(non bank) financing of smes in light of crisis and new ... eric paper.pdf · cosimano and hakura...
TRANSCRIPT
(Non‐Bank) Financing of SMEs in Light of Crisis and New Regulation –
Do Innovations in Market Financing have a real Impact?
Alexander Eisele
UBS Asset Management Products
Eric Nowak*
Swiss Finance Institute and University of Lugano
ABSTRACT
As the availability of bank loans to SMEs is likely to deteriorate in the future due to crisis-ridden banks
and new regulation, there should be growth potential for alternative financing sources. We look at the
innovation of SME segments as a quasi-exogenous shock and conduct a difference-in-difference
estimation (DID) to study the effect of the introduction of an SME equity segment and find that it
increases the use of equity financing of SMEs significantly (around 6% in relative terms). Equivalently,
the introduction of SME bond segments increases bond financing of SMEs significantly (around 9.5%
in relative terms). Our results suggest a positive complementarity of introducing SME bond and equity
segments, as higher disclosure costs can be leveraged across different financing sources, so SMEs are
more likely to be willing to pay the costs in the first place.
*Corresponding author: [email protected]. The authors thank Thomas Hellman and Vikrant
Vig for helpful comments. We thank the CEPR project Restarting European Long Term Investment
Finance (RELTIF) for financial support.
I. Introduction - SME Financing and New Regulation
European firms and particularly small and medium-sized enterprises (SMEs) became highly reliant
on bank credit relative to the US since the 1990s. The European market is dominated by a few large
banks (ESRB 2014) and European banks are underfunded relative to their counterparts in other
countries (Acharya and Steffen 2015). Consequently, bank financing is more volatile than other sources
of financing (Becker and Ivashina 2014), and countries with a bank-based financial system are hit more
severely by a financial crisis (Gambacorta et al., 2014). As in addition to these reasons the availability
of bank loans to European SMEs is likely to even deteriorate in the future due to crisis-ridden banks
and new regulation (Basel III, IFRS, Mifid), there should be significant growth potential for alternative
financing sources.
We look at the introduction of SME market segments as a quasi-exogenous shock and find that
it increases the equity financing of SMEs significantly (around 6% in relative terms). Equivalently, the
introduction of SME bond segments increases bond financing of SMEs significantly (around 9.5% in
relative terms). Our results suggest a positive complementarity of introducing SME bond and equity
segments, as higher disclosure costs can be leveraged across different financing sources at the same
time, so SMEs are more likely to be willing to pay the costs of transparency in the first place.
The remainder of our paper is organized as follows. We first provide a summary of new rules
and regulations for bank capital requirements and loan issuance which will have an impact on the
financing of SMEs. Then we deliver a descriptive empirical overview on the current situation of SME
financing. In the next part we show how SME financing has been adversely affected by the financial
crisis in the European countries. Our main empirical analysis assesses the impact of new
(market-based) initiatives to strengthen the financing of SMEs through the introduction of specialized
SME equity and bond market segments. In the final section we conclude.

A. New Regulations for Bank Capital Requirements and Loan Issuance
The primary goal of the new regulations is to make banks safer by imposing higher capital
requirements and force the banks to hold more liquid assets more liquid assets. Secondary goals are to
encourage more market-based funding by strengthening the relative attractiveness of market-based
funding relative to bank loans. However, a pre-condition for this is to ease the burden for firms to
access capital markets and this is true in particular for SMEs.
A.1 Basel III
Basel III will impose higher capital requirements on banks:
‐ Tier 1 capital increases from 4% to at least 8.5%
‐ Tier 2 capital decreases from 4% to 2%
‐ Total regulatory capital increases from 8% to at least 10.5%
The introduction of the Liquidity Coverage Ratio (LCR) is supposed to guarantee a bank‘s
liquidity in the short run (< 1 month). The amount of highly liquid assets (which can be liquidated in
less than a month) has to be larger than the amount of liabilities with a maturity less than a month.
Banks will always have to maintain at least 25% of their expected cash outflows as liquid assets.
The Introduction of the Net Stable Funding Ratio (NSFR) is supposed to guarantee the stability of
banks‘ funding. The ratio of long-term liabilities (> 1 year) to weighted long-term assets has to be
larger than 100%.
A.2 Impact of Liquidity Coverage Ratio, Net Stable Funding Ratio, and IFRS 9
LCR and NSFR will have a potentially significant impact on SME lending. LCR threatens the
traditional maturity transformation business, because banks have to change their balance sheet

composition towards more liquid assets (ESBG, 2011). Consequently, the maturity of loans to SMEs
will shorten. IFRS 9 will impose higher interest rate costs to compensate for the higher capital
requirements. That might lead to a change of asset composition away from SME loans to less
regulatory capital-intensive business and more securitization of loans.
Higher capital requirements will have a significant impact on lending spreads for SMEs. Berg et al.
(2011) estimate that a higher Tier 1 capital ratio could lead to an increase in interest rates of 54bps for
SME loans. Cardone-Riportella et al. (2010) estimate that a higher Tier 1 capital ratio could increase
interest rates for SME loans by 30-100bps. The impact of a one percent capital ratio increase on
lending spreads is estimated between 2.5 and 16 bps.
Table 1. Impact of 1% capital ratio increase on lending spreads
Kashyap
et al.
(2011)
BCBS
(2010)
Cosimano
and Hakura
(2011)
Elliott
(2009)
Baker and
Wurgler
(2015)
MAG
(2010)
King
(2010)
Slovik and
Cournède
(2011)
Impact,
in b.p. 2.5-4.5 9-19 9-13 5-10 6-9 12.2 15 16

II. SME Financing – The Current Situation
A. Data Description and Methodology
In this section, we provide a first descriptive analysis of the current state of SME financing in
Europe. We make use of the BACH Database (Bank for the Accounts of Companies Harmonized)
created by the European Committee of Central Balance – Sheet Data Offices. It contains comparable
information aggregated across a set of European countries and sectors. The number of SMEs in the
BACH database increases from 648‘000 in 2000 to 1.2 million in 2013. We use a panel of 17 sectors
across 9 countries (153 observations per year) between 2000 and 2013. Then we utilize regression
analysis to study the impact of country, time and sector effects on the financial structure of SMEs.
B. Results
B.1 Equity Financing
Equity financing constitutes on average around 38% of all SME funding. During our sample
period, it has increased from 34% in 2000 to 40% in 2013 and 2.5% of variation can be explained by
time effects. The fraction of equity varies significantly across sectors and industry effects can explain
23% of the variation in equity ratios. Again as to be expected, the fraction of equity varies significantly
across countries so country effects can explain 34% of the variation in equity ratios.
[Insert Figures 2a-c about here]
B.2 Bank Financing
Bank financing constitutes around 25% of overall financing of SMEs in Europe. The fraction of
bank financing stays relatively stable across time. Time effects explain only 0.92% of the variation in
the fraction of bank financing. However, the fraction of bank financing varies significantly across
sectors with 25% of the variation in bank funding ratios explained by industry effects. As we would
expect, the fraction of bank financing varies significantly across countries, hence country effects
explain 28% of the variation in bank funding ratios.
[Insert Figures 3a-c about here]
B.3 Bond Financing
Bond financing is still relatively less important for SMEs in Europe as it constitutes on average
only around 0.6% of all funding. However, it has increased with the beginning of the financial crisis
and time effects can explain 0.36% of the variation. The fraction of bond financing varies significantly
across sectors so industry effects can explain 6% of the variation in bond funding ratios. Finally, the
fraction of bonds varies significantly across countries and country effects can explain 8% of the
variation in bond funding ratios.
[Insert Figures 4a-c about here]
III. SME Financing – The Impact of the Financial Crisis
In this section, we analyze the impact of the Financial Crisis on the financing of SMEs in Europe.
For this purpose, we use data from the ECB Survey on Access to Finance for Enterprises (SAFE),
which comprises survey responses from companies that are available every 6 months starting from
2009. The survey covers over 10‘000 enterprises in the Euro area. We complement this with data from
the ECB Lending Survey which comprises responses of senior loan officers from 90 banks in the euro
area. This data is available quarterly since 2000.
A. Intermediated Financing
A.1 Supply of Bank Loans
The supply of bank loans tightened during the financial crisis with negative consequences for
corporate investment. Iyer et al. (2014) show that Portuguese banks relying more on interbank
financing tightened credit supply significantly and that firms were not able to substitute the shortfall in
loans through other banks. Cingano et al. (2016) argue that the freeze of the interbank market in 2007
explained more than 40% of the decrease in corporate investment in Italy. As Jimenez et al. (2012)
conclude during times of crisis banks are less likely to grant loans the weaker their capital position.
Data from the ECB SAFE on the availability of bank loans in the Eurozone confirms these
findings. The net change in the availability of loans was sharply negative (up to minus 40 percent) for
every half year from 2009 until 2014.
[Insert Figure 5a about here]

A.2 Interest Rates, Collateral, and Maturity
As Rajan (1992) points out banks extract informational rents from their borrowers when their
access to market- based funding is more difficult (hold-up problem). Santos and Winton (2008) argue
that this hold-up problem is particularly severe in recessions. Empirical evidence from the ECB Bank
Lending Survey shows that this hampered bank financing particularly to SMEs in the Financial Crisis.
SMEs usually ask for smaller loans than large blue chip companies. The interest rate spread between
small loans (of less than one million euros) and large loans increased substantially following the
Financial Crisis, from less than one percent on average before the Crisis up to almost 1.8 percent in
2012. Interestingly this effect was driven mainly by peripheral countries like Italy and Spain while the
spread remained constant in Germany and even declined in France.
[Insert Figures 5b-e about here]
Furthermore, while the collateral requirements for SME borrowers become stricter for every
quarter from 2008 until 2015, the maturities of those same loans are becoming significantly shorter. So
following the Crisis SMEs can borrow less, at higher interest rates, for a shorter time, and yet have to
provide even more collateral.
A.3 Trade Credit
Not surprisingly that due to the higher costs and decreased availability of bank loans, many SMEs
substituted bank loans with trade credit, in particular in countries where firms were more likely to be
constrained (see Carbo-Valverde et al. 2012).
[Insert Figure 6 about here]
B. Market-based Financing
B.1 Equity Securities
Information problems make equity financing for SMEs difficult and the costs to list equity are
sometimes prohibitively high for SME. Nevertheless, our empirical evidence suggests some increase in
equity raising during the financial crisis. The increase in equity financing seems to be particularly
strong in countries with established SME equity segments (France and Germany). For example, the
number of listed SMEs at Alternext increased from 125 in June 2008 to 177 at the end of 2014.
B.2 Debt Securities
The problems in SME bond financing are similar to those hindering SME equity financing and
hence the percentage of SMEs issuing debt securities remains in the low single digits, with the
interesting exception of Italy and Spain. Not surprisingly, the volume in the ABS market for SMEs
decreased significantly following the Crisis, as the negative sentiment towards ABS decreased demand.
In addition, heightened capital requirements after the crisis dampened the demand as well.
[Insert Figure 7 about here]
IV. Innovations in SME Financing – Assessing the Impact of New Form of Market
Finance for SMEs in Europe
A. Identification Strategy
In this section, we use the implementation of innovative forms of SME financing in a country as
events to study the impact on the financial structure of SMEs - and their cost of capital (tbd). We look
at the introduction of an SME equity or bond segment as a quasi-exogenous shock to the financing of
SMEs. SMEs in a country with such a market innovation are the treatment group, while the control
group are SMEs in non-treated countries.
B. Innovations in SME Financing – Equity Market Segments
France, Germany, Italy, and Spain have all introduced new market segments to trade equity
securities of SMEs (Lugaresi, 2015). Germany’s Deutsche Börse installed the Entry Standard segment
targeting SMEs on October 25, 2005. Additionally, in 2008, favorable interest rates to companies
investing in SME equity were introduced. In France, the Alternext multilateral trade facility opened as
an SME equity segment of NYSE Euronext on May 17, 2005. Since 2008, the Fonds Stratègique
d’Investissement (FSI) provides direct equity investments and the Garantie des Fonds Propres gives
public guarantees on SME equity investments. In 2008, the European Commission presented the
European Economic Recovery Plan, part of which was the European Recovery Programme (ERP).
ERP is a EUR 1.7 bn Fund of Funds investing in venture capital funds mainly focusing on German
based, high-tech early and development stage companies. Even though those funds are not restricted to
invest solely in German companies, the focus of investments should be in Germany
(http://www.eif.org/what_we_do/resources/erp/). In Italy, the AIM Italia MAC opened in 2008 as a new
facility to trade SME equity. Finally, in 2009 Spain created the Mercado Alternativo Bursatil MAB as a

new facility to trade SME equity with the exclusion of real estate and financial companies. While as
described above there have been other shocks to the ecosystems of SME financing such as public tax
credits, loan guarantees, and EIF programs, the timing of these has been different to the opening of the
SME equity segments. These innovations can therefore count as independent single and exogenous
events (initiated by profit-maximizing stock exchanges as opposed to public governments) in our
identification strategy.
B.1 Equity Impact Assessment
Descriptive analyses show that the median equity funding ratio before and after the introduction
of a SME equity segment significantly increases in all four countries. To confirm these results, in a
second step, we use the aforementioned BACH database to conduct a difference-in-difference
estimation (DID) to study the effect of the introduction of an SME equity segment on the use of equity
by SMEs. We use the general DID model as described in Bertrand et al. (2004), but also present some
simple dummy regressions in columns 1 and 2 of Table 2. The third column of Table 2 presents the
DID results where we control for time, sector, and country fixed effects. Results show that the
introduction of a SME equity segment increases the equity funding ratio by 2.37% (the average equity
funding ratio is 38.6%) so the effect is about 6 percent in relative terms and statistically significant.
[Insert Figures 8 and Table 2 about here]
C. Innovations in SME Financing – Bond Market Segments
The first European SME Bond market initiative was the German BondM Market for
Mittelstandsanleihen introduced in 2010. At the end of 2014 the approximate size of the market was

EUR 6 bn (see Brächer 2014) with 148 different bond issues. In Italy the Market for Italian minibonds
ExtraMOT PRO was introduced in February 11, 2013 to target the needs of SMEs to listing bonds, but
is open only for institutional investors. Bonds are partially guaranteed by the Italian government. At the
end of 2014 there were around EUR 4 bn in minibonds in 82 issues outstanding (see Kraemer-Eis et al.
2014). According to Cerved Group (2013) the pool of potential issuers comprises 34’000 companies
with EUR 140 bn of outstanding debt. In Spain the Alternative Fixed Income Market MARF was
introduced as a Market for SME bonds in October 2013. In France a Market for first-time SME bond
issuers exists since 2014, with the development of the Euro PP market for SMEs, with access for retail
as well as institutional investors.
Other related initiatives include the increase in the direct lending to SMEs by specialized debt
funds. According to Moeglich and Rabel (2014) the number of such funds investing in European SMEs
grew significantly to 31 with a target volume of EUR 13.2 bn. New laws in Italy allow insurance
companies to lend directly to SMEs conditionally on a bank having significant interest in the
transaction. French insurers are allowed to invest up to 5% of their balance sheet in unrated bonds,
which has led to the creation of Novo, a credit fund/private placement platform.
C.1 Bond Impact Assessment
The simple change in the median Bond Funding Ratio before and after the introduction of a
SME bond segment is heterogeneous across countries and industries. We conduct again a
difference-in-difference estimation to study the effect of an SME bond segment on the use of debt
securities by SMEs. In the third column of Table 3 we find that the introduction of a SME bond
segment increases the bond funding ratio by 0.06% (the average bond funding ratio is 0.62%). The
effect is economically small given small bond funding ratios but still around 9.5% in relative terms and
statistically significant.
[Insert Table 3 about here]
D. Innovations in SME Financing – Joint Assessment of Market-Based Funding Initiatives
Finally, we analyze the joint effect of introducing Equity and Bond market segments for SMEs.
Table 4 presents the DID results and column 2 suggests that the introduction of a SME bond segment
has a positive impact also on the Equity Funding Ratio, while the introduction of a SME Equity market
segment has no further impact on the bond funding ratio.
[Insert Table 4 about here]
Our empirical results suggest a positive complementarity of introducing SME bond and equity
segments. While this seems to be surprising at first sight, it does make sense from the point of view of
SMEs and their potential investors. Listing equity or bond debt on an exchange imposes direct and
indirect issuance costs. The most important indirect costs are the costs of higher disclosure as external
investors require a higher level of transparency. When these higher disclosure costs can be utilized
across different financing sources, the SMEs are more likely to be willing to pay the costs in the first
place. They can thereby leverage through multiple forms of market-based financing. We can therefore
conclude that equity and bond markets are not substitutes but complementary forms of financing for
SMEs. This result is in contrast to findings in the venture capital literature that different forms of
venture financing are substitutes not complements (Ozmel et al., 2013; Hellmann et al. 2015).

V. Conclusion - The Future of SME Financing in Europe
We look at the introduction of SME equity segments as a quasi-exogenous shock and find that it
increases the equity financing of SMEs significantly (around 6% in relative terms). Equivalently, the
introduction of SME bond segments increases bond financing of SMEs significantly (around 9.5% in
relative terms). Our results suggest a positive complementarity of introducing a SME bond and equity
segments. When these higher disclosure costs can be utilized across different financing sources, SMEs
are more likely to be willing to pay the costs in the first place, as they can thereby leverage through
multiple forms of market-based financing. We can therefore conclude that equity and bond markets are
not substitutes but complementary forms of financing for SMEs in Europe. This result is in contrast to
findings in the venture capital literature that different forms of venture financing are substitutes not
complements (Ozmel et al., 2013; Hellmann et al. 2015).
Bank debt is likely to stay an important financing source for SMEs but to a lower extent, as
higher collateral requirements make bank financing particularly uninteresting for young and asset-light
enterprises. Shorter maturities of bank loans can harm investments into long-term projects. In light of
significant efforts to facilitate the direct access of SMEs to capital markets, our evidence suggests that
the introduction of SME bond segments has a positive impact on the amount of bond financing of
SMEs. Our evidence also suggests that introduction of SME equity segments has a positive impact on
the equity financing of SMEs. Future success depends critically on the costs of issuance and disclosure.
Low institutional demand due to the small issuance amounts could become a growth obstacle for these
markets as well as high issuance and disclosure costs for SMEs. However, there is a lot of potential for
SME bond and equity market segments as complementary financing sources.
REFERENCES
Acharya, Viral, and Sascha Steffen, The "Greatest" Carry Trade Ever? Understanding Eurozone Bank
Risks", Journal of Financial Economics 115 (2), 2015, 215 – 236.
Altman, Edward and Gabriele Sabato, 2005, Effects of the New Basel Capital Accord on Bank
Capital Requirements for SMEs, Journal of Financial Services Research 28(1-3), 15–42.
Baker, Malcolm and Jeffrey Wurgler, 2015, Do Strict Capital Requirements Raise the Cost of Capital?
Bank Regulation, Capital Structure, and the Low-Risk Anomaly. American Economic Review 105(5):
315-20.
Bank for the Accounts of Companies Harmonized (BACH), BACH Userguide Summary. European
Committee of Central Balance – Sheet Data Offices.
Basel Committee on Banking Supervision (BCBS), 2010 (rev June 2011), Basel III: A global
regulatory framework for more resilient banks and banking systems, Basel.
Becker, Bo, and Victoria Ivashina, 2014, “Cyclicality of Credit Supply: Firm Level Evidence,” Journal
of Monetary Economics 62, 76-93.
Becker, Bo, and Victoria Ivashina, 2014, Financial Repression in the European Sovereign Debt Crisis,
Working Paper, Harvard Business School.
Tobias Berg, Bernhard Gehra, and Michael Kunisch, 2011, A Certification Model for Regulatory
Arbitrage: Will Regulatory Arbitrage persist under Basel III?, Journal of Fixed Income 21(2), 39-56.
Betrand, Marianne, Esther Duflo and Sendhil Mullainathan, 2004, How Much Should We Trust
Difference-In-Difference Estimates?, Quarterly Journal of Economics 119, 249–275.
Carbo-Valverde, Santiago, Francisco Rodriguez-Fernandez and Gregory F. Udell, 2016, Trade Credit,
the Financial Crisis, and SME Access to Finance, Journal of Money, Credit and Banking, 48(1):
113-143.
Cardone-Riportella, Clara, Reyes Samaniego-Medina, Antonio Trujillo-Ponce, 2010, What drives bank
securitisation? The Spanish experience, Journal of Banking and Finance 34(11), 2639-2651.
Cingano, Federico, Francesco Manaresi, and Enrico Sette, 2016, Does Credit Crunch Investment
Down? New Evidence on the Real Effects of the Bank-Lending Channel, Review of Financial Studies,
first published online June 7, 2016.
Cosimano, Thomas F. and Dalia Hakura, 2011, Bank Behavior in Response to Basel III: A
Cross-Country Analysis, IMF Working Paper No. 11/119.
Cournède, Boris and Patrick Slovik, 2011, Macroeconomic Impact of Basel III, OECD Economics
Department Working Paper, No. 844, OECD Publishing, Paris.
Elliott, Douglas J., 2009, Reviewing the Administration’s Financial Reform Proposals, The Brookings
Institution.
European Systemic Risk Board (ESRB), 2014, Is Europe Overbanked?, Report of the Advisory
Scientific Committee No. 4, June.
European Systemic Risk Board (ESRB), 2013, The structure and resilience of the European interbank
market, ESRB Occasional Paper no. 3.
Gambacorta, Leonardo, Jing Yang, and Kostas Tsatsaronis, 2014, Financial structure and growth, BIS
Quarterly Review, 21-37.

Giovannini, Alberto, Colin Mayer, Stefano Micossi, Carmine Di Noia, Marco Onado, Marco Pagano,
Andrea Polo, 2015, Restarting European Long-Term Investment Finance - A Green Paper Discussion
Document, CEPR, London.
Hanson, Samuel G., Anil K Kashyap, and Jeremy C. Stein, 2011, A Macroprudential Approach to
Financial Regulation, Journal of Economic Perspectives 25(1), 2011, 3-28.
Hellmann, Thomas, Paul Schure and Dan Vo, 2015, Angels and Venture Capitalists: Complements or
Substitutes? Said Business School Working Paper 2015-2.
Iyer, Rajkamal, José-Luis Peydró, Samuel da-Rocha-Lopes, and Antoinette Schoar, 2014, Interbank
Liquidity Crunch and the Firm Credit Crunch: Evidence from the 2007–2009 Crisis, Review of
Financial Studies 27 (1): 347-372.
Jiménez, Gabriel, Steven Ongena, José-Luis Peydró and Jesús Saurina. 2012. Credit Supply and
Monetary Policy: Identifying the Bank Balance-Sheet Channel with Loan Applications. American
Economic Review, 102(5): 2301-26.
King, Michael R., 2010, Mapping capital and liquidity requirements to bank lending spreads, BIS
Working Paper No. 324.
Kraemer-Eis, Helmut, Lang, Frank and Gvetadze, Salome, 2014. European Small Business Finance
Outlook. EIF Working Paper 2014/26. EIF Research & Market Analysis. December 2014.
Lugaresi, Sergio, 2015, Restarting the credit engine in Europe - Review of the Main European Policy
Initiatives, Restarting European Long-Term Investment Finance, CEPR, London.
Macroeconomic Assessment Group established by the Financial Stability Board and the Basel
Committee on Banking Supervision (MAG), 2010, Assessing the macroeconomic impact of the
transition to stronger capital and liquidity requirements, Final report, Basel.

Ozmel, Umit, David T. Robinson, Toby E. Stuart, 2013, Strategic alliances, venture capital, and exit
decisions in early stage high-tech firms, Journal of Financial Economics 107(3), 655-670.
Rajan, Raghuram G., 1992, Insiders and Outsiders: The Choice between Informed and Arm's-Length
Debt. Journal of Finance 47(4), 1367-1400.
Santos, Joao and Andrew Winton, 2008, Bank Loans, Bonds, and Information Monopolies across the
Business Cycle. Journal of Finance, 63: 1315–1359.
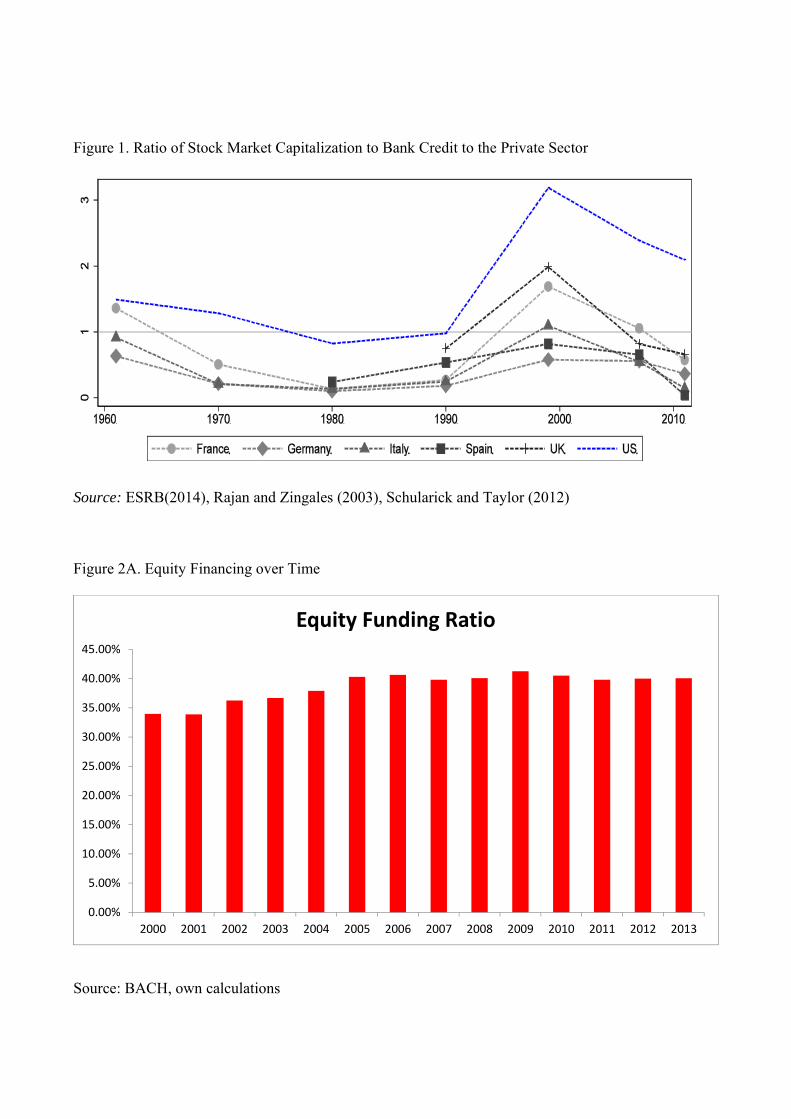
Figure 1. Ratio of Stock Market Capitalization to Bank Credit to the Private Sector
Source: ESRB(2014), Rajan and Zingales (2003), Schularick and Taylor (2012)
Figure 2A. Equity Financing over Time
Source: BACH, own calculations
0.00%
5.00%
10.00%
15.00%
20.00%
25.00%
30.00%
35.00%
40.00%
45.00%
2000 2001 2002 2003 2004 2005 2006 2007 2008 2009 2010 2011 2012 2013
Equity Funding Ratio
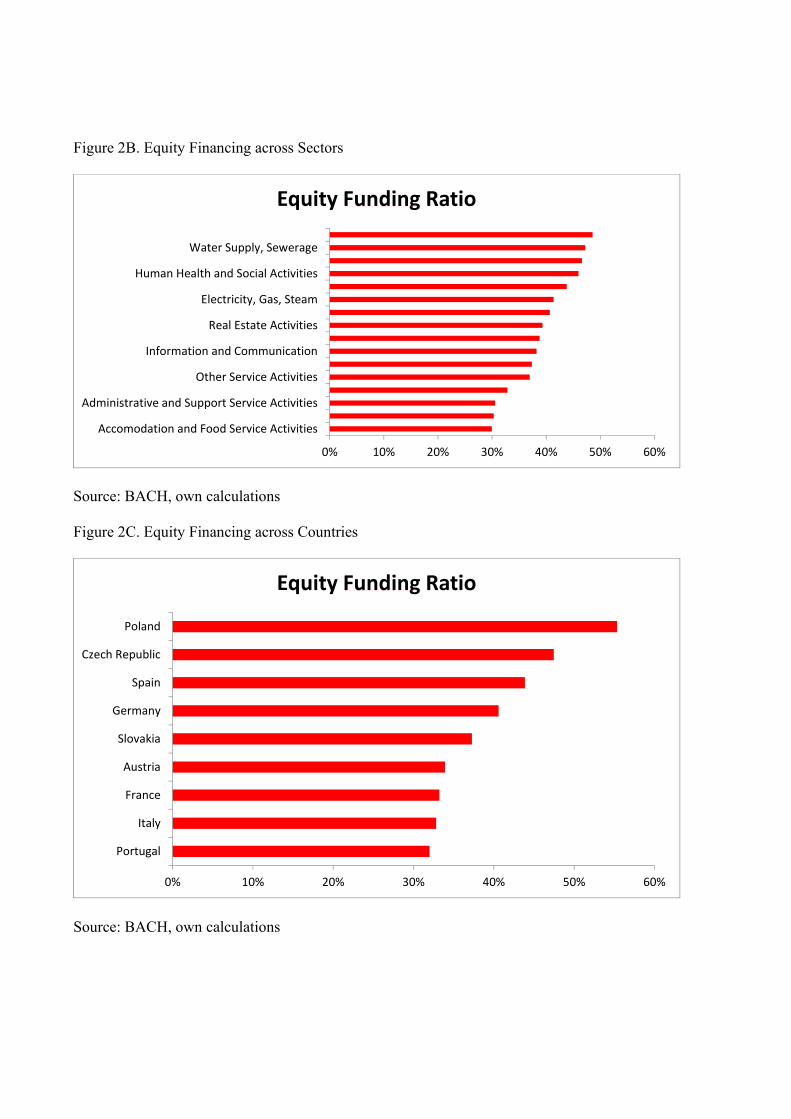
Figure 2B. Equity Financing across Sectors
Source: BACH, own calculations
Figure 2C. Equity Financing across Countries
Source: BACH, own calculations
0% 10% 20% 30% 40% 50% 60%
Accomodation and Food Service Activities
Administrative and Support Service Activities
Other Service Activities
Information and Communication
Real Estate Activities
Electricity, Gas, Steam
Human Health and Social Activities
Water Supply, Sewerage
Equity Funding Ratio
0% 10% 20% 30% 40% 50% 60%
Portugal
Italy
France
Austria
Slovakia
Germany
Spain
Czech Republic
Poland
Equity Funding Ratio
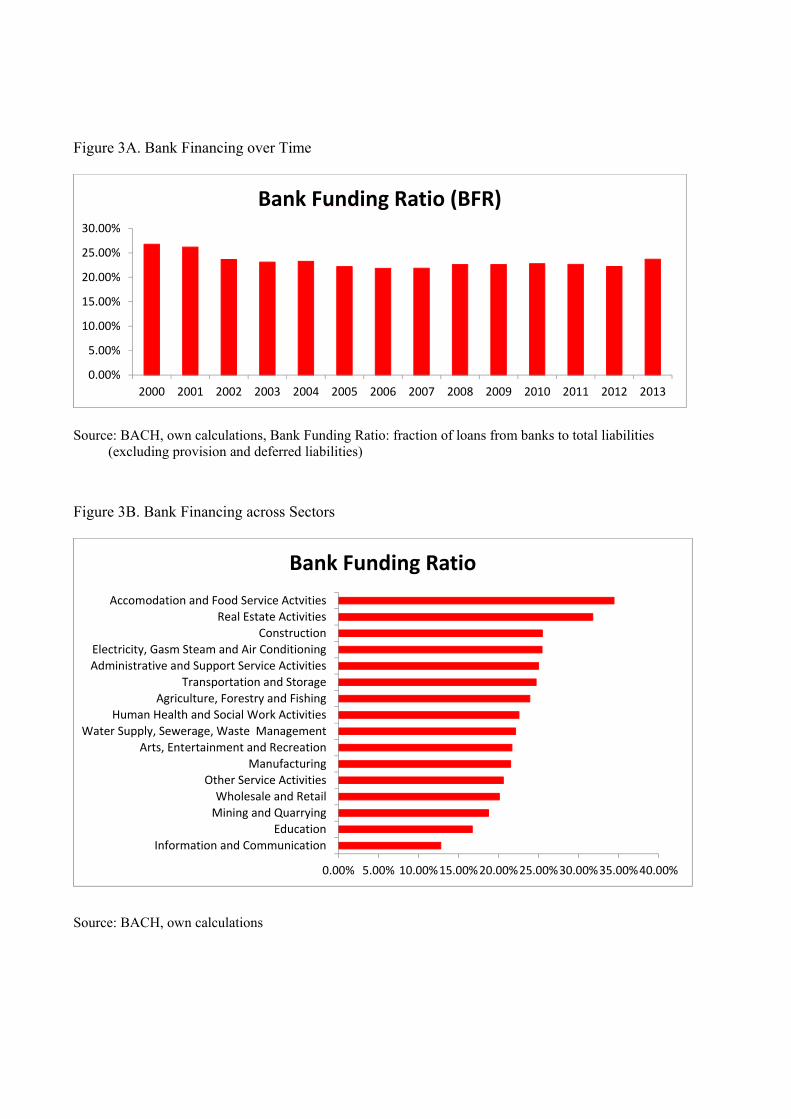
Figure 3A. Bank Financing over Time
Source: BACH, own calculations, Bank Funding Ratio: fraction of loans from banks to total liabilities (excluding provision and deferred liabilities)
Figure 3B. Bank Financing across Sectors
Source: BACH, own calculations
0.00%
5.00%
10.00%
15.00%
20.00%
25.00%
30.00%
2000 2001 2002 2003 2004 2005 2006 2007 2008 2009 2010 2011 2012 2013
Bank Funding Ratio (BFR)
0.00% 5.00% 10.00%15.00%20.00%25.00%30.00%35.00%40.00%
Information and Communication
Education
Mining and Quarrying
Wholesale and Retail
Other Service Activities
Manufacturing
Arts, Entertainment and Recreation
Water Supply, Sewerage, Waste Management
Human Health and Social Work Activities
Agriculture, Forestry and Fishing
Transportation and Storage
Administrative and Support Service Activities
Electricity, Gasm Steam and Air Conditioning
Construction
Real Estate Activities
Accomodation and Food Service Actvities
Bank Funding Ratio
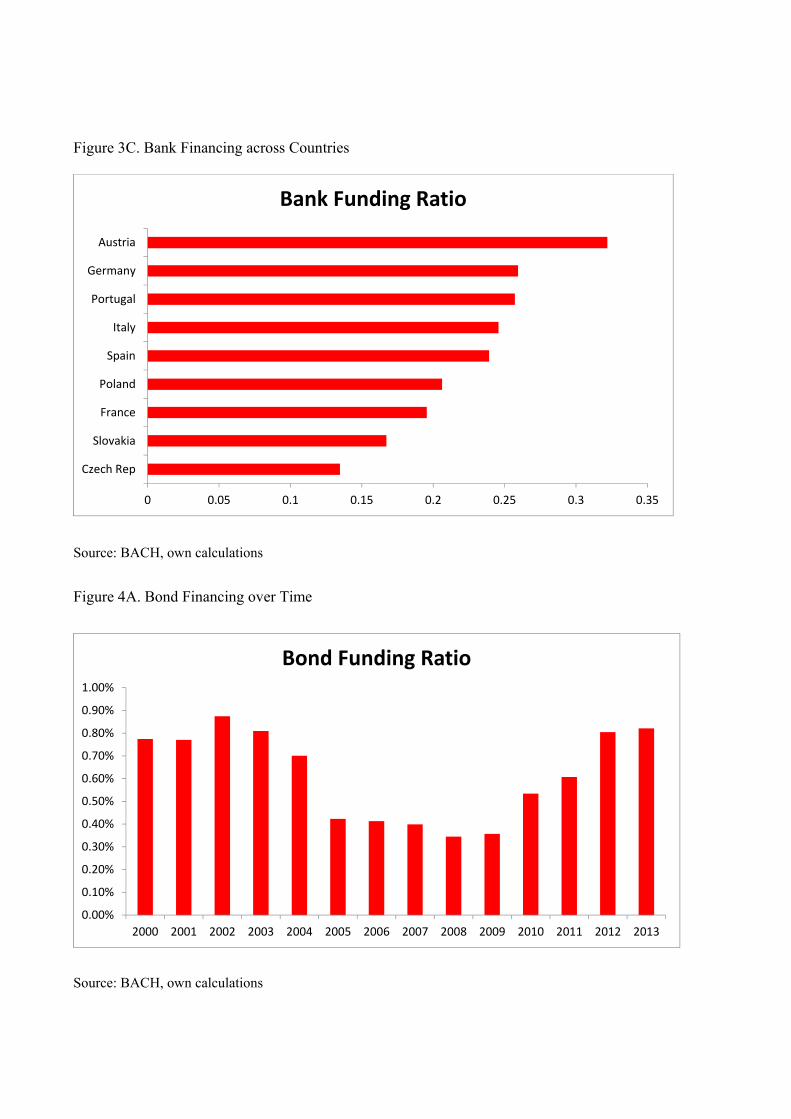
Figure 3C. Bank Financing across Countries
Source: BACH, own calculations
Figure 4A. Bond Financing over Time
Source: BACH, own calculations
0 0.05 0.1 0.15 0.2 0.25 0.3 0.35
Czech Rep
Slovakia
France
Poland
Spain
Italy
Portugal
Germany
Austria
Bank Funding Ratio
0.00%
0.10%
0.20%
0.30%
0.40%
0.50%
0.60%
0.70%
0.80%
0.90%
1.00%
2000 2001 2002 2003 2004 2005 2006 2007 2008 2009 2010 2011 2012 2013
Bond Funding Ratio
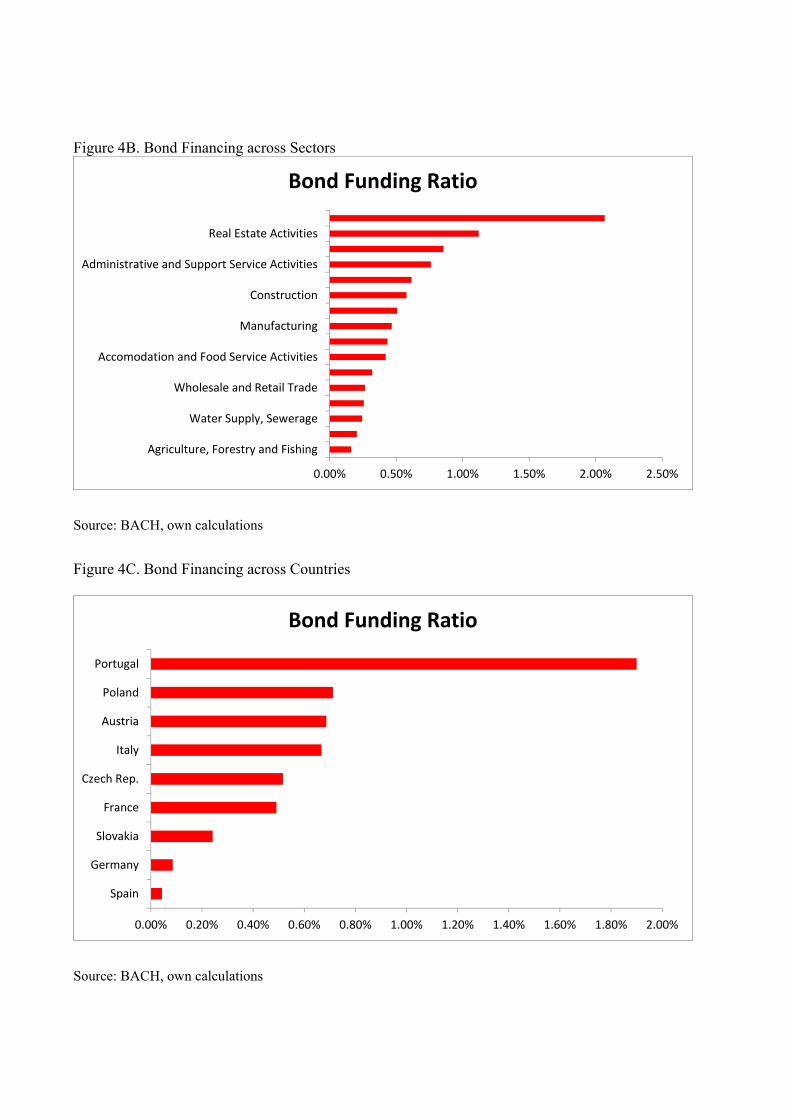
Figure 4B. Bond Financing across Sectors
Source: BACH, own calculations
Figure 4C. Bond Financing across Countries
Source: BACH, own calculations
0.00% 0.50% 1.00% 1.50% 2.00% 2.50%
Agriculture, Forestry and Fishing
Water Supply, Sewerage
Wholesale and Retail Trade
Accomodation and Food Service Activities
Manufacturing
Construction
Administrative and Support Service Activities
Real Estate Activities
Bond Funding Ratio
0.00% 0.20% 0.40% 0.60% 0.80% 1.00% 1.20% 1.40% 1.60% 1.80% 2.00%
Spain
Germany
Slovakia
France
Czech Rep.
Italy
Austria
Poland
Portugal
Bond Funding Ratio
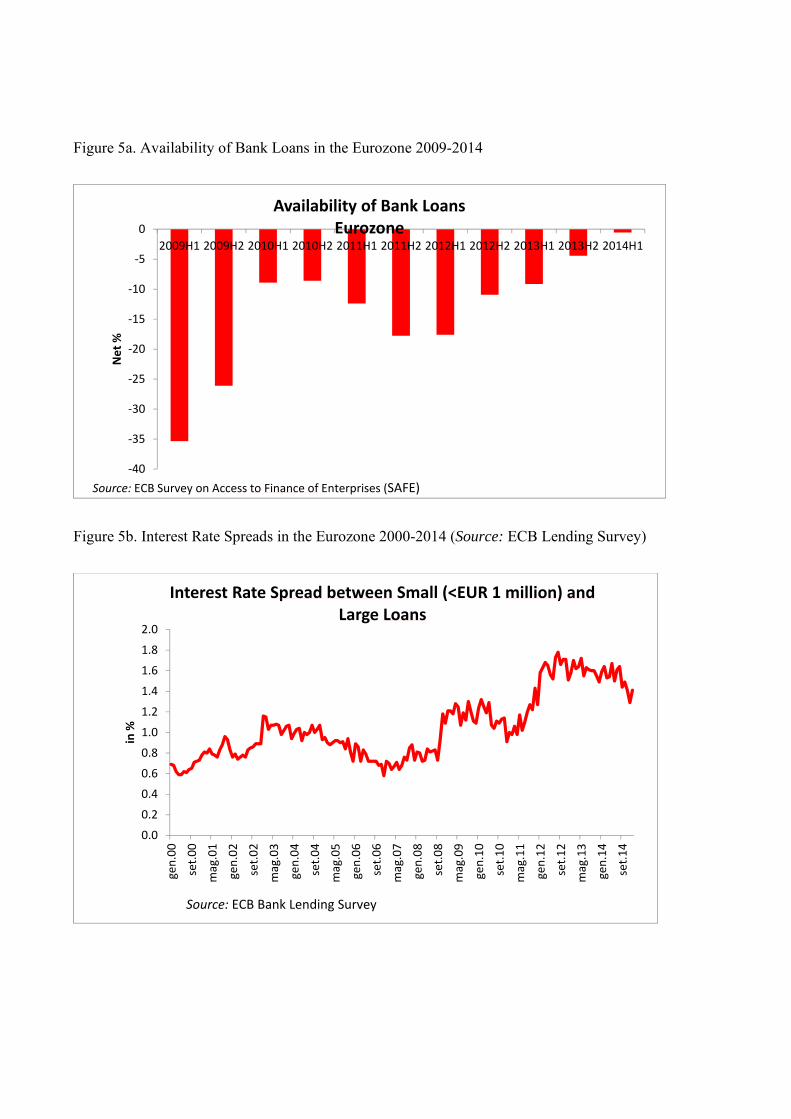
Figure 5a. Availability of Bank Loans in the Eurozone 2009-2014
Figure 5b. Interest Rate Spreads in the Eurozone 2000-2014 (Source: ECB Lending Survey)
‐40
‐35
‐30
‐25
‐20
‐15
‐10
‐5
0
2009H1 2009H2 2010H1 2010H2 2011H1 2011H2 2012H1 2012H2 2013H1 2013H2 2014H1
Net %
Availability of Bank LoansEurozone
Source: ECB Survey on Access to Finance of Enterprises (SAFE)
0.0
0.2
0.4
0.6
0.8
1.0
1.2
1.4
1.6
1.8
2.0
gen.00
set.00
mag.01
gen.02
set.02
mag.03
gen.04
set.04
mag.05
gen.06
set.06
mag.07
gen.08
set.08
mag.09
gen.10
set.10
mag.11
gen.12
set.12
mag.13
gen.14
set.14
in %
Interest Rate Spread between Small (<EUR 1 million) andLarge Loans
Source: ECB Bank Lending Survey
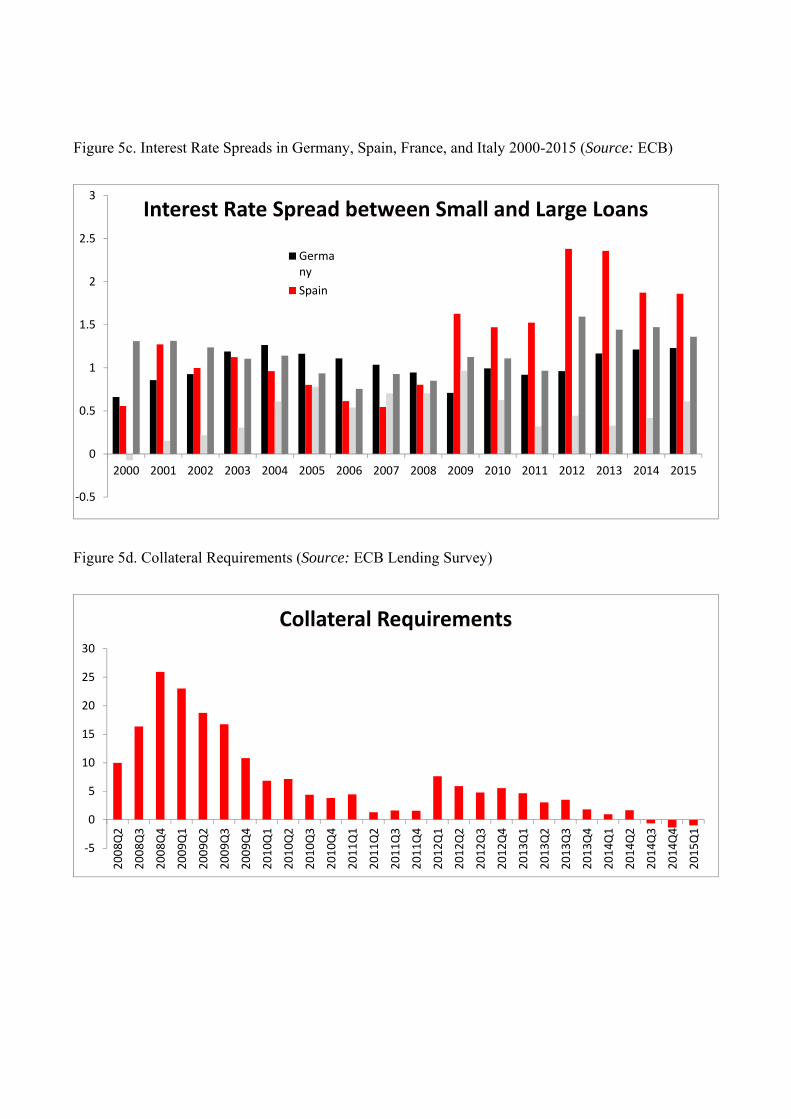
Figure 5c. Interest Rate Spreads in Germany, Spain, France, and Italy 2000-2015 (Source: ECB)
Figure 5d. Collateral Requirements (Source: ECB Lending Survey)
‐0.5
0
0.5
1
1.5
2
2.5
3
2000 2001 2002 2003 2004 2005 2006 2007 2008 2009 2010 2011 2012 2013 2014 2015
Interest Rate Spread between Small and Large Loans
Germany
Spain
‐5
0
5
10
15
20
25
30
2008Q
2
2008Q
3
2008Q
4
2009Q
1
2009Q
2
2009Q
3
2009Q
4
2010Q
1
2010Q
2
2010Q
3
2010Q
4
2011Q
1
2011Q
2
2011Q
3
2011Q
4
2012Q
1
2012Q
2
2012Q
3
2012Q
4
2013Q
1
2013Q
2
2013Q
3
2013Q
4
2014Q
1
2014Q
2
2014Q
3
2014Q
4
2015Q
1
Collateral Requirements

Figure 5e. Loan Maturities (Source: ECB Lending Survey)
Figure 5f. Percentage of SMEs using Trade Credit across Countries (Source: ECB SAFE)
‐4
‐3
‐2
‐1
0
1
2009H1 2009H2 2010H1 2010H2 2011H1 2011H2 2012H1 2012H2 2013H1 2013H2 2014H1
in %
Net percentage of SMEs reporting an increase in loan maturities
0
10
20
30
40
50
60
70
2009H1 2009H2 2010H1 2010H2 2011H1 2011H2 2012H1 2012H2 2013H1 2013H2
Germany
Spain
Italy
France
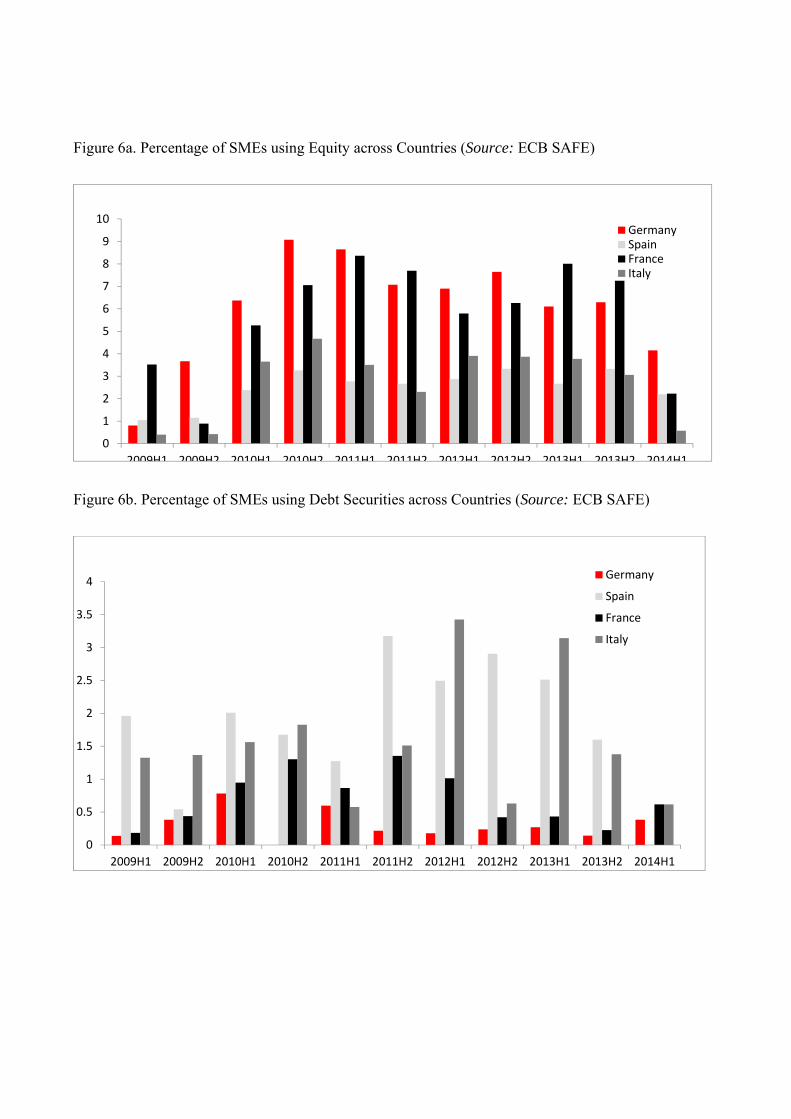
Figure 6a. Percentage of SMEs using Equity across Countries (Source: ECB SAFE)
Figure 6b. Percentage of SMEs using Debt Securities across Countries (Source: ECB SAFE)
0
1
2
3
4
5
6
7
8
9
10
2009H1 2009H2 2010H1 2010H2 2011H1 2011H2 2012H1 2012H2 2013H1 2013H2 2014H1
GermanySpainFranceItaly
0
0.5
1
1.5
2
2.5
3
3.5
4
2009H1 2009H2 2010H1 2010H2 2011H1 2011H2 2012H1 2012H2 2013H1 2013H2 2014H1
Germany
Spain
France
Italy

Figure 7. Outstanding volume of SME backed ABS (EUR millions)
Source: SIFMA
Figure 8. Median Equity Funding Ratio before and after the introduction of a SME equity segment
0
20000
40000
60000
80000
100000
120000
140000
160000
180000
200000
Mar‐…
Oct‐99
May‐…
Dec‐…
Jul‐01
Feb‐02
Sep‐02
Apr‐03
Nov‐…
Jun‐04
Jan‐05
Aug‐…
Mar‐…
Oct‐06
May‐…
Dec‐…
Jul‐08
Feb‐09
Sep‐09
Apr‐10
Nov‐…
Jun‐11
Jan‐12
Aug‐…
Mar‐…
Oct‐13
May‐…
0.0%
5.0%
10.0%
15.0%
20.0%
25.0%
30.0%
35.0%
40.0%
45.0%
50.0%
Germany Spain France Italy
Before After
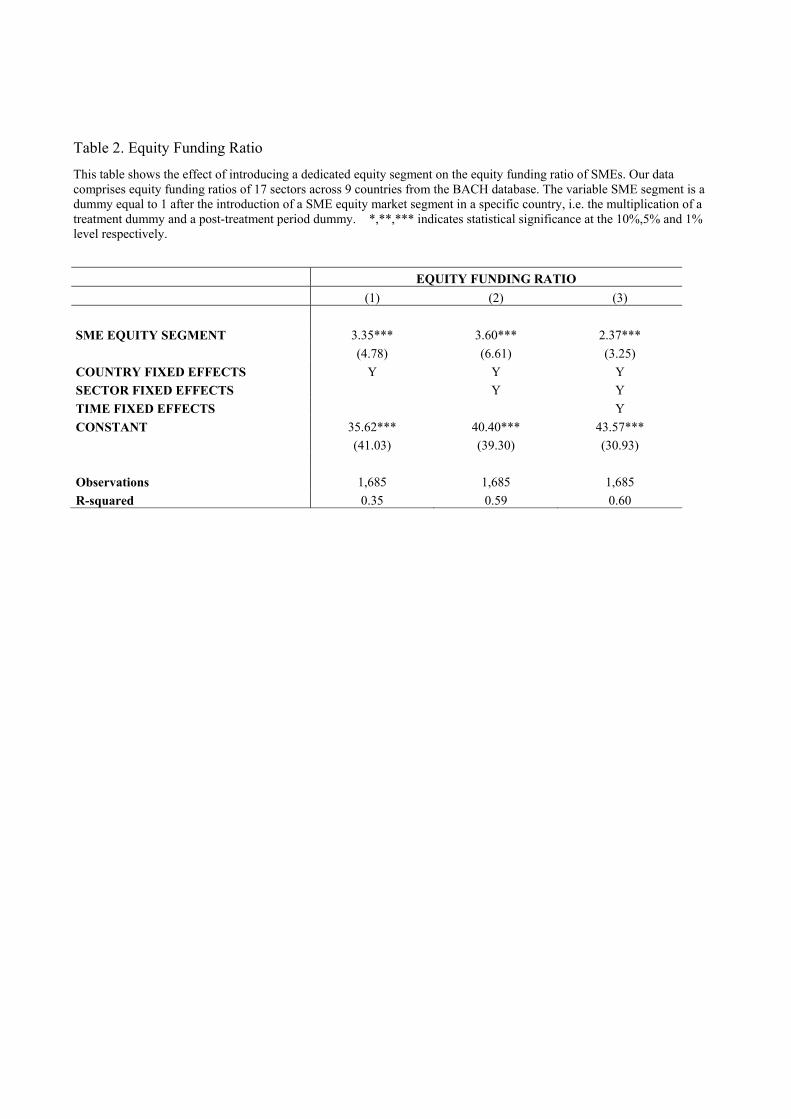
Table 2. Equity Funding Ratio
This table shows the effect of introducing a dedicated equity segment on the equity funding ratio of SMEs. Our data comprises equity funding ratios of 17 sectors across 9 countries from the BACH database. The variable SME segment is a dummy equal to 1 after the introduction of a SME equity market segment in a specific country, i.e. the multiplication of a treatment dummy and a post-treatment period dummy. *,**,*** indicates statistical significance at the 10%,5% and 1% level respectively.
EQUITY FUNDING RATIO
(1) (2) (3)
SME EQUITY SEGMENT 3.35*** 3.60*** 2.37***
(4.78) (6.61) (3.25)
COUNTRY FIXED EFFECTS Y Y Y
SECTOR FIXED EFFECTS Y Y
TIME FIXED EFFECTS Y
CONSTANT 35.62*** 40.40*** 43.57***
(41.03) (39.30) (30.93)
Observations 1,685 1,685 1,685
R-squared 0.35 0.59 0.60

Table 3. Bond Funding Ratio
This table shows the effect of introducing a dedicated bond segment on the bond funding ratio of SMEs. Our data comprises bond funding ratios of 17 sectors across 9 countries from the BACH database. The variable SME Bond segment is a dummy equal to 1 after the introduction of a SME bond market segment, i.e. the multiplication of a treatment dummy and a post-treatment period dummy. *,**,*** indicates statistical significance at the 10%,5% and 1% level respectively.
BOND FUNDING RATIO
(1) (2) (3)
SME BOND SEGMENT 0.03 0.03 0.06** (1.35) (1.39) (2.03)
COUNTRY FIXED EFFECTS Y Y Y
SECTOR FIXED EFFECTS Y Y
TIME FIXED EFFECTS Y
CONSTANT 0.13*** 0.15*** 0.10**
(7.28) (5.72) (2.52)
Observations 1,685 1,685 1,685
R-squared 0.35 0.43 0.44
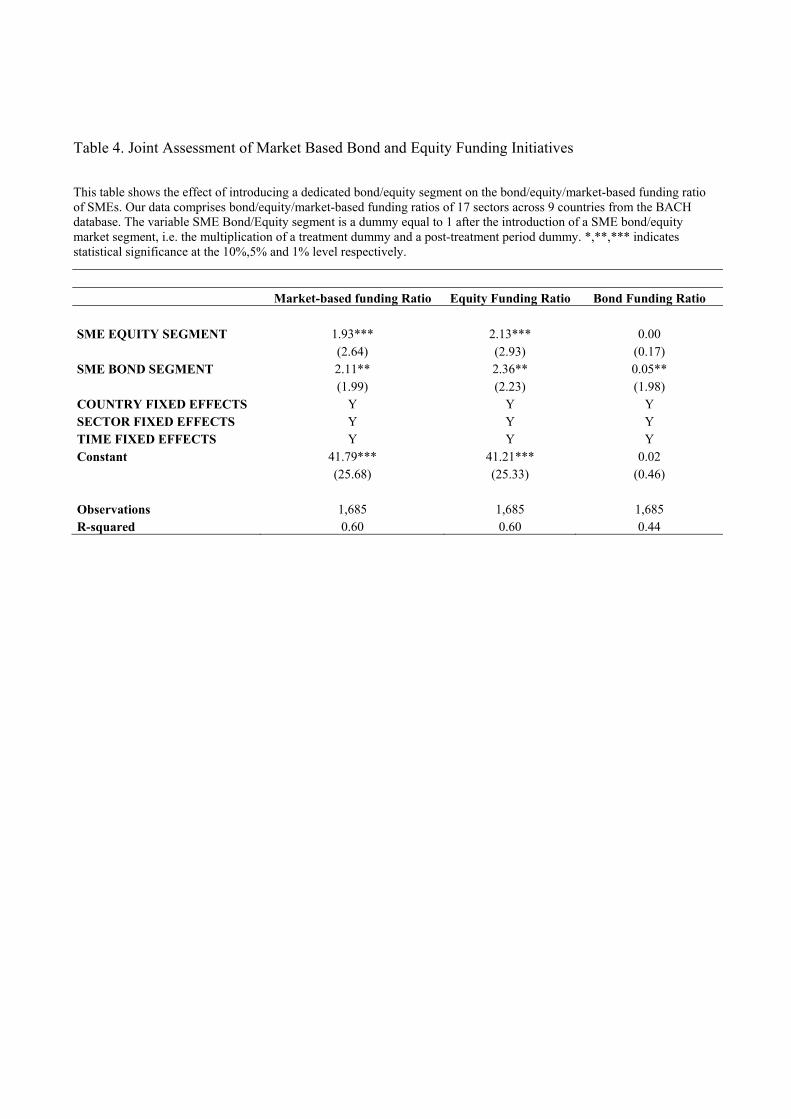
Table 4. Joint Assessment of Market Based Bond and Equity Funding Initiatives
This table shows the effect of introducing a dedicated bond/equity segment on the bond/equity/market-based funding ratio of SMEs. Our data comprises bond/equity/market-based funding ratios of 17 sectors across 9 countries from the BACH database. The variable SME Bond/Equity segment is a dummy equal to 1 after the introduction of a SME bond/equity market segment, i.e. the multiplication of a treatment dummy and a post-treatment period dummy. *,**,*** indicates statistical significance at the 10%,5% and 1% level respectively.
Market-based funding Ratio Equity Funding Ratio Bond Funding Ratio
SME EQUITY SEGMENT 1.93*** 2.13*** 0.00
(2.64) (2.93) (0.17) SME BOND SEGMENT 2.11** 2.36** 0.05**
(1.99) (2.23) (1.98) COUNTRY FIXED EFFECTS Y Y Y SECTOR FIXED EFFECTS Y Y Y TIME FIXED EFFECTS Y Y Y Constant 41.79*** 41.21*** 0.02
(25.68) (25.33) (0.46)
Observations 1,685 1,685 1,685 R-squared 0.60 0.60 0.44