non-communicable disease risk factor survey bangladesh 2010
TRANSCRIPT

Non-Communicable DiseaseRisk Factor SurveyBangladesh 2010
Bangladesh Society of Medicine N.C.D
Directorate General of Health Services Ministry of Health & Family Welfare

Non-Communicable DiseaseRisk Factor SurveyBangladesh 2010
Bangladesh Society of Medicine N.C.D
Directorate General of Health Services Ministry of Health & Family Welfare

II
WHO Library Cataloguing-in-Publication data
Non-communicable disease risk factor survey, Bangladesh 2010
1. Chronic disease - prevention and control. 2. Risk factors. 3. Health surveys. 4. Sampling studies.
5. Diabetes Mellitus. 6. Hypertension. 7. Alcohol Drinking. 8. Tobacco, Smokeless. 9. Motor Activity.
10. Socioeconomic Factors. 11. Bangladesh. I. Bangladesh Society of Medicine. II. Ministry of Health
& Family Welfare, Bangladesh. III. WHO Country Office for Bangladesh.
ISBN 978-92-9022-393-1 (NLM classification: WT 500)
© World Health Organization 2011All rights reserved.
Requests for publications, or for permission to reproduce or translate WHO publications - whether for
sale or for noncommercial distribution - can be obtained from Publishing and Sales, World Health
Organization, Regional Office for South-East Asia, Indraprastha Estate, Mahatma Gandhi Marg, New
Delhi 110 002, India (fax: +91 11 23370197; e-mail: [email protected]). The designations
employed and the presentation of the material in this publication do not imply the expression of any
opinion whatsoever on the part of the World Health Organization concerning the legal status of any
country, territory, city or area or of its authorities, or concerning the delimitation of its frontiers or
boundaries. Dotted lines on maps represent approximate border lines for which there may not yet be
full agreement.
The mention of specific companies or of certain manufacturers' products does not imply that they are
endorsed or recommended by the World Health Organization in preference to others of a similar
nature that are not mentioned. Errors and omissions excepted, the names of proprietary products are
distinguished by initial capital letters. All reasonable precautions have been taken by the World Health
Organization to verify the information contained in this publication. However, the published material
is being distributed without warranty of any kind, either expressed or implied. The responsibility for
the interpretation and use of the material lies with the reader. In no event shall the World Health
Organization be liable for damages arising from its use. This publication does not necessarily represent
the decisions or policies of the World Health Organization.
Printed in Bangladesh
Risk Factor Survey Bangladesh 2010

III
It is a great pleasure to have this report of the National Survey on Non-Communicable Disease (NCD) Risk Factors 2010 in Bangladesh. It is the product of a sincere effort of National Survey on NCD Risk Factors Bangladesh team.
This survey was designed to produce internationally comparable data on NCD risk factors using a standardized questionnaire, sample design, data collection and management procedures.
The Directorate General of Health Services designated the Bangladesh Society of Medicine as the implementing agency for the survey. I am happy that they have completed the survey within the stipulated time. In this regard, I am also grateful to the World Health Organization for their extensive technical assistance.
The present Government is committed to building a "Digital Bangladesh" and the National Survey on NCD Risk Factors was the second ever national survey using electronic means of data collection. This brings Bangladesh one step closer toward a digital Bangladesh.
I trust that this report will contribute to the monitoring of the NCD prevention and control policy package in Bangladesh.
Professor Dr A.F.M. Ruhal Haque
Risk Factor Survey Bangladesh 2010
MinisterMinistry of Health & Family Welfare
Government of the People's Republic of Bangladesh

Risk Factor Survey Bangladesh 2010

V
I feel proud that Bangladesh is one of the countries in the world that has undertaken a National Survey on NCD Risk Factors in 2010. It is one of the pioneering countries to complete the study using digital technology. This is towards fulfilling the Government's commitment to build a digital Bangladesh.
Surveillance and evaluation systems are an integral part of NCD control programme. The development of such a system is an obligation for the parties to the WHO Framework Convention on Tobacco Control (FCTC) and Global Strategy on Diet, Physical activity and Health. The National Survey on NCD Risk Factors 2010 will help us monitor the NCD and their risk factors for NCD control policies and programmes in Bangladesh.
I must thank the Bangladesh Society of Medicine for completing this challenging task in a timely manner despite many obstacles. In this regard, I would also like to thank the World Health Organization for their continuous support and technical assistance.
I hope the findings will help in monitoring the indicators of NCDs, WHO FCTC, as well as in monitoring implementation of the Global Strategy on Diet, Physical Activity and Health in Bangladesh.
Professor Dr Syed Modasser Ali
Risk Factor Survey Bangladesh 2010
Advisor tothe Honorable Prime Minister of the
Government of the People's Republic of Bangladesh(Health & Family Welfare and Social Welfare Ministry)

Risk Factor Survey Bangladesh 2010

VII
I am pleased to know that the report of the National Survey on NCD Risk Factors Bangladesh 2010 is now being published after a successful completion of the survey.
It is exciting to see that the survey covered the whole country, including some very hard-to-reach areas. The National Survey on NCD Risk Factor is a real example of the increasing digital capacity of Bangladesh. The sampling frame that has been established for this study can be used for future health-related studies in Bangladesh, which will make it possible to save time and resources.
I would like to thank Bangladesh Society of Medicine and the World Health Organization for their untiring efforts to conduct this study and publish this report.
I hope the findings of this study will guide implementation of the strategy on NCD prevention and control in Bangladesh.
Joy BanglaJoy Bangabandhu
Dr Capt. (Retd.) Mozibur Rahman Fakir
Risk Factor Survey Bangladesh 2010
State MinisterMinistry of Health & Family Welfare
Government of the People's Republic of Bangladesh

Risk Factor Survey Bangladesh 2010

IX
I am very pleased to know that Bangladesh Society of Medicine have completed the National Survey on NCD Risk Factors successfully under guidance of the Directorate General of Health Services.
NCDs are causing serious harms to the society both in terms of health and economy. For effective control and prevention of NCDs, periodic prevalence data are required. I am sure that this report will provide us valuable information in this regard. I sincerely acknowledge the technical support provided by the World Health Organization for the survey.
I believe that substantial capacity among the professionals has been developed through this survey which will be helpful for doing further survey at national level.
Md. Humayun Kabir
Risk Factor Survey Bangladesh 2010
SecretaryMinistry of Health and Family Welfare
Government of the People's Republic of Bangladesh

Risk Factor Survey Bangladesh 2010

XI
It gives me an immense pleasure to know that Bangladesh Society of Medicine has completed the National Survey on NCD Risk Factors maintaining the requisite quality. I thank the research team for successful completion of the survey.
Non-communicable diseases are the major health problem in developed countries. Nowadays it is becoming the leading cause of morbidity and mortality in developing countries also. I am sure the data from the National Survey on NCD Risk Factors will help us designing appropriate intervention programme for specific target groups.
I thank the World Health Organization for their technical support. I am happy to learn that substantial capacity building for doing large scale survey by using electronic data collection system has been done through this survey. This will take the present government's commitment for a digital Bangladesh a step ahead. I am grateful to Ministry of Health and Family welfare for providing leadership.
Professor Dr Khondhaker Md. Shefyetullah
Risk Factor Survey Bangladesh 2010
Director General of Health ServicesGovernment of the People's Republic of Bangladesh

Risk Factor Survey Bangladesh 2010

XIII
Non-communicable diseases (NCDs) are major causes of preventable deaths and disabilities. The National Survey on NCD Risk Factors provides information on the prevalence of important risk factors comparable across countries using standardized method.
I am pleased to see that National Survey on NCD Risk Factor in Bangladesh 2010 was completed successfully in spite of various limitations. I commend the Ministry of Health and Family Welfare for their leadership in conducting the survey. The Bangladesh Society of Medicine, the main implementing agency for the survey, did an excellent job using electronic data capture and transfer mechanism.
I am confident that this report will be useful in designing and implementing effective NCD control policies and programmes in Bangladesh.
Dr Arun Bhadra ThapaActing WHO Representative to Bangladesh
Risk Factor Survey Bangladesh 2010

Risk Factor Survey Bangladesh 2010

XVRisk Factor Survey Bangladesh 2010
Bangladesh Society of Medicine (BSM) is the platform for the Internists working all over Bangladesh. This is the first time that the Internist under the banner of Bangladesh Society of Medicine has undertaken a task of doing a nationwide survey of NCD risk factors following the WHO STEPS strategy. I must congratulate the members of the Society, particularly those who have in spite of their routine clinical job, worked hard, spent time and ultimately could successfully complete the task. I believe through this survey BSM has developed capacity and has gathered the experience of using electronic machine for survey. Experience gained through this survey can be utilized for doing other surveys in future. After successful completion of this survey, now BSM can announce that they are capable of doing national level surveys.
In this connection I like to thank those, in particular WHO, who from the very beginning of the study had placed faith on BSM for getting quality data. I think BSM has proved that those who kept faith on us were not incorrect.
I must admire the Directorate General of Health Services for their unconditional support for our researchers. Finally I on behalf of BSM must acknowledge with gratitude the contribution of all the researchers, doctors, field workers, data collectors, data analyst and the people who responded to the survey.
I hope that BSM will continue to contribute to the field of research in a much broader spectrum and in a much better way.
Professor M A Jalil Chowdhury
From the Desk of PresidentBangladesh Society of Medicine
Bangladesh Society of Medicine

Risk Factor Survey Bangladesh 2010

XVIIRisk Factor Survey Bangladesh 2010
STEERING COMMITTEE AND INVESTIGATORS
Steering Committee1. Professor M A Kashem Khandaker, Department of Medicine, Dhaka Medical College
2. Professor M A Faiz, Department of Medicine, Sir Salimullah Medical College
3. Professor F M Siddiqui, Department of Medicine, Dhaka Medical College
4. Professor Emran Bin Yunus, Department of Nephrology, Chittagong Medical College
5. Professor Kazi Tariqul Islam, Department of Medicine, Dhaka Medical College
6. Professor Khan Abul Kalam Azad, Department of Medicine, Dhaka Medical College
7. Associate Professor Billal Alam, Department of Medicine, Dhaka Medical College
Investigators Principal Investigator:
Professor Md. Mujibur Rahman, Department of Medicine, Shaheed Suhrawardy Medical College
Co-Principal Investigators:1. Professor Md. Abdul Jalil Chowdhury, Department of Medicine, Bangabandhu Sheikh
Mujib Medical University (BSMMU)
2. Professor H A M Nazmul Ahasan, Department of Medicine, Dhaka Medical College Investigators:
1. Professor Md. Ridwanur Rahman, Shaheed Suhrawardy Medical College (Dhaka Division)
2. Professor Md. Mahtabuddin Hasan, Chittagong Medical College (Chittagong Division)
3. Professor Syed Rezaul Karim, Khulna Medical College (Khulna Division)
4. Professor Md. Zakir Hossain, Rangpur Medical College (Rajshahi Division)
5. Assistant Professor Rubina Yasmin, Dhaka Medical College (Sylhet Division)
6. Associate Professor Humayun Kabir, Sher-e-Bangla Medical College (Barisal Division)
7. Associate Professor Md. Shafiqul Islam, National Institute of Preventive and Social
Medicine (NIPSOM)

Risk Factor Survey Bangladesh 2010

XIXRisk Factor Survey Bangladesh 2010
CONTRIBUTORS TO THE REPORT
1. M Mostafa Zaman, World Health Organization
2. Md. Mujibur Rahman, Shaheed Suhrawardy Medical College
3. Md. Abdul Jalil Chowdhury, Bangabandhu Sheikh Mujib Medical University
4. Md. Ridwanur Rahman, Shaheed Suhrawardy Medical College
5. Mahfuzur Rahman Bhuiyan, Senior Research Physician, National Survey on NCD Risk Factors
6. Md. Nazmul Karim, World Health Organization
7. Md. Shafiqul Islam, National Institute of Preventive and Social Medicine
8. S M Mahbubus Sobhan, Research Physician, National Survey on NCD Risk Factors

Risk Factor Survey Bangladesh 2010

XXIRisk Factor Survey Bangladesh 2010
List of acronyms . . . . . . . . . . . . . . . . . . . . . . . . . . . . . . . . . . . . . . . . . . . . . . . . . . . . . . . . . . . . . . . . . . . . . . . . . . . . . . XXIII
List of text boxes . . . . . . . . . . . . . . . . . . . . . . . . . . . . . . . . . . . . . . . . . . . . . . . . . . . . . . . . . . . . . . . . . . . . . . . . . . . . . . XXV
List of figures . . . . . . . . . . . . . . . . . . . . . . . . . . . . . . . . . . . . . . . . . . . . . . . . . . . . . . . . . . . . . . . . . . . . . . . . . . . . . . . . . XXVII
List of tables . . . . . . . . . . . . . . . . . . . . . . . . . . . . . . . . . . . . . . . . . . . . . . . . . . . . . . . . . . . . . . . . . . . . . . . . . . . . . . . . . . XXIX
Preface . . . . . . . . . . . . . . . . . . . . . . . . . . . . . . . . . . . . . . . . . . . . . . . . . . . . . . . . . . . . . . . . . . . . . . . . . . . . . . . . . . . . . . . XXXIII
Executive summary . . . . . . . . . . . . . . . . . . . . . . . . . . . . . . . . . . . . . . . . . . . . . . . . . . . . . . . . . . . . . . . . . . . . . . . . . . . XXXV
1. Introduction . . . . . . . . . . . . . . . . . . . . . . . . . . . . . . . . . . . . . . . . . . . . . . . . . . . . . . . . . . . . . . . . . . . . . . . . . . . . . . . 01
2. Objectives . . . . . . . . . . . . . . . . . . . . . . . . . . . . . . . . . . . . . . . . . . . . . . . . . . . . . . . . . . . . . . . . . . . . . . . . . . . . . . . . . 03
3. Methods . . . . . . . . . . . . . . . . . . . . . . . . . . . . . . . . . . . . . . . . . . . . . . . . . . . . . . . . . . . . . . . . . . . . . . . . . . . . . . . . . . 05
4. Results . . . . . . . . . . . . . . . . . . . . . . . . . . . . . . . . . . . . . . . . . . . . . . . . . . . . . . . . . . . . . . . . . . . . . . . . . . . . . . . . . . . . 17
4.1 Socioeconomic background . . . . . . . . . . . . . . . . . . . . . . . . . . . . . . . . . . . . . . . . . . . . . . . . . . . . . . . . . . 17
4.2 Tobacco . . . . . . . . . . . . . . . . . . . . . . . . . . . . . . . . . . . . . . . . . . . . . . . . . . . . . . . . . . . . . . . . . . . . . . . . . . . . . . 17
4.3 Diet . . . . . . . . . . . . . . . . . . . . . . . . . . . . . . . . . . . . . . . . . . . . . . . . . . . . . . . . . . . . . . . . . . . . . . . . . . . . . . . . . . 19
4.4 Physical activity . . . . . . . . . . . . . . . . . . . . . . . . . . . . . . . . . . . . . . . . . . . . . . . . . . . . . . . . . . . . . . . . . . . . . . 20
4.5 Alcohol consumption . . . . . . . . . . . . . . . . . . . . . . . . . . . . . . . . . . . . . . . . . . . . . . . . . . . . . . . . . . . . . . . . . 21
4.6 Obesity . . . . . . . . . . . . . . . . . . . . . . . . . . . . . . . . . . . . . . . . . . . . . . . . . . . . . . . . . . . . . . . . . . . . . . . . . . . . . . 22
4.7 Blood pressure . . . . . . . . . . . . . . . . . . . . . . . . . . . . . . . . . . . . . . . . . . . . . . . . . . . . . . . . . . . . . . . . . . . . . . . 23
4.8 Diabetes mellitus . . . . . . . . . . . . . . . . . . . . . . . . . . . . . . . . . . . . . . . . . . . . . . . . . . . . . . . . . . . . . . . . . . . . . 24
4.9 Socio-economic gradients and clustering of risk factors . . . . . . . . . . . . . . . . . . . . . . . . . . . . . . . . 24
5. Discussion . . . . . . . . . . . . . . . . . . . . . . . . . . . . . . . . . . . . . . . . . . . . . . . . . . . . . . . . . . . . . . . . . . . . . . . . . . . . . . . . 27
6. Policy recommendations . . . . . . . . . . . . . . . . . . . . . . . . . . . . . . . . . . . . . . . . . . . . . . . . . . . . . . . . . . . . . . . . . . 35
7. Acknowledgements . . . . . . . . . . . . . . . . . . . . . . . . . . . . . . . . . . . . . . . . . . . . . . . . . . . . . . . . . . . . . . . . . . . . . . . 37
8. References . . . . . . . . . . . . . . . . . . . . . . . . . . . . . . . . . . . . . . . . . . . . . . . . . . . . . . . . . . . . . . . . . . . . . . . . . . . . . . . . 39
9. Appendices
Appendix A: List of project staff . . . . . . . . . . . . . . . . . . . . . . . . . . . . . . . . . . . . . . . . . . . . . . . . . . . . . . . . . 43
Appendix B: Survey questionnaire: English and Bangla . . . . . . . . . . . . . . . . . . . . . . . . . . . . . . . . . . . 45
Appendix C: Showcards . . . . . . . . . . . . . . . . . . . . . . . . . . . . . . . . . . . . . . . . . . . . . . . . . . . . . . . . . . . . . . . . . 81
Appendix D: Glossary of terms . . . . . . . . . . . . . . . . . . . . . . . . . . . . . . . . . . . . . . . . . . . . . . . . . . . . . . . . . . 87
Appendix E: Tables . . . . . . . . . . . . . . . . . . . . . . . . . . . . . . . . . . . . . . . . . . . . . . . . . . . . . . . . . . . . . . . . . . . . . . 91
TABLE OF CONTENTS

Risk Factor Survey Bangladesh 2010

XXIIIRisk Factor Survey Bangladesh 2010
LIST OF ACRONYMS
BBS Bangladesh Bureau of Statistics
BMI Body mass index
BP Blood pressure
BSM Bangladesh Society of Medicine
COPD Chronic obstructive pulmonary disease
CVD Cardiovascular disease
DBP Diastolic blood pressure
DM Diabetes mellitus
GATS Global Adult Tobacco Survey
MET Metabolic equivalent
NCD Non-communicable disease
PDA Personal digital assistant
PSU Primary sampling unit
SBP Systolic blood pressure
SHS Second hand smoke
SSU Secondary sampling unit
FCTC Framework Convention on Tobacco Control
STEPS STEPwise Surveillance
WHO World Health Organization

Risk Factor Survey Bangladesh 2010

XXVRisk Factor Survey Bangladesh 2010
Box 1: Selection of primary sampling units (PSUs) . . . . . . . . . . . . . . . . . . . . . . . . . . . . . . . . . . . . . . . . . . . . . 06
Box 2: Stages of sample selection and their techniques . . . . . . . . . . . . . . . . . . . . . . . . . . . . . . . . . . . . . . . 06
Box 3: Summary results for overall response proportions . . . . . . . . . . . . . . . . . . . . . . . . . . . . . . . . . . . . . 09
Box 4: Agreement between measurements by field investigators and quality control
physicians . . . . . . . . . . . . . . . . . . . . . . . . . . . . . . . . . . . . . . . . . . . . . . . . . . . . . . . . . . . . . . . . . . . . . . . . . . . . 14
Box 5: Number of people (in millions) with selected risk factors among the adult population
aged 25 years or above . . . . . . . . . . . . . . . . . . . . . . . . . . . . . . . . . . . . . . . . . . . . . . . . . . . . . . . . . . . . . . . . 27
Box 6: Comparison of GATS and NCD risk factor survey findings on current tobacco use for
those aged 25 years or above . . . . . . . . . . . . . . . . . . . . . . . . . . . . . . . . . . . . . . . . . . . . . . . . . . . . . . . . . . 27
LIST OF TEXT BOXES

Risk Factor Survey Bangladesh 2010

XXVIIRisk Factor Survey Bangladesh 2010
Figure 1: Study locations . . . . . . . . . . . . . . . . . . . . . . . . . . . . . . . . . . . . . . . . . . . . . . . . . . . . . . . . . . . . . . . . . . . . . 08
Figure 2: Sample map of a primary sampling unit . . . . . . . . . . . . . . . . . . . . . . . . . . . . . . . . . . . . . . . . . . . . 08
Figure 3: Sample map of a secondary sampling unit . . . . . . . . . . . . . . . . . . . . . . . . . . . . . . . . . . . . . . . . . . 08
Figure 4: Flowchart of digital data collection and transfer . . . . . . . . . . . . . . . . . . . . . . . . . . . . . . . . . . . . . 08
Figure 5: Prevalence of current tobacco use, smoking or smokeless forms, in rural and
urban areas . . . . . . . . . . . . . . . . . . . . . . . . . . . . . . . . . . . . . . . . . . . . . . . . . . . . . . . . . . . . . . . . . . . . . . . . 18
Figure 6: Prevalence of inadequate intake of fruit and/or vegetables (<5 servings/day) in
rural and urban areas . . . . . . . . . . . . . . . . . . . . . . . . . . . . . . . . . . . . . . . . . . . . . . . . . . . . . . . . . . . . . . . 19
Figure 7: Prevalence of low physical activity (<600 MET - minutes) in rural and urban areas . . . . . 20
Figure 8: Percentage of people who drank at least one sip of alcoholic drink in past 30 days . . . . 21
Figure 9: Percentage of people having BMI 25 (kg/m2) or above in urban and rural areas . . . . . . . 22
Figure 10: Percentage of respondents with increased waist circumference (men >_94 cm,
women >_80 cm) in urban and rural areas . . . . . . . . . . . . . . . . . . . . . . . . . . . . . . . . . . . . . . . . . . . . 22
Figure 11: Prevalence of hypertension (blood pressure >_140/90 mmHg or drug treatment) in
urban and rural areas . . . . . . . . . . . . . . . . . . . . . . . . . . . . . . . . . . . . . . . . . . . . . . . . . . . . . . . . . . . . . . . 23
Figure 12: Prevalence of self reported (documented) diabetes in urban and rural areas . . . . . . . . . . 24
Figure 13: Risk factor clustering across wealth quartiles . . . . . . . . . . . . . . . . . . . . . . . . . . . . . . . . . . . . . . . . 25
Figure 14: Distribution of respondents with three or more risk factors in rural and
urban areas . . . . . . . . . . . . . . . . . . . . . . . . . . . . . . . . . . . . . . . . . . . . . . . . . . . . . . . . . . . . . . . . . . . . . . . . . 25
LIST OF FIGURES

Risk Factor Survey Bangladesh 2010

XXIXRisk Factor Survey Bangladesh 2010
Table 1.1: Distribution of the respondents by age, residence and sex . . . . . . . . . . . . . . . . . . . . . . . . . . 91
Table 1.2: Level of education of respondents . . . . . . . . . . . . . . . . . . . . . . . . . . . . . . . . . . . . . . . . . . . . . . . . . 92
Table 1.3: Distribution of the respondents by principal occupation . . . . . . . . . . . . . . . . . . . . . . . . . . . . 93
Table 1.4: Distribution of the respondents by wealth indices . . . . . . . . . . . . . . . . . . . . . . . . . . . . . . . . . . 94
Table 2.1: Current smoking status (daily and non-daily) of the respondents . . . . . . . . . . . . . . . . . . . . 95
Table 2.2: Age of initiation and duration of smoking (in years) of the daily smokers . . . . . . . . . . . . 96
Table 2.3: Distribution of daily smokers by use of smoking tobacco products . . . . . . . . . . . . . . . . . . 97
Table 2.4: Frequency of smoking per day of the daily smokers. . . . . . . . . . . . . . . . . . . . . . . . . . . . . . . . . 98
Table 2.5: Distribution of the respondents by ex-daily smoking status . . . . . . . . . . . . . . . . . . . . . . . . . 99
Table 2.6: Prevalence of current and ex-use of smokeless tobacco among all respondents . . . . . . 100
Table 2.7: Frequency of use of various tobacco products by daily smokeless
tobacco users . . . . . . . . . . . . . . . . . . . . . . . . . . . . . . . . . . . . . . . . . . . . . . . . . . . . . . . . . . . . . . . . . . . . . 101
Table 2.8: Distribution of daily smokeless tobacco users by use of smokeless
tobacco products . . . . . . . . . . . . . . . . . . . . . . . . . . . . . . . . . . . . . . . . . . . . . . . . . . . . . . . . . . . . . . . . . 102
Table 2.9: Distribution of the tobacco users by combination of smoking and
smokeless tobacco use . . . . . . . . . . . . . . . . . . . . . . . . . . . . . . . . . . . . . . . . . . . . . . . . . . . . . . . . . . . . 103
Table 2.10: Exposure to secondhand tobacco smoke of smokers and non smokers on one
or more days in the past 7 days . . . . . . . . . . . . . . . . . . . . . . . . . . . . . . . . . . . . . . . . . . . . . . . . . . . . 104
Table 3.1: Mean number of days and servings of fruit and vegetables consumption . . . . . . . . . . . . 105
Table 3.2: Fruit consumption of the respondents on an average day (in servings) . . . . . . . . . . . . . . . 106
Table 3.3: Vegetables consumption of the respondents on an average day (in servings) . . . . . . . . . 107
Table 3.4: Consumption of fruit and/or vegetables on an average day (in servings) . . . . . . . . . . . . . 108
Table 4.1: Time (in minutes) spent in work, transport and leisure-related physical
activity on an average day . . . . . . . . . . . . . . . . . . . . . . . . . . . . . . . . . . . . . . . . . . . . . . . . . . . . . . . . . 109
Table 4.2: Prevalence of no work, transport and leisure related physical activity . . . . . . . . . . . . . . . . 110
LIST OF TABLES

Risk Factor Survey Bangladesh 2010
Table 4.3: Proportion of work, transport and leisure activity contributing to total activity . . . . . . 111
Table 4.4: Prevalence of non-engagement into vigorous or at least moderate physical
activity irrespective of duration . . . . . . . . . . . . . . . . . . . . . . . . . . . . . . . . . . . . . . . . . . . . . . . . . . . 112
Table 4.5: Time (in minutes) spent in vigorous, moderate and sedentary activity
on an average day . . . . . . . . . . . . . . . . . . . . . . . . . . . . . . . . . . . . . . . . . . . . . . . . . . . . . . . . . . . . . . . . . 113
Table 4.6: Distribution of the respondents by total (combination of work, transportation
and leisure) physical activity categories . . . . . . . . . . . . . . . . . . . . . . . . . . . . . . . . . . . . . . . . . . . . 114
Table 5.1: Distribution of the respondents by alcohol consumption status . . . . . . . . . . . . . . . . . . . . . 115
Table 5.2: Frequency of drinking among those who drank alcohol in the past12 months . . . . . . . 116
Table 5.3: Number of occasions with at least one drink consumed on a drinking occasion
in the past 30 days by current drinkers . . . . . . . . . . . . . . . . . . . . . . . . . . . . . . . . . . . . . . . . . . . . . 117
Table 5.4: Number of standard drinks consumed on a drinking occasion in the past
30 days by current drinkers . . . . . . . . . . . . . . . . . . . . . . . . . . . . . . . . . . . . . . . . . . . . . . . . . . . . . . . . 118
Table 5.5: Prevalence of heavy episodic (binge) drinking in the past 30 days among
current drinkers . . . . . . . . . . . . . . . . . . . . . . . . . . . . . . . . . . . . . . . . . . . . . . . . . . . . . . . . . . . . . . . . . . . 119
Table 6.1: Height (in cm), weight (in kg) and body mass index (in kg/m2) of the respondents . . 120
Table 6.2: Body mass index (BMI) categories of respondents . . . . . . . . . . . . . . . . . . . . . . . . . . . . . . . . . . 121
Table 6.3: Mean waist circumference (in cm) of the respondents . . . . . . . . . . . . . . . . . . . . . . . . . . . . . . 122
Table 6.4: Distribution of the respondents by waist circumference categories . . . . . . . . . . . . . . . . . 123
Table 7.1: Measurement of blood pressure and diagnosis of hypertension among
respondents . . . . . . . . . . . . . . . . . . . . . . . . . . . . . . . . . . . . . . . . . . . . . . . . . . . . . . . . . . . . . . . . . . . . . . 124
Table 7.2: Prevalence of use of blood pressure drugs prescribed by doctor or health
worker among the hypertensive respondents . . . . . . . . . . . . . . . . . . . . . . . . . . . . . . . . . . . . . . 125
Table 7.3: Distribution of the hypertensive respondents who received advice from a
doctor or health worker for lifestyle modification . . . . . . . . . . . . . . . . . . . . . . . . . . . . . . . . . . . 126
XXX
LIST OF TABLES (Cont.)

XXXIRisk Factor Survey Bangladesh 2010
Table 7.4: Hypertensives who have seen traditional healers for advice/treatment for
raised blood pressure . . . . . . . . . . . . . . . . . . . . . . . . . . . . . . . . . . . . . . . . . . . . . . . . . . . . . . . . . . . . . 127
Table 7.5: Mean blood pressure (mmHg) among all respondents . . . . . . . . . . . . . . . . . . . . . . . . . . . . . 128
Table 7.6: Prevalence of high blood pressure among respondents at measurement
during survey . . . . . . . . . . . . . . . . . . . . . . . . . . . . . . . . . . . . . . . . . . . . . . . . . . . . . . . . . . . . . . . . . . . . . 129
Table 7.7: Status of treatment and blood pressure control among previously diagnosed
hypertensive respondents . . . . . . . . . . . . . . . . . . . . . . . . . . . . . . . . . . . . . . . . . . . . . . . . . . . . . . . . . 130
Table 8.1: Distribution of the respondents by measurement of blood glucose and
diagnosis of diabetes . . . . . . . . . . . . . . . . . . . . . . . . . . . . . . . . . . . . . . . . . . . . . . . . . . . . . . . . . . . . . . 131
Table 8.2: Diabetic respondents who are currently taking insulin or oral antidiabetic drugs . . . . 132
Table 8.3: Diabetic respondents who received advice for lifestyle modification from
a doctor or health worker . . . . . . . . . . . . . . . . . . . . . . . . . . . . . . . . . . . . . . . . . . . . . . . . . . . . . . . . . 133
Table 8.4: Distribution of the diabetic respondents who sought advice or treatment
from traditional healers for diabetes . . . . . . . . . . . . . . . . . . . . . . . . . . . . . . . . . . . . . . . . . . . . . . . 134
Table 9: Distribution of the respondents by the number of risk factors . . . . . . . . . . . . . . . . . . . . . . 135
LIST OF TABLES (Cont.)

Risk Factor Survey Bangladesh 2010

XXXIIIRisk Factor Survey Bangladesh 2010
PREFACE
The STEPS survey of non-communicable disease (NCD) is the first ever population based national survey in Bangladesh. It is one of the pioneering STEPS survey in the world to be done using digital technology; Bangladesh Society of Medicine is a proud part of this history.
I gratefully admire and acknowledge the attitude of Directorate General of Health Services and Ministry of Health and Family Welfare towards us for their whole hearted support. I also acknowledge and sincerely express my gratitude to the WHO, for its technical support to the investigators team for smooth completion of the project. Specially I want to mention one name, Dr. M Mostafa Zaman, without active support of him and his team it would not be possible to complete the task in time with such a high quality.
I must convey my gratitude to the investigators team, research physicians, field interviewers, the IT specialists and above all the participants who spent their valuable time to provide data. I would like to extend my gratitude to the steering committee and other members of BSM for their whole hearted support and contributions to the survey. I also acknowledge and express my gratitude to the Principal and Director of Shaheed Suhrawardy Medical College and Hospital for their support and providing us with infrastructural facilities in their premises.
Because this survey has given nationally representative data on NCD risk factors, this report will help formulating the prevention strategy on NCDs in Bangladesh.
Professor Md. Mujibur RahmanDepartment of Medicine, ShSMCSecretary for Scientific Affairs, BSM & Principal Investigator

Risk Factor Survey Bangladesh 2010

XXXVRisk Factor Survey Bangladesh 2010
EXECUTIVE SUMMARY
The emerging pandemic of non-communicable diseases (NCDs) creates a new frontier for health professionals globally. Most of the forecasted increase in NCD prevalence and death rates can be accounted for by emerging NCD epidemics in developing countries. Bangladesh has been facing a dual burden of existing infectious diseases and escalating rise of NCDs like diabetes, heart disease, stroke, cancer, chronic respiratory disease, etc. For getting prepared for the challenge of these diseases, information regarding their distribution and determinants is indispensable. Their control could well be addressed through their common risk factors. Current nationwide survey was aimed at determining the distribution of NCD risk factors in Bangladeshi adult population.
METHODS
This national survey on NCD risk factors is a cross-sectional study and was carried out as part of the global endeavour to address major NCD risk factors. The survey was conducted from November 2009 to April 2010 and involved collection of data from a representative sample of men and women aged 25 years or above residing everywhere in Bangladesh.
The study adopted a multistage, geographically clustered, probability-based sampling approach and 2001 census sampling frame, the latest census in the country, was used. The primary sampling units (PSUs) considered for rural stratum were mauza, and for the urban stratum, PSUs were based on mahalla. One enumeration area from each of 200 mauza and 200 mahalla were identified and marked as secondary sampling unit (SSU). The ultimate sampling units were the household and one individual (equal number of men and women) residing in the selected household. Sampling of eligible individuals was done from a sample of households with one individual randomly selected per household. Each selected household was randomly assigned as a men or women household. Among the 400 PSUs data could be made available for 9 947 households. Out of them 9 275 respondents (93.3%) participated. Survey used a standardized questionnaire and physical measurements. The questionnaire for the survey was developed with minor adaptation of WHO STEPwise Surveillance (STEPS) questionnaire. All the core variables along with some expanded variables from step 1 were incorporated. From step 2 physical measurements (height, weight, waist circumference and blood pressure) were included. For each interviewee one household and one individual questionnaire were administered.
RESULTS AND COMMENTS
1. Population characteristics
Of 9 275 respondents of the survey 4 312 were men and 4 963 were women. Mean age was 42.4 years. They had 3 years of median schooling (5 years in men and 3 years in women). Interestingly (and encouragingly) equal percentage (11%) of men and women completed primary education. In men farmers made up 22.8%, 19.2% were small businessmen, 12% were day labourer and 11.8% non-government employee. In women, housewives made up 83.4% of the surveyed population.
2. Tobacco use
Overall prevalence of smoking was 26.2% (54.8% in men and 1.3% in women). The picture was similar in rural and urban residents. Twenty five per cent were daily smoker. On an average people started

XXXVIRisk Factor Survey Bangladesh 2010
smoking at 18.4 years of age, however around 34.6% respondents initiated smoking at or before the age of 15 years. Most smokers (67.7%) used manufactured cigarette. Overall consumption of smokeless tobacco was 31.7%. Its use in women (33.6%) was more than in men (29.4%). Consumption was higher in older age groups and this trend was more prominent in women. Smokeless tobacco use was slightly more in rural area (35.1%) compared to urban area (30.8%). Tobacco in combination of smoking and smokeless or in isolation was being used by half of the adult population (51%), man being the most users (70%) compared to women (34.4%). Moreover 42% non-smokers were exposed to second hand smoke at home (36%) or workplace (21%).
3. Fruit and vegetables intake
Survey population took fruit on an average 1.8 days a week. Frequency of vegetables consumption was particularly high in Bangladeshi population. They consumed vegetables in around 6.1 days a week (men 5.7 days and women 6.4 days). However in combination of fruit and/or vegetables it became 4 days a week. Quantity of intake was measured by servings of fruit (say one serving equal to a medium size banana or apple or equivalents) and vegetables (one cup for green leafy vegetables or half a cup for cooked vegetables). In spite of a satisfactory frequency, neither fruit nor vegetables consumption was adequate in quantity. The overall daily per capita consumption of fruit was 1.7 servings and of vegetables 2.3 servings against their minimum daily total requirement of 5 servings. Considering this as minimum recommended amount, 95.7% did not consume adequate fruit or vegetables on an average day.
4. Physical activity
Physical activity related to work, transportation and leisure time was assessed in terms of minutes that caused them breathless or feeling of palpitation. However continuous activity of at least ten minutes was taken into account to add up to the total minutes of activity for the day. Then the total duration was converted into metabolic equivalents (MET minutes/week). Based on MET minutes/week, 27% of the subjects fell into low physical activity category (<600), 20.2% fell into moderate physical activity category (600 -- 3000) and 52.8% fell into high physical activity category (>3000). Women were generally less active but most of their METs were contributed by moderate activities irrespective of their area of residence. Work contributed more than half of the total activity (56%), around 31% was contributed by transport related activity and around 13% were contributed by the leisure time physical activity. One third (33%) of them usually do not engage into even moderate activity (such as brisk walking, household chores) and 62% people usually did not engage into any vigorous physical activities such as running, cycling, swimming, climbing, lifting heavy weights etc. High physical activity was more in rural men than their urban counterparts.
5. Alcohol consumption
Ninety four per cent adult in Bangladesh were lifetime abstainer of alcohol. Only 0.9% respondent consumed alcohol, even a single sip, in past 30 days. However overall 66.7% of the current alcohol consumers were binge drinkers (>_5 standard drink in men and >_4 standard drinks in women) and almost all of them were men. On an average current drinkers went binge in 4.2 occasions in past 30 days.
6. Obesity
Based on body mass index (weight in Kg divided by height in meter squared) one fourth (25%) of the population were underweight (BMI<18.5 kg/m2), 57% were normal weight and 18% were overweight

XXXVIIRisk Factor Survey Bangladesh 2010
Number of people (in millions) with selected risk factors among the adult populationaged 25 year or above*
Risk factors Men Women Both sexes Current smoking 18.5 0.4 18.9Smokeless tobacco use 9.9 11.3 21.2Tobacco use (any form) 23.6 11.5 35.1Low fruit/vegetable intakea 32.9 31.6 64.5Low physical activityb 3.5 13.9 17.4Obesityc 4.4 7.3 11.6Abdominal obesityd 2.7 11.3 14.0Hypertensione 6.2 5.8 12.0Diabetes mellitus (documented) 1.4 1.2 2.7* Based on projected 2008 population a < 5 servings/day, b< 600 MET-minutes per week, c BMI >_25 kg/m2, d Waist girth: men >_94 cm, women >_80 cm,e BP >_140/90 mmHg or medication
(BMI>_25.0 kg/m2). Proportion of overweight in women (21.6%) exceeded the proportion of those in men (13%). Waist circumference is a measure of central obesity. Eight per cent men and 33.7% women (21.7% sexes combined) had increased waist circumference (>_94 cm in men and >_80 cm in women). Higher prevalence of both central and general obesity in women may predispose them to an increased risk of NCDs.
7. Blood pressure
One third (32.9%) of the population never measured their blood pressure. The prevalence of self-reported (documented) hypertension was 12.5% (men 10.9% and women 13.9%). Prevalence of hypertension was related to age.
Overall 14.8% of the survey population was having hypertension (blood pressure >_140/90 mmHg) excluding medication; when history of anti-hypertensive drugs was considered this figure rose to 17.9% suggesting an existence of a huge number of undiagnosed cases in the population who are potentially at more risk of ill consequences. The prevalence of hypertension is more in urban area (19.9%) than in rural area (15.9%). Among those previously reported to have hypertension, 30% were found to be normotensive at measurement and 18% were normotensive on medication, 31% were hypertensive with medication and 21% were hypertensive and they did not take any medication. This clearly reflects the need for effective hypertension control programme for the population at large.
8. Diabetes mellitus
Blood glucose measurement was not included in this study. Documented history of diabetes was sought. Around 83% of participants never measured their blood glucose. About 3.9% of the people were previously diagnosed to have diabetes (men 4.3% and women 3.6%). Among them, 21% were receiving insulin and 61% oral anti diabetic drugs.
9. Socioeconomic gradients and clustering of risk factors
Risk factors of NCDs have a tendency of clustering. There was hardly anyone without a risk factor. About 98.7% have at least one risk factor, 77.4% had two or more risk factors and 28.3% had 3 or more

XXXVIIIRisk Factor Survey Bangladesh 2010
risk factors. Participants were categorized into four quartiles based on wealth indices derived from household assets. Diabetes, hypertension, low physical activity and obesity were more in rich people but tobacco use, binge drinking, low fruit and vegetables intake were more in the poor. However when presence of three or more risk factors was considered, it is the higher socioeconomic groups that bear most of the brunt.
POLICY RECOMMENDATIONS
This first ever nationally representative survey in Bangladesh provides essential information on key indicators of NCD risk factors and creates an opportunity for policy makers, programme managers, and researchers to adopt interventions. Inadequate intake of fruit and vegetables, use of tobacco, low level of physical activity (specially in women), binge drinking among current drinkers, obesity (especially abdominal), high blood pressure and diabetes mellitus are fairly common in adults. Almost all adults (98.7%) have at least one risk factor and substantial proportion of people have two or more risk factors. Based on these findings, the specific recommendations are:
1. Population based approach using primary health care system for NCD prevention is warranted. Mass awareness through campaigns and school curricula is necessary.
2. Tobacco consumption is high even after five years of having a Tobacco Control Act. Adequate enforcement of the Act is necessary. Necessary amendment of the Act is also required to close all the loop holes in the tobacco control programme.
3. Strategies to promote accessibility and availability of fruit and vegetables round the year for all people should be formulated and implemented.
4. Appropriate measures should be undertaken, with emphasis on leisure time physical activity, to promote empowering environment for physical activity.
5. A large proportion of people do not measure blood pressure or blood glucose and, hence large proportion of hypertension and diabetes remain undetected. Primary health care system should be reoriented towards early detection and treatment of these common ailments.
6. Because there is hardly any nationally representative data on NCD risk factors, national surveys on health should consider inclusion of NCD risk factors.

1Risk Factor Survey Bangladesh 2010
The rapid rise of non-communicable diseases (NCDs) represents one of the major health challenges to global development. NCDs were estimated to have contributed to almost 60% of deaths in the world and among them about 80% occur in the developing countries.1 NCDs are already of major importance in developed countries and are rapidly becoming a major public health threat in the developing world. These diseases constituted 43% of the global burden of disease in 1999. Based on current trends, by 2020 they will account for 73% of deaths and 60% of the disease burden in the developing countries.2
The underlying cause of NCD epidemic is the increase in lifestyle related risk factors resulting from social and economic changes. In many countries the increasing impact of globalization has given momentum to this process.2 Currently neighbouring India is also experiencing an epidemic of NCDs attributed to lifestyle changes resulting from urbanization.3
WHO report in 2002 identified unhealthy diet, physical inactivity, tobacco use, harmful use of alcohol, overweight, raised blood pressure, raised total cholesterol levels and raised blood glucose as the most prevalent NCD risk factors among the world population.4 Among the modifiable risk factors unhealthy diet, physical inactivity, alcohol and tobacco use are categorized into primary risk factors and overweight, raised blood pressure, raised total cholesterol levels and raised blood glucose are categorized as intermediate risk factors. Most population has been experiencing an increased prevalence of both primary and intermediate risk factors. Hypertension alone is the main risk factor for developing ischemic heart disease, stroke, heart and renal failures and peripheral vascular diseases.4
NCD associated risk factors are largely modifiable. Therefore, by identifying and preventing the risk factors, NCDs such as coronary heart disease and stroke would be prevented by 80%, cancer by 40% and type 2 diabetes by 90%. Projections by experts estimate that an annual reduction of chronic disease death rates by 2% in the next 10 years will account for 36 million lives be saved.5 In addition, one third of all cancers could be prevented by eating healthy food, maintaining normal weight and being physically active throughout the lifespan.6
Like many other countries, Bangladesh has been experiencing an epidemiological transition from communicable disease to NCDs.7 Among the NCDs, cardiovascular diseases (CVD), diabetes, chronic obstructive pulmonary disease (COPD) and cancers are most prevalent. With economic development and increased level of control and treatment of infectious diseases NCDs are becoming a major health problem in Bangladesh.8 However, representative national level data on NCDs and their risk factors are still inadequate in Bangladesh. Major established risk factors explain approximately 75% of the occurrence of coronary heart disease within populations.9 A few studies have so far reported prevalence of individual risk factors such as hypertension, smoking and dietary habit, from urban and rural populations.10,11 However only few of them are done recently,12,13 and showed a significantly increasing gradient in NCD prevalence.
To respond to the increased burden of NCDs, WHO put due emphasis on gathering information on NCDs and their risk factors, as they are necessary for designing prevention and control programme with specific goal and measurable outcome. Population specific data on risk factors are essential in
1. INTRODUCTION

2Risk Factor Survey Bangladesh 2010
order to set priorities, develop targeted programmmes on NCDs. Anticipating the NCD epidemic, WHO has initiated the worldwide STEPwise approach to Surveillance (STEPS) of risk factors for NCDs. STEPS focuses on the periodic collection of data on key risk factors associated with major NCDs which is indispensable for designing community based interventions to reduce risk factors in the population.14
Prevalence of common NCDs are increasing and most of these NCDs share common preventable risk factors. Major risk factors of today will be the diseases of tomorrow. Therefore measuring risk factors for NCDs is an attempt to predict the future distribution of NCDs in a population and is vital for promoting disease prevention and control programmes.9 Therefore it is of prime importance to conduct a nationwide survey on NCD risk factors taking into account of national representatives.

3Risk Factor Survey Bangladesh 2010
This survey is designed to have a nationally representative prevalence estimate of NCD risk factors of all non-institutionalized individuals of both sexes of 25 years and above following WHO STEPS. The main objectives of the study are -
1. To determine the distribution of the risk factors such as tobacco use, alcohol consumption, low fruit and vegetables intake, low physical activity, obesity, hypertension and diabetes mellitus.
2. To prepare a baseline data on NCD risk factors for planning, prevention and control activities of NCDs in Bangladesh.
2. OBJECTIVES OF THE STUDY

Risk Factor Survey Bangladesh 2010

5Risk Factor Survey Bangladesh 2010
The NCD risk factor survey was designed to establish baseline information on the major risk factors for the action plan implemented within the integrated NCD prevention and control programme in Bangladesh. The survey was conducted using steps 1 and 2 of the WHO STEPwise approach for NCD surveillance taking into account local needs and resources available.
Definition of the study population The target population for this survey includes all men and women aged 25 years or older. This target population includes all people who consider Bangladesh to be their primary place of residence. This definition included those individuals residing in Bangladesh even though they may not be considered a citizen of the country. The only people excluded from the study were those individuals:�������������Visiting Bangladesh ( e.g. tourists);�������������Who indicated their primary place of residence as a military base or group quarters (e.g. a dormitory);�������������Who were institutionalized-including people residing in hospitals, prisons, nursing homes and other such institutions.
In general, the target population of the study included individuals residing in all geographic areas of the country.
Sampling frame
For the study, an indirect cluster sampling frame was used to select the sample. The sampling frame used in the population census conducted by Bangladesh Bureau of Statistics (BBS) in 2001. Census 2001, latest census in the country, provided the measures of size of household. There were six divisions in Bangladesh which were the largest administrative units. Each division was divided into several districts (Zilla) and sub-districts (Upzilla). Within sub districts mauzas and mahallas were the smallest units with defined area in rural and urban areas respectively. It was decided that primary sampling units (PSUs) for rural stratum were mauzas, the smallest revenue rural geographic unit having jurisdiction list number for which census information was available with clear and updated boundaries. A mauza may be populated or depopulated. For the urban stratum, PSUs were based on mahalla which was the lowest urban geographic unit having identifiable boundaries. Households in this survey was defined according to BBS as "A dwelling in which persons either related or unrelated living together and taking food from the same kitchen".
According to the Census 2001, there were 64 407 PSUs (mauzas and mahallas) in Bangladesh which also included cantonment areas and depopulated areas such as areas with less than five households (Box 1). In the census data the PSUs were distributed in the rural areas, municipalities, other urban areas, Statistical Metropolitan Areas (SMA), cantonment areas and city corporation areas. Urban stratum was defined as the mahallas from municipality area, SMAs and city corporation areas. SMAs were the areas which had urban characteristics adjoining city corporation areas. Rural stratum includes mauzas and mahallas from rural area and other urban areas as other urban areas had characteristics similar to those of rural areas. Cantonment areas were not included in the sample frame and depopulated areas as defined by households (HH) less than five were deleted from the frame. Therefore final PSUs left for this survey was 58 755.
3. METHODS

6Risk Factor Survey Bangladesh 2010
*Equal number of male and female HH/individuals
At the first stage 400 PSUs (200 urban and 200 rural) were selected with probability proportionate to size, followed by a random selection of a secondary sampling units (SSUs) per selected PSU. SSUs were based on enumeration areas (EA) from the Bangladesh Agricultural census 2008. These selected EAs were updated with mapping and listing. Typically these EAs were consisted of 200 household units in mauzas and 300 household units in mahalla. The explicit satisfaction used at the first stage of selection based upon urban (mahalla) and rural (mauza) designation of BBS. Each list of urban and rural geopolitical units was implicitly satisfied by division and within division by per cent literacy of women in each mauza and mahalla. At the third stage 28 households per PSUs were selected systematically within the listed household form and selected SSU (process shown in Box 2).
Box 2: Stages of sample selection and their techniques
Stage
1
2
3
4
Selection Technique
Selection of mauzas and mahalla (400 PSU;200urban and 200 rural)
Selection of one SSUs from each mauza and mahalla(average HH of 200 in rural and 300 HH urban in eachselected SSUs) from updated data of agriculturecensus 2008.
Selection of 28 HH (half male and half femalehouseholds) from each SSU
Selection of eligible respondent fromhousehold roster
Simple random sampling based onAgriculture Census 2008.
Systematic random sampling
Simple random sampling (Kish method)
Probability proportional to size (PPS)based upon the total number ofhouseholds in the 2001 census.
Box 1: Selection of primary sampling units (PSUs)
Division Total mauzasor mahallas
Sampled mauzas ormahallas
Sampled households/individuals*
Barisal
Chittagong
Dhaka
Khulna
Rajshahi
Sylhet
Total
Rural
2 837
6 866
13 521
6 044
15 472
4 541
49 281
Urban
394
1 623
3 365
1 059
2 416
617
9 474
Total
3 231
8 489
16 886
7 103
17 888
5 158
58 755
Rural
15
35
54
26
58
12
200
Urban
5
39
98
21
31
6
200
Total
20
74
152
47
89
18
400
Rural
420
980
1 512
728
1 624
336
5 600
Urban
140
1 092
2 744
588
868
168
5 600
Total
560
2 072
4 256
1 316
2 492
504
11 200

7Risk Factor Survey Bangladesh 2010
Sampling design features
The sampling design of this survey is based on the Global Adult Tobacco Survey (GATS) 2009 of Bangladesh.15 That particular design was developed by the joint effort of National Institute of Preventive and Social Medicine (NIPSOM), Bangladesh Bureau of Statistics (BBS), and Centers for Disease Control (CDC), and World Health Organization (WHO). The basic design is based on the sample design for GATS developed by CDC. Subsequently through workshops and seminars with BBS and other national experts, the sample design for Bangladesh was adopted. The electronic data collection programme used in this survey was adopted from the one developed by CDC and Research Triangle Institute (RTI) International for GATS.16
The sample for this survey was a multistage, geographically clustered, probability-based sample of households. Sampling of eligible individuals was done from a sample of households with one individual randomly selected per household. Each selected household was randomly assigned as a men or women household. Households assigned to the men group was with only men aged 25 years or more living in that household listed in the roster during the screening phase of interview and subsequently a men was selected randomly from that list. Similar procedure was used for selection of women respondent from a women household. The questionnaire was administered by interviewers and no proxy interview was allowed.
The sampling unit in each stage of selection refers to the entities that were selected for the survey. In this survey, the ultimate sampling units were the household and one individual residing within the selected household. Since, in general, up-to-date listings of all households in a country do not exist (housing structures are built and torn down every day) and because it would be too costly to select a simple random sample of households directly within a country, the sample has been designed to be selected using a multi-stage, geographically clustered design.
Sample size calculation
Using the prevalence of any form of tobacco consumption 43.3% among the population with 95% confidence interval and 3% margin of error, the minimum sample size was 1 048 (rounded to 1 050) required for effective analysis per group such as sex (male/female) and residence (urban/rural). This study was proposing national estimate in four groups according to gender and urban-rural areas and assumed a design effect of 2 for adjusting between-subject homogeneity in cluster. In this regard, a minimum of (1 050 x 4 x 2) 8 400 respondents was needed; only one respondent per household was selected.
To estimate the final sample size of households following anticipated non-response rates at the household and individual level were considered. In this regard response rates reported in recently completed GATS15 was used for determining the inflation. Adjusting GATS household eligibility rate (90%), household response rate (97.7%), household screening rate (95%), individual eligibility rate (98%) and individual response rate (95.8% in both men and women) the targeted sample size was inflated to 11 200 . Based on number of PSU (400) an average of 28 (11 200/400) households (later randomized to produce equal male and female households based on design specifications) per SSU were targeted.

8Risk Factor Survey Bangladesh 2010
Field Interviewers (36)Used iPAQ
Internet
National Data Centre(WHO NCD Office)
Research Physicians (09)Sent data daily through
internet
Sr. Research Physicians (01)IT Personnel (02)
Checked quality of datadaily
Transferreddata by SD
Card
Figure 4: Flowchart of digital data collection and transferFigure 3: Sample map of a secondary sampling unit
Figure 2: Sample map of a primary sampling unitFigure 1: Study locations

9Risk Factor Survey Bangladesh 2010
Response rate
Targeted size of the sample was 11 200 from 400 PSUs, out of them 9 947 (90.6%) households could be covered from 398 PSUs. Remaining 2 PSU could not be visited due to political unrest in hill tract region. Finally 9 275 (93.3%) individual questionnaires were completed out 9 947 household questionnaires.
Box 3: Summary results for overall response proportions
Selected households
Completed (HC)Household completed, no one selected (HCN)Household incomplete (HI)Household no screening respondent (HNS)Household refusal (HR)Household unoccupied/ vacant/demolished houseHousehold address not a dwelling Household with person incapacitated (HPI)Household others (HO)Total households selected
Household response rate (%)*
Selected individuals
Completed (PC)Not eligible Ineligible, later determined Refusal (PR)Incapacitated (PI)Other (PO) Number of eligible individuals Individual response rate (%)**
4 974234
81335
13945
1885 600
4 62911
1619
308
4 974
93.100
0.30.46.2
100
4 646026
13306
4 973
93.400
0.10.36.2
100
9 27513
2232
614
9 947
82.800
0.20.37.2
100
88.84.20.10.20.62.50.10.13.4100
4 973309
872
6154
2315 600
88.85.50.10.10
1.10.10.14.1100
9 947543162037
20099
41911 200
88.84.80.10.20.31.80.10.13.7100
Residence
Total
Number per cent
Rural
Number per cent
Urban
Number per cent
*Household response rate (HRR) was calculated by: [HC]×100
[HC]+[HCN]+[HI]+[HNS]+[HR]+[HPI]+[HO]
**Individual response rate (IRR) was calculated by: [PC]×100
[PC]+[PR]+[PI]+[PO]
91.3% 90.0% 90.6%
93.1% 93.5% 93.3%

10Risk Factor Survey Bangladesh 2010
Data collection procedures
Data were collected by using structured questionnaire from WHO STEPS system by the trained field interviewers (see list of project staff in Appendix A). Updating of household listing, proper mapping of households for identification, repeated visits to selected households was taken to ensure a total response rate of 80% or more. Sample substitutions were not allowed as per sampling protocol. A maximum of one respondent per household was selected from households that completed the screening process. Nearly all members of the target population were sampled from their primary place of residence. Some individuals who were living at some location other than their "primary" home at the time the interviewer visited a household, for example college students who were staying in dormitories, families staying at their vacation homes, and labourers who were temporarily living at a farm during the harvest season. These individuals were sampled from the place they consider to be their primary place of residence. Consequently then,
● If a household was visited and the interviewer learned some people staying on that time at the dwelling unit considered the dwelling unit to be a vacation home and not their primary residence, then those individuals were not included in the roster for the household.
● If a household was visited and the interviewer learned some residents considered the dwelling unit to be their primary place of residence; however, they were not staying in the household, then those individuals were still included in the roster for the household.
Training of data collectors
The research physicians and field interviewers underwent a four day extensive training in Shaheed Suhrawardy Medical College Hospital (ShSMCH) on questionnaire, interview technique, physical measurement and blood pressure measurement,17 way of supervision and others. Training on physical measurement and blood pressure measurement was extensive to ensure minimal inter observer variation and to increase validity. All the investigators, personnel from health directorate, WHO and Director of ShSMCH and Principal of the medical college were involved in the training process. It is important to mention here that the interviewers were involved in the recently completed GATS.15 Therefore they already had acquaintance with PSUs and SSUs. Only the sampling of households is newly done to avoid or minimize repeat selections. Only the research physicians were new addition to the field team.
Study period
Data were collected from November 2009 to April 2010. Mapping listing, trained manpower and IT equipments including PDAs of GATS were used in this study.15
Survey instruments
Survey was done by using a standardized questionnaire and by doing physical examination. Questionnaire for this survey was developed by using steps I & II of WHO STEPS.14 All the core components of the questions along with some expanded questions were incorporated. (Appendix B); Questionnaire was translated into Bangla. Validation of the translated questionnaire was done. Physical examination was done according to standardized procedure by measuring height, weight, waist circumference, pulse and blood pressure. Relevant information were also obtained from medical records or other authentic documents as necessary from study population.

11Risk Factor Survey Bangladesh 2010
Fieldwork
Data were collected by nine field teams. Each team consisted of one research physician, two women and two men interviewers. Interviewers had at least a bachelor's degree. There was one IT personnel to assist the data collection. All the interviewers and research physicians were specially hired, taking into account their educational background, experience, computer skills and other relevant qualifications. There were total of 36 interviewers for data collection. Equal number of men (18) and women (18) interviewers were recruited to ensure the cultural sensitivity and quality of reporting by ensuring that women respondents were interviewed by women interviewers and men respondents by men interviewers.
Field interviewers were responsible for data collection on questionnaires using handheld devices (iPAQ). Research physicians were responsible for the overall operation of the field team. In addition research physicians conducted spot checks to verify information collected by interviewers and also to ensure the accuracy of household identification in the field as well as ensuring the measurement taken by the interviewers. Research physician also checked blood pressure of four respondents measured by four interviewers randomly and wherever necessary for validation of the data collection. Research physicians were also responsible for aggregation of the individual-level data to their laptops and forwarding the information through email to the National Data Center through secured system to a file transfer protocol (FTP) server on daily basis, IT personnel were responsible for providing technical support with respect to the concerns raised during fieldwork and trouble-shooting any issues with the handheld devices (see Figure 4).
Ascertainment of variables:
1. Tobacco: Information of tobacco was collected for both smoking and smokeless forms. Those who smoked or used smokeless tobacco in the past 30 days were considered as 'current' user. Daily users were asked about the initiation and duration of use by means of age and year(s) both. Frequency of use of products was asked. Question was asked if the respondents were exposed to second hand smoke in last seven days at their home or workplace (see Appendix C).
2. Alcohol: Alcohol consumption was measured by asking the respondents if they consumed ever, within past 12 months, and within past 30 days. They were also asked about the frequency of "standard" alcoholic drinking by number of occasion in past 12 months and in past 30 days. One standard alcoholic drink equals to 10 grams of ethanol and was measured by showing the pictorial showcards of different size drinking glasses (see Appendix D).
3. Diet: Respondents were asked for the number of days they ate fruit and vegetables in a typical week and on one of those days how many servings they ate these. One standard serving size equals to 80 grams. Servings were measured by showing the pictorial showcards or measuring cups (see Appendix C).
● For raw green leafy vegetables, 1 serving = one cup; ● For cooked or chopped vegetables, 1 serving = ½ cup; ● For fruit (apple, banana, orange), 1 serving = 1 medium size piece; ● For chopped, cooked and canned fruit, 1 serving = ½ cup; and ● For juice from fruit, 1 serving = ½ cup.

12Risk Factor Survey Bangladesh 2010
4. Physical activities: According to WHO STEPS, physical activity is defined as any bodily movement produced by skeletal muscles that require energy expenditure. Physical activity was categorized into vigorous and moderate and sedentary activity. A vigorous-intensity activity was defined as any activity that causes large increase in breathing or heart rate, if continued for at least 10 minutes (e.g. running, carrying or lifting heavy loads, digging or construction work). Moderate-intensity activity was defined as any activity that causes small increase in breathing or heart rate, if continued for at least 10 minutes (brisk walking or carrying light loads). Physical activity related to work, transportation and leisure time was assessed in terms of minutes that caused them breathless or feel palpitation. However continuous activity of at least ten minutes was taken in to account to add up to the total minutes of activity for the day. Then the total duration was converted into metabolic equivalents (MET minutes/week). METs are commonly used to express the intensity of physical activities. MET is the ratio of a person's working metabolic rate relative to their resting metabolic rate. One MET is defined as the energy cost of sitting quietly and is equivalent to a caloric consumption of 1 kcal/kg/hour. It is estimated that compared with sitting quietly, a person's caloric consumption is three to six times higher when being moderately active (3-6 METs) and more than six times higher when being vigorously active (>6 METs). However for our study we have taken four times for moderate and eight times for vigorous-intensity activity than sedentary position (sitting quietly).
Physical activities were measured in the survey by asking the respondents about their weekly and daily vigorous and moderate activities during work and leisure time, activities related with transport and time spent in sedentary position. Respondents were asked for number of days they do vigorous and moderate activities in a typical week. In such a day, how much time they spent (in minutes) in these type of activities. Similarly they were asked about time spent on transport related activities. However, for sedentary position, directly spent time (in minutes) in a day was asked. All type of physical activities transferred in minutes per day. MET-minute was calculated according to the STEPS protocol as follows: one minute in sedentary position (sitting quietly) equal to 1 MET-minute. One minute in moderate and transport related activities equal to 4 MET-minutes and one minutes in vigorous activities equal to 8 MET-minutes. All MET-minutes for different forms of physical activities added together to get total physical activities MET-minutes. Then total activities were categorized in high, moderate and low type. Those who spent 3000 or more MET-minutes per week, they were involved in high category. Those spent between 600-3000 MET-minutes, they were involved in moderate physical activities. Rest of the respondents, those did not meet even moderate activities; they fall in low activity category.
5. Anthropometric measurements: Height, weight and waist circumference were measured to calculate their body mass index (BMI), thereby obesity. Height was measured by a portable height/length measuring scale to the nearest millimeter. Participants were asked to remove their footwear and head gear, if any, and stand on the board facing the interviewer, feet together, heels against the board, knees straight. Looking straight ahead and not to tilt head up and making sure that eyes were at the same level as the ear. Height was read in centimeter to the nearest millimeter. Weight was measured by a portable bathroom weighing scale (Tanita HA-621). The scale was put on a firm, flat surface. The participants were asked to remove footwear and wear light casual clothing, and stand still, face forward and place arms on the side. Waist circumference was measured by plastic measuring tape, maintaining privacy of the participants; in a separate room or area screened

13Risk Factor Survey Bangladesh 2010
off from other people. This was measured directly on the skin at the end of a normal expiration with the arms relaxed at the sides, at the midpoint between the lower margin of the last palpable rib and the top of the hip bone. Waist circumference was measured to nearest millimeter.
6. Blood pressure: For collecting information about high blood pressure, both self reported data and blood pressure measurements were taken. Blood pressure was measured using ordinary aneroid sphygmomanometers on the right arm while the participants were in sitting position and hand in resting on handle of the chair or some objects, after rested for at least 5 minutes. Korotkoff phase V was taken as diastolic blood pressure. Systolic and diastolic measurements were taken by means of mmHg. A second reading was taken after 2 minutes resting interval. Pulse was also measured before each time blood pressure was measured by means of beats per minutes. Mean of two measurements of blood pressure and pulse were used in the statistical analysis. Stage I Hypertension was defined as blood pressure >_140/90 mmHg and/or history of antihypertensive medication or any advice for controling high blood glucose.
7. Diabetes: As this study did not include biochemical measurement, information of diabetes or raised blood glucose level was only collected by asking the respondents if any health personnel told them that s/he had diabetes or not. S/he was also asked if s/he measured blood glucose level earlier and/or received any medicine.
Quality control measurement
Senior research physician, survey investigators, IT personnel, staff from the Ministry of Health and Family Welfare (MoHFW), Directorate General of Health Services (DGHS) and World Health Organization, Bangladesh visited the field to monitor the data collection in order to ensure that standard quality control procedures were followed.
Both formative and global assessments by the quality control (QC) personnel were done. None of the nine QC observers reported any violation of SOP in measurement and data collection. The overall rating of interviewer's conduct and performance was found to be satisfactory based on indicators, behavior of interviewer, mode of measurement, maintenances of interview environment and mode of administration of the questionnaire.
Measurement data of four variables were collected by the QC personnel. Relevant field data were then extracted from the main data set in a different spreadsheet. In the current study blood pressure and anthropometric measurement were taken by trained field investigator and the quality control check was done by physician. Evidence suggests that effective training has the potential to minimize the difference in measurement by different rater irrespective of whether they are physician or not.17
Measurements by individual observer of the variables (SBP, DBP and height and waist circumference) and number of days with moderate or vigorous physical activity on an average week were found to be highly correlated in terms of Spearman rho coefficient (ranging from 0.933 to 0.998) across two independent measurements by two raters indicating highly significant agreement between two measurements.

14Risk Factor Survey Bangladesh 2010
Box 4: Agreement between measurement by field investigators and quality control physicians
Variables
Systolic BP (mmHg)
Diastolic BP (mmHg)
Height (cm)
Waist circumference (cm)
Smokeless tobacco user (%)
Moderate to vigorous physicalactivity (days/week)
132.9
83.1
157.1
77.8
52.2
3.9
131.3
80.6
157.1
77.1
52.2
3.9
0.977*
0.933*
0.998*
0.983*
0.826**
0.954*
0.000
0.000
0.000
0.000
0.000
0.000
Quality controlpersons (mean)
Fieldinterviewer
(mean)
Teststatistics
Pvalue
* Spearman r, ** Kappa
Number of days having moderate to vigorous physical activity in an average week was also in agreement (r=0.954). The inter-rater agreement for the raters of the smokeless tobacco was also highly significant (k=0.826).
Data processing and analysis
The aggregated data from the interviewers were sent to the FTP server by all research physicians on a daily basis using secured digital (SD) cards. IT personnel aggregated the data that they had received from all research physicians twice in a week and gave feedback to the field staffs if problem observed. Senior research physician cleaned the data and aggregated all the files to a single SDF file with the support of IT personnel (Figure 4). Then, using an aggregation module in GSS software and a statistical software SPSS version 16.0, the aggregated data was transposed to an analyzable raw data format that can be read by statistical software for further analysis and reporting.
Complex survey data analysis was performed to obtain population estimates and their 95% confidence intervals. The collected data used for assessment of prevalence of risk factor of NCD in population of Bangladesh. All analyses were done by using SPSS 16.0 version.
In this report an index of household economic status was created and used as background characteristics with information on household ownership of assets. It is an indicator of the level of wealth that is consistent with expenditure and income measures.18 The wealth index was constructed using principle component analysis of the household assets. Each asset was assigned a weight (factor score), and the resulting asset score were standardized in relation to normal distribution with mean zero and standard deviation one. Each household was then assigned a score for each asset. The scores were summed for each household. Individual were ranked according to the total score of the household in which they resided. The sample was then divided in to quartiles from one (lowest) to four (highest). A single asset index was developed for the whole sample; indices were not prepared for urban and rural population separately. Distributions of risk factors across the quartiles were then examined.

15Risk Factor Survey Bangladesh 2010
Ethical consideration
First of all, ethical clearance was obtained from the ethical committee of Bangladesh Medical Research Council (BMRC). The study was conducted maintaining all possible ethical considerations. Before data collection informed written consent of the study subject was obtained inconformity with the revised declaration of Helsinki. Detailed study related information was read out and explained in the local language from a printed handout. Informed consent form contained objectives and methods of the study, duration and frequency, clinical examination, risks and benefits of the study. Consent was taken in Bengali and interview was also conducted in Bengali. Finger impression was obtained from participants, who do not know how to sign. The respondents had a right to refuse to answer any question without providing the reason for their decisions and could withdraw from the study at any time. The information was dealt with highest confidentiality and used only for this study. Privacy of the respondents was maintained during data collection.

Risk Factor Survey Bangladesh 2010

17Risk Factor Survey Bangladesh 2010
4. RESULTS
Results are presented in a descriptive manner for age and sex groups separately and combined. Data of key variables on urban-rural residential strata are plotted in figures for visual impression. Generally speaking risk factors are highly prevalent in Bangladeshi adult population.
4.1 Socioeconomic background
Of the 9 275 respondents, 4 312 (46.5%) were men (Table 1.1). Mean age was 42.4 years with standard deviation of 13.5 years. Half of them were from urban areas as stipulated in the study design. According to survey data in general Bangladesh doesn't have a well educated population, median years of schooling being 3 years (5 years in men and 3 years in women). Interestingly and encouragingly similar proportion of men and women have completed primary education, however more men (19.3%) have completed secondary school than women (11.2%) (Table 1.2). Almost 90% were Muslims which is similar to census data. Because the subjects were aged 25 years or older, 91% were currently married. Occupational groups were classical of Bangladeshi population (Table 1.3).
The wealth index was constructed using principal component analysis. Asset information was collected with the NCD survey questionnaire. The questionnaire covered information on household ownership of a 20 items. A single asset index was generated. According to the wealth index the survey population is found to be equally distributed in all four wealth quartiles from lowest to highest. The distribution is nearly persistent in both sexes (Table 1.4). 4.2 Tobacco
4.2.1 Smoking habit
The smoking status of the participants were categorized into 'current smoker' those who have smoked tobacco in past 30 days and 'daily smoker' those who smoke any tobacco products every day. Categorization of smoking status in such groups actually facilitates the addictive characteristics of tobacco.
Overall proportion of current smoker was 26.2% (men 54.8% and women 1.3%) (Table 2.1). Prevalence figures are a little higher in rural residents (Figure 5). Most current smokers were actually daily smoker and the proportion of non-daily smoker in men was only 0.8% (Table 2.1). Age specific distribution of smoking prevalence was almost homogeneous across age groups in men but increasing trend was observed in women (Table 2.1).
Mean age of initiation of smoking in the adult population was 18.4 years. Women on an average started smoking late (23.5 years) than men (18.3 years). Around 34.6% respondents initiated smoking at or before the age of 15 years (Table 2.2). The average duration of smoking in the survey population was 26 years (Table 2.2).
Around seven out of ten (67.7%) current smokers used manufactured cigarette. In men the percentage was (69.0%) much higher than in women (12.5%). The use of manufactured cigarette in survey population was highest in the youngest age group (79.8%) and lowest in the eldest age group (50%) (Table 2.3). This trend reflects a gradual shift of bidi smoking towards cigarette smoking. About four

18Risk Factor Survey Bangladesh 2010
out of ten (43.4%) smoked biri (men 42.7%, women 69.9%). Some people smoked both cigarette and biri. Daily cigarette smokers on an average smoked 9.5 cigarette sticks per day and daily biri smokers on an average smoked 12.8 sticks of biri per day (Table 2.4).
In the survey population 7.5% were former daily smoker (Table 2.5). The proportion of former daily smoker was much higher in men (15.4%) than in women (0.7%). A generalized increase in the proportion of former daily smoker was evident across age. Proportion of former daily smoker was highest in eldest age group (30.4%).
4.2.2 Smokeless tobacco
Smokeless tobacco traditionally has not been emphasized for its harmful health effect in Bangladesh. It is considered to have equal potential to impair health and can lead to scores of chronic diseases. Overall consumption of smokeless tobacco in survey population was 31.7% (Table 2.6). More women (33.6%) were found to use smokeless tobacco than men (29.4%). Most smokeless tobacco users took it daily and only 1.6% was reported to be occasional users. Older people used smokeless tobacco more than young people. This trend was more apparent in women.
Around 3.3% were former user of smokeless tobacco and proportion of quitter were more in men (5.1%) than in women (1.8%) (Table 2.6). Smokeless tobacco use in general was slightly more in rural area (Figure 5). Among the smokeless tobacco users 66.3% used jarda, 33.5% used sada pata and 17.4% used gul. Alarmingly gul is found to be popular in younger people (Table 2.7). All these products were taken five to seven times a day (Table 2.8).
4.2.3 Tobacco use in any form
Seventy percent men used any form of tobacco and in women the proportion was around 34.4%. Over all (sexes combined) 51% consume either smoking or smokeless tobacco. Around 7.4% of the survey population used both the forms of tobacco, such practice was particularly high in men (14.1%)
Perc
enta
ge o
f sub
ject
s100
90
80
70
60
50
40
30
20
10
0Urban Rural Urban Rural Urban Rural
Smoking tobacco Smokeless tobacco Either form
Men Women Both sexes
51.3 56
.8
29.9 34
.8
64.8
75.3
0.9
1.5
31.6 35
.4
30.2
38.6
24.9
27.2 30
.8 35.1
46.5 55
.5
Figure 5: Prevalence of current tobacco use, smoking or smokeless forms, in rural and urban areas
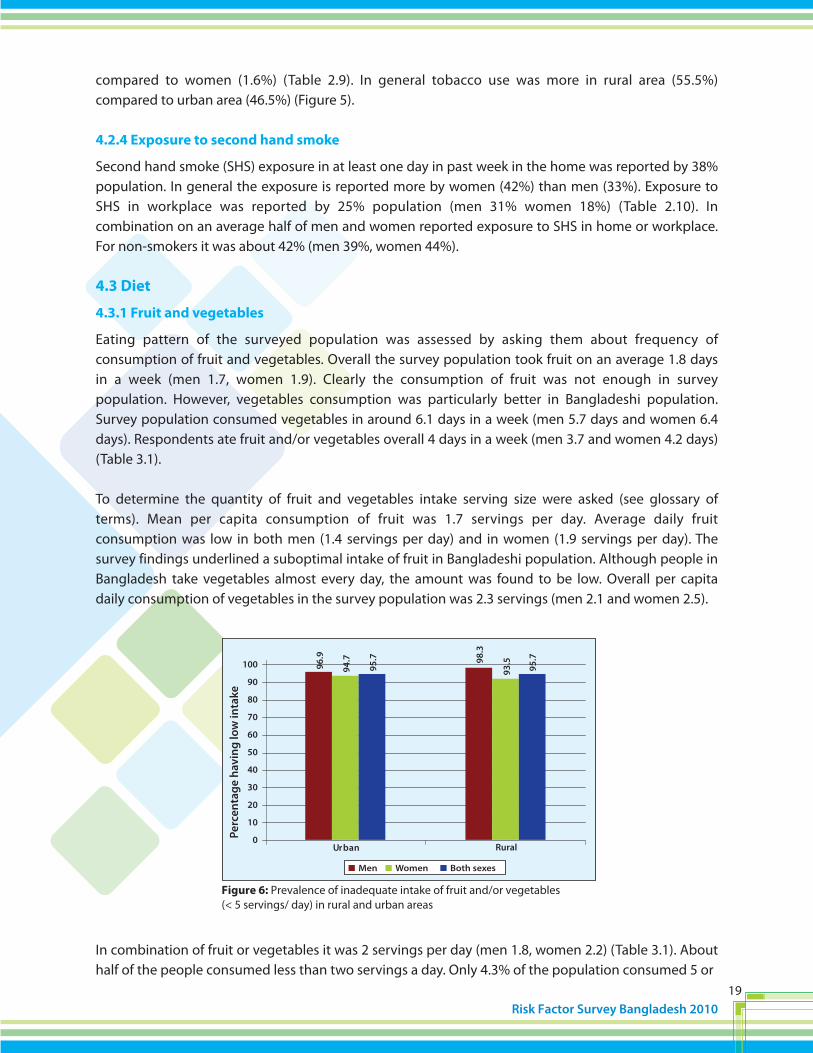
19Risk Factor Survey Bangladesh 2010
compared to women (1.6%) (Table 2.9). In general tobacco use was more in rural area (55.5%) compared to urban area (46.5%) (Figure 5).
4.2.4 Exposure to second hand smoke
Second hand smoke (SHS) exposure in at least one day in past week in the home was reported by 38% population. In general the exposure is reported more by women (42%) than men (33%). Exposure to SHS in workplace was reported by 25% population (men 31% women 18%) (Table 2.10). In combination on an average half of men and women reported exposure to SHS in home or workplace. For non-smokers it was about 42% (men 39%, women 44%).
4.3 Diet
4.3.1 Fruit and vegetables
Eating pattern of the surveyed population was assessed by asking them about frequency of consumption of fruit and vegetables. Overall the survey population took fruit on an average 1.8 days in a week (men 1.7, women 1.9). Clearly the consumption of fruit was not enough in survey population. However, vegetables consumption was particularly better in Bangladeshi population. Survey population consumed vegetables in around 6.1 days in a week (men 5.7 days and women 6.4 days). Respondents ate fruit and/or vegetables overall 4 days in a week (men 3.7 and women 4.2 days) (Table 3.1).
To determine the quantity of fruit and vegetables intake serving size were asked (see glossary of terms). Mean per capita consumption of fruit was 1.7 servings per day. Average daily fruit consumption was low in both men (1.4 servings per day) and in women (1.9 servings per day). The survey findings underlined a suboptimal intake of fruit in Bangladeshi population. Although people in Bangladesh take vegetables almost every day, the amount was found to be low. Overall per capita daily consumption of vegetables in the survey population was 2.3 servings (men 2.1 and women 2.5).
In combination of fruit or vegetables it was 2 servings per day (men 1.8, women 2.2) (Table 3.1). About half of the people consumed less than two servings a day. Only 4.3% of the population consumed 5 or
Perc
enta
ge h
avin
g lo
w in
take
100
90
80
70
60
50
40
30
20
10
0Urban Rural
Men Women Both sexes
96.9
94.7
95.7 98
.3
93.5
95.7
Figure 6: Prevalence of inadequate intake of fruit and/or vegetables(< 5 servings/ day) in rural and urban areas

20Risk Factor Survey Bangladesh 2010
more servings either of fruit or vegetables on an average day. The pattern of consumption was similar in both sexes (Table 3.4). There was no striking difference between rural and urban people in consumption of fruit or vegetables (Figure 6).
4.3.2 Type of oil or fat used for meal preparation:
In regard to the use of the type of oil most often used for food preparation at home, around 86% reported to use soybean oil and 12.6% mustard oil and 1% used palm oil for preparation of meal. As meal is prepared in home together for men and women, no sex difference should persist.
4.4 Physical activity
Activity time (that cause large increase in breathing or heart rate with absence of any definite heart pathology) was measured to assess the amount of individuals' physical activity level. On an average a person's total activity time was 177 minutes and the amount of time was almost 3 times in men (268 minutes) than women (98 minutes). The survey population spent 116 minutes for work related activity, around 45 minutes for travel and 16 minutes for leisure time activity. In general younger age groups were found to spend relatively more time for work related physical activity and the trend is persistent across sexes (Table 4.1).
Overall 45.7% of the survey populations were not engaged in work related physical activity (women 54.5%, men 35.5%), around 44.5% reported no transport related activity (men 21.5%, women 64.6%) and around 81.9% did not attend in any leisure time physical activity (Table 4.2).
The major bulk of the physical activity was usually contributed by work, transport and recreation related activity together. In our sample more than half of the total activity (56.2%) was contributed by work related activity, around 31% were contributed by transport related activity and around 13% were contributed by the leisure time physical activity (Table 4.3). Around 61.8% of the survey participant had never been engaged in vigorous physical activity and 32.7% not even in moderate physical activity (Table 4.4).
Men on an average spent four times more time in vigorous intensity activities (101 minutes) than women (25 minutes) and nearly double time in moderate intensity activity (167 minutes vs. 77
Perc
enta
ge o
f low
phy
sica
l act
ivit
y
100
90
80
70
60
50
40
30
20
10
0Urban Rural
Men Women Both sexes
12.2
43.6
28.9
8.8
39.1
25.1
Figure 7: Prevalence of low physical activity (< 600 MET-minutes)in rural and urban areas

21Risk Factor Survey Bangladesh 2010
minutes). Both men and women spent similar amount of time although the amount of time spent for sedentary activity sharply increases with age in either sex (Table 4.5).
Physical activity data of three domains were combined to categorize individual's total physical activity status as is conventionally done. Analysis suggests overall 27% of the survey population fell into low physical activity category, 20.2% fell in to moderate physical activity category and 52.8% fell in to high physical activity category. Men were found to have higher level of physical activity than women (Table 4.6).
In general low physical activity was prevalent in 27% of the population (men 10.5%, women 41.3%). Men were more active than women both in rural and urban areas (Figure 7).
4.5 Alcohol consumption
Prevalence of alcohol consumption was assessed by status of usage and the consumption behavior. The consumption behavior of binge drinking was specially assessed due to its associated cardiovascular risk. In the survey population only 0.8% (men 1.5% and women 0.1%) were current drinker (drank in past 30 days). Inversely 95.6% never took alcohol (Table 5.1). Among the consumer of alcohol (who drank in past 12 months), around 4.2% were daily drinker (Table 5.2).
Current drinkers on an average had 5.8 occasions with at least one drink in past 30 days and consumed on an average 3.6 standard drinks on a drinking occasion (Table 5.3). Two third (66.7%) of the current alcohol consumers were binge drinkers (>_5 standard drinks/drinking day for men, >_4 standard drinks/drinking day for women) and almost all of them were men.
On an average current drinkers went binge 4.2 occasions in past 30 days (Table 5.5). In general alcohol consumption was low in rural area; in male prevalence in rural area was almost half (Figure 8).
Perc
enta
ge o
f cur
rent
dri
nker
504540353025201510
50
Urban Rural
2.5
0 1.2
1.2
0.2
0.7
Men Women Both sexes
Figure 8: Percentage of people who drank at least one sip of alcoholic drink in past 30 days

22Risk Factor Survey Bangladesh 2010
Perc
enta
ge o
f BM
I >_25
504540353025201510
50
Urban Rural
18.8
30.6
25.1
7.2
12.8
10.2
Men Women Both sexes
Figure 9: Percentage of people having BMI 25 (kg/m2) or above inurban and rural areas
4.6 Obesity
4.6.1 Body mass index (BMI)
BMI reflects generalized obesity of individual, but it doesn't differentiate between solid masses like bones and muscles with fat. In general men (mean BMI 21) were lighter than women (mean BMI 22). About one fourth of the populations were underweight (BMI <18.5), 14.3% were overweight (BMI 25-29.9) and 3.6% were obese (BMI >_30). Proportion of both overweight (men 11.1%, women 17%) and obesity (men 2.2%, women 4.9%) in women exceeded those in men. Prevalence of overweight and obesity together constituted 17.6% of the population, the prevalence was much higher in women (21.6%) than in men (13%). Generalized obesity was apparently high in the age group of 35-54 years in either sex. Generalized overweight (BMI >_25) is more prevalent in urban area than the rural area (Figure 9).
4.6.2 Waist circumference
The measurement of waist circumference was done to assess the central obesity in survey population. Average waist circumference in men was 78 cm and in women 76 cm. Overall more than one in five among survey population was having increased waist circumference (men >_94 cm, women >_80 cm) and 8.9% had substantially increased (men >_102 cm, women >_88 cm) waist circumference. Proportion of women with both increased as well as substantially increased waist circumference outnumbered the proportions in men (Table 6.3 & 6.4). Proportion of survey population with increased waist circumference was more in urban area than in rural area (Figure 10).
Perc
enta
ge o
f inc
reas
ed w
aist
circ
umfe
renc
e 504540353025201510
50
Urban Rural
12.0
45.2
29.6
3.9
22.5
13.9
Men Women Both sexes
Figure 10: Percentage of respondents with increased waist circumference(men >_94 cm, women >_80 cm) in urban and rural areas

23Risk Factor Survey Bangladesh 2010
4.7 Blood pressure (BP)
Around one third (32.9%) never measured their BP and the proportion was much higher in men (44.5%) than in women (22.8%) (Table 7.1). Prevalence of self reported hypertension estimated in the survey population was 12.5%. It was greater in women and increased with age. More respondents in urban area reported hypertension than in rural area.
In the hypertensive population (self reported) overall 52.3% had been taking antihypertensive drug. In general use of the drug was more prevalent in older age groups. On an average more men (57.9%) were taking antihypertensive medication than the women (48.5%). The observation was consistent across age groups (Table 7.2). Overall two third of the hypertensive patients were advised to reduce salt intake by their physician, the observation was identical in both sexes. Around 41.8% of the respondents were advised to lose some weight, 36.5% were told to cease tobacco use and more than half were asked to raise physical activity level through exercise (Table 7.3). Among the known hypertensive patients 4.1% sought advice or remedy from traditional healers and 1.4% receiving herbal or traditional remedy. Men were found to seek both treatment from traditional healer and use herbal or traditional remedy more than women (Table 7.4).
In this survey BP was measured by trained observers. Mean systolic blood pressure was 121 mmHg in men, 119 mmHg in women and 120 mmHg in both sexes. Mean diastolic blood pressure was 78 mmHg for men, 75 mmHg for women and for both sexes 76 mmHg. A steady increasing trend in both systolic and diastolic BP were evident with age (Table 7.5).
Among survey population 14.8% were having stage I hypertension (BP >_140/90 mmHg) on measurement during survey. When subjects with medication were included the prevalence rose to 17.9%. Prevalence of hypertension tended to increase with age irrespective of whether subjects were on medication or not and this trend was persistent in both sexes. Upon measurement 5.5% of the survey populations were having stage II hypertension (BP>_160/100 mmHg). Prevalence of stage II hypertension also increased with age (Table 7.6).
Among the people previously reported as hypertensive, 30.3% were found to be normotensive on measurement and 17.6% were normotensive on medication, 30.7% were hypertensive with medication
Perc
enta
ge o
f hyp
erte
nsio
n
504540353025201510
50
Urban Rural
21.1
18.8
19.9
15.9
15.9
15.9
Men Women Both sexes
Figure 11: Prevalence of hypertension (blood pressure >_140/90 mmHg or drugtreatment)

24Risk Factor Survey Bangladesh 2010
Perc
enta
ge o
f sel
f rep
orte
d di
abet
es
504540353025201510
50
Urban Rural
6.0
5.6
5.8
2.5
1.7 2.1
Men Women Both sexes
Figure 12: Prevalence of self reported (documented) diabetes in rural and urban areas
and 21.4% were hypertensive and not taking any medication. Uncontrolled BP was found more in women than men and the proportion seems to increase with age (Table 7.7). Prevalence of hypertension in general is more in urban area than in rural area (Figure 11).
4.8 Diabetes mellitus
As this survey did not conduct STEP 3 or biochemical measurement, diabetes status among survey population were assessed on documented evidence of receiving anti-diabetic medication. Around eighty three percent of the survey population never measured their blood glucose. Prevalence of self reported or documented diabetes was found to be 3.9% (men 4.3% and women 3.6%) (Table 8.1). In both sexes prevalence of diabetes is more in urban area than the rural areas (Figure 12).
Among diabetic patients, 20.8% reportedly taking insulin and 61.1% were taking oral anti- hypoglycemic drug (Table 8.2). Sixty five per cent was taking either form of drug. Among the participants with a previous diagnosis of diabetes, along with drug treatment, most (90.1%) received advice on diet, two third were advised to lose some weight, 47.4% were asked to quit smoking, and 84.7% were advised to start or increase the amount of physical exercise (Table 8.3). Of all participants with known diabetes around 7.7% sought advice or remedy from traditional healers for diabetes, and 4.1% were currently taking herbal or traditional remedy (Table 8.4). 4.9 Socioeconomic gradients and clustering of risk factors
The participants were grouped into four quartiles according to household assets based on principal component analysis. Current alcohol drinking remained same across the socioeconomic quartiles possibly because of alcohol use by a very small proportion of people. Diabetes, hypertension, low physical activity and obesity increased with socioeconomic achievements. However the opposite was the picture for tobacco use, fruit and vegetable intake. As a result higher proportion of wealthier people was seen to have three or more risk factors concurrently. The features is almost similar in both rural and urban areas.
Around 98.7 percent of the survey population has at least one risk factor of NCD, around 77.4% had two or more risk factors and around 28.3% had 3 or more risk factors. More women (31.5%) were found

25Risk Factor Survey Bangladesh 2010
80.0
70.0
60.0
50.0
40.0
30.0
20.0
10.0
0.0
Perc
enta
ge o
f pop
ulat
ion
Q1 Q2 Q3 Q4
Figure 13: Risk factor clustering across wealth quartiles
Wealth quartile
66.5 68.4
12.913.7
19.8
29.7
2 RF
68.072.3
>_
3 RF>_
Perc
enta
ge o
f peo
ple
with
3 ri
sk fa
ctor
s
100
90
80
70
60
50
40
30
20
10
0Urban Rural
Men Women Both sexes
28.8 36
.2
32.8
20.4 26
.9
23.9
Figure 14: Distribution of respondents with three or more risk factors in rural and urban areas
to have three or more risk factors than men (24.7%) (Table 9). Figure 13 depicted a clear increasing trend of proportion of respondents with >_3 risk factors with increasing wealth quartiles. However this trend was subtle in case of >_2 risk factors.
The phenomenon of clusturing was more in urban area (32.8%) compared to rural area (23.9%). This was true across sexes (Figure 14).

Risk Factor Survey Bangladesh 2010

27Risk Factor Survey Bangladesh 2010
Box 6: Comparison of GATS and NCD risk factor survey findings on current tobacco use forthose aged 25 years or above*
Smoker 26.2 (25.3, 27.1) 27.6 (26.1, 29.1)
Smokeless tobacco user 31.7 (30.7, 32.6) 35.7 (33.7, 37.8)
Tobacco user (any form) 51.0 (49.5, 52.5) 54.3 (52.3, 56.4)
NCD RF 2010 GATS 2009
* results are percentage (confidence interval)
The current study is the first national survey on NCD risk factors in Bangladesh and it is one of the pioneering national survey of NCD risk factors done by using digital technology in the world. The data generated from this survey have reported a high prevalence of risk factors that poses a significant threat to Bangladeshi population. In specific terms a high prevalence of tobacco use, inadequate fruit and vegetables consumption and raised blood pressure were observed. The gender and socioeconomic differentials in several factors have also been identified. Further the survey result highlights the reversal of social gradient (higher occurrence of some risk factors in the low socioeconomic group) for a few NCD risk factors.
Tobacco
Smoking is clearly a major threat for health; given that more than a quarter of the population is current smoker. A recent study conducted by WHO Bangladesh found that 41% of the eight killer diseases (heart attack, stroke, oral cancer, larynx cancer, lung cancer, Buerger's disease, tuberculosis and chronic obstructive pulmonary disease) are attributable to tobacco usage.19
Current survey findings are almost in line with recently completed GATS15 when the analysis was done for the same age group i.e. 25 years or above (Box 6). GATS was conducted in Bangladeshi people aged >_15 years in 2009. However the current study is among people aged >_25 years in 2010. Current findings are closer to the findings reported by WHO 2004 study19 also. Therefore our data suggest that tobacco consumption has reached a plateau. A declining trend is expected soon in Bangladesh.
5. DISCUSSION
Box 5: Number of people (in millions) with selected risk factors among the adult populationaged 25 year or above*
Risk factors Men Women Both sexes Current smoking 18.5 0.4 18.9Smokeless tobacco use 9.9 11.3 21.2Tobacco use (any form) 23.6 11.5 35.1Low fruit/vegetable intakea 32.9 31.6 64.5Low physical activityb 3.5 13.9 17.4Obesityc 4.4 7.3 11.6Abdominal obesityd 2.7 11.3 14.0Hypertensione 6.2 5.8 12.0Diabetes mellitus (documented) 1.4 1.2 2.7* Based on projected 2008 population a<5 servings/day, b< 600 MET-minutes per week, c BMI >_25 kg/m2, d Waist girth: men >_94 cm, women >_80 cm,eBP >_140/90 mmHg or medication

28Risk Factor Survey Bangladesh 2010
Smoking in medical profession is notable in Bangladesh. Compared to 55% smoking in male adults in general population 33% male doctors of a tertiary level hospital smoke.20 Absence of role model behaviour in medical profession is a matter of concern. However, this should be interpreted with caution because the doctor's study was reported in 1998. Unlike many other nations, it is notable in Bangladesh that the prevalence of smoking is very low among women (1.3%). In Bangladeshi society smoking among female is regarded impolite. Most women who smoked were mostly of low socioeconomic status or of very high society, which is actually very rare. The trend was persistent across rural and urban residents. Occasional smoking was very low, almost all the smokers actually smoked on daily basis. In men, age specific distribution of smoking prevalence was almost homogeneous. However increasing trend was evident in women with age. However this was a little low in participants above 65 years of age. This might be due to survival effect.
On an average smoking was generally being initiated in the late teenage years and women started smoking late compared to men. The alarming thing is that more than one third respondents initiated smoking at or before the age of 15 years. The major implication of such finding is that a large number of children can access tobacco during school age. These findings reflect the lack of regulation of cigarette or biri sales to minors. Strategies to lower the rates of smoking initiation during adolescence and efforts to promote smoking cessation are needed to lower the risk of disease among people who have adopted this behaviour.
The use of manufactured cigarette in survey population was around 80% in the youngest age and around half in the eldest age group. Type of tobacco has significantly been different across socioeconomic classes, manufactured and filtered cigarette were used by people of higher wealth quartile and biri was popularly used by low socioeconomic group and in rural area. Hukka is almost extinct but still popular to some rural elderly. Type of tobacco has significant implication on quality of exposure. For example biri tobacco is very crude and of low quality without any filter. Thromboangitis obliterans (Buerger's disease) has strongly been related to biri smoking in Bangladeshi population. 21
Smokeless tobacco has not been emphasized for its harmful health effects. It is considered to have equal potential to impair health and can lead to scores of chronic diseases. Consumption of smokeless tobacco our population was 31.7%. Women were found to use more smokeless tobacco than men. Most smokeless tobacco users took it daily. Age stratified distribution showed a higher consumption among older age groups, however the trend was more apparent in women. Current smokeless tobacco use was more prevalent in rural areas compared to urban areas, particularly women used this form of tobacco more than men. Use of smokeless tobacco as a component of betel quid has a very high cultural acceptance in Bangladesh. Therefore culturally appropriate public awareness will be required. Considering serious health consequences of smokeless tobacco, relevant law should address it also.
Exposure to second hand smoke (SHS) is still very high in Bangladeshi people both at home and at workplaces. This is very unfortunate that more than 40% of the nonsmokers are exposed to second hand smoke even after five years of enactment of tobacco control law. Strict enforcement of smoke free provisions is essential. A very high level of public support in this regard should be used.22

29Risk Factor Survey Bangladesh 2010
Fruit and vegetables
Diet and nutrition play a significant role in the prevention of many NCDs such as cardiovascular disease, diabetes, and many forms of cancer. It is suggested that diets high in saturated fat and salt, and low in fruit and vegetables are likely to be associated with the increased risk of heart disease, stroke, obesity and some cancers.23 Strategies aimed at improving dietary habits therefore can play a key part in reducing early deaths from these diseases. 'Five-a-day' campaign is an important initiative adopted in England, the principal objective of the initiative is to increase consumption levels of a variety of different fruit and vegetables to at least five portions (400g) per day.24 This is in accordance with dietary recommendations around the world, including those set out by the WHO.25
Overall calorie intake at the population level in Bangladesh is not high but in certain affluent group excess energy intake is becoming evident. According to Bangladesh Bureau of Statistics26 per capita energy intake in Bangladesh was 2 554 Kcal in 2000-2001, which is fairly good if the large gaps in the distribution could be minimized. Main problem is low intake fruit and vegetables by Bangladeshi population. While there is a steady increase in the per capita intake of rice, meat and fish from 1998 to 2001, intake of vegetables and fruit remained stable.25 Bangladesh adults take fruit on average less than two days in a week. The survey findings underline a suboptimal intake of fruit by Bangladeshi population.
Number of days in a week with vegetables consumption is particularly high in Bangladeshi population, however the per capita daily consumption is found to be low (2.3 serving). Daily vegetables consumption should not be considered as a sign of health awareness among people of low income country like Bangladesh, rather it is poverty that incapacitates them to afford meat or fish and as a result they have to resort to low cost vegetables. Most people take vegetables as an adjunct to rice or other staple food. This explains why they don't take adequate amount of fruit or vegetables. If >_5 servings of either fruit or vegetables consumption is considered adequate only 4.3% fell in to the category.
Dietary habits are often rooted in local and regional traditions. National strategies therefore need to be culturally appropriate and able to challenge cultural influence and to respond change over time. Promoting healthy diet requires a multi-sectoral approach. There is a need for close co-operation among health, agriculture and food industry sectors. Strategies for adoption of healthy diet include: marketing, advertising, sponsorship and promoting food products consistent with a healthy diet, fiscal policies that can influence price through taxation, subsidies or direct pricing encouraging healthy eating, development of dietary guidelines, education, communication for public awareness etc. Bangladesh should graduate in near future from "sweet" culture to "fruit" culture.
Physical activity
Low physical activity is considered as an important predictor of many chronic diseases, most notably heart disease, stroke, obesity, type 2 diabetes, some types of cancers, and osteoporosis27. Beyond its role in the development of obesity, physical inactivity and associated poor cardio-respiratory fitness pose direct health risks28. The global estimate for prevalence of physical inactivity among adults is 17%.29 Our observed rate is 27%.

30Risk Factor Survey Bangladesh 2010
Current statistics on physical activity doesn't seem to be too alarming; however there are subgroups that are particularly at risk. Low physical activity is particularly more in women. In general women were found to be less active, particularly in urban area. In rural area while doing daily activity they have to do a lot of physical activity. However in the urban area mechanized work appliances limit most household activity. According to behavioral risk factor survey in 2006, around 57% of the rural and only 10 per cent of urban adults 'usually' had moderate physical activity.30 However it was not a nationwide survey.
Leisure time physical activity is not popular in our population. Anecdotal evidence suggests that in Bangladesh, people in the rural area undergo fairly moderate physical activity because of their traditional lifestyle whereas in urban area it is very low. Unplanned urbanization is the major reason behind this difference. Collaboration with local governments (city corporations and municipalities) is necessary to promote physical activity.
Increasing physical activity in the population will require development of strategies that are suitable for various population segments and the establishment of partnerships between various sectors like, health, education, roads, planning, and transport etc. in order to ensure that these are effectively delivered. Removal of environmental barriers to physical activity will play an important enabling role which will complement strategies such as community-wide education and the development of recreation programmes. In a Muslim predominant community like Bangladesh, maintenance of physical activity for women is difficult. To some extent they remain restricted within the boundary of their households. In this regard an innovative strategy for uplifting physical activity of women, not conflicting with social and religious norms is required.
Alcohol
Consumption of alcohol is low in Bangladesh, due to sociocultural inhibition and the fact is reflected in the survey. The prevalence of current alcohol drinking is less than one per cent and only five per cent people ever tried alcohol in their life time. This is true across the wealth quartiles. Although the prevalence of alcohol consumption is low, the pattern of consumption among the current users suggests that 4% drink daily. Surprisingly two third of the current alcohol consumers are binge drinkers and almost all of them are men. On average current drinkers went binge more than four occasions in past one month.
A notable finding was that the average amount of alcohol consumed on each occasion by drinkers was very high. This pattern of binge drinking, which creates severe risks of injury and chronic health problems, needs to be addressed in alcohol misuse interventions. There are reports of illegal and informal production of alcohol. 'Tari' is a popular form of illegally brewed alcoholic drink in Bangladesh. Sometimes group alcohol poisoning are reported due to drinking of illegally produced alcoholic drink. Therefore significant measures on illegal production are needed. The prevalence of drinking among transport workers, such habit risks others' life too. The report of casualty by intoxicated drivers is not rare. Preventive measures are required to control accident related deaths and disabilities.
Obesity
Obesity is believed by a section of the society to be a positive attribute, an indicator of a person's good health and prosperity. Anecdotal evidence suggests that, in Bangladesh obesity is still not widely considered to be a health risk factor and in fact the converse, that losing weight is an indicator of

31Risk Factor Survey Bangladesh 2010
illness, is more likely to be believed. This indicates that raising public awareness about the harmful consequences of obesity is necessary in order to influence societal norms concerning body size. Prevention and management of obesity are major challenges, especially in developing countries, where obesity often coexists with underweight.31
a. Body mass index (BMI) (measure of generalized obesity)
According to survey data around one fourth of the population was underweight, 14% were overweight and four percent were obese based on BMI criteria. Proportion of both overweight and obese in women exceeds those in men, which may be a reflection of lower level of physical activity in women. No specific trend of obesity is apparent in the age distribution in either sex, however in both sexes obesity is found to be less prevalent in the older age groups. An important policy implication is that, the anthropologic background of inactivity of women in the Bangladesh population is worth investigating for shaping women's NCD risk reduction. Besides, use of the same cutoff for different ethnic group/populations warrants investigation. The cutoff used in the survey will need validation in future studies.
b. Waist circumference (measure of central obesity)
Waist circumference provides an indication about the central obesity and has been suggested to be a risk factor more specific to cardiovascular disease as visceral fat is considered as a predictor of morbidity and mortality. This alone provides similar information as waist-hip ratio. Like general obesity the central obesity was also more in women. Overall one in five had increased waist circumference. Recently waist circumference have been implicated with individual's propensity to develop NCDs. Higher prevalence of central and general adiposity in women indicates that women may be at a relatively increased risk of cardiovascular disease. This survey, therefore, identified large number of people with physical risk factors for NCDs that require immediate interventions and longer term monitoring as a priority measure in Bangladesh. It is noteworthy that central obesity is a special characteristic of south Asian population in general.32
Blood pressure (BP)
Three in ten never measured their BP. In general women measured BP more than men. This might reflect a fact that women have the opportunity to measure BP during antenatal checkup. In urban area both men and women measured BP more than people in rural area. This is due to better availability of and accessibility to health care delivery system.
The overall prevalence of self reported hypertension is 12.5%. In the current survey prevalence of self reported hypertension is almost similar to previous studies. A population-based study done in the beginning of the decade found similar prevalence of hypertension (13%),33 which was supportive to another population study in Bangladesh (12%).10 Recent studies done in rural community also suggested similar percentage.12, 13
Hypertension is a disease of its own as well as a risk factor for other major disease such as stroke, coronary heart disease, heart failure and renal insufficiency. It is very common in Bangladeshi people but its detection and treatment status is far from adequate. We should have intensive programme for salt reduction because its consumption is very high in the country. Estimated per capita salt intake

32Risk Factor Survey Bangladesh 2010
based on salt production was 15.3 gm per day in 2001,34 which is three times than a person requires for physiological functions of the body. This might be an important reason of high prevalence of hypertension in Bangladesh. A previous behavioural risk factor survey of NCDs in Bangladesh observed higher prevalence of table salt intake in both rural and urban areas. In rural area it was 92% and in urban area it was 46.3%.30
Control of hypertension is essential for ensuring cardiac, cerebral and renal health. In this regard rational intake of prescribed antihypertensive drug, where indicated, is mandatory. In our population only half of the hypertensive subjects used antihypertensive drugs. To ensure wider coverage of treatment primary health care approach needs to be used to ensure adequate detection and treatment.
Around 14.8% of the survey population was diagnosed to have hypertension (>_140/90 mmHg) on measurement. Inclusion of those on medication increased the prevalence to 17.9%. Prevalence of hypertension increased with age irrespective of whether patient is on medication or not and the trend is persistent across sexes. A population based study12 in rural Bangladesh conducted to see the prevalence of ischaemic heart disease observed similar prevalence (18.6%) of hypertension. Upon measurement 5.5% were found to have stage II hypertension (>_160/100 mmHg).35 This warrants an aggressive detection and treatment at primary care level to save huge people from risk of ill consequences of hypertension.
Diabetes
People here usually do not measure blood glucose level. Eighty three per cent of the survey population never measured their blood glucose. Considering the prevalence of diabetes among those who measured blood glucose was 3.9%. In men the percentage is slightly high. Population data in Bangladesh indicate an increasing trend in diabetes prevalence especially in urban areas. A higher prevalence of diabetes mellitus in the urban population was also observed compared with rural subjects by another population-based study.36 As mentioned earlier, current study did not use blood glucose measurement. Addition of blood glucose data definitely would yield a higher prevalence of diabetes. There are lines of evidences that the prevalence of diabetes is rising in Bangladesh.37 Possible explanation for this is the prevalence of recent sudden change in lifestyle. Behavioral risk factor survey reported 5% prevalence of diabetes in rural area.30 In urban area the prevalence is just double (10%).38 This could reflect the effect of unplanned urbanization that lacks in environment for physical activity, consumption of junk food and exposure to stressful life in cities. Therefore diabetes and cardiovascular disease prevention initiative in general should be developed in partnership with local governments for adopting healthy lifestyle friendly settings or environment for both men and women.
Clustering of risk factor
Risk factors of NCDs appear in clusters and a person may have several risk factors for single NCD or a single risk factor may actually result in several diseases. Presence of one risk factor in turn increases the likelihood of having other risk factors, showing a cluster phenomenon. The proportion of subjects with 3 or more risk factors increases along with higher economic quartiles. One study done in five Asian countries (Bangladesh, India, Indonesia, Thailand and Vietnam) reported high percentage of people with >_3 NCD risk factors in rural population.39 An Indian study reported similar

33Risk Factor Survey Bangladesh 2010
gradient in urban Indian population. Similar clustering of risk factors leading to metabolic syndrome have been reported from Bangladeshi clinic-based41 and community-based samples42
as well. This clustering issue in South Asian population needs extensive study for proper planning of NCD prevention at first hand.

Risk Factor Survey Bangladesh 2010

35Risk Factor Survey Bangladesh 2010
6. POLICY RECOMMENDATIONS
This first ever nationally representative survey in Bangladesh provides essential information on key indicators of NCD risk factors and creates an opportunity for policy makers, programme managers, and researchers to adopt interventions. Inadequate intake of fruit and vegetables, use of tobacco, low level of physical activity (specially in women), binge drinking among current drinkers, obesity (especially abdominal), high blood pressure and diabetes mellitus are fairly common in adults. Almost all adults (98.7%) have at least one risk factor and substantial proportion of people have two or more risk factors. Based on these findings, the specific recommendations are:
1. Population based approach using primary health care system for NCD prevention is warranted. Mass awareness through campaigns and school curricula is necessary.
2. Tobacco consumption is high even after five years of having a Tobacco Control Act. Adequate enforcement of the Act is necessary. Necessary amendment of the Act is also required to close all the loop holes in the tobacco control programme.
3. Strategies to promote accessibility and availability of fruit and vegetables round the year for all people should be formulated and implemented.
4. Appropriate measures should be undertaken, with emphasis on leisure time physical activity, to promote empowering environment for physical activity.
5. A large proportion of people do not measure blood pressure or blood glucose and, hence large proportion of hypertension and diabetes remain undetected. Primary health care system should be reoriented towards early detection and treatment of these common ailments.
6. Because there is hardly any nationally representative data on NCD risk factors, national surveys on health should consider inclusion of NCD risk factors.

Risk Factor Survey Bangladesh 2010

37Risk Factor Survey Bangladesh 2010
The support, suggestions comments, and guidance, as applicable, provided by the following persons are duly appreciated and acknowledged.
A. Quality control team: Professor Shah Monir Hossain Professor M A Faiz Dr Umar Khyyam Professor Dr Khondhaker Md. Shefyetullah Professor ABM Muksudul Alam Mr Raisul Alam Mondal Dr Md Humayun Kabir Dr AKM Jafar Ullah Dr M Mostafa Zaman B. Sampling frame for the survey: Bangladesh Bureau of Statistics C. Survey office in Dhaka: Professor ABM Muksudul Alam Principal, Shaheed Suhrawardy Medical College Dr A. K. M. Muzibur Rahman Director, Shaheed Suhrawardy Medical College Hospital
D. Training of the field worker: Dr Sohel Reza Choudhury, NHF
E. Accommodation for the filed team: Civil Surgeons and UHFPOs of 62 districts and NIPORT
F. Technical reviewers of the report: Professor Hajera Mahtab, BIRDEM Professor Mahmudur Rahman, IEDCR Professor Louis Wilhelmus Niessen, ICDDR,B Dr Jerzy Leowski, WHO, SEARO Dr Samira Asma, CDC, USA Dr Krishna Mohan Palipudi, CDC, USA Professor Dr Abul Kalam Azad, MIS, DGHS Dr Sohel Reza Choudhury, NHF Mr Md Ahsanul Alam, NIPORT Dr AKM Jafar Ullah, DGHS Dr Leanne Margaret Riley, WHO, HQs
7. ACKNOWLEDGEMENTS

Risk Factor Survey Bangladesh 2010

39Risk Factor Survey Bangladesh 2010
8. REFERENCES
1. World Health Organization. Global status report on noncommunicable diseases 2010. WHO
Geneva 2011.
2. World Health Organization. WHO NCD Surveillance Strategy. Available at
<http://www.who.int/ncd_surveillance/strategy/en/print.html>. accessed on 22 Oct 2010
3. Reddy KS, Shah B, Varghese C, Ramadoss A. Responding to the threat of chronic diseases in India.
Lancet 2005;366:1744-49.
4. World Health Organization. World Health Report 2002: Reducing risks, promoting healthy life.
WHO Geneva 2003.
5. World Health Organization. Preventing chronic diseases: a vital investment, WHO Geneva 2005.
6. World Health Organization. Mongolian STEPS Survey on the prevalence of noncommunicable
disease risk factors 2006. WHO Geneva 2007.
7. Karar ZA, Alam N, Streatfield PK, Epidemiological transition in rural Bangladesh, 1986-2006. Global
Health Action, North America 2009; 2. Available at.
http://www.globalhealthaction.net/index.php/gha/article/view/1904 accessed on 29 Jan 2011
8. World Health Organization. Health profile of Bangladesh. WHO Bangladesh 2003. Available at
http://www.whoban.org/country_ health_ profile.html accessed on 22 Oct 2010.
9. Magnus P, Beaglehole R. The real contribution of the major risk factors to the coronary epidemics:
time to end the "only-50%'' myth. Arch Intern Med 2001;161:257-60.
10. Zaman MM, Rouf MA. Prevalence of hypertension in a Bangladeshi adult population. J Hum
Hypertens 1999;13:547-49.
11. Islam N, Islam MN, Khanam K. Smoking habit among Bangladesh secretariat staff. Bangladesh Med
Res Counc Bull 1990;16:62-69.
12. Zaman MM, Ahmed J, Chowdhury SR, Numan SM, Parvin K, Islam MS. Prevalence of ischemic heart
disease in a rural population of Bangladesh. Indian Heart Journal 2007;59:239-41.
13. Karim MN, Hossain M, Faruqee MH, Chaklader MA, Yasmin N. Prevalence of non communicable
diseases in rural Bangladesh. State University of Bangladesh Journal of Public Health 2010;2:32-42.
14. Bonita R, de Courten M, Dwyer T, Jamrozik K, Winkelmann R. Surveillance of risk factors for
noncommunicable diseases: The WHO STEPwise approach summary. WHO Geneva 2001.
15. World Health Organization. Global adult tobacco survey, Bangladesh report 2009. WHO Dhaka 2009.
16. Global Tobacco Surveillance System, Global adult tobacco survey. Programmer's guide to general
survey system 2009.
17. Zaman MM, Yoshike N. Vedio-Instruction for blood pressure measurement. Regional Health Forum
2003;7:63-65.
18. Rutstein, SO, Johnson K. The DHS Wealth Index. DHS comparative reports No. 6. Calverton,
Maryland: ORC Macro 2004.

40Risk Factor Survey Bangladesh 2010
19. Zaman MM, Nargis N, Perucic AM, Rahman K (editors). Impact of tobacco-related illnesses in
Bangladesh. SEARO, WHO, New Delhi 2007.
20. Azad KAK, Chowdhury MAJ, Saha AK, Patwary MI & Rafiquddin AKM. Doctors as smoker.
Bangladesh J Medicine 1998;9:44-46.
21. Rahman M, Chowdhury AS, Fukui T, Hira K, Shimbo T. Association of thromboangiitis obliterans
with cigarette and bidi smoking in Bangladesh: a case-control study. International Journal of
Epidemiology, 2000;29:266-70.
22. Palipudi KM, Sinha DN, Choudhury S, Zaman MM, Andes L, Asma S. Exposure to tobacco smoke
among adults in Bangladesh. Indian Journal of Public Health, 2011;55:210-19.
23. Department of Health, UK. Nutritional aspects of cardiovascular disease. HMSO. London 1994.
24. National health archive UK. The school fruit and vegetable scheme, 5-A-DAY programme.
available at: http://www.dh.gov.uk/PolicyAndGuidance/HealthSocialCareTopics/FiveADay/fs/en
Accessed on 22 Oct 2010.
25. World Health Organization. Diet, nutrition and the prevention of chronic diseases: Report of a
joint WHO/FAO expert consultation. WHO technical report series 916. Geneva 2003.
26. Bangladesh Bureau of Statistics. Ministry of Planning. Government of Bangladesh. Health and
demographic survey. Dhaka 2002.
27. Chakravarthy MV, Joyner MJ, Booth FW. An obligation for primary care physicians to prescribe
physical activity to sedentary patients to reduce the risk of chronic health conditions. Mayo clinic
proceedings, 2002;77:165-73.
28. Stevens J, Evenson KR, Thomas O, Cai J, Thomas R. Associations of fitness and fatness with
mortality in Russian and American men in the lipids research clinics study. International Journal of
Obesity Related Metabolic Disorder 2004;28:1463-70.
29. Mathers CD, Loncar D. Projection of global mortality and burden of disease from 2002 to 2030.
Plos medicine, 2006;3:e442.
30. Rahman M, Rahman M, Flora MS, Akhtar SFU, Hossain S. Behavioral risk factors of non
communicable diseases in Bangladesh report 2006.
31. World Health Organization. Obesity: preventing and managing the global epidemic. Report on a
WHO consultation. WHO technical report series 894. WHO Geneva 2000.
32. Yajnik CS, Yudkin JS. The Y-Y paradox. Lancet. 2004;363:163.
33. Zaman MM, Yoshiike N, Rouf MA, Syeed MH, Khan RH, Haque S, Mahtab H, Tanaka H.
Cardiovascular risk factors: distribution and prevalence in a rural population of Bangladesh.
Journal of Cardiovascular Risk 2001;8:103-08.
34. Nishtar S. Preventing coronary heart disease in south Asia. SAARC cardiac society guideline and
recommendations. SAARC cardiac society heartfile. Islamabad 2002.

41Risk Factor Survey Bangladesh 2010
35. Chobanian AV, Barkis GL, Black HR , Cushman WC, Green LA, Izzo JL. Seventh report of the joint
national committee on prevention detection evaluation and treatment of high blood pressure.
Hypertension 2003;42:1206-52.
36. Hussain A, Rahim MA, Azad Khan AK, Ali SM, Vaaler S. Type 2 diabetes in rural and urban
population: diverse prevalence and associated risk factors in Bangladesh. Diabetic Medicine
2005;22:931-36.
37. Rahim MA, Akhtar H, Khan AKA, Sayeed MA, Ali SMK, Vaaler S. Rising prevalence of type 2 diabetes
in rural Bangladesh: A population based study. Diabetes research and clinical practice
2007;77:300-05.
38. Sayeed MA, Banu A, Khanam PA, Mahtab H and Azad Khan AK. Prevalence of hypertension in
Bangladesh: effect of socioeconomic risk on difference between rural and urban community.
Bangladesh Medical Research Council Bulletin 2002;28:07-18.
39. Ahmed SM, Hadi A, Razzaque Abdur, Ashraf A, Juvekar S, Ng N, Uraiwan K, Soonthornthada K,
Minh HV, Bich TH. Clustering of chronic non-communicable disease risk factors among selected
Asian populations: levels and determinants. Global Health Action 2009;2:68-75.
40. Reddy KS, Prabhakaran D, Jeemon P, Thankappan KR, Joshi P, Chaturvedi V, Ramakrishnan L,
Ahmed F. Educational status and cardiovascular risk profile in Indians. Proceedings of National
Academy of Science of the USA 2007;104:16263-68.
41. Siddique MA, Sultan MAU, Haque S, Zaman MM, Ahmed CM, Rahim MA and Salman M. Clustering
of metabolic factors among the patients with essential hypertension. Bangladesh Medical
Research Council Bulletin 2008;34:71-75.
42. Zaman MM, Ahmed J, Choudhury SR, Numan SM, Islam MS, Parvin K. Prevalence of metabolic
syndrome in rural Bangladesh women. Diabetes care 2006;29:1456-57.

Risk Factor Survey Bangladesh 2010

43Risk Factor Survey Bangladesh 2010
Appendix A
List of Project Staff
Senior Research Physician Dr Mahfuzur Rahman Bhuiyan
Research Physicians Dr Sheikh Mohammad Mahbubus Sobhan Dr Abdullah Al Mamun Dr Eusha Ahmed Fidalillah Ansary Dr Abdullah Al Imran Dr Md. Ahad Bakas Dr Aftab Rassel Dr Tapas Kanti Majumder Dr Debashish Roy Dr Ziaul Islam Chowdhury
IT Specialists A. B. M. Kamruzzaman Md. Hasanuzzaman Khan
Male Interviewers
Md. Mahfuzur Rahman Md. Mizanur RahmanIqbal HossainShariful IslamMd. Zahidul HaqueAftabuddinMd. Kamal HossainMd. Atiqur RahmanOmar Faruq SarkarMd. Khorshed Alam BhuiyanMd. Abdur Rab SardarMd. Obaidul HaqueMd. Alauddin ChoudhurySubas Broto ChakmaAtaur Rahman MasudANM Khairul BasharShah Md. Mamun HossainAKM Rajibul Amin
Female Interviewers
Tahmina FerdowsMahmuda BegumAfroza Khatun SheulyMarjina KhanamMonjura ParveenMahbuba KhatunArfia NazMukta RoyDilara IslamNazmoon NaharShamim AraShilpy AkterShamima SultanaFarhana KhanNasima AkterAsma AkterKafura AlamSyeda Afroza Sultana
9. APPENDICES

Risk Factor Survey Bangladesh 2010

45Risk Factor Survey Bangladesh 2010
National Survey on NCD Risk FactorsBangladesh
Bangladesh Society of Medicine,Directorate General of Health Services and World Health Organization, Bangladesh
Appendix B1Participant Identification Number
Location and Date Response
dd mm year
1
2
3
4
PSU ID
PSU name
Interviewer ID
Date of completion of the questionnaire
Survey Information
Code
I1
I2
I3
I4
hrs mins
Consent, Interview Language and Name
Additional Information that may be helpful
Response
5
6
7
8
10
Whether Consent has been obtained?
Interview Language
Time of interview (24 hour clock)
Name of Interviewee
Telephone/Mobile number
Yes 1No 2 if NO, END
Code
I5
I6
I7
I8
I10
Participant Id Number
English 1Bangla 2
Record and file identification information (I5 to I10) separately from the completed questionnaire.
:

46Risk Factor Survey Bangladesh 2010
Participant Identification Number
Household Information
Time of Household interview (24 hour clock)
___ ___ : ___ ___ Hour Minute
[For Interviewer: The household screening respondent must be 18 years of age or older and you must be confident that this person can provide accurate information about all members of the household]
[if needed, verify the age of the household screening respondent to make sure He/she is 18 years of age or older]
Introduction: National Survey on Non Communicable Diseases Risk Factors is an important survey being conducted by the Ministry of Health and Family Welfare throughout Bangladesh and your household has been selected to participate. All houses selected were chosen from a scientific sample and it is very important to the success of this project that each participates in the survey. All information gathered will be kept strictly confidential. I have a few questions to find out who in your household is eligible to participate.
HH1. First, I'd like to ask you a few questions about your household. In total, how many persons live in this household, anyone who considers this household their primary place of residence last night?
Persons
HH2. How many of these household members are 25 years of age or older?
Persons
HH3. How many (male/female) household members are 25 years of age or older?
Persons
HH4. I now would like to collect information about the (males/females) that live in this household who are 15 years of age or older. Let's start listing the (males/females) from oldest to youngest.
[Ask the following questions and record answers in table below]
a. What is this person's full name? b. What is this person's age? [If respondent doesn't know, probe for an estimate] c. Record gender

47Risk Factor Survey Bangladesh 2010
Participant Identification Number
a. Name
1
2
3
4
5
6
7
8
9
10
__________________
__________________
__________________
__________________
__________________
__________________
__________________
__________________
__________________
__________________
________
________
________
________
________
________
________
________
________
________
b. Age c. Gender
Male Female
1 2
HH5. Household roster number of the selected eligible (male/female)
HH6. Fill in questionnaire ID number
Questionnaire ID number: ___ ___ ___ ___ ___ - ___ __
1 2
1 2
1 2
1 2
1 2
1 2
1 2
1 2
1 2

48Risk Factor Survey Bangladesh 2010
Participant Identification Number
CORE: Demographic Information
ResponseQuestion
11
12
13
14
15
16
17
C5
C6
C7
Sex
What is your date of birth?(Don't Know 77 77 7777)
How old are you?
In total, how many years have you spent atschool or in full-time study (excluding lessthan Class 1 and pre-school)?
Male 1Female 2
No formal schooling 1Less than primary school 2
Primary school completed 3Secondary school completed 4
Higher Secondary school completed 5College/University completed 6
Post graduate degree completed 7Refused 88
Islam 1Hinduism 2
Christianity 3Buddhism 4
Others 5Refused 88
Never married 1Currently married 2
Separated 3Divorced 4
Widowed 5Refused 88
What is the highest level of educationyou have completed?
What is your religion?
What is your marital status?
Years
Years
dd mm year if known, Go to C4
Step 1 Demographic Information
Code
C1
C2
C3
C4
EXPANDED: Demographic Information

49Risk Factor Survey Bangladesh 2010
Participant Identification Number
18
Which of the following best describesyour main work status over the past12 months?
C8
Government employee 1Non-government employee 2
Business (small) 3Business (large) 4
Farming (Land owner & farmer) 5Agricultural worker 6
Industrial worker 7Daily laborer 8
Other self-employed 9Student 10
Homemaker/ Housework 11Retired 12
Unemployed, able to work 13Unemployed, unable to work 14
Other (specify) 15Refused 88
EXPANDED: Demographic Information
Note: Question 19 of STEPs questionnaire is dropped.

ResponseQuestion Code
50Risk Factor Survey Bangladesh 2010
Participant Identification Number
20
C10a
C10b
C10c
C10d
C10e
C10f
C10g
C10h
C10i
C10j
C10k
EXPANDED: Demographic Information, Continued
a. [Electricity?]
b. [Flush toilet?]
c. [Land phone?]
d. [Mobile?]
e. [Television?]
f. [Radio?]
g. [Refrigerator?]
h. [Private car?]
i. [Motor cycle?]
j. [Washing machine?]
k. [Bicycle?]
yes 1 no 2
Don't know 77 Refused 88
yes 1 no 2
Don't know 77 Refused 88
yes 1 no 2
Don't know 77 Refused 88
yes 1 no 2
Don't know 77 Refused 88
yes 1 no 2
Don't know 77 Refused 88
yes 1 no 2
Don't know 77 Refused 88
yes 1 no 2
Don't know 77 Refused 88
yes 1 no 2
Don't know 77 Refused 88
yes 1 no 2
Don't know 77 Refused 88
yes 1 no 2
Don't know 77 Refused 88
yes 1 no 2
Don't know 77 Refused 88
Please tell me whether this household or any person who lives in the household has the following items:

51Risk Factor Survey Bangladesh 2010
Participant Identification Number
C10l
C10m
C10n
C10o
C10p
C10q
C11a
C11b
C11c
l. [Sewing machine?]
m.[Almirah/ wardrobe?]
n. [Table?]
o. [Bed or cot?]
p. [Chair or Bench?]
q. [Watch or Clock?]
yes 1 no 2
Don't know 77 Refused 88
yes 1 no 2
Don't know 77 Refused 88
yes 1 no 2
Don't know 77 Refused 88
yes 1 no 2
Don't know 77 Refused 88
yes 1 no 2
Don't know 77 Refused 88
yes 1 no 2
Don't know 77 Refused 88
a. What is the main material of the roof of main house? (record observation)
Katcha (bamboo/straw)............ 1Tin..................................................... 2Cement/concrete/tiles.............. 3Other................................................ 4Don't know/can't tell ................ 77
b. What is the main material of the wall of main house? (record observation)
Jute stick/bamboo/clay............ 1Wood............................................... 2Brick/Cement................................ 3Tin…................................................ 4Other................................................ 5Don't know.................................... 77
c. What is the main material of the floor of main house? (record observation)
Soil/bamboo/clay....................... 1wood............................................... 2Cement/concrete........................ 3Other............................................... 4Don't know…………................ 77
21
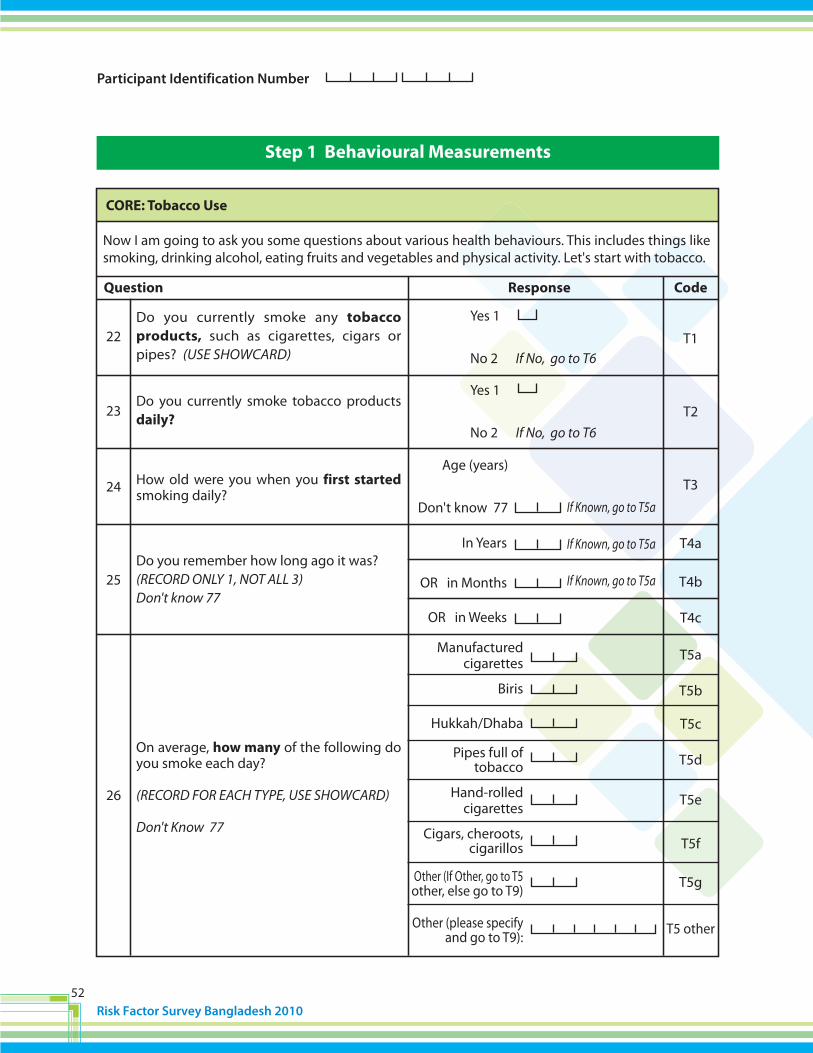
52Risk Factor Survey Bangladesh 2010
Participant Identification Number
CORE: Tobacco Use
ResponseQuestion
22
23
24
25
26
Yes 1
No 2 If No, go to T6
Yes 1
No 2 If No, go to T6
Step 1 Behavioural Measurements
Code
T1
T2
T3
T4a
T4b
T4c
T5a
T5b
T5c
T5d
T5e
T5f
T5g
T5 other
Now I am going to ask you some questions about various health behaviours. This includes things like smoking, drinking alcohol, eating fruits and vegetables and physical activity. Let's start with tobacco.
Do you currently smoke any tobacco products, such as cigarettes, cigars or pipes? (USE SHOWCARD)
Do you currently smoke tobacco products daily?
How old were you when you first started smoking daily?
Do you remember how long ago it was?(RECORD ONLY 1, NOT ALL 3)Don't know 77
On average, how many of the following do you smoke each day?
(RECORD FOR EACH TYPE, USE SHOWCARD)
Don't Know 77
In Years
OR in Months
OR in Weeks
Age (years)
Don't know 77 If Known, go to T5a
If Known, go to T5a
If Known, go to T5a
Manufacturedcigarettes
Biris
Hukkah/Dhaba
Pipes full oftobacco
Hand-rolledcigarettes
Cigars, cheroots,cigarillos
Other (If Other, go to T5other, else go to T9)
Other (please specifyand go to T9):

53Risk Factor Survey Bangladesh 2010
Participant Identification Number
If Known, go to T9
If Known, go to T9
EXPANDED: Tobacco UseResponseQuestion
27
28
29
30
31
32
33
34
35
T6
T7
T8a
T8b
T8c
T9
T10
T11a
T11b
T11c
T11d
T11e
T11other
T12
T13
T14
Yes 1
No 2 If No, go to T9
Yes 1
No 2 If No, go to T12
Yes 1
No 2 If No, go to T12
Yes 1
No 2
Number of days
Don't know 77
Number of days
Don't know or don't work in a closed area 77
Code
In the past, did you ever smoke daily?
How old were you when you stopped smoking daily?
How long ago did you stop smoking daily?(RECORD ONLY 1, NOT ALL 3)Don't Know 77
Do you currently use any smokeless tobacco such as zarda, sadapata, gul, snuff?(USE SHOWCARD)
Do you currently use smokeless tobacco products such as zarda, sadapata, gul, snuff daily?
On average, how many times a day do you use ….
(RECORD FOR EACH TYPE, USE SHOWCARD)
Don't Know 77
In the past, did you ever use smokeless tobacco such as zarda, sadapata, gul, snuff daily?
During the past 7 days, on how many days did someone in your home smoke when you were present?
During the past 7 days, on how many days did someone smoke in closed areas in your workplace (in the building, in a work area or a specific office) when you were present?
Age (years)
Don't know 77 If Known, go to T9
Years ago
OR Months ago
OR Weeks ago
Snuff, by mouth
Snuff, by nose
Chewing tobacco
Betel, quid
Other
Other (specify)
If Other, go toT11 other,else go to T13
Go to T13

54Risk Factor Survey Bangladesh 2010
Participant Identification Number
CORE: Alcohol Consumption
ResponseQuestion
36
37
38
39
40
41
42
43
Yes 1
No 2 If No, go to D1
Yes 1
No 2 If No, go to D1
Code
A1a
A1b
A2
A3
A4
A5
A6
A7
The next questions ask about the consumption of alcohol.
Have you ever consumed an alcoholic drink such as local wine, beer, wine, spirit?
Have you consumed an alcoholic drink within the past 12 months?
During the past 12 months, how frequently have you had at least one alcoholic drink?
(READ RESPONSES, USE SHOWCARD)
Have you consumed an alcoholic drink within the past 30 days?
During the past 30 days, on how many occasions did you have at least one alcoholic drink?
During the past 30 days, when you drank alcohol, on average, how many standard alcoholic drinks did you have during one drinking occasion?(USE SHOWCARD)
During the past 30 days, what was the largest number of standard alcoholic drinks you had on a single occasion, counting all types of alcoholic drinks together?
During the past 30 days, how many times did you havefor men: five or more for women: four or morestandard alcoholic drinks in a single drinking occasion?
Daily 15-6 days per week 21-4 days per week 3
1-3 days per month 4Less than once a month 5
Yes 1
Number
Don't know 77
Number
Don't know 77
Largest number
Don't Know 77
Number of times
Don't Know 77
No 2 If No, go to D1
Note: Question 44 & 45 of STEPs questionnaire are dropped.

55Risk Factor Survey Bangladesh 2010
Participant Identification Number
CORE: Diet
ResponseQuestion
46
47
48
49
Code
D1
D2
D3
D4
In a typical week, on how many days do you eat fruit?(USE SHOWCARD)
How many servings of fruit do you eat on one of those days? (USE SHOWCARD)
In a typical week, on how many days do you eat vegetables? (USE SHOWCARD)
How many servings of vegetables do you eat on one of those days? (USE SHOWCARD)
The next questions ask about the fruits and vegetables that you usually eat. I have a nutrition card here that shows you some examples of local fruits and vegetables. Each picture represents the size of a serving. As you answer these questions please think of a typical week in the last year.
Number of daysDon't Know 77
Number of servingsDon't Know 77
Number of daysDon't Know 77
Number of servings Don't know 77
If Zero days,go to D3
If Zero days,go to D5
EXPANDED: Diet
50
51
D5
D5other
D6
What type of oil or fat is most often used for meal preparation in your household?
(USE SHOWCARD)(SELECT ONLY ONE)
On average, how many meals per week do you eat that were not prepared at home? By meal, I mean breakfast, lunch and dinner.
Vegetable oil 1Lard 2
Butter or ghee 3Palm oil 4
other 5None in particular 6
None used 7Sunflower oil 8
Mustard oil 9Dalda 10
Don't know 77
Other (Specify)
NumberDon't know 77
If Other, go to D5 other

Travel to and from places
Now I would like to ask you about the usual way you travel to and from places. For example to workfor shopping, to market, to place of worship.
r example to work,
56Risk Factor Survey Bangladesh 2010
Participant Identification Number
CORE: Physical Activity
ResponseQuestionWork
52
53
54
55
56
57
58
59
60
Yes 1
No 2
Number of days
Code
P1
P2
P3(a-b)
P4
P5
P6(a-b)
Does your work involve vigorous-intensity activity that causes large increases in breathing or heart rate like carrying or lifting heavy loads, digging or construction work, harvesting for at least 10 minutes continuously?
In a typical week, on how many days do you do vigorous-intensity activities as part of your work?
How much time do you spend doing vigorous-intensity activities at work on a typical day?
Does your work involve moderate-intensity activity that causes small increases in breathing or heart rate such as brisk walking or carrying light loads for at least 10 minutes continuously? (USE SHOWCARD)
In a typical week, on how many days do you do moderate-intensity activities as part of your work?
How much time do you spend doing moderate-intensity activities at work on a typical day?
Do you walk or use a bicycle (pedal cycle) for at least 10 minutes continuously to get to and from places?
In a typical week, on how many days do you walk or bicycle for at least 10 minutes continuously to get to and from places?
How much time do you spend walking or bicycling for travel on a typical day?
Next I am going to ask you about the time you spend doing different types of physical activity in a typical week. Please answer these questions even if you do not consider yourself to be a physically active person. Think first about the time you spend doing work. Think of work as the things that you have to do such as paid or unpaid work, study/training, household chores, harvesting food/crops, fishing or hunting for food, seeking employment. In answering the following questions 'vigorous-intensity activities' are activities that require hard physical effort and cause large increases in breathing or heart rate, 'moderate-intensity activities' are activities that require moderate physical effort and cause small increases in breathing or heart rate.
Now I would like to ask you about the time you spend doing moderate-intensity activity
Number of days
Number of days
If No, go to P4
Yes 1
No 2 If No, go to P7
Yes 1
No 2 If No, go to P10
Hours : minuteshrs mins
:
Hours : minuteshrs mins
:
Hours : minuteshrs mins
:
P7
P8
P9(a-b)

Sedentary behaviour
EXPANDED: Physical Activity
57Risk Factor Survey Bangladesh 2010
Participant Identification Number
Recreational activities
Now I would like to ask you about sports, fitness and recreational activities (leisure)
Now I would like to ask you about the time you spend doing moderate-intensity activity outside your work
The following question is about sitting or reclining at work, at home, getting to and from places, or with friends including time spent sitting at a desk, sitting with friends, traveling in car, bus, train, reading, playing cards or watching television, but do not include time spent sleeping.
CORE: Physical Activity, Continued
ResponseQuestion
61
62
63
64
65
66
67
Code
Do you do any vigorous-intensity sports, fitness or recreational (leisure) activities that cause large increases in breathing or heart rate like running, playing ha-du-du or football for at least 10 minutes continuously? (USE SHOWCARD)
In a typical week, on how many days do you do vigorous-intensity sports, fitness or recreational (leisure) activities?
How much time do you spend doing vigorous-intensity sports, fitness or recreational activities on a typical day?
Do you do any moderate-intensity sports, fitness or recreational (leisure) activities that cause a small increase in breathing or heart rate such as brisk walking, cycling, swimming, playing volleyball and dariabandha for at least 10 minutes continuously? (USE SHOWCARD)
In a typical week, on how many days do you do moderate-intensity sports, fitness or recreational (leisure) activities?
How much time do you spend doing moderate-intensity sports, fitness or recreational (leisure) activities on a typical day?
How much time do you usually spend sitting or reclining on a typical day?
Number of days
Number of days
Yes 1
No 2 If No, go to P13
Yes 1
No 2 If No, go to P16
Hours : minuteshrs mins
:
Hours : minuteshrs mins
:
Hours : minuteshrs mins
:
P10
P11
P12(a-b)
P13
P14
P15(a-b)
P16(a-b)

58Risk Factor Survey Bangladesh 2010
Participant Identification Number
CORE: History of Raised Blood Pressure
ResponseQuestion
68
69
70
71
72
73
H1
H2a
H2b
H3a
H3b
H3c
H3d
H3e
H4
H5
Code
Have you ever had your blood pressure measured by a doctor or other health worker?
Have you ever been told by a doctor or other health worker that you have raised blood pressure or hypertension?
Have you been told in the past 12 months?
Yes 1
No 2 If No, go to H6
Yes 1
No 2 If No, go to H6
Yes 1
No 2
Yes 1
No 2
Yes 1
No 2Yes 1
No 2Yes 1
No 2Yes 1
No 2
Yes 1
No 2
Yes 1
No 2
EXPANDED: History of Raised Blood Pressure
Are you currently receiving any of the following treatments/advice for high blood pressure prescribed by a doctor or other health worker?
Drugs (medication) that you have taken in the past two weeks
Advice to reduce salt intake
Advice or treatment to lose weight
Advice or treatment to stop smoking
Advice to start or do more exercise
Have you ever seen a healer other than allopathic such as homeopathic, ayurvedic, herbalist, traditional healers and others for raised blood pressure or hypertension?
Are you currently taking any herbal or traditional remedy for your raised blood pressure?

59Risk Factor Survey Bangladesh 2010
Participant Identification Number
CORE: History of Diabetes
ResponseQuestion
74
75
76
77
78
79
H6
H7a
H7b
H8a
H8b
H8c
H8d
H8e
H8f
H9
H10
Code
Have you ever had your blood sugar measured by a doctor or other health worker?
Have you ever been told by a doctor or other health worker that you have raised blood sugar or diabetes?
Have you been told in the past 12 months?
Yes 1
No 2 If No, go to M1
Yes 1
No 2 If No, go to M1
Yes 1
No 2
Yes 1
No 2
Yes 1
No 2Yes 1
No 2Yes 1
No 2Yes 1
No 2Yes 1
No 2
Yes 1
No 2
Yes 1
No 2
EXPANDED: History of Diabetes
Are you currently receiving any of the following treatments/advice for diabetes prescribed by a doctor or other health worker?
Insulin
Drugs (medication) that you have taken in the past two weeks
Special prescribed diet
Advice or treatment to lose weight
Advice or treatment to stop smoking
Advice to start or do more exercise
Have you ever seen a healer other than allopathic such as homeopathic, ayurvedic, herbalist, traditional healers and others for diabetes or raised blood sugar?
Are you currently taking any herbal or traditional remedy for your diabetes?

CORE: Blood Pressure
Interviewer ID
Device ID for blood pressure
Cuff size used
Reading 1 (Take the first reading. Let the person at rest for 3 minutes before taking second reading)
Reading 2 (Take the second reading. Let the person at rest for 3 minutes before taking third reading)
Reading 3 (Take the third reading)
During the past two weeks, have you been treated for raised blood pressure with drugs (medication) prescribed by a doctor or other health worker?
CORE: Waist
60Risk Factor Survey Bangladesh 2010
Participant Identification Number
CORE: Height and Weight
ResponseQuestion
80
81
82
83
84
In Centimetres (cm)
In Kilograms (kg)
In Centimetres (cm)
Height
Weight
Yes 1
No 2
Yes 1
No 2
Small 1Medium 2
Large 3
Systolic ( mmHg)
Diastolic (mmHg)
Systolic ( mmHg)
Diastolic (mmHg)
Systolic ( mmHg)
Diastolic (mmHg)
If yes, go to M8
Step 2 Physical Measurements
Code
M1
M2a
M2b
M3
M4
M5
M6
M7
Now I am going to measure your height and weight (in erect posture)
Interviewer ID
Device IDs for height and weight
Height
Weight If too large for scale 666.6
For women: Are you pregnant?
85
86
87
88
89
90
91
92
93
Device ID for waist
Waist circumference
.
.
.
Now I am going to measure your waist (in erect posture)
Now I am going to measure your blood pressure (in sitting posture, in right arm with two legs paralleled)
M8
M9
M10
M11a
M11b
M12a
M12b
M13a
M13b
M14

61Risk Factor Survey Bangladesh 2010
Participant Identification Number
94
95
EXPANDED: Hip Circumference and Heart Rate
M15
M16a
M16b
M16c
Hip circumference
Pulse
Reading 1
Reading 2
Reading 3
In Centimetres (cm) .
Beats per minute
Beats per minute
Beats per minute
Now I am going to measure your hip circumference and Pulse (hip and waist circumference should be measured at a time and pulse during measuring blood pressure)

Risk Factor Survey Bangladesh 2010

63Risk Factor Survey Bangladesh 2010
Appendix B2
¯’vb Ges ZvwiL DËi
dd mm year
1.
2.
3.
4.
PSU ID
PSU name
Interviewer ID
Date of completion of the questionnaire
mgx¶vi Z_¨vejx
†KvW
I1
I2
I3
I4
RvZxq ch©v‡q AmsµvgK †iv‡Mi SzwK mg~‡ni e¨vwß wbY©‡qi mgx¶vevsjv‡`k †mvmvBwU Ae †gwWwmb, ¯^v¯’¨ Awa`ßi Ges wek¦ ¯^v¯’¨ ms¯’v, evsjv‡`k
Z_¨ cÖ`vbKvixi AvB.wW. bs t
AbygwZ †bqv n‡q‡Q wK?
mv¶vrKv‡ii fvlv
mv¶vrKvi MÖn‡Yi mgq (24 N›Uvq)
mv¶vrKvi cÖ`vbKvixi bvg
†Uwj‡dvb/†gvevBj bs
(DËi bv n‡j mv¶vrKvi †kl Ki“b)
nu¨v 1bv 2
Bs‡iRx 1evsjv 2
Z_¨ cÖ`vbKvixi AvB.wW. bs t
N›Uv wgwbU
AbygwZ, mv¶vrKv‡ii fvlv Ges bvg
AwZwi³ mvnvh¨Kvix Z_¨
DËi
5.
6.
7.
8.
10.
†KvW
I5
I6
I7
I8
I10
Record and file identification information (I5 to I10) separately from the completed questionnaire.
:

64Risk Factor Survey Bangladesh 2010
Lvbv m¤úwK©Z cÖkœvejx
___ ___ : ___ ___ N›Uv wgwbU
[mv¶vrKvi MÖnYKvixi Rb¨: cwievi m¤ú‡K© Z_¨ cÖ`vbKvix DËi`vZvi Aek¨B eqm 18 ermi ev Z`~aŸ© n‡Z n‡e Ges Avcbv‡K Aek¨B wbwðZ n‡Z n‡e †h †mB e¨w³ cwieviwU m¤ú‡K© mwVK Z_¨ w`‡Z cvi‡e|]
[hw` cÖ‡qvRb nq, Lvbv m¤úwK©Z DËi`vZvi eqm hvPvB Ki“b Ges wbwðZ nDb †h, Zvi eqm 18 ermi ev Z`~aŸ©]
MYcÖRvZš¿x evsjv‡`k miKv‡ii ¯^v¯’¨ I cwievi Kj¨vY gš¿Yvjq mviv evsjv‡`‡k 25 eQ‡ii EaŸ© cÖvßeq®‹‡`i g‡a¨ RvZxq ch©v‡q AmsµvgK †iv‡Mi SzwK mg~‡ni e¨vwß wbY©‡qi GKwU ¸iyZ¡c~Y© RwicKvR cwiPvjbv Ki‡Q Ges Avcbvi cwievi G‡Z Ask MÖn‡bi Rb¨ wbe©vwPZ n‡q‡Q| Rwi‡c Ask MÖn‡bi Rb¨ wbe©vwPZ mKj cwieviB ˆeÁvwbK c×wZ‡Z wbe©vPb Kiv n‡q‡Q Ges GB Rwi‡ci mvd‡j¨i Rb¨ wbe©vwPZ mK‡ji Ask MÖnY LyeB ¸iyZ¡c~Y©| msM„wnZ mKj Z_¨B K‡Vvifv‡e †Mvcb ivLv n‡e| Avcbvi Lvbvi g‡a¨ †K GB Rwi‡c AskMÖn‡bi Rb¨ Dchy³ Zv Rvbvi Rb¨ Avwg K‡qKwU cªkœ Kie|
HH1. cÖ_‡g Avwg Avcbv‡K Avcbvi Lvbv m¤ú‡K© K‡qKwU cªkœ wRÁvmv Kie| GB M„‡n †gvU KZRb evm K‡ib, hviv MZ iv‡Z GB M„n Zv‡`i cÖv_wgK Avevm¯’j wnmv‡e we‡ePbv K‡ib?
Rb
HH2. GB Lvbvi KZR‡bi eqm 25 ermi ev Zvi †ekx?
Rb
HH3. GB Lvbvi KZRb (cyi“l / gwnjv)-i eqm 25 ermi ev Zvi †ekx?
Rb
HH4. GLb Avwg GB Lvbvq emevmKvix 25 ermi ev Zvi †ekx eqmx (cyi“l / gwnjv) - ‡`i e¨vcv‡i Z_¨ msMÖn Ki‡Z PvB| eo †_‡K †QvU µ‡g (cyi“l / gwnjv)-‡`i ZvwjKv ˆZwi Kwi|
[bx‡Pi cÖkœ¸‡jv wRÁvmv Ki“b Ges DËi¸‡jv bx‡Pi Q‡K wjwce× Ki“b|]
K. Zvi c~Y© bvg wK? L. Zvi eqm KZ? [DËi`vZv bv Rvb‡j AbymÜvb K‡i ejyb|] M. wj½ wjwce× Ki“b|
Z_¨ cÖ`vbKvixi AvB.wW. bs t
Lvbv m¤úwK©Z (Household) mv¶vrKvi MÖnY ïi“i mgq [Nwoi 24 N›Uv mgq Abymv‡i]
f~wgKv:

65Risk Factor Survey Bangladesh 2010
K. bvg
1
2
3
4
5
6
7
8
9
10
__________________
__________________
__________________
__________________
__________________
__________________
__________________
__________________
__________________
__________________
________
________
________
________
________
________
________
________
________
________
L. eqm M. wj½
1 2
1 2
1 2
1 2
1 2
1 2
1 2
1 2
1 2
1 2
Z_¨ cÖ`vbKvixi AvB.wW. bs t
cyi“l wba©vwiZ HH ................... 1
gwnjv wba©vwiZ HH .................. 2
cyi“l gwnjv
[HH5. wbe©vwPZ Dchy³ cyi“l / gwnjv-i Lvbv ch©¨vqµg msL¨v (HOUSEHOLD ROSTER NUMBER)]
HH6. cÖkœgvjv mbv³KiY msL¨vi Ni c~iY Ki“b
cÖkœgvjv mbv³KiY msL¨v: [___ ___ ___ ___ ___ - ___ ___]

66Risk Factor Survey Bangladesh 2010
DËicÖkœvejx
11.
12.
13.
14.
15.
16.
17.
C5
C6
C7
ermi
ermi
w`b gvm mvj
Step 1 †W‡gvMÖvwdK Z_¨vejx
†KvW
C1
C2
C3
C4
ewa©Z: †W‡gvMÖvwdK Z_¨mg~n
Z_¨ cÖ`vbKvixi AvB.wW. bs t
g~j: †W‡gvMÖvwdK Z_¨vejx
wj½
Avcbvi Rb¥ ZvwiL wK?(Rvbv bvB 77 77 7777)
Avcbvi eqm KZ?
me©‡gvU KZ ermi cÖvwZôvwbK wk¶v MÖnY K‡i‡Qb?(cÖ_g †kªbxi wb‡P Ges DcvbyôvwbK wk¶v Aš—f©y³n‡e bv)
cyi“l 1
gwnjv 2
hw` Rvbv _v‡K,C4-G hvb
Avcwb KZ`~i †jLvcov K‡i‡Qb?
Avcbvi ag© wK?
†Kvb cÖvwZôvwbK wk¶v †bB ... ... 1 cÖv_wgK wk¶v †kl K‡ibwb ... ... 2 cÖv_wgK wk¶v †kl K‡i‡Qb ... ... 3 gva¨wgK wk¶v †kl K‡i‡Qb ... ... 4
D”P gva¨wgK wk¶v †kl K‡i‡Qb ... ... 5 K‡jR/wek¦we`¨vjq †kl K‡i‡Qb ... ... 6
mœvZ‡KvËi wWMÖx AR©b K‡i‡Qb ... ... 7 Rvbv‡Z Am¤§wZ ... ... 88
Bmjvg ... ... 1 wn›`y ... ... 2
wLªóvb ... ... 3 †eŠ× ... ... 4
Ab¨vb¨ ... ... 5 Rvbv‡Z Am¤§wZ ... ... 88
Avcbvi ˆeevwnK Ae¯’v wK? AweevwnZ ... ... 1
weevwnZ ... ... 2 c„_K ... ... 3
ZvjvKcÖvß ... ... 4 wecZœxK ... ... 5
Rvbv‡Z Am¤§wZ ... ... 88

67Risk Factor Survey Bangladesh 2010
18. C8
ewa©Z: †W‡gvMÖvwdK Z_¨mg~n
Z_¨ cÖ`vbKvixi AvB.wW. bs t
wb‡Pi †KvbwU MZ 12 gv‡mi g‡a¨ Avcbvi cÖavb †ckvwn‡m‡e we‡ewPZ n‡Z cv‡i?
miKvix Kg©Pvix ... ... 1 †emiKvix Kg©Pvix ... ... 2
e¨emv (†QvU) ... ... 3 e¨emv (eo) ... ... 4
K…wl KvR (Rwgi gvwjK Ges K…lK ... ... 5 †¶Z gRyi ... ... 6
KviLvbvi kªwgK ... ... 7 w`bgRyi ... ... 8
Ab¨ ¯^-wb‡qvM ... ... 9 QvÎ ... ... 10
M„n-Kg© ... ... 11 AemicÖvß ... ... 12
†eKvi, Kg¶©g ... ... 13 †eKvi, Kg©¶g bb ... ... 14
Ab¨ wKQz (wbw`©ó Ki“b) ... ... 15 Rvbv‡Z Am¤§wZ ... ... 88
†bvU: 19 bs cÖkœ ev` †`Iqv n‡q‡Q|

DËicÖkœvejx †KvW
68Risk Factor Survey Bangladesh 2010
20
C10a
C10b
C10c
C10d
C10e
C10f
C10g
C10h
C10i
C10j
C10k
ewa©Z: †W‡gvMÖvwdK Z_¨mg~n
a. [we`¨yr?]
b. [d¬vk cvqLvbv?]
c. [j¨vÛ †dvb?]
d. [‡gvevBj †dvb?]
e. [‡Uwjwfkb?]
f. [‡iwWI?]
g. [‡iwdªRv‡iUi?]
h. [cÖvB‡fU Kvi?]
i. [†gvUi mvB‡Kj?]
j. [Iqvwks †gwkb?]
k. [evB mvB‡Kj?]
AbyMÖn K‡i ejyb GB M„‡n ev GB M„‡n hviv evm K‡ib Zv‡`i KviI wb‡Pi mvgMÖx ¸‡jv Av‡Q wK bv:
Z_¨ cÖ`vbKvixi AvB.wW. bs t
nu¨v 1 bv 2
Rvbv bvB 77 Rvbv‡Z Am¤§wZ 88
nu¨v 1 bv 2
Rvbv bvB 77 Rvbv‡Z Am¤§wZ 88
nu¨v 1 bv 2
Rvbv bvB 77 Rvbv‡Z Am¤§wZ 88
nu¨v 1 bv 2
Rvbv bvB 77 Rvbv‡Z Am¤§wZ 88
nu¨v 1 bv 2
Rvbv bvB 77 Rvbv‡Z Am¤§wZ 88
nu¨v 1 bv 2
Rvbv bvB 77 Rvbv‡Z Am¤§wZ 88
nu¨v 1 bv 2
Rvbv bvB 77 Rvbv‡Z Am¤§wZ 88
nu¨v 1 bv 2
Rvbv bvB 77 Rvbv‡Z Am¤§wZ 88
nu¨v 1 bv 2
Rvbv bvB 77 Rvbv‡Z Am¤§wZ 88
nu¨v 1 bv 2
Rvbv bvB 77 Rvbv‡Z Am¤§wZ 88
nu¨v 1 bv 2
Rvbv bvB 77 Rvbv‡Z Am¤§wZ 88

69Risk Factor Survey Bangladesh 2010
C10l
C10m
C10n
C10o
C10p
C10q
C11a
C11b
C11c
l. [‡mjvB †gwkb?]
m. [Avjwgiv / Iqv‡Wªve?]
n. [‡Uwej?]
o. [†PŠwK A_ev LvU?]
p. [‡Pqvi A_ev †eÂ?]
q. [Nwo?]
21
Z_¨ cÖ`vbKvixi AvB.wW. bs t
nu¨v 1 bv 2
Rvbv bvB 77 Rvbv‡Z Am¤§wZ 88
nu¨v 1 bv 2
Rvbv bvB 77 Rvbv‡Z Am¤§wZ 88
nu¨v 1 bv 2
Rvbv bvB 77 Rvbv‡Z Am¤§wZ 88
nu¨v 1 bv 2
Rvbv bvB 77 Rvbv‡Z Am¤§wZ 88
nu¨v 1 bv 2
Rvbv bvB 77 Rvbv‡Z Am¤§wZ 88
nu¨v 1 bv 2
Rvbv bvB 77 Rvbv‡Z Am¤§wZ 88
a. cÖavb N‡ii Qv`/Pvj cÖavbZt wK w`‡q wbwg©Z?(ch©‡e¶Y K‡i wjLyb)
KuvPv (euvk/Lo) ....................... 1
wUb ..................................... 2
wm‡g›U/KbwµU/UvBjm& .............. 3
Ab¨wKQz ................................ 4
Rvbv †bB .............................. 77
b. cÖavb N‡ii ‡`qvj cÖavbZt wK w`‡q wbwg©Z?(ch©‡e¶Y K‡i wjLyb)
cvU/euvk/Kv`v .......................... 1
KvV ..................................... 2
BU/wm‡g›U .............................. 3
wUb ....................................... 4
Ab¨wKQz .................................. 5
Rvbv †bB ................................ 77
c. cÖavb N‡ii ‡g‡S cÖavbZt wK w`‡q wbwg©Z?(ch©‡e¶Y K‡i wjLyb)
gvwU/euvk/Kv`v ......................... 1
KvV ...................................... 2
wm‡g›U / KbwµU ...................... 3
Ab¨wKQz ................................. 4
Rvbv †bB................................ 77

70Risk Factor Survey Bangladesh 2010
g~j: Zvgv‡Ki e¨envi
DËicÖkœvejx
22
23
24
25
26
Step 1 RxebvPiY cwigv‡ci Z_¨vejx (Behavioral Measurements)
†KvW
T1
T2
T3
T4a
T4b
T4c
T5a
T5b
T5c
T5d
T5e
T5f
T5g
T5 other
GLb Avwg Avcbv‡K wewfbœ ¯^v¯’¨ welqK RxebvPiY m¤ú‡K© wKQz cÖkœ Kie| G¸‡jvi g‡a¨ Av‡Q- aygcvb, g`¨cvb, dj I kvK-mwâ LvIqv Ges kvixwiK cwikªg|
Avcwb wK eZ©gv‡b †Kvb cÖKvi aygcvb K‡ib? †hgb-wmMv‡iU, wewo, û°v, Pzi“U, cvBc| (bgybv KvW© Abyhvqx)
Avcwb wK cÖwZw`b aygcvb K‡ib?
KZ ermi eq‡m Avcwb cÖwZw`b aygcvb ïi“ K‡ib?
Avcbvi wK g‡b Av‡Q Zv KZ Av‡M?
M‡o wb‡Pi †KvbwU KZwU Avcwb cÖwZw`b aygcvb K‡ib?
wmMv‡iU
wewo
û°v/avev
cvBc
nv‡Z †gvov‡bv wmMv‡iU
Pzi“U
Ab¨vb¨ (hw` Ab¨vb¨ nq Z‡e T5 Others-G hvb, ZvQvov T9-G hvb),
Ab¨vb¨ (wbw`©ó Ki“b) Ges T9-G hvb
Z_¨ cÖ`vbKvixi AvB.wW. bs t
nu¨v 1
bv 2 (hw` bv nq, T6-G hvb)
nu¨v 1
bv 2 (hw` bv nq, T6-G hvb)
ermi
Rvbv bv _vK‡j 77 (Rvbv _vK‡j, T5a-G hvb)
Rvbv bv _vK‡j 77 (Rvbv _vK‡j, T5a-G hvb)
ermi ev
gvm ev
mßvn

71Risk Factor Survey Bangladesh 2010
g~j: Zvgv‡Ki e¨envi
DËicÖkœvejx
27
28
29
30
31
32
33
34
35
T6
T7
T8a
T8b
T8c
T9
T10
T11a
T11b
T11c
T11d
T11e
T11f
T11other
T11g
T12
T13
T14
†KvW
Z_¨ cÖ`vbKvixi AvB.wW. bs t
Rvbv bv _vK‡j 77 (Rvbv _vK‡j, T9-G hvb)
ermi
Rvbv bv _vK‡j 77 (Rvbv _vK‡j, T9-G hvb)
ermi ev
gvm ev
mßvn
c~‡e© wK Avcwb KL‡bv cÖwZw`b aygcvb Ki‡Zb?
KZ ermi eq‡m Avcwb cÖwZw`b aygcvb eÜ K‡iwQ‡jb?
KZ Av‡M Avcwb cÖwZw`b aygcvb eÜ K‡iwQ‡jb? (†h †Kvb 1wU DËi w`b)
Avcwb wK eZ©gv‡b †Kvb ayqvnxb ZvgvK e¨envi K‡ib? (†hgb-R`©v, mv`v-cvZv, ¸j, bwm¨)
Avcwb wK ayqvnxb ZvgvK cÖwZw`b e¨envi K‡ib?(†hgb-R`©v, mv`v-cvZv, ¸j, bwm¨)
M‡o cÖwZw`b KZevi G¸‡jv e¨envi K‡ib?(cÖwZwUi DËi wb‡Z n‡e)
R`©v
mv`v-cvZv
¸j
bwm¨
ˆLwb
Ab¨vb¨ (hw` Ab¨vb¨ nq Z‡e T11 Others-G hvb,ZvQvov T13-G hvb),
Ab¨vb¨ (wbw`©ó Ki“b) Ges T13-G hvb
Rvbv bvB 77
c~‡e© wK KL‡bv Avcwb cÖwZw`b a~qvnxb ZvgvK e¨envi Ki‡Zb? (†hgb-R`©v, mv`v-cvZv, ¸j, bwm¨)
MZ 7 w`‡b, Avcbvi Dcw¯’wZ‡Z Ab¨ †KD Avcbvi evox‡Z KZw`b a~gcvb K‡i‡Qb?
MZ 7 w`‡b, Avcbvi Dcw¯’wZ‡Z Ab¨ †KD Avcbvi Kg©‡¶‡Îi Ave× GjvKvq KZw`b a~gcvb K‡i‡Qb?
nu¨v 1
bv 2 (hw` bv nq, T9-G hvb)
nu¨v 1
bv 2 (hw` bv nq, T12-G hvb)
nu¨v 1
bv 2 (hw` bv nq, T12-G hvb)
nu¨v 1
bv 2
w`b
Rvbv bv _vK‡j 77
w`b
Rvbv bv _vK‡j ev Ave×GjvKvq KvR bv Ki‡j 77

72Risk Factor Survey Bangladesh 2010
g~j: g`¨cvb
DËicÖkœvejx
36
37
38
39
40
41
42
43
†KvW
A1a
A1b
A2
A3
A4
A5
A6
A7
GLb Avwg Avcbv‡K g`¨cvb m¤ú‡K© wKQz cÖkœ Ki‡ev?
Z_¨ cÖ`vbKvixi AvB.wW. bs t
Avcwb wK KL‡bv g` RvZxq cvbxq cvb K‡i‡Qb?(†hgb-†`kx g`, weqvi, IqvBb, w¯úwiU)
Avcwb wK MZ 12 gv‡m †Kvb ai‡bi g` RvZxqcvbxq cvb K‡i‡Qb?
MZ 12 gv‡m †h †Kvb ai‡bi g` RvZxq cvbxq wKnv‡i cvb K‡i‡Qb?
ˆ`wbK ... ... ... ... ... ... ... ... 1
mßv‡n 5/6 w`b ... ... ... ... ... 2
mßv‡n 1-4 w`b ... ... ... ... ... 3
gv‡m 1-3 w`b ... ... ... ... ... . 4
gv‡m 1 ev‡ii Kg ... ... ... ... . 5
[DËi¸‡jv c‡o ïbvb, bgybv KvW© Abyhvqx]
Avcwb wK MZ 30 w`‡b †Kvb ai‡bi g` RvZxqcvbxq cvb K‡i‡Qb?
MZ 30 w`‡bi g‡a¨ Avcwb KZevi g` RvZxq cvbxqcvb K‡i‡Qb?
MZ 30 w`‡bi g‡a¨ g` RvZxq cvbxq cvb Kivi mgqM‡o wK cwigvb cvb K‡i‡Qb? [bgybv KvW© Abyhvqx]
MZ 30 w`‡bi g‡a¨ g` RvZxq cvbxq cvb Kivi mgqme‡P‡q †ekx wK cwigvb cvb K‡i‡Qb?
MZ 30 w`‡b KZevi GKmv‡_ 5 (cyi“l) ev 4 (gwnjv)BDwbU Gi †ekx g` RvZxq cvbxq cvb K‡i‡Qb?
nu¨v 1
bv 2 (hw` bv nq, D1-G hvb)
nu¨v 1
bv 2 (hw` bv nq, D1-G hvb)
nu¨v 1
bv 2 (hw` bv nq, D1-G hvb)
w`b
Rvbv bv _vK‡j 77
w`b
Rvbv bv _vK‡j 77
w`b
Rvbv bv _vK‡j 77
w`b
Rvbv bv _vK‡j 77
†bvU: 44 Ges 45 bs cÖkœ ev` †`Iqv n‡q‡Q|

73Risk Factor Survey Bangladesh 2010
g~j: Lv`¨vf¨vm msµvš— Z_¨vejx
DËicÖkœvejx
46
47
48
49
†KvW
D1
D2
D3
D4
Avgiv mvaviYZ †hme dj Ges mwâ LvB †mB Lv`¨ m¤úwK©Z cÖkœ Ki‡ev? Avgvi Kv‡Q †`kxq dj Ges kvK-mwâi Qwemn GKwU cywó KvW© Av‡Q, cÖwZwU Qwe GK GKwU mvwf©sm& Gi mgvb| DËi †`Iqvi mgq MZ 1 eQ‡ii mvaviY 1wU mßv‡ni K_v wPš—v Ki“b...
50
51
D5
D5 other
D6
Avcbvi evmvi ivbœvi mgq mvaviYZ †Kvb ai‡bi ˆZj ev Pwe© e¨envi nq? [bgybv KvW© Abyhvqx] (†h †Kvb GKwU wbwÏ©ó Ki“b)mqvweb ˆZj ... ... ... ...... ...... ... 1Pwe© ... ... ... ...... ...... ...... ...... 2gvLb/wN ... ... ... ... ... ... ... ... . 3cvg A‡qj ... ... ... ... ... ... ... ... 4Ab¨vb¨ ... ... ... ... ... ... ... ... ... 5wbw`©ó †KvbwU bq ... ... ... ... ... ... 6wKQzB bq ... ... ... ... ... ... ... ... 7mvbdvIqvi ˆZj ... ... ... ... ... ... 8mwilvi ˆZj ... ... ... ... ... ... ... 9WvjWv ... ... ... ... ... ... ... ... ... 10(hw` Ab¨vb¨ nq Z‡e D5 Others-G hvb)
Ab¨vb¨ (wbw`©ó Ki“b)
evox‡Z ˆZix nq bv Ggb Lvevi M‡o mßv‡n KZevi Lvb? (mKv‡ji bv¯—v, `ycyi I iv‡Zi Lvevi)
Z_¨ cÖ`vbKvixi AvB.wW. bs t
mvaviYZ mßv‡n KZ w`b dj Lvb? [bgybv KvW© Abyhvqx]
†mB w`b¸wji GKw`‡b KZUzKz dj †L‡q‡Qb?[bgybv KvW© Abyhvqx]
mvavibZ mßv‡n KZ w`b kvK-mwâ Lvb?[bgybv KvW© †`Lvb]
†mB w`b¸wji GKw`‡b KZUzKy kvK-mwâ †L‡q‡Qb?[bgybv KvW© Abyhvqx]
w`b
Rvbv bv _vK‡j 77 (hw` '00' nq, D3-G hvb)
w`b
Rvbv bv _vK‡j 77 (hw` '00' nq, D5-G hvb)
mvwf©sm
Rvbv bv _vK‡j 77
Rvbv bv _vK‡j 77
Rvbv bv _vK‡j 77
msL¨v
mvwf©sm
Rvbv bv _vK‡j 77

Avcwb mvaviYZ Kv‡R, †`vKv‡b, evRv‡i ev Dcvmbvj‡q hvZvqv‡Zi Rb¨ hv e¨envi K‡ib mB m† ¤ú‡m K‡ © RvbK© vb‡bb Z PvB‡‡ ‡BB ev|‡‡
74Risk Factor Survey Bangladesh 2010
g~j: kvixwiK cwikªg msµvš— Z_¨
DËicÖkœvejxGLb Avwg Avcbvi fvix gvÎvi KvR m¤ú‡K© Rvb‡Z PvB‡ev|
52
53
54
55
56
57
58
59
60
†KvW
P1
P2
P3(a-b)
P4
P5
P6(a-b)
Avcbvi †ckvMZ Kv‡R AZ¨vwaK nvwc‡q D‡Vb Ges eyK
aici K‡i Ggb †Kvb KvR GKbvMv‡o Kgc‡¶ 10
wgwbU Ki‡Z nq wK? †hgb-fvix wRwbm †Zvjv, gvwU KvUv,
wbg©vY KvR, avb KvUv BZ¨vw`|
[bgybv KvW© Abyhvqx]
mvavib GKwU mßv‡n G ai‡bi fvix KvR KZw`b Ki‡Z
nq?
Ggb GKwU w`‡b GB ai‡bi fvix KvR AvbygvwbK KZ¶b
Ki‡Z nq?
Avcbvi †ckvMZ Kv‡R Aí nvwc‡q D‡Vb Ggb †Kvb KvR
GKbvMv‡o Kgc‡¶ 10 wgwbU Ki‡Z nq wK? †hgb-`ª“Z
nvUv ev nvév fvi enb| [bgybv KvW© Abyhvqx]
mvavib GKwU mßv‡n G ai‡bi fvix KvR KZw`b Ki‡Z
nq?
Ggb GKwU w`‡b GB ai‡bi fvix KvR AvbygvwbK KZ¶b
Ki‡Z nq?
hvZvqv‡Zi Rb¨ Avcwb wK GKbvMv‡o Kgc‡¶ 10 wgwbU
nuv‡Ub ev evBmvB‡Kj e¨envi K‡ib?
mvavib GKwU mßv‡n hvZvqv‡Zi Rb¨ KZw`b GKbvMv‡o
Kgc‡¶ 10 wgwbU nuv‡Ub ev evBmvB‡Kj e¨envi K‡ib?
mvavib GKwU w`‡b †gvU KZ¶b mgq hvZvqv‡Zi Rb¨
Avcwb nuv‡Ub ev evBmvB‡Kj Pvjvb?
mvaviY GKwU mßv‡n wewfbœ ai‡bi kvixwiK cwikª‡g Avcwb †h mgq KvUvb †m m¤úwK©Z wKQz cÖkœ Ki‡ev| Avcwb hw` g‡b K‡ib, Avcwb †Kvb ai‡bi kvixwiK cwikªg K‡ib bv, ZeyI `qv K‡i cÖkœ¸‡jvi DËi w`‡eb|
Avcwb †ckvMZ Kv‡Ri mgq cÖ_‡g Avcbvi †ckvMZ Kv‡R †h mgq e¨q K‡ib Zv m¤ú‡K© wPš—v Ki“b| Zv n‡Z cv‡i UvKvi wewbg‡q ev webvg~‡j¨i KvR| covïbv, †Uªwbs, evmv-evoxi KvR, Lv`¨-k‡m¨i Pvlvev`, gvQ aiv ev Lv‡`¨i Rb¨ wkKvi Kiv A_ev PvKzix †LuvRv| GLv‡b Ôfvix gvÎvi KvRÕ ej‡Z †evSvq Lye cwikª‡gi KvR hv‡Z GKRb AZ¨vwaK nvwc‡q D‡Vb Ges eyK aici K‡i Ges Ôga¨g gvÎvi KvRÕ ej‡Z †evSvq gvSvix cwikª‡gi KvR hv‡Z GKRb Aí nvwc‡q I‡Vb|
GLb Avwg Avcbvi ga¨g gvÎvi fvix KvR m¤ú‡K© Rvb‡Z PvB‡ev|
P7
P8
P9(a-b)
Z_¨ cÖ`vbKvixi AvB.wW. bs t
nu¨v 1
bv 2 (hw` bv nq, P4-G hvb)
nu¨v 1
bv 2 (hw` bv nq, P7-G hvb)
w`b
N›Uv wgwbUt
w`b
N›Uv wgwbUt
nu¨v 1
bv 2 (hw` bv nq, P10-G hvb)
w`b
N›Uv wgwbUt

e‡m Kiv KvR m¤úwK©Z AvPibt
ewa©Z t kvwiixK cwikªg msµvš— Z_¨vejx
†ckvMZ Kv‡Ri evwn‡i Avcwb wK Ggb †Kvb KvR Kgc‡¶ GKbvMv‡o 10wgwbU K‡ib, hv‡Z AZ¨vwaK nvwc‡q D‡Vb Ges eyK aici K‡i| †hgb †Ljvayjv, e¨qvg A_ev we‡bv`bg~jK KvR K‡ib (†`Šov‡bv, nvWzWz ev
dzUej †Ljv) [bgybv KvW© †`Lvb]
GKwU mvavib mßv‡n †ckvMZ Kv‡Ri evwn‡i Ggb cwikªg KZw`b K‡ib? †hgb-†Ljvayjv, e¨vqvg A_ev we‡bv`bg~jK KvR|
Ggb GKwU w`‡b †ckvMZ Kv‡Ri evwn‡i G ai‡bi fvix KvR AvbygvwbK KZ¶b K‡ib?
†ckvMZ Kv‡Ri evwn‡i Avcwb wK Ggb †Kvb KvR Kgc‡¶ GKbvMv‡o 10wgwbU K‡ib, hv‡Z Aí nvwc‡q D‡Vb| †hgb-†Ljvayjv, e¨qvg A_ev we‡bv`bg~jK KvR, †Rv‡o nvUv, mvB‡Kwjs, mvZvi KvUv, fwjej I `vwoqvevÜv †Ljv| [bgybv KvW© †`Lvb]
mvavib GKwU mßv‡n †ckvMZ Kv‡Ri evwn‡i Gai‡bi cwikªg KZw`b Ki‡Z nq?
Ggb GKwU w`‡b †ckvMZ Kv‡Ri evwn‡i G ai‡bi gvSvix KvR AvbygvwbK me©‡gvU KZ¶b K‡ib?
75Risk Factor Survey Bangladesh 2010
cieZ©x cÖkœ¸‡jv †ckvMZ KvR Ges hvZvqv‡Zi evwn‡i †Ljvayjv, e¨qvg A_ev we‡bv`bg~jK KvR m¤ú‡K©| GLb Avwg Avcbv‡K GB ai‡bi fvix KvwqK cwikªg m¤ú‡K© Rvb‡Z PvB‡ev|
GLb Avwg Avcbvi †ckvMZ Kv‡Ri evwn‡i gvSvix gvÎvi KvwqK cwikªg m¤ú‡K© Rvb‡Z PvB‡ev|
cieZ©x cÖkœwU Kg©‡¶‡Î, evwo‡Z, GK RvqMv †_‡K Ab¨ RvqMvq †h‡Z A_ev eÜz‡`i AvÇvq, Mvox, evm ev †Uª‡b K‡i hvIqv, cov‡kvbv, KvW© †Ljv A_ev †Uwjwfkb †`Lvi †¶‡Î ï‡q ev †njvb w`‡q KvUv‡bv mgq m¤ú‡K©| GLv‡b Nywg‡q KvUv‡bv mgq Aš—f~©³ n‡e bv|
g~j: kvixwiK cwikªg msµvš— Z_¨
61
62
63
64
65
66
67mvavib GKwU w`‡b Nyg I QzwUi w`b Qvov KZUzKz mgq Avcwb ï‡q e‡m KvUvb?
P10
P11
P12(a-b)
P13
P14
P15(a-b)
P16(a-b)
Z_¨ cÖ`vbKvixi AvB.wW. bs t
nu¨v 1
bv 2 (hw` bv nq, P13-G hvb)
w`b
N›Uv wgwbUt
nu¨v 1
bv 2 (hw` bv nq, P13-G hvb)
w`b
N›Uv wgwbUt
N›Uv wgwbUt

76Risk Factor Survey Bangladesh 2010
g~j: D”P i³Pvc msµvš— Z_¨
DËicÖkœvejx
68
69
70
71
72
73
H1
H2a
H2b
H3a
H3b
H3c
H3d
H3e
H4
H5
†KvW
Avcbvi i³Pvc GKRb Wv³vi ev ¯^v¯’¨Kg©x Øviv KL‡bv gvwc‡q‡Qb wK?
†Kvb Wv³vi ev ¯^v¯’¨Kg©x Avcbv‡K KLbI e‡j‡Qb wK †h Avcbvi D”P i³Pvc Av‡Q?
Avcbvi D”P i³Pvc wK MZ 12 gv‡mi g‡a¨ cÖ_g aiv c‡o‡Q?
ewa©Z: D”P i³Pvc msµvš— Z_¨
MZ 2 mßv‡n D”P i³Pv‡ci †Kvb Jla †L‡q‡Qb wK?
jeb Kg LvIqvi Dc‡`k
IRb Kgv‡bvi Dc‡`k ev †Kvb wPwKrmv
aygcvb cwiZ¨v‡Mi Dc‡`k ev wPwKrmv
e¨vqvg A_ev nuvUvi Dc‡`k
Avcwb D”P i³Pv‡ci Rb¨ G‡jvc¨vw_K Qvov Ab¨ †Kvb wPwKrmK †`wL‡q‡Qb wK? (†hgb-†nvwgIc¨vw_, Avqy‡e©w`K,
KweivwR, SvoduyK I Ab¨vb¨)
Avcwb D”P i³Pv‡ci Rb¨ †flR ev KweivRx wPwKrmv wb‡”Qb?
Z_¨ cÖ`vbKvixi AvB.wW. bs t
nu¨v 1
bv 2 (hw` bv nq, H6-G hvb)
nu¨v 1
bv 2 (hw` bv nq, H6-G hvb)
nu¨v 1
bv 2
nu¨v 1
bv 2
nu¨v 1
bv 2
nu¨v 1
bv 2
nu¨v 1
bv 2
nu¨v 1
bv 2
nu¨v 1
bv 2
nu¨v 1
bv 2
eZ©gv‡b D”Pi³Pv‡ci Rb¨ Avcwb wK Wv³vi ev ¯^v¯’¨Kg©xi †`Iqv wb‡gœv³ †Kvb wPwKrmv ev Dc‡`k †c‡q‡Qb wK?

77Risk Factor Survey Bangladesh 2010
g~j: Wvqv‡ewUm msµvš— Z_¨
DËicÖkœvejx
74
75
76
77
78
79
H6
H7a
H7b
H8a
H8b
H8c
H8d
H8e
H8f
H9
H10
†KvW
Avcwb wK KL‡bv †Kvb Wv³vi ev ¯^v¯’¨Kg©x Øviv i‡³i myMvi gvwc‡q‡Qb?
†Kvb Wv³vi ev ¯^v¯’¨Kg©x wK KLbI Avcbv‡K e‡j‡Qb, Avcbvi i‡³ myMvi †ekx ev Wvqv‡ewUm Av‡Q?
MZ 12 gv‡mi g‡a¨ wK †KD Avcbv‡K e‡j‡Q?
ewa©Z: Wvqv‡ewUm msµvš— Z_¨vejx
Bbmywjb
MZ 2 mßv‡n Wvqv‡ewUm Gi †Kvb Jla †L‡q‡Qb wK?
mywbwÏ©ó LvIqvq Dc‡`k
IRb Kgv‡bvi Dc‡`k ev wPwKrmv
aygcvb cwiZ¨v‡Mi Dc‡`k ev wPwKrmv
e¨vqvg ïi“ ev †ekx K‡i Kivi Dc‡`k
Avcwb i‡³ myMvi evovi Rb¨ G‡jvc¨vw_K Qvov Ab¨ †Kvb wPwKrmK †`wL‡q‡Qb wK? (†hgb-†nvwgIc¨vw_,
Avqy‡e©w`K, KweivwR, SvoduyK I Ab¨vb¨)
Avcwb wK Wvqv‡ewU‡mi Rb¨ eZ©gv‡b †Kvb †flR ev KweivwR wPwKrmv wb‡”Qb?
Z_¨ cÖ`vbKvixi AvB.wW. bs t
nu¨v 1
bv 2 (hw` bv nq, M1-G hvb)
nu¨v 1
bv 2 (hw` bv nq, M1-G hvb)
nu¨v 1
bv 2
nu¨v 1
bv 2
nu¨v 1
bv 2
nu¨v 1
bv 2
nu¨v 1
bv 2
nu¨v 1
bv 2
nu¨v 1
bv 2
nu¨v 1
bv 2
nu¨v 1
bv 2
Avcwb wK eZ©gv‡b Wvqv‡ewU‡mi Rb¨ Wv³vi ev ¯^v¯’¨Kg©x Øviv wb‡gœv³ †Kv‡bv wPwKrmv ev Dc‡`k †c‡q‡Qb wK?

g~j: i³Pvc
B›Uvi wfDqvi AvB.wW
i³Pvc cwigv‡ci h‡š¿i AvBwW
e¨eüZ evûeÜbxi gvc †QvU ... ... 1 gvSvwi (mvavib) ... ... 2 eo ... ... 3
wiwWs 1mv¶vrKvi cÖ`vbKvix 15 wgwbU wekªvg †bIqvi ci cÖ_gevi i³Pvc gvcyb| wØZxqevi i³Pvc gvcvi c~‡e© 3 wgwbU A‡c¶v Ki“b|
wiwWs 2wØZxqevi i³Pvc gvcyb| Z…Zxqevi i³Pvc gvcvi Av‡M mv¶vrKvi cÖ`vbKvix‡K c~Yivq 3 wgwbU wekªvg wb‡Z ejyb|
wiwWs 3
Z…Zxqevi i³Pvc gvcyb|
MZ `yB mßv‡ni g‡a¨ Avcwb wK †Kvb Wv³vi ev ¯^v¯’¨ Kgx©i civgk© Abyhvqx D”P i³Pv‡ci Rb¨ Jla †L‡q‡Qb?
g~j: †Kvgi
78Risk Factor Survey Bangladesh 2010
g~j: D”PZv Ges IRb
80
81
82
83
84
Step 2 kvixwiK cwigv‡ci Z_¨mg~n (Physical Measurements)
M1
M2a
M2b
M3
M4
M5
M6
M7
B›UviwfDqvi AvB.wW
D”PZv Ges IRb gvcvi h‡š¿i AvB.wW
D”PZv (†mw›UwgUv‡i)
IRb (wK‡jvMÖv‡g)(hw` h‡š¿i m‡e©v”P gvÎv AwZµg K‡i Zvn‡j 666.6)
gwnjv‡`i Rb¨ t Avcwb wK Mf©eZx©?
DËicÖkœvejx †KvW
85
86
87
88
89
90
91
92
93
.
.
GLb Avwg Avcbvi i³Pvc gvc‡ev (e‡m Wvb evû‡Z, `yB cv cvkvcvwk †i‡L)
wm‡óvwjK wg.wg.Ae gvK©vix
Wvqv‡óvwjK wg.wg.Ae gvK©vix
wm‡óvwjK wg.wg.Ae gvK©vix
Wvqv‡óvwjK wg.wg.Ae gvK©vix
wm‡óvwjK wg.wg.Ae gvK©vix
Wvqv‡óvwjK wg.wg.Ae gvK©vix
M8
M9
M10
M11a
M11b
M12a
M12b
M13a
M13B
M14
Z_¨ cÖ`vbKvixi AvB.wW. bs t
nu¨v 1
bv 2
nu¨v 1
bv 2
(hw` nu¨v nq, M8-G hvb)
GLb Avwg Avcbvi D”PZv Ges IRb †be (†mvRv n‡q `uvwo‡q)|
D”PZv
IRb
‡m. wg.
. ‡m. wg.
‡KwR
GLb Avwg Avcbvi †Kvg‡ii gvc †be (†mvRv n‡q `uvwo‡q)
†Kvgi gvcvi h‡š¿i AvB.wW
†Kvg‡ii cwiwa (†mw›UwgUv‡i)

79Risk Factor Survey Bangladesh 2010
94
95
ewa©Z: wbZ‡¤^i cwiwa Ges cvj&m †KvW
M15
M16a
M16b
M16c
wbZ‡¤^i cwiwa (†mw›UwgUv‡i)
cvj&‡mi nvi
wiwWs 1
wiwWs 2
wiwWs 3
GLb Avwg Avcbvi wbZ‡¤^i cwiwa Ges cvj&m gvc‡ev (wbZ‡¤¢i Ges †Kvg‡ii cwiwai gvc GKB mv‡_ wb‡Z n‡e, i³Pvc gvcvi mgq cvj&m ¸‡b wb‡Z n‡e)|
Z_¨ cÖ`vbKvixi AvB.wW. bs t
. ‡m. wg.
/wgwbU
/wgwbU
/wgwbU

Risk Factor Survey Bangladesh 2010

81Risk Factor Survey Bangladesh 2010
Appendix CSHOWCARDS
A. Tobacco Products
Examples The following picture shows a few selected examples of tobacco products. Sites are to develop show cards including specific examples of local tobacco products.
Step
Step 1, Tobacco use T T1 to T14
Section Items
ManufacturedCigarettes
Snuff, available inwet and dry form
Betel nut
Chewing tobacco,e.g., plug, loose-leaf,chimo, toombak,guthha or twist.
Betel leaf
Water pipe, alsoknown as shisha,hookah or hubble-bubble
Roll-your-own(RYO) cigarettes
Pipe
Cigars, e.g.,cigarillos, doublecoronas, cheroots,stumpen, chuttasand dhumtis.
Biri

82Risk Factor Survey Bangladesh 2010
B. Alcohol Consumption
Note: Net alcohol content of a standard drink is approximately 10g of ethanol. However, standard drinks in different countries can contain different amounts of ethanol. Therefore, countries may have to adapt this measure according to their own standards and will report it measure if different from the standard mentioned above.
Source: World Health Survey Questionnaire.
1 standard drink =
1 Standard bottleof regular beer(285ml)
1 Single measureof spirits (30ml)
1 Medium sizeglass of wine(120ml)
1 Measure ofaperitif (60ml)
Step Section Items
Step 1, alcohol consumption A
SHOWCARDS
A1-A7

83Risk Factor Survey Bangladesh 2010
C. Diet (Typical Fruit And Vegetables And Serving Sizes)
VEGETABLES
Step
Step 1, Diet D D1 to D6
Section Items
Vegetables 1 Serving size
Raw green leafy vegetables 1 cup
Other vegetables cocked chopped ½ cup
Vegetable Juice ½ cup
Serving size: One standard serving=80 grams (translated into different units of cups depending on type of vegetable and standard cup measures available in the country).
SHOWCARDS

84Risk Factor Survey Bangladesh 2010
FRUITS
Step
Step 1, Diet D D1 to D6
Section Items
Serving size: One standard serving=80 grams (translated into different units of cups depending on type of vegetable and standard cup measures available in the country).
Fruits 1 Serving size
Apple, Banana, Orange 1 medium size piece
Chopped, Cooked or caned fruit ½ cup
Fruit Juice ½ cup Not artificially flavored
SHOWCARDS

85Risk Factor Survey Bangladesh 2010
D. Typical Physical Activities
Examples of Typical Physical Activities
Examples for moderate activities
Step
Step 1, Physical Activity P P1 to P16b
Section Items
WORK RELATED PHYSICAL ACTIVITY
MODERATEIntensity Activities
Makes you breathe somewhatharder than normal
Examples:● Cleaning (vacuuming, mopping, polishing, scrubbing, sweeping, ironing)● Washing (beating and brushing carpets, wringing clothes by hand) Gardening● Milking cows (by hand) Planting and harvesting crops● Digging dry soil (with spade)● Weaving● Woodwork (chiselling, sawing softwood)● Mixing cement (with shovel)● Labouring (pushing loaded wheelbarrow, operating jack hammer)● Walking with load on head● Drawing water● Tending animals
Examples:● Forestry (cutting, chopping, carryingwood)● Sawing hardwood● Ploughing● Cutting crops (sugar cane)● Gardening (digging)● Grinding (with pestle)● Labouring (shovelling sand)● Loading furniture (stoves, fridge)● Instructing spinning (fitness)● Instructing sports acrobics● Sorting postal parcels (fast pace)● Cycle rickshaw driving
Examples:● Cycling● Jogging● Dancing● Horse-riding● Tai chi● Yoga● Pilates● Low-impact aerobics● Cricket
Examples:● Soccer● Rugby● Tennis● High-impact aerobics● Aqua aerobics● Ballet dancing● Fast swimming
VIGOROUSIntensity Activities
Makes you breathe muchharder than normal
MODERATEIntensity Activities
Makes you breathe somewhatharder than normal
VIGOROUSIntensity Activities
Makes you breathe somewhatharder than normal
LEISURE/SPARE TIME RELATED PHYSICAL ACTIVITY
Examples: The following pictures show a few selected examples of physical activity show cards that have been developed and used by different countries.
SHOWCARDS

86Risk Factor Survey Bangladesh 2010
Examples of vigorous activities at work
Examples of vigorous activities during leisure time

Appendix D
87Risk Factor Survey Bangladesh 2010
GLOSSARY OF TERMS
Introduction: This section provides an alphabetical list of all the terms used in a STEPS surveillance with definitions that are appropriate for STEPS.
Abdominal obesity
Binge drinking
Cluster
TERM DEFINITION
A study design based on observations at a single point in time. STEPS surveys will be cross-sectional unless they are especially being extended to follow the sample over time.
Smokeless tobacco user who are daily or occasional any smokeless tobacco product user
Smoker who are daily or occasional smokers of any smoking tobacco products.
A person was considered diabetic if any health personnel told after measuring BP that s/he had diabetes or not. If a person reported to have been told by any health personnel, or taking any treatment for diabetes were considered as diabetic.
A small to medium sized geographic area that has been defined in a census.
Who saw somebody smoking or smelled tobacco smoke, or saw tobacco butts inside (indoor areas) the workplace in the past 30 days.
Who were exposed to SHS inside the respondent's home which does not include areas outside such as patios, balcony, garden, etc. that are not fully enclosed.
See Hypertension
Hypertension was measured if blood pressure was >_140/90 mmHg. Respondents who were taking any medicine were also considered as hypertensive.
A (usually geographical defined) group of individuals.
Cross-sectional design
Current smokelesstobacco products user
Current smoker
Diabetes mellitus
Enumeration area
Exposure to secondhandsmoke (SHS) at workplace
Exposure to secondhandsmoke at home
High blood pressure
Hypertension
Abdominal obesity was measured by waist circumference (WC) of the subjects. Increased waist circumference is considered if WC >_94cm in men and >_80 cm in women. Substantially increased waist circumference is considered if WC >_102 cm in men and >_88 cm in women.
Binge drinking is considered if in a drinking occasion >_5 standard drink consumed by a men and >_4 drinks consumed by a women.

88Risk Factor Survey Bangladesh 2010
Kish method
Mean
MET
Moderate intensityphysical activity
Obesity
Participant
Pilot test
Prevalence
Primary samplingunit (PSU)
Probabilityproportional tosize (PPS)
Representativeness
Risk factor
Secondary sampling units(SSU)
Serving (of fruit orvegetable)
The Kish method is a sampling method for selecting an individual randomly from a household. It uses a pre-determined table to select an individual based on the number of individuals living in the household.
The arithmetic mean is the average of a set of values, that is, the sum of all the values divided by number of values. Because of its simplicity and its statistical properties, it is used more than any of the other measures of central tendency (e.g. median).
Metabolic equivalent (MET) is the ratio of a person's working metabolic rate relative to the resting metabolic rate. One MET is defined as the energy cost of sitting quietly, and is equivalent to a caloric consumption of 1 kcal/kg/hour.
Refers to activities which take moderate physical effort and that make you breathe somewhat harder than normal. Examples include cleaning, vacuuming, polishing, gardening, cycling at a regular pace or horse riding. Moderate intensity activities require an energy expenditure of approximately 3-6 METs.
Obesity was determined by using the standard BMI Cutoff. A person is considered obese if the BMI measured >_30.0.
An individual who responds to the STEPS Instrument.
A small trial run or "dress rehearsal" of an entire process, e.g. data collection or data entry, completed before the process officially begins.
The number of persons with a disease or an attribute in a given population at a designated time, e.g. % daily smoker in a country in 2008.
The sampling units for the first stage of sampling in a multi-stage sample design. See multi-stage sample design.
Probability proportional to size (PPS) sampling is a method for selecting a sampling unit in which the probability of selection for a given sampling unit is proportional to its size (most often the number of individuals or households within the sampling unit).
The extent to which a sample has the same distribution of the characteristics of interest as the target population from which it was selected.
Refers to any attribute, characteristic, or exposure of an individual, which increases the likelihood of developing a disease, or other unwanted condition/event.
The sampling units used for selection after the primary sampling units.
For vegetables this refers to one cup of raw, leafy green vegetables (spinach, salad etc.), one half cup of other vegetables, cooked or raw (tomatoes, pumpkin, beans etc.), or a half cup of vegetable juice. For fruits, this refers to one medium-sized piece of fruit (banana, apple, kiwi etc.) or a half cup of raw, cooked or canned fruit or a half cup of juice from a fruit (not artificially flavored).

89Risk Factor Survey Bangladesh 2010
Smokeless tobaccouse frequency
Smoking frequency
Standard drink
Target population
Tobacco products
Vigorous intensityactivity
Classified into three categories, i.e.,1) Daily smokeless tobacco use means smokeless tobacco use at least one
smokeless tobacco product every day over a period of month or more 2) Occasional smokeless tobacco use (/ less than daily)3) Never smokeless tobacco users means person has never tried
smokeless tobacco products or have just tried once or twice in lifetime.
Classified into three categories, i.e.,1) Daily smoking means smoking at least one tobacco product every day
over a period of month or more 2) Occasional smoking (/ less than daily)3) Never smoking means person has never tried smoking or have just
tried once or twice in lifetime.
The net alcohol content of a standard drink is generally 10g of ethanol depending on the country/site. This is the equivalent of 1 regular beer (285ml), a single measure of spirits (30 ml), a medium-sized glass of wine (120 ml), or a measure of aperitif (60 ml).
The population from which the sample population is drawn. If the sample has been drawn correctly, the estimates obtained from the survey should be representative of the target population.
Two types of tobacco products, i.e.1) Smoked tobacco: it includes manufactured cigarettes, bidi, hookkah
(Water pipes) hand - rolled cigarettes, pipes full of tobacco, cigars, cheroots or, cigarillos and any others. Others includes dhaba (water pipes made of bamboo),
2) Smokeless tobacco: it includes-jarda, sada pata, gul, khoinee and others. Other includes different brands of jarda, pan masala etc.
Refers to activities which take hard physical effort and which make you breathe much harder than normal. Examples include loading furniture, digging, playing football, tennis or fast swimming. Vigorous activities require an energy expenditure of greater than 8 METs.

Risk Factor Survey Bangladesh 2010

Appendix E
91Risk Factor Survey Bangladesh 2010
Table 1.1: Distribution of the respondents by age, residence and sex
Women(n = 4 963)
Age groups
Residence
25 - 3435 - 4445 - 5455 - 6465 +
1 992 (40.1)1 455 (29.3)876 (17.7)430 (8.7)210 (4.2)
UrbanRuralTotal
2 454 (49.4)2 509 (50.5)4 963 (100)
Men(n = 4 312)
1 172 (27.2)1 076 (25.0)971 (22.5)585 (13.6)508 (11.8)
2 175 (50.4)2 137 (49.5)4 312 (100)
Both sexes(n = 9 275)
3 164 (34.1)2 531 (27.3)1 847 (19.9)1 015 (10.9)
718 (7.7)
4 629 (49.9)4 646 (50.1)9 275 (100)
n (%) n (%) n (%)

92Risk Factor Survey Bangladesh 2010
Table 1.2: Level of education of respondents*
Age(years)
NumberNo formalschooling
Secondaryor above
Less thanprimaryschool
Primaryschool
completed
Less thansecondary
school
Men25 – 3435 – 4445 – 5455 – 6465 +Total
1 1721 076971585508
4 312
356 (30.4)395 (36.7)400 (41.2)229 (39.1)249 (49.0)
1 629 (37.8)
180 (15.4) 158 (14.7) 131 (13.5) 80 (13.7) 90 (17.7)
639 (14.8)
149 (12.7) 111 (10.3) 101 (10.4) 62 (10.6) 45 (8.9)
468 (10.9)
237 (20.2) 190 (17.7) 166 (17.1) 85 (14.5) 65 (12.8)
743 (17.2)
250 (21.3)222 (20.6)173 (17.8)129 (22.1)59 (11.6)
833 (19.3)
Women25 – 3435 – 4445 – 5455 – 6465 +Total
1 9921 455876430
210 4 963
525 (26.4) 726 (49.9) 530 (60.5) 306 (71.2) 172 (81.9)
2 259 (45.1)
418 (21.0) 215 (14.8) 123 (14.0) 52 (12.1) 16 (7.6)
824 (16.6)
278 (14.0) 150 (10.3)
82 (9.4) 27 (6.3) 8 (3.8)
545 (11.0)
479 (24.0) 190 (13.1)
70 (8.0) 25 (5.8) 13 (6.2)
777 (15.7)
292 (14.7)174 (12.0)
71 (8.1)20 (4.7)1 (0.5)
558 (11.2)
Both Sexes25 – 3435 – 4445 – 5455 – 6465 +Total
3 1642 5311 8471 015718
9 275
881 (27.8) 1 121 (44.3) 930 (50.4) 535 (52.7) 421 (58.6)
3 888 (41.9)
598 (18.9) 373 (14.7) 254 (13.8) 132 (13.0) 106 (14.8)
1 463 (15.8)
427 (13.5) 261 (10.3) 183 (9.9) 89 (8.8) 53 (7.4)
1 013 (10.9)
716 (22.6) 380 (15.0) 236 (12.8) 110 (10.8) 78 (10.9)
1 520 (16.4)
542 (17.1)396 (15.9)244 (13.2)149 (14.7)
60 (8.4)1 391 (15.0)
*Results are n (%)

93Risk Factor Survey Bangladesh 2010
Tabl
e 1.
3: D
istr
ibut
ion
of th
e re
spon
dent
s by
prin
cipa
l occ
upat
ion*
Men
Wom
en
Both
Sex
es
25 –
34
35 –
44
45 –
54
55 –
64
65 +
Tota
l
25 –
34
35 –
44
45 –
54
55 –
64
65 +
Tota
l
25 –
34
35 –
44
45 –
54
55 –
64
65 +
Tota
l
1 17
21
076
971
585
508
4 31
2
31 (2
.6)
38 (3
.5)
25 (7
.4)
25 (4
.3)
2 (0
.4)
168
(3.9
)
207
(17.
7)15
2 (1
4.1)
88 (9
.1)
54 (9
.2)
6 (1
.2)
507
(11.
8)
237
(20.
2)26
1 (2
4.3)
200
(20.
6)87
(14.
9)43
(8.5
)82
8 (1
9.2)
32 (2
.7)
55 (5
.1)
27 (2
.8)
24 (4
.1)
6 (1
.2)
144
(3.3
)
187
(16.
0)23
5 (2
1.8)
256
(26.
4)17
4 (2
9.7)
132
(26.
0)98
4 (2
2.8)
91 (7
.8)
79 (7
.4)
92 (9
.4)
42 (7
.2)
27 (5
.3)
331
(7.7
)
102
(3.2
)88
(3.5
)97
(5.2
)43
(4.2
)27
(3.7
)35
7 (3
.8)
203
(17.
3)14
8 (1
3.8)
112
(11.
5)39
(6.7
)17
(3.3
)51
9 (1
2.0)
236
(7.5
)17
8 (7
.0)
132
(7.1
)46
(4.5
)19
(2.6
)61
1 (6
.6)
92 (7
.8)
64 (5
.9)
62 (6
.4)
16 (2
.7)
12 (2
.4)
246
(5.7
)
124
(3.9
)99
(3.9
)76
(4.1
)21
(2.1
)13
(1.8
)33
3 (3
.6)
25 (2
.1)
1 (0
.1)
0 (0
)0
(0)
0 (0
)26
(0.6
)
38 (1
.2)
1 (0
)0
(0)
0 (0
)0
(0)
39 (0
.4)
0 (0
)1
(0.1
)13
(1.3
)70
(12.
0)14
8 (2
9.1)
232
(5.4
)
0 (0
)1
(0)
14 (0
.8)
74 (7
.3)
156
(21.
7)24
5 (2
.6)
35 (1
.1)
17 (0
.7)
24 (1
.2)
45 (4
.5)
125
(17.
4)24
6 (2
.7)
154
(4.9
)95
(3.8
)76
(4.1
)37
(3.6
)28
(3.9
)39
0 (4
.2)
31 (2
.7)
16 (1
.4)
20 (2
.0)
35 (6
.0)
94 (1
8.6)
196
(4.6
)
34 (2
.9)
24 (2
.2)
26 (2
.7)
14 (2
.4)
11 (2
.2)
109
(2.5
)
2 (0
.2)
2 (0
.2)
3 (0
.3)
5 (0
.9)
10 (2
.0)
22 (0
.5)
1 66
3 (5
2.6)
1 21
6 (4
8.0)
747
(40.
4)37
6 (3
7.0)
159
(22.
1)4
161
(44.
9)
22 (1
.1)
19 (1
.3)
14 (1
.6)
1 (0
.2)
0 (0
)56
(1.1
)
82 (4
.1)
48 (3
.3)
14 (1
.6)
7 (1
.6)
1 (0
.5)
152
(3.1
)
10 (0
.5)
19 (1
.3)
7 (0
.8)
0 (0
)0
(0)
36 (0
.7)
0 (0
)3
(0.2
)0
(0)
0 (0
)0
(0)
3 (0
.1)
4 (0
.2)
6 (0
.4)
3 (0
.3)
1 (0
.2)
1 (0
.5)
15 (0
.3)
11 (0
.6)
9 (0
.6)
5 (0
.5)
1 (0
.2)
0 (0
)26
(0.5
)
33 (1
.7)
30 (2
.1)
20 (2
.3)
7 (1
.6)
2 (1
.0)
92 (1
.9)
32 (1
.6)
35 (2
.4)
14 (1
.6)
5 (1
.2)
1 (0
.5)
87 (1
.8)
13 (0
.7)
0 (0
)0
(0)
0 (0
)0
(0)
13 (0
.3)
1 66
1 (8
3.4)
1 21
4 (8
3.4)
744
(84.
9)37
1 (8
6.3)
149
(71.
0)4
139
(83.
4)
0 (0
)0
(0)
1 (0
.1)
4 (0
.9)
8 (3
.8)
13 (0
.3)
4 (0
.2)
1 (0
.1)
4 (0
.4)
10 (2
.3)
31 (1
4.8)
50 (1
.0)
120
(6.0
)71
(4.9
)50
(5.7
)23
(5.3
)17
(8.1
)28
1 (5
.7)
1 99
21
455
876
430
210
4
963
3 16
42
531
1 84
71
015
718
9 27
5
53 (1
.7)
57 (2
.3)
86 (4
.7)
26 (2
.6)
2 (0
.3)
224
(2.4
)
289
(9.1
)20
0 (7
.9)
102
(5.5
)61
(6.0
)7
(1.0
)65
9 (7
.1)
247
(7.8
)28
0 (1
1.1)
207
(11.
2)87
(8.6
)43
(6.0
)86
4 (9
.3)
32 (1
.0)
58 (2
.3)
27 (1
.5)
24 (2
.4)
6 (0
.8)
147
(1.6
)
191
(6.0
)24
1 (9
.5)
259
(14.
0)17
5 (1
7.2)
133
(18.
5)99
9 (1
0.8)
Age
(yea
rs)
Num
ber
Gov
t.em
ploy
eeN
on-g
ovt.
empl
oyee
Busin
ess
(sm
all)
Busin
ess
(larg
e)La
bour
er(d
aily
)Se
lf em
ploy
edFa
rmer
sSt
uden
tH
ome-
mak
erRe
tired
Oth
ers
Une
mpl
oyed
(abl
e to
wor
k or
not
)
Labo
urer
(agr
icul
tura
l/In
dust
rial)
*Res
ults
are
n (%
)

94Risk Factor Survey Bangladesh 2010
Table 1.4: Distribution of the respondents by wealth indices*
Women25 – 3435 – 4445 – 5455 – 6465 +Total
1 9921 455876430210
4 963
566 (28.4)363 (24.9)219 (25.0)138 (32.1)78 (37.1)
1 364 (27.5)
502 (25.2)372 (25.6)217 (24.8)98 (22.8)53 (25.2)
1 242 (25.0)
432 (21.7)341 (23.4)203 (23.2)97 (22.6)33 (15.7)
1 106 (22.3)
492 (24.7)379 (26.0)237 (27.1)97 (22.6)46 (21.9)
1 251 (25.2)
Both sexes25 – 3435 – 4445 – 5455 – 6465 +Total
3 1642 5311 8471 015718
9 275
825 (26.1)579 (22.9)415 (22.5)257 (25.3)205 (28.6)
2 281 (24.6)
845 (26.7)629 (24.9)469 (25.4)227 (22.4)186 (25.9)
2 356 (25.4)
751 (23.7)652 (25.8)456 (24.7)255 (25.1)172 (24.0)
2 286 (24.6)
743 (23.5)671 (26.5)507 (27.4)276 (27.2)155 (21.6)
2 352 (25.4)
*Results are n (%).
Age (years) Number1st
Wealth index quartiles**
2nd 3rd 4th
**The wealth index was constructed using principal component analysis. Asset information was collected with the NCD survey questionnaire and covered information on household ownership of a number of items, such as electricity, flush toilet, fixed telephone, cell telephone, television, radio, refrigerator, car, moped/scooter/motorcycle, washing machine, bicycle, sewing machine, almirah/wardrobe, table, bed or cot, chair or bench, watch or clock, as well as the type of main material used for the roof, wall and floor of the main house (cement, tin and katcha such as bamboo/thatched/straw).
Each asset was assigned a weight (factor score) generated through principal components analysis, and the resulting asset scores were standardized in relation to a normal distribution with a mean of zero and standard deviation of one. Each household was then assigned a score for each asset, and the scores were summed for each household; individuals were ranked according to the total score of the household in which they resided. The sample was then divided into quartiles from one (lowest) to four (highest). A single asset index was developed for the whole sample; indices were not prepared for urban and rural populations separately.
Men25 – 3435 – 4445 – 5455 – 6465 +Total
1 1721 076971585508
4 312
259 (22.1)216 (20.1)196 (20.2)119 (20.3)127(25.0)917 (21.3)
343 (29.3)257 (23.9)252 (26.0)129 (22.1)133 (26.2)
1 114 (25.8)
319 (27.2)311 (28.9)253 (26.1)158 (27.0)139 (27.4)
1 180 (27.4)
251 (21.4)292 (27.1)270 (27.8)179 (30.6)109 (21.5)
1 101 (25.5)

95Risk Factor Survey Bangladesh 2010
Table 2.1: Current smoking status (daily and non-daily) of the respondents
Women25 – 3435 – 4445 – 5455 – 6465 +Total
1 9921 455876430210
4 963
6 (0.3)14 (1.0)15 (1.7)8 (1.9)
13 (6.2)56 (1.1)
0.1, 0.70.6, 1.61.0, 2.80.9, 3.7
3.6, 10.40.9, 1.5
8 (0.4)18 (1.2)15 (1.7)10 (2.3)13 (6.2)64 (1.3)
0.2, 0.80.8, 2.01.0, 2.81.3, 4.3
3.6, 10.41.0, 1.6
Both sexes
25 – 3435 – 4445 – 5455 – 6465 +Total
3 1642 5311 8471 015718
9 275
621 (19.6)646 (25.5)576 (31.2)314 ( 30.9)199 (27.7)
2 356 (25.4)
18.3, 21.023.9, 27.329.1, 33.328.2, 33.824.6, 31.124.5, 26.3
646 (20.4)666 (26.3)585 (31.7)323 (31.8)209 (29.1)
2 429 (26.2)
19.0, 21.924.6, 28.129.6, 33.829.0, 34.825.9, 32.525.2, 27.3
Age (years) Numbern (%)
Daily smoker Daily or non daily smoker
95% CI n (%) 95% CI
Men25 – 3435 – 4445 – 5455 – 6465 +Total
1 1721 076971585508
4 312
615 (52.5)632 (58.7)561 (57.8)306 (52.3)186 (36.6)
2 300 (53.3)
49.6, 55.355.8, 61.654.6, 60.848.3, 56.332.5, 40.951.8, 54.8
638 (54.4)648 (60.2)570 (58.7)313 (53.5)196 (38.6)
2 365 (54.8)
51.6, 57.357.3, 63.155.6, 61.849.4, 57.534.4, 42.952.7, 57.1

96Risk Factor Survey Bangladesh 2010
Table 2.2: Age of initiation and duration of smoking (in years) of the daily smokers
Age(years) Number Mean 95% CI
n % 95% CI n % 95% CI n % 95% CI
Men
Number Mean 95% CI
Women*
Number Mean 95% CI
Both Sexes
Age of Initiation25 – 3435 – 4445 – 5455 – 6465 +Total
614627561306186
2 294
4121369
44
618639574312195
2 338
17.818.718.418.218.918.3
19.324.317.834.325.323.5
17.818.818.418.519.218.4
17.4, 18.118.3, 19.117.9, 18.917.5, 18.917.8, 20.118.1, 18.6
16.0, 22.520.7, 28.012.4, 23.124.3, 44.415.7, 34.920.1, 23.9
17.4, 18.118.4, 19.217.9, 18.917.8, 19.318.0, 20.518.2, 18.7
Duration of smoking (in years)25 – 3435 – 4445 – 5455 – 6465 +Total
614627561306186
2 294
4121369
44
618639574312195
2 338
11.820.530.740.453.026.0
12.815.232.822.543.727.0
11.820.430.840.152.626.0
11.4, 12.120.1, 21.030.2, 31.339.6, 41.251.6, 54.525.4, 26.5
10.9, 14.611.2, 19.127.9, 37.711.6, 33.433.5, 53.822.4, 31.5
11.4, 12.220.0, 20.930.2, 31.339.2, 40.951.1, 54.125.4, 26.6
Age of inititation at <_ 15 years
25 – 3435 – 4445 – 5455 – 6465 +Total
614627561306186
2 294
4121369
44
6186395743121952 338
211 (34.4)198 (31.6)197 (35.1)113 (36.9)77 (41.4)796 (34.7)
30.7, 38.228.1, 35.331.3, 39.231.7, 42.534.5, 48.632.8, 36.7
1 (25.0)1 (8.3)7 (53.8)1 (16.7)4 (44.4)14 (31.8)
212 (34.3)199 (31.1)204 (35.5)114 (36.5)81 (41.5)810 (34.6)
3.3, 76.31.2, 41.428.1, 77.62.3, 63.217.7, 74.919.8, 46.8
30.7, 38.127.7, 34.831.7, 39.531.4, 42.034.8, 48.632.7, 36.6
* Low prevelance among women contribute to wider intervalNote: 2 338 among the smokers responded to this questions but remaining 18 respondents (6 men and 12 women) answered as “don’t know”

97Risk Factor Survey Bangladesh 2010
Table 2.3: Distribution of daily smokers by use of smoking tobacco products
Age(years) Number n (%)
Cigarrate
95% CI n (%) 95% CI n (%) 95% CI
Biri Others
Men25-3435-4445-5455-6465+Total
615632561306186
2 300
491(79.8)446 (70.6)360 (64.2)198 (64.7)93 (50.0)
1 588 (69.0)
76.5, 82.966.9, 74.060.1, 68.159.2. 69.942.8, 57.267.1, 70.9
195 (31.7)253 (40.0)269 (48.0)155 (50.7)112 (60.2)984 (42.8)
28.1, 35.536.3, 43.943.8, 52.145.1, 56.253.1, 67.140.8, 44.8
38 (6.2)37 (5.9)37 (6.6)23 (7.5)17 (9.1)
152 (6.6)
4.5, 8.333.8, 41.3
4.8, 8.94.9, 10.95.6, 14.05.6, 7.7
Women
25-3435-4445-5455-6465+Total
614158
1356
1 (16.7)4 (28.6)0 (0.0)0 (0.0)
2 (15.4)7 (12.5)
0.8, 59.19.8, 55.50, 18.10, 31.2
2.7, 42.05.6, 23.2
3 (50.0)5 (35.7)
14 (93.3)7 (87.5)
10 (76.9)39 (69.6)
14.7, 85.314.4, 62.471.3, 99.751.9, 99.449.1, 93.856.7, 80.6
3 (50.0)5 (35.7)2 (13.3)1 (12.5)1 (7.7)
11 (19.6)
14.7, 85.314.4, 62.42.3, 37.50.6, 48.00.4, 32.5
10.8, 31.6
Both sexes
25-3435-4445-5455-6465+Total
621646576314199
2 356
492 (79.2)450 (69.7)360 (62.5)198 (63.1)95 (47.7)
1 595 (67.7)
76.0, 82.366.0, 73.158.5, 66.457.6, 68.340.9, 54.765.8, 69.6
198 (31.9)258 (39.9)283 (49.1)162 (51.6)122 (61.3)
1 023 (43.4)
28.1, 35.636.2, 43.845.0, 53.246.1, 57.154.4, 67.941.4, 45.4
41 (6.6)42 (6.5)39 (6.8)23 (7.3)18 (9.0)
163 (6.9)
4.8, 8.84.8, 8.64.9, 9.0
4.8, 10.65.6, 13.75.9, 8.0

98Risk Factor Survey Bangladesh 2010
Table 2.4: Frequency of smoking per day of the daily smokers
Age(years)
25 – 3435 – 4445 – 5455 – 6465 +Total
49144636019893
1 588
195253269155112984
3837372317
152
9.010.310.19.37.09.5
12.414.613.412.311.513.1
1.41.51.51.51.91.5
8.4, 9.69.6, 10.99.3, 10.88.1, 10.65.7, 8.29.2, 9.9
11.3, 13.613.5, 15.812.4, 14.411.0, 13.69.7, 13.3
12.6, 13.7
1.2, 1.61.3, 1.81.4, 1.71.4, 1.61.5, 2.31.4, 1.6
25 – 3435 – 4445 – 5455 – 6465 +Total
140027
35
147
1039
35201
11
10.013.0
--
5.510.4
3.74.07.14.35.25.5
1.91.80.9
-1.41.6
-3.2, 22.8
--
0.6, 10.44.2, 16.7
3.1, 4.22.9, 5.1
3.3, 11.01.9, 6.73.1, 7.33.9, 7.1
0.1, 3.60.8, 2.70.8, 1.0
--
0.9, 2.3
25 – 3435 – 4445 – 5455 – 6465 +Total
49245036019895
1 595
198258283162122
1 023
4142392318
163
9.010.310.19.36.99.5
12.314.413.111.911.012.8
1.51.51.51.51.81.5
8.4, 9.69.7, 11.09.3, 10.88.1, 10.65.7, 8.29.2, 9.9
11.1, 13.413.3, 15.612.1, 14.110.7, 13.29.3, 12.7
12.3, 13.4
1.3, 1.71.3, 1.81.3, 1.61.4, 1.61.5, 2.21.4, 1.6
*Other smoked tobaccos include hukkah/dhaba, pipes of tobacco, hand rolled cigarettes and others
Men
Women
Both Sexes
Number Mean 95% CI
Manufactured cigarettes
Number Mean 95% CI
Biris
Number Mean 95% CI
Other smoked tobaccos*

99Risk Factor Survey Bangladesh 2010
Table 2.5: Distribution of the respondents by ex-daily smoking status
Age(years) Number n (%) 95% CI
Men
Number n (%) 95% CI
Women
Number n (%) 95% CI
Both Sexes
25 – 3435 – 4445 – 5455 – 6465 +Total
1 1721 076971585508
4 312
1 9921 455876430210
4 963
3 1642 5311 8471 015718
9 275
65 (5.5)88 (8.2)
150 (15.4)152 (26.0)211 (41.5)666 (15.4)
1 (0.1)6 (0.4)7 (0.8)
13 (3.0)7 (3.3)
34 (0.7)
66 (2.1)94 (3.7)
157 (8.5)165 (16.3)218 (30.4)700 (7.5)
4.4, 7.06.7, 10.0
13.3, 17.922.6, 29.737.3, 45.914.4, 16.6
0, 0.40.2, 0.90.4, 1.71.8, 5.11.6, 6.80.5, 1.0
1.6, 2.63.0, 4.57.3, 9.9
14.1, 18.727.1, 33.8
7.0, 8.1

100Risk Factor Survey Bangladesh 2010
Table 2.6: Prevalence of current and ex-use of smokeless tobacco among all respondents
Age(years) Number
n (%)
Daily
95% CI n (%)
Daily or non daily
95% CI n (%) 95% CI
Current UserEx-daily user
Men25 – 3435 – 4445 – 5455 – 6465 +Total
1 1721 076971585508
4 312
185 (15.8)255 (23.7)309 (31.8)224 (38.3)198 (39.0)
1 171 (27.2)
13.8, 18.021.3, 26.329.0, 34.834.4, 42.334.8, 43.325.8, 28.5
215 (18.3)276 (25.7)332 (34.2)237 (40.5)208 (40.9)
1 268 (29.4)
16.2, 20.723.1, 28.331.3, 37.236.6, 44.536.7, 45.328.1, 30.8
34 (2.9)33 (3.1)48 (4.9)44 (7.5)
61 (12.0)220 (5.1)
2.1, 4.02.2, 4.33.7, 6.5
5.6, 10.09.5, 15.14.5, 5.8
Women25 – 3435 – 4445 – 5455 – 6465 +Total
1 9921 455876430210
4 963
305 (15.3)514 (35.3)428 (48.9)240 (55.8)130 (61.9)
1 617 (32.6)
13.8, 17.032.9, 37.845.6, 52.251.1, 60.455.2, 68.231.3, 33.9
327 (16.4)531 (36.5)435 (49.7)245 (57.0)132 (62.9)
1 670 (33.6)
14.9, 18.134.1, 39.046.4, 53.052.2, 61.656.1, 69.132.3, 35.0
11 (0.6)26 (1.8)24 (2.7)15 (3.5)11 (5.2)87 (1.8)
0.3, 1.01.2, 2.61.8, 4.12.1, 5.72.9, 9.21.4, 2.2
Both sexes25 – 3435 – 4445 – 5455 – 6465 +Total
3 1642 5311 8471 015718
9 275
490 (15.5)769 (30.4)737 (39.9)464 (45.7)328 (45.7)
2 788 (30.1)
14.3, 16.828.6, 32.237.7, 42.242.7, 48.842.1, 49.329.1, 31.0
542 (17.1)807 (31.9)767 (41.5)482 (47.5)340 (47.4)
2 938 (31.7)
15.9, 18.530.1, 33.739.3, 43.844.4, 50.643.7, 51.030.7, 32.6
45 (1.4)59 (2.3)72 (3.9)59 (5.8)
72 (10.0)307 (3.3)
1.1, 1.91.8, 3.03.1, 4.94.5, 7.4
8.0, 12.43.0, 3.7

101Risk Factor Survey Bangladesh 2010
Table 2.7: Frequency of use of various tobacco products by daily smokeless tobacco users
Age(years) Number Mean 95% CI Number Mean 95% CI Number Mean 95% CI Number Mean 95% CI
Jarda Sadapata Gul Other smokeless tobaccos*
Men25 – 3435 – 4445 – 5455 – 6465 +Total
164214269186161994
3267847198
352
4767714834
267
5.66.27.36.36.26.4
6.16.17.55.25.76.1
5.84.74.03.82.74.3
4.9, 6.45.5, 6.86.6, 8.05.6, 6.95.5, 7.06.1, 6.8
4.2, 8.14.8, 7.45.8, 9.14.1, 6.24.7, 6.65.5, 6.7
4.4, 7.23.9, 5.53.2, 4.82.8, 4.81.9, 3.53.8, 4.7
121721252297
1.31.41.31.31.41.3
1.1, 1.41.3, 1.41.2, 1.41.3, 1.41.3, 1.51.3, 1.4
Women25 – 3435 – 4445 – 5455 – 6465 +Total
20534323510764
954
9015718813265
632
4475753516
245
5.86.26.46.56.46.2
7.17.88.57.06.77.6
4.24.64.94.95.34.7
5.2, 6.35.8, 6.65.9, 6.95.7, 7.25.5, 7.35.9, 6.4
6.3, 7.87.0, 8.57.7, 9.36.3, 7.75.7, 7.77.2, 8.0
3.2, 5.33.8, 5.54.0, 5.83.2, 6.63.1, 7.54.2, 5.2
114309
0.30.31.01.4
-1.0
--
0.8, 1.20.4, 2.5
-0.6, 1.4
Both sexes
*Other smokeless tobaccos include snuff, khoinee and others
25 – 3435 – 4445 – 5455 – 6465 +Total
369557504293225
1 948
122224272203163984
911421468350
512
5.76.26.96.36.36.3
6.87.38.26.36.17.1
5.04.74.54.33.64.5
5.3, 6.15.8, 6.56.5, 7.35.8, 6.85.7, 6.96.1, 6.5
6.1, 7.66.6, 7.97.4, 8.95.8, 6.95.4, 6.86.7, 7.4
4.2, 5.94.1, 5.33.8, 5.13.3, 5.22.6, 4.54.2, 4.8
1318252822
106
1.21.31.31.41.41.3
1.0, 1.41.2, 1.41.2, 1.31.2, 1.51.3, 1.51.3, 1.4

102Risk Factor Survey Bangladesh 2010
Table 2.8: Distribution of daily smokeless tobacco users by use of smokeless tobacco products
Jarda Sada pata GulAge(years) Number
n (%) 95% CI n (%) 95% CI n (%) 95% CI
Men25-3435-4445-5455-6465+Total
215276332237208
1 268
164 (76.3)214 (77.5)269 (81.0)186 (78.5)161 (77.4)994 (78.4)
70.3, 81.672.3, 82.276.5, 74.972.9, 83.471.3, 82.776.1, 80.6
32 (14.9)67 (24.3)84 (25.3)71 (30.0)98 (47.1)
352 (27.8)
10.6, 20.119.5, 29.620.8, 30.224.4, 36.040.1, 53.925.4, 30.3
47 (21.9)67 (24.3)71 (21.4)48 (20.3)34 (16.3)
267 (21.1)
16.7, 27.719.5, 29.617.2, 26.015.5, 25.711.8, 21.818.9, 23.4
Women25-3435-4445-5455-6465+Total
327531435245132
1 670
205 (62.7)343 (64.6)235 (54.0)107 (43.7)64 (48.5)
954 (57.1)
57.4, 67.860.5, 68.649.3, 58.737.6, 49.940.1, 57.054.7, 59.5
90 (27.5)157 (29.6)188 (43.2)132 (53.9)65 (49.2)
632 (37.8)
22.9, 32.625.8, 33.638.6, 47.947.6, 60.140.8, 57.735.5, 40.2
44 (13.5)75 (14.1)75 (17.2)35 (14.3)16 (12.1)
245 (14.7)
10.1, 17.511.5, 17.313.9, 21.010.3, 19.17.3, 18.5
13.0, 16.4
Both sexes25-3435-4445-5455-6465+Total
542807767482340
2 938
369 (68.1)557 (69.0)504 (65.7)293 (60.8)225 (66.2)
1 948 (66.3)
64.1, 71.965.8, 72.162.3, 69.156.4, 65.161.0, 71.054.6, 68.0
122 (22.5)224 (27.8)272 (35.5)203 (42.1)163 (47.9)984 (33.5)
19.1, 26.224.8, 30.932.1, 38.937.8, 46.642.7, 53.331.8, 35.2
91 (16.8)142 (17.6)146 (19.0)83 (17.2)50 (14.7)
512 (17.4)
13.8, 20.115.1, 20.316.4, 21.914.0, 20.811.2, 18.816.1, 18.8
Others
n (%) 95% CI
12 (5.6)17 (6.2)21 (6.3)
25 (10.5)22 (10.6)97 (7.6)
3.1, 9.32.4, 7.34.1, 9.3
7.1, 14.96.9, 15.36.3, 9.2
1 (0.3)1 (0.2)4 (0.9)3 (1.2)0 (0.0)9 (0.5)
0.01, 1.50.0, 0.90.3, 2.20.3, 3.30.0, 2.40.3, 1.0
13 (2.4)18 (2.2)25 (3.3)28 (5.8)22 (6.5)
106 (3.6)
1.3, 4.01.4, 3.42.2, 4.73.9, 8.24.2, 9.52.9, 4.3

103Risk Factor Survey Bangladesh 2010
Table 2.9: Distribution of the tobacco users by combination of smoking and smokeless tobacco use
Daily either smoking orsmokeless tobacco users
Daily both smoking andsmokeless tobacco users
Current tobacco users(any type)Age
(years) Numbern (%) 95% CI n (%) 95% CI n (%) 95% CI
Men
25 – 3435 – 4445 – 5455 – 6465 +Total
1 1721 076971585508
4 312
604 (51.5)619 (57.5)552 (56.8)338 (57.8)286 (56.3)
2 399 (55.6)
48.7, 54.454.6, 60.553.7, 59.953.7, 61.751.9, 60.654.1, 57.1
123 (10.5)151 (14.0)172 (17.7)103 (17.6)61 (12.0)
610 (14.1)
8.9, 12.412.1, 16.215.4, 20.214.7, 20.99.5, 15.1
13.1, 15.2
731 (62.4)771 (71.7)726 (74.8)444 (75.9)348 (68.5)
3 020 (70.0)
59.6, 65.168.9, 74.371.9, 77.472.3, 79.264.3, 72.467.6, 72.6
Women25 – 3435 – 4445 – 5455 – 6465 +Total
1 9921 455876430210
4 963
311 (15.6)520 (35.7)427 (48.7)242 (56.3)131 (62.4)
1 631 (32.9)
14.1, 17.333.3, 38.245.4, 52.151.5, 60.955.6, 68.731.6, 34.2
23 (1.2)24 (1.6)15 (1.7)9 (2.1)7 (3.3)
78 (1.6)
0.8, 1.71.1, 2.41.0, 2.81.1, 4.01.6, 6.81.3, 2.0
334 (16.8)544 (37.4)442 (50.5)251 (58.4)138 (65.7)
1 709 (34.4)
15.2, 18.534.9, 39.947.1, 53.853.7, 62.959.0, 71.832.8, 36.1
Both sexes25 – 3435 – 4445 – 5455 – 6465 +Total
3 1642 5311 8471 015718
9 275
915 (28.9)1 139 (45.0)979 (53.0)580 (57.1)417 (58.1)
4 030 (43.5)
27.4, 30.543.1, 46.950.7, 55.354.1, 60.254.4, 61.642.4, 44.5
146 (4.6)175 (6.9)
187 (10.1)112 (11.0)
68 (9.5)688 (7.4)
3.9, 5.46.0, 8.0
8.8, 11.69.2, 13.17.5, 11.86.9, 8.0
1 065 (33.7)1 315 (52.0)1 168 (63.2)695 (68.5)486 (67.7)
4 729 (51.0)
32.0, 35.350.0, 53.961.0, 65.465.5, 71.364.2, 71.049.5, 52.5

104Risk Factor Survey Bangladesh 2010
Table 2.10: Exposure to secondhand tobacco smoke of smokers and non smokers on one or more daysin the past 7 days
Age(years) Number n (%) 95% CI
Men
Number n (%) 95% CI
Women
Number n (%) 95% CI
Both sexes
OverallIn the home
25 – 3435 – 4445 – 5455 – 6465 +Total
1 1721 076971585508
4 312
1 9921 455876430210
4 963
3 1642 5311 8471 015718
9 275
423 (36.1)352 (32.7)291 (30.0)191 (32.6)154 (30.3)
1 411 (32.7)
882 (44.3)672 (46.2)351 (40.1)140 (32.6)58 (27.6)
2 103 (42.4)
1 305 (41.2)1 024 (40.5)642 (34.8)331 (32.6)212 (29.5)
3 514 (37.9)
32.9, 39.431.2, 37.928.5, 35.330.0, 38.828.2, 37.532.4, 35.7
43.0, 48.143.0, 48.938.3, 45.728.6, 38.519.6, 32.641.4, 44.6
40.0, 44.038.8, 43.234.2, 39.230.6, 37.326.9, 34.637.6, 39.9
In the workplace25 – 3435 – 4445 – 5455 – 6465 +Total
1 1721 076971585508
4 312
1 9921 455876430210
4 963
3 1642 5311 8471 015718
9 275
422 (36.0)377 (35.0)301 (31.0)152 (26.0)102 (20.1)
1 354 (31.4)
389 (19.5)306 (21.0)146 (16.7)54 (12.6)19 (9.0)
914 (18.4)
811 (25.6)683 (27.0)447 (24.2)206 (20.3)121 (16.9)
2 268 (24.5)
32.7, 39.631.6, 38.827.6, 34.721.9, 30.316.4, 24.429.8, 33.1
17.6, 21.618.7, 23.514.1, 19.69.4, 16.45.4, 14.1
17.2, 19.9
23.9, 27.525.0, 29.122.0, 26.617.6, 23.314.0, 20.123.5, 25.5
In the home or workplace25 – 3435 – 4445 – 5455 – 6465 +Total
731771726444348
3 020
334544442251138
1 709
1 0651 3151 168695486
4 729
422 (57.7)423 (54.9)365 (50.3)217 (48.9)154 (44.3)
1 581 (52.4)
207 (62.0)310 (57.0)198 (44.8)92 (36.7)42 (30.4)
849 (49.7)
629(59.1)733(55.7)563(48.2)309(44.5)196(40.3)
2 430 (51.4)
52.4, 63.549.7, 60.445.3, 55.742.6, 55.837.5, 51.849.8, 55.0
53.8, 71.050.8, 63.738.8, 51.529.6, 45.022.0, 41.146.4, 53.1
54.5, 63.951.8, 59.944.3, 52.339.6, 49.734.9, 46.449.4, 53.5
Non smokerIn the home
25 – 3435 – 4445 – 5455 – 6465 +Total
534428401272312
1 947
1 9841 437861420197
4 899
2 5181 8651 262692509
6 846
133 (24.9)90 (21.0)74 (18.5)62 (22.8)73 (23.4)
432 (22.2)
875 (44.1)656 (45.7)342 (39.7)132 (31.4)51 (25.9)
2 056 (42.0)
1 008 (40.0)746 (40.0)416 (33.0)194 (28.0)124 (24.4)
2 488 (36.3)
20.9, 29.516.9, 25.914.5, 23.217.5, 29.226.9, 43.320.1, 24.4
42.0, 48.042.2, 49.333.6, 44.126.3, 37.329.3, 34.140.2, 43.8
37.6, 42.637.2, 43.029.9, 36.322.9, 30.720.3, 29.134.9, 37.8
In the workplace25 – 3435 – 4445 – 5455 – 6465 +Total
534428401272312
1 947
1 9841 437861420197
4 899
2 5181 8651 262692509
6 846
180 (33.7)145 (33.9)122 (30.4)62 (22.8)59 (18.9)
568 (29.2)
386 (19.5)299 (20.8)141 (16.4)50 (11.9)16 (8.1)
892 (18.2)
566 (22.5)444 (23.8)263 (20.8)112 (16.2)75 (14.7)
1 460 (21.3)
29.0, 39.028.6, 39.925.3, 36.317.5, 29.214.4, 24.426.9, 31.7
17.6, 21.518.5, 23.313.3, 19.38.8, 15.74.6, 13.2
17.0, 19.4
20.7, 24.021.6, 26.018.4, 23.513.1, 29.511.6, 18.520.3, 22.5
In the home or workplace
25 – 3435 – 4445 – 5455 – 6465 +Total
534428401272312
1 947
1 9841 437861420197
4 899
2 5181 8651 262692509
6 846
240 (44.9)181 (42.3)158 (39.4)91 (33.5)95 (30.4)
765 (39.3)
908 (45.8)680 (47.3)355 (41.2)135 (32.1)52 (26.4)
2 130 (43.5)
1 148 (45.6)861(46.2)513 (40.6)226 (32.7)147 (28.9)
2 895 (42.3)
39.4, 51.036.4, 48.933.5, 46.126.9, 41.124.6, 37.235.6. 42.4
42.8, 48.843.8, 51.036.0, 44.527.0, 38.019.7, 34.641.7, 45.4
42.9, 48.344.4, 50.737.2, 44.328.5, 37.224.4, 33.940.8, 43.9

105Risk Factor Survey Bangladesh 2010
Table 3.1: Mean number of days and servings* of fruit and vegetables consumption
Age(years) Number Mean 95% CI
Men
Number Mean 95% CI
Women
Number Mean 95% CI
Both sexes
1 9921 455876430210
4 963
3 1642 5311 8471 015718
9 275
Number of days in a typical week Fruit
25 – 3435 – 4445 – 5455 – 64
65 +Total
1 1721 076971585508
4 312
1.71.71.61.71.51.7
2.02.01.91.81.81.9
1.91.91.71.71.61.8
1.7, 1.81.6, 1.81.5, 1.71.5, 1.81.4, 1.71.6, 1.7
1.9, 2.01.9, 2.11.8, 2.11.6, 2.01.6, 2.11.9, 2.0
1.8, 1.91.8, 1.91.7, 1.81.6, 1.81.5, 1.71.8, 1.9
Vegetables25 – 3435 – 4445 – 5455 – 64
65 +Total
1 1721 076971585508
4 312
1 9921 455876430210
4 963
3 1642 5311 8471 015718
9 275
5.65.85.85.95.75.7
6.46.46.46.36.36.4
6.16.26.16.05.96.1
5.5, 5.75.7, 5.95.7, 5.95.7, 6.05.6, 5.85.7, 5.8
6.4, 6.56.3, 6.56.3, 6.56.1, 6.46.1, 6.46.4, 6.4
6.1, 6.26.1, 6.26.0, 6.15.9, 6.15.8, 6.06.1, 6.1
Fruit and / or vegetables
25 – 3435 – 4445 – 5455 – 64
65 +Total
1 1721 076971585508
4 312
1 9921 455876430210
4 963
3 1642 5311 8471 015718
9 275
3.73.83.73.83.63.7
4.24.24.24.04.14.2
4.04.03.93.93.74.0
3.6, 3.73.7, 3.83.6, 3.83.7, 3.93.5, 3.73.7, 3.7
4.1, 4.24.1, 4.34.1, 4.23.9, 4.23.9, 4.24.1, 4.2
3.9, 4.04.0, 4.13.9, 4.03.8, 4.03.7, 3.83.9, 4.0
Number of servings per day Fruit
25 – 3435 – 4445 – 5455 – 64
65 +Total
1 1721 076971585508
4 312
1 9921 455876430210
4 963
3 1642 5311 8471 015718
9 275
1.61.71.11.31.21.4
1.92.01.82.22.31.9
1.81.81.41.71.51.7
1.3, 2.01.2, 2.10.9, 1.40.9, 1.60.8, 1.61.3, 1.6
1.5, 2.21.5, 2.51.3, 2.21.3, 3.11.0, 3.51.7, 2.2
1.5, 2.01.5, 2.21.2, 1.71.2, 2.11.1, 2.01.5, 1.8
Vegetables25 – 3435 – 4445 – 5455 – 64
65 +Total
1 1721 076971585508
4 312
1 9921 455876430210
4 963
3 1642 5311 8471 015718
9 275
2.32.12.02.01.92.1
2.72.52.61.91.52.5
2.62.32.31.91.72.3
2.0, 2.72.0, 2.21.9, 2.11.9, 2.11.6, 2.22.0, 2.2
2.4, 2.92.2, 2.82.0, 3.21.7, 2.01.4, 1.62.3, 2.7
2.3, 2.82.2, 2.52.0, 2.61.8, 2.01.5, 2.02.2, 2.4
Fruit and / or vegetables25 – 3435 – 4445 – 5455 – 64
65 +Total
1 1721 076971585508
4 312
1 9921 455876430210
4 963
3 1642 5311 8471 015718
9 275
2.01.91.61.61.51.8
2.32.22.22.11.92.2
2.22.11.91.81.62.0
1.7, 2.21.6, 2.11.4, 1.71.4, 1.81.3, 1.81.7, 1.9
2.1, 2.51.9, 2.61.8, 2.61.6, 2.51.3, 2.52.1, 2.8
2.0, 2.31.9, 2.31.6, 2.01.6, 2.01.4, 1.91.9, 2.1
*One standard serving = 80 grams• For raw green leafy vegetables, 1 serving = one cup• For cooked or chopped vegetables, 1 serving = ½ cup• For fruit (Apple, banana, orange), 1 serving = 1 medium size piece• For chopped, cooked and canned fruit, 1 serving = ½ cup • For juice from fruit, 1 serving = ½ cup

106Risk Factor Survey Bangladesh 2010
Tabl
e 3.
2: F
ruit
cons
umpt
ion
of th
e re
spon
dent
s on
an
aver
age
day
( in
serv
ings
)
Age
(yea
rs)
Num
ber
n (%
)95
% C
I
No fr
uit
n (%
)95
% C
I
Up to
1 se
rvin
g
n (%
)95
% C
I
2 se
rvin
gs
n (%
)95
% C
I
3 se
rvin
gs
n (%
)95
% C
I
4 se
rvin
gs
n (%
)95
% C
I
<5 se
rvin
gs
n (%
)95
% C
I
51.1
, 56.
850
.8, 5
6.8
46.3
, 52.
647
.9, 5
6.0
46.2
, 54.
950
.7, 5
3.7
179
(15.
3)14
1 (1
3.1)
132
(13.
6)71
(12.
1)61
(12.
0)58
4 (1
3.5)
13.3
, 17.
411
.2, 1
5.3
11.6
, 15.
99.
7, 1
5.0
9.5,
15.
112
.6, 1
4.6
61 (5
.2)
43 (4
.0)
36 (3
.7)
24 (4
.1)
15 (3
.0)
179
(4.2
)
4.1,
6.6
3.0,
5.3
2.7,
5.1
2.8,
6.0
1.8,
4.8
3.6,
4.8
21 (1
.8)
24 (2
.2)
22 (2
.3)
13 (2
.2)
8 (1
.6)
88 (2
.0)
1 15
6 (9
8.6)
1 05
7 (9
8.2)
959
(98.
8)57
8 (9
8.8)
500
(98.
4)4
250
(98.
6)
97.8
, 99.
297
.2, 9
8.9
97.8
, 99.
397
.5, 9
9.4
96.9
, 99.
298
.2, 9
8.9
16 (1
.4)
19 (1
.8)
12 (1
.2)
7 (1
.2)
8 (1
.6)
62 (1
.4)
0.8,
2.2
1.1,
2.8
0.7,
2.2
0.6,
2.5
0.8,
3.1
1.1,
1.8
1.2,
2.7
1.5,
3.3
1.5,
3.4
1.3,
3.8
0.8,
3.1
1.7,
2.5
Men
25 –
34
35 –
44
45 –
54
55 –
64
65 +
Tota
l
1 17
21
076
971
585
508
4 31
2
632
(53.
9)57
9 (5
3.8)
480
(49.
4)30
4 (5
2.0)
257
(50.
6)2
252
(52.
2)
263
(22.
4)27
0 (2
5.1)
289
(29.
8)16
6 (2
8.4)
159
(31.
3)1
147
(26.
6)
20.1
, 24.
922
.6, 2
7.8
27.0
, 32.
724
.9, 3
2.2
27.4
, 35.
525
.3, 2
7.9
45.9
, 50.
244
.4, 4
9.5
45.1
, 51.
743
.2, 5
2.6
35.9
, 49.
246
.1, 4
9.8
338
(17.
0)27
5 (1
8.9)
142
(16.
2)63
(14.
7)34
(16.
2)85
2 (1
7.2)
15.4
, 18.
717
.0, 2
1.0
13.9
, 18.
811
.6, 1
8.3
11.8
, 21.
816
.1, 1
8.2
83 (4
.2)
57 (3
.9)
35 (4
.0)
17 (4
.0)
13 (6
.2)
205
(4.1
)
3.4,
5.1
3.0,
5.0
2.9,
5.5
2.5,
6.3
3.6,
10.
43.
6, 4
.7
26 (1
.3)
21 (1
.4)
17 (1
.9)
2 (0
.5)
5 (2
.4)
71 (1
.4)
1 93
5 (9
7.1)
1 41
2 (9
7.0)
849
(96.
9)41
8 (9
7.2)
201
(95.
7)4
815
(97.
0)
96.3
, 97.
896
.0, 9
7.8
95.5
, 97.
995
.2, 9
8.4
92.0
, 97.
896
.5, 9
7.5
57 (2
.9)
43 (3
.0)
27 (3
.1)
12 (2
.8)
9 (4
.3)
148
(3.0
)
2.2,
3.7
2.2,
4.0
2.1,
4.5
1.6,
4.8
2.2,
8.0
2.5,
3.5
0.9,
1.9
0.9,
2.2
1.2,
3.1
0.1,
1.8
1.0,
5.6
1.1,
1.8
Wom
en 25 –
34
35 –
44
45 –
54
55 –
64
65 +
Tota
l
1 99
21
455
876
430
210
4 96
3
957
(48.
0)68
3 (4
6.9)
424
(48.
4)20
6 (4
7.9)
89 (4
2.4)
2 35
9 (4
7.5)
531
(26.
7)37
6 (2
5.8)
231
(26.
4)13
0 (3
0.2)
60 (2
8.6)
1 32
8 (2
6.8)
24.8
, 28.
623
.7, 2
8.2
23.6
, 29.
426
.1, 3
4.7
22.9
, 35.
025
.5, 2
8.0
48.5
, 52.
047
.9, 5
1.8
46.7
, 51.
247
.2, 5
3.3
44.6
, 51.
848
.7, 5
0.7
517
(16.
3)41
6 (1
6.4)
274
(14.
8)13
4 (1
3.2)
95 (1
3.2)
1 43
6 (1
5.5)
15.1
, 17.
715
.0, 1
7.9
13.3
, 16.
511
.3, 1
5.4
10.9
, 15.
914
.8, 1
6.2
144
(4.6
)10
0 (4
.0)
71 (3
.8)
41 (4
.0)
28 (3
.9)
384
(4.1
)
3.9,
5.3
3.3,
4.8
3.1,
4.8
3.0,
5.4
2.7,
5.6
3.8,
4.6
47 (1
.5)
45 (1
.8)
39 (2
.1)
15 (1
.5)
13 (1
.8)
159
(1.7
)
3 09
1 (9
7.7)
2 46
9 (9
7.6)
1 80
8 (9
7.9)
996
(98.
1)70
1 (9
7.6)
9 06
5 (9
7.7)
97.1
, 98.
296
.9, 9
8.1
97.1
, 98.
597
.1, 9
8.8
96.2
, 98.
597
.4, 9
8.0
73 (2
.3)
62 (2
.4)
39 (2
.1)
19 (1
.9)
17 (2
.4)
210
(2.3
)
1.8,
2.9
1.9,
3.1
1.5,
2.9
1.2,
2.9
1.5,
3.8
2.0,
2.6
1.1,
2.0
1.3,
2.4
1.5,
2.9
0.9,
2.4
1.1,
3.1
1.5,
2.0
Both
sexe
s25
– 3
435
– 4
445
– 5
455
– 6
465
+To
tal
3 16
42
531
1 84
71
015
718
9 27
5
1 58
9 (5
0.2)
1 26
2 (4
9.9)
904
(48.
9)51
0 (5
0.2)
346
(48.
2)4
611
(49.
7)
794
(25.
1)64
6 (2
5.5)
520
(28.
2)29
6 (2
9.2)
219
(30.
5)2
475
(26.
7)
23.6
, 26.
623
.9, 2
7.3
26.1
, 30.
226
.4, 3
2.0
27.2
, 34.
025
.8, 2
7.6
>_5 se
rvin
gs

107Risk Factor Survey Bangladesh 2010
Tabl
e 3.
3: V
eget
able
s co
nsum
ptio
n of
the
resp
onde
nts
on a
n av
erag
e da
y ( i
n se
rvin
gs)
43.7
, 49.
443
.8, 4
9.7
43.1
, 49.
446
.6, 5
4.6
55.3
, 63.
847
.1, 5
0.1
330
(28.
2)27
7 (2
5.7)
292
(30.
1)15
9 (2
7.2)
108
(21.
3)1
166
(27.
0)
25.7
, 30.
823
.2, 2
8.4
27.3
, 33.
023
.7, 3
0.9
17.9
, 25.
025
.7, 2
8.4
163
(13.
9)16
0 (1
4.9)
128
(13.
2)62
(10.
6)56
(11.
0)56
9 (1
3.2)
12.0
, 16.
012
.9, 1
7.1
11.2
, 15.
58.
3, 1
3.4
8.6,
14.
112
.2, 1
4.2
76 (6
.5)
73 (6
.8)
52 (5
.4)
38 (6
.5)
24 (4
.7)
263
(6.1
)
1 12
0 (9
5.6)
1 01
7 (9
4.5)
926
(95.
4)55
6 (9
5.0)
495
(97.
4)4
114
(95.
4)
94.2
, 96.
693
.0, 9
5.7
93.8
, 96.
593
.0, 9
6.5
95.6
, 98.
594
.7, 9
6.0
52 (4
.4)
59 (5
.5)
45 (4
.6)
29 (5
.0)
13 (2
.6)
198
(4.6
)
3.4,
5.8
4.3,
7.0
3.5,
6.2
3.5,
7.0
1.5,
4.4
4.0,
5.3
5.2,
8.0
5.4,
8.5
4.1,
7.0
4.8,
8.8
3.2,
7.0
5.4,
6.9
Men
25 –
34
35 –
44
45 –
54
55 –
64
65 +
Tota
l
1 17
21
076
971
585
508
4 31
2
545
(46.
5)50
3 (4
6.7)
449
(46.
2)29
6 (5
0.6)
303
(59.
6)2
096
(48.
6)
6 (0
.5)
4 (0
.4)
5 (0
.5)
1 (0
.2)
4 (0
.8)
20 (0
.5)
0.2,
1.1
0.1,
1.0
0.2,
1.2
0.0,
1.2
0.3,
2.1
0.3,
0.7
38.5
, 42.
839
.6, 4
4.7
39.0
, 45.
543
.9, 5
3.3
55.6
, 68.
741
.6, 4
4.3
555
(27.
9)40
6 (2
7.9)
264
(30.
1)12
5 (2
9.1)
50 (2
3.8)
1 40
0 (2
8.2)
25.9
, 29.
925
.7, 3
0.3
27.2
, 33.
325
.0, 3
3.5
18.5
, 30.
027
.0, 2
9.5
379
(19.
0)28
9 (1
9.9)
158
(18.
0)71
(16.
5)27
(12.
9)92
4 (1
8.6)
17.4
, 20.
817
.9, 2
2.0
15.6
, 20.
713
.3, 2
0.3
9.0,
18.
117
.6, 1
9.7
94 (4
.7)
74 (5
.1)
40 (4
.6)
14 (3
.3)
2 (1
.0)
224
(4.5
)
1 83
7 (9
2.2)
1 38
3 (9
5.1)
834
(95.
2)41
9 (9
7.4)
210
(100
.0)
4 68
3 (9
4.4)
91.0
, 93.
393
.8, 9
6.1
93.6
, 96.
495
.4, 9
8.6
-93
.7, 9
5.0
155
(7.8
)72
(4.9
)42
(4.8
)11
(2.6
)0
(0)
280
(5.6
)
6.7,
9.0
3.9,
6.2
3.6,
6.4
1.4,
4.6
-5.
0, 6
.3
3.9,
5.7
4.1,
6.3
3.4,
6.2
1.9,
5.4
0.2,
3.7
4.0,
5.1
Wom
en 25 –
34
35 –
44
45 –
54
55 –
64
65 +
Tota
l
1 99
21
455
876
430
210
4 96
3
809
(40.
6)61
3 (4
2.1)
370
(42.
2)20
9 (4
8.6)
131
(62.
4)2
132
(43.
0)
0 (0
)1
(0.1
)2
(0.2
)0
(0)
0 (0
)3
(0.1
)
-0.
0, 0
.50.
1, 0
.9- -
0.0,
0.2
41.1
, 44.
542
.2, 4
6.0
42.1
, 46.
646
.7, 5
2.8
56.8
, 64.
044
.6, 4
6.6
885
(28.
0)68
3 (2
7.0)
556
(30.
1)28
4 (2
8.0)
158
(22.
0)2
566
(27.
7)
26.4
, 29.
625
.3, 2
8.7
28.1
, 32.
225
.3, 3
0.8
19.1
, 25.
226
.8, 2
8.6
542
(17.
1)44
9 (1
7.7)
286
(15.
5)13
3 (1
3.1)
83 (1
1.6)
1 49
3 (1
6.1)
15.9
, 18.
516
.3, 1
9.3
13.9
, 17.
211
.2, 1
5.3
9.4,
14.
115
.4, 1
6.9
170
(5.4
)14
7 (5
.8)
92 (5
.0)
52 (5
.1)
26 (3
.6)
487
(5.3
)
2 95
7 (9
3.5)
2 40
0 (9
4.8)
1 76
0 (9
5.3)
975
(96.
1)70
5 (9
8.2)
8 79
7 (9
4.8)
92.5
, 94.
393
.9, 9
5.6
94.2
, 96.
294
.7, 9
7.1
96.9
, 98.
994
.4, 9
5.3
207
(6.5
)13
1 (5
.2)
87 (4
.7)
40 (3
.9)
13 (1
.8)
478
(5.2
)
5.7,
7.5
4.4,
6.1
3.8,
5.8
2.9,
5.3
1.1,
3.1
4.7,
5.6
4.6,
6.2
5.0,
6.8
4.1,
6.1
3.9,
6.7
2.5,
5.3
4.8,
5.7
Both
sex
es25
– 3
435
– 4
445
– 5
455
– 6
465
+To
tal
3 16
42
531
1 84
71
015
718
9 27
5
1 35
4 (4
2.8)
1 11
6 (4
4.1)
819
(44.
3)50
5 (4
9.8)
434
(60.
4)4
228
(45.
6)
6 (0
.2)
5 (0
.2)
7 (0
.4)
1 (0
.1)
4 (0
.6)
23 (0
.2)
0.1,
0.4
0.1,
0.5
0.2,
0.8
0.0,
0.7
0.2,
1.5
0.2,
0.4
Age
(yea
rs)Nu
mbe
rn
(%)
95%
CI
No v
eget
able
s
n (%
)95
% C
I
Up to
1 se
rvin
g
n (%
)95
% C
I
2 se
rvin
gs
n (%
)95
% C
I
3 se
rvin
gs
n (%
)95
% C
I
4 se
rvin
gs
n (%
)95
% C
I
<5 se
rvin
gs
n (%
)95
% C
I
>_5 se
rvin
gs

108Risk Factor Survey Bangladesh 2010
65.8
, 71.
167
.2, 7
2.6
68.4
, 74.
170
.1, 7
7.2
74.8
, 81.
970
.1, 7
2.8
237
(20.
2)19
3 (1
7.9)
193
(19.
9)87
(14.
9)59
(11.
6)76
9 (1
7.8)
18.0
, 22.
615
.8, 2
0.3
17.5
, 22.
512
.2, 1
8.0
9.1,
14.
716
.7, 1
9.0
72 (6
.1)
66 (6
.1)
36 (3
.7)
35 (6
.0)
32 (6
.3)
241
(5.6
)
4.9,
7.7
4.8,
7.7
2.7,
5.1
4.3,
8.2
4.5,
8.8
4.9,
6.3
31 (2
.6)
30 (2
.8)
22 (2
.3)
15 (2
.6)
9 (1
.8)
107
(2.5
)
1 14
6 (9
7.8)
1 04
4 (9
7.0)
946
(97.
4)57
0 (9
7.4)
501
(98.
6)4
207
(97.
6)
96.8
, 98.
595
.8, 9
7.9
96.2
, 98.
395
.8, 9
8.4
97.1
, 99.
397
.1, 9
8.0
26 (2
.2)
32 (3
.0)
25 (2
.6)
15 (2
.6)
7 (1
.4)
105
(2.4
)
1.5,
3.2
2.1,
4.2
1.7,
3.8
1.6,
4.2
0.7,
2.9
2.0,
2.9
1.9,
3.7
2.0,
4.0
1.5,
3.4
1.6,
4.2
0.9,
3.4
2.1,
3.0
Men
25 –
34
35 –
44
45 –
54
55 –
64
65 +
Tota
l
1 17
21
076
971
585
508
4 31
2
803
(68.
5)75
3 (7
0.0)
693
(71.
4)43
2 (7
3.8)
399
(78.
5)3
080
(71.
4)
3 (0
.3)
2 (0
.2)
2 (0
.2)
1 (0
.2)
2 (0
.4)
10 (0
.2)
0.1,
0.8
0.0,
0.7
0.1,
0.8
0.0,
1.2
0.1,
1.6
0.1,
0.4
64.0
, 68.
263
.6, 6
8.4
64.5
, 70.
769
.8, 7
8.1
67.9
, 79.
766
.1, 6
8.7
430
(21.
6)34
1 (2
3.4)
195
(22.
3)79
(18.
4)40
(19.
0)1
085
(21.
9)
19.8
, 23.
421
.3, 2
5.7
19.6
, 25.
115
.0, 2
2.3
14.3
, 24.
920
.7, 2
3.0
78 (3
.9)
71 (4
.9)
36 (4
.1)
13 (3
.0)
8 (3
.8)
206
(4.2
)
3.1,
4.9
3.9,
6.1
3.0,
5.6
1.8,
5.1
1.9,
7.4
3.6,
4.7
10 (0
.5)
13 (0
.9)
7 (0
.8)
3 (0
.7)
1 (0
.5)
34 (0
.7)
1 83
5 (9
2.1)
1 38
7 (9
5.3)
831
(94.
9)41
4 (9
6.3)
205
(97.
6)4
672
(94.
1)
90.9
, 93.
294
.1, 9
6.3
93.2
, 96.
194
.0, 9
7.7
94.4
, 99.
093
.4, 9
4.8
157
(7.9
)68
(4.7
)45
(5.1
)16
(3.7
)5
(2.4
)29
1 (5
.9)
6.8,
9.1
3.7,
5.9
3.9,
6.8
2.3,
6.0
1.0,
5.6
5.2,
6.6
0.3,
0.9
0.5,
1.5
0.4,
1.7
0.2,
5.1
0.1,
3.3
0.5,
1.0
Wom
en 25 –
34
35 –
44
45 –
54
55 –
64
65 +
Tota
l
1 99
21
455
876
430
210
4 96
3
1 31
7 (6
6.1)
961
(66.
0)59
3 (6
7.7)
319
(74.
2)15
6 (7
4.3)
3 34
6 (6
7.4)
0 (0
)1
(0.1
)0
(0)
0 (0
)0
(0)
1 (0
)
-0.
0, 0
.5- - -
0.0,
0.1
65.3
, 68.
665
.9, 6
9.5
67.5
, 71.
771
.2, 7
6.6
74.1
, 80.
268
.3, 7
0.2
667
(21.
1)53
4 (2
1.1)
388
(21.
0)16
6 (1
6.4)
99 (1
3.8)
1 85
4 (2
0.0)
19.7
, 22.
519
.6, 2
2.7
19.2
, 22.
914
.2, 1
8.8
11.5
, 16.
519
.2, 2
0.8
150
(4.7
)13
7 (5
.4)
72 (3
.9)
48 (4
.7)
40 (5
.6)
447
(4.8
)
4.1,
5.5
4.6,
6.4
3.1,
4.9
3.6,
6.2
4.1,
7.5
4.4,
5.3
41 (1
.3)
43 (1
.7)
29 (1
.6)
18 (1
.8)
10 (1
.4)
141
(1.5
)
2 98
1 (9
4.2)
2 43
1 (9
6.0)
1 77
7 (9
6.2)
984
(96.
9)70
6 (9
8.3)
8 87
9 (9
5.7)
93.3
, 95.
095
.2, 9
6.7
95.2
, 97.
095
.7, 9
7.8
97.1
, 99.
095
.3, 9
6.1
183
(5.8
)10
0 (4
.0)
70 (3
.8)
31 (3
.1)
12 (1
.7)
396
(4.3
)
5.0,
6.7
3.3,
4.8
3.0,
4.8
2.2,
4.3
1.0,
2.9
3.9,
4.7
1.0,
1.8
1.3,
2.3
1.1,
2.3
1.1,
2.8
0.8,
2.6
1.3,
1.8
Both
sexe
s25
– 3
435
– 4
445
– 5
455
– 6
465
+To
tal
3 16
42
531
1 84
71
015
718
9 27
5
2 12
0 (6
7.0)
1 71
4 (6
7.7)
1 28
6 (6
9.6)
751
(74.
0)55
5 (7
7.3)
6 42
6 (6
9.3)
3 (0
.1)
3 (0
.1)
2 (0
.1)
1 (0
.1)
2 (0
.3)
11 (0
.1)
0.0,
0.3
0.0,
0.4
0.0,
0.4
0.0,
0.7
0.1,
1.1
0.1,
0.2
Age
(yea
rs)
Num
ber
n (%
)95
% C
I
No fr
uit or
vege
tabl
es
n (%
)95
% C
I
Up to
1 se
rvin
g
n (%
)95
% C
I
2 se
rvin
gs
n (%
)95
% C
I
3 se
rvin
gs
n (%
)95
% C
I
4 se
rvin
gs
n (%
)95
% C
I
<5 se
rvin
gs
n (%
)95
% C
I
>_5 se
rvin
gs
Tabl
e 3.
4: C
onsu
mpt
ion
of fr
uit a
nd/o
r veg
etab
les
on a
n av
erag
e da
y (in
ser
ving
s)

109Risk Factor Survey Bangladesh 2010
Table 4.1: Time (in minutes) spent in work, transport and leisure-related physical activity on an average day*
Work-related physical activity
25 – 3435 – 4445 – 5455 – 6465 +Total
1 1721 076971585508
4 312
0, 3680, 3420, 3600, 2570, 86
0, 317
030000
21418720314074
178
1 9921 455876430210
4 963
0, 600, 810, 600, 260, 4
0, 60
154111129430
90
6370634331
61.8
3 1642 5311 8471 015718
9 275
1191201379961
116
17213000
15
0, 1800, 1800, 2290, 1540, 43
0, 180
Age(years)
Men
Number Mean Median IQR**
Women
Number Mean Median IQR
Both sexes
Number Mean Median IQR
*Total physical activity include work over 10 minutes at strech moderate or vigorous that make people feel palpitation and breathlessness ( for detail see appendix D: glossary of terms) done at work, during travel or at leisure**IQR - Inter Quartile Range
Transport-related physical activity25 – 3435 – 4445 – 5455 – 6465 +Total
1 1721 076971585508
4 312
17, 11010, 12013, 1204, 1090, 60
10, 110
000000
7271
111645177
1 9921 455876430210
4 963
0, 140, 170, 130, 4
-0, 13
514551503045
181817147
17
3 1642 5311 8471 015718
9 275
384166433845
99
13139
10
0, 450, 600, 600, 600, 600, 60
Leisure-related physical activity25 – 3435 – 4445 – 5455 – 6465 +Total
1 1721 076971585508
4 312
0, 00, 00, 00, 00, 00, 0
000000
1312141211
12.7
1 9921 455876430210
4 963
0, 00, 00, 00, 00, 00, 0
000000
162122208
19
3 1642 5311 8471 015718
9 275
151818161016
000000
0, 00, 00, 00, 00, 00, 0
Total physical activity25 – 3435 – 4445 – 5455 – 6465 +Total
1 1721 076971585508
4 312
90.0, 473.660.0, 434.381.4, 447.951.4, 347.912.9, 188.660.0, 420.0
263434150
30
299271327216136268
1 9921455876430210
4 963
0, 120.02.9, 154.30, 130.2
0, 900, 25.7
0, 126.0
25220622315061
189
971101017746
97.5
3 1642 5311 8471 015718
9 275
172178220157109177
7186
116693179
8.6, 269.815.0, 291.421.4, 317.18.6, 252.90.0, 150.0
10.0, 270.0

110Risk Factor Survey Bangladesh 2010
Table 4.2: Prevalence of no work, transport and leisure related physical activity
Age(years) Number n (%) 95% CI
Men
Number n (%) 95% CI
Women
Number n (%) 95% CI
Both sexes
1 9921 455876430210
4 963
3 1642 5311 8471 015718
9 275
Work-related physical activity
25 – 3435 – 4445 – 5455 – 6465 +Total
1 1721 076971585508
4 312
338 (28.8)355 (33.0)290 (29.9)245 (41.9)301 (59.3)
1 529 (35.5)
1 071 (53.8)721 (49.6)484 (55.3)275 (64.0)156 (74.3)
2 707 (54.5)
1 409 (44.5)1 076 (42.5)774 (41.9)520 (51.2)457 (63.6)
4 236 (45.7)
26.3, 31.530.2, 35.927.1, 32.837.9, 45.945.9, 63.434.0, 36.9
51.6, 55.947.0, 52.151.9, 58.559.3, 68.467.9, 79.753.2, 55.9
42.8, 46.340.6, 44.439.7, 44.248.2, 54.360.1, 67.144.7, 46.7
1 9921 455876430210
4 963
3 1642 5311 8471 015718
9 275
Transport-related physical activity25 – 3435 – 4445 – 5455 – 6465 +Total
1 1721 076971585508
4 312
201 (17.2)232 (21.6)186 (19.2)139 (23.8)167 (32.9)925 (21.5)
1 267 (66.6)878 (60.3)581 (66.3)306 (71.2)173 (82.4)
3 205 (64.6)
1 468 (46.4)1 110 (43.9)767 (41.5)445 (43.8)340 (47.4)
4 130 (44.5)
15.1, 19.419.2, 24.116.8, 21.820.5, 27.428.9, 37.120.3, 22.7
61.5, 65.757.8, 62.863.1, 69.462.7, 75.276.6, 87.063.2, 65.9
44.7, 48.141.9, 45.839.3, 43.840.8, 46.933.7, 51.043.5, 45.5
1 9921 455876430210
4 963
3 1642 5311 8471 015718
9 275
Leisure-related physical activity
25 – 3435 – 4445 – 5455 – 6465 +Total
1 1721 076971585508
4 312
974 (83.1)910 (84.6)812 (83.6)494 (84.4)446 (87.8)
3 636 (84.3)
1 632 (81.9)1 145 (78.7)663 (75.7)338 (78.6)181 (86.2)
3 959 (79.8)
2 606 (82.4)2 055 (81.2)1 475 (79.9)832 (82.0)627 (87.3)
7 595 (81.9)
80.9, 85.182.3, 86.681.2, 85.881.3, 87.284.7, 90.483.2, 85.4
80.2, 83.676.5, 80.772.7, 78.474.5, 82.280.8, 90.278.6, 80.9
81.0, 83.779.6, 82.778.0, 81.679.5, 84.284.7, 89.681.1, 82.7

111Risk Factor Survey Bangladesh 2010
Table 4.3: Proportion of work, transport and leisure activity contributing to total activity
Age(years) Number
(%) 95% CI
Activity from work
(%) 95% CI
Activity from transport
(%) 95% CI
Activity during leisure
4.7, 7.0 5.5, 8.3 4.9, 7.6 5.5, 9.4
6.7, 12.2 6.1, 7.5
5.86.96.37.49.56.8
Men25 – 3435 – 4445 – 5455 – 6465 +Total
1 112990917526402
3 947
58.856.657.351.538.454.7
35.436.636.441.152.138.5
56.2, 61.453.8, 59.354.5, 60.247.5, 55.434.0, 42.953.3, 56.1
32.9, 37.933.9, 39.233.6, 39.237.3, 44.947.6, 56.737.2, 39.9
15.1, 19.5 16.5, 21.5 20.0, 27.1 20.9, 31.9 12.3, 31.0 18.4, 21.3
17.319.023.526.421.719.9
Women25 – 3435 – 4445 – 5455 – 6465 +Total
1 3871 10461526487
3 457
59.558.556.551.257.557.9
23.222.519.922.420.822.2
56.8, 62.255.6, 61.552.6, 60.545.2, 57.246.4, 68.656.2, 59.6
21.0, 25.320.2, 24.817.1, 22.817.9, 26.912.1, 29.620.9, 23.5
10.9, 13.6 11.8, 14.8 11.7, 15.1 11.7, 16.6 8.8, 14.4
12.2, 13.7
12.213.313.414.211.613.0
Both sexes25 – 3435 – 4445 – 5455 – 6465 +Total
2 4992 0941 532790489
7 404
59.257.657.051.441.856.2
28.629.129.634.546.630.9
57.3, 61.155.6, 59.654.7, 59.448.1, 54.737.6, 46.055.1, 57.3
26.9, 30.227.3, 30.927.5, 31.731.5, 37.542.4, 50.929.9, 31.8

112Risk Factor Survey Bangladesh 2010
Table 4.4: Prevalence of non-engagement into vigorous or at least moderate physical activityirrespective of duration
Age(years) Number n (%) 95% CI
Men
Number n (%) 95% CI
Women
Number n (%) 95% CI
Both sexes
1 9921 455876430210
4 963
3 1642 5311 8471 015718
9 275
Vigorous physical activity
25 – 3435 – 4445 – 5455 – 6465 +Total
1 1721 076971585508
4 312
590 (47.3)574 (51.0)525 (51.9)391 (64.3)417 (81.7)
2 490 (55.9)
1 439 (68.5)938 (59.1)631 (66.6)340 (75.8)188 (89.3)
3 536 (67.1)
2 029 (60.6)1 512 (55.6)1 156 (58.9)731 (69.3)605 (83.9)
6 033 (61.8)
44.0, 50.747.5, 54.448.2, 55.559.7, 68.677.6, 85.254.2, 57.6
66.0, 70.956.1, 62.162.9, 70.270.8, 80.283.3, 93.365.5, 68.6
58.6, 62.653.4, 57.956.3, 61.565.9, 72.580.6, 86.760.7, 63.0
1 9921 455876430210
4 963
3 1642 5311 8471 015718
9 275
At least moderate physical activity
25 – 3435 – 4445 – 5455 – 6465 +Total
1 1721 076971585508
4 312
256 (21.1)291 (25.2)226 (22.7)191 (31.8)264 (49.0)
1 228 (27.5)
815 (38.4)513 (31.2)329 (34.6)203 (43.8)135 (63.4)
1 995 (37.3)
1 071 (32.0)804 (28.6)555 (28.4)394 (37.0)399 (53.1)
3 223 (32.7)
18.5, 24.022.3, 28.319.8, 25.927.6, 36.244.2, 53.926.0, 29.1
36.0, 40.928.6, 33.931.2, 38.238.7, 49.155.7, 70.535.7, 38.8
30.1, 33.926.7, 30.626.1, 30.833.7, 40.449.0, 57.231.6, 33.8
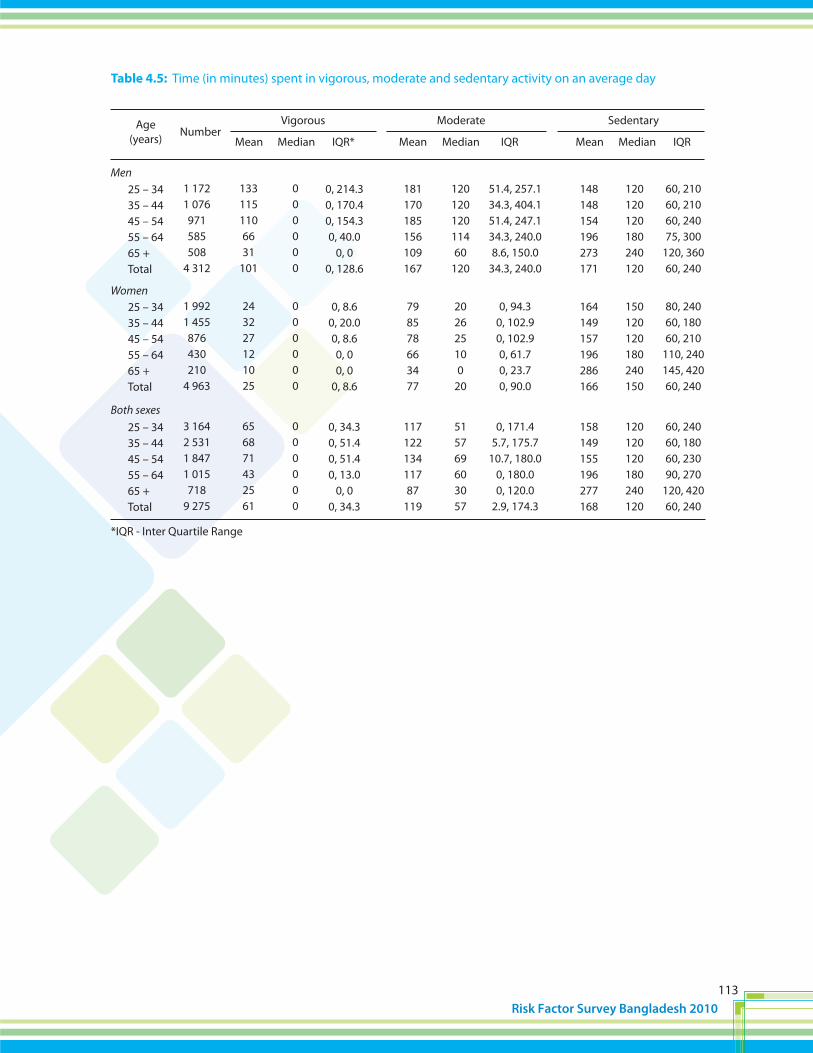
113Risk Factor Survey Bangladesh 2010
Table 4.5: Time (in minutes) spent in vigorous, moderate and sedentary activity on an average day
Age(years)
NumberMean Median IQR*
*IQR - Inter Quartile Range
Vigorous
Mean Median IQR
Moderate
Mean Median IQR
Sedentary
0, 214.30, 170.40, 154.30, 40.0
0, 00, 128.6
148148154196273171
Men25 – 3435 – 4445 – 5455 – 6465 +Total
1 1721 076971585508
4 312
1331151106631
101
181170185156109167
120120120180240120
000000
51.4, 257.134.3, 404.151.4, 247.134.3, 240.08.6, 150.0
34.3, 240.0
12012012011460
120
60, 21060, 21060, 24075, 300
120, 36060, 240
0, 8.60, 20.00, 8.60, 00, 0
0, 8.6
164149157196286166
Women25 – 3435 – 4445 – 5455 – 6465 +Total
1 9921 455876430210
4 963
243227121025
798578663477
150120120180240150
000000
0, 94.30, 102.90, 102.90, 61.70, 23.70, 90.0
202625100
20
80, 24060, 18060, 210
110, 240145, 42060, 240
0, 34.30, 51.40, 51.40, 13.0
0, 00, 34.3
158149155196277168
Both sexes25 – 3435 – 4445 – 5455 – 6465 +Total
3 1642 5311 8471 015718
9 275
656871432561
11712213411787
119
120120120180240120
000000
0, 171.45.7, 175.7
10.7, 180.00, 180.00, 120.0
2.9, 174.3
515769603057
60, 24060, 18060, 23090, 270
120, 42060, 240

114Risk Factor Survey Bangladesh 2010
Table 4.6: Distribution of the respondents by total (combination of work, transportation and leisure)physical activity categories*
Age(years) Number
n (%) 95% CI
Low
n (%) 95% CI
Moderate
n (%) 95% CI
High
76.5, 87.071.0, 82.073.9, 85.264.9, 78.845.5, 58.272.3, 77.5
957 (81.7)819 (76.1)771 (76.1)419 (71.6)262 (51.6)
3 228 (74.9)
Men25 – 3435 – 4445 – 5455 – 6465 +Total
1 1721 076971585508
4 312
83 (7.1)110 (10.2)
63 (6.5)67 (11.5)
130 (25.6)453 (10.5)
132 (11.3)147 (13.7)137 (14.1)99 (16.9)
116 (22.8)631 (14.6)
5.6, 8.78.4, 12.34.9, 8.3
8.8, 14.521.3, 30.39.5, 11.5
9.4, 13.311.5, 16.111.8, 16.713.7, 20.618.8, 27.413.5, 15.8
30.6, 35.735.5, 41.930.6, 38.523.3, 33.69.6, 20.4
32.1, 35.4
659 (33.1) 562 (38.6)301 (34.4)121 (28.1)30 (14.3)
1 673 (33.7)
Women25 – 3435 – 4445 – 5455 – 6465 +Total
1 9921 455876430210
4 963
825 (41.4)511 (35.1)352 (40.2)216 (50.2)147 (70.0)
2 051 (41.3)
508 (25.5)382 (26.3)223 (25.5)93 (21.6)33 (15.7)
1 239 (25.0)
38.6, 44.332.1, 38.336.1, 44.643.7, 57.459.1, 82.239.6, 43.1
23.3, 27.823.7, 29.022.2, 29.017.5, 26.510.8, 22.023.6, 26.4
48.6, 53.651.7, 57.554.6, 61.648.8, 57.836.1, 45.651.4, 54.3
1 616 (33.0)1 381 (28.2)1 072 (21.9)540 (11.0)292 (6.0)
4 901 (52.8)
Both sexes25 – 3435 – 4445 – 5455 – 6465 +Total
3 1642 5311 8471 015718
9 275
908 (36.3)621 (24.8)415 (16.6)283 (11.3)277 (11.1)
2 504 (27.0)
640 (34.2)529 (28.3)360 (19.3)192 (10.3)149 (8.0)
1 870 (20.2)
26.8, 30.622.6, 26.520.4, 24.724.7, 31.334.1, 43.425.9, 28.1
18.7, 21.919.2, 22.717.5, 21.616.3, 21.817.5, 24.419.3, 21.1
*High: A person achieving a minimum of at least 3 000 MET-minutes per weekModerate: A person not meeting the criteria for the "high" category, but achieving a minimum of at least 600 MET-minutes per weekLow: A person not meeting any of the above mentioned criteria falls in this category

115Risk Factor Survey Bangladesh 2010
Table 5.1: Distribution of the respondents by alcohol consumption status
Age(years) Number
n (%) 95% CI
Drank in past 30days
n (%) 95% CI
Drank in past 12months*
n (%) 95% CI
Lifetime abstainer
87.8, 91.588.6, 92.287.6, 91.787.9, 92.994.6, 97.790.0, 91.8
1 009 (89.8)939 (90.6)858 (89.8)520 (90.7)482 (96.5)
3 808 (91.0)
Men25 – 3435 – 4445 – 5455 – 6465 +Total
1 1721 076971585508
4 312
32 (2.3)26 (1.6)14 (1.1)8 (1.6)1 (0.2)
81 (1.5)
83 (5.2)56 (3.7)23 (2.2)14 (2.2)4 (0.7)
180 (3.2)
1.5, 3.41.0, 2.50.6, 2.10.7, 3.30.0, 1.51.1, 1.9
4.0, 6.82.7, 5.01.4, 3.41.2, 4.10.3, 1.92.7, 3.8
99.5, 99.999.3, 99.998.6, 99.9
98.6, 100.0-
99.6, 99.9
1 986 (99.8)1 450 (99.7)873 (99.6)429 (99.8)
210 (100.0)4 948 (99.8)
Women25 – 3435 – 4445 – 5455 – 6465 +Total
1 9921 455876430210
4 963
1 (0.0)2 (0.1)2 (0.3)1 (0.2)0 (0)
6 (0.1)
2 (0.1)4 (0.2)3 (0.4)1 (0.2)0 (0)
10 (0.2)
0.0, 0.30.0, 0.50.1, 1.10.0, 1.4
- 0.1, 0.3
0.0, 0.30.1, 0.70.1, 1.40.0, 1.4
-0.1, 0.4
95.3, 96.794.9, 96.593.2, 95.593.0, 95.996.1, 98.492.4, 96.4
2 995 (96.1)2 389 (95.8)1 731 (94.5)949 (94.7)692 (97.5)
8 756 (94.4)**
Both sexes
* Inclusive of past 30 days category **Another 329 (3.5) drank any amount of alcohol at least once in past 2-12 months
25 – 3435 – 4445 – 5455 – 6465 +Total
3 1642 5311 8471 015718
9 275
33 (0.9)28 (0.8)16 (0.7)9 (1.0)1 (0.2)
87 (0.9)
85 (2.0)60 (1.7)26 (1.3)15 (1.3)4 (0.5)
190 (2.0)
0.6, 1.30.5, 1.20.4, 1.30.5, 2.00.0, 1.10.8, 1.2
1.5, 2.61.3, 2.30.9, 2.00.7, 2.40.2, 1.41.8, 2.4

116Risk Factor Survey Bangladesh 2010
Table 5.2: Frequency of drinking among those who drank alcohol in the past 12 months
Age(years)
Numbern (%) 95% CI n (%) 95% CI n (%) 95% CI
2.5, 17.54.3, 76.25.1, 13.4
9(6.5)6(14.6)15(8.3)
Men25 – 3445 +Total
13941
180
5 (3.6)3 (7.3)8 (4.4)
4 (2.9)2 (4.9)6 (3.3)
0.6,15.30.6, 8.62.2, 8.6
0.2,15.30.6,7.21.5, 7.2
Daily 5-6 days/week 1-4 days/week
n (%) 95% CI
19.2, 39.812.2, 76.220.2, 33.0
38 (27.3)9 (22.0)
47 (26.1)
51.7, 66.648.9, 57.152.5, 66.9
83 (59.7)21 (51.2)
104 (57.8)
-.63, 39.3.25, 55.7
0(0.0)1(25.0)1(10.0)
Women25 – 4445 +Total
64
10
0 (0)0 (0)0 (0)
1 (16.7)0 (0.0)
1 (10.0)
---
0.4, 92.2-
.25, 55.7
0.4, 92.215.3, 95.710.0, 62.4
1 (16.7)2 (50.0)3 (30.0)
51.3,77.1.63, 39.3
22.4, 77.6
4 (66.7)1 (25.0)5 (50.0)
2.5, 16.55.9, 76.25.2, 13.3
9(6.2)7(15.6)16(8.4)
Both sexes25 – 4445 +Total
14545
190
5 (3.4)3 (6.7)8 (4.2)
5 (3.4)2 (4.4)7 (3.7)
0.6, 14.40.5, 40.52.1, 8.2
0.2, 16.50.5, 7.11.8, 7.5
18.7, 39.216.2, 76.220.5, 33.0
39 (26.9)11 (24.4)50 (26.3)
52.8, 67.028.4, 87.750.2, 64.2
87 (60.0)22 (48.9)
109 (57.4)
1-3 days/month
n (%) 95% CI
Less than once a month

117Risk Factor Survey Bangladesh 2010
Table 5.3: Number of occasions with at least one drink consumed on a drinking occasion in thepast 30 days by current drinkers
Age(years) Number Mean 95% CI
Men (n=81)
Number Mean 95% CI
Women (n=6)
Number Mean 95% CI
Both sexes (n=87)
336
602585
25 – 4445 +Total
Note: Two respondents answered 'Don't know' in occasions with at least one drink consumed on a drinking occasion
572279
5.16.95.6
14.71.38.0
5.66.35.8
2.3, 10.01.9, 11.44.0, 7.2
9.2, 27.60.8, 5.2
0.2, 15.8
2.6, 10.41.8 , 9.614.2, 7.4

118Risk Factor Survey Bangladesh 2010
Table 5.4: Number of standard drinks consumed on a drinking occasion in the past 30 daysby current drinkers
Age(years) Number Mean 95% CI
Men (n=81)
Number Mean 95% CI
Women (n=6)
Number Mean 95% CI
Both sexes (n=87)
235
571980
25 – 4445 +Total
Note: Seven respondents answered 'Don't know' in "standard drinks" consumed on a drinking occasion
552075
3.54.33.7
1.52.32.0
2.54.32.8
2.0, 6.12.2, 6.72.3, 4.6
0.02, 2.30.02, 3.61.4, 2.6
2.0, 3.91.3, 5.22.7, 4.4

119Risk Factor Survey Bangladesh 2010
Table 5.5: Prevalence of heavy episodic (binge) drinking in the past 30 days among current drinkers
Age(years) Number n (%) 95% CI
Men
Number n (%) 95% CI
Women
Number n (%) 95% CI
Both sexes
336
612687
25 – 4465 +Total
582381
40 (68.9)14 (60.9)54 (66.7)
2 (66.7)2 (66.7)4 (66.7)
21 (68.9)16 (61.5)58 (66.7)
54.5, 77.652.3, 85.755.5, 76.2
8.1, 2418.1, 241
26.1, 91.9
45.9, 78.343.5, 86.455.9, 75.9
202
421456
25 – 4465 +Total
Note: "Don't know" was responded by 10 respondents in "largest number of drinks"
401454
3.25.64.3
2.00.02.0
2.73.94.2
2.0, 3.51.4, 6.52.9, 5.7
0.2, 6.6-
0.2, 6.6
2.0, 3.51.4, 6.32.8, 5.5
Prevalence of having >_ 5 drinks in men and >_ 4 drinks in women
Mean number of times drank >_ 5 drinks in men and >_ 4 drinks in women

120Risk Factor Survey Bangladesh 2010
Table 6.1: Height (in cm), weight (in kg) and body mass index (in kg/m2) of the respondents
Age(years) Number Mean 95% CI
Men
Number Mean 95% CI
Women
Number Mean 95% CI
Both sexes
Height1 9921 455876430210
4 963
3 1642 5311 8471 015718
9 275
25 – 3435 – 4445 – 5455 – 6465 +Total
1 1721 076971585508
4 312
162.7162.8162.2161.9159.0162.1
150.9150.8150.0148.4145.2150.3
155.3155.9156.4156.2155.0155.8
162.3, 163.1162.4, 163.2161.4, 162.6161.4, 162.4158.4, 159.6161.9, 162.3
150.6, 151.2150.5, 151.2149.6, 150.4147.9, 149.0144.4, 146.1150.1, 150.4
155.0, 155.6155.6, 156.3156.0, 156.8155.6, 156.7154.3, 155.6155.6, 155.9
Weight1 9921 455876430210
4 963
3 1642 5311 8471 015718
9 275
25 – 3435 – 4445 – 5455 – 6465 +Total
1 1721 076971585508
4 312
55.157.056.154.650.155.2
50.451.049.547.641.549.8
52.153.553.051.647.652.3
54.5, 55.756.3, 57.855.3, 56.953.7, 55.549.2, 51.054.8, 55.5
49.9, 50.850.4, 51.648.7, 50.246.4, 48.840.1, 42.849.4, 50.1
51.7, 52.553.1, 54.052.4, 53.550.9, 52.446.8, 48.452.0, 52.5
Body mass index (BMI)1 9921 455876430210
4 963
3 1642 5311 8471 015718
9 275
25 – 3435 – 4445 – 5455 – 6465 +Total
1 1721 076971585508
4 312
20.821.521.320.819.721.0
22.122.322.021.519.622.0
21.622.021.621.119.721.5
20.6, 21.021.2, 21.721.0, 21.720.5, 21.119.4, 20.020.8, 21.1
21.9, 22.322.1, 22.621.6, 22.321.0, 22.019.0, 20.221.8, 22.1
21.5, 21.721.8, 22.121.4, 21.920.8, 21.419.4, 20.021.4, 21.6

121Risk Factor Survey Bangladesh 2010
Tabl
e 6.
2: B
ody
mas
s in
dex
(BM
I) ca
tego
ries
of re
spon
dent
s
Age
(yea
rs)
Num
ber
n (%
)95
% C
In
(%)
95%
CI
n (%
)95
% C
I
7.9,
11.
311
.8, 1
5.9
10.9
, 15.
17.
6, 1
2.4
5.7,
10.
310
.2, 1
2.1
111
(9.5
)14
8 (1
3.8)
125
(12.
9)57
(9.7
)39
(7.7
)48
0 (1
1.1)
Men
25 –
34
35 –
44
45 –
54
55 –
64
65 +
Tota
l
1 17
21
076
971
585
508
4 31
2
306
(26.
1)25
5 (2
3.7)
263
(27.
1)16
9 (2
8.9)
203
(40.
0)1
196
(27.
7)
733
(62.
5)64
9 (6
0.3)
553
(57.
0)34
6 (5
9.1)
262
(51.
6)2
543
(59.
0)
23.7
, 28.
721
.3, 2
6.3
24.4
, 30.
025
.4, 3
2.7
35.8
, 44.
326
.4, 2
9.1
59.7
, 65.
357
.4, 6
3.2
53.8
, 60.
055
.1, 6
3.1
47.2
, 55.
957
.5, 6
0.4
Und
er w
eigh
tBM
I <18
.5O
verw
eigh
tBM
I 25.
0-29
.9N
orm
al w
eigh
tBM
I 18.
5-24
.9
n (%
)95
% C
I
1.2,
2.8
1.5,
3.3
2.2,
4.4
1.3,
3.8
0.3,
2.1
1.8,
2.6
22 (1
.9)
24 (2
.2)
30 (3
.1)
13 (2
.2)
4 (0
.8)
93 (2
.2)
9.3,
12.
913
.6, 1
7.9
13.5
, 18.
19.
6, 1
4.9
6.2,
11.
012
.0, 1
4.0
129
(11.
0)16
8 (1
5.6)
152
(15.
7)70
(12.
0)42
(8.3
)56
1(13
.0)
16.0
, 19.
316
.1, 2
0.1
15.1
, 20.
111
.4, 1
8.1
4.4,
11.
515
.9, 1
8.0
350
(17.
6)26
2 (1
8.0)
153
(17.
5)62
(14.
4)15
(7.1
)84
2 (1
7.0)
Wom
en25
– 3
435
– 4
445
– 5
455
– 6
465
+To
tal
1 99
21
455
876
430
210
4 96
3
392
(19.
7)29
6 (2
0.3)
218
(24.
9)12
6 (2
9.3)
98 (4
6.7)
1 13
0 (2
2.8)
1 16
6 (5
8.5)
809
(55.
6)45
9 (5
2.4)
222
(51.
6)93
(44.
3)2
749
(55.
4)
18.0
, 21.
518
.4, 2
2.5
22.1
, 27.
925
.2, 3
3.8
40.0
, 53.
421
.6, 2
4.0
56.4
, 60.
753
.0, 5
8.1
49.1
, 55.
746
.9, 5
6.3
37.7
, 51.
154
.0, 5
6.8
3.4,
5.2
4.9,
7.4
4.0,
6.9
3.0,
7.1
0.7,
5.0
4.3,
5.5
84 (4
.2)
88 (6
.0)
46 (5
.3)
20 (4
.7)
4 (1
.9)
242
(4.9
)
19.8
, 23.
421
.7, 2
6.0
19.8
, 25.
415
.6, 2
3.1
5.8,
13.
720
.5, 2
2.8
430
(21.
6)34
6 (2
3.8)
197
(22.
5)82
(19.
1)19
(9.0
)1
074
(21.
6)
13.4
, 15.
814
.8, 1
7.7
13.5
, 16.
89.
9, 1
3.9
5.8,
9.7
13.6
, 15.
0
461
(14.
6)41
0 (1
6.2)
278
(15.
1)11
9 (1
1.7)
54 (7
.5)
1 32
2 (1
4.3)
Both
sexe
s25
– 3
435
– 4
445
– 5
455
– 6
465
+T o
tal
3 16
42
531
1 84
71
015
718
9 27
5
698
(22.
1)55
1 (2
1.8)
481
(26.
0)29
5 (2
9.1)
301
(41.
9)2
326
(25.
1)
1 89
9 (6
0.0)
1 45
8 (5
7.6)
1 01
2 (5
4.8)
568
(56.
0)35
5 (4
9.4)
5 29
2 (5
7.1)
20.6
, 23.
520
.2, 2
3.4
24.1
, 28.
126
.4, 3
1.9
38.4
, 45.
624
.2, 2
6.0
58.3
, 61.
755
.7, 5
9.5
52.5
, 57.
152
.9, 5
9.0
45.8
, 53.
156
.0, 5
8.1
2.8,
4.0
3.7,
5.3
3.3,
5.1
2.3,
4.5
0.6,
2.2
3.3,
4.0
106
(3.4
)11
2 (4
.4)
76 (4
.1)
33 (3
.3)
8 (1
.1)
335
(3.6
)
16.4
, 19.
018
.8, 2
1.9
17.2
, 20.
712
.9, 1
7.3
6.7,
10.
816
.9, 1
8.4
559
(17.
7)51
4 (2
0.3)
349
(18.
9)15
2 (1
5.0)
61 (8
.5)
1 63
5 (1
7.6)
n (%
)95
% C
I
Obe
seBM
I >_ 3
0.0
Ove
rwei
ght o
r obe
seBM
I >_ 2
5

122Risk Factor Survey Bangladesh 2010
Table 6.3: Mean waist circumference (in cm) of the respondents
Age(years) Number Mean 95% CI
Men
Number Mean 95% CI
Women
Number Mean 95% CI
Both sexes
Note: 112 women were excluded because of pregnancy and 3 had refusals
1 8921 443873430210
4 848
3 0642 5191 8441 0147189 159
25 – 3435 – 4445 – 5455 – 6465 +Total
1 1721 076971584508
4 311
75.778.679
78.776.577.7
74.976.976.375.471.975.7
75.277.677.777.375.276.6
75.2, 76.277.9, 79.278.4, 79.777.8, 79.575.5, 77.577.4, 78.0
74.4, 75.376.3, 77.575.5, 77.174.3, 76.670.0, 73.875.3, 76.0
74.8, 75.577.2, 78.177.2, 78.376.6, 78.074.2, 76.176.4, 76.8

123Risk Factor Survey Bangladesh 2010
Table 6.4: Distribution of the respondents by waist circumference categories
Age(years) Number n (%) 95% CI
Men
Number n (%) 95% CI
Women
Number n (%) 95% CI
Both sexes
1 9921 455876430210
4 963
25 – 3435 – 4445 – 5455 – 6465 +Total
1 1721 076971585508
4 312
46 (3.9)92 (8.6)
103 (10.6)57 (9.7)46 (9.1)
344 (8.0)
588 (29.5)564 (38.8)327 (37.3)146 (34.0)47 (22.4)
1 672 (33.7)
3.0, 5.27.0, 10.48.8, 12.77.6, 12.46.8, 11.97.2, 8.8
27.6, 31.636.3, 41.334.2, 40.629.6, 38.617.2, 28.532.4, 35.0
3 1642 5311 8471 0157189 275
634 (20.0)656 (25.9)430 (23.3)203 (20.0)93 (13.0)
2 016 (21.7)
18.7, 21.524.2, 27.721.4, 25.317.7, 22.610.7, 15.620.9, 22.6
Increased (men >_ 94 cm, women >_ 80 cm)
1 9921 455876430210
4 963
25 – 3435 – 4445 – 5455 – 6465 +Total
1 1721 076971585508
4 312
7 (0.6)25 (2.3)22 (2.3)16 (2.7)11 (2.2)81 (1.9)
233 (11.7)267 (18.4)156 (17.8)68 (15.8)20 (9.5)
744 (15.0)
0.3, 1.21.6, 3.41.5, 3.41.7, 4.41.2, 3.91.5, 2.3
10.4, 13.216.4, 20.415.4, 20.512.7, 19.66.2, 14.314.0, 16.0
3 1642 5311 8471 0157189 275
240 (7.6)292 (11.5)178 (9.6)84 (8.3)31 (4.3)
825 (8.9)
6.7, 8.610.3, 12.88.4, 11.16.7, 10.13.1, 6.18.3, 9.5
Substantially increased (men >_ 102 cm, women >_ 88 cm)

124Risk Factor Survey Bangladesh 2010
Table 7.1: Measurement of blood pressure and diagnosis of hypertension among respondents
Age(years)
Numbern (%) 95% CI
Never measured
n (%) 95% CI
Measured, not diagnosed
n (%) 95% CI
Measured, diagnosed
3.3, 5.86.9, 9.9
11.1, 15.813.3, 20.015.1, 22.99.9, 11.9
52 (4.4)86 (8.0)
129 (13.3)96 (16.4)95 (18.7)
468 (10.9)
Men25 – 3435 – 4445 – 5455 – 6465 +Total
1 1721 076971585508
4 312
666 (56.8)448 (41.6)408 (42.0)208 (35.6)187 (36.8)
1 917 (44.5)
454 (38.7)542 (50.4)434 (44.7)271 (46.3)226 (44.5)
1 927 (44.7)
54.0, 59.638.7, 44.638.9, 45.231.8, 39.532.7, 41.143.0, 45.9
36.0, 41.647.4, 53.441.6, 47.842.3, 50.440.2, 48.843.2, 46.2
15.7, 8.112.0, 15.918.8, 25.121.5, 31.316.9, 30.312.9, 14.9
136 (6.8)201 (13.8)191 (21.8)112 (26.0)48 (22.9)
688 (13.9)
Women25 – 3435 – 4445 – 5455 – 6465 +Total
1 9921 455876430210
4 963
516 (25.9)316 (21.7)170 (19.4)82 (19.1)49 (23.3)
1 133 (22.8)
1 340 (67.3)938 (64.5)515 (58.8)236 (54.9)113 (53.8)
3 142 (63.3)
24.0, 27.919.7, 23.916.9, 22.215.6, 23.118.1, 29.521.7, 24.0
65.2, 69.362.0, 66.955.5, 62.050.1, 59.547.0, 60.462.0, 64.6
5.1, 6.910.1 12.715.5, 19.318.7, 24.516.8, 23.511.8, 13.2
188 (5.9)287 (11.3)320 (17.3)218 (21.5)143 (19.9)
1 156 (12.5)
Both sexes25 – 3435 – 4445 – 5455 – 6465 +Total
3 1642 5311 8471 015718
9 275
1 182 (37.4)764 (30.2)578 (31.3)290 (28.6)236 (23.9)
3 050 (32.9)
1 794 (56.7)1 480 (58.5)949 (51.4)507 (50.0)339 (47.2)
5 069 (54.7)
35.7, 39.128.4, 32.029.2, 33.425.9, 31.429.5, 36.431.9, 33.8
55.0, 58.456.5, 60.449.1, 53.746.9, 53.043.6, 50.953.6, 55.7

125Risk Factor Survey Bangladesh 2010
Table 7.2: Prevalence of use of blood pressure drugs prescribed by doctor or health worker amongthe hypertensive respondents
Age(years) Number n (%) 95% CI
Men
Number n (%) 95% CI
Women
Number n (%) 95% CI
Both sexes
13620119111248
688
25 – 3435 – 4445 – 5455 – 6465 +Total
5286
12910695
468
17 (32.7)35 (40.7)81 (62.8)73 (68.9)65 (68.4)
271 (57.9)
40 (29.4)73 (36.3)
116 (60.7)72 (64.3)33 (68.8)
334 (48.5)
16.1, 47.628.4, 56.649.9, 78.254.0, 86.652.8, 87.251.2, 65.2
21.0, 40.128.5, 45.771.8, 98.450.3, 81.047.3, 96.643.5, 54.0
188287320218143
1 156
57 (30.3)108 (37.6)197 (61.6)145 (66.5)98 (68.5)
605 (52.3)
23.3, 39.330.9, 45.453.3, 70.856.1, 78.355.6, 78.348.3, 57.7

126Risk Factor Survey Bangladesh 2010
Table 7.3: Distribution of the hypertensive respondents who received advice from a doctor or healthworker for lifestyle modification
Age(years) Number n (%) 95% CI
Men
Number n (%) 95% CI
Women
Number n (%) 95% CI
Both sexes
13620119111248
688
25 – 3435 – 4445 – 5455 – 6465 +Total
5268
12910695
468
27 (51.9)57 (66.3)90 (69.8)78 (73.6)66 (69.5)
318 (67.9)
81 (59.6)134 (66.7)141 (73.8)75 (67.0)31 (64.6)
462 (67.2)
38.5, 65.055.7, 75.561.3, 77.164.4, 81.159.5, 77.963.6, 72.0
51.1, 67.559.9, 72.867.1, 79.657.8, 75.050.2, 76.763.6, 70.6
188287320218143
1 156
108 (57.4)191 (66.6)231 (72.2)153 (70.2)97 (67.8)
780 (67.5)
50.3, 64.360.9, 71.867.0, 76.863.8, 75.959.8, 75.064.7, 70.1
Reduce salt intake
13620119111248
688
25 – 3435 – 4445 – 5455 – 6465 +Total
5286
12910695
468
18 (34.6)36 (41.9)62 (48.1)60 (56.6)37 (38.9)
213 (45.5)
46 (33.8)84 (41.8)85 (44.5)45 (40.2)10 (20.8)
270 (39.2)
23.0, 48.431.9, 52.539.6, 56.747.0, 65.729.7, 49.141.0, 50.0
26.4, 42.235.2, 48.737.6, 51.631.5, 49.511.6, 34.635.7, 42.9
188287320218143
1 156
64 (34.0)120 (41.8)147 (45.9)105 (48.2)47 (32.9)
483 (41.8)
27.6, 41.136.2, 47.640.5, 51.441.6, 54.825.7, 41,039.0, 44.6
Lose weight
13620119111248
688
25 – 3435 – 4445 – 5455 – 6465 +Total
5286
12910695
468
28 (53.8)55 (64.0)88 (68.2)73 (68.9)64 (67.4)
308 (65.8)
11 (8.1)35 (17.4)32 (16.8)25 (22.3)11 (22.9)
114 (16.6)
40.3, 66.853.3, 73.459.7, 75.759.5, 76.957.3, 76.061.4, 70.0
4.5, 14.012.8, 23.312.1, 22.715.6, 31.013.2, 36.814.0, 19.5
188287320218143
1 156
39 (20.7)90 (31.4)
120 (37.5)98 (45.0)75 (52.4)
422 (36.5)
15.5, 27.126.3, 37.032.4, 42.938.5, 51.644.3, 60.533.8, 39.3
Stop tobacco use
13620119111248
688
25 – 3435 – 4445 – 5455 – 6465 +Total
5286
12910695
468
28 (53.8)57 (66.3)86 (66.7)77 (72.6)65 (68.4)
313 (66.9)
52 (38.2)99 (49.3)
108 (56.5)56 (50.0)20 (41.7)
335 (48.7)
40.3, 66.855.7, 75.558.1, 74.363.4, 80.358.4, 77.062.5, 71.0
30.5, 46.742.4, 56.149.4, 63.440.8, 59.228.7, 55.945.0, 52.4
188287320218143
1 156
80 (42.6)156 (54.4)194 (60.6)133 (61.0)85 (59.4)
648 (56.1)
35.7, 49.748.6, 60.055.2, 65.854.4, 67.351.2, 67.253.2, 58.9
Start or do more exercise

127Risk Factor Survey Bangladesh 2010
Table 7.4: Hypertensives who have seen traditional healers for advice/treatment for raisedblood pressure
Age(years) Number n (%) 95% CI
Men
Number n (%) 95% CI
Women
Number n (%) 95% CI
Both sexes
13620119111248
688
25 – 3435 – 4445 – 5455 – 6465 +Total
5286
12910695
468
4 (7.7)9 (10.5)4 (3.1)6 (5.7)6 (6.3)
29 (6.2)
5 (3.7)3 (1.5)7 (3.7)1 (0.9)2 (4.2)
18 (2.6)
2.9, 18.85.5, 18.91.2, 8.0
2.6, 12.02.9, 13.44.3, 8.8
1.5, 8.50.5, 4.51.8, 7.50.1, 6.1
1.0, 15.21.7, 4.1
188287320218143
1 156
9 (4.8)12 (4.2)11 (3.4)7 (3.2)8 (5.6)
47 (4.1)
2.5, 8.92.4, 7.21.9, 6.11,5, 6.6
2.8, 10.83.1, 5.4
Seen traditional healers for advice/treatment
13620119111248
688
25 – 3435 – 4445 – 5455 – 6465 +Total
5286
12910695
468
2 (3.8)5 (5.8)2 (1.6)1 (0.9)1 (1.1)
11 (2.4)
1 (0.7)2 (1.0)1 (0.5)0 (0)
1 (2.1)5 (0.7)
1.0, 14.12.4, 13.20.4, 6.00.1, 6.40.1, 7.11.3, 4.2
0.1, 5.00.2, 3.90.1, 3.6
-0.3, 13.40.3, 1.7
188287320218143
1 156
3 (1.6)7 (2.4)3 (0.9)1 (0.5)2 (1.4)
16 (1.4)
0.5, 4.81.2, 5.00.3, 2.90.1, 3.20.3, 5.40.8, 2.2
Currently taking herbal or traditional remedy

128Risk Factor Survey Bangladesh 2010
Table 7.5: Mean blood pressure (mmHg) among all respondents
Age(years) Number Mean 95% CI
Men
Number Mean 95% CI
Women
Number Mean 95% CI
Both sexes
1 9921 455876430210
4 963
25 – 3435 – 4445 – 5455 – 6465 +Total
1 1721 076971585508
4 312
116118122126134121
113118124130134119
115.3, 116.7116.7, 118.6120.9, 123.1124.1, 127.7131.5, 135.9120.7, 121.8
111.9, 113.0117.1, 118.9122.4, 125.1127.6, 132.1130.6, 137.2118.0, 119.0
3 1642 5311 8471 015718
9 275
114118123128134120
113.3, 114.2117.2, 118.5122.0, 123.7126.2, 129.0131.9, 135.6119.4, 120.1
Systolic blood pressure
1 9921 455876430210
4 963
25 – 3435 – 4445 – 5455 – 6465 +Total
1 1721 076971585508
4 312
757879797978
737678797675
74.6, 75.776.9, 78.378.1, 79.677.8, 79.877.5, 79.877.2, 77.8
72.0, 72.975.8, 77.077.5, 79.177.7, 80.373.9, 77.275.0, 75.7
3 1642 5311 8471 015718
9 275
747779797876
73.1, 73.876.5, 77.478.0, 79.178.1, 79.776.8, 78.776.1, 76.6
Diastolic blood pressure

129Risk Factor Survey Bangladesh 2010
Table 7.6: Prevalence of high blood pressure among respondents at measurement during survey
Age(years) Number n (%) 95% CI
Men
Number n (%) 95% CI
Women
Number n (%) 95% CI
Both sexes
1 9921 455876430210
4 963
25 – 3435 – 4445 – 5455 – 6465 +Total
1 1721 076971585508
4 312
63 (5.4)119 (11.1)165 (17.0)147 (25.1)177 (34.8)671 (15.6)
102 (5.1)200 (13.7)183 (20.9)127 (29.5)91 (43.3)
703 (14.2)
5.1, 7.910.6, 14.616.7, 21.623.1, 30.233.1, 41.514.4,16.8
5.3, 7.414.4, 18.221.5, 27.130.7, 39.840.0, 53.413.1, 15.3
3 1642 5311 8471 015718
9 275
165 (5.2)319 (12.6)348 (18.8)274 (27.0)268 (37.3)
1 374 (14.8)
5.5, 7.213.3, 16.019.7, 23.427.4, 33.036.4, 43.614.0, 15.6
1 9921 455876430210
4 963
25 – 3435 – 4445 – 5455 – 6465 +Total
1 1721 076971585508
4 312
74 (6.3)142 (13.2)204 (21.0)182 (31.1)196 (38.6)798 (18.5)
128 (6.4)242 (16.6)237 (27.1)153 (35.6)99 (47.1)
859 (17.3)
6.2, 9.313.3, 17.621.1, 26.529.5, 37.136.6, 45.117.2,19.8
6.7, 9.117.6, 21.728.1, 34.237.3, 46.643.3, 56.716.2,18.5
3 1642 5311 8471 015718
9 275
202 (6.4)384 (15.2)441 (23.9)335 (33.0)295 (41.1)
1 657 (17.9)
6.9, 8.716.3, 19.325.2, 29.233.9, 39.939.9, 47.117.0, 18.8
1 9921 455876430210
4 963
25 – 3435 – 4445 – 5455 – 6465 +Total
1 1721 076971585508
4 312
12 (1.0)33 (3.1)57 (5.9)58 (9.9)
90 (17.7)250 (5.8)
26 (1.3)70 (4.8)73 (8.3)
53 (12.3)40 (19.0)262 (5.3)
0.8, 2.12.9, 5.24.5, 7.4
7.3, 12.014.6, 21.3
5.3, 6.7
1.1, 2.23.8, 6.06.2, 9.7
8.5, 14.513.5, 23.9
4.6, 5.8
3 1642 5311 8471 015718
9 275
38 (1.2)103 (4.1)130 (7.0)
111 (10.9)130 (18.1)512 (5.5)
1.1, 1.93.7, 5.35.7, 7.9
8.4, 12.215.2, 20.8
5.1, 6.0
Stage I hypertension >_ 140 / 90 on measurement
Stage II hypertension >_ 160 / 100 on measurement
Hypertension ( BP >_ 140 / 90 on measurement and/or on medication)

130Risk Factor Survey Bangladesh 2010
Table 7.7: Status of treatment and blood pressure control among previously diagnosed hypertensive respondents
5 (9.6)11 (12.8)25 (19.4)28 (26.4)13 (13.7)82 (17.5)
25 – 3435 – 4445 – 5455 – 6465 +Total
5286
12910695
468
38 (73.0)33 (38.4)35 (27.1)21 (19.8)16 (16.8)
143 (30.6)
4.1, 21.17.2, 21.7
13.4, 27.118.9, 35.68.1, 22.2
14.3, 21.2
59.5, 83.428.7, 49.020.2, 35.513.3, 28.510.6, 25.826.5, 34.9
4 (7.7)17 (19.8)45 (34.9)42 (39.6)46 (48.4)
154 (32.9)
2.9, 18.812.6, 29.527.2, 43.530.8, 49.238.6, 58.428.8, 37.3
5 (9.6)25 (29.1)24 (18.6)15 (14.2)20 (21.1)89 (19.0)
4.1, 21.120.5, 39.512.8, 26.38.7, 22.2
14.0, 30.415.7, 22.8
Men
21 (15.4)33 (16.4)42 (22.0)21 (18.8)5 (10.4)
122 (17.7)
25 – 3435 – 4445 – 5455 – 6465 +Total
13620119111248
688
73 (53.7)81 (40.3)38 (19.9)11 (9.8)4 (8.3)
207 (30.1)
10.3, 22.511.9, 22.216.7, 28.412.5, 27.14.4, 22.7
15.1, 20.8
45.3, 61.933.7, 47.214.8, 26.25.5, 16.93.2, 20.2
26.8, 33.6
15 (11.0)38 (18.9)70 (36.6)51 (45.5)27 (56.2)
201 (29.2)
6.8, 17.514.1, 24.930.1, 43.736.6, 54.842.1, 69.525.9, 32.7
27 (19.9)49 (24.4)41 (21.5)29 (25.9)12 (25.0)
158 (23.0)
14.0, 27.418.9, 30.816.2, 27.918.6, 34.814.8, 39.120.0, 26.3
Women
26 (13.8)44 (15.3)67 (20.9)49 (22.5)18 (12.6)
204 (17.6)
25 – 3435 – 4445 – 5455 – 6465 +Total
188287320218143
1 156
111 (59.0)114 (39.7)73 (22.8)32 (14.7)20 (14.0)
350 (30.3)
9.6, 19.511.6, 20.016.8, 25.717.4, 28.58.1, 19.1
15.6, 20.0
51.9, 65.934.2, 45.518.5, 27.710.6, 20.09.2, 20.7
27.7, 33.0
19 (10.1)55 (19.2)
115 (35.9)93 (42.7)73 (51.0)
355 (30.7)
6.5, 15.315.0, 24.130.9, 41.436.3, 49.342.9, 59.228.1, 33.4
32 (17.0)74 (25.8)65 (20.3)44 (20.2)32 (22.4)
247 (21.4)
12.3, 23.121.0, 31.216.3, 25.115.4, 26.016.3, 29.919.1, 23.8
Both sexes
Age(years) Number
n (%) 95% CI
Not on medication andSBP < 140 and DBP < 90
n (%) 95% CI
On medication andSBP < 140 and DBP < 90
n (%) 95% CI n (%) 95% CI
Not on medication andSBP >_ 140 and DBP >_ 90
On medication andSBP >_ 140 and DBP >_ 90

131Risk Factor Survey Bangladesh 2010
Table 8.1: Distribution of the respondents by measurement of blood glucose and diagnosis of diabetes
Age(years)
Number
0.2, 1.22.5, 4.93.9, 6.9
8.3, 13.83.3, 7.53.7, 5.0
7 (0.6)38 (3.5)51 (5.3)
63 (10.8)26 (5.1)
185 (4.3)
Men25 – 3435 – 4445 – 5455 – 6465 +Total
1 1721 076971585508
4 312
1 092 (93.2)911 (84.7)770 (79.3)431 (73.7)376 (74.0)
3 580 (83.0)
73 (6.2)127 (11.8)150 (15.4)91 (15.6)
106 (20.9)547 (12.7)
91.6, 94.582.4, 86.776.6, 81.770.0, 77.170.0, 77.681.9, 84.1
5.0, 7.810.0, 13.913.3, 17.912.8, 18.717.6, 24.611.7, 13.7
0.5, 1.42.9, 4.95.9, 9.7
4.9, 10.21.7, 8.13.1, 4.2
18 (0.9)55 (3.8)67 (7.6)31 (7.2)9 (4.3)
180 (3.6)
Women25 – 3435 – 4445 – 5455 – 6465 +Total
1 9921 455876430210
4 963
1 781 (89.4)1 195 (82.1)645 (73.6)323 (75.1)170 (81.0)
4 114 (82.9)
193 (9.7)205 (14.1)164 (18.7)76 (17.7)31 (14.8)
669 (13.5)
88.0, 90.780.1, 84.070.6, 76.470.8, 79.075.1, 85.781.8, 83.9
8.5, 11.112.4, 16.016.3, 21.414.4, 21.610.6, 20.212.6, 14.5
0.5, 1.22.9, 4.55.3, 7.7
7.5, 11.33.4, 6.83.5, 4.4
25 (0.8)93 (3.7)
118 (6.4)94 (9.3)35 (4.9)
365 (3.9)
Both sexes25 – 3435 – 4445 – 5455 – 6465 +Total
3 1642 5311 8471 015718
9 275
2 873 (90.8)2 106 (83.2)1 415 (76.6)754 (74.3)546 (76.0)
7 694 (83.0)
266 (8.4)332 (13.1)314 (17.0)167 (16.5)137 (19.1)
1 216 (13.1)
89.7, 91.881.7, 84.674.6, 78.571.5, 76.972.8, 79.082.2, 83.7
7.5, 9.411.9, 14.515.4, 18.814.3, 18.916.4, 22.112.4, 13.8
Never measured Measured, not diagnosed Measured, diagnosed
n (%) 95% CI n (%) 95% CI n (%) 95% CI

132Risk Factor Survey Bangladesh 2010
Table 8.2: Diabetic respondents who are currently taking insulin or oral antidiabetic drugs
Age(years)
Number n (%) 95% CI
Men
Number n (%) 95% CI
Women
Number n (%) 95% CI
Both sexes
185567319
180
25 – 3435 – 4445 – 5455 – 6465 +Total
738516326
185
3 (42.9)8 (21.1)
10 (19.6)13 (20.6)9 (34.6)
43 (23.2)
3 (16.7)8 (14.5)
14 (20.9)6 (19.4)2 (22.2)
33 (18.3)
14.4, 77.010.9, 36.810.9, 32.712.4, 32.419.1, 54.317.7, 29.9
5.5, 40.97.4, 26.5
12.8, 32.39.0, 36.95.6, 57.9
13.3, 24.7
2593
1189435
365
6 (24.0)16 (17.2)24 (20.3)19 (20.2)11 (31.4)76 (20.8)
11.2, 44.210.8, 26.314.0, 28.613.3, 29.518.3, 48.317.0, 25.3
Taking insulin
185567319
180
25 – 3435 – 4445 – 5455 – 6465 +Total
738516326
185
4 (57.1)23 (60.5)28 (54.9)40 (63.5)19 (73.1)
114 (61.6)
7 (38.9)32 (58.2)46 (68.7)18 (58.1)6 (66.7)
109 (60.6)
23.0, 85.644.4, 74.641.2, 67.951.0, 74.453.3, 86.654.4, 68.3
19.8, 62.144.9, 70.456.7, 78.640.4, 73.933.3, 88.953.2, 67.4
2593
1189435
365
11 (44.0)55 (59.1)74 (62.7)58 (61.7)25 (71.4)
223 (61.1)
26.3, 63.448.9, 68.653.7, 71.051.5, 70.954.6, 83.956.0, 66.0
Oral drug
185567319
180
25 – 3435 – 4445 – 5455 – 6465 +Total
738516326
185
4 (57.1)26 (68.4)29 (56.9)41 (65.1)20 (76.9)
120 (64.9)
9 (50.0)34 (61.8)49 (73.1)18 (58.1)6 (66.7)
116 (64.4)
15.6, 99.944.7, 100.038.1, 81.7
46.7, 100.047.0, 100.053.8, 77.6
22.9, 94.942.8, 86.454.1, 96.734.4, 91.8
24.5, 100.042.5, 70.5
2593
1189435
365
14 (52.0)60 (64.5)78 (66.1)59 (62.8)26 (74.3)
236 (64.7)
27.7, 88.949.2, 83.052.3, 82.547.8, 80.948.5, 80.956.7, 73.5
Oral drug and/or insulin

133Risk Factor Survey Bangladesh 2010
Table 8.3: Diabetic respondents who received advice for lifestyle modification from a doctor or health worker
Age(years) Number n (%) 95% CI
Men
Number n (%) 95% CI
Women
Number n (%) 95% CI
Both sexes
185567319
180
25 – 3435 – 4445 – 5455 – 6465 +Total
738516326
185
5 (71.4)33 (86.8)44 (86.3)60 (95.2)25 (96.2)
167 (90.3)
16 (88.9)49 (89.1)61 (91.0)28 (90.3)8 (88.9)
162 (90.0)
32.7, 92.872.0, 94.473.9, 93.386.2, 98.577.2, 99.585.1, 93.8
64.8, 97.277.8, 95.081.5, 95.973.9, 96.850.0, 98.584.7, 93.6
2593
1189435
365
21 (84.0)82 (88.2)
105 (89.0)88 (93.6)33 (94.3)
329 (90.1)
64.3, 93.979.9, 93.381.9, 93.586.5, 97.179.8, 98.686.6, 92.8
Diet
185567319
180
25 – 3435 – 4445 – 5455 – 6465 +Total
738516326
185
5 (71.4)27 (71.1)40 (78.4)41 (65.1)18 (69.2)
131 (70.8)
10 (55.6)39 (70.9)43 (64.2)18 (58.1)4 (44.4)
114 (63.3)
32.7, 92.854.9, 83.265.1, 87.652.6, 75.849.4, 83.863.9, 76.9
33.0, 76.057.7, 81.452.1, 74.740.4, 73.917.7, 74.956.1, 70.1
2593
1189435
365
15 (60.0)66 (71.0)83 (70.3)59 (62.8)22 (62.9)
245 (67.1)
40.3, 77.061.0, 79.361.5, 77.952.6, 71.946.0, 77.162.1, 71.8
Lose weight
185567319
180
25 – 3435 – 4445 – 5455 – 6465 +Total
738516326
185
4 (57.1)26 (68.4)37 (72.5)45 (71.4)18 (69.2)
130 (70.3)
2 (11.1)14 (25.5)15 (22.4)12 (38.7)
0 (0)43 (23.9)
23.0, 85.652.2, 81.158.8, 83.059.1, 81.249.4, 83.863.3, 76.4
2.8, 35.215.7, 38.514.0, 33.923.5, 56.5
-18.2, 30.7
2593
1189435
365
6 (24.0)40 (43.0)52 (44.1)57 (60.6)18 (51.4)
173 (47.4)
11.2, 44.233.2, 53.235.4, 53.150.5, 70.035.3, 67.342.3, 52.5
Stop smoking
185567319
180
25 – 3435 – 4445 – 5455 – 6465 +Total
738516326
185
5 (71.4)31 (81.6)44 (86.3)57 (90.5)25 (96.2)
162 (87.6)
14 (77.8)48 (87.3)56 (83.6)24 (77.4)5 (55.6)
147 (81.7)
32.7, 92.866.1, 91.073.9, 93.380.4, 95.777.2, 99.582.0, 91.6
53.5, 91.475.6, 93.872.7, 90.759.6, 88.825.1, 82.375.3, 86.7
2593
1189435
365
19 (76.0)79 (84.9)
100 (84.7)81 (86.2)30 (85.7)
309 (84.7)
55.8, 88.876.2, 90.977.1, 90.277.6, 91.869.9, 93.980.6, 88.0
Start or do more exercise

134Risk Factor Survey Bangladesh 2010
Table 8.4: Distribution of the diabetic respondents who sought advice or treatment from traditionalhealers for diabetes
Sought advice or treatment
Currently taking herbal or traditional remedy
73107180
25 – 4445 +Total
45140185
5 (11.1)15 (10.7)20 (10.8)
4 (5.5)4 (3.7)8 (4.4)
2.0, 24.94.1, 34.57.1, 16.2
0.8, 15.60.7, 50.02.2, 8.6
118247365
9 (7.6)19 (7.7)28 (7.7)
2.0, 15.02.9, 30.15.3, 10.9
73107180
25 – 4445 +Total
45140185
2 (4.4)8 (5.7)
10 (5.4)
5 (6.8)0 (0)
5 (2.8)
2.0, 16.52.4, 34.52.9, 9.8
2.8, 15.6-
1.2, 6.5
118247365
7 (5.9)8 (3.2)
15 (4.1)
3.9, 10.91.6, 26.82.5, 6.7
Age(years) Number n (%) 95% CI
Men
Number n (%) 95% CI
Women
Number n (%) 95% CI
Both sexes

135Risk Factor Survey Bangladesh 2010
Table 9: Distribution of the respondents by the number of risk factors*
*Combined risk factors include current tobacco use, less than 5 servings of fruit and vegetables intake per day, low level of physical activity, overweight (BMI >_25 kg/m2) and raised blood pressure >_140 / 90 mmHg or currently on medication for raised blood pressure.
15.3, 18.830.5, 35.623.2, 26.2
382 (17.0)681 (33.0)
1 063 (24.7)
Men25 – 4445+Total
2 2482 0644 312
2 239 (99.6)2 056 (99.6)4 295 (99.6)
1 733 (77.1)1 840 (89.1)3 573 (82.9)
95.5, 99.995.3, 99.996.7, 99.9
73.5, 80.885.1, 93.380.2, 85.6
22.0, 25.346.1, 53.230.0, 33.1
813 (23.6)751 (49.5)
1 564 (31.5)
Women
25 – 4445+Total
3 4471 5164 963
3 353 (97.3)1 504 (99.2)4 857 (97.9)
2 304 (66.9)1 301 (85.8)3 605 (72.6)
94.0, 99.994.3, 99.995.1, 99.9
64.1, 69.681.2, 90.670.3, 75.1
19.8, 22.237.9, 42.127.2, 29.4
1 195 (21.0)1 432 (40.0)2 627 (28.3)
Both sexes25 – 4445+Total
5 6953 5809 275
5 592 (98.2)3 560 (99.4)9 152 (98.7)
4 037 (70.9)3 141 (87.7)7 178 (77.4)
95.6, 99.996.2, 99.996.6, 99.9
68.7, 73.185.0, 91.075.7, 79.2
Age(years)
NumberAt least one Two or more 3 or more
n (%) 95% CI n (%) 95% CI n (%) 95% CI

Risk Factor Survey Bangladesh 2010

Bangladesh Society of Medicine N.C.D
Directorate General of Health Services Ministry of Health & Family Welfare