non-destructive testing of drilled shafts: current
TRANSCRIPT

Non-Destructive Testing of Drilled Shafts
Current Practices and New Methods
© 2012 Pile Dynamics, Inc. Foundation & Geotechnical
Engineering
Brent Robinson, Pile Dynamics, Inc.

Why Test Integrity?
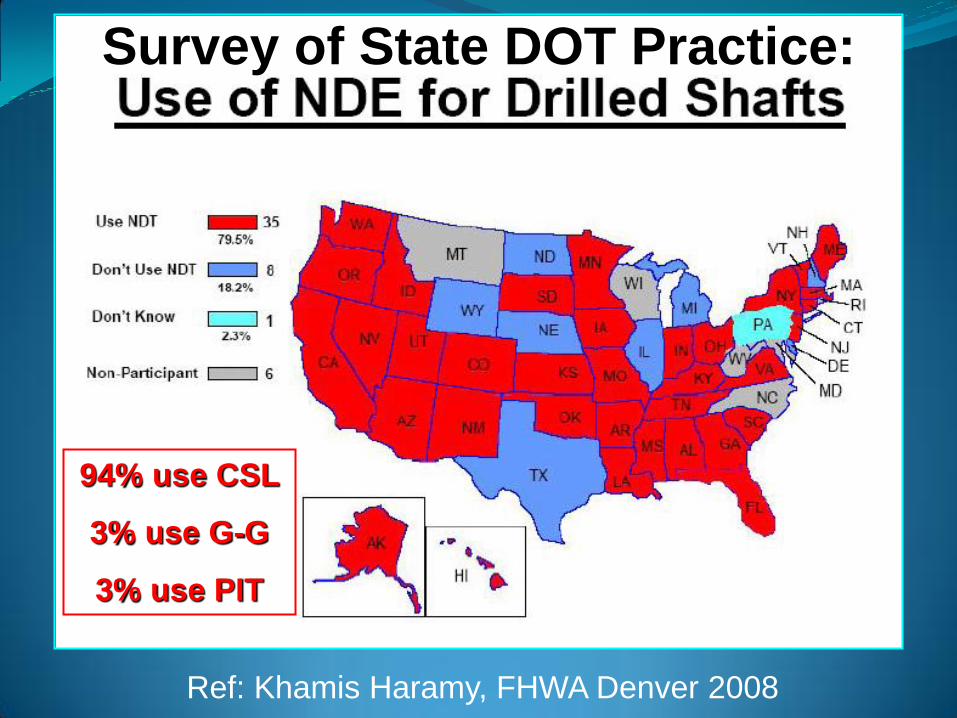
Survey of State DOT Practice:
94% use CSL
3% use G-G
3% use PIT
Ref: Khamis Haramy, FHWA Denver 2008
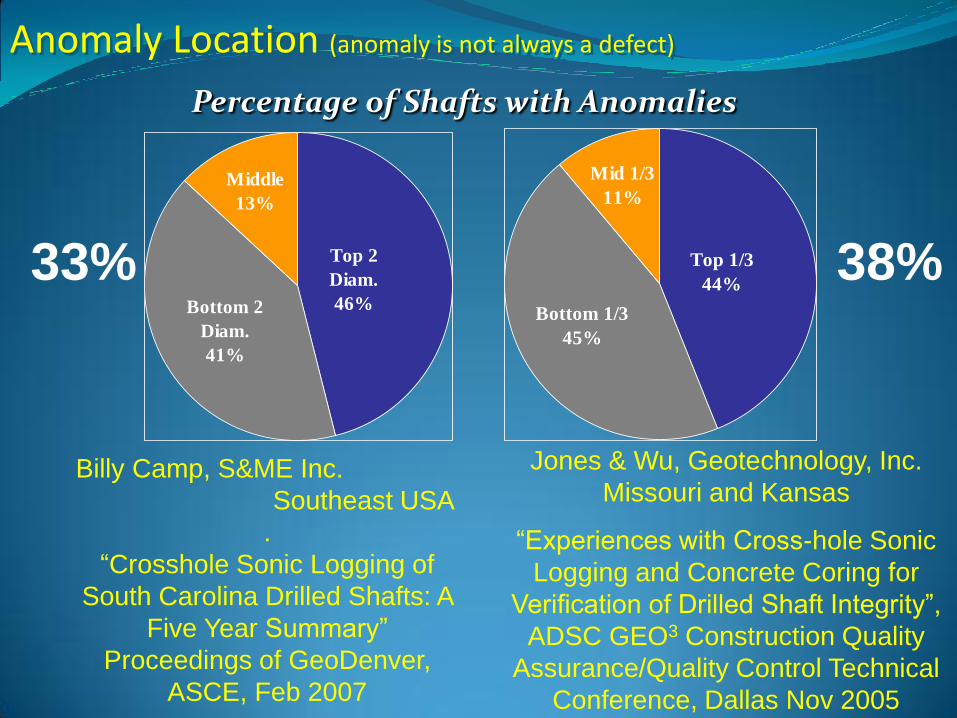
Anomaly Location (anomaly is not always a defect)
Bottom 2
Diam.
41%
Middle
13%
Top 2
Diam.
46%Bottom 1/3
45%
Mid 1/3
11%
Top 1/3
44%
Billy Camp, S&ME Inc.
Southeast USA
.
“Crosshole Sonic Logging of
South Carolina Drilled Shafts: A
Five Year Summary”
Proceedings of GeoDenver,
ASCE, Feb 2007
Jones & Wu, Geotechnology, Inc.
Missouri and Kansas
“Experiences with Cross-hole Sonic
Logging and Concrete Coring for
Verification of Drilled Shaft Integrity”,
ADSC GEO3 Construction Quality
Assurance/Quality Control Technical
Conference, Dallas Nov 2005
Percentage of Shafts with Anomalies
33% 38%

CSL Cross-hole Sonic Logging
Stress Waves, emitted
in one tube are received
in another one if concrete
quality is satisfactory
Fill Tubes with water
Pull Probes From Bottom To Top
Transmit Receive
Top view of pile with
4 access tubes –
test all paths

Cross-hole Sonic Logging
Advantages
• Checks concrete quality inside cage
• by depth and by quadrant
• Tomography available for complicated cases
Limitations / Disadvantages
• Needs access tubes (steel tubes preferred)
• Wait min 3 days prior to test (7 days preferred)
• Cannot evaluate concrete cover

Indiana Drilled Shaft—Soft Toe
Length: 92 feet
Geometry:
7 ft diameter, upper 16 ft, temporary casing
6 ft diameter, 16 to 92 ft (top of rock),
temporary casing
5.5 ft diameter, 72 to 92 ft (20 ft rock socket)
CSL Results:
Arrival delays of 50 to 100% on all profiles
Over bottom 1-2 ft of shaft


Core Results “Tools dropped from 88 to 91 ft”
Recovered 7” concrete, 38.75” void, 21.25” sandstone

Indiana Drilled Shaft—Top Same project, different shaft
Similar geometry, slightly longer
Anomaly identified near the top
CSL identifed 20-100% reductions within 2-5 ft
of top

Core results Core samples compression tested
Compressive strength
6000 to 7000 psi
Cage was wet slabbed
Concrete poured
Cage installed
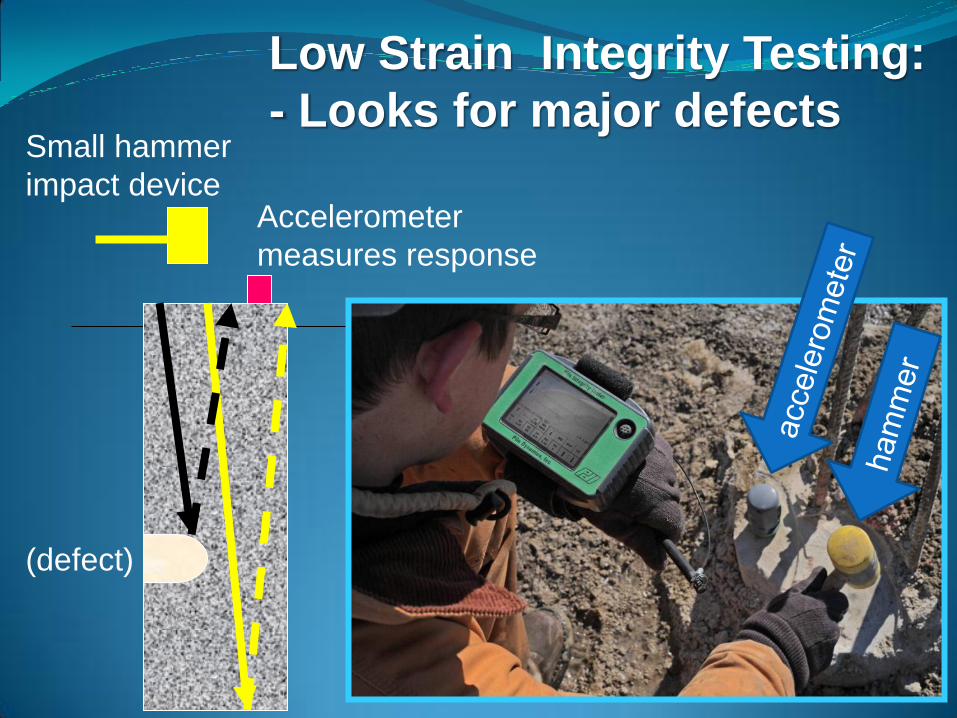
Small hammer
impact device Accelerometer
measures response
(defect)
Low Strain Integrity Testing:
- Looks for major defects

Advantages • Cost Effective
• Apply to any or even all concrete pile/shaft
minimal pile preparation
• Finds MAJOR defects
• Sometimes test piles in structure
Limitations / Disadvantages • Best use: CFA/ACIP or drilled shafts
• Solid section of concrete needed
• Limited to 30 to 50 L/D
• Difficult interpretation for highly non-uniform
• Cannot locate defect quadrant

Indiana Shafts—PIT results
v

Gamma-Gamma Logging Advantages
• Gives data on concrete cover
perhaps to 3 inch range
rad.energy halved every 2”
• Compliments CSL testing
Disadvantages
• Needs many PVC access tubes (3 inch range)
(steel access tubes generally preferred for CSL)
• Uses radioactive materials (Cesium 137)
Probe must be retrieved
( note: long probe vs. bent PVC tubes)

0%
10%
20%
30%
40%
50%
60%
70%
80%
90%
100%
3 4 5 6 7 8 9 10
Shaft Diam. (ft)
Te
sti
ng
Co
ve
rag
e
GGL Shaft Tested GGL Cover Tested CSL Shaft Tested CSL Cover Tested
CSL GGL

Thermal Integrity Profiling
Temperature from concrete curing is directly related to concrete quality
Heat from concrete curing evaluates concrete both inside and outside cage
(100% testing – entire section)
Obtain temperature vs. depth vs. quadrant
Infra-red probe via CSL tubes
Thermal wires on cage cast in shaft
Test can reveal cage alignment problems Minimum cover can be verified

1 4 7
10
13
16
19
22
25
28
31
34
37
40
43
46
49
S1
S10
S19
S28
S37
S46
20
30
40
50
60
70
80
70-80
60-70
50-60
40-50
30-40
20-30
Shaft Heat Signature Tem
pera
ture

0
5
10
15
20
25
30
35
40
45
50
110 120 130 140 150
De
pth
(ft
.)
Degrees F
Data Interpretation Cage alignment
A1
A2
AVG
Data Interpretation
Cage Alignment

Data Interpretation Local Defect
0
5
10
15
20
25
30
35
40
45
50
90 110 130 150
De
pth
(ft
.)
Degrees F
Data Interpretation Local Defect near C2
C1
C2
Average
C1 C2


Test Procedure using probes
H2O Container
•Transfer water from first tube into container
•Warm temperature probe
•Lower probe into tube – data collected
from top to bottom – 1’/sec. rate
•Remove probe
•Transfer water from second tube into first
•Repeat scan in second tube
•Continue for all remaining tubes
CSL
Tubes
To
Depth
Encoder

Thermal Integrity Profiler (TIP) - probe testing
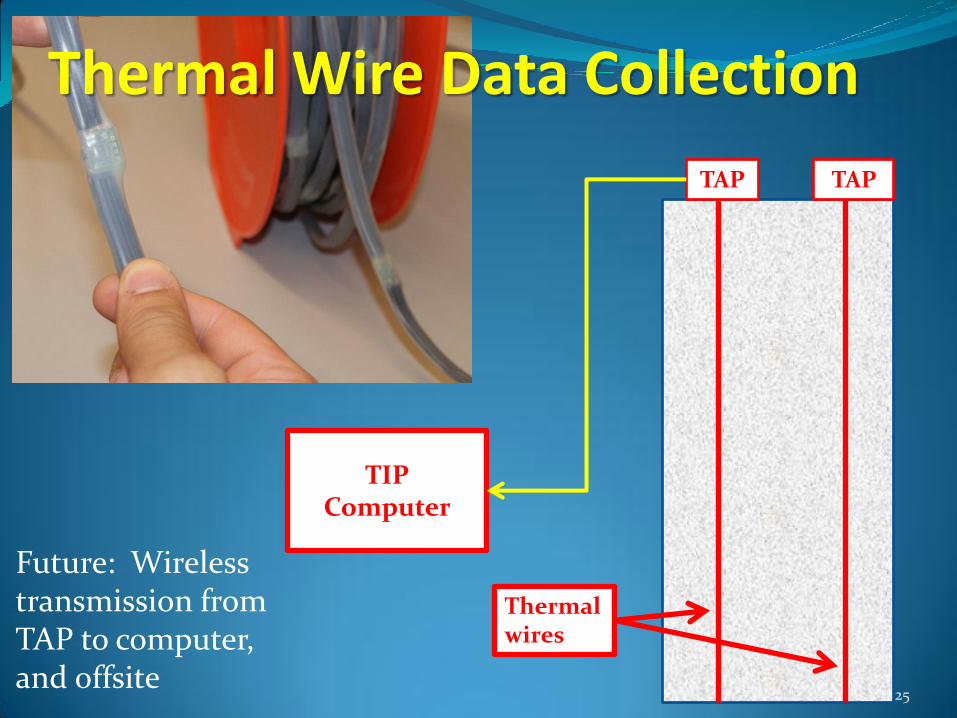
TAP TAP
TIP Computer
Thermal wires
25
Thermal Wire Data Collection
Future: Wireless transmission from TAP to computer, and offsite

Thermal wires
eliminate need for
access tubes

Interpretation: Direct Observation (Field)
Verify shaft length - Identify top and bottom
Confirm cage alignment
Locate changes in shaft diameter
Locate immediate areas of concern

Field Observations:
Scatter Creek, Florida
No cage eccentricity
(all tubes ~same temp)
Clean top and toe
signature (approximate
1 diameter temperature
roll-off top and bottom)
Good Shaft
0
5
10
15
20
25
30
35
40
70 80 90 100 110 120
Temperature (deg F)
Depth
(ft)
T1
T2
T3
T4
Avg
Scatter Creek
Shaft A

Interpretation: Added Field Records
Confirm direct observations and preliminary
information
Find relationship between concrete volume
and measured temperature
Predict as-built shaft radius, shape, and
cover
Correlate soil strata to thermal conductivity and
observe influence on less prominent
temperature fluctuations

0
10
20
30
40
50
60
70
80
90
100
70 90 110 130 150
Temperature (deg F)D
epth
(ft)
0 2 4 6 8 10
Shaft Diam (ft)
Average
Grnd Surf
TOS
WT
BOC
TOLime
TOR
BOS
Effective
Diam.
Theoretical
Diam.
Method ShaftNo Correction for
Over-pour Concrete
No Correction for
Tremie f illing /
volume
Shape of avg.
profile mimics
diameter from
concrete yield
Average temp. is
determined for a
given truck yield
(diam.)
Results plotted
to establish
correlation
0.8 inch / degree

How to determine cover?
Correlate temp. with concrete volume
Measure the temperature “gradient”
Thermal Wire option
Short parallel separate wire of known offset
Attach to cross brace
Simplifies the interpretation
Model the mix to get the “gradient”

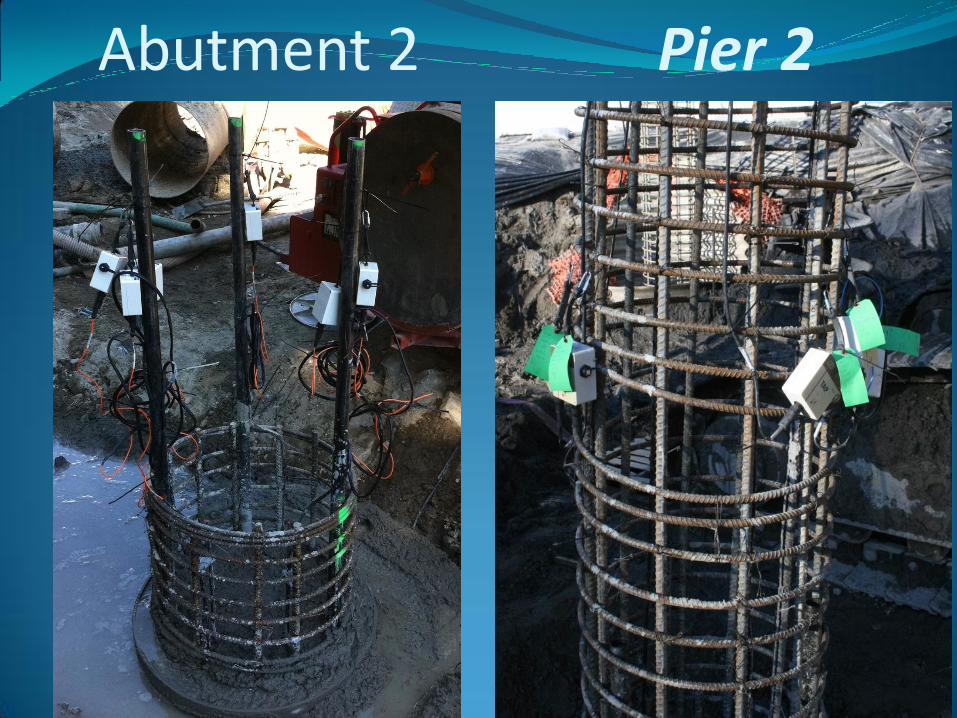
Case Study –FHWA WFLHD

Shaft Details
Halstead Medows Bridge
Tubes (3) and T-wires (4 +2 Grad)
38 inch diameter casing (0-20’)
36 inch diameter (20-49’)
30 inch rebar diameter
49 ft long
~18% more concrete required
CSL and Thermal Testing
Poured 9/19/2011
Tube 3
Tube 2
Tube 1
G
003
002 001
000
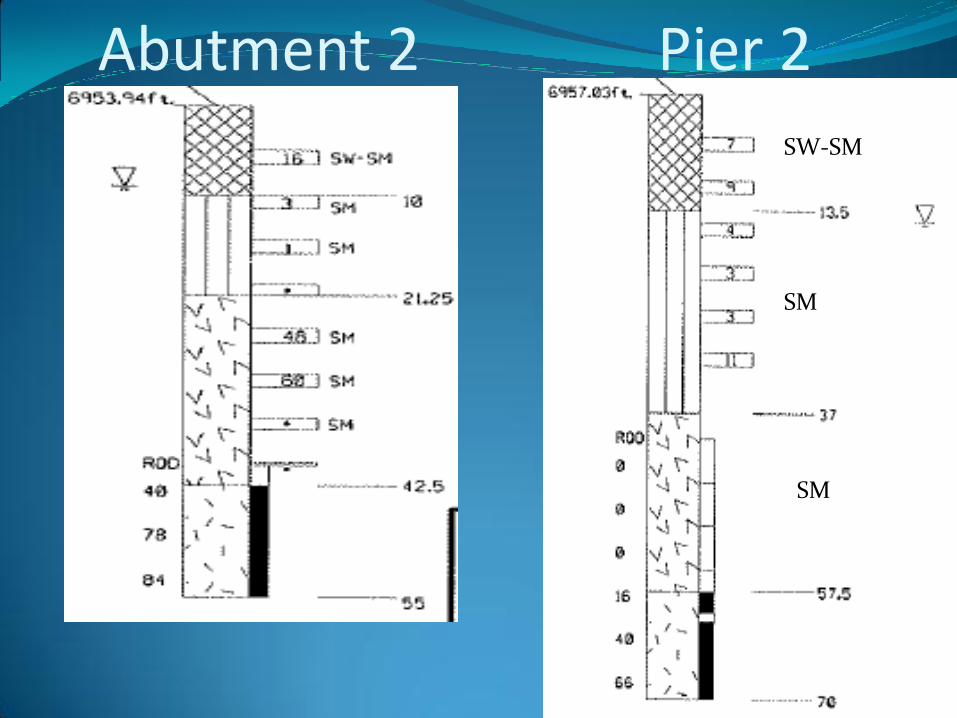
Abutment 2 Pier 2
SW-SM
SM
SM


Abutment 2 Pier 2

Basic Temperature Display Abutment 2 Pile C
-50
-45
-40
-35
-30
-25
-20
-15
-10
-5
0
50 70 90 110 130
De
pth
(ft
)
Temperature (F)
000
001
003
004
Average
Refusal

Corrected Shaft Radius Display Abutment 2 Pile C

-5
0
5
10
15
20
25
30
35
40
45
50
55
60
-3 -2 -1 0 1 2 3D
ep
th (
ft)
Shaft Radius (ft)Sequoia Abutment 2 Pile C
-5
0
5
10
15
20
25
30
35
40
45
50
55
60
-3 -2 -1 0 1 2 3
De
pth
(ft
)
Shaft Radius (ft)Sequoia Abutment 2 Pile C
3D Representation Abutment 2 Pile C

CSL Results – Abutment 2 Pile C
Abutment 2 Pier 2

-60
-50
-40
-30
-20
-10
0
10 15 20 25 30
Dep
th (
ft)
Shaft Radius (in)
009 radius
010 radius
011 radius
012 radius
Cage
18 inches
average
Corrected Shaft Radius Display Pier 2 Pile C

-5
0
5
10
15
20
25
30
35
40
45
50
55
60
65
-3 -2 -1 0 1 2 3D
ep
th (
ft)
Shaft Radius (ft)
Sequoia Pier 2 Pile C
-5
0
5
10
15
20
25
30
35
40
45
50
55
60
65
-3 -2 -1 0 1 2 3
De
pth
(ft
)
Shaft Radius (ft)
Sequoia Pier 2 Pile C
3D Representation Pier 2 Pile C

CSL Results – Pier 2 Pile C

Abutment 2 and Pier 2
-5
0
5
10
15
20
25
30
35
40
45
50
55
60
65
-3 -2 -1 0 1 2 3
De
pth
(ft
)
Shaft Radius (ft)
Sequoia Pier 2 Pile C
-5
0
5
10
15
20
25
30
35
40
45
50
55
60
-3 -2 -1 0 1 2 3D
ep
th (
ft)
Shaft Radius (ft)Sequoia Abutment 2 Pile C

Summary Significant improvements in NDT technology over the
last 20 years.
CSL, PIT and Gamma Gamma continue to provide useful information
Thermal Integrity Profiling promising for determining
Integrity of 100% of shaft
Cage location and alignment
Concrete cover
Overall profile of the shaft

Drilled shaft application – IN DOT

