non-invasive method for the aortic blood pressure - iopscience
TRANSCRIPT

Journal of Physics Conference Series
OPEN ACCESS
Non-invasive method for the aortic blood pressurewaveform estimation using the measured radialEBITo cite this article Andrei Krivoshei et al 2013 J Phys Conf Ser 434 012048
View the article online for updates and enhancements
You may also likeSublingual capnometry a non-invasivemeasure of microcirculatory dysfunctionand tissue hypoxiaPaul E Marik
-
Systolic time intervals assessed fromanalysis of the carotid pressure waveformPaolo Salvi Andrea Grillo Isabella Tan etal
-
Determining carotid artery pressure fromscaled diameter waveforms comparisonand validation of calibration techniques in2026 subjectsS J Vermeersch E R Rietzschel M L DeBuyzere et al
-
Recent citationsMart Min et al-
Development of bioimpedance sensingdevice for wearable monitoring of theaortic blood pressure curveH Kotildeiv et al
-
A Krivoshei et al-
This content was downloaded from IP address 18711138170 on 12012022 at 0947
Non-invasive method for the aortic blood pressure waveform
estimation using the measured radial EBI
Andrei Krivoshei12
Juumlrgen Lamp23
Mart Min1 Tiina Uuetoa
24 Hasso Uuetoa
15
and Paul Annus12
1 Tallinn University of Technology Estonia
2 ELIKO Competence Center Estonia
3 JR Medical OY Estonia
4 East-Tallinn Central Hospital Estonia
5 Sahlgrenska University Hospital Sweden
E-mail andreikrivosheigmailcom
Abstract The paper presents a method for the Central Aortic Pressure (CAP) waveform
estimation from the measured radial Electrical Bio-Impedance (EBI) The method proposed
here is a non-invasive and health-safe approach to estimate the cardiovascular system
parameters such as the Augmentation Index (AI) Reconstruction of the CAP curve from the
EBI data is provided by spectral domain transfer functions (TF) found on the bases of data
analysis Clinical experiments were carried out on 30 patients in the Center of Cardiology of
East-Tallinn Central Hospital during coronary angiography on patients in age of 43 to 80 years
The quality and reliability of the method was tested by comparing the evaluated augmentation
indices obtained from the invasively measured CAP data and from the reconstructed curve
The correlation coefficient r = 089 was calculated in the range of AICAP values from 5 to 28
Comparing to the traditional tonometry based method the developed one is more convenient to
use and it allows long-term monitoring of the AI what is not possible with tonometry probes
1 Introduction Increasing mortality in developed countries caused by cardiovascular disease and mainly by
atherosclerosis andor hypertension is a major concern in modern medicine nowadays Thereupon the
situation requires developing of novel non-invasive and reliable monitoring and diagnosing tools
capable to recognize a heart disease on its early progress stages
Along with other parameters the Central Aortic Pressure (CAP) and the Augmentation Index (AI) have been indicated in several studies as important cardiovascular risk markers [1 2] It is well known that the CAP curve is formed from the sum of the direct aortic pressure wave just pumped out
from the heart and from the traveling wave reflected from peripheral arteries A quickly arrived reflected wave will produce an increase in the CAP and significant rise of which can be recognized as a risk marker Thus estimating the contribution of a reflected wave to the CAP gives important information about condition of arteries and patient health risk
Non-invasive estimation of the AI and the CAP is usually done by a well-known applanation tonometry when a peripheral blood pressure is measured on a radial artery and then calibrated by the
pressure values obtained using the brachial cuff After that both the CAP and the AI values are estimated from the measured radial pressure and generalized transfer function [3 - 6]
XV Int Conf on Electrical Bio-Impedance amp XIV Conf on Electrical Impedance Tomography IOP PublishingJournal of Physics Conference Series 434 (2013) 012048 doi1010881742-65964341012048
Published under licence by IOP Publishing Ltd 1
In our research we show that AI can be estimated from a radial electrical bio-impedance (EBI) as well as from radial blood pressure curve Comparing to the traditional tonometry based method presented one is more convenient to use and it allows long-term monitoring of the AI what is not possible with tonometry probes
2 Method
Clinical experiments were carried out on 30 patients during coronary angiography in the Center of
Cardiology of East-Tallinn Central Hospital After that the found out spectral domain transfer
function TF was used to estimate the CAP waveform from the noninvasively measured radial EBI All
patients in age of 43 to 80 years were informed about the purpose and threats of an investigation and
they all have signed consents The investigation was carried in according to the decision of the Ethics
Committee of the National Institute for Health Development
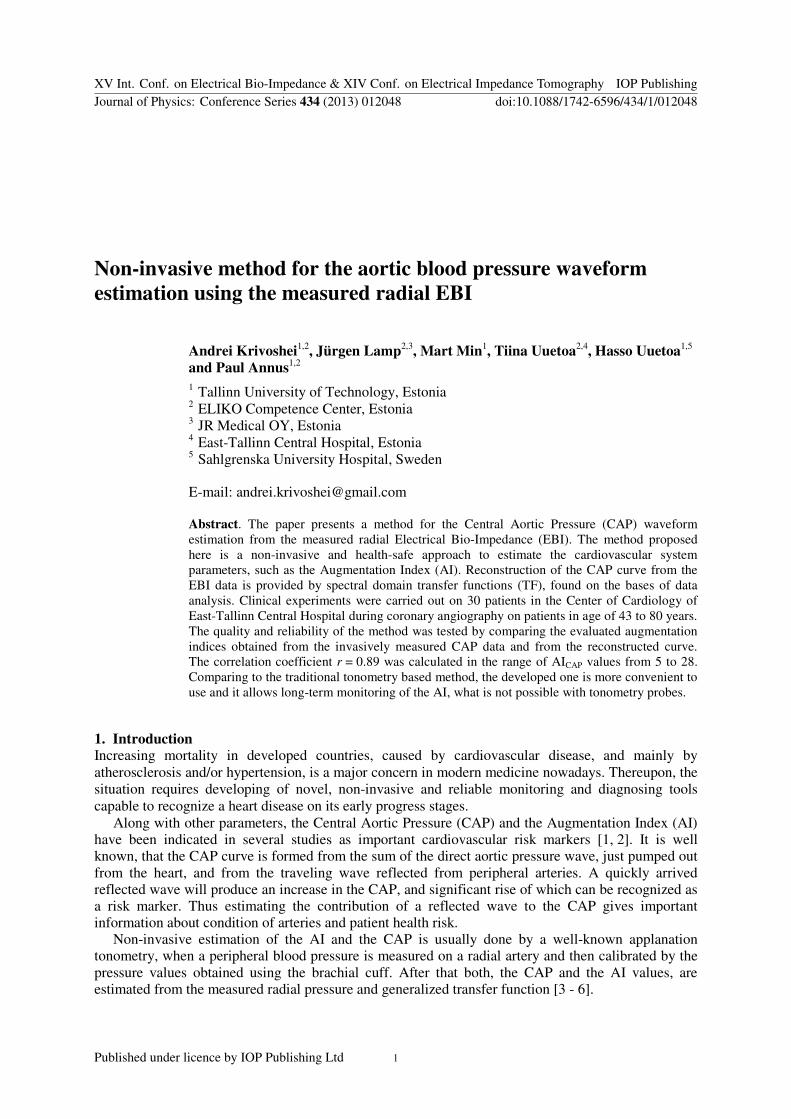
The EBI was measured using the bracelet-type holder and specially designed tetra-polar sensor (figure 1) placed on a wrist directly onto a radial artery in close region to a scaphoid bone The electrodes were made of non-toxic and non-irritable silver compound The distance between
measuring electrodes of 5 mm was used to limit the volume of the tissue under the measurement and thus to avoid any possible influence from surrounding veins and arteries The distance of 14 mm was used between the current injecting electrodes which were placed on the both sides from the voltage measuring electrodes The frequency of the injecting current was 125 kHz and the amplitude 02 mA
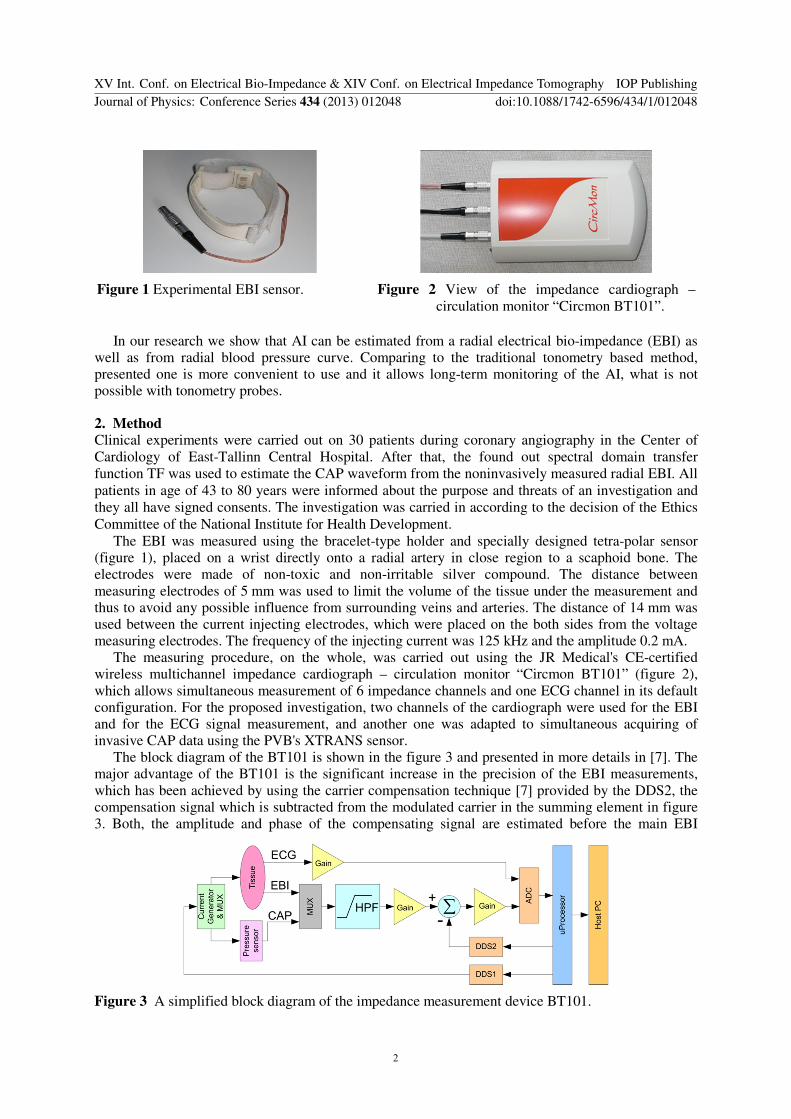
The measuring procedure on the whole was carried out using the JR Medicals CE-certified wireless multichannel impedance cardiograph ndash circulation monitor ldquoCircmon BT101rdquo (figure 2)
which allows simultaneous measurement of 6 impedance channels and one ECG channel in its default configuration For the proposed investigation two channels of the cardiograph were used for the EBI and for the ECG signal measurement and another one was adapted to simultaneous acquiring of invasive CAP data using the PVBs XTRANS sensor
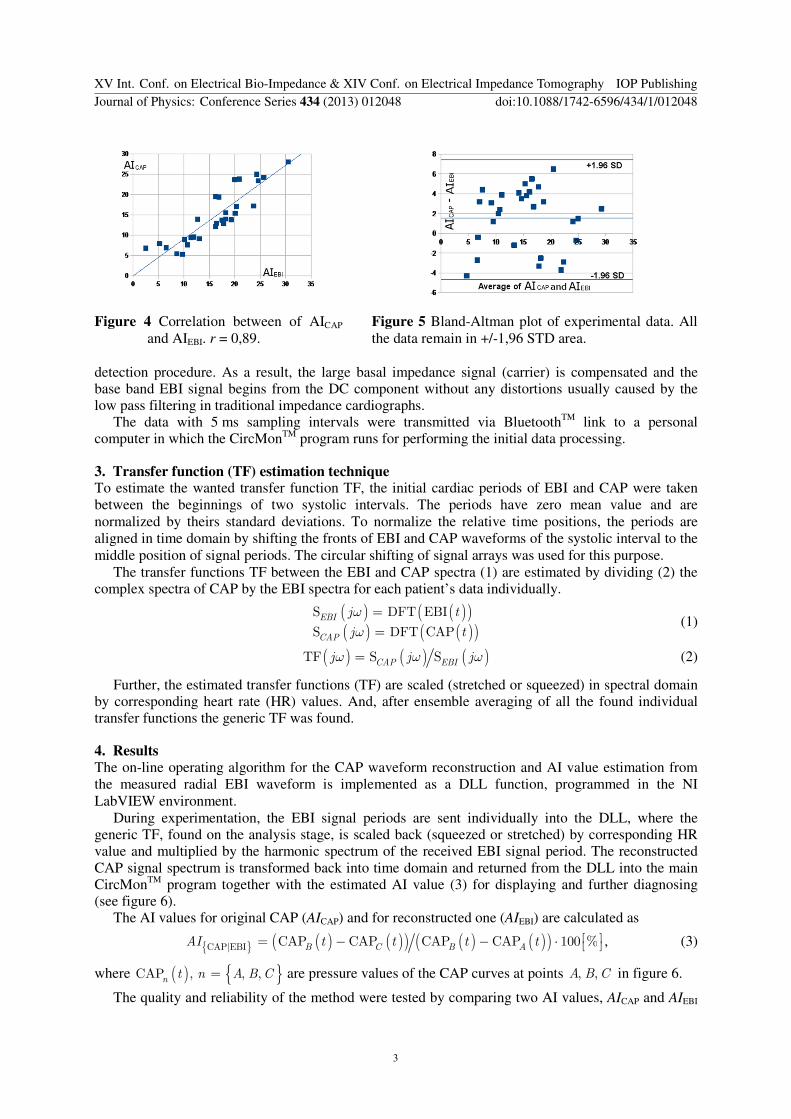
The block diagram of the BT101 is shown in the figure 3 and presented in more details in [7] The major advantage of the BT101 is the significant increase in the precision of the EBI measurements
which has been achieved by using the carrier compensation technique [7] provided by the DDS2 the compensation signal which is subtracted from the modulated carrier in the summing element in figure 3 Both the amplitude and phase of the compensating signal are estimated before the main EBI
Figure 1 Experimental EBI sensor Figure 2 View of the impedance cardiograph ndash
circulation monitor ldquoCircmon BT101rdquo
Figure 3 A simplified block diagram of the impedance measurement device BT101
XV Int Conf on Electrical Bio-Impedance amp XIV Conf on Electrical Impedance Tomography IOP PublishingJournal of Physics Conference Series 434 (2013) 012048 doi1010881742-65964341012048
2
detection procedure As a result the large basal impedance signal (carrier) is compensated and the base band EBI signal begins from the DC component without any distortions usually caused by the low pass filtering in traditional impedance cardiographs
The data with 5 ms sampling intervals were transmitted via BluetoothTM
link to a personal computer in which the CircMon
TM program runs for performing the initial data processing
3 Transfer function (TF) estimation technique To estimate the wanted transfer function TF the initial cardiac periods of EBI and CAP were taken
between the beginnings of two systolic intervals The periods have zero mean value and are
normalized by theirs standard deviations To normalize the relative time positions the periods are
aligned in time domain by shifting the fronts of EBI and CAP waveforms of the systolic interval to the
middle position of signal periods The circular shifting of signal arrays was used for this purpose
The transfer functions TF between the EBI and CAP spectra (1) are estimated by dividing (2) the complex spectra of CAP by the EBI spectra for each patientrsquos data individually
( ) ( )( )( ) ( )( )
S DFT EBI
S DFT CAPEBI
CAP
j t
j t
ω
ω
=
= (1)
( ) ( ) ( )TF S SCAP EBIj j jω ω ω= (2)
Further the estimated transfer functions (TF) are scaled (stretched or squeezed) in spectral domain by corresponding heart rate (HR) values And after ensemble averaging of all the found individual transfer functions the generic TF was found
4 Results
The on-line operating algorithm for the CAP waveform reconstruction and AI value estimation from
the measured radial EBI waveform is implemented as a DLL function programmed in the NI
LabVIEW environment
During experimentation the EBI signal periods are sent individually into the DLL where the generic TF found on the analysis stage is scaled back (squeezed or stretched) by corresponding HR value and multiplied by the harmonic spectrum of the received EBI signal period The reconstructed
CAP signal spectrum is transformed back into time domain and returned from the DLL into the main CircMon
TM program together with the estimated AI value (3) for displaying and further diagnosing
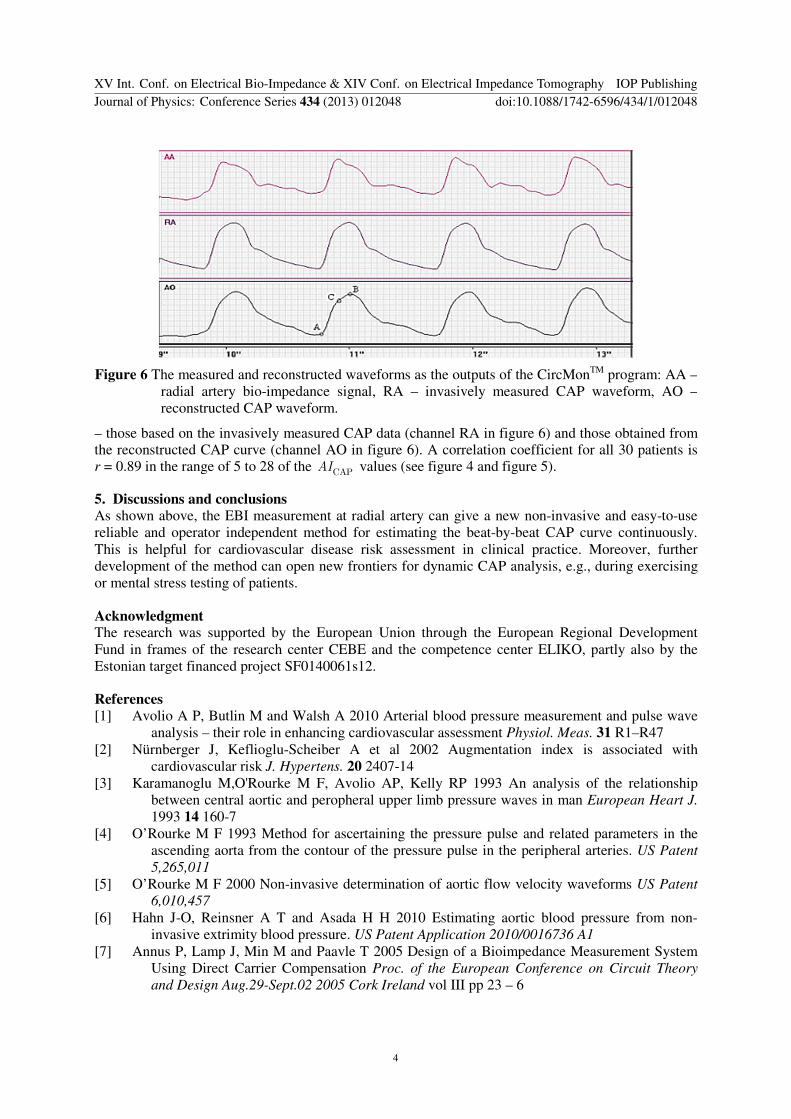
(see figure 6) The AI values for original CAP (AICAP) and for reconstructed one (AIEBI) are calculated as
( ) ( )( ) ( ) ( )( )CAP|EBI CAP CAP CAP CAP 100 B C B AAI t t t t = minus minus sdot (3)
where ( ) CAP nt n A B C= are pressure values of the CAP curves at points A B C in figure 6
The quality and reliability of the method were tested by comparing two AI values AICAP and AIEBI
Figure 4 Correlation between of AICAP
and AIEBI r = 089 Figure 5 Bland-Altman plot of experimental data All
the data remain in +-196 STD area
XV Int Conf on Electrical Bio-Impedance amp XIV Conf on Electrical Impedance Tomography IOP PublishingJournal of Physics Conference Series 434 (2013) 012048 doi1010881742-65964341012048
3
ndash those based on the invasively measured CAP data (channel RA in figure 6) and those obtained from the reconstructed CAP curve (channel AO in figure 6) A correlation coefficient for all 30 patients is r = 089 in the range of 5 to 28 of the CAPAI values (see figure 4 and figure 5)
5 Discussions and conclusions
As shown above the EBI measurement at radial artery can give a new non-invasive and easy-to-use
reliable and operator independent method for estimating the beat-by-beat CAP curve continuously
This is helpful for cardiovascular disease risk assessment in clinical practice Moreover further
development of the method can open new frontiers for dynamic CAP analysis eg during exercising
or mental stress testing of patients
Acknowledgment The research was supported by the European Union through the European Regional Development
Fund in frames of the research center CEBE and the competence center ELIKO partly also by the
Estonian target financed project SF0140061s12
References
[1] Avolio A P Butlin M and Walsh A 2010 Arterial blood pressure measurement and pulse wave
analysis ndash their role in enhancing cardiovascular assessment Physiol Meas 31 R1ndashR47
[2] Nuumlrnberger J Keflioglu-Scheiber A et al 2002 Augmentation index is associated with
cardiovascular risk J Hypertens 20 2407-14
[3] Karamanoglu MORourke M F Avolio AP Kelly RP 1993 An analysis of the relationship
between central aortic and peropheral upper limb pressure waves in man European Heart J
1993 14 160-7
[4] OrsquoRourke M F 1993 Method for ascertaining the pressure pulse and related parameters in the
ascending aorta from the contour of the pressure pulse in the peripheral arteries US Patent
5265011
[5] OrsquoRourke M F 2000 Non-invasive determination of aortic flow velocity waveforms US Patent
6010457
[6] Hahn J-O Reinsner A T and Asada H H 2010 Estimating aortic blood pressure from non-
invasive extrimity blood pressure US Patent Application 20100016736 A1
[7] Annus P Lamp J Min M and Paavle T 2005 Design of a Bioimpedance Measurement System
Using Direct Carrier Compensation Proc of the European Conference on Circuit Theory
and Design Aug29-Sept02 2005 Cork Ireland vol III pp 23 ndash 6
Figure 6 The measured and reconstructed waveforms as the outputs of the CircMonTM
program AA ndash
radial artery bio-impedance signal RA ndash invasively measured CAP waveform AO ndash
reconstructed CAP waveform
XV Int Conf on Electrical Bio-Impedance amp XIV Conf on Electrical Impedance Tomography IOP PublishingJournal of Physics Conference Series 434 (2013) 012048 doi1010881742-65964341012048
4
Non-invasive method for the aortic blood pressure waveform
estimation using the measured radial EBI
Andrei Krivoshei12
Juumlrgen Lamp23
Mart Min1 Tiina Uuetoa
24 Hasso Uuetoa
15
and Paul Annus12
1 Tallinn University of Technology Estonia
2 ELIKO Competence Center Estonia
3 JR Medical OY Estonia
4 East-Tallinn Central Hospital Estonia
5 Sahlgrenska University Hospital Sweden
E-mail andreikrivosheigmailcom
Abstract The paper presents a method for the Central Aortic Pressure (CAP) waveform
estimation from the measured radial Electrical Bio-Impedance (EBI) The method proposed
here is a non-invasive and health-safe approach to estimate the cardiovascular system
parameters such as the Augmentation Index (AI) Reconstruction of the CAP curve from the
EBI data is provided by spectral domain transfer functions (TF) found on the bases of data
analysis Clinical experiments were carried out on 30 patients in the Center of Cardiology of
East-Tallinn Central Hospital during coronary angiography on patients in age of 43 to 80 years
The quality and reliability of the method was tested by comparing the evaluated augmentation
indices obtained from the invasively measured CAP data and from the reconstructed curve
The correlation coefficient r = 089 was calculated in the range of AICAP values from 5 to 28
Comparing to the traditional tonometry based method the developed one is more convenient to
use and it allows long-term monitoring of the AI what is not possible with tonometry probes
1 Introduction Increasing mortality in developed countries caused by cardiovascular disease and mainly by
atherosclerosis andor hypertension is a major concern in modern medicine nowadays Thereupon the
situation requires developing of novel non-invasive and reliable monitoring and diagnosing tools
capable to recognize a heart disease on its early progress stages
Along with other parameters the Central Aortic Pressure (CAP) and the Augmentation Index (AI) have been indicated in several studies as important cardiovascular risk markers [1 2] It is well known that the CAP curve is formed from the sum of the direct aortic pressure wave just pumped out
from the heart and from the traveling wave reflected from peripheral arteries A quickly arrived reflected wave will produce an increase in the CAP and significant rise of which can be recognized as a risk marker Thus estimating the contribution of a reflected wave to the CAP gives important information about condition of arteries and patient health risk
Non-invasive estimation of the AI and the CAP is usually done by a well-known applanation tonometry when a peripheral blood pressure is measured on a radial artery and then calibrated by the
pressure values obtained using the brachial cuff After that both the CAP and the AI values are estimated from the measured radial pressure and generalized transfer function [3 - 6]
XV Int Conf on Electrical Bio-Impedance amp XIV Conf on Electrical Impedance Tomography IOP PublishingJournal of Physics Conference Series 434 (2013) 012048 doi1010881742-65964341012048
Published under licence by IOP Publishing Ltd 1
In our research we show that AI can be estimated from a radial electrical bio-impedance (EBI) as well as from radial blood pressure curve Comparing to the traditional tonometry based method presented one is more convenient to use and it allows long-term monitoring of the AI what is not possible with tonometry probes
2 Method
Clinical experiments were carried out on 30 patients during coronary angiography in the Center of
Cardiology of East-Tallinn Central Hospital After that the found out spectral domain transfer
function TF was used to estimate the CAP waveform from the noninvasively measured radial EBI All
patients in age of 43 to 80 years were informed about the purpose and threats of an investigation and
they all have signed consents The investigation was carried in according to the decision of the Ethics
Committee of the National Institute for Health Development
The EBI was measured using the bracelet-type holder and specially designed tetra-polar sensor (figure 1) placed on a wrist directly onto a radial artery in close region to a scaphoid bone The electrodes were made of non-toxic and non-irritable silver compound The distance between
measuring electrodes of 5 mm was used to limit the volume of the tissue under the measurement and thus to avoid any possible influence from surrounding veins and arteries The distance of 14 mm was used between the current injecting electrodes which were placed on the both sides from the voltage measuring electrodes The frequency of the injecting current was 125 kHz and the amplitude 02 mA
The measuring procedure on the whole was carried out using the JR Medicals CE-certified wireless multichannel impedance cardiograph ndash circulation monitor ldquoCircmon BT101rdquo (figure 2)
which allows simultaneous measurement of 6 impedance channels and one ECG channel in its default configuration For the proposed investigation two channels of the cardiograph were used for the EBI and for the ECG signal measurement and another one was adapted to simultaneous acquiring of invasive CAP data using the PVBs XTRANS sensor
The block diagram of the BT101 is shown in the figure 3 and presented in more details in [7] The major advantage of the BT101 is the significant increase in the precision of the EBI measurements
which has been achieved by using the carrier compensation technique [7] provided by the DDS2 the compensation signal which is subtracted from the modulated carrier in the summing element in figure 3 Both the amplitude and phase of the compensating signal are estimated before the main EBI
Figure 1 Experimental EBI sensor Figure 2 View of the impedance cardiograph ndash
circulation monitor ldquoCircmon BT101rdquo
Figure 3 A simplified block diagram of the impedance measurement device BT101
XV Int Conf on Electrical Bio-Impedance amp XIV Conf on Electrical Impedance Tomography IOP PublishingJournal of Physics Conference Series 434 (2013) 012048 doi1010881742-65964341012048
2
detection procedure As a result the large basal impedance signal (carrier) is compensated and the base band EBI signal begins from the DC component without any distortions usually caused by the low pass filtering in traditional impedance cardiographs
The data with 5 ms sampling intervals were transmitted via BluetoothTM
link to a personal computer in which the CircMon
TM program runs for performing the initial data processing
3 Transfer function (TF) estimation technique To estimate the wanted transfer function TF the initial cardiac periods of EBI and CAP were taken
between the beginnings of two systolic intervals The periods have zero mean value and are
normalized by theirs standard deviations To normalize the relative time positions the periods are
aligned in time domain by shifting the fronts of EBI and CAP waveforms of the systolic interval to the
middle position of signal periods The circular shifting of signal arrays was used for this purpose
The transfer functions TF between the EBI and CAP spectra (1) are estimated by dividing (2) the complex spectra of CAP by the EBI spectra for each patientrsquos data individually
( ) ( )( )( ) ( )( )
S DFT EBI
S DFT CAPEBI
CAP
j t
j t
ω
ω
=
= (1)
( ) ( ) ( )TF S SCAP EBIj j jω ω ω= (2)
Further the estimated transfer functions (TF) are scaled (stretched or squeezed) in spectral domain by corresponding heart rate (HR) values And after ensemble averaging of all the found individual transfer functions the generic TF was found
4 Results
The on-line operating algorithm for the CAP waveform reconstruction and AI value estimation from
the measured radial EBI waveform is implemented as a DLL function programmed in the NI
LabVIEW environment
During experimentation the EBI signal periods are sent individually into the DLL where the generic TF found on the analysis stage is scaled back (squeezed or stretched) by corresponding HR value and multiplied by the harmonic spectrum of the received EBI signal period The reconstructed
CAP signal spectrum is transformed back into time domain and returned from the DLL into the main CircMon
TM program together with the estimated AI value (3) for displaying and further diagnosing
(see figure 6) The AI values for original CAP (AICAP) and for reconstructed one (AIEBI) are calculated as
( ) ( )( ) ( ) ( )( )CAP|EBI CAP CAP CAP CAP 100 B C B AAI t t t t = minus minus sdot (3)
where ( ) CAP nt n A B C= are pressure values of the CAP curves at points A B C in figure 6
The quality and reliability of the method were tested by comparing two AI values AICAP and AIEBI
Figure 4 Correlation between of AICAP
and AIEBI r = 089 Figure 5 Bland-Altman plot of experimental data All
the data remain in +-196 STD area
XV Int Conf on Electrical Bio-Impedance amp XIV Conf on Electrical Impedance Tomography IOP PublishingJournal of Physics Conference Series 434 (2013) 012048 doi1010881742-65964341012048
3
ndash those based on the invasively measured CAP data (channel RA in figure 6) and those obtained from the reconstructed CAP curve (channel AO in figure 6) A correlation coefficient for all 30 patients is r = 089 in the range of 5 to 28 of the CAPAI values (see figure 4 and figure 5)
5 Discussions and conclusions
As shown above the EBI measurement at radial artery can give a new non-invasive and easy-to-use
reliable and operator independent method for estimating the beat-by-beat CAP curve continuously
This is helpful for cardiovascular disease risk assessment in clinical practice Moreover further
development of the method can open new frontiers for dynamic CAP analysis eg during exercising
or mental stress testing of patients
Acknowledgment The research was supported by the European Union through the European Regional Development
Fund in frames of the research center CEBE and the competence center ELIKO partly also by the
Estonian target financed project SF0140061s12
References
[1] Avolio A P Butlin M and Walsh A 2010 Arterial blood pressure measurement and pulse wave
analysis ndash their role in enhancing cardiovascular assessment Physiol Meas 31 R1ndashR47
[2] Nuumlrnberger J Keflioglu-Scheiber A et al 2002 Augmentation index is associated with
cardiovascular risk J Hypertens 20 2407-14
[3] Karamanoglu MORourke M F Avolio AP Kelly RP 1993 An analysis of the relationship
between central aortic and peropheral upper limb pressure waves in man European Heart J
1993 14 160-7
[4] OrsquoRourke M F 1993 Method for ascertaining the pressure pulse and related parameters in the
ascending aorta from the contour of the pressure pulse in the peripheral arteries US Patent
5265011
[5] OrsquoRourke M F 2000 Non-invasive determination of aortic flow velocity waveforms US Patent
6010457
[6] Hahn J-O Reinsner A T and Asada H H 2010 Estimating aortic blood pressure from non-
invasive extrimity blood pressure US Patent Application 20100016736 A1
[7] Annus P Lamp J Min M and Paavle T 2005 Design of a Bioimpedance Measurement System
Using Direct Carrier Compensation Proc of the European Conference on Circuit Theory
and Design Aug29-Sept02 2005 Cork Ireland vol III pp 23 ndash 6
Figure 6 The measured and reconstructed waveforms as the outputs of the CircMonTM
program AA ndash
radial artery bio-impedance signal RA ndash invasively measured CAP waveform AO ndash
reconstructed CAP waveform
XV Int Conf on Electrical Bio-Impedance amp XIV Conf on Electrical Impedance Tomography IOP PublishingJournal of Physics Conference Series 434 (2013) 012048 doi1010881742-65964341012048
4