non-isothermal modeling and simulation for a soluble-lead acid flow battery
TRANSCRIPT

International Journal of Advances in Engineering & Technology, Jan., 2015.
©IJAET ISSN: 22311963
1630 Vol. 7, Issue 6, pp. 1630-1641
NON-ISOTHERMAL MODELING AND SIMULATION FOR A
SOLUBLE-LEAD ACID FLOW BATTERY
Amir A-K. Omran, Hassan. Al-Fetlawi, Falah K. Matlub Department of Electrochemical Engineering,
Babylon University, Hilla City, Iraq
ABSTRACT Non-isothermal two-dimensional transient model for a soluble lead-acid flow battery is developed, including the
negative electrode, positive electrode and the flow space between them. The model based on a comprehensive
description of mass, charge, energy and momentum transport and conservation, and is combined with a global
kinetic model for reactions involving lead species. The influence of the applied current density, operating
temperature, inlet electrolyte velocity and initial concentration of lead ions on the charge/discharge behavior
are investigated. Numerical simulations have shown increasing the applied current density can decrease the cell
voltage. Increasing cell temperature improved the cell voltage with a very little effect on the outlet
concentrations, so cell temperature can be considered a key parameter to optimize the performance. Simulated
behavior shows a very little effect with variations in the inlet electrolyte velocity, while changing in the initial
concentration of lead ions have shown a good influence on the performance.
KEY WORDS: Redox flow batteries, soluble lead-acid, non-isothermal, modeling, simulation.
I. INTRODUCTION
Among rechargeable batteries, the redox flow batteries (RFB) have some advantages where the
electrodes are not being part of electrochemical fuel. The electrodes do not undergo physical and
chemical changes during operation, thus leading to more stable and durable performance [1]. Long
charge/discharge cycle service life is realized. The storage capacity can be increased easily by
increasing the capacity of the electrolyte tanks (installing additional tanks) [2]. Energy storage
capability depends on the quantity of the reactant species in solution [3]. Scale up can be easily
achieved by increasing the electrode size or by adding more electrodes in each stack. Power can be
simply determined by the numbers of cells in the stack and size of electrodes. The applications of
redox flow batteries are numerous, including load leveling and peak shaving, power quality control
application, facilitating renewable energy deployment and energy storage for electric vehicles [4, 5].
The soluble lead-acid redox flow battery proposed over the last ten years by Pletcher and et al has two
inert electrodes and a single electrolyte of lead methanesulfonate, Pb(CH3SO3)2, in methanesulfonic
acid, (CH3SO3H), and it is based on the electrode reactions of Pb(II) in the acid [6, 7]. During charge,
lead deposits at the negative electrode while lead dioxide deposits at the positive one. While During
discharge, the lead and lead dioxide layers re-dissolve via oxidation and reduction, respectively, back
to the soluble lead(II) ion [6, 8].
Pb ⇌ Pb2+ + 2e- (1)
PbO2 + 4H+ + 2e- ⇌ Pb2+ + 2H2O (2)
The overall cell reaction is:
Pb + PbO2 +4H+ ⇌ 2Pb2+ + 2H2O (3)
The lead acid flow system differs from the traditional lead acid battery [9] since the electrolyte is
aqueous methanesulfonic acid and lead ions is highly soluble in this acid [10]. While the very familiar
static lead acid battery operates with a sulfuric acid electrolyte where the source of the Pb(II) is an
insoluble lead sulfate present in a paste on the surface of the two electrodes [11, 12]. In comparison

International Journal of Advances in Engineering & Technology, Jan., 2015.
©IJAET ISSN: 22311963
1631 Vol. 7, Issue 6, pp. 1630-1641
with other flow batteries, the soluble lead acid flow battery has the key advantage that it employs only
a single electrolyte and therefore operates without a membrane separator [7]. This simplifies the cell
design and halves the number of pumps and reservoirs in the system, as well as avoiding the cost
problems associating with membrane [7, 9]. The absence of a membrane also has appositive influence
on the energy efficiency and the cell chemistry avoids the problems associated with leakage and
cross-contamination of species through a membrane that severely hampered other flow batteries [6].
The approaching commercialization of a whole class of redox flow cell storage systems sets a series
of new challenges to developers of this new technology, notably scale-up and optimization (with
regards to flow geometries and operating conditions), improvement in electrolyte stability,
development of electrode materials resistant to oxidation. Many of these challenges are not
particularly well suited to laboratory analysis alone, by virtue of the associated financial costs and
long timescales. In such cases it is beneficial to employ modeling and simulation as a means of down-
selecting laboratory test scenarios so that, wherever possible, extensive laboratory experimentation
can be avoided.
This work has done at the Electrochemical Engineering Department at the University of Babylon.
II. MODEL DEVELOPMENT
2.1 Model assumptions
The model is based on the two-dimensional slice depicted in Figure 1. The two-dimensional
approximation leads to a considerable saving in computational time without a major loss in accuracy
if the electrolyte flow rate is reasonably high, as in normal operation. The reactions that occur in the
soluble lead acid flow battery during charge and discharge have shown by reaction (1) and (2).
Figure 1: The soluble lead acid battery and the flow system.
The following assumptions have been made in the present study:
The dilute solution approximation is employed, assuming water to be a dominant component, so water
properties for density and viscosity are used. Flow is considered laminar and incompressible. Side
reactions involving PbOx formation reaction and oxygen evolution reaction are not considered. The
thicknesses of the Pb and PbO2 deposits are small compared to the reactor dimensions and are,
therefore, neglected. The electrolyte mixture only dissociate into Pb2+, H+, and HSO4-.
2.2 Model equations
2.2.1 Principles of conservation
A volume-averaged mass balance for each species (Pb2+, H2O and H+) in the liquid electrolyte
can be expressed in the following form: 𝜕𝑐𝑖
𝜕𝑡 + ∇𝑁𝑖 = −𝑆𝑖 (3)
𝑆𝑖 is the source term for species i, the source term defined in Table 1.

International Journal of Advances in Engineering & Technology, Jan., 2015.
©IJAET ISSN: 22311963
1632 Vol. 7, Issue 6, pp. 1630-1641
Table 1: Source and sinks for the liquid phase for equation (3).
Source term -ve electrode +ve electrode
Pb2+ ∇. 𝑖1⃗⃗ 2𝐹⁄ ∇. 𝑖2⃗⃗⃗ 2𝐹⁄
H2O − ∇. 𝑖2⃗⃗⃗ 𝐹⁄
H+ − 2∇. 𝑖2⃗⃗⃗ 𝐹⁄
For concentration fluxes, modified Nernst-Planck can be used, in which transport of a charged species
occur by diffusion, migration, and convection. The total flux is:
𝑁𝑖⃗⃗ ⃗= −𝐷𝑖 ∇𝑐𝑖 −
𝑧𝑖𝑐𝑖𝐷𝑖
𝑅𝑇 𝐹 ∇𝜙𝑒 + 𝑢⃗⃗⃗ 𝑐𝑖 (4)
The electrolyte is considered to be electrically neutral, ∑ 𝑧𝑖𝑐𝑖𝑖 = 0
The bulk flow velocity of the electrolyte solution is given by the incompressible Navier–Stokes
equation and continuity equations.
𝜌 𝜕 𝑢⃗⃗ ⃗
𝜕𝑡 + 𝜌 ( 𝑢⃗⃗⃗ . ∇) 𝑢⃗⃗⃗ = −∇𝑝 + 𝜇 ∇2 𝑢⃗⃗⃗ (5)
∇ 𝑢⃗⃗⃗ = 0 (6)
The total current density in the electrolyte can be calculated, using electroneutrality condition:
𝑖𝑒⃗⃗⃗ = ∑ 𝑧𝑖𝐹 𝑁𝑖⃗⃗ ⃗
𝑖 = −𝜎𝑒 ∇𝜙𝑒 −𝐹 ∑ 𝑧𝑖𝐷𝑖 ∇𝑐𝑖𝑖 (7)
where the ionic conductivity, 𝜎𝑒, is given by:
𝜎𝑒 = 𝐹2
𝑅𝑇 ∑ 𝑧𝑖
2𝑖 𝐷𝑖𝑐𝑖 (8)
At all points, including the boundaries, the ionic and electronic currents satisfy the condition of charge
conservation yields:
∇. 𝑖𝑒⃗⃗⃗ + ∇. 𝑖𝑠⃗⃗ = 0 (9)
The electronic potential in the electrodes is given by Ohm's law:
−𝜎𝑠 ∇2𝜙𝑠 = −∇. 𝑖 (10)
2.2.2 Reaction kinetics and cell voltage
From the Butler–Volmer expression for charge-transfer kinetics. The common approximation
of equal charge-transfer coefficients for the forward and reverse reactions has been made for the
reactions at both electrodes
𝑖1 = 𝐹𝑘0𝑃𝑏𝑐𝑃𝑏2+ [𝑒𝑥𝑝 (
𝐹 𝜂−
𝑅𝑇) − 𝑒𝑥𝑝 (
𝐹 𝜂−
𝑅𝑇)] (11)
𝑖2 = 𝐹𝑘0𝑃𝑏𝑂2 𝑐𝑃𝑏2+ (
𝑐𝐻+
𝑐𝐻+0 ) [𝑒𝑥𝑝 (
𝐹 𝜂+
𝑅𝑇) − 𝑒𝑥𝑝 (
𝐹 𝜂+
𝑅𝑇)] (12)
where the overpotential is given by:
𝜂± = 𝜙𝑠± − 𝜙𝑒 − 𝐸± (13)
where 𝐸± are the open-circuit potentials for reaction (1) and (2), respectively, estimated from the
Nernst equations:
𝐸− = 𝐸0,1 + 2.3𝑅𝑇
𝐹 ln 𝑐𝑃𝑏2+ (14)
𝐸+ = 𝐸0,2 + 2.3𝑅𝑇
𝐹 (ln 𝑐𝑃𝑏2+ − ln 𝑐𝐻+) (15)
2.2.3 Energy balance
The energy balance takes into account heat conduction, convective heat transport and heat
generation by reaction and ohmic resistance. As a reasonable first approximation it is assumed that the
liquid and solid phases in the same temperature. The energy balance is thus:
𝜕
𝜕𝑡(𝜌𝑙𝐶𝑙̅̅ ̅̅ ̅𝑇) + ∇. (�⃗� 𝜌𝑙𝐶𝑙𝑇) − �̅�∇2𝑇 = ∑ 𝑄𝑘𝑘 (16)
The heat generation term, 𝑄𝑘 are defined in Table 2: they represent heating by activation losses,
reaction and ohmic resistance.

International Journal of Advances in Engineering & Technology, Jan., 2015.
©IJAET ISSN: 22311963
1633 Vol. 7, Issue 6, pp. 1630-1641
Table 2: Sources and sinks for the energy equation (18).
Term -ve electrode +ve electrode
𝑄𝑎𝑐𝑡 𝜂1 ∇. 𝑖1⃗⃗ 𝜂2 ∇. 𝑖2⃗⃗⃗ 𝑄𝑟𝑒𝑣 −∆𝑆1𝑇 ∇. 𝑖1⃗⃗ /𝐹 −∆𝑆2𝑇 ∇. 𝑖2⃗⃗⃗ /𝐹
𝑄𝑜ℎ𝑚 𝜎𝑠 |∇𝜙𝑠|2 + 𝜎𝑒 |∇𝜙𝑒|
2 𝜎𝑠 |∇𝜙𝑠|2 + 𝜎𝑒 |∇𝜙𝑒|
2
These standard reaction entropies are given by:
∆𝑆0,𝑗 =(∑ 𝑆0,𝑗𝑝𝑟𝑜𝑑𝑢𝑐𝑡𝑠
𝑝𝑟𝑜𝑑𝑢𝑐𝑡𝑠 ) − (∑ 𝑆0,𝑗𝑟𝑒𝑎𝑐𝑡𝑎𝑛𝑡𝑠
𝑟𝑒𝑎𝑐𝑡𝑎𝑛𝑡𝑠 ) (17)
where 𝑆0,𝑗𝑝𝑟𝑜𝑑𝑢𝑐𝑡𝑠
, 𝑆0,𝑗𝑟𝑒𝑎𝑐𝑡𝑎𝑛𝑡𝑠 are the standard entropies of formation of the products and reactants in
reactions (j = 1, and 2). Their values at 298.15 K. For each reaction j, the standard reaction entropy is
related to the standard Gibbs free energy change of the reaction,∆𝐺0,𝑗, and the standard enthalpy
change of reaction, ∆𝐻0,𝑗, by the thermodynamic relation:
∆𝐺0,𝑗 = ∆𝐻0,𝑗 − 𝑇∆𝑆0,𝑗 (18)
Using equation (18) and the relation ∆𝐺0,𝑗 = −𝑛𝐹𝐸0,𝑗 , where 𝐸0,𝑗 is the standard potential of reaction
j, the temperature dependence of ∆𝑆0,𝑗 is obtained:
−𝑛𝐹 𝜕∆𝐸0,𝑗
𝜕𝑇 =
𝜕∆𝐺0,𝑗
𝜕𝑇 = ∆𝑆0,𝑗 (19)
The standard potentials 𝐸0,1, 𝐸0,2 are functions of temperature [13]:
𝐸0𝑇 = 𝐸0
298 + (𝑇 − 298) (𝑑𝐸0
𝑑𝑇)298
(20)
where 𝐸0298 is the standard electrode potential at T= 298 K , (
𝑑𝐸0
𝑑𝑇)298
is the temperature coefficient of
the standard electrode potential. So the standard electrode potentials at both the negative and positive
electrodes, respectively are:
𝐸0,1𝑇 = 𝐸0,1
298 + (𝑇 − 298) (−395 × 10−5) (21)
𝐸0,2𝑇 = 𝐸0,2
298 + (𝑇 − 298) (−253 × 10−5) (22)
The reaction constants are also temperature dependent. They can be written in Arrhenius form
as follows [14]:
𝑘𝑗 = 𝑘𝑟𝑒𝑓,𝑗 exp (−∆𝐺0,𝑗
𝑅 [
1
𝑇𝑟𝑒𝑓,𝑗−
1
𝑇]) (23)
and hence;
𝑘𝑗 = 𝑘𝑟𝑒𝑓,𝑗 exp (𝑛𝐹𝐸0,𝑗
𝑅 [
1
𝑇𝑟𝑒𝑓,𝑗−
1
𝑇]) (24)
where 𝑘𝑟𝑒𝑓,𝑗 is the values of 𝑘𝑗 at a reference temperature 𝑇𝑟𝑒𝑓,𝑗 ( 𝑗 = 1, 2).
2.2.4 Reservoir and recirculation equations
The movement of the electrolyte solution between the electrodes and the pump alters the
concentrations at the inlet boundaries with time. Invoking conservation of volume, the volumetric
flow at the outlet boundary, which has a cross-sectional area 𝐴𝑜𝑢𝑡, is 𝜔 = 𝑣𝑖𝑛𝐴𝑜𝑢𝑡. From the
calculated average concentration at the outflow boundary,
𝑐𝑖𝑜𝑢𝑡 = ∫𝑦=ℎ𝑐𝑖 𝑑𝑥 (25)
The inlet concentrations are approximated from the following mass balance, which assumes
instantaneous mixing and negligible reaction in the reservoir of electrolyte volume, 𝑉.
𝑑𝑐𝑖
𝑖𝑛
𝑑𝑡 =
𝜔
𝑉 (𝑐𝑖
𝑜𝑢𝑡 − 𝑐𝑖𝑖𝑛); 𝑐𝑖
𝑖𝑛(0) = 𝑐𝑖0 (26)
The inlet temperature is determined by a heat balance performed along similar lines (assuming that
density and specific heat capacity of the solutions are constant and that instantaneous mixing occurs in
the reservoirs):
𝑑𝑇𝑖𝑛
𝑑𝑡 =
𝜔
𝑉 (𝑇𝑜𝑢𝑡 − 𝑇𝑖𝑛); 𝑇𝑖𝑛(0) = 𝑇0 (27)

International Journal of Advances in Engineering & Technology, Jan., 2015.
©IJAET ISSN: 22311963
1634 Vol. 7, Issue 6, pp. 1630-1641
where 𝑇𝑖𝑛 and 𝑇𝑜𝑢𝑡 are the temperatures at the inflow and outflow boundaries, respectively.
2.3 Initial and boundary conditions
Along the electrode surfaces, a Neumann condition was applied for the pressure:
∇𝑝. �⃗� = 0 (Except inlet and outlet surfaces) (28)
At the inlet, each species of the liquid electrolyte solution enters with a prescribed bulk
velocity and the species concentrations are given:
𝑐𝑖 = 𝑐𝑖𝑖𝑛(𝑡) and �⃗� = (0, 𝑣𝑖𝑛) (inlets) (29)
At the outlets, the liquid pressure is prescribed and the diffusive fluxes of the species are set
to a zero value (fully developed flow conditions):
−𝐷𝑖 ∇𝑐𝑖 . �⃗� = 0 𝑝 = 𝑝𝑜𝑢𝑡 (outlets) (30)
At the electrode surfaces, no-slip conditions are applied:
�⃗� = 0; 𝑥 = 0, 𝑥 = 𝑤 (31)
The flux conditions for the potential distribution of the electrodes are as follow:
−𝜎𝑠 ∇𝜙𝑠 = 0; 𝑥 = 0, 𝑥 = 𝑤, 𝑦 = 0, 𝑦 = ℎ (32)
The potential distribution for electrolyte is specified as (during charge):
−𝜎𝑒 ∇𝜙𝑒 . �⃗� = { 𝐼𝑎𝑝𝑝; 𝑥 = 0
−𝐼𝑎𝑝𝑝; 𝑥 = 𝑤 (33)
For the discharge signs are reversed.
The temperature at the inlets is given separately as:
𝑇 = 𝑇𝑖𝑛 (34)
Consistent initial conditions are prescribed for the concentrations and potentials, as follows:
At the negative electrode:
𝑐𝑖 = 𝑐𝑖0
𝜙𝑠−= 𝐸−
𝜙 = 0
(35)
At the positive electrode:
𝑐𝑖 = 𝑐𝑖0
𝜙𝑠+= 𝐸+
𝜙 = 0
(36)
The initial temperature is uniform through the cell:
𝑇(𝑡 = 0) = 𝑇0 (37)
2.4 Numerical details
The model presented above was solved using the COMSOL Multiphysics® package, with a
combination of the convection–diffusion, general-form and PDE options. The package is based on the
finite-element method; a quadratic basis was used in all of the simulations, together with 13528
elements. The relative error tolerance was set to 1 × 10⁻⁶. The default set of operating conditions is
given in Table 4 and the default parameter values are given in Tables (3, 5, 6, 7).
III. RESULTS AND DISCUSSION
3.1 Effect of the applied current
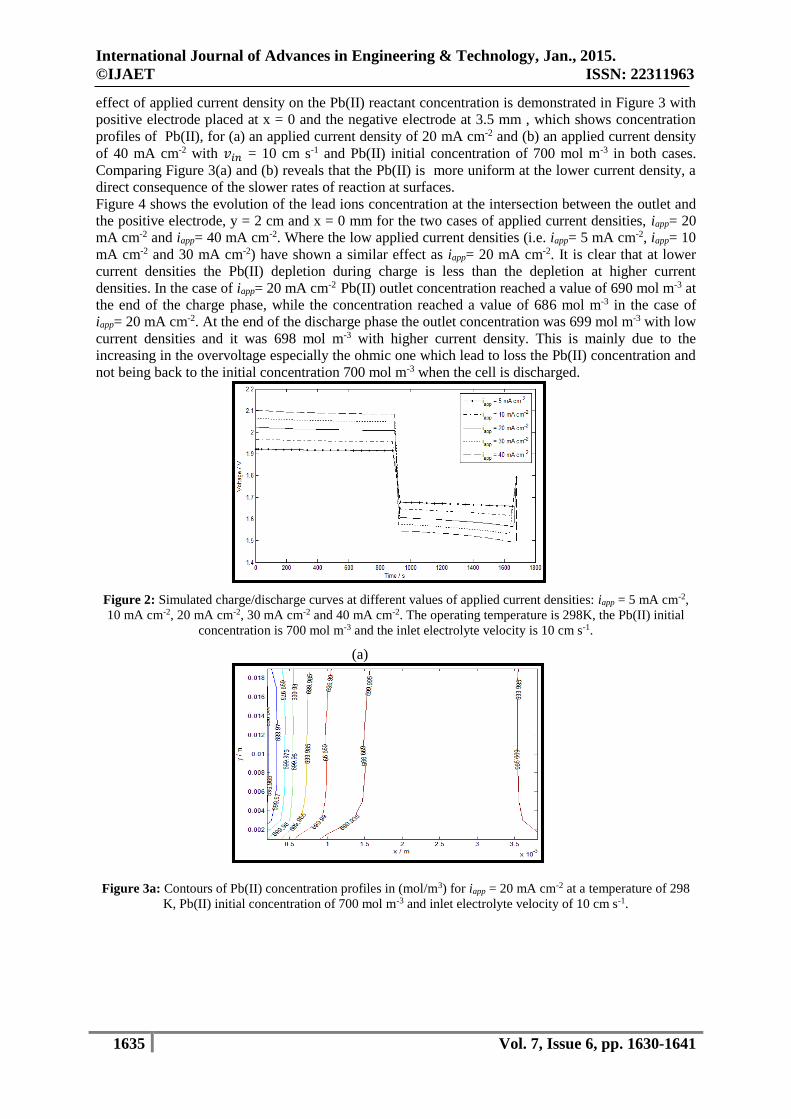
Figure 2 shows simulated charge-discharge curves at different applied current densities: iapp = 5 mA
cm-2, 10 mA cm-2, 20 mA cm-2, 30 mA cm-2 and 40 mA cm-2. The sign of the current is reversed
during discharge. In all cases the initial temperature is T0 = 298 K, the Pb(II) initial concentration is
700 mol m-3 and the inlet electrolyte velocity is 10 cm s-1. As the applied current density is increased,
the cell voltage increases during charge, and the drop in cell voltage between charge and discharge
increases. This is primarily due to the increased ohmic resistance as the current density increased. The
International Journal of Advances in Engineering & Technology, Jan., 2015.
©IJAET ISSN: 22311963
1635 Vol. 7, Issue 6, pp. 1630-1641
effect of applied current density on the Pb(II) reactant concentration is demonstrated in Figure 3 with
positive electrode placed at x = 0 and the negative electrode at 3.5 mm , which shows concentration
profiles of Pb(II), for (a) an applied current density of 20 mA cm-2 and (b) an applied current density
of 40 mA cm-2 with 𝑣𝑖𝑛 = 10 cm s-1 and Pb(II) initial concentration of 700 mol m-3 in both cases.
Comparing Figure 3(a) and (b) reveals that the Pb(II) is more uniform at the lower current density, a
direct consequence of the slower rates of reaction at surfaces.
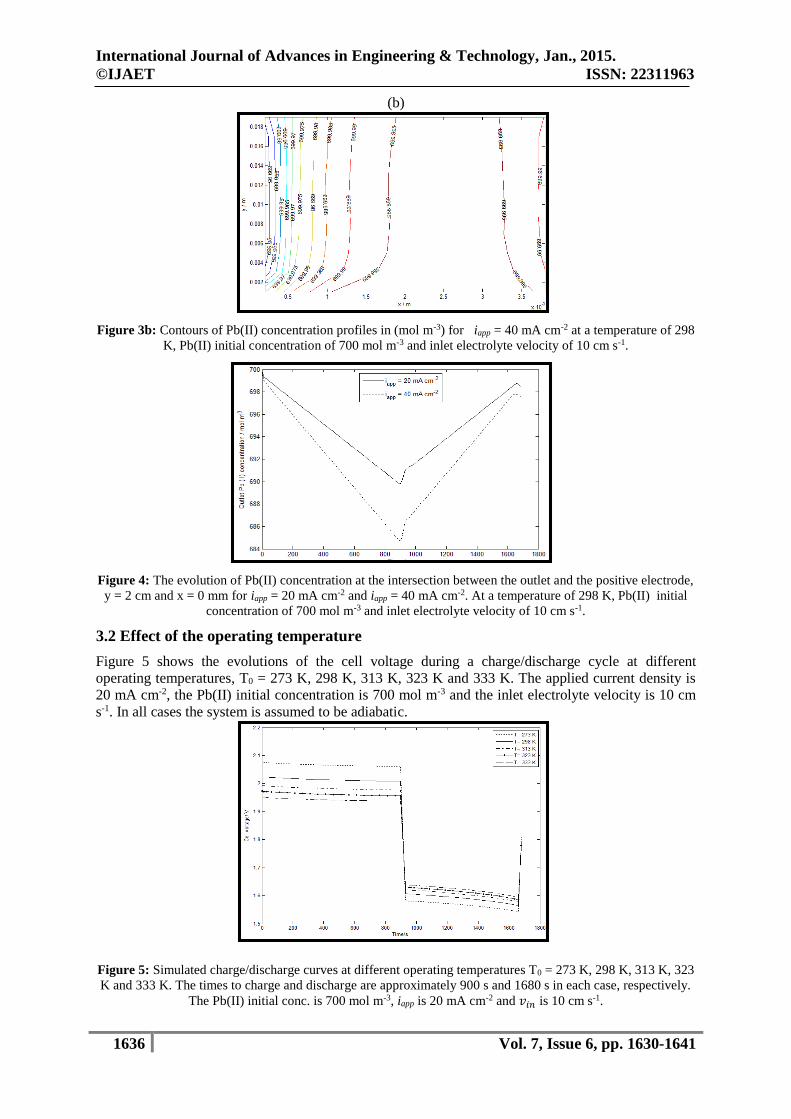
Figure 4 shows the evolution of the lead ions concentration at the intersection between the outlet and
the positive electrode, y = 2 cm and x = 0 mm for the two cases of applied current densities, iapp= 20
mA cm-2 and iapp= 40 mA cm-2. Where the low applied current densities (i.e. iapp= 5 mA cm-2, iapp= 10
mA cm-2 and 30 mA cm-2) have shown a similar effect as iapp= 20 mA cm-2. It is clear that at lower
current densities the Pb(II) depletion during charge is less than the depletion at higher current
densities. In the case of iapp= 20 mA cm-2 Pb(II) outlet concentration reached a value of 690 mol m-3 at
the end of the charge phase, while the concentration reached a value of 686 mol m-3 in the case of
iapp= 20 mA cm-2. At the end of the discharge phase the outlet concentration was 699 mol m-3 with low
current densities and it was 698 mol m-3 with higher current density. This is mainly due to the
increasing in the overvoltage especially the ohmic one which lead to loss the Pb(II) concentration and
not being back to the initial concentration 700 mol m-3 when the cell is discharged.
Figure 2: Simulated charge/discharge curves at different values of applied current densities: iapp = 5 mA cm-2,
10 mA cm-2, 20 mA cm-2, 30 mA cm-2 and 40 mA cm-2. The operating temperature is 298K, the Pb(II) initial
concentration is 700 mol m-3 and the inlet electrolyte velocity is 10 cm s-1.
(a)
Figure 3a: Contours of Pb(II) concentration profiles in (mol/m3) for iapp = 20 mA cm-2 at a temperature of 298
K, Pb(II) initial concentration of 700 mol m-3 and inlet electrolyte velocity of 10 cm s-1.
International Journal of Advances in Engineering & Technology, Jan., 2015.
©IJAET ISSN: 22311963
1636 Vol. 7, Issue 6, pp. 1630-1641
(b)
Figure 3b: Contours of Pb(II) concentration profiles in (mol m-3) for iapp = 40 mA cm-2 at a temperature of 298
K, Pb(II) initial concentration of 700 mol m-3 and inlet electrolyte velocity of 10 cm s-1.
Figure 4: The evolution of Pb(II) concentration at the intersection between the outlet and the positive electrode,
y = 2 cm and x = 0 mm for iapp = 20 mA cm-2 and iapp = 40 mA cm-2. At a temperature of 298 K, Pb(II) initial
concentration of 700 mol m-3 and inlet electrolyte velocity of 10 cm s-1.
3.2 Effect of the operating temperature
Figure 5 shows the evolutions of the cell voltage during a charge/discharge cycle at different
operating temperatures, T0 = 273 K, 298 K, 313 K, 323 K and 333 K. The applied current density is
20 mA cm-2, the Pb(II) initial concentration is 700 mol m-3 and the inlet electrolyte velocity is 10 cm
s-1. In all cases the system is assumed to be adiabatic.
Figure 5: Simulated charge/discharge curves at different operating temperatures T0 = 273 K, 298 K, 313 K, 323
K and 333 K. The times to charge and discharge are approximately 900 s and 1680 s in each case, respectively.
The Pb(II) initial conc. is 700 mol m-3, iapp is 20 mA cm-2 and 𝑣𝑖𝑛 is 10 cm s-1.

International Journal of Advances in Engineering & Technology, Jan., 2015.
©IJAET ISSN: 22311963
1637 Vol. 7, Issue 6, pp. 1630-1641
During charge, there is a clear decrease in the cell voltage as the temperature is raised and during
discharge the cell voltage is increased, i.e., the deviation of the cell voltage from the equilibrium value
decreases as the temperature is increased, this behavior is in agreement with published work by Al-
Fetlawi and et al [18], but Alex Bates and et al [16] have showed opposite behavior with increasing
temperature. The decreasing deviation of the cell voltage from the equilibrium value with increasing
temperature is due to reduction in the equilibrium potentials given by equations (14) and (15) and
equations (21) and (22) for fixed initial concentrations of the reactants and also increasing the rate
constants, 𝑘𝑗, given in equations (23) and (24). For lower temperatures, the decreased reaction rate
constant leads to an increase in the magnitude of the overpotential, as seen from the Butler-Volmer
equations (11) and (12).
3.3 Effect of the inlet electrolyte velocity
Simulation results have shown that the variations in the inlet electrolyte velocity have very little effect
on cell voltage during charge and discharge. Increasing the inlet electrolyte velocity in the range
(2 − 20) cm s-1 lead to change in the charge/discharge voltages in the range of about 0.01 V. Figure 6
compares the charge/discharge curves for the base case 𝑣𝑖𝑛 = 10 cm s-1 with 𝑣𝑖𝑛 = 2 cm s-1, 5 cm s-1,
15 cm s-1 and 20 cm s-1.
Only when the inlet electrolyte velocity varies from 10 cm s-1 to 20 cm s-1, there was a change in the
concentration of Pb(II) with time in the intersection point between the outlet ant the positive
electrode, y = 2 cm and x = 0 mm. At the end of the charge phase the concentration reached 690 mol
m-3 with 𝑣𝑖𝑛 = 10 cm s-1 and reached 691 mol m-3 with 𝑣𝑖𝑛 = 20 cm s-1. In the end of the discharge the
effect also was little, that Pb(II) concentration changed from 699 mol m-3 to 698 mol m-3 as shown in
Figure 7. The inlet electrolyte velocity primarily affects the convection flux of species.
Figure 6: Simulated charge-discharge curves at different inlet electrolyte velocities; 𝑣𝑖𝑛 = 2 cm s-1,
5 cm s-1, 10 cm s-1, 15 cm s-1 and 20 cm s-1. The iapp = 20 mA cm-2, the initial Pb(II) conce. = 700
mol m-3 and the T = 298 K.
Figure 7: The evolution of Pb(II) concentration at the intersection between the outlet and the positive
electrode, y = 2 cm and x = 0 mm at 𝑣𝑖𝑛 = 10 cm s-1 and 𝑣𝑖𝑛 = 20 cm s-1, with iapp = 20 mA cm-2, the initial
Pb(II) conce. = 700 mol m-3 and T =298 K for both cases.

International Journal of Advances in Engineering & Technology, Jan., 2015.
©IJAET ISSN: 22311963
1638 Vol. 7, Issue 6, pp. 1630-1641
3.4 Effect of the Pb(II) initial concentration
Figure 8 shows the changes in the simulation charge/discharge voltages versus time resulting from
changes in the initial concentration of Pb(II). Increasing the Pb(II) initial concentration in the
electrolyte reduces the voltage during charge, voltage is only slightly affected during discharge.
Figure 8: Simulated charge/discharge curves at different initial concentration of Pb(II); 300 mol m-3, 500 mol
m-3, 700 mol m-3, 900 mol m-3 and 1000 mol m-3, at T = 298 K, iapp = 20 mA cm-2 and 𝑣𝑖𝑛 = 10 cm s-1.
IV. CONCLUSIONS
A non-isothermal transient two-dimensional model for the soluble lead-acid redox flow battery has
been developed. The impact of changing the operating conditions, including applied current density,
temperature, inlet electrolyte velocity, and Pb(II) initial concentration on the performance was
investigated.
Increasing the applied current density badly affected the performance. Voltage efficiency markedly
decreased with higher current densities due to the high overpotential associated with high current
densities. Also increasing the applied current density has increased the depletion rate of Pb(II) during
charge and lower the outlet Pb(II) concentration.
Higher operating temperatures enhanced the performance by reducing the overpotentials, increasing
the reaction rate and improving the voltage efficiency. This indicates cell temperature may be a key in
optimizing a lead acid flow battery.
Changing the inlet electrolyte velocity showed no significant effect on the cell voltage and little effect
on the voltage efficiency. But, the outlet Pb(II) concentration increased during charge and decreased
during discharge with increasing the inlet electrolyte velocity.
Increasing the initial concentration of Pb(II) reduces the cell voltage during charge and slightly
increases it during discharge. While, the voltage efficiency increased with changing the Pb(II) initial
concentration.
V. RECOMMENDATIONS FOR FUTURE WORK
The framework developed can be extended to other flow battery systems with some modifications.
Some specific extensions can be included to the present work are: effect of oxygen evolution reaction;
it is a competing reaction may occur on the positive electrode during charge exhausting some of the
applied energy and leading to deterioration in the performance and effect of PbO formation reaction;
this component is a side product formed on the positive electrode during discharge leading to loss in
the active species (i.e. Pb(II)) and loss in battery performance.
Table 3: Default values of the constants related to the structure.
Value Quantity Symbol
0.02 m Electrode height h
0.004 m Electrode separation w
0.01 m Electrode thickness d

International Journal of Advances in Engineering & Technology, Jan., 2015.
©IJAET ISSN: 22311963
1639 Vol. 7, Issue 6, pp. 1630-1641
2m 5-10× 4 Inlet/Outlet cross section area in/outA 3m 5-10×3.92 Reservoir volume V
2m 4-10 × 2 Active electrode surface area sA
Table 4: Default initial and boundary values.
Symbol Quantity Value
refT Reference temperature 298 K
cPb(II)0 Initial lead ion concentration 3-700 mol m
cH+0 Initial proton concentration 3-50 mol m
cH2O0 Initial water concentration 3-4700 mol m
outp Negative electrode outlet pressure 300 K Pa [15]
vin Inlet electrolyte velocity 1-s 0.1 m
appi Applied current density ]51[ 2-200 A m
Table 5: Default values of the constants related to electrochemistry.
Symbol Quantity Value
𝑘𝑟𝑒𝑓,1 Standard rate constant for reaction 1 2.1 × 10⁻⁷ m s-1 [15]
𝑘𝑟𝑒𝑓,2 Standard rate constant for reaction 1 2.5 × 10⁻⁷ m s-1 [15]
𝐸+0 Positive electrode standard potential 1.458 V [13]
𝐸−0 Negative electrode standard potential −0.395 V [13]
Table 6: Default values for constants related to the transport of charge and mass.
Symbol Quantity Value
𝐷𝑃𝑏(𝐼𝐼) Pb(II) diffusion coefficient in electrolyte 2.4 × 10⁻¹⁰ m2 s-1 [15]
𝐷𝐻+ H+ diffusion coefficient in electrolyte 1.4 × 10⁻⁹ m2 s-1 [15]
𝐷𝐻2𝑂 H2O diffusion coefficient in electrolyte 2.3 × 10⁻⁹ m2 s-1 [15]
𝐷𝐻𝑆𝑂4− HSO4
- diffusion coefficient in electrolyte 1.23 × 10⁻⁹ m2 s-1 [15]
𝜇𝐻2𝑂 Water viscosity 10-3 Pa. s [15]
Table 7: Default parameter values for the heat equation and thermodynamic values of the aqueous species at
25°c.
Symbol Quantity Value
𝜆 Electrolyte thermal conductivity 0.6 W m-1 K-1
𝜌𝑙 𝐶𝑙 Liquid thermal capacitance (water) 4.187× 10⁶ J m-2 K-1
−∆𝑆1 Entropy associated with reaction 1 43.59 J mol-1 K-1 [17]
−∆𝑆2 Entropy associated with reaction 2 -84.73 J mol-1 K-1 [17]
−∆𝐻1 Enthalpy associated with reaction 1 -1632.85 J mol-1 [17]
−∆𝐻2 Enthalpy associated with reaction 2 293598.53 J mol-1 [17]
Nomenclature
Roman
Symbol Definition Unit A Area m2
C Specific heat capacitance J Kg-1 K-1
c Concentration mol m-3
D Diffusion coefficient m2 s-1
d Thickness m
E Potential V
F Faraday's constant C mol-1
h Height m
I Current A
i Current density A m-2
k Reaction rate constant m s-1
N Flux density mol m-2 s-1

International Journal of Advances in Engineering & Technology, Jan., 2015.
©IJAET ISSN: 22311963
1640 Vol. 7, Issue 6, pp. 1630-1641
n Number of electrons Dimensionless
�⃗� Unit outer normal Dimensionless
p Pressure Pa
Q Heat source W m-3
R Molar gas constant J mol-1 K-1
S Source/sink flux term mol m-3 s-1
T Temperature K
t Time s
u X-component of velocity m s-1
�⃗� Phase velocity m s-1
V Volume m3
v Y-component of velocity m s-1
𝑣 Average velocity m s-1
w Width m
z Charge number Dimensionless
Greek
Symbol Definition Unit
∆𝐺 Change in Gibbs free energy J mol-1
∆𝐻 Change in enthalpy J mol-1
∆𝑆 Change in entropy J mol-1 K-1
𝜙𝑒 Ionic potential V
𝜙𝑠 Electronic potential V
η Overpotential V
𝜆 Thermal conductivity W mol-1 K-1
𝜇 Dynamic viscosity Kg m-1 s-1
ρ Density Kg m-3
σ Electronic conductivity S m-1
𝜎𝑒 Ionic conductivity S m-1
𝜁𝑣 Voltage efficiency Dimensionless
𝜔 Flow rate m3 s-1
Subscripts Meaning
app Applied
e Electrolyte property
H+ proton property
i, j, k Species
l Liquid phase property
Pb2+ Lead ion property
ref Reference value
s Solid property
0 Standard or reference value
1 Negative electrode redox reaction
2 Positive electrode redox reaction
+ Positive electrode
− Negative electrode
Upscripts Meaning eq Equilibrium
in Inlet
out Outlet
0 Initial
⟶ Vector property
— Volume-averaged property

International Journal of Advances in Engineering & Technology, Jan., 2015.
©IJAET ISSN: 22311963
1641 Vol. 7, Issue 6, pp. 1630-1641
REFERENCES
[1] T. Nguyen and R. F. Savinell, "Flow Batteries", The Electrochemical Society, (2010) 54–56.
[2] T. Shibata, T. Kumamoto, Y. Nagaoka, K. Kawase, "Redox Flow Batteries for the Stable Supply of
Renewable Energy", SEI Technical Review No.76, April (2013) 14–21.
[3] D. Pletcher and R. Wills, "A lead acid battery based on an electrolyte with soluble lead (II) - Part II",
Phys Chem Chem Phys, 6 (2004) 1779–1785.
[4] H. Al-Fetlawi, "Modelling and Simulation of all-Vanadium Redox Flow Batteries", Ph.D., thesis,
Faculty of Engineering and The Environment, University of Southampton, (2010).
[5] P K. Leung, "Development of A Zinc-Cerium Redox Flow Battery", Ph.D., thesis, Faculty of
Engineering and The Environment, University of Southampton, (2011).
[6] C. P Zhang, S. M. Sharkh, F. C. Walsh, C. N. Zhang, J. C. Jiang, "The performance of a soluble lead-
acid flow battery and its comparison to a static lead-acid battery", Energy Conversion and
Management, 52 (2011) 3391–3398.
[7] J. Collins, G. Kear, X. Li, C. T. John, D. Pletcher, R. Tangirala, D. Sratton-Campbell, F. C. Walsh, C.
Zhang, "A lead acid battery based on an electrolyte with soluble lead (II) - Part VII. The cycling of 10
cm × 10 cm flow cell", Journal of Power Sources, 195(2010) 1731–1738.
[8] R. G. A. Wills, J. Collins, D. Stratton-Campbell "Developments in the soluble lead-acid flow battery",
Journal of Applied Electrochemistry 40 (2010) 955–965.
[9] D. Pletcher and R. Wills, "A lead acid battery based on an electrolyte with soluble lead (II) - Part III.
The influence of conditions on battery performance", Journal of Power Source 149 (2005) 96–102.
[10] A. Hazza, D. Pletcher, R. Wills "A lead acid battery based on an electrolyte with soluble lead (II) - Part
I. Preliminary studies", Phys Chem Chem Phys, 6 (2004) 1773–1778.
[11] H. Bode, "Lead acid batteries", John Wiley, 1977.
[12] M. Barak, P. Peregrinus, Stevenage, "Primary and secondary batteries", Electrochemical Power
Sources, (1980).
[13] S. G. Bratsch, "Standard electrode potentials and temperature coefficients in water at 298.15 K", J.
Phys. Chem. Ref. Data, 18 (1989) No.1, P.1–21.
[14] I. Rubenstein, "Physical Electrochemistry", Marcel Dekker, (1995).
[15] A. A. Shah, X. Li, R. G. A. Wills, F. C. Walsh, "A mathematical model for the soluble lead-acid flow
battery", Journal of the Electrochemical Society, 157-A (2010) 589–599.
[16] A. Bates, S. Mukerjee, S. C. Lee, D-H. Lee, S. Park, "An analytical study of a lead-acid flow battery as
an energy storage system" Journal of Power Sources, 249 (2014) 207–218.
[17] A. Bard, R. Parsons, J. Jordan, "Standard potentials in aqueous solutions", Marcel Dekker, New York,
(1985).
[18] H. Al-Fetlawi, A. A. Shah, F. C. Walsh, "Non-isothermal modeling of the all-vanadium redox flow
battery", Electrochimica Acta, 55 (209) 78–89.
AUTHORS BIOGRAPHY
Amir A-K Omran was born in Karbala City, Iraq, in 1990. He received the BSc in
Electrochemical Engineering from the University of Babylon, Hila City, in 2012 and the
MSc in Electrochemical Engineering from the University of Babylon, Hila City, in 2014.
Hassan Abdul-Zehra Abdul-Yima was born in Babylon, Iraq, in 1965. He received the
BSc in Chemical Engineering from the University of Baghdad, Baghdad City, in 1988, the
MSc in Chemical Engineering from the University of Baghdad, Baghdad City, in 1993, and
the PhD in Electrochemical Engineering from Southampton University, United Kingdom, in
2011.