non-motorized transport in peri-urban areas of delhi, … the ceo of innovative transport solutions...
TRANSCRIPT

Anvita Arora is an urban transport planner with a PhD from the Indian Institute of Technology (IIT), Delhi. She has a Bachelors degree in Architecture and a Masters degree in Transport Planning. She is, currently, the CEO of Innovative Transport Solutions (iTrans) Pvt. Ltd. She has been working on the social dimensions of urban transport for over 10 years, specifically on poverty and gender issues. She works to incorporate the needs of marginal road users like the pedestrians, bicyclists, rickshaw pullers, hawkers and the disabled in the mainstream of urban transport design and is a certified trainer on non-motorized transport. She is currently working with several cities in India on these issues.
Non-Motorized Transport in Peri-urban Areas of Delhi, India
Anvita Arora
Case study prepared for
Global Report on Human Settlements 2013
Available from http://www.unhabitat.org/grhs/2013

Disclaimer: This case study is published as submitted by the consultant, and it has not been edited by the United Nations. The designations employed and the presentation of the material in this publication do not imply the expression of any opinion whatsoever on the part of the Secretariat of the United Nations concerning the legal status of any country, territory, city or area, or of its authorities, or concerning delimitation of its frontiers or boundaries, or regarding its economic system or degree of development. The analysis, conclusions and recommendations of the report do not necessarily reflect the views of the United Nations Human Settlements Programme, the Governing Council of the United Nations Human Settlements Programme or its Member States. Nairobi, 2011

Non-motorized Transport in Peri-urban Areas of Delhi Dr Anvita Arora
Introduction Utility cycling is widespread in Indian cities. Bicycle use in Indian cities varies between 7–15 per cent in large cities and 13–21 per cent in medium and small cities (Tiwari and Jain, 2008). In Indian cities, about 75 per cent people live on less than US$2 a day (Beinhocker et al, 2007). With hard-pressed budgets, many poor people cannot afford motorized transport including subsidized public transport (Tiwari, 1999). In contrast, the bicycle is a more affordable mode of transport (Tiwari and Jain, 2008). Yet studies have reported dwindling shares of bicycles in Indian cities. For example, a government agency study in Delhi in 1998 recorded a decline in bicycle share from 36 per cent in 1957 to 6.61 per cent in 1994 (RITES, 1998 cited in Tiwari, 2003).
Even though the percentage of people using bicycles and other human-powered vehicles may have declined, the absolute numbers remain high. Tiwari and Jain (2008) estimate that even though cycle trips in mega cities might be as low as 6–8 per cent, in absolute terms, they might mean over a million commuter trips. Further, the methods used to determine use of non-motorized transport in Indian cities may be flawed, which might result in an incorrect estimation. Tiwari (2003) has estimated the bicycle share in the Delhi modal split to be 24 per cent in 1999 as opposed to 6.61 per cent, estimated by RITES, in 1994. Besides bicyclists and pedestrians, the other popular slow moving mode of transport is the cycle rickshaw.1
While bus commuters, pedestrians and non-motorized vehicle (NMV) users together form the largest group of road users in Indian cities, their needs for safe and convenient infrastructure continues to be ignored (Tiwari, 2002). The current urban transportation-planning paradigm does not take into account the needs of vulnerable road users like pedestrians, cyclists and other slow-moving modes. This approach results in wider roads meant exclusively for cars. This leads to negative consequences for public health.
According to official statistics, 105,725 people were killed in road traffic crashes in India in 2006 (NCRB, 2007 cited in Mohan et al, 2009). Mohan et al (2009) posit that as incomes rise along with motor vehicle use, the present trends in India and the experience of some mid-income countries suggests that fatalities could see a dramatic rise before they start to drop.
Interestingly, unlike high-income countries, in India, a large majority of those killed in traffic crashes are bicyclists and pedestrians. Bicyclists and pedestrians represented 10 and 53 per cent of those killed in traffic crashes in Delhi (Mohan and Tiwari, 2000). In the case of Mumbai, this was 6 and 78 per cent respectively (Tiwari, 2000). The same study also reported bicyclists and pedestrians representing 11 and 32 per cent of those killed on highways (14 selected highway locations in India).
While it is an established fact that the majority of bicyclists in India are captive users – they cannot afford any other means of transport, and form the majority victim group in traffic crashes, not much is known about cyclists who frequent peri-urban routes.
Bicycles are an important means of transport amongst industrial workers for pecuniary reasons. Therefore, despite high exposure to traffic crashes, lack of adequate infrastructure
1. Cycle rickshaw is a modified tri-cycle that is used around South and Southeast Asia to ferry passengers and goods.
Non Motorized Transport in Peri-Urban Areas of Case study prepared for the Delhi, India Page 3 of 23 Global Report on Human Settlements 2013

and lack of policies for cycling, a large number of captive cyclists frequent highways passing through peri-urban areas of Delhi.
This study is an attempt to understand the usage of non-motorized modes of transport including bicycles and cycle rickshaws on the national highways leading out of Delhi.2 Through traffic volume counts and user surveys at locations where the national highways lead out of Delhi, we try to estimate the number of non-motorized vehicles (NMVs) in the traffic mix, the socio-economic profile of NMV users, record the frequency of traffic crashes, and understand their travel characteristics.
The City Delhi, officially National Capital Territory of Delhi (NCT), is the largest metropolis by area and the second-largest metropolis by population in India. Delhi is an expansive area. In its extremity it spans from Narela in the north to Badarpur in the south. Najafgarh is the furthest point west, and Seemapuri is its eastern extremity. Places like Shahdara and Bhajanpura are its eastern ends and are one of major shopping centres in Delhi. The National Capital Region (NCR) encompasses towns south and east of the said border, namely Ghaziabad, Noida, Faridabad and Gurgaon. The industrial areas of the city lie along the city periphery and are divided in to North, East, West and South Zones. As per the Economic Survey of Delhi 2001–2002, in 1998 Delhi had 129,000 industries that employed 1,440,000 workers (DDA, 2005).
Figure 1. New Delhi, India
Source: http://topnews.in/law/files/Delhi_map.gif.
Cycling in Delhi Unlike other urban areas in India the majority of the population in Delhi is not dependent on bicycles for daily commute. Still, as mentioned earlier, the absolute number of bicycle trips in Delhi is a large; there are up to 4.5 million commuter trips on bicycles in Delhi every day.
2. Only National Highways lead in and out of Delhi. There are no other types of highways in Delhi.
Non Motorized Transport in Peri-Urban Areas of Case study prepared for the Delhi, India Page 4 of 23 Global Report on Human Settlements 2013

Cycle traffic contributed between 15–40 per cent of the total traffic on the 5 important intersections monitored since 2003. The proportion of cycle traffic has been observed to be more than 19 per cent of the total traffic in peak hours on the main roads of the observed junctions (TRIPP, 2010).
Table 1 below shows the modal share of various modes of transport in Delhi. It can be observed from the table that bicycles are used primarily for short trips. This is because of mixed land use patterns in the city and the existence of low- and middle- and high-income neighbourhoods in close proximity to each other. However, 14.41 per cent of the bicycle trips take longer than 45 minutes. Given the large volume of trips, this implies that there are a large number of long distance trips.
Table 1. Modal share of trips and no. of vehicle trips in Delhi
Mode Average speed**
Average time (min)
Average trip
length
% trips below 5km
Trips above 45min
Modal share*
Trips by mode*
Occupancy factors
Walk 4.3 10 0.72 100 0.17 10.74 1,879,500 1
Cycle 13 25 5.42 74.7 14.41 25.84 4,522,000 1 Motorized two-wheelers 20 27 9.00 21.74** 29** 14.72 2,576,000 1.1 Auto rickshaws 20 29 9.67 45 12.8 0.77 134,750 1.8
Car 20 32 10.67 12.87** 31.2** 12.51 2,189,250 1.4
Bus 18 49 14.70 15 50 35.42 6,198,500 56
Total 100 17,500,000 Source: RITES, 2005; RITES, 2001; TRIPP, 2000 (*); Mukti, 2009 (**).
In a Delhi-based survey of bicycle users done in 2006, it was found that 21 per cent of cyclists reported factories as their destination. About 25 per cent and 51 per cent of the cyclists travelled up to 5 km and 10 km to reach their destinations (Tiwari and Jain, 2008). Industrial areas in Delhi are mostly situated along highways leading out of Delhi. Since Delhi’s Government began shifting polluting industries outside the city (beginning in 1996), there must have been at least some increase in the number of trips to and from these industrial areas. As can be seen from Figure 2 below, catchment areas of radius 5 km drawn around industrial areas in Delhi cover a large part of the city. If a majority of bicyclists travel up to 10 km to reach their destinations, then the catchment for industrial areas commuting on bicycles is the entire city.
Along with a large number of bicyclists, there are more than 500,000 passenger cycle rickshaws in Delhi. Each cycle rickshaws travels 25–30 km per day and makes 6–8 passenger trips per day or about 1.5 million trips per day; directly and indirectly supporting nearly 2 million people (Gadepalli, 2008). In a bid to reduce traffic congestion, Municipal Corporation of Delhi (MCD) has put a 99,000 cap on the number of cycle rickshaws in the city. MCD has divided the city in to three zones – red, amber and green. While rickshaws cannot ply at all in the red zone, they cannot ply between 8 a.m. in the morning and 11p.m. in the night in the amber zone. They can ply without any hindrance in the green zone alone (Ravi, 2008).
Gupta and Agarwal (2008) reported that across six metro stations on Shahadra–Rithala Delhi Metro line 1 in Delhi, cycle rickshaws on average account for a share of 23 per cent of the
Non Motorized Transport in Peri-Urban Areas of Case study prepared for the Delhi, India Page 5 of 23 Global Report on Human Settlements 2013

Figure 2. Selected land uses in Delhi with buffers of radius 5 km
Legend
n govt landuse
railway line
NCTD Boundary
yamuna watercourse
govt. landuse
manufacture
IGI airport
forests and ridge
Buffer_of_manufacture
Buffer_of_govt_landuse
n
nn
nnnnnnn n
n
n
±0 6 12 18 243Kilometers
Source: Tiwari and Jain, 2008
access/dispersal trips at the stations. Females, predominantly from the middle- and high-income classes are the primary patrons of cycle rickshaw services.
NMT Study in Peri-urban Delhi All locations (five in number) where National Highways intersect Delhi City border were selected for this study. National Highways intersecting the city boundary are NH 1, NH 2, NH 8, NH 10, NH 24 on the northern, south-eastern, south-western, western and eastern peripheries of Delhi respectively.
Traffic flow was video recorded at various hours of the day to cover the variation in traffic flow and travel modes. Modal shares on each site during different times of the day were ascertained by vehicle counts from the video recordings. Further, to understand the NMV user group, bicyclists and cycle rickshaw pullers were interviewed personally.
All sites were within 5 km of the border and were roughly mid-block. Figure 3 shows a map of Delhi and survey site locations. It can be seen from the figure that all sites have industrial areas in the vicinity.3
The volume count recorded two-way traffic separately. A large flow of non-motorized vehicles moving contra-flow was observed. Since this has important policy implications, it was recorded separately. Presented below are the study results along with analysis.
3. The Location 3-Gurgaon map does not show industrial areas. This is because the industrial areas lie outside the Delhi boundary and are not marked on this map. A large number of industries are located in Gurgaon (Figure 11).
Non Motorized Transport in Peri-Urban Areas of Case study prepared for the Delhi, India Page 6 of 23 Global Report on Human Settlements 2013
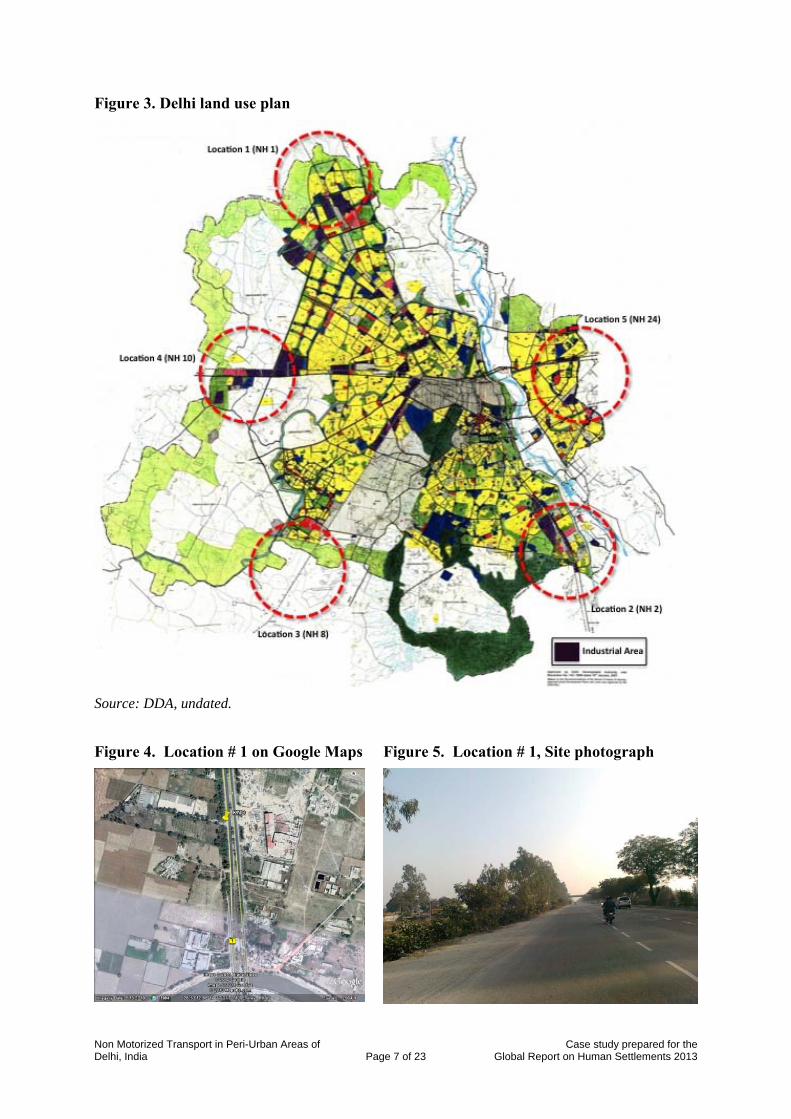
Figure 3. Delhi land use plan
Source: DDA, undated.
Figure 4. Location # 1 on Google Maps Figure 5. Location # 1, Site photograph
Non Motorized Transport in Peri-Urban Areas of Case study prepared for the Delhi, India Page 7 of 23 Global Report on Human Settlements 2013

Figure 6. Location # 2 on Google Maps Figure 7. Location # 2, Site photograph
Figure 8. Faridabad land use plan
Source: http://www.urbanindia.nic.in/theministry/subordinateoff/tcpo/DMA_Report/DMA_Maps/FARIDABAD_LANDUSE_2011.pdf, last accessed 6 June 2011.
Figure 9. Location # 3 on Google Maps Figure 10. Location # 3, Site photograph
Non Motorized Transport in Peri-Urban Areas of Case study prepared for the Delhi, India Page 8 of 23 Global Report on Human Settlements 2013
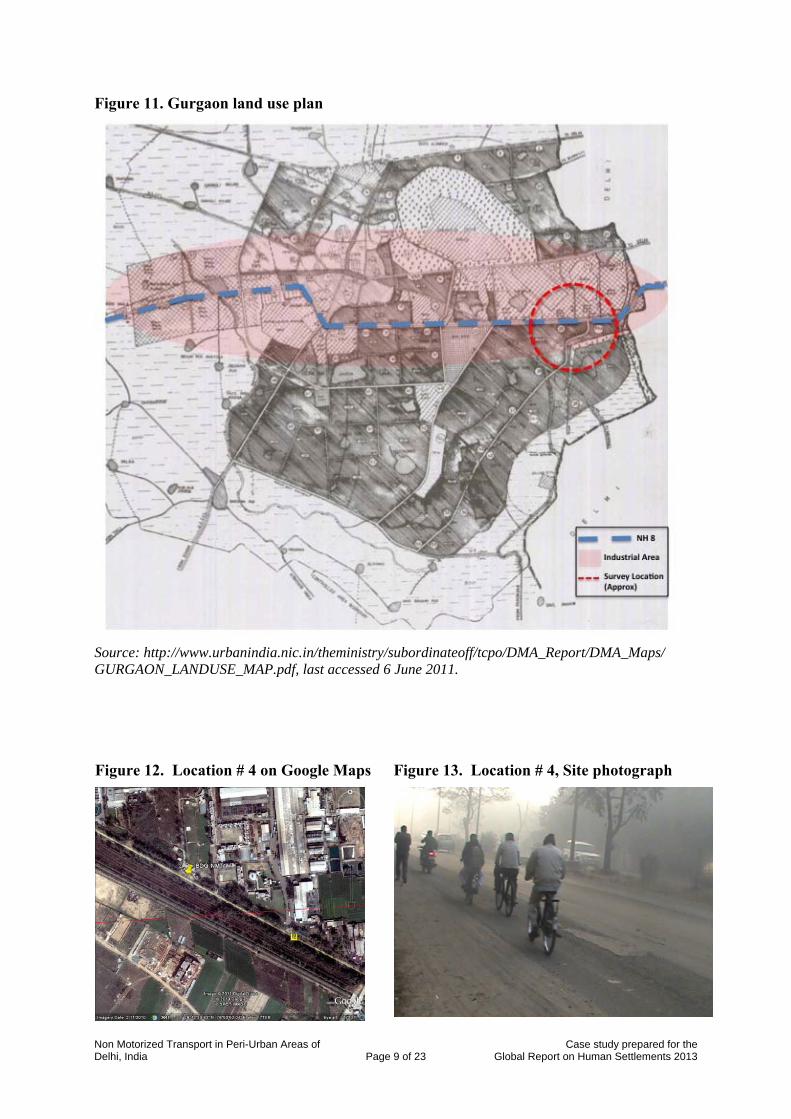
Figure 11. Gurgaon land use plan
Source: http://www.urbanindia.nic.in/theministry/subordinateoff/tcpo/DMA_Report/DMA_Maps/GURGAON_LANDUSE_MAP.pdf, last accessed 6 June 2011.
Figure 12. Location # 4 on Google Maps Figure 13. Location # 4, Site photograph
Non Motorized Transport in Peri-Urban Areas of Case study prepared for the Delhi, India Page 9 of 23 Global Report on Human Settlements 2013

Figure 14. Location # 5 on Google Maps Figure 15. Location # 5, Site photograph
Figure 16. Ghaziabad land use plan
Source: http://www.urbanindia.nic.in/theministry/subordinateoff/tcpo/DMA_Report/DMA_Maps/GHAZIABAD.pdf, last accessed 6 June 2011.
Observations Bicycles were observed in the traffic mix at all locations. Cycle rickshaws were observed at all but one location. The highest modal share of NMVs (35 per cent) was recorded at NH-24 during the morning peak hour direction (PHPD). The highest volume of NMVs in the evening peak hour direction was also recorded at this site. The share of car groups was, in direct Non Motorized Transport in Peri-Urban Areas of Case study prepared for the Delhi, India Page 10 of 23 Global Report on Human Settlements 2013

contrast to NMV shares, lowest at this location. The location with lowest modal share of bicycles and cycle rickshaws was in Gurgaon on NH-8. Only 2 and 1 per cent NMV modal share was recorded here during the morning and evening PHPDs. Interestingly, the highest
share of car groups across study locations was recorded here (Figures 17 and 18).
Figure 17: Mode share at study locations - evening peak hour direction
Figure 18: Mode share at study locations - morning peak hour direction
It is important to note the highway design at these locations. While the study location at NH-24 was a 4-lane highway not divided by a median, NH-8 was an 8-lane access-controlled highway with a wide median. It has clear markings for cars and other motorized 4-wheel vehicles, fencing on its extremities to prevent strays coming in, and signage that clearly prohibits NMV use on the main section of the highway. This stretch also has a number of flyovers and at off-peak hours, motorized vehicles have high speeds.
Among NMVs the number of bicycles and cycle rickshaws in the traffic mix varied sharply across sites and between morning and evening. While at NH-24, the cycle rickshaws represented only about 1 per cent of total NMVs, they represented about 7 per cent at NH-8. This has to do with availability of intermediate para-transit modes at these locations. While shared three-wheeled auto rickshaws and buses are easily available at NH-24, there is a dearth of them at NH-8. Also, since the advent of the metro rail near NH-8, the importance of cycle rickshaws as a feeder mode has increased (see Figures 19 and 20).
Non Motorized Transport in Peri-Urban Areas of Case study prepared for the Delhi, India Page 11 of 23 Global Report on Human Settlements 2013

Figure 19: Breakup of NMVs at study locations - morning peak hour direction
Figure 20: Breakup of NMVs at study locations - evening peak hour direction
Another interesting observation was the difference in timing when different modes hit their peak volumes. This is best illustrated by the observing the traffic volume flows on NH-24. This location recorded the highest modal share of bicycles (35 per cent in the morning PHPD). While bicycles and other NMVs hit their morning peak in the direction of Hapur to Delhi around 8.30 a.m., cars in the same direction hit it only after 10.00 a.m. Similarly, in the evening PHPD direction – Delhi to Hapur, bicycles and other NMVs hit their peak at the same time as cars hit their volume lows around 18.30 (see Figures 21 and 22 below).
Some modes also have difference in peak timings at different study locations. For instance, while bicycles and other NMVs hit their morning peak around 8.30 a.m. on NH-1 (both directions), on NH-2 their morning peak volume timing is somewhere around 7.30 a.m.
Among other factors, peak volumes are functions of users’ distance to destination, and different reporting time for work. For instance, the majority of bicyclists work in factories or shops. They usually have to report to work earlier than car drivers, a majority of whom work in the service sector or in shops they own themselves. This variation in peak timing must be kept in mind especially for those who are investigating the level of bicycle use in a city.
Non Motorized Transport in Peri-Urban Areas of Case study prepared for the Delhi, India Page 12 of 23 Global Report on Human Settlements 2013

Figure 21. Vehicle flow vs time at NH-24 (Direction: Delhi to Hapur)
Figure 22. Vehicle flow vs time at NH-24 (Direction: Hapur to Delhi
Profile of Cyclists There can be no planning without understanding whom the planning is for. Given no dedicated lanes for bicycles and cycle rickshaws, why do people still use these modes of transport. Do they do it out of lack of choice? How much do they earn; what kind of trade and employment are bicyclists involved in? How often are they involved in traffic accidents? With these questions in mind, bicycle user and cycle rickshaw puller surveys were carried out at the five study locations. The survey profiled between 109–124 cyclists on each location with a total of 574 bicycle users whose sex, age, education level, occupation status, job type, place of work and income levels were recorded. A total of 82 cycle rickshaw pullers were also interviewed. This has been used to map their socio-economic status.
Survey results show that of all respondents, 100 per cent were male cyclists. This was synonymous to the findings of Singh and Anand (2001) where in a Delhi based survey, while the bicycle was the mode of transport for the poor, where distances exceeded walking limits
Non Motorized Transport in Peri-Urban Areas of Case study prepared for the Delhi, India Page 13 of 23 Global Report on Human Settlements 2013
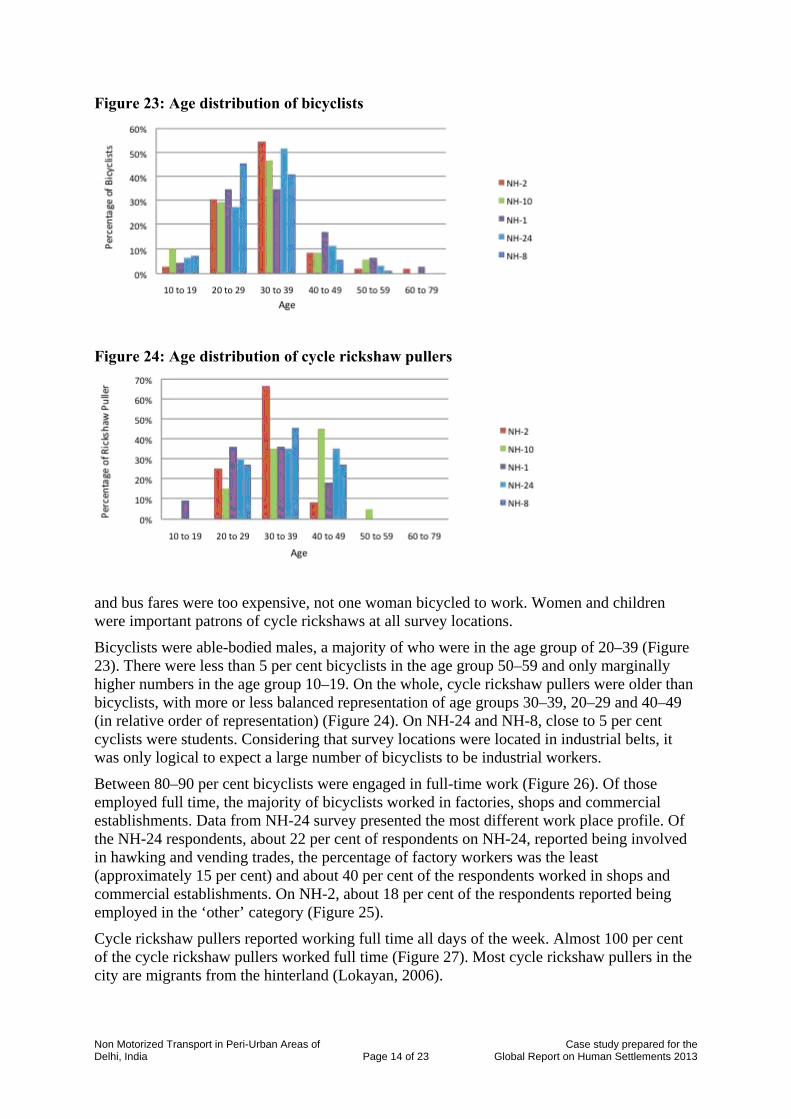
Figure 23: Age distribution of bicyclists
Figure 24: Age distribution of cycle rickshaw pullers
and bus fares were too expensive, not one woman bicycled to work. Women and children were important patrons of cycle rickshaws at all survey locations.
Bicyclists were able-bodied males, a majority of who were in the age group of 20–39 (Figure 23). There were less than 5 per cent bicyclists in the age group 50–59 and only marginally higher numbers in the age group 10–19. On the whole, cycle rickshaw pullers were older than bicyclists, with more or less balanced representation of age groups 30–39, 20–29 and 40–49 (in relative order of representation) (Figure 24). On NH-24 and NH-8, close to 5 per cent cyclists were students. Considering that survey locations were located in industrial belts, it was only logical to expect a large number of bicyclists to be industrial workers.
Between 80–90 per cent bicyclists were engaged in full-time work (Figure 26). Of those employed full time, the majority of bicyclists worked in factories, shops and commercial establishments. Data from NH-24 survey presented the most different work place profile. Of the NH-24 respondents, about 22 per cent of respondents on NH-24, reported being involved in hawking and vending trades, the percentage of factory workers was the least (approximately 15 per cent) and about 40 per cent of the respondents worked in shops and commercial establishments. On NH-2, about 18 per cent of the respondents reported being employed in the ‘other’ category (Figure 25).
Cycle rickshaw pullers reported working full time all days of the week. Almost 100 per cent of the cycle rickshaw pullers worked full time (Figure 27). Most cycle rickshaw pullers in the city are migrants from the hinterland (Lokayan, 2006).
Non Motorized Transport in Peri-Urban Areas of Case study prepared for the Delhi, India Page 14 of 23 Global Report on Human Settlements 2013
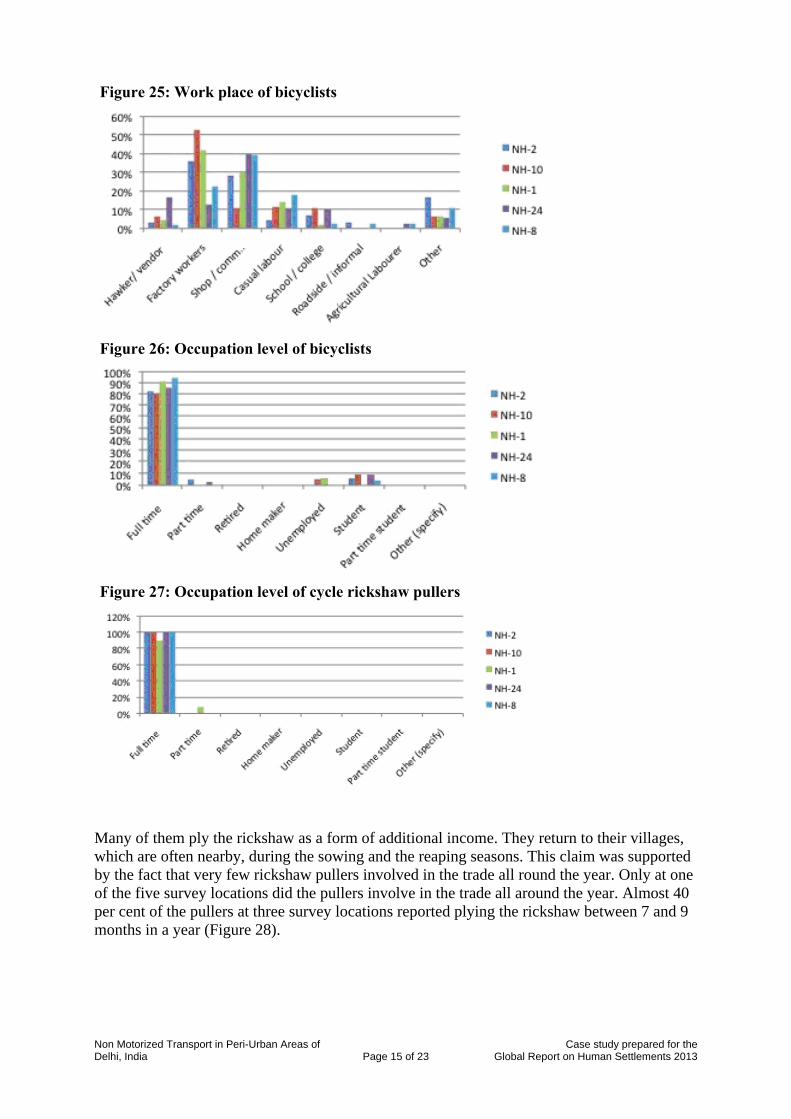
Figure 25: Work place of bicyclists
Figure 26: Occupation level of bicyclists
Figure 27: Occupation level of cycle rickshaw pullers
Many of them ply the rickshaw as a form of additional income. They return to their villages, which are often nearby, during the sowing and the reaping seasons. This claim was supported by the fact that very few rickshaw pullers involved in the trade all round the year. Only at one of the five survey locations did the pullers involve in the trade all around the year. Almost 40 per cent of the pullers at three survey locations reported plying the rickshaw between 7 and 9 months in a year (Figure 28).
Non Motorized Transport in Peri-Urban Areas of Case study prepared for the Delhi, India Page 15 of 23 Global Report on Human Settlements 2013

Figure 28: Number of months in a year that pullers ply cycle rickshaws
Figure 29: Education level of bicyclists
Figure 30: Education level of cycle rickshaw pullers
Most bicyclists were literates. This was in harmony with the fact that Delhi has a male literacy level of 87.33 per cent.4 Interestingly, more than 50 per cent of the respondents at each survey location had secondary or higher secondary education. On location 4 (NH-24), about 25 per cent of the cyclists were graduates. The number of illiterate cyclists was negligible on all sites except location 3 (NH-8), where about 10 per cent cyclists were illiterates (Figure 29). This is in direct contrast to the literacy and educational level of cycle rickshaw pullers, a majority of who were illiterates (Figure 30). At most, cycle rickshaw pullers had primary or middle school level of education. There were very few pullers with secondary or higher secondary education and none with graduate degrees.
4. National Literacy Mission, http://www.nlm.nic.in/literacy01.htm, last accessed 25 April 2011
Non Motorized Transport in Peri-Urban Areas of Case study prepared for the Delhi, India Page 16 of 23 Global Report on Human Settlements 2013

Figure 31: Household income of bicyclists (Rs. per month)
Figure 32: Household income of cycle rickshaw pullers (Rs. per month)
Figure 33: Other modes of transport available to bicyclists
Most bicyclists fell in two income brackets – between Rs.3000–5000 and Rs.5000–7000 per month. Close to 60 per cent of the respondents on one location reported earning between Rs.5000–7000 per month (Figure 31). While most bicyclists remained low-income earners, interestingly, there were some ‘elites’ too. Up to 15 per cent bicyclists on one site earned more than Rs.9000 per month.5 Even within these elites segments, bicyclists owned no other modes of transport. Less than 2 per cent had access to scooters or motorbikes (Figure 33). On the other three sites, close to 10 per cent of the respondents earned more than Rs.9000.
5. It must be remembered that these are household and not individual bicyclist’s incomes. Assuming a household size of 4, this means that the per capita incomes of bicyclists are one-quarter of household income.
Non Motorized Transport in Peri-Urban Areas of Case study prepared for the Delhi, India Page 17 of 23 Global Report on Human Settlements 2013
On comparing the work places of bicyclists and income levels, it seems that those employed in shops and commercial establishments earn better than factory workers. The non-availability of any other transport modes is explained by the meagre incomes of most cyclists. There were very few bicyclists who earned less than Rs.3000 per month.
Cycle rickshaw pullers reported, on an average, more modest incomes than bicyclists. Most pullers earned between Rs.3000–7000. The extremes were rather pronounced in the rickshaw pullers case – close to 25 per cent pullers on one location, and 30 per cent on another earned between Rs.1000–3000 and Rs.7000–9000 respectively (Figure 32). This variation can be accounted for by recognizing that rickshaw pullers’ earning depends on the number of work hours they put in and the demand for rickshaws in the locality they operate in.
Travel Characteristics The travel characteristics of the cyclists like trip length distribution, other modes of transport availability, secure parking availability, trip rate for work and trip rate for other purposes of cyclists are discussed below.
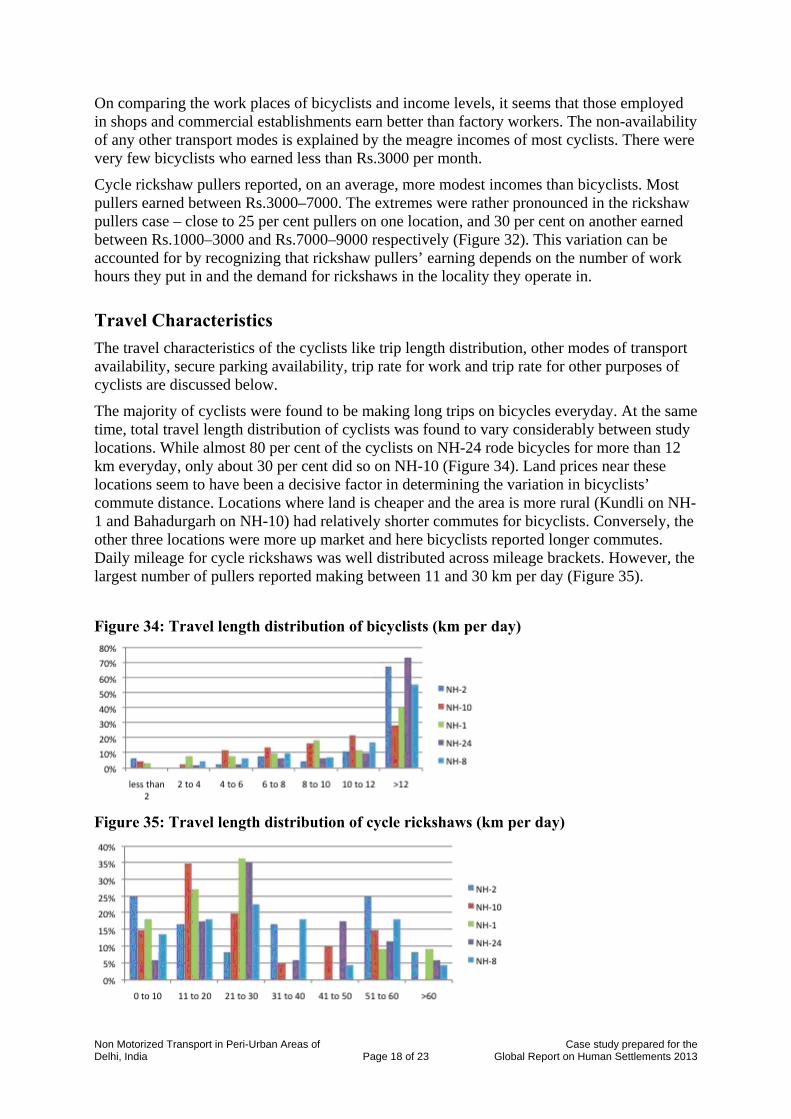
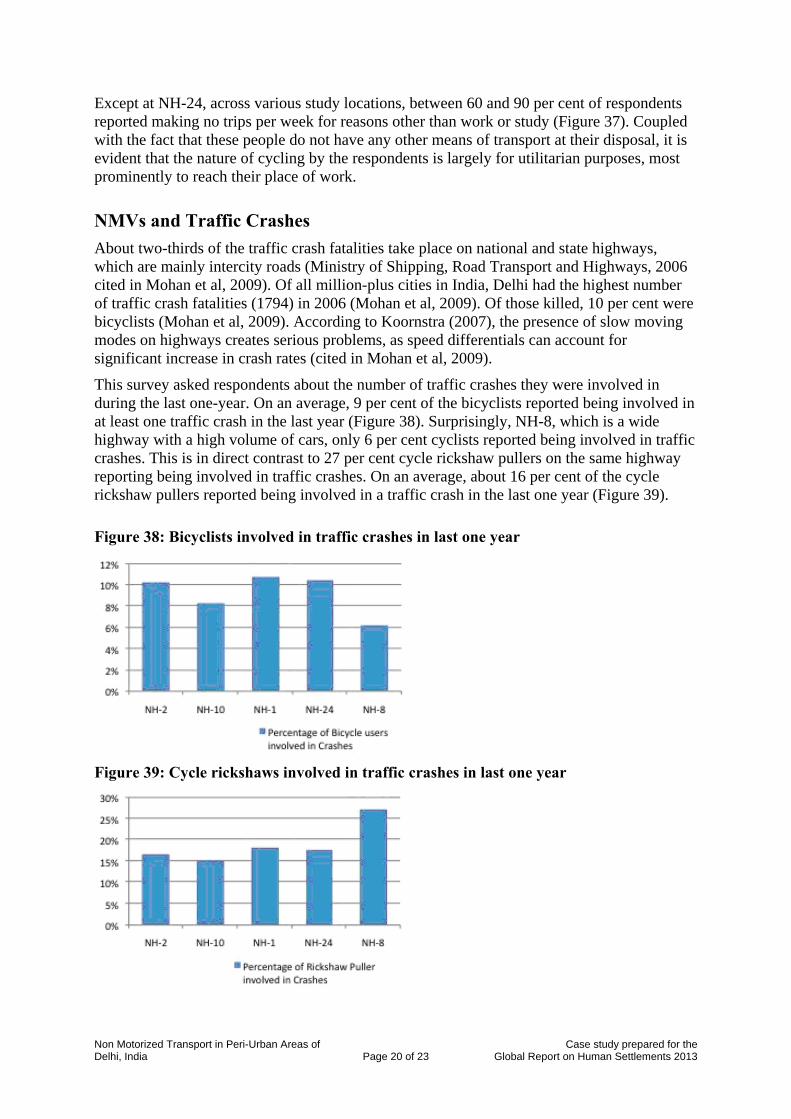
The majority of cyclists were found to be making long trips on bicycles everyday. At the same time, total travel length distribution of cyclists was found to vary considerably between study locations. While almost 80 per cent of the cyclists on NH-24 rode bicycles for more than 12 km everyday, only about 30 per cent did so on NH-10 (Figure 34). Land prices near these locations seem to have been a decisive factor in determining the variation in bicyclists’ commute distance. Locations where land is cheaper and the area is more rural (Kundli on NH-1 and Bahadurgarh on NH-10) had relatively shorter commutes for bicyclists. Conversely, the other three locations were more up market and here bicyclists reported longer commutes. Daily mileage for cycle rickshaws was well distributed across mileage brackets. However, the largest number of pullers reported making between 11 and 30 km per day (Figure 35).
Figure 34: Travel length distribution of bicyclists (km per day)
Figure 35: Travel length distribution of cycle rickshaws (km per day)
Non Motorized Transport in Peri-Urban Areas of Case study prepared for the Delhi, India Page 18 of 23 Global Report on Human Settlements 2013

On all study sites, only less than 10 per cent of the respondents reported travelling less than 45 minutes each day on their bicycles (Figure 36). Therefore, the majority of cyclists spend considerable time riding their bicycles everyday. Even though a majority of cyclists across survey locations are making long journeys, the total travel time distribution of cyclists reveals that the travel times are rather ‘evenly’ distributed across time periods 45–90 minutes per day. Close to 60 per cent respondents on NH-24 reported spending over 90 minutes riding bicycles everyday.
Considering that bicyclists average speed in the city is around 13 km per hour and higher along highways, spending over 90 minutes riding bicycles means that these commuters must be travelling over 20 km per day. Many survey respondents reported staying far away from these locations – in nearby villages. Therefore, it is clear that a considerable number of bicyclists frequent these highways as far as 10–15 km from the border. Tiwari et al (2007) have reported that bicycles represent 16–31 per cent traffic on Indian highways, depending on highway design type.
Many bicyclists reported spending between 45 and 60 minutes each day riding their bicycles. This matches well with the fact that taken together, about 30 per cent of bicyclists ride between 6 and 12 km per day. Depending on road type and traffic conditions, it is logical to expect the variation in average speed for this group.
An interesting observation here is the departure of this group of bicyclists from the city average. As seen from Table 1, 74.7 per cent bicycle trips in Delhi are below 5 km. Here, perhaps because the bicyclists are mostly staying far away from the city, a large majority of trips are long distance.
Figure 36: Total travel time distribution of bicyclists (mins. per day)
Figure 37: Number of bicycle trips for reasons other than work or study
Non Motorized Transport in Peri-Urban Areas of Case study prepared for the Delhi, India Page 19 of 23 Global Report on Human Settlements 2013
Except at NH-24, across various study locations, between 60 and 90 per cent of respondents reported making no trips per week for reasons other than work or study (Figure 37). Coupled with the fact that these people do not have any other means of transport at their disposal, it is evident that the nature of cycling by the respondents is largely for utilitarian purposes, most prominently to reach their place of work.
NMVs and Traffic Crashes About two-thirds of the traffic crash fatalities take place on national and state highways, which are mainly intercity roads (Ministry of Shipping, Road Transport and Highways, 2006 cited in Mohan et al, 2009). Of all million-plus cities in India, Delhi had the highest number of traffic crash fatalities (1794) in 2006 (Mohan et al, 2009). Of those killed, 10 per cent were bicyclists (Mohan et al, 2009). According to Koornstra (2007), the presence of slow moving modes on highways creates serious problems, as speed differentials can account for significant increase in crash rates (cited in Mohan et al, 2009).
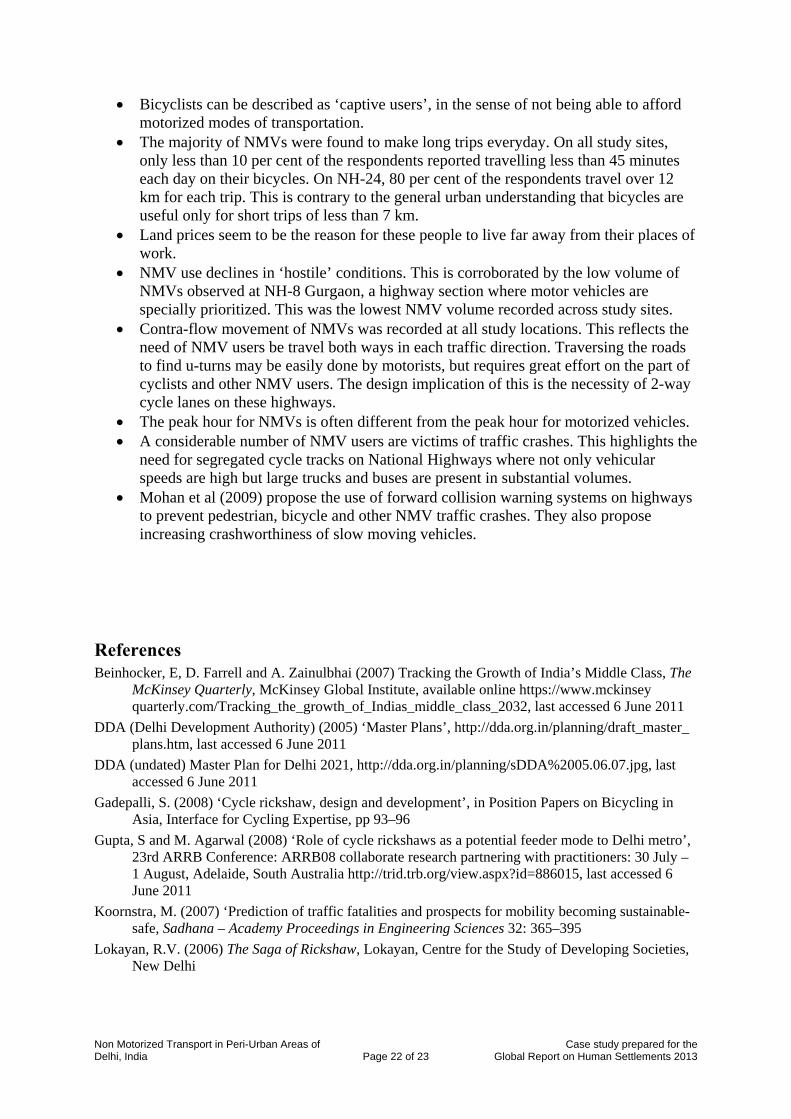
This survey asked respondents about the number of traffic crashes they were involved in during the last one-year. On an average, 9 per cent of the bicyclists reported being involved in at least one traffic crash in the last year (Figure 38). Surprisingly, NH-8, which is a wide highway with a high volume of cars, only 6 per cent cyclists reported being involved in traffic crashes. This is in direct contrast to 27 per cent cycle rickshaw pullers on the same highway reporting being involved in traffic crashes. On an average, about 16 per cent of the cycle rickshaw pullers reported being involved in a traffic crash in the last one year (Figure 39).
Figure 38: Bicyclists involved in traffic crashes in last one year
Figure 39: Cycle rickshaws involved in traffic crashes in last one year
Non Motorized Transport in Peri-Urban Areas of Case study prepared for the Delhi, India Page 20 of 23 Global Report on Human Settlements 2013

Tiwari et al (2000) reported that 19 per cent of crashes on four-lane divided roads were head-on collisions. Keeping this in mind, contra-flow movement of NMVs was recorded separately at all study locations. There was significant variation between various study locations as far as this parameter is concerned.
While the lowest recorded was 1 per cent, the highest was 19 per cent (Figure 40). On this study location (NH-2) heavy contra-flow movement was observed in the morning peak hour traffic heading in to Delhi. Since there were no temporary obstructions near the survey location, this seems to be a permanent feature. Contra-flow movement happens because of riders’ tendency to take the shortest route possible.
Figure 40: Percentage of bicycles and NMVs moving contra-flow
In this case, the road has a wide tree-lined median and intersections or pedestrian crossings are infrequent. Therefore, since most employment opportunities are on a particular side of the road, which is the contra-flow direction for cyclists heading towards Delhi, they cross over at the closest intersection and then ride contra-flow until they reach their destinations.
Even though the location NH-8 is highly bicycle unfriendly with intersections located kilometres apart, instances of contra-flow movement was very negligible. This is explained by the existence of a parallel road, which provides access to the industrial areas near this location.
Clearly, these highway locations can be described as hostile towards bicyclists and cycle rickshaws.
Conclusions This study highlights a few important aspects about cyclists and other NMV users in the peri-urban areas of Delhi.
While NMVs are present at all study locations, their presence varies between 2 per cent and 35 per cent. There was no dedicated NMV infrastructure in any of the study areas.
Bicycles are used primarily for utilitarian trips. At all locations, except NH-24, between 60 and 80 per cent of the respondents reported making no trips per week for reasons other than work or study. At NH-24, 100 per cent reported the same.
Cyclists are primarily men, with full-time employment in the 20–40 years age group. A majority of them work in factories, shops and other commercial establishments.
Non Motorized Transport in Peri-Urban Areas of Case study prepared for the Delhi, India Page 21 of 23 Global Report on Human Settlements 2013
Bicyclists can be described as ‘captive users’, in the sense of not being able to afford motorized modes of transportation.
The majority of NMVs were found to make long trips everyday. On all study sites, only less than 10 per cent of the respondents reported travelling less than 45 minutes each day on their bicycles. On NH-24, 80 per cent of the respondents travel over 12 km for each trip. This is contrary to the general urban understanding that bicycles are useful only for short trips of less than 7 km.
Land prices seem to be the reason for these people to live far away from their places of work.
NMV use declines in ‘hostile’ conditions. This is corroborated by the low volume of NMVs observed at NH-8 Gurgaon, a highway section where motor vehicles are specially prioritized. This was the lowest NMV volume recorded across study sites.
Contra-flow movement of NMVs was recorded at all study locations. This reflects the need of NMV users be travel both ways in each traffic direction. Traversing the roads to find u-turns may be easily done by motorists, but requires great effort on the part of cyclists and other NMV users. The design implication of this is the necessity of 2-way cycle lanes on these highways.
The peak hour for NMVs is often different from the peak hour for motorized vehicles. A considerable number of NMV users are victims of traffic crashes. This highlights the
need for segregated cycle tracks on National Highways where not only vehicular speeds are high but large trucks and buses are present in substantial volumes.
Mohan et al (2009) propose the use of forward collision warning systems on highways to prevent pedestrian, bicycle and other NMV traffic crashes. They also propose increasing crashworthiness of slow moving vehicles.
References Beinhocker, E, D. Farrell and A. Zainulbhai (2007) Tracking the Growth of India’s Middle Class, The
McKinsey Quarterly, McKinsey Global Institute, available online https://www.mckinseyquarterly.com/Tracking_the_growth_of_Indias_middle_class_2032, last accessed 6 June 2011
DDA (Delhi Development Authority) (2005) ‘Master Plans’, http://dda.org.in/planning/draft_master_plans.htm, last accessed 6 June 2011
DDA (undated) Master Plan for Delhi 2021, http://dda.org.in/planning/sDDA%2005.06.07.jpg, last accessed 6 June 2011
Gadepalli, S. (2008) ‘Cycle rickshaw, design and development’, in Position Papers on Bicycling in Asia, Interface for Cycling Expertise, pp 93–96
Gupta, S and M. Agarwal (2008) ‘Role of cycle rickshaws as a potential feeder mode to Delhi metro’, 23rd ARRB Conference: ARRB08 collaborate research partnering with practitioners: 30 July – 1 August, Adelaide, South Australia http://trid.trb.org/view.aspx?id=886015, last accessed 6 June 2011
Koornstra, M. (2007) ‘Prediction of traffic fatalities and prospects for mobility becoming sustainable-safe, Sadhana – Academy Proceedings in Engineering Sciences 32: 365–395
Lokayan, R.V. (2006) The Saga of Rickshaw, Lokayan, Centre for the Study of Developing Societies, New Delhi
Non Motorized Transport in Peri-Urban Areas of Case study prepared for the Delhi, India Page 22 of 23 Global Report on Human Settlements 2013

Non Motorized Transport in Peri-Urban Areas of Case study prepared for the Delhi, India Page 23 of 23 Global Report on Human Settlements 2013
Ministry of Shipping, Road Transport and Highways (2006) ‘State-wise number of persons killed in road accidents on National Highways, State Highways and other roads of India (2004)’, Starred Question no.169, New Delhi: Parliament of India, Rajya Sabha
Mohan, D and G. Tiwari (2000) ‘Road safety in less motorized countries – Relevance of international vehicle and highway safety standards’, Proceedings for the International Conference on Vehicle Safety, Paper C567/008/2000, London: Institution of Mechanical Engineers, pp 155–166
Mohan, D; O. Tsimhoni, M. Sivak and M.J. Flannagan (2009) ‘Road safety in India: Challenges and opportunities’, Transportation Research Institute, University of Michigan, Report no. UMTRI-2009–1, http://deepblue.lib.umich.edu/bitstream/2027.42/61504/1/102019.pdf, last accessed 7 June 2011
Mukti, A. (2009) ‘Demand estimation for public transport systems: Developing a demand estimation model for Delhi Metro’ Doctoral Thesis, Transportation Research and Injury Prevention Program, Indian Institute of Technology, Delhi
NCRB (National Crime Records Bureau) (2007).Accidental Deaths and Suicides in India – 2006: National Crime Records Bureau, Ministry of Home Affairs, New Delhi
Ravi, R. (2008) ‘Cycle rickshaw in Delhi’, in Position Papers on Bicycling in Asia, Interface for Cycling Expertise, pp 103–112
RITES (1998) ‘Route rationalization and timetable formulation study for bus system of Delhi’, Government of the National Capital Territory of Delhi, Delhi
RITES (2001) Household Survey for Transport Department, Government of the National Capital Territory of Delhi
RITES (2005) Report for Transport Department, Government of the National Capital Territory of Delhi, September
Singh, N. and A. Anand (2001) ‘Linking transport planning with alleviating women's poverty’, unpublished report of joint project by Asian Institute of Transport Development, New Delhi, and Transportation Research and Injury Prevention Program, IIT Delhi
Tiwari, G. (1999) ‘Towards a sustainable urban transport system: Planning for non-motorized vehicles in cities’, Transport and Communications Bulletin for Asia and the Pacific 68: 49–66
Tiwari, G. (2002) ‘Planning for bicycles and other non-motorized modes: The critical element in city transport system, Asian Development Bank International Workshop on Transport Planning, Demand Management and Air Quality, February 2002, Manila
Tiwari, G. (2003) ‘Transport and Land-use Policies in Delhi’, Bulletin of the World Health Organization 81: 444–450
Tiwari, G. and H. Jain (2008) ‘Bicycles in urban India’ in Position Papers on Bicycling in Asia, Interface for Cycling Expertise, pp 3–20
Tiwari, G., D Mohan and D. Gupta (2000) ‘Evaluation of capacity augmentation projects of national highways and state highways, Ministry of Surface Transport, New Delhi
Tiwari, G., J. Fazio and S. Gaurav (2007) ‘Traffic planning for non-homogeneous traffic’, Sa ̄dhana ̄ 32(4): 309–328
TRIPP (Transportation Research and Injury Prevention Programme) (2000) Internal Working Paper, Indian Institute of Technology, Delhi
TRIPP (2010) ‘Bicycle master plan for Delhi (Revised)’, Indian Institute of Technology, Delhi