non tariff measures an introductionary...
TRANSCRIPT
1
NON TARIFF MEASURES: AN INTRODUCTIONARY
GUIDE
Raoul Minetti, Luca Salvatici1
FONDAZIONE MANLIO MASI
Via Listz 21,-0014 Roma tel. 06.599260049 [email protected]
1 Raoul Minetti, Michigan State University, Luca Salvatici, Roma Tre University, Viola Di Caccamo provided assistance in the preparation of individual sections and the editing of the report
2
Executive Summary ........................................................................................................................... 5
Chapter One: Definition and Classification of Non Tariff Measures ........................................... 8
1.1 Definition ....................................................................................................................................... 8 1.2 UNCTAD-ITC Classification ...................................................................................................... 10
1.2.1 Main Chapters ......................................................................................................................... 10 1.2.2 The Role Of TBT And SPS .................................................................................................... 12 1.2.3 Technical measures (Chapters A and B) ................................................................................ 13
Chapter Two: The role of Non Tariff Measures in the WTO system ......................................... 15
2.1 Regulatory approaches............................................................................................................... 15
2.2 Multilateral ................................................................................................................................ 15 2.3 The TBT an SPS agreements ..................................................................................................... 17
2.3.1 Avoid trade restrictiveness ................................................................................................. 17
2.3.2 Harmonisation .................................................................................................................... 19 2.3.3 Transparency ...................................................................................................................... 20 2.3.4 Equivalence (mutual) recognition ...................................................................................... 22 2.3.5 Main Differences between TBT and SPS .......................................................................... 23
2.4 Regional/Bilateral ...................................................................................................................... 25
Chapter Three: Measuring and summarizing NTBs .................................................................... 29
3.1 Measurement problem ............................................................................................................... 29 3.1.1 Inventory methods ............................................................................................................. 29
The frequency index ................................................................................................................... 29 3.1.2 Price wedges ...................................................................................................................... 30 3.1.3 Tariff equivalents ............................................................................................................... 30
Price equivalents ......................................................................................................................... 31
3.2 Aggregation problem ................................................................................................................. 34 3.2.1 Simple averages ................................................................................................................. 34 The frequency index ................................................................................................................... 34
3.2.2 Weighted averages ............................................................................................................. 34 3.2.3 Equivalence measures ........................................................................................................ 35
Chapter Four: Main Worldwide Trends ....................................................................................... 37
4.1 European Trends .......................................................................................................................... 37 4.2 SPS and TBT in the World Economy .......................................................................................... 39
4.2.1 Metodology I-TIP ................................................................................................................... 41 Appendix 1. Gravity Model ............................................................................................................... 43
Appendix 2. CGE models .................................................................................................................. 45 Appendix 3. Main Features regarding European Export ................................................................... 47
European Exports............................................................................................................................. 47 An introduction for the agri food sector ..................................................................................... 47 Main regulations ......................................................................................................................... 48 Labels .......................................................................................................................................... 48 Alcoholic Beverages ................................................................................................................... 49
Appendix 4. Databases ....................................................................................................................... 51 Integrated Trade Intelligence Portal (I-TIP) .................................................................................... 51 Trade Monitoring Database ............................................................................................................. 51 NTM official data ............................................................................................................................ 52 World Bank Temporary Trade Barriers Database (TTBD) ............................................................. 52
UNCTAD TRAINS ......................................................................................................................... 53 OECD product market regulation .................................................................................................... 54
ITC business surveys ....................................................................................................................... 54 Perinorm .......................................................................................................................................... 56
References ......................................................................................................................................... 58

3
GLOSSARY
ALOP Appropriate Level Of Protection
CEPR Centre for Economic Policy Research
CTS Consolidated Tariff Schedule Data Base
GTA Global Trade Alert
ITC International Trade Center
I-TIP Integrated Trade Intelligence Portal
MAST Multi-Agency Support Team
MRA Mutaul Recognition Agreement
NTB Non Tariff Barrier
NTE The National Trade Estimate
NTM Non Tariff Measure
OECD Organisation for Economic Co-operation and Development
RAPEX Rapid Exchange of Information
RoHS Restriction of Hazardous Substances Directive
SPS Sanitary And Phytosanitary Measures
TBT Technical Barrier to Trade
TRAINS Trade Analysis and Information System
TTB Alcohol Tobacco Tax Trade Bureau
TTBD World Bank Temporary Trade Barriers Database
USITC United States International Trade Commission
UNCTAD United Nation Conference on Trade and Development
WITS World Integrated Trade Solution
WTO World Trade Organisation

4
5
Executive Summary
Governments are subject to incresing pressures to assist domestic firms and industries, and the
possibility to use traditional trade policies such as tariffs have been largely limited around the
world as a result of multilateral, regional, and unilateral tariff reductions. It is well-known that the
implications of trade liberalisation have been enormous, with the value of global trade expanding,
and foreign direct investment flows growing even more: the result is an ever increasing
fragmentation of production and the development of global value chains.
Changes in the structure of global trade and production have implications for trade policy choices,
and Non Tariff Measures (NTM) have become more attractive so that they presently are one of the
main sources of trade costs. Well-established theoretical grounds exist for lowering tariffs, since
levels of trade and welfare are both positively correlated with lower rates. A similar presumption
is often offered for removing NTMs but theoretical and empirical grounds for such claims are
much weaker.
Market imperfections call for some regulatory or policy interventions, which may reduce or
enhance trade flows. In practice, many of the NTMs that are imposed by governments have
legitimate objectives - such as safeguarding human health, plant safety, national security,
consumer protection, and so forth. Since they often respond to societal demands that are likely to
grow over time and with consumer wealth, NTMs are with us to stay.
Removing policies that address market imperfections may be suboptimal, and this makes linkages
among NTMs, trade and welfare more tenuous than for tariffs. As a matter of fact, if product
standards and technical regulations can act as trade inhibitors, they can also act as trade
facilitators. For instance, they can alleviate asymmetric information problems by subjecting all
producers to a common quality standard and then encouraging consumption.
There are two main reasons to focus on NTMs:
First of all it is crucial to study NTMs due to their proliferation in terms of numbers but also in
terms of their variety. It is also important to consider the fact that their impact on trade is still not
completely understood and their magnitude is difficult to measure.
Secondly, NTMs can be extremely discriminatory. In fact, even if they are uniformly applied to all
imported goods, many NTMs discriminate among a country's trading partners. This effect occurs
because of the costs of compliance to NTMs which can be different across exporters; in particular,
they can be higher for developing countries.

6
In order to provide a comprehensive report on NTMs, this study is divided into four different
chapters.
The first one, illustrates the main definitions and classifications of Non Tariff Barriers, providing
the reader with a general understanding on the overall role of this crucial form of trade cost.
Amongst the variety of NTMs, it has been decided to conduct an in depth analysis on Technical
Barriers to Trade (TBT) and Sanitary and Phytosanitary measures (SPS) that are widely addressed
as one of the main obstacles to free trade. In the appendix we report the main accessible databases
where it is possible to get the available data on NTMs.
The second chapter presents an overview of the regulation and the history of NTMs inside the
GATT/WTO system. The growing weight of the investigated measure in this study is, in fact,
reflected also in the importance that they have within multilateral and regional agreements and
inside the GATT/WTO rounds. The Tokyo and Uruguay rounds, for example, concentrated on
different NTBs, which were gradually subject to increased multilateral discipline. In this study,
both TBT and SPS agreements are dully examined, highlighting their main similarities and
differences, which allows a clearer understanding of such agreements.
The third chapter surveys the key quantitative instruments used in the literature in order to
evaluate and quantify the magnitude and the effects of NTMs on the free movement of goods.
Roughly, there are three ways of assessing the ad-valorem equivalent (AVE) of the wedge
introduced by NTMs between domestic and world prices. The simplest method consists in
comaring the price of a product affected by an NTM with its price in a similar market without the
NTM; more sophisticated econometric methods fall into two main categories: price- versus
quantity-based methods. The appendixes illustrate the challenges providing sound ecometric
estimation through the popular gravity models as well as the difficulties of feeding the AVEs of
NTMs into general equilibrium models to treat them as tariffs.
The fourths and final chapter illustrates several empirical examples of NTMs. Data is taken from
the World Trade Organisation (WTO I -TIP) to develop several graphs illustrating NTMs trends
both across countries and throughout time. The focus is on the TBTs and SPS’ that mainly
influence European import and export, with the intention of identifying future developments of
NTMs within the European framework of international agreements affecting trade (i.e., the
Transatlantic Trade And Investment Partnership, TTIP).
Three main takeaways may be highlighted follwing our review of the most recent thread of data and
analyses:
more effort should be put to collect data in both developed and developing countrties to
7
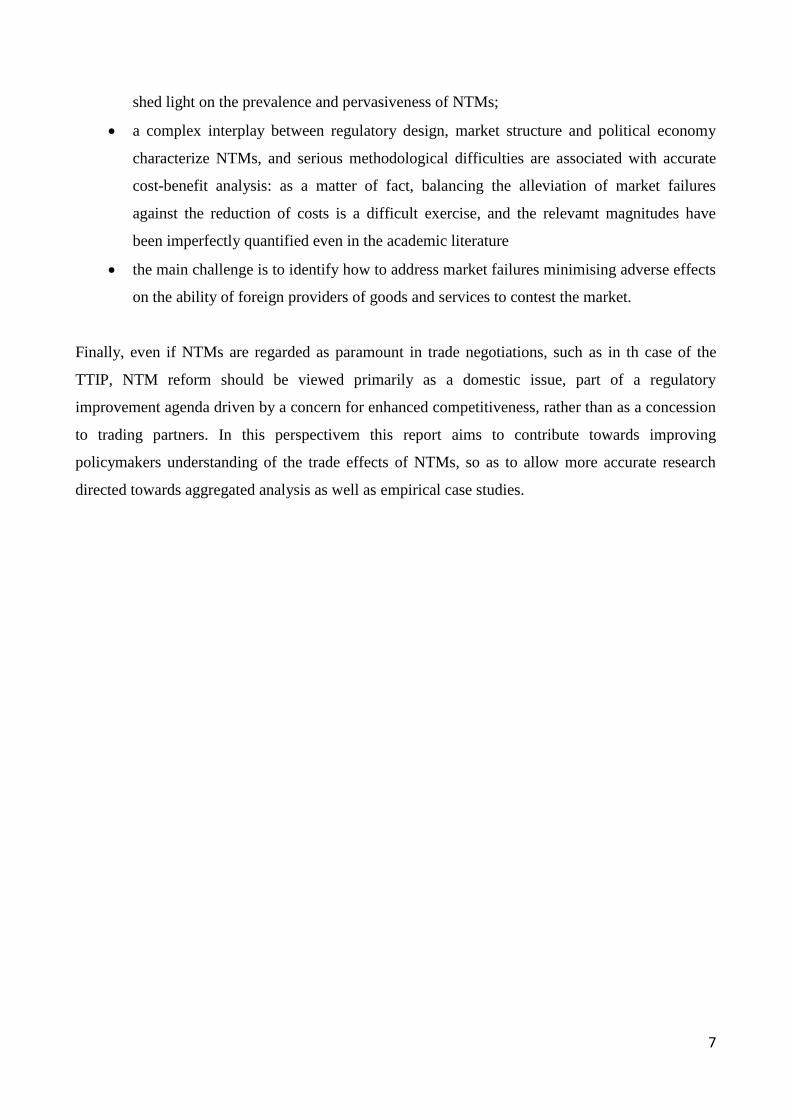
shed light on the prevalence and pervasiveness of NTMs;
a complex interplay between regulatory design, market structure and political economy
characterize NTMs, and serious methodological difficulties are associated with accurate
cost-benefit analysis: as a matter of fact, balancing the alleviation of market failures
against the reduction of costs is a difficult exercise, and the relevamt magnitudes have
been imperfectly quantified even in the academic literature
the main challenge is to identify how to address market failures minimising adverse effects
on the ability of foreign providers of goods and services to contest the market.
Finally, even if NTMs are regarded as paramount in trade negotiations, such as in th case of the
TTIP, NTM reform should be viewed primarily as a domestic issue, part of a regulatory
improvement agenda driven by a concern for enhanced competitiveness, rather than as a concession
to trading partners. In this perspectivem this report aims to contribute towards improving
policymakers understanding of the trade effects of NTMs, so as to allow more accurate research
directed towards aggregated analysis as well as empirical case studies.

8
Chapter One: Definition and Classification of Non Tariff Measures
1.1 Definition
The definition of Non-Tariff Measures (NTMs) is far from being uncontroversial. It is important
to offer a preliminary overview of the definitions that have been proposed by scholars and
international institutions. Non-Tarif Measures are typically defined as all non-price and non-
quantity restrictions on trade in goods, services and investment (Berden et al, 2009). This
definition comprises border measures (customs procedures, etc.) as well as behind-the-border
measures, which range from domestic laws, to regulations and practices as mentioned in the
Terms of Reference of this Study.
NTMs are often improperly referred to as non-tariff barriers (NTBs). However NTMs comprise a
wider set of measures than NTBs. Nowadays NTBs is only used to describe discriminatory NTMs
imposed by governments to favour domestic suppliers. The source of confusion between the two
terms is that in the past most NTMs took the form of quotas or voluntary export restraints. These
are restrictive measures by design, and this induced to use the term "barrier". However, policy
interventions take a variety of forms, and it is therefore better to refer to them as measures instead
of barriers.
According to UNCTAD (UNCTAD, 2010), NTMs are measures, other than ordinary customs
tariffs, that can affect the international trade of goods, influencing quantities traded or prices. This
can comprise policies and regulations that restrict trade as well as policies and regulations that
facilitate it. Moreover, UNCTAD established the MAST, attributing to it the objective of carrying
out the collection of data and the revision of the NTM classification. The MAST introduced the
following definition of NTMs: “policy measures, other than ordinary customs tariffs, that can
potentially have an economic effect on international trade in goods, changing quantities traded, or
prices, or both”. Thus, according to this definition, an NTM is a measure that produces a wedge
between the domestic price and the world price of one or several traded goods or services.
Hillman (1996) defines NTM or nontariff barriers (NTB) as all government measures, other than
tariffs or customs taxes, that restrict international commerce of domestic and imported goods and
services. According to Hillman, NTM or NTB can be classified into technical NTB when they
refer to quality product attributes and nontechnical NTB otherwise (Nardella and Boccaletti,
2004).
A broader definition is offered by Nicita and Guordon, 2013, according to which NTMs include
all policy-related trade costs that arise from the production stage to the final consumption stage,
9
with the exclusion of tariffs. The impact of NTMs on trade can either be the primary objective of
the policy (for example, in the case of quotas), or only the by-product of another objective (for
example, quality control and packaging requirements).
According to Staiger (2012), non-tariff measures can be classified depending on whether they are
imposed at the border and/or beyond, or on exports and/or imports; thus distinguishing between
restrictions applied to foreign products only (i.e. at the border) and those applied to both domestic
and foreign ones. Overall, what defines non-tariff measures is their effect on trade which can
either be a simple consequence of a policy, or its primary objective. Such effects can best be
identified by observing the NTM adopted by the regulator, the sector(s) of application, the impact
it has on consumers vis à vis producers or the level of discrimination between foreign and
domestic products.
In this regard, the WTO (2012) highlights a distinction between price-centered (i.e. subsidies),
quantity-centered (i.e. quotas) and quality-centered (i.e. technical and/or sanitary measures)
NTMs.
Import quotas which determine fixed levels of trade flows represent the main type of quantitative
restrictions. As a matter of fact, import quotas can be employed when information costs are high
to transfer income to interest groups or to obtain a specific policy goal. According to Melitz
(2005), for instance, if the level of protection of a specific industry needs to be decreased, and
there is not enough information regarding the policy setting, quotas may be a better instrument
than subsidies.
Price measures include domestic taxes, production subsidies, etc. To contrast market failures such
as externalities, price measures can be adopted to expand or reduce trade flows. Looking at
environmental policies, for instance, if a Pigouvian tax is levied to contrast pollution in a country
where the industry is competitive, domestic output will be higher than optimal lowering the trade
flow created due to the market’s inability to price in the environmental damage generated by
national producers. Thus, a Pigouvian tax can increase imports and welfare of the importing
country.
Quality measures imply a modification of the technical characteristics of the imported goods
which can act both as an impediment and as an incentive to trade. As exporters are required to
follow TBT and SPS measures, trade costs will increase. Alternatively, if TBT and SPS measures
contribute to ameliorating information asymmetries, increased confidence in the quality of the
products on the part of consumers will increase demand and trade. These considerations imply that
the effects that a quality measure will have on trade and welfare will depend on the market failures
it seeks to counter. A mere protection of domestic producers will diminish the level of trade and
10
welfare in the importing country. If, instead, the measure is adopted to contrast a real market
failure, welfare could increase with uncertain effects on trade levels. It is important to note that
consumers in the importing country will be affected because there will be less products and prices
will increase as trade volumes drop. Domestic companies, on the other hand, will profit as
competition will be depressed thanks to the exit of some exporters and the drop in sales from the
exporters still operating in the market. Finally, while compliance costs will force some exporters
to abandon the market, others will take this opportunity to enlarge their market share. It is not
uncommon for some countries to acquire a position within the global market by employing quality
and safety regulations. Increasing compliance costs for foreign exporters should lead to an
increase in output and revenues for domestic producers; while, on the consumer front, the
consequences will be an increase in price.
1.2 UNCTAD-ITC Classification
As noted, NTMs comprise all policy-related trade costs that arise from production to final
consumer, with the exception of tariffs. NTMs are classified depending on their scope and/or
design and can be subdivided in technical measures (SPS measures, TBTs and pre-shipment
inspections) and non-technical measures. These are further sub-classified in hard measures (such
as price and quantity control measures), threat measures (e.g. anti-dumping and safeguards) and
other measures (including trade-related finance and investment measures). The crucial feature of
NTMs to bear in mind is that they can significantly distort international trade, whether their trade
effects are protectionist or not. For example, measures such as quality standards, although in
principle they do not have a protectionist objective, may be of particular concern to the exporters
of poor countries (Disdier and Marette, 2010).
1.2.1 Main Chapters
To ease the collection of information on NTMs a classification was compiled by a team of experts
from eight international organizations –FAO, IMF, ITC, OECD, UNCTAD, UNIDO, the World
Bank and the WTO in 2008, with revisions carried out in 2009 and 2012. This classification
categorizes NTMs into technical and non-technical measures, and identifies 16 chapters.
Furthermore, the classification distinguishes between import-related measures (Chapters A to O),
11
which are imposed by the importing country, and export-related measures (Chapter P), which are
imposed by the exporting country.
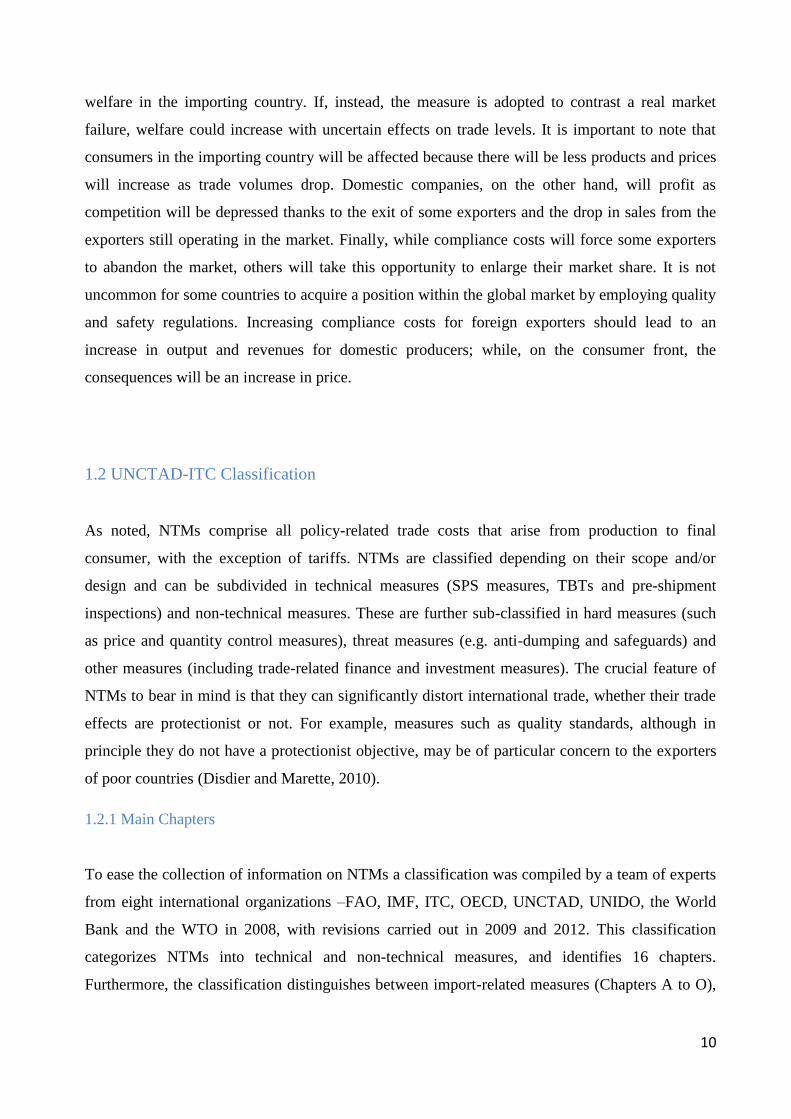
Technical measures (Chapters A and B) include product-specific features such as characteristics,
technical specifications and production process of a product. They also include conformity
assessment methods, which check the compliance of a product with given requirements. These
technical requirements are generally aimed at guaranteeing quality and food safety, environmental
protection and national security, and protecting animal and plant health. Non-technical measures
(Chapters C to O) do not refer to product properties but to trade requirements, such as shipping
requirements, custom formalities, taxation policies, trade rules, etc.
In addition, procedural obstacles (PO) POs are obstacles in administration or transportation such
as long delays in testing or certification, lack of adequate information, inappropriate facilities (ITC
Website).
Figura 1 Sounce UNCTAD 2013
12
The UNCTAD classification consists of a tree/branch structure where measures are classified into
16 chapters (A to P) depending on their scope and design. Each chapter is then further categorized
into sub-groups (see figure 1) with depth up to three levels (one, two, and three digits). The full
classification can be found in UNCTAD (2010).
Though the adoption of some NTMs is clearly conducive to restrictions on trade, other measures
have unclear effects. While the regulatory policies included in Chapters A, B and C clearly
address specific market imperfections (Beghin, 2006) in a variety of fields ranging from
environmental concerns, consumer rights, food safety and animal welfare, such measures may
represent an opportunity to increase technical requirements and reduce informational standards,
potentially increasing – not depressing – the demand for goods. Often these policies may be
enacted to ameliorate potential capacity failures of trading partners and to affect certification,
inspection, compliance and other trade costs which have a direct effect on trade flows (Boughner
et al., 2000).
1.2.2 The Role Of TBT And SPS
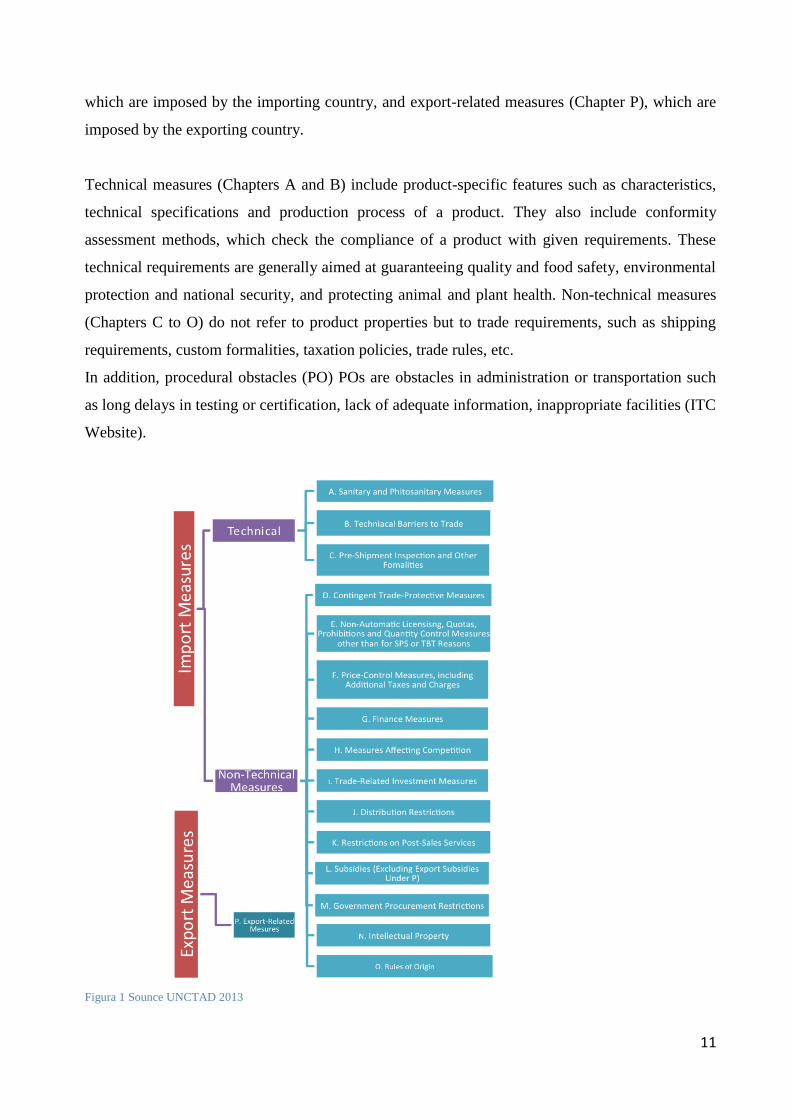
The importance of TBT and SPS is underlined also in an important work of Nicita and Guordon
(2012). Following the classification presented above, the two authors, using a database that
includes the European Union, Japan and 29 developing countries, find out that TBT affect about
30% of products, while the incidence of SPS is around 15%. It is clear that the predominance of
these two types of measures demonstrates that a major shift in world trade has taken place in the
last twenty years or so: through multi/bi-lateral and regional agreements tariffs have decreased and
no longer represent the main trade policy measures. The prevalence of SPS and TBT is a matter of
concern especially for developing countries with higher value-added and for those investing in
new international trade sectors. Quantity controls represent the second largest NTM category in
that they affect 16% of products and about 20% of trade (Nicita and Guordons, 2012).

13
Figura 2 Source Nicita Guordon (2012)
1.2.3 Technical measures (Chapters A and B)
Sanitary and phytosanitary measures include regulations protecting human, animal and/or plant
life. TBTs are concerned with technical regulations, standards and conformity assessment
procedures with objectives unrelated to trade (i.e. environmental protection). Both SPS and TBTs,
without regard to their objectives, can have sizeable effects on international trade (UNCTAD,
2013) and, hence, are mentioned in two important WTO agreements.
Chapter A: Sanitary and phytosanitary measures (SPS)
Sanitary and phytosanitary (SPS) measures are technical in nature, and can include prohibition,
quality and hygienic requirements, production and conformity assessments, and generally aim at:
- Protecting human or animal life from food-related issues related to additives, contaminants,
toxins or disease-causing organisms;
- Protecting human life from diseases carried by plants and/or animals;
- Protecting animals or plants from pests and diseases;
- Preventing damages caused to a country by the entry, establishment or spread of pests;
- Protecting bio-diversity.
Examples include, among others, the prohibition imposed on the import of poultry from countries
affected by avian flu or the pasteurization of liquid eggs to destroy Salmonella viruses.
13
28
11
2
16 14
31
11
5
22
SPS TBT Pre Shipment Price Control Quantity Control
Frequency Index and Coverage Ratio by NTM chapters
Frequency Index(%) Coverage Ratio(%)
14
Chapter B: Technical barriers to trade (TBT)
TBT measures concern procedures aiming at assessing the conformity to technical regulations –
defining a product’s characteristic and method of production – and standards including applicable
administrative provisions, sampling, testing and inspection procedures, terminology, symbols,
packaging, labeling requirements (and excluding the measures dealt with by the SPS Agreement).
Technical regulations are classified under measures B1 through B7 – with regulations in B4
dealing exclusively with Production Processes – while procedures related to Conformity
Assessment are classified under Chapter B8. Examples include among others: imports of
medicines, drugs, explosives, weapons, alcohol, cigarettes, etc. may have to be registered in the
importing country; chocolate producers must use a minimum of 30% of cocoa for the product to
be defined as “chocolate”.
15
Chapter Two: The role of Non Tariff Measures in the WTO system
2.1 Regulatory approaches
Non-tariff measures have always featured a basic policy challenge – how to ensure that NTMs do
not restrict or distort trade, and at the same time ensure that they can be used for necessary and
legitimate policy goals. Whether NTMs are concerned, the principles that should guide regulatory
practices are largely the same (UNCTAD, 2013):
Non-discrimination. Similar products and services from all countries should be given equal
competitive opportunities, in conformity with the WTO principles of national treatment and most
favoured nation clause. For instance, technical regulations should not be designed to be costlier for
some producers than for others.
Use of international standards for technical regulations. The policy option in which each country
chooses one common standard is known as ‘harmonisation’.
Ensuring the quality of conformity assessment procedures. These procedures should act as
facilitators (by raising consumer confidence) as opposed to bureaucratic harassment. Options
include mutual recognition agreements (whereby a country grants unrestricted access to products
that meet the standard of another country and vice versa), recognition of suppliers' declaration of
conformity, unilateral recognition of conformity assessment results from other countries and
voluntary agreements between conformity assessment bodies in different countries.
Transparency and openness. All stakeholders should have unrestricted access to relevant
information on regulations and procedures and be consulted on their design. Bureaucratic
discretion should be limited by clear rules. ‘Transparency’ reduces the costs associated with
having to learn about regulations of other countries and makes it more difficult for importers to
introduce a discriminatory regulation.
Avoiding unnecessary trade restrictiveness. Governments should avoid the use of instruments that
restrict trade more than needed to fulfil legitimate non-trade objectives, either by design or in their
implementation. Use of performance-based regulation instead of regulations based on design or
descriptive characteristics, so as to preserve producers’ technical flexibility in meeting
requirements. This is important to encourage innovation in response to regulation.
2.2 Multilateral
The GATTacronimo non incluso nella lista iniziale text, included among the WTO agreements,
does not restrict the regulatory autonomy of WTO members except when a measure treats an

16
imported product less favourably than a “like” domestic product (Article III: national treatment),
discriminates between two like imported products (Article I: most-favoured nation), or represents
a border prohibition or restriction that limits the quantity imported or exported of a product
(Article XI). Standards, technical regulations and conformity assessment procedures should not
openly discriminate imports according to the national treatment principle (Article III, outlawed
internal taxes or charges on imported products that were not applied equally to “like” domestic
products). National treatment also requires that domestic laws and regulations related to sales,
purchases, transportation and distribution be non-discriminatory in their application. Although the
GATT did not explicitly refer to technical or health standards, Article III’s coverage of “laws,
regulations, and requirements” was generally assumed to apply (that is, the same standard may
apply to domestically and produced goods).
National standards may impose large costs on foreign producers. They may generate fixed costs
for the interpretations of regulations and may also increase marginal costs if the standards result in
a reduced scale of operation. Similarly, conformity assessment procedures can constitute a barrier
to trade. Often exporters are required to certify their products in each of the countries where they
export. The resulting costs also comprise the risk that goods are rejected by the importing country
after shipment as well as the costs in terms of time requierd for complying with administrative
requirements and inspections by the importing country’s authorities.
To the extent that standards, technical regulations and conformity assessments procedures increase
costs for foreign companies relatively more than for domestic firms, they act as a protectionst
measure; that us, they reduce the ability of a producer to enter a foreign market. As a consequence.
governments may define technical regulations, standards and conformity assessment procedures
with the strategic aim of creating a disadvantage for foreign competitors.
While the GATT framework attempts to drive import protection toward the instrument of applied
MFN tariffs, the Agreement also contains a variety of exceptions spelling out conditions under
which governments could subsequently resort to other instruments of protection (Article XX
explicitly recognizes that measures “necessary to protect human, animal or plant life and health”
were justified – confirming governments’ responsibility for ensuring that goods of all kinds meet
certain national standards – but only so long as these measures met the “necessity” standard, and
did not “constitute a means of arbitrary or unjustified discrimination or a disguised restriction on
international trade”). The broad strategy for the GATT system at its inception was twofold. First,
get countries to convert their quantitative restrictions and other nontariff barriers into
nondiscriminatory, or most-favored-nation (MFN), tariff form. Then, get the GATT members
17
together in teriodic negotiating rounds to reciprocally exchange concessions to lower these applied
tariffs, and legally ‘bind’ those tariffs to prevent them from increasing.
The Agreement in the WTO that deals with technical barriers to trade in goods is the Agreement
on Technical Barriers to Trade (TBT). Another agreement containing standard-related to trade in
goods provisions is the Agreement on the Application of the Sanitary and Phytosanitary Measures
(SPS). The SPS Agreement applies to any measure that is applied to protect human or animal or
plant life or health. The WTO agreement does not deal with production (i.e., process) standards.
Products standards need to be ‘justified’ and governments need to ensure that requirements are not
‘unnecessarily trade restrictive’.
2.3 The TBT an SPS agreements
Both agreements were entered into force on January 1, 1995, as part of the establishment of the
WTO, following the Uruguay Round of multilateral negotiations. These agreements establish rules
regarding the use of certain human, animal, and plant health protection measures, as well as the
technical requirements, standards and procedures intended to ensure such protections are met, for
a range of traded goods. These agreements apply only to governmental measures that may directly
or indirectly affect international trade (Johnson, 2014)
The WTO agreements on sanitary and phytosanitary measures (SPS Agreement) and technical
barriers to trade (TBT Agreement) both explicitly address the problem of trade restricting
regulatory measures (regulations, standards and conformit assessment procedures, see definitions
below). Further, both agreements encourage international harmonization of food standards and the
use of equivalence to facilitate trade. In addition, provisions of the TBT Agreement include the
use of mutual recognition of conformity assessment procedures (cf. Article 6) (Elvestad and
Veggeland, 2005)
2.3.1 Avoid trade restrictiveness
For a government, avoiding unnecessary obstacles to trade means that when it is preparing a
technical regulation to achieve a certain policy objective - whether protection of human health,
safety, the environment, etc - the negotiations shall not be more trade-restrictive than necessary to
fulfil the legitimate objective. According to the TBT Agreement, specifying, whenever appropriate,
18
product regulations in terms of performance rather than design or descriptive characteristics will
also help in avoiding unnecessary obstacles to international trade (Article 2.8).
Unnecessary obstacles to trade can result when (i) a regulation is more restrictive than necessary
to achieve a given policy objective, or (ii) when it does not fulfil a legitimate objective. A
regulation is more restrictive than necessary when the objective pursued can be achieved through
alternative measures which have less trade-restricting effects, taking account of the risks non-
fulfilment of the objective would create. Elements that Members can use for risk assessment are:
available technical and scientific information, technology or end-uses of the products. Article 2.2
of the Agreement specifies that legitimate objectives include inter alia: national security
requirements, prevention of deceptive practices, protection of human health or safety, protection
of animal and plant life or health or the environment.
Also in the SPS agreement it is underlined how it is important to avoid unnecessary obstacles to
trade, and this concern is articulated in Article 5.5.According to the agreement, Members must
avoid unjustifiable differences in the level of health protection they require in different situations,
if such differences result in discrimination or a disguised restriction on international trade. For
example, if a Member restricts the importation of one animal product because of disease risks, yet
allows the importation of other animals presenting identical or similar risks, there would be a
concern that the objective may be protectionism (protection from competition), and not health
protection.
Article 5.6 requires Members to adopt measures that are not more trade-restrictive than required to
achieve their appropriate level of protection. This implies that when there are alternative ways to
achieve that appropriate level of protection, the government should use those measures which are
the least trade-restrictive, if technically and economically feasible. For example, if a country wants
to avoid the introduction of an insect associated with fruit imports, requiring fumigation might be
a less trade-restrictive alternative to an import ban.
Furthermore ,article 2 of the SPS Agreement stresses that Members have the right to adopt SPS
measures to achieve their self-determined health protection level. This level, called the appropriate
level of protection (ALOP) or the acceptable level of risk, represents a key feature of the SPS
Agreement.
19
The right to adopt SPS measures to achieve a given appropriate level of protection is accompanied
by basic obligations. Essentially, countries may adopt SPS measures provided the measures:
are applied only to the extent necessary to protect life or health;
are based on scientific principles and not maintained without sufficient scientific evidence
(except emergency or provisional measures); and
do not unjustifiably discriminate between national and foreign, or among foreign sources of
supply.
Members have two options to show that their measures are based on science. They may
either:
base their measures on international standards;
or base their measures on scientific risk assessment.
To find out how this article has been applied in dispute settlement see relevant findings in the
Variety Testing case.
2.3.2 Harmonisation
Harmonisation has a key role in both the TBT and SPS agreements and it is regulated,
respectively, in article 5 and article 3.
Harmonization is necessary for the connection and compatibility of parts of products, i.e.
telecommunications equipment or car parts. Lack of technical compatibility might otherwise
generate barriers to international trade. For example, television sets suitable for the US market
would be unsaleable in Europe due to divergences in colour broadcasting formats (NTSC vs PAL
or SECAM). Similarly, in order to be marketable in the United Kingdom, French or German
motor vehicles need to be adjusted to right-hand drive. The costs of designing, manufacturing, and
delivering the same product in various configurations may be high.
For many years, technical experts have worked towards the international harmonization of
standards. An important role in these efforts is played by the International Standardization
Organization (ISO), the International Electrotechnical Commission (IEC) and the International
Telecommunication Union (ITU). Their activities have had major impact on trade, especially in
20
industrial products. For example, ISO has developed more than 9,600 international standards
covering almost all technical fields.
In the SPS agreement harmonisation is regulated by article 3 which encourages Members to base
their measures on international standards, guidelines and recommendations, where they exist. By
harmonizing SPS measures with international standards, food safety and animal and plant health
protection can be achieved without unduly restricting international trade.
The SPS Agreement recognizes in particular three international standard-setting bodies (the three
sister organizations). For food safety measures, standards, guidelines and recommendations are
established by the Codex Alimentarius Commission. Similarly, the Office Internationale des
Epizootiesaddresses animal health measures, and the Secretariat of the International Plant
Protection Convention sets norms for plant health measures. It should be noted that the SPS
Agreement makes no legal distinction between the “standards”, “guidelines” and
“recommendations” of these three organizations. All three types of norms have equal status under
the SPS Agreement (see “Clarification of References to Codex Texts”,G/SPS/W/86/Rev.1).
Measures based on international standards, guidelines or recommendations developed by the three
sister organizations are presumed to be consistent with the SPS Agreement, and Members who
base their measures on them can be confident of their compliance with the SPS
Agreement. International standards are sometimes described as providing a “safe harbour” for
governments. Clearly, however, Members have the right to challenge all SPS measures, and
particularly if they believe that the claim of being based on an nternational standard is ill
founded.The process of harmonization is monitored by the SPS Committee in cooperation with the
three sister organizations.
2.3.3 Transparency
Trasparency is one of the main issue regarding both TBTs and SPSs and it is regulated in both the
agreements that we are considering.
Technical regulations and conformity assessment procedures
In order to foster transparency, the TBT agreement requires that members notify when two
conditions occur: (1) whenever a relevant international standard or guide or recommendation does
21
not exist, or the technical content of a proposed or adopted technical regulation or procedure is not
in accordance with the technical content of relevant international standards or guides of
recommendations; and (2) if the technical regulation or conformity assessment procedure may
have a significant effect on the trade of other Members (Articles 2.9 and 5.6). Draft regulations
should be notified to the WTO Secretariat, if possible sixty days prior to their formal adoption so
as to allow time for other Members to make comments. Regulations can also be notified ex-post
whenever urgent problems of safety, health, environment protection arise (Articles 2.10 and 5.7).
Local Governments at the level directly below central government are required to notify technical
regulations and conformity assessment procedures which have not been previously notified by
their central government authorities (Article 3.2 and 7.2).
Each WTO Member must, promptly after the Agreement enters into force for it, notify Members
of the measures in existence or taken to ensure the implementation and administration of the
Agreement and of any subsequent changes to them (Article 15.2). This written statement has to
include, inter alia, all relevant laws, regulations, administrative orders, etc., to ensure that the
provisions of the Agreement are applied; the names of the publications where draft and final
technical regulations, standards and conformity assessment procedures are published; the expected
length of time for the presentation of written comments on technical regulations, standards or
conformity assessment procedures; and the name and address of the Enquiry Points established
under Article 10.
Also for the SPS agreement, one of the key goal is to increase the transparency of sanitary and
phytosanitary measures. Governments are required to notify other countries of any new or
changed SPS measure which affects trade. They also have to set up offices (Enquiry Points) to
respond to requests for more information on new or existing measures. Such increased
transparency protects the interests of consumers, as well as trading partners, from hidden
protectionism through unnecessary technical requirements.
The SPS Committee is a forum where WTO Members exchange information on all aspects related
to the implementation of the SPS Agreement. It reviews compliance with the agreement, discusses
specific trade concerns, and all matters related to notification and transparency in general.
The transparency obligations of the Agreement are contained in Article 5.8,Article 7 and Annex
B. In addition, the Committee has elaborated recommended procedures for implementing the
transparency obligations of the SPS Agreement (G/SPS/7/Rev.2).
22
Whenever an international standard, guideline or recommendation does not exist or the content of
a proposed sanitary or phytosanitary regulation is not substantially the same as the content of an
international standard, guideline or recommendation, and if the regulation may have a significant
effect on trade of other Members, Members shall:
(a) publish a notice at an early stage in such a manner as to enable interested Members to become
acquainted with the proposal to introduce a particular regulation;
(b) notify other Members, through the Secretariat, of the products to be covered by the regulation
together with a brief indication of the objective and rationale of the proposed regulation. Such
notifications shall take place at an early stage, when amendments can still be introduced and
comments taken into account;
(c) provide upon request to other Members copies of the proposed regulation and, whenever
possible, identify the parts which in substance deviate from international standards, guidelines or
recommendations;
(d) without discrimination, allow reasonable time for other Members to make comments in
writing, discuss these comments upon request, and take the comments and the results of the
discussions into account.
2.3.4 Equivalence (mutual) recognition
Equivalence is the process leading to the preparation of an international standard and it can be
lengthy and costly. Reaching consensus on technical details can take several years. The time gap
between the adoption of an international standard and its implementation by national regulators
can also be significant. For these reasons, negotiators introduced in the TBT Agreement a
complementary approach to technical harmonization, known as equivalence. Technical barriers to
international trade could be eliminated if Members accept that technical regulations different from
their own fulfil the same policy objectives even if through different means. This approach is
contained in Article 2.7 of the TBT Agreement. The issue of equivalence is also considered by the
SPS agreement. The idea is simple and is a requirement in the SPS Agreement. Much more
difficult is how to do it. Years of discussion have led to guidelines, which then required clarifying.
Some recognition of equivalence is in place, but members will always feel that their trading
partners can do more.
23
Developing countries in particular say the actions they are taking on their exports provide levels of
protection that are not recognized as equivalent to importing developed countries’ requirements.
An example in relation to technical measures is Japan’s acceptance of the U.S. standard for
organic agricultural products as equivalent to the relevant Japanese standard, allowing products
labelled in accordance with the U.S. standard on the Japanese market (WTO 2002, see also case
description in chapter 3 of this report). In other words, Japan considers the U.S. standard and
labelling practices to be ensuring the interest of the consumers in a way just as effective as its own
standard and practices. These examples illustrate that equivalence recognition can lead to the same
results as harmonization; trade barriers are removed and the products can be accepted on the basis
that they fulfil the relevant regulatory objectives – even though regulatory differences persist.
Agreements involving equivalence assessments make it possible to maintain distinct national
regulatory measures while at the same time removing the measures’ (Veggelandm Elvestad, 2004)
In conclusion, the equivalence (mutual) recognition means that two or more parties mutually
accept each other’s rules. Such acceptance is possible in situations where differences in national
regulatory measures and objectives are considered to be of no such nature as to allow for trade
restrictions. A classic example of this conception of mutual recognition is the so-called “Cassis de
Dijon doctrine” of the European Union, which implies that a product lawfully produced in one
member state must be accepted into another member state. According to this doctrine national
food legislation cannot be invoked to prevent trade unless necessary for reasons of public health,
fiscal supervision or consumer protection. Mutual recognition in this sense means that producers
that comply with the regulatory requirements of an exporting country, automatically should be
allowed into an importing country (Elvestad & Veggeland, 2005).
2.3.5 Main Differences between TBT and SPS
Firstly, the scope of the two agreements is different. The SPS Agreement covers all measures
whose purpose is to protect:
human or animal health from food-borne risks;
human health from animal- or plant-carried diseases;
animals and plants from pests or diseases;
24
whether or not these are technical requirements.
The TBT Agreement covers all technical regulations, voluntary standards and the procedures to
ensure that these are met, except when these are sanitary or phytosanitary measures as defined by
the SPS Agreement. It is thus the type of measure which determines whether it is covered by the
TBT Agreement, but the purpose of the measure which is relevant in determining whether a
measure is subject to the SPS Agreement.
On the other hand, by definition, regulations which address microbiological contamination of
food, or set allowable levels of pesticide or veterinary drug residues, or identify permitted food
additives, fall under the SPS Agreement. Some packaging and labelling requirements, if directly
related to the safety of the food, are also subject to the SPS Agreement.
Sanitary and phytosanitary measures may be imposed only to the extent necessary to protect
human, animal or plant health, on the basis of scientific information. Governments may, however,
introduce TBT regulations when necessary to meet a number of objectives, such as national
security or the prevention of deceptive practices. Because the obligations that governments have
accepted are different under the two agreements, it is important to know whether a measure is a
sanitary or phytosanitary measure, or a measure subject to the TBT Agreement.
While the aim to prevent unnecessary trade barriers is common to both agreements, the rights and
obligations they entail are quite different. Under the SPS Agreement, measures may be imposed
only to the extent necessary to protect life or health, on the basis of scientific
information. However, the TBT Agreement permits the introduction of TBT regulations to meet a
variety of legitimate objectives, including national security, the prevention of deceptive practices,
protection of human health or safety or the environment. Essentially, the WTO recognizes that
governments will impose technical requirements for a wide variety of reasons, and the TBT
Agreement allows them to do this, subject to certain disciplines.
TBT measures, indeed, could cover any subject, from car safety to energy-saving devices, to the
shape of food packages. To give some examples pertaining to human health, TBT measures could
include pharmaceutical restrictions, or the labelling of cigarettes. Most measures related to human
disease control are under the TBT Agreement, unless they concern food safety or diseases which
are carried by plants or animals (such as rabies). In terms of food, labelling requirements dealing
with nutrition claims, quality and packaging regulations are not considered to be SPS measures
25
and hence are normally subject to the TBT Agreement. However, labelling requirements dealing
with food safety are considered to be SPS measures.
The SPS Agreement applies to a narrowly defined range of health protection measures, but it
places quite strict requirements on these measures, for example that they always be based on
scientific principles. The TBT Agreement on the other hand applies to a wide range of technical
requirements, and solely notes that available scientific information is one of the relevant elements
of consideration in assessing risks. Some of these technical requirements are introduced for health
or safety purposes, but others are introduced to standardize products, ensure quality, or to avoid
consumer deception. In these cases scientific information might be less relevant in assessing risks
than for example processing technology and intended
Even if the two agreements have some common elements, including basic obligations for non-
discrimination and similar requirements for the advance notification of proposed measures and the
creation of information offices ("Enquiry Points"), many of the substantive rules are different. For
example, both agreements encourage the use of international standards. However, under the SPS
Agreement the only justification for not using such standards for food safety and animal/plant
health protection are scientific arguments resulting from an assessment of the potential health
risks. In contrast, under the TBT Agreement governments may decide that international standards
are not appropriate for other reasons, including fundamental technological problems or
geographical factors.
2.4 Regional/Bilateral
GATT rules on NTMs are consistent with a “shallow integration” approach. Many regional
agreements include norms for technical barriers to trade. It is clear that, to the extent that regional
trade agreements are signed among ‘similar’ countries or countries that trust each other, they
could provide rules that go beyond those established at the WTO.
One example is the EU itself:
The process of harmonization of standards and regulations takes place in national and
European standardization bodies mutually cooperating.
Where technical standards are not harmonized, the principle of mutual recognition applies.
In addition, EU countries mutually recognise each other’s conformity assessments.
26
Piermartini and Budetta (2009) point out emerging patterns as to the way regional agreements
address the issue of removing technical barriers to trade. On the other hand, Horn, Mavroidis and
Sapir (2009) distinguish commitments going beyond the WTO, but building on WTO
commitments (“WTO+”), including e.g. SPS and TBT commitments, from commitments covering
areas not covered by the WTO (“WTO-X”), including e.g. labour or environmentcommitments.
Many United States and European Union bilateral free trade agreements have WTO+ clauses. For
instance, all 14 European Union agreements reviewed include TBT provisions, but those are
enforceable in only five of them (the Caribbean Forum of African, Caribbean and Pacific States
(CARIFORUM), Mexico, Chile and the European Economic Area (EEA) and Turkey). These
commitments are typically deeper than in the case of United States agreements, which only restate
the WTO obligations of preferential partners. Eight European Union agreements include SPS
provisions and only three are legally enforceable (EEA, Chile and CARIFORUM). As for the
United States, 12 agreements include SPS provisions, but only two are legally enforceable through
dispute settlement (Israel and NAFTA).

27
Box1. TTIP: Main Implications
The Transatlantic Trade and Investment Partnership (TTIP) is a trade agreement that is presently being
negotiated between the European Union and the United States.
It aims at removing trade barriers in a wide range of economic sectors to make it easier to buy and sell
goods and services between the EU and the US.
On top of cutting tariffs across all sectors, the EU and the US want to tackle barriers behind the customs
border – such as differences in technical regulations, standards and approval procedures. These often cost
unnecessary time and money for companies who want to sell their products on both markets. For example,
when a car is approved as safe in the EU, it has to undergo a new approval procedure in the US even
though the safety standards are similar.
The TTIP negotiations will also look at opening both markets for services, investment, and public
procurement. They could also shape global rules on trade.
The aim is to increase trade and investment between the EU and the US by unleashing the untapped
potential of a truly transatlantic market place. The agreement is expected to create jobs and growth by
delivering better access to the US market, achieving greater regulatory compatibility between the EU and
the US, and paving the way for setting global standards. If such an ambitious agreement were achieved, it
is expected that every year an average European household would gain an extra €545 and our economy
would be boosted by 0.5% to up to 1% of GDP, or €119 billion annually, once fully implemented
(http://trade.ec.europa.eu/doclib/press/index.cfm?id=918)
In more concrete terms, the goal will be to eliminate duties and other restrictions for trade in goods. Freeing
up commercial services, providing the highest possible protection, certainty and level playing field for
European investors in the US, and increasing access to American public procurement markets are also
objectives. Removing unnecessary regulatory constraints on trade is a key issue for the EU, as are obtaining
stronger protection of European Geographical Indications, facilitating customs formalities and addressing
competition rules.
Main source: http://ec.europa.eu/trade/policy/in-focus/ttip/about-ttip/

28
29
Chapter Three: Measuring and summarizing NTBs
Protection indicators should fulfil certain requirements and constraints: ideally, they ought to be
comprehensible, transparent and capable of straightforward interpretation. Operationally, any
measures of protection should meet the following requirements:
1. they should be able to indicate if a protectionist policy exists,
2. they should be able to rank different policies according to their degree of
restrictiveness
3. they should guarantee a consistent scaling of all degrees of restrictiveness.
There are two fundamental obstacles to constructing summary statistics of the overall level of
trade restrictions in an economy. On the one hand, in order to summarize different policy
instruments they must be expressed in a common metric: this is the conversion problem.
On the other hand, the level of trade restriction in each industry must be appropriately weighted:
this is the index number problem.
NTBs are well known to be pervasive, difficult to quantify and politically sensitive (Dee and
Ferrantino, 2005). They are pervasive because regulations designed to address legitimate market
failures may have incidental but unwarranted effects on trade. They are difficult to quantify since
they are not published in tariff schedules and are not expressed in simple ‘metrics’ such as
percentage or monetary values. Finally, they are politically sensitive because measures that are
difficult to quantify may also be less transparent which helps to avoid public discussion. When
such measures do receive public attention, their direct impact on trade may be less clear to the
public than easily quantified measures such as tariffs.
3.1 Measurement problem
3.1.1 Inventory methods
The frequency index accounts only for the presence or absence of an NTM and summarizes the
percentage of products to which one or more NTMs are applied. In more formal terms, the
frequency index of NTMs imposed by country j is calculated as:
30
where D is a dummy variable reflecting the presence of one or more NTMs and M indicates
whether there are imports of good i (also a dummy variable). Note that frequency indices do not
reflect the relative value of the affected products and thus cannot give any indication of the
importance of the NTMs to overall imports (UNCTAD,2013).
Inventories of NTMs represent valuable information that could, if updated on a regular basis, help
keep track of the evolution of the relative incidence of different types of NTMs on trade flows of
goods and of the evolution of their incidence relative to tariffs. Another obvious advantage is that
information can be very NTM-specific and highly disaggregated at the product level. On the other
hand, these indicators have limitations in that they do not give any direct information about
possible impact on price and quantities produced, consumed or traded ( UNCTAD, 2013).
In other terms, this index is based on the direct observation of the policy instruments. It measures
the existence of regulations without considering their impact as trade barriers. It provides a sort of
‘self-contained’ assessment of the policies under consideration since it ignores any effects of these
policies on specific markets (economies). The frequency of the various types of NTBs appears to
be far from satisfactory but it should be recalled that more sophisticated indexes use
data/informations that are different from the policies under consideration and policy-makers do
not want compliance to be influenced by events that are out of their control.
3.1.2 Price wedges
First, it is necessary to identify the appropriate prices to use and this is likely to be problematic.
While it is fairly easy to obtain information on the price paid by the importers of a good, it might
become difficult to obtain the corresponding price prevailing in the domestic market especially at
a fairly disaggregated level. This becomes even more difficult if data collection has to be done for
a large set of countries. Other drawbacks are: the price comparison implicitly assumes perfect
substitution between imported and domestic goods and the price differential does not convey
information about how the NTM operates in practice (Beghin and Bureau, 2001). Another factor is
that the comparison is made in the presence of the NTM distortion (and not by comparison to a
benchmark case without distortion; see Deardoff and Stern, 1997). (Fugazza, 2013)
This enables the easy computation of so-called ad valorem equivalents.
3.1.3 Tariff equivalents
Serious conceptual and data problems are likely to arise in the estimation and interpretation of
tariffs equivalents. Since they are not only based on observed data (as for outcome measures), they
31
require some maintained assumptions in terms of model or methodology.
In principle, the effects of NTBs may be quantified by estimating the tariff that would produce the
same overall impact. The problem is that the impacts of NTBs are multidimensional and there is
no measure that gives an equivalence in all dimensions. An equivalence criterion must be
established and the effects of NTBs quantified with respect to the dimension we are interested in.
In this perspective, there is a growing literature using econometric models to estimate changes in
prices, trade flows and economic performances due to the introduction of an NTB.
According to Ferrantino (2006), a broad distinction can be made between price-based and
quantity-based models: price-based models look for evidence that NTBs cause the domestic pric
of certain goods to be higher than it otherwise would be whereas quantity-base models look for
evidence that NTBs cause trade in certain goods to be smaller than it otherwise would be. Price-
based methods aim to identify the extent to which higher domestic prices may be attributable to
NTBs and correct other factors that may influence prices but are not due to NTBs. In order to
explain the systematic reasons for international price differences more carefully, many models
exploit the socalled Balassa–Samuelson effect which explains the higher absolute price level in
rich countries with the higher levels of productivity in tradables relative to non-tradables.
Price-based models
Price equivalents are often used to quantify the impact of sanitary and phytosanitary (SPS)
regulations and other technical barriers to trade (TBT) on market equilibrium and trade (see, for
example, Calvin and Krissoff, 1998). Calvin and Krissoff provide a tariff equivalent of
phytosanitary barriers in the Japanese apple market regarding the risk of contamination by fire
blight. They use the law of one price under a homogeneous commodity assumption (arbitrage
condition) to calculate the tariff equivalent of SPS barriers affecting apple imports in Japan to
avoid damages from fire blight. Yue et al. (2006) derive a revamped tariffequivalent estimate of a
TBT by relaxing the homogeneous commodity assumption and accounting explicitly for
commodity heterogeneity and perceived quality of substitutes and trade costs.
Econometric methods attempt to incorporate the intuition behind the price-gap method and extend
it to many countries and products simultaneously. They take advantage of systematic reasons
prices are higher in some countries than others to identify the extent to which high prices for some
countries and products may be attributable to NTMs. Because these methods are capable of
handling larger quantities of data than the “handicraft” price-gap method, they offer the promise
of being able to compare the effects of NTMs more broadly, in order to identify which categories
of goods they are most applicable to, using a common method for all countries and products. Their
32
results can also be expressed as ad valorem tariff equivalents and used in simulation models. Price
data is not always readily available for all products and countries of interest. Because a common
method is used for all products and countries, a good deal of product- and policy-specific detail
must be set aside. Thus, results for specific cases may diverge widely from those which would
have been obtained using a case-by-case analysis. Choices about the econometric specification
may influence the results obtained. (Farrantino, 2006)
Quantity-based models
The other approach for measuring NTBs is to model the determination of quantity rather than
price and then include an index of trade restrictiveness in a quantity equation. Quantity-impact
measures focus on changes in the volume of imports and domestic production caused by various
non-tariff policies. As for price comparison measures, it is hard to obtain appropriate data to
compute the exact quantitative impact of an NTB.
These methods look for evidence that the presence of NTMs leads to lower trade flows, or that the
presence of tradefacilitating policies or practices leads to higher trade flows. Statistical analysis of
trade data is employed, mostly based on gravity models (see Appendix 1) emphasizing the
demand side, focusing on country size and economic distance between countries as factors
explaining trade, or the supply side focusing on different availability of resources or tecnologies in
different countries). Trade data on quantities are much more abundant and more internationally
standardized than price data, so that in principle all products in all countries can be analyzed.
Recent advances in methods offer hope for future progress. The effect on trade flows may be of
more direct interes to policymakers than the effect on prices. The general limitations of
econometric work (using common methods may ignore product-specific information, choices
about econometric specification may affect results) apply to both pricebased and quantity-based
methods and may be more severe for quantity-based methods. Results from quantity-based
methods can only be expressed as tariff equivalents or price gaps by use of additional assumptions
and information (Farrantino, 2006).
Quantity impact calculations can also provide precise information about the effect of NTMs on
trade. However, similarly to the price comparison approach, it may be challenging to obtain
appropriate data to compute the exact impact. An advantage of quantitybased indicators is that a
general approach to the measurement of the quantity effects of NTMs can be undertaken, leading
to the possibility of systematic and repeated estimation. Such an approach could ideally (with a
sufficiently large dataset) include all categories of NTMs and thus isolate the individual impact of
each. Quantity estimates associated with information about, import demand elasticities can then be
33
used to derive price effect estimates and thus the computation of ad valorem estimates. This is the
methodology followed in Kee, Nicita and Olarreaga (2009). UNCTAD (2013).
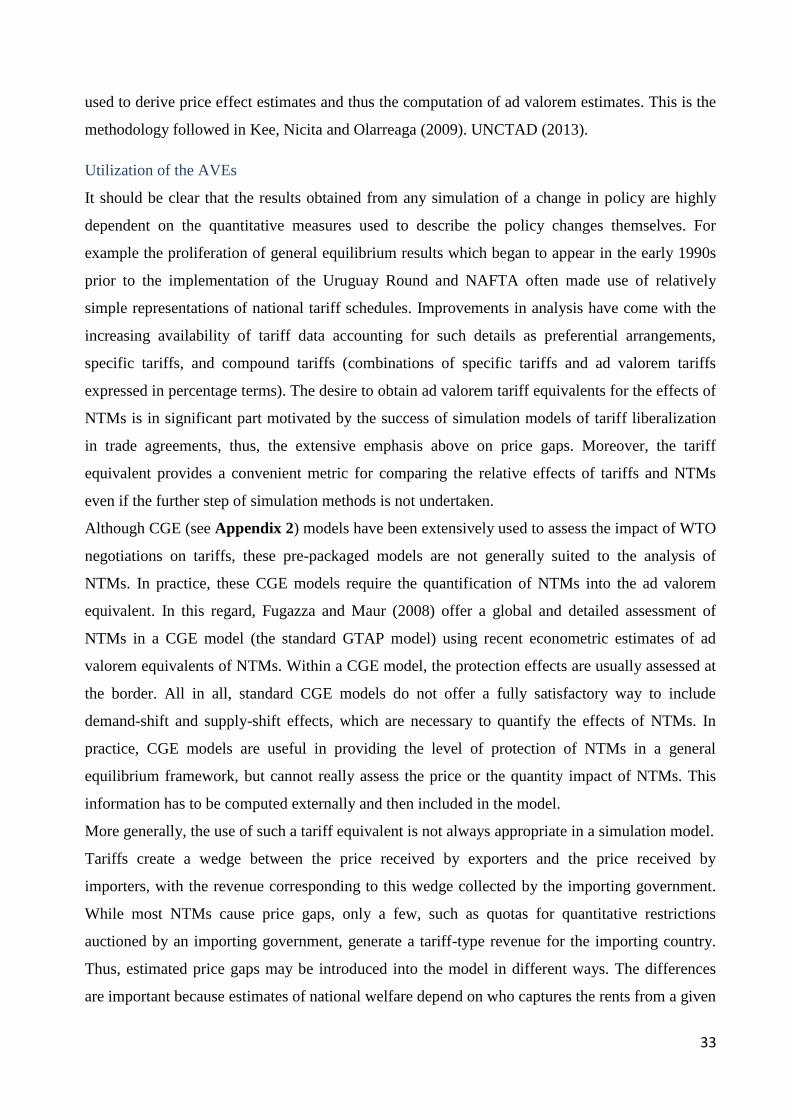
Utilization of the AVEs
It should be clear that the results obtained from any simulation of a change in policy are highly
dependent on the quantitative measures used to describe the policy changes themselves. For
example the proliferation of general equilibrium results which began to appear in the early 1990s
prior to the implementation of the Uruguay Round and NAFTA often made use of relatively
simple representations of national tariff schedules. Improvements in analysis have come with the
increasing availability of tariff data accounting for such details as preferential arrangements,
specific tariffs, and compound tariffs (combinations of specific tariffs and ad valorem tariffs
expressed in percentage terms). The desire to obtain ad valorem tariff equivalents for the effects of
NTMs is in significant part motivated by the success of simulation models of tariff liberalization
in trade agreements, thus, the extensive emphasis above on price gaps. Moreover, the tariff
equivalent provides a convenient metric for comparing the relative effects of tariffs and NTMs
even if the further step of simulation methods is not undertaken.
Although CGE (see Appendix 2) models have been extensively used to assess the impact of WTO
negotiations on tariffs, these pre-packaged models are not generally suited to the analysis of
NTMs. In practice, these CGE models require the quantification of NTMs into the ad valorem
equivalent. In this regard, Fugazza and Maur (2008) offer a global and detailed assessment of
NTMs in a CGE model (the standard GTAP model) using recent econometric estimates of ad
valorem equivalents of NTMs. Within a CGE model, the protection effects are usually assessed at
the border. All in all, standard CGE models do not offer a fully satisfactory way to include
demand-shift and supply-shift effects, which are necessary to quantify the effects of NTMs. In
practice, CGE models are useful in providing the level of protection of NTMs in a general
equilibrium framework, but cannot really assess the price or the quantity impact of NTMs. This
information has to be computed externally and then included in the model.
More generally, the use of such a tariff equivalent is not always appropriate in a simulation model.
Tariffs create a wedge between the price received by exporters and the price received by
importers, with the revenue corresponding to this wedge collected by the importing government.
While most NTMs cause price gaps, only a few, such as quotas for quantitative restrictions
auctioned by an importing government, generate a tariff-type revenue for the importing country.
Thus, estimated price gaps may be introduced into the model in different ways. The differences
are important because estimates of national welfare depend on who captures the rents from a given
34
policy, which in turn depends on how the policy is administered (Ferrantino, 2006).
Finally, it is worth mentioning that of the existing CGE analysis remains essentially
static.Generally speaking, a dynamic set-up would allow the adjustment process going from the
original equilibrium to the post-policy reform one to be identified.
3.2 Aggregation problem
3.2.1 Simple averages
The frequency index accounts only for the presence or absence of an NTM and summarizes the
percentage of products to which one or more NTMs are applied. In more formal terms, the
frequency index of NTMs imposed by country j is calculated as:
where D is a dummy variable reflecting the presence of one or more NTMs and M indicates
whether there are imports of good i (also a dummy variable). Note that frequency indices do not
reflect the relative value of the affected products and thus cannot give any indication of the
importance of the NTMs to overall imports (UNCTAD,2013).
This index is based on the direct observation of the policy instruments. It measures the existence
of regulations without considering their impact as trade barriers. It provides a sort of ‘self-
contained’ assessment of the policies under consideration since it ignores any effects of these
policies on specific markets (economies). The frequency of the various types of NTBs appears to
be far from satisfactory but it should be recalled that more sophisticated indexes use
data/informations that are different from the policies under consideration and policy-makers do
not want compliance to be influenced by events that are out of their control.
3.2.2 Weighted averages
A measure of the importance of NTMs to overall imports is given by the coverage ratio which
measures the percentage of trade subject to NTMs for importing country j. In formal terms the
coverage ratio is given by:
where D is defined as before and V is the value of imports in product i. The immediate advantage
of using actual weights is the relative ease with which they can be collected.
Different ‘weights’ – such as trade, production or consumption shares, GDPs, etc. – could be used
in the aggregation process. This means that some economic effects of existing policies are taken

35
into account though these indexes remain ‘a-theoretic’ since they are not computed according to
‘equivalence criteria’ (e.g. welfare, volume of imports).
One drawback of the coverage ratio, or any other weighted average, arises from the likely
endogeneity of the weights (the fact that the level of imports may be dependent on the presence of
NTMs). This problem is best corrected by using weights fixed at trade levels that would arise in a
world free of NTMs (and tariffs). Otherwise, the coverage ratio would be systematically
underestimated. While one cannot get to that benchmark, it is possible to soften the endogeneity
problem (and test for the robustness of the results) by using trade values of past periods.
3.2.3 Equivalence measures
The equivalence measures provide results that are equivalent to the original data in terms of the
information we are interested in. The greatest advantage of this class of measures is that they are
unequivocal because their definition is predetermined. These indexes provide an assessment of
how far actual observations are from other hypothetical equilibria. As a result, explicit model
structures and/or estimated parameters are needed for computation. The definition of an
equivalence criterion implies that the construction of an index will depend on the purpose of the
index itself.
The use of a counterfactual approach implies that the calculation of the index does not only rely
on observed data but requires the use of statistical or equilibrium models in order to assess what
would have happened after a policy change.
Some of the most widely used indicators to measure the effect of NTMs on trade are those
developed by Kee, Nicita and Olarreaga (2009) and implemented by the World Bank in its global
monitoring reports.
The indicators referred to are the overall trade restrictiveness index (OTRI) and market access
OTRI (MA-OTRI). These indicators provide the overall level of restrictiveness of the trade
policies imposed (OTRI) or faced (MA-OTRI) by a country and are based on the estimation of ad
valorem equivalents of NTMs. Trade policies specifically treated by these indicators are ad
valorem tariffs, specific duties and some NTMs, such as price control measures, quantitative
restrictions, anti-competitive measures and technical regulations.
Other measures, such as rules of origin and export related measures, are not included. Although
these indicators cannot disentangle the impact of each specific type of NTM, they can separate the
effect on overall restrictiveness due to traditional trade policies (tariffs and specific duties) from
that caused by NTMs. It is also important to note that because many NTMs are not protectionist in
intent (or effect), these indicators reflect net restrictiveness; they are not measures of the level of
36
protection that Governments seek for a domestic industry. A drawback of those indicators is that
their NTM component is based on obsolete data collected more than 10 years ago.8 Since the use
of NTMs has increased in the last 10 years, these indicators probably underrepresent the actual
impact of NTMs on trade. On the other hand, in the statistics presented below, tariff data is
updated (UNCTAD, 2013).
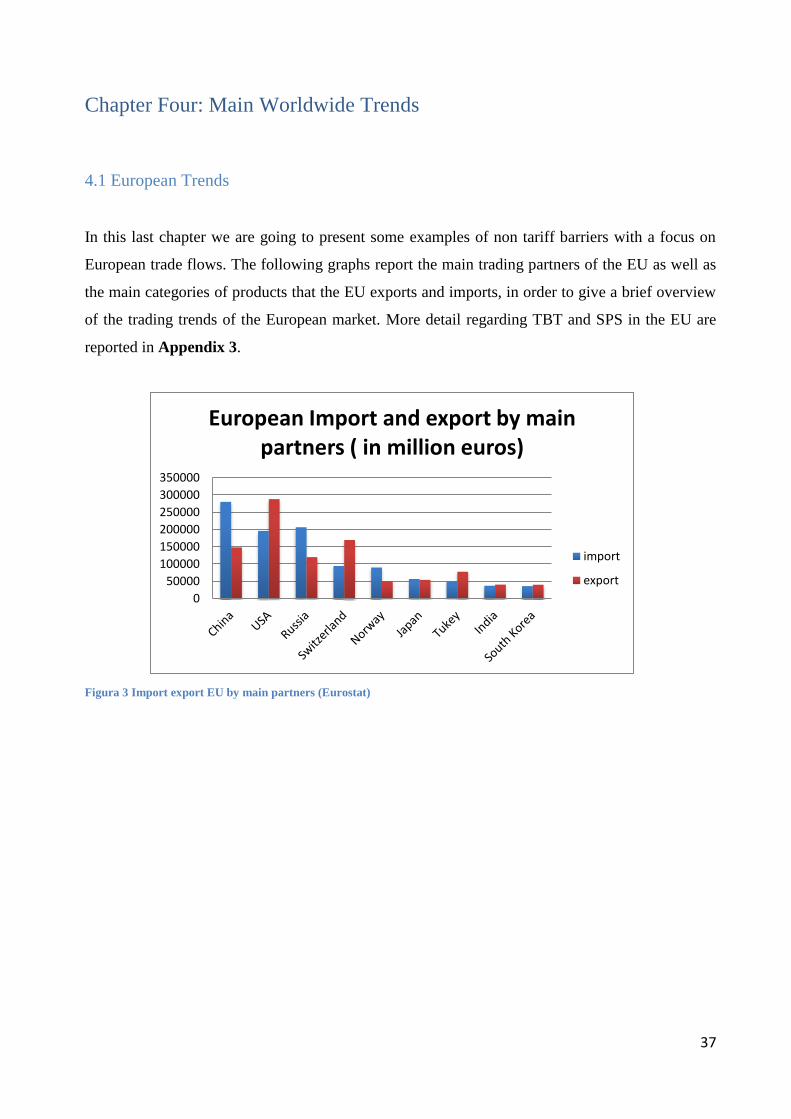
37
Chapter Four: Main Worldwide Trends
4.1 European Trends
In this last chapter we are going to present some examples of non tariff barriers with a focus on
European trade flows. The following graphs report the main trading partners of the EU as well as
the main categories of products that the EU exports and imports, in order to give a brief overview
of the trading trends of the European market. More detail regarding TBT and SPS in the EU are
reported in Appendix 3.
Figura 3 Import export EU by main partners (Eurostat)
0
50000
100000
150000
200000
250000
300000
350000
European Import and export by main partners ( in million euros)
import
export
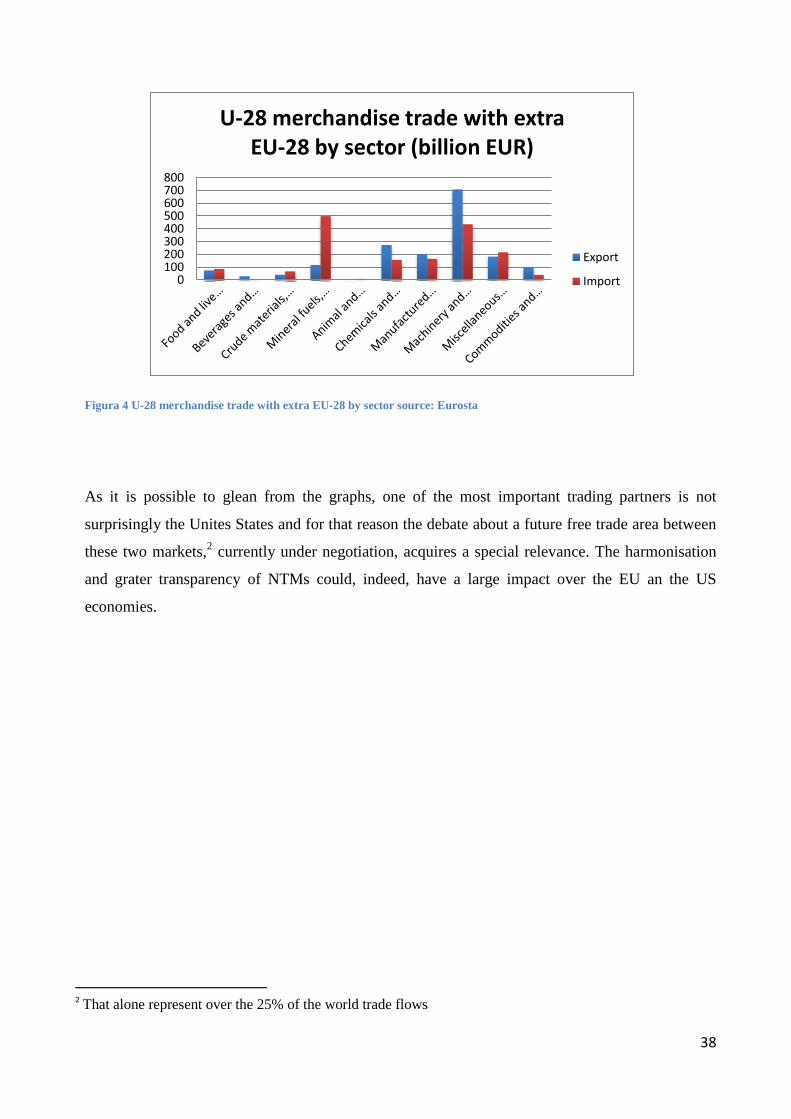
38
Figura 4 U-28 merchandise trade with extra EU-28 by sector source: Eurosta
As it is possible to glean from the graphs, one of the most important trading partners is not
surprisingly the Unites States and for that reason the debate about a future free trade area between
these two markets,2 currently under negotiation, acquires a special relevance. The harmonisation
and grater transparency of NTMs could, indeed, have a large impact over the EU an the US
economies.
2 That alone represent over the 25% of the world trade flows
0 100 200 300 400 500 600 700 800
U-28 merchandise trade with extra EU-28 by sector (billion EUR)
Export
Import
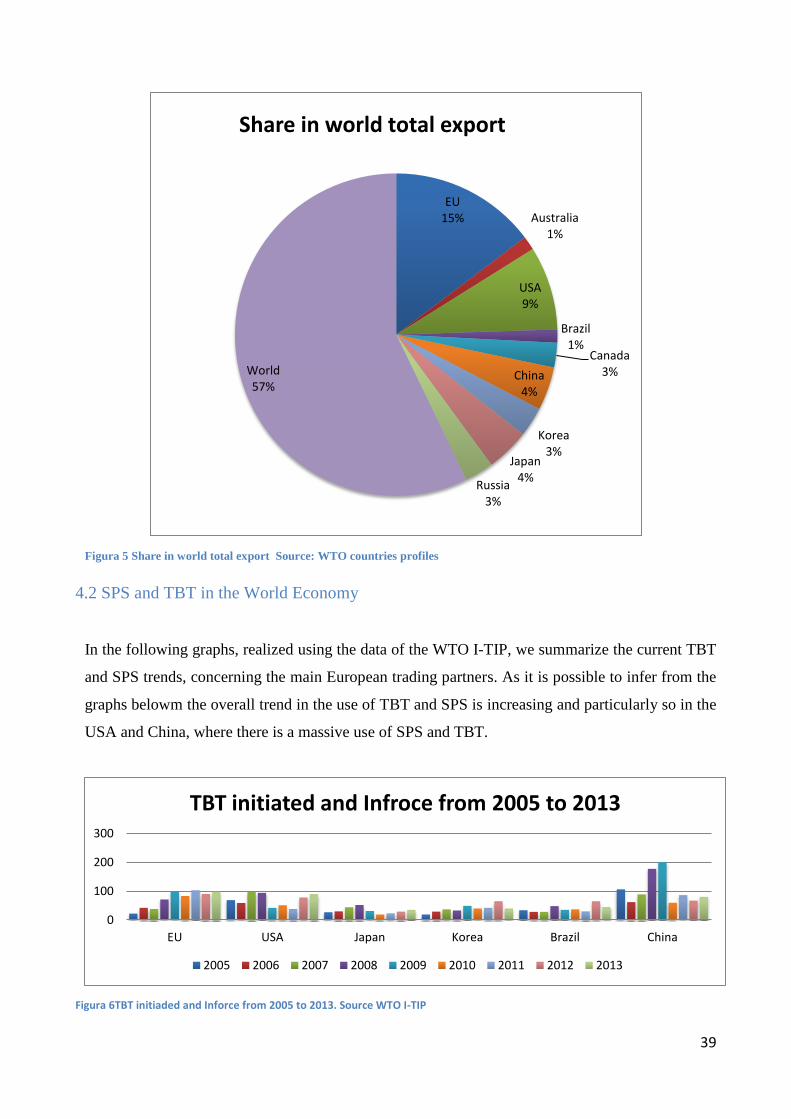
39
Figura 5 Share in world total export Source: WTO countries profiles
4.2 SPS and TBT in the World Economy
In the following graphs, realized using the data of the WTO I-TIP, we summarize the current TBT
and SPS trends, concerning the main European trading partners. As it is possible to infer from the
graphs belowm the overall trend in the use of TBT and SPS is increasing and particularly so in the
USA and China, where there is a massive use of SPS and TBT.
Figura 6TBT initiaded and Inforce from 2005 to 2013. Source WTO I-TIP
EU 15% Australia
1%
USA 9%
Brazil 1%
Canada 3% China
4%
Korea 3%
Japan 4%
Russia 3%
World 57%
Share in world total export
0
100
200
300
EU USA Japan Korea Brazil China
TBT initiated and Infroce from 2005 to 2013
2005 2006 2007 2008 2009 2010 2011 2012 2013
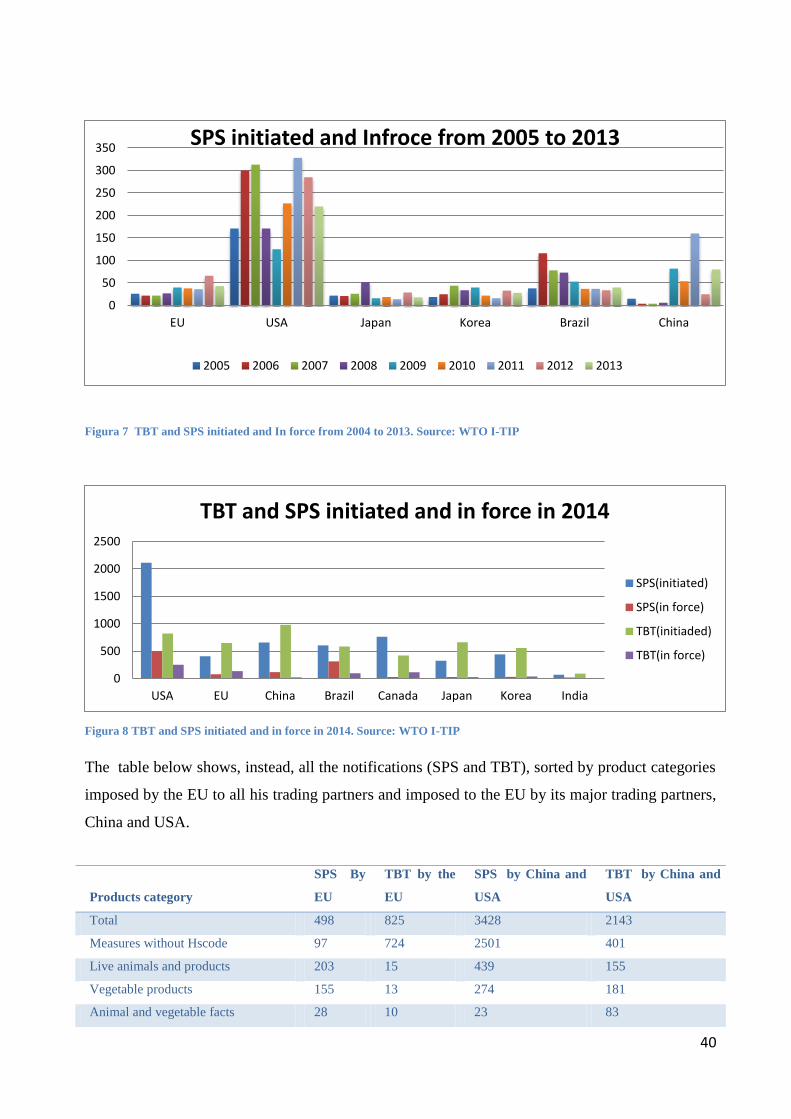
40
Figura 7 TBT and SPS initiated and In force from 2004 to 2013. Source: WTO I-TIP
Figura 8 TBT and SPS initiated and in force in 2014. Source: WTO I-TIP
The table below shows, instead, all the notifications (SPS and TBT), sorted by product categories
imposed by the EU to all his trading partners and imposed to the EU by its major trading partners,
China and USA.
0
50
100
150
200
250
300
350
EU USA Japan Korea Brazil China
SPS initiated and Infroce from 2005 to 2013
2005 2006 2007 2008 2009 2010 2011 2012 2013
0
500
1000
1500
2000
2500
USA EU China Brazil Canada Japan Korea India
TBT and SPS initiated and in force in 2014
SPS(initiated)
SPS(in force)
TBT(initiaded)
TBT(in force)
Products category
SPS By
EU
TBT by the
EU
SPS by China and
USA
TBT by China and
USA
Total 498 825 3428 2143
Measures without Hscode 97 724 2501 401
Live animals and products 203 15 439 155
Vegetable products 155 13 274 181
Animal and vegetable facts 28 10 23 83
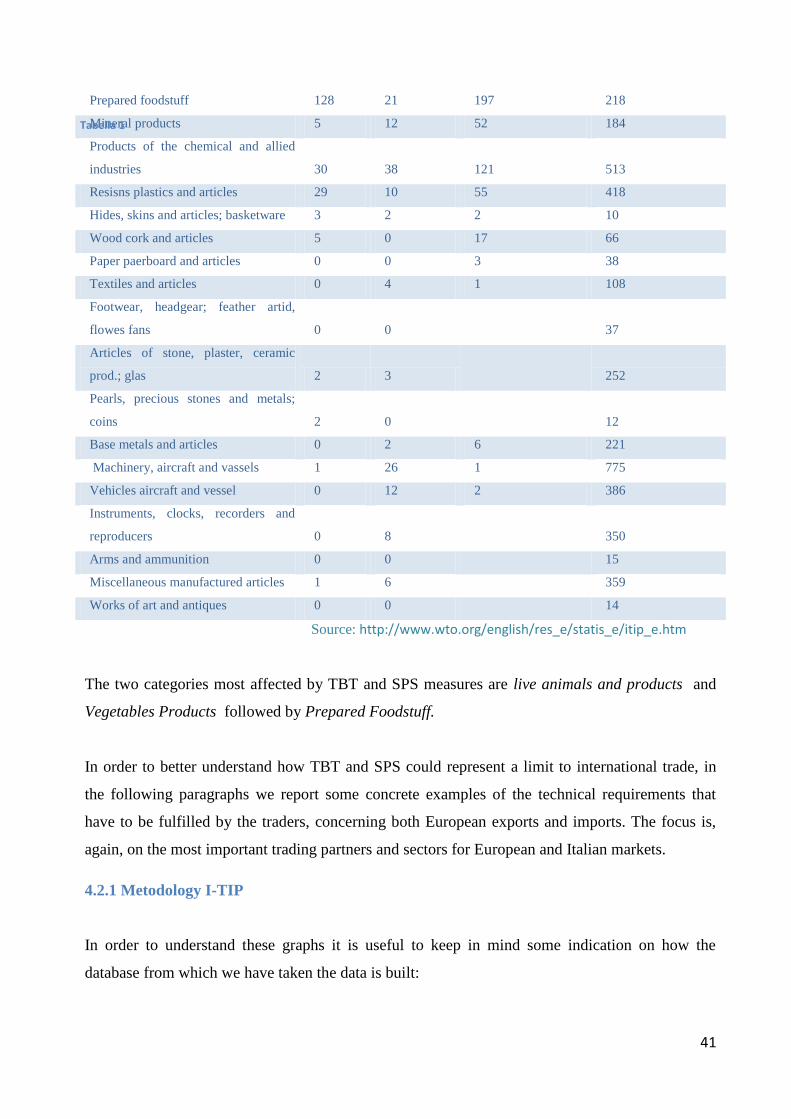
41
Source: http://www.wto.org/english/res_e/statis_e/itip_e.htm
The two categories most affected by TBT and SPS measures are live animals and products and
Vegetables Products followed by Prepared Foodstuff.
In order to better understand how TBT and SPS could represent a limit to international trade, in
the following paragraphs we report some concrete examples of the technical requirements that
have to be fulfilled by the traders, concerning both European exports and imports. The focus is,
again, on the most important trading partners and sectors for European and Italian markets.
4.2.1 Metodology I-TIP
In order to understand these graphs it is useful to keep in mind some indication on how the
database from which we have taken the data is built:
Prepared foodstuff 128 21 197 218
Mineral products 5 12 52 184
Products of the chemical and allied
industries 30 38 121 513
Resisns plastics and articles 29 10 55 418
Hides, skins and articles; basketware 3 2 2 10
Wood cork and articles 5 0 17 66
Paper paerboard and articles 0 0 3 38
Textiles and articles 0 4 1 108
Footwear, headgear; feather artid,
flowes fans 0 0
37
Articles of stone, plaster, ceramic
prod.; glas 2 3
252
Pearls, precious stones and metals;
coins 2 0
12
Base metals and articles 0 2 6 221
Machinery, aircraft and vassels 1 26 1 775
Vehicles aircraft and vessel 0 12 2 386
Instruments, clocks, recorders and
reproducers 0 8
350
Arms and ammunition 0 0
15
Miscellaneous manufactured articles 1 6
359
Works of art and antiques 0 0
14
Tabella 1
42
Inforce date: The date when the measure is put in force, in I-TIP, is well known for trade defence
measures (Antidumping, Countervailing, and Safeguards measures); in contrast, it may or may not
be notified for SPS and TBT. The measures in agriculture (SSG, TRQ, XS, AMS) are defined in
annual periods and here we use the start and the end of the year as in-force date and withdrawal
date, respectively.
Initiation date: The initiation date is the date when the measure in preparation is made known to
other WTO members; in SPS and TBT it is then the date when the measure is distributed to other
members through DOL. In AD, CV, and SG, the date of initiation of investigation is also the date
when the affected member is notified of initiation. In agricultural NTMs, initiation is not
applicable.
SPS data: Data have been sourced mainly from regular SPS notifications, as reflected in the SPS-
IMS online system. Specific Trade Concerns (STC) information (see following paragraphs) is
used as a complementary source of information.
TBT data: Data have been sourced from regular TBT notifications as reflected in the TBT-IMS,
(TBT Information Management System). The measures reflected in I-TIP are those notified under
Articles 10.6 and 10.7 of the TBT agreement.
43
Appendix 1. Gravity Model
The gravity model of trade is often used to estimate the value impact of NTMs. Gravity models are
estimated both on cross-section and panel data. Cross-section models have the advantage of a
much lower data requirement and an easier calculation of the price and quantity effects of NTMs.
Panel data models (or repeated cross sections) allow for a better identification strategy of the
effect of the implementation of NTMs.
In practice, if the data allows, a panel structure is preferable even if it may complicate the
empirical decomposition of variations in value into price and quantity variations. The standard
gravity estimation can be implemented at various degrees of aggregation. Normally the analysis is
conducted at the product level (e.g. HS six-digit classification) or at the industry level (e.g.
international standard industrial classification). The estimation is often restricted to a group of
countries for which detailed data is available (UNCTAD,2013) .
The gravity model of trade has also been used to estimate the value impact of NTMs. In a cross
section, a value impact is comparable to a quantity impact after some price normalization.
However, in terms of identification of the effect of the implementation of an NTM measure, a
panel structure is preferable even if it may complicate the empirical decomposition of variations in
value into price and quantity variations.
The standard gravity estimation is implemented at the product level or at the industry level. In the
former, estimation is in most cases product specific and often limited to a restricted sample of
countries (see, for example, Disdier and Marette (2010)). In the case of implementation at the
industry level, although the analysis could be exhaustive in terms of industry coverage it is usually
restricted to a limited number of countries (see, for example, Xiong and Beghin (2011)). Besides
data availability, empirical strategies must also account for computational constraints. A full
fledge gravity model run at the product level (for example, HS-6 digit) for a multiple-country
sample (more than 20 countries) for a period of 3 years or more may not be easily estimated,
especially when controlling for possible selection bias. (Fugazza, 2013)
Main Results:
One of the early and more discussed studies on the impact of SPS standards on trade is Otsuki et
al. (2001). These authors provide one of the first empirical analyses on the large impact of SPS
measures on developing countries exports. Using a gravity model framework, their analysis
investigates the impact of European Union regulations on aflatoxin (a naturally occurring

44
mycotoxin that frequently contaminates fruits and grains) on a few selected African export
products. Their findings indicate a quite important effect of the European Union regulation on
African exports of cereals, dried fruits and nuts. They quantify it as accounting for about 65 per
cent export loss. Since this paper, a number of other studies have investigated similar issues in
different countries and sectors using quantitative methods.
Wilson and Otsuki (2004) find that a 10 per cent increase in stringency of the MRL on
chlorpyrifos (an organophosphate insecticide) on bananas could lead to a 14 per cent decrease in
international trade of this good. Wilson et al. (2003) find that if MRLs of antibiotics on beef were
harmonized to the Codex Alimentarius standard, the rise in beef world exports would exceed 3
billion tons. More than twenty per cent of that rise would originate from South Africa, Brazil and
Argentina.
Still using data for the European Union, Chevassus-Lozza et al. (2008) find positive trade effects
of sanitary measures, and negative or insignificant impacts of phytosanitary and quality measures.
More specifically, their results suggest that for new member States (Bulgaria and Romania
excepted) sanitary measures do not act as a barrier to trade at entry to the European Union market
and even significantly stimulate traded volume for firms in those States fulfilling sanitary
requirements. As far as Bulgaria and Romania are concerned these measures still act as barriers to
trade. However, once the barrier has been overcome, the impact on traded volume is slightly
positive (Fugazza, UNCTAD, 2012)
45
Appendix 2. CGE models
Thanks to advances in computer and simulation technology, such as the Global Trade Analysis
Project (GTAP) (Hertel, 1997) and efforts to improve data collection and availability (trade
analysis and information system (TRAINS) being a leading example). Applied general
equilibrium (AGE) simulations of tariff reductions can now be carried out almost routinely.
General equilibrium modelling has played an important role in the WTO multilateral negotiations,
helping assess complex negotiation modalities and global interdependencies but also fuelling a
public debate on the direction and magnitude of estimates. The same cannot be said of NTMs.
The protection effect of NTMs is the most immediate candidate for assessment in a AGE model,
provided that the correct impact estimates are available. Protection effects are usually assessed at
the border. These border effects generate a wedge either between the world price and the domestic
price in the importing country or between the world price and the domestic price in the exporting
country. As discussed previously, protection effects also arise beyond (within) the border because
NTMs do not necessarily discriminate between domestic and imported goods. Tackling these
beyond-the-border effects would require a model including increasing returns to scale and export
specific costs. Moreover, the assessment of the other economic effects in an AGE context is much
more complex. Although it would be desirable to investigate how one can identify and separate
the cost and the welfare-enhancing dimension of NTMs, it is difficult to think of a methodology
that would allow this to be carried out in a systematic way. Detailed information is needed; it
would have to be provided by technical experts (Deardoff and Stern, 1997) and probably only for
specific products or a limited range of countries. All in all, standard AGE models do not offer
many ways to include demand-shift and supplyshift effects and none of them are fully satisfactory.
(Fugazza, 2013)
Main results
Andriamanajara et al. (2004) offer a large-scale study of impact of NTMs in an AGE model. They
include 14 product groups and 18 regions. This work first estimates global AVEs for NTMs, using
price data from Euromonitor and non-tariff barrier (NTB) coverage information from UNCTAD.
The price effects obtained are generally very large: up to 190 per cent in the wearing apparel
sector in Japan and the bovine meat sector in China. The estimate of the price incidence in
wearing apparel in the European Union is 60 per cent. The authors then use their AVEs to
simulate in GTAP the welfare effects of a removal of the selected NTMs. Global gains are
46
important (US$90 billion) arising mostly from liberalization in Japan and Europe and in the textile
and machinery sectors.
With the surging political interest in trade facilitation, several recent studies have attempted to
capture its potential benefits, using the sand in the wheels approach. Hertel et al. (2001) are the
first to introduce an efficiency-shock variable in GTAP to simulate the impact of lower non-tariff
trade costs such as customs clearance costs in the free trade agreement between Japan and
Singapore. Total expected welfare gains for the agreement are worth $US 9 billion annually, with
most of these accruing from the trade facilitation component.
Other important works such as Gasiorek et al. (1992) and Harrison et al. (1994) simulate the
effects of regulations harmonization in the European Union in the post Maastricht era. The former
adopt the sand in the wheel approach and assume that trade costs are reduced uniformly by 2.5 per
cent, allowing for the characterization of short run and long run equilibrium. The latter use a
similar framework, extended to endogenize the elasticity of substitution between domestic and
European
Union goods to account to some extent for the demand-shift effect mentioned previously. Results
in these two studies suggest that the impact of harmonization could reach 2.4 per cent of gross
domestic product (GDP).
In a country-focused but otherwise similar computational set-up, Chemingui and Dessus (2008)
assess the impact of NTBs in Syria. They introduce estimates of price effects of NTBs as regular
tariffs. AVEs of NTBs are obtained in their study using the price comparison approach. Welfare
gains could range between 0.4 and 4.8 per cent of GDP depending on whether or not dynamic
effects (associated with a technological catch-up with the rest of the world) are taken into
consideration.
Finally, Fugazza and Maur (2008) demonstrate the importance of modelling both the demand and
supply-shift effects of technical measures in policy analysis using AGE models. Most importantly
their simulation results underline substantial differences in effects, depending on whether AVEs
are introduced using shocks on import tariffs or on technological change. The sign of the welfare
impact can be reverted in more than 50 per cent of the cases (Fugazza, Unctad, 2012).
47
Appendix 3. Main Features regarding European Export
European Exports
In this section we report the main technical requirements concerning the European exports of agri
food in the USA market with a special focus on the export of Italian wine for the key role that it
represents for the Italian export.
An introduction for the agri food sector
The USA market continue to shows a deep interest for Italian agricultural and food products and it
represents the third market, after Germany and France, where Italy exports its agricultural and
food products. The main difficulty that Italy has to face in order to export to the USA market is
their different hygienical and sanitary approach. Furthermore it is worth to mention the fact that
the products that effectively come from Italy are not distinguished from the products that only
recall to an Italian sounding.
U.S. regulation of the agri-food sector
The rules on the food imports are managed by three different departments of the federal
government and the bureau linked to them:
(1) Department of Agriculture (USDA) – The departmentd responsable for the development and
the fulfilment of the federal politics regarding the livestock, the agriculture and food.
http://www.usda.gov.
It has several branches among which the Food Safety and Inspection Service (FSIS)
(http://www.fsis.usda.gov) and Animal and Plant Health Inspection Service (APHIS)
(http://www.aphis.usda.gov)
(2) The Department of Health and Human Services (HHS), which manages the protection U.S.
citizens health (http://www.hhs.gov).
It has several agencies among which the most important is the Food and Drug Administration
(FDA), an agency responsible for the regulation and the supervision of food safety, diet
supplement, drugs, vaccines and biological medical products. It is the most important body for the
export of foodstuff (http://www.fda.gov).
(3) Department of Homeland Security (DHS) (http://www.dhs.gov) the department delegated to
48
internal security. It is divided in bureaus including the Bureau of Custom and Border Protection
(CBP).
Main regulations
We report here just the most important regulations:
Federal Food, Drug, and Cosmetic Act (FD&C Act), in which are defined the main
requirement for wrap products together with the specific regulation of labeling. It is possible
to consult it at the following link (http://www.fda.gov/RegulatoryInformation/Legislation/)
The Fair Packaging and Labeling Act that regulate the food production under the US FDA
jurisdiction.
The Bio-Terrorism Act (BTA) that concerns also some question food import Food Allergen
Act, for the dispositions regarding all the allergic substances.
The Food Safety Modernization Act (FSMA), which establish the reference frame for the
modification of disposition on the sanitary control of the food products both domestic and
foreign, with a special regard to fruit and vegetables ones.
Code of Federal Regulations (CFR), in which are collected the provisions federal laws. The
Title 21 concerns the implementation of the FDA and it is possible to consult it on the FDA
website: http://www.accessdata.fda.gov/SCRIPTs/cdrh/cfdocs/cfcfr/CFRSearch.cfm
Labels
Concerning the label these are the main rules required for agri-food products in the USA.
Since 1992, under the Fair Packaging and Labelling Act, the United States requires that all the
labels for all the products must report the quantity both in the SI system and in the Anglo-Saxon
(inch / pounds) one. All items imported must bear the country of origin, which could be where the
product is effectively produced or where it was finally assembled. Semi-finished products must
indicate the country of origin on the packaging alone. Remember that food labels must contain, in
contrast to what happens in the European Union, a table containing all the nutritional properties
(fat content, protein, vitamin and calorie).
The box relative to the nutritional information must include the following details:
49
portion; Total calories; Calories from fat; Total fat; Saturated fat; cholesterol; sodium; Total
carbohydrate; Dietary fiber; sugars; proteins; and Vitamins
There are also specific rules that determine the size and position of the box with the nutritional
information.
http://aretusa.ice.it/GuidaAlMercato/GuidePaesi/400/Interscambio%20con%20l%27Italia.html
Alcoholic Beverages
The role of wine
With regard to our study we found particularly interesting the role of TBT and SPS in the agri-
food sector and we reported a short example of the impact of the technical requirement that
concern the import of wine in the USA
Concerning the agri-food and wine, a key role in the Italian export is represented by the sparkling
wine for which the USA are the most important import market with a share of more then the 18%
and a value of the quantity exported higher then 149 000 dollars. Also concerning the wine sector
the USA are a crucial market with a relative value, in 2012, of more then 1,1 million dollar ( for
both the generic and the quality one)3.
The export of alcoholic beverage in the USA has to follow a particular procedure that necessitates
an inspection over the requirements before the introduction of this kind of product in the USA
market.
First of all it is necessary that the importer, in order to obtain the license ( Basic Permit) has an
office with some employers inside the territory of the USA, otherwise the Italian firm can work
together with an American importer that already carries out this kind of activity. For alcoholic
beverage it is necessary to obtain the approval of the label by the TTB ( COLA or Certificate of
Label Approval). This way it is possible to be certain that the product complies with the federal
law.
Sometimes it is also necessary a preventive evaluation of the label (pre-COLA) that involves
controls regarding:
• the formulation
3 Source: http://www.ice.gov.it/
50
• the letter of pre import
• the findings of the analytical laboratory
• verification of the contents in sulphites
In the case of distillates products information could be required on the type of agricultural
producct used in the distillation process. The following aspects are examined:
• the fairness of the tax classification
• the production process so that it follows the federal provisions, and so that:
• banned substances are not used
• all the ingredients used in the production respect any restriction required
• It is reported the presence of sulfites if it is over the value of 10 mg / L.
In the case of the European Union there is an MRA over the correct usage of the ecological
practices for alcoholic beverages that have viticulture origin with an alcohol presence in a range
between 0.5% and 22%. In this case it is not necessary that the TTB verify the production
process.
A different situation subsists for spirit beverage for which, when there are added colorant,
aromatic substances or other additives, it is required a communication of the formulation of the
product in order to verify the compliance with the federal law.
In order to know the specific procedures that the exporter of wine has to follow it is possible to
consult the following website: http://www.ttb.gov/forms/f510031.pdf and the module for the
registration of the label available online on the following website:
http://www.ttb.gov/forms/f510031.pdf
Alcoholic beverage could be imported only from American operators that have special licenses
issued by the TTB. Furthermore the product are subject both federal taxation and the taxation that
could be different from state to state.
European imports
On the side of the European imports, it is briefly reported a case in which the U.S. express its
concern regarding the new European framework legislation for quality schemes in agriculture, EU
No. 1151/2012, that became effective in January 2013.
51
The quality schemes prescribe (1) “certification” procedures, in which detailed specifications are
checked periodically by an ad hoc body and (2) “labeling” systems to communicate information
about product quality to consumers. The United States is concerned with an aspect of the
legislation that creates a new framework for the development and protection of optional “quality
terms.” For example, it creates and protects the term “mountain product.” The United States is
concerned that the legislation incorporates commonly used terms into the EU’s quality schemes
and subjects them to registration requirements. For that reason the U.S is worried that, as a result,
the legislation will negatively affect U.S. producers’ ability to export and market their products in
the European Union (U.S. & Foreign Commercial Service And U.S. Department Of State,2013).
Appendix 4. Databases
Integrated Trade Intelligence Portal (I-TIP)
http://www.wto.org/english/res_e/statis_e/itip_e.htmI
The Integrated Trade Intelligence Portal (I-TIP) provides a single entry point for information
compiled by the WTO on trade policy measures. Containing information on over 25,000
measures, I-TIP covers both tariff and non-tariff measures affecting trade in goods as well as
information on trade in services, regional trade agreements and the accession commitments of
WTO members. Its aim is to serve the needs of those seeking detailed information on trade policy
measures as well as those looking for summary information.
Trade Monitoring Database
http://tmdb.wto.org/
The WTO launched on 3 May 2013 a new Trade Monitoring Database (TMDB), which provides
detailed information on trade measures implemented by WTO members and observers since
October 2008. The database can be accessed through the WTO website. The trade policy data is
taken from the regular trade monitoring reports prepared by the WTO Secretariat. All information
52
is submitted to the relevant WTO member for confirmation; if not confirmed, this is clearly
indicated within the database.
The database will be updated each time a new trade monitoring report has been discussed by WTO
members. The most recent update was completed on 15 October 2012. The next is expected at the
end of July 2013.
The information contained within the database can be displayed in a number of ways, including by
implementing country, by country affected by the measure, by type of measure, and by products
affected (http://www.wto.org/english/news_e/news13_e/tpr_03may13_e.htm)
NTM official data
http://www.intracen.org/itc/market-info-tools/non-tariff-measures/official-data/
The official NTM data collection involves a careful review and classification of legal documents
issued by a government, such as laws, decrees and directives, and identifying individual measures
that can affect trade.
The collection of official NTM data is done jointly by ITC, UNCTAD and the World Bank. The
data collected is harmonized using the NTM nomenclature system, prepared under a multi-agency
framework, and saved with other vital information such as affected products, partner country,
period of validity and the agency in charge of the regulation. All final data are validated by
national authorities. This strategy ensures that all official laws and directives are recorded,
including those that are not notified by the governments to the WTO.
World Bank Temporary Trade Barriers Database (TTBD)
The World Bank’s Trade Barriers Database (TTBD) website website4 hosts detailed and freely
available data on more than 30 different national governments’ use of anti-dumping and
countervailing duties since 1980 and of global safeguards since 1995 as well as on China’s use of
its specific transitional safeguard. The Global Anti-Dumping Database, developed by Chad Bown,
with funding from the World Bank, uses original national government documentation to organize
4
http://econ.worldbank.org/WBSITE/EXTERNAL/EXTDEC/EXTRESEARCH/EXTPROGRAMS/EXTTRADERESEA
RCH/0,,contentMDK:22561572~pagePK:64168182~piPK:64168060~theSitePK:544849,00.html
53
information on affected countries, product category (at the HS8 level), type of measure, date of
initiation, final imposition of duties, and revocation dates, and even information on the companies
involved.
The TTBD website also hosts a public database with information on WTO disputes developed by
Henrik Horn and Petros Mavroidis. It contains information on all stages of WTO dispute
settlement proceedings (e.g. panel reports, appeals, compliance panel reports) for all WTO
disputes up to 11 August 2011.
UNCTAD TRAINS
http://www.unctad.info/en/Trade-Analysis-Branch/Key-Areas/TRAINSWITS/
The most complete collection of publicly available information on non-tariff measures is the
Trade Analysis and Information System (TRAINS) developed by the United Nations Conference
on Trade and Development (UNCTAD). UNCTAD started collecting NTM information in 1994
and simultaneously developed the TRAINS database. TRAINS provides information on trade,
tariffs and NTMs by Harmonized System (HS) tariff line. NTMs were classified according to a
customized Coding System of Trade Control Measures, which distinguished six core categories of
NTMs. The database includes between one and seven years of NTM information for 86 countries
over the period 1992 to 2010. For some countries/years, in particular after 2001, data were
collected only for a sub-set of NTM categories. Various sources were used to provide data,
including, where available, WTO sources such as notifications. Overall, the coverage is patchy,
resulting in blank cells which are difficult to interpret. They can mean missing data or indicate that
a particular NTM is not applied to a particular tariff line.
In the early 2000s, it became clear that the TRAINS database required substantial improvement
and that the Coding System needed an update to reflect new practices. In 2005, the Secretary
General of UNCTAD launched a project aimed at revamping the definition, classification,
collection and quantification of nontariff measures. Under the guidance of a Group of Eminent
Persons, a multi-agency team composed of experts from all international agencies active in th
NTM area started working on the project. In 2009, the multi-agency team proposed an updated
and modified version of the old Coding System including 16 categories which brought the
classification closer to the regulatory framework. A pilot project on the collection and
quantification of NTMs was carried out by UNCTAD and the International Trade Centre (ITC),
with a view to testing the new classification. With the support of two UN regional commissions,
54
UNCTAD and ITC collected NTM information in seven developing countries. Based on the
lessons learned in the pilot project, the updated NTM classification was finalized and adopted.
The updated classification also introduced the concept of “procedural obstacles”, defined as
“issues related to the process of application of an NTM, rather than to the measure itself” (United
Nations Conference on Trade and Development (UNCTAD), 2010: xvii). An initial list of
procedural obstacles was established and tested in a series of interviews with exporting companies
carried out as part of the pilot project (see the discussion of business surveys below).
OECD product market regulation
The OECD Economics Department has developed a database consisting of indicators of product
market regulation for member states. The aim is to turn qualitative data on laws and regulations
that may affect competition into quantitative indicators. The indicators mostly measure regulations
that are potentially anticompetitive in areas where competition is viable. With the exception of the
foreign direct investment (FDI) restrictiveness index, they do not distinguish between
discriminatory and non-discriminatory measures. The main source of information used for this
database is official government responses to the OECD Regulatory Indicators Questionnaire, with
only a small fraction of information being drawn from external datasets, thereby guaranteeing a
high level of comparability across countries. The indicators are subject to peer review by the
national administrations of OECD member countries.
ITC business surveys
Since the end of the pilot project in 2009, the ITC has carried out large scale company surveys on
non-tariff measures in more than a dozen developing and least-developed countries in all the
continents. The surveys cover at least 90 per cent of the total export value of each participating
country (excluding minerals and arms). The economy is divided into 13 sectors, and all sectors
accounting for more than 2 per cent of total exports are included in the survey. Both exporting and
importing companies are covered. The survey methodology involves a two-step approach.
In the first step, companies that experience burdensome non-tariff measures are identified through
phone conversations with all the companies in the sample. The second step then consists of face-
to-face interviews with the companies that reported difficulties with NTMs in the phone
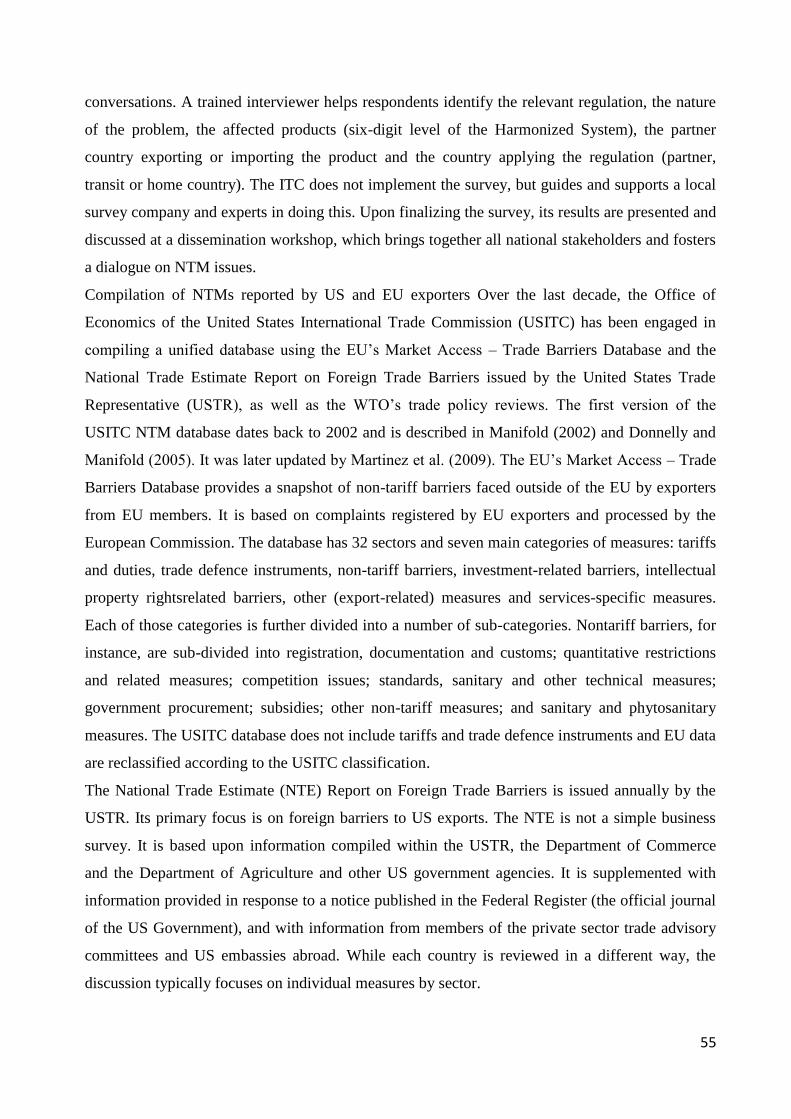
55
conversations. A trained interviewer helps respondents identify the relevant regulation, the nature
of the problem, the affected products (six-digit level of the Harmonized System), the partner
country exporting or importing the product and the country applying the regulation (partner,
transit or home country). The ITC does not implement the survey, but guides and supports a local
survey company and experts in doing this. Upon finalizing the survey, its results are presented and
discussed at a dissemination workshop, which brings together all national stakeholders and fosters
a dialogue on NTM issues.
Compilation of NTMs reported by US and EU exporters Over the last decade, the Office of
Economics of the United States International Trade Commission (USITC) has been engaged in
compiling a unified database using the EU’s Market Access – Trade Barriers Database and the
National Trade Estimate Report on Foreign Trade Barriers issued by the United States Trade
Representative (USTR), as well as the WTO’s trade policy reviews. The first version of the
USITC NTM database dates back to 2002 and is described in Manifold (2002) and Donnelly and
Manifold (2005). It was later updated by Martinez et al. (2009). The EU’s Market Access – Trade
Barriers Database provides a snapshot of non-tariff barriers faced outside of the EU by exporters
from EU members. It is based on complaints registered by EU exporters and processed by the
European Commission. The database has 32 sectors and seven main categories of measures: tariffs
and duties, trade defence instruments, non-tariff barriers, investment-related barriers, intellectual
property rightsrelated barriers, other (export-related) measures and services-specific measures.
Each of those categories is further divided into a number of sub-categories. Nontariff barriers, for
instance, are sub-divided into registration, documentation and customs; quantitative restrictions
and related measures; competition issues; standards, sanitary and other technical measures;
government procurement; subsidies; other non-tariff measures; and sanitary and phytosanitary
measures. The USITC database does not include tariffs and trade defence instruments and EU data
are reclassified according to the USITC classification.
The National Trade Estimate (NTE) Report on Foreign Trade Barriers is issued annually by the
USTR. Its primary focus is on foreign barriers to US exports. The NTE is not a simple business
survey. It is based upon information compiled within the USTR, the Department of Commerce
and the Department of Agriculture and other US government agencies. It is supplemented with
information provided in response to a notice published in the Federal Register (the official journal
of the US Government), and with information from members of the private sector trade advisory
committees and US embassies abroad. While each country is reviewed in a different way, the
discussion typically focuses on individual measures by sector.
56
In 2009, the Centre for Economic Policy Research (CEPR) teamed up with independent research
institutes from around the world to create the Global Trade Alert (GTA) initiative. Their objective
was to increase the information available on state measures that may affect trading partners’
commercial interests broadly defined as imports, exports, foreign investments (including
intellectual property), and foreign employees. CEPR believed that a combination of peer pressure
plus up-to-date, comprehensive information would help avoid the historic mistakes of
protectionism. In addition to tracking government measures taken during the current global
economic downturn, the GTA provides researchers and government officials with information on
new patterns of state intervention that are problematic. Regional nodes, a network of independent
research institutes and trade experts from all over the globe, are responsible for monitoring state
measures introduced in their own region (and elsewhere). The GTA initiative also encourages
third parties to submit measures for scrutiny, and welcomes dialogue with implementing
jurisdictions concerning the measures they have introduced. The Evaluation Group, consisting of
the leaders of the regional nodes and chaired by the representative of the network hub (CEPR), is
responsible for assessing this information and deciding whether to publish it on the GTA website.
The GTA does not confine itself to the measures that are covered by the existing body of WTO
agreements. Nor does the initiative pronounce on the WTO legality of a measure or whether a
measure is “protectionist”.
Perinorm
http://www.perinorm.com/home/default.aspx?ReturnUrl=%2fdefault.aspx
Perinorm is a bibliographic database dedicated to helping you with your standards and technical
regulations enquiries. It is the world's leading bibliographic database of national, European and
international standards from more than 200 standards publishing organizations in 23 countries,
with a total of more than 1,400,000 records.
Available in three languages both on DVD and online (English, French & German), Perinorm
comes with a monthly update. The quality of information is guaranteed by monthly delivery of
records direct from each standards publisher.
With powerful and flexible search features Perinorm allows you to quickly and easily make your
documentation queries and manage your international standards compliance. Perinorm is available
on annual subscription.

57
58
References
- Akhtar, S. I., & Jones, V. C. (2013). Proposed Transatlantic Trade and Investment Partnership
(TTIP): In Brief. Congressional Research Service. July, 23.
- Andriamananjara, S., Dean, J. M., Feinberg, R., Ferrantino, M. J., Ludema, R., & Tsigas, M.
(2004). The Effects of Non-Tariff Measures on Prices, Trade, and Welfare: CGE
Implementation of Policy-Based Price Comparisons. US International Trade Commission,
Office of Economics Working Paper, 4.
- Beghin, J., & Melatos, M. (2012). The Trade and Welfare Impacts of Australian Quarantine
Policies: The Case of Pigmeat. The World Economy, 35(8), 1006-1021.
- Berden, K. G., Francois, J., Thelle, M. M., & Tamminen, M. S. (2009). Non-Tariff Measures in
EU-US Trade and Investment–An Economic Analysis.
- Boughner, D. S., de Gorter, H., & Sheldon, I. M. (2000). The Economics of Two-Tier Tariff
Rate Import Quotas in Agriculture. Agricultural and Resource Economics Review, 29(1), 58-69.
- Bratt, M. (2014). Estimating the bilateral impact of non-tariff measures (NTMs)(No. 14011).
Département des Sciences Économiques, Université de Genève.
- Cadot & Jammes (2012). Aves In TRIST in Non-Tariff Measures – A Fresh Look At Trade
Policy’s New Frontier.
- Chemingui MA and Dessus S (2008). Assessing non-tariff barriers in Syria. Journal of Policy
Modeling. 30:917–928.
- Chevassus-Lozza, E., Latouche, K., Majkovič, D., & Unguru, M. (2008). The importance of
EU-15 borders for CEECs agri-food exports: The role of tariffs and non-tariff measures in the
pre-accession period. Food Policy, 33(6), 595-606.
- Cipollina, M., & Salvatici, L. (2008). Measuring protection: mission impossible?. Journal of
Economic Surveys, 22(3), 577-616.
- Clougherty, J.A. and M. Grajek (2008). The Impact of ISO 9000 Diffusion on Trade and FDI: A
New Institutional Analysis. Journal of International Business Studies , 39 (4), 613-633.
- Deardorff AV and Stern R (1997). Measurement of non-tariff barriers. Economics Department
Working
- DeMaria, F., & Drogue, S. (2013). EU trade regulation for baby food: protecting health or trade?
(No. 192807). Developing Countries In International Trade Studies (UNCTAD 2013)
- Disdier, A. C., Fontagné, L., & Mimouni, M. (2008). The impact of regulations on agricultural
trade: evidence from the SPS and TBT agreements. American Journal of Agricultural
Economics, 90(2), 336-350.
- Disdier, A. C., & Marette, S. (2010). The combination of gravity and welfare approaches for
59
evaluating nontariff measures. American Journal of Agricultural Economics, 92(3), 713-726.
- Elvestad, C., & Veggeland, F. (2005). International Trade and Guidelines on Equivalence and.
Norwegian Agricultural Economics Research Institute. ISO 690
- European Commission (2008). Preventing obstacles to trade in the internal market Directive
98/34/EC.
- European Commission (2013). Transatlantic Trade and Investment Partnership The Regulatory
Part.
- Ferrantino, M. (2006). Quantifying the Trade andEconomic Effects of Non-Tariff Measures.
OECD Trade Policy Papers, No. 28, OECD Publishing.http://dx.doi.org/10.1787/837654407568
- Ferro, E., Wilson, J. S., & Otsuki, T. (2013). The effect of product standards on agricultural
exports from developing countries.
- Francois, J., Berden, K., Tamminen, S., Thelle, M., & Wymenga, P. (2013). Non-Tariff
Measures in EU-US Trade and Investment: An Economic Analysis (No. 20090806). Institue for
International and Development Economics.
- Fugazza, M., & Maur, J. C. (2008). Non-tariff barriers in CGE models: How useful for policy?.
Journal of Policy Modeling, 30(3), 475-490.
- Fugazza, M. (2013). The Economics Behind Non-Tariff Measures: Theoretical Insights and
Empirical Evidence. UNCTAD Policy Issues in International Trade and Commodities Studies
Series, (57).
- Gasiorek M, Smith A and Venables AJ (1992). Trade and welfare – a general equilibrium
model. In: Winters LA, ed. Trade Flows and Trade Policy After ‘1992’. Cambridge University
Press. Cambridge: 35–66.
- Harrison GW, Tarr D and Rutherford TF (1994). Product standards, imperfect competition, and
the completion of the market in the European Union. World Bank policy research working paper
No. 1293.
- Hertel TW, ed. (1997). Global Trade Analysis: Modeling and Applications. Cambridge
University Press, Cambridge.
- Hillman, J. S. (1996). Nontariff agricultural trade barriers revisited. International Trade
Research Consortium.
- Horn, H., Mavroidis, P. C., & Sapir, A. (2009). Beyond the WTO? An Analysis of EU and US
Preferential Trade Agreements. CEPR Discussion Papers, (7317).
- Jaffee, S., & Henson, S. (2004). Standards and agro-food exports from developing countries:
rebalancing the debate (Vol. 3348). World Bank Publications.
- Johnson, R. (2014). Sanitary and Phytosanitary (SPS) and Related Non-Tariff Barriers to
Agrcultural Trade. Congressional Research Service
60
- Looi Kee, H., Nicita, A., & Olarreaga, M. (2009). Estimating Trade Restrictiveness
Indices*. The Economic Journal, 119(534), 172-199.
- Malouche, M., Reyes, J. D., & Fouad, A. (2013). Making Trade Policy More Transparent: A
New Database of Non-Tariff Measures. World Bank-Economic Premise, (128), 1-7.
- Melitz, M. J. (2005). When and how should infant industries be protected?.Journal of
International Economics, 66(1), 177-196.
- Meyer, N. et al. (2010). Bilateral and Regional Trade Agreements and Technical Barriers to
Trade: An African Perspective. OECD Trade Policy Working Papers, No. 96, OECD
Publishing. doi: 10.1787/5kmdbgfrgnbv-en OECD
- Munasib, A., & Roy, D. (2011). Nontariff Barriers as Bridge to Cross. In 2012 Conference,
August 18-24, 2012, Foz do Iguacu, Brazil (No. 125025). International Association of
Agricultural Economists. ISO 690
- Nicita, A., & Gourdon, J. (2012). A Preliminary Analysis on Newly Collected Data on Non-
Tariff Measures. In United Nations Conference on Trade and Development, Policy Issues in
International Trade and Commodities Study Series (No. 53).
- Nimenya, N., Ndimira, P. F., & de Frahan, B. H. (2012). Tariff equivalents of nontariff
measures: the case of European horticultural and fish imports from African
countries. Agricultural Economics, 43(6), 635-653.
- OECD (2005). Looking Beyond Tariff. The role Of Non-Tariff Barriers in the World Trade.
- Otsuki, T., Wilson, J. S., & Sewadeh, M. (2001). Saving two in a billion:: quantifying the trade
effect of European food safety standards on African exports. Food Policy, 26(5), 495-514.
- Peterson, E., Grant, J., Roberts, D., & Karov, V. (2013). Evaluating the Trade Restrictiveness of
Phytosanitary Measures on US Fresh Fruit and Vegetable Imports. American Journal of
Agricultural Economics, 95(4), 842-858.
- Piermartini, R. and Michele B. (2009). A mapping of regional rules on technical barriers to
trade. In A. Estevadeordal, K. Suominen and R. Tech, eds, Regional Rules in the Global Trading
System. Cambridge: Cambridge University Press.
- Shepherd, B., & Wilson, N. L. (2013). Product standards and developing country agricultural
exports: The case of the European Union. Food Policy, 42, 1-10.
- Swann, G. P. (2010). International Standards and Trade: A Review of the Empirical Literature.
OECD Trade Policy Working Papers, No. 97, OECD Publishing. doi: 10.1787/5kmdbg9xktwg-
en
- The Office of the United States Trade Representative(2013). 2013 Report On Technical Barrier
To Trade.
61
- UNCTAD (2013). Non-Tariff Measures to Trade: Economic and Policy Issues for Developing
Countries
- U.S. & Foreign Commercial Service And U.S. Department Of State (2013). Doing Business in
Italy: 2014 Country Commercial Guide for U.S. Companies
- Vade-mecum to directive 98/48/ec* which introduces a mechanism for the transparency of
regulations on information society services. EUROPEAN COMMISSION.
- Wieck, C., Schlüter, S. W., & Britz, W. (2012). Assessment of the Impact of Avian Influenza–
related Regulatory Policies on Poultry Meat Trade and Welfare. The World Economy, 35(8),
1037-1052.
- Wilson, J. S., & Otsuki, T. (2004). To spray or not to spray: pesticides, banana exports, and food
safety. Food Policy, 29(2), 131-146.
- Winchester, N., Rau, M. L., Goetz, C., Larue, B., Otsuki, T., Shutes, K., & Nunes de Faria, R.
(2012). The Impact of Regulatory Heterogeneity on Agri‐food Trade. The World Economy,
35(8), 973-993.
- World Trade Report 2012. Trade and Public Policies: A Closer Look at Non-Tariff Measures in
the 21st
Century.
- Xiong, B., & Beghin, J. C. (2011). Disentangling the demand-enhancing effect and trade-cost
effect of technical measures in agricultural trade among OECD countries. In 2011 Annual
Meeting, July 24-26, 2011, Pittsburgh, Pennsylvania. Agricultural and Applied Economics
Association.
- Yue, C., Beghin, J., & Jensen, H. H. (2006). Tariff equivalent of technical barriers to trade with
imperfect substitution and trade costs. American Journal of Agricultural Economics, 88(4), 947-
960.