non-toll budget r'million2012/132013/142014/152015/16 treasury allocation 9,728 10,341 10,961...
TRANSCRIPT
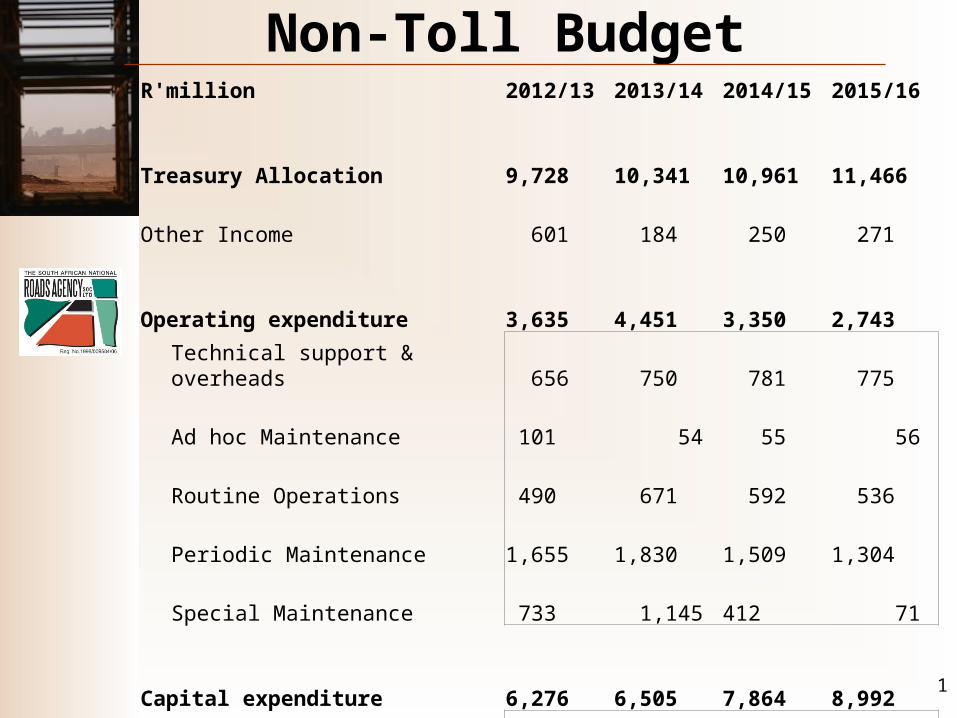
Non-Toll BudgetR'million 2012/13 2013/14 2014/15 2015/16
Treasury Allocation 9,728 10,341 10,961 11,466 Other Income 601 184 250 271
Operating expenditure 3,635 4,451 3,350 2,743Technical support & overheads 656 750 781 775Ad hoc Maintenance 101 54 55 56Routine Operations 490 671 592 536Periodic Maintenance 1,655 1,830 1,509 1,304Special Maintenance 733 1,145 412 71
Capital expenditure 6,276 6,505 7,864 8,992 Land acquisition & sundry 121 176 106 67Community Development 141 130 264 371Strengthening 3,375 3,225 3,366 2,684 Improvements 1,710 2,271 2,761 4,614New Facilities 929 702 1,364 1,257
Closing Balance 1 3 2 3
1

Toll BudgetR'million 2012/13 2013/14 2014/15 2015/16
Toll Income 3,690 3,341 4,839 5,392
Operating expenditure 2,424 2,304 2,010 1,719 Technical support & Admin 23 24 25 -
Ad hoc Maintenance 11 13 8
20
Routine Operations 2,179 1,953 1,832 1,655
Periodic Maintenance 169 301
145
44
Special Maintenance 42 13 300 -
Capital expenditure 2,236 1,785 1,620 2,669 Strengthening 168 126 538 680Improvements 991 743 527 1,614 New Facilities 1,077 916 555 375
Net Income (969) (748) 1,209 1,004 Finance charges (3,048) (3,167) (3,394) (3,755)(Operating cost)/Repayment of debt
(4,017)
(3,914)
(2,185)
(2,751)
2
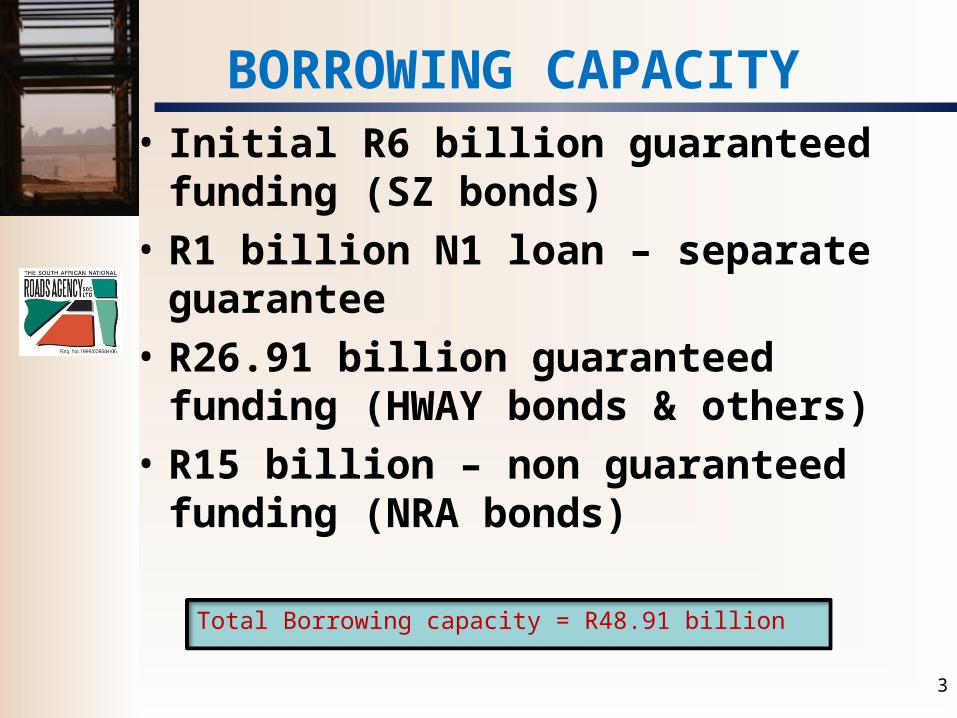
BORROWING CAPACITY• Initial R6 billion guaranteed funding
(SZ bonds)• R1 billion N1 loan – separate
guarantee• R26.91 billion guaranteed funding
(HWAY bonds & others) • R15 billion – non guaranteed funding
(NRA bonds)
Total Borrowing capacity = R48.91 billion
3

TOTAL DEBT
4Total Debt: R36.1 billion bonds + R4 billion loans (Oct 2013)
5
SOCIO-ECONOMIC DEVELOPMENT
ON SANRAL PROJECTS FOR
2012/13

6
BEE: PROJECT CONTRIBUTIONCOMMITMENT 2012/13
Total
R’million
CAPEX
R’million
RRM
R’million
Total value of Contracts awarded
9 895 8 290 1 605
Value of work to HD Ownership
2 311 2 166 145
Value of work to SMME’s (black owned)
2 051 837 1 214
Empowerment % 2012/13
44% 36% 85%
7
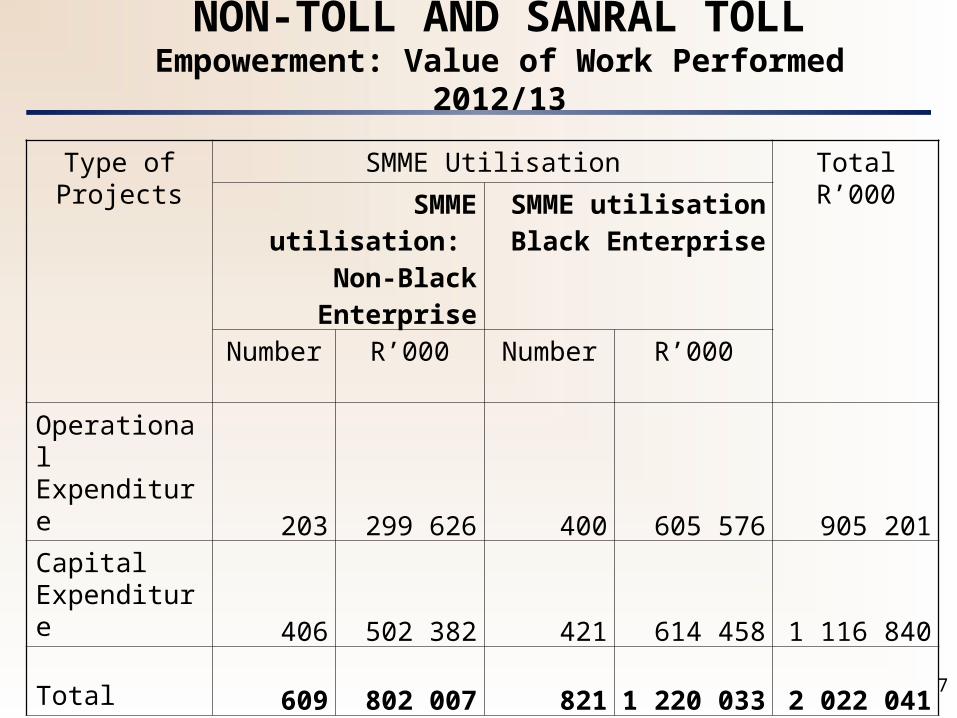
NON-TOLL AND SANRAL TOLLEmpowerment: Value of Work Performed
2012/13
Type of Projects
SMME Utilisation Total R’000
SMME utilisation: Non-Black Enterprise
SMME utilisation Black Enterprise
Number R’000 Number R’000
Operational Expenditure 203 299 626 400 605 576 905 201Capital Expenditure 406 502 382 421 614 458 1 116 840
Total 609 802 007 821 1 220 033 2 022 041

TRAINING NUMBERS : 2012/13
Type of Project Male Female Total Total Rand Value
Non-Toll Roads
Maintenance 3 249 1 372 4 620 5 923 953
Replacement and Improvement 3 545 1 503 5 048 10 238 737
SUB-TOTAL 6 794 2 875 9 668 16 162 690 SANRAL Toll Roads
Maintenance 801 191 992 395 877
Toll Operations 2 724 4 026 6 750 3 060 723
Improvement 591 160 751 1 561 104
SUB-TOTAL 4 116 4 377 8 493 5 017 704
TOTAL 10 910 7 252 18 161 21 180 3948
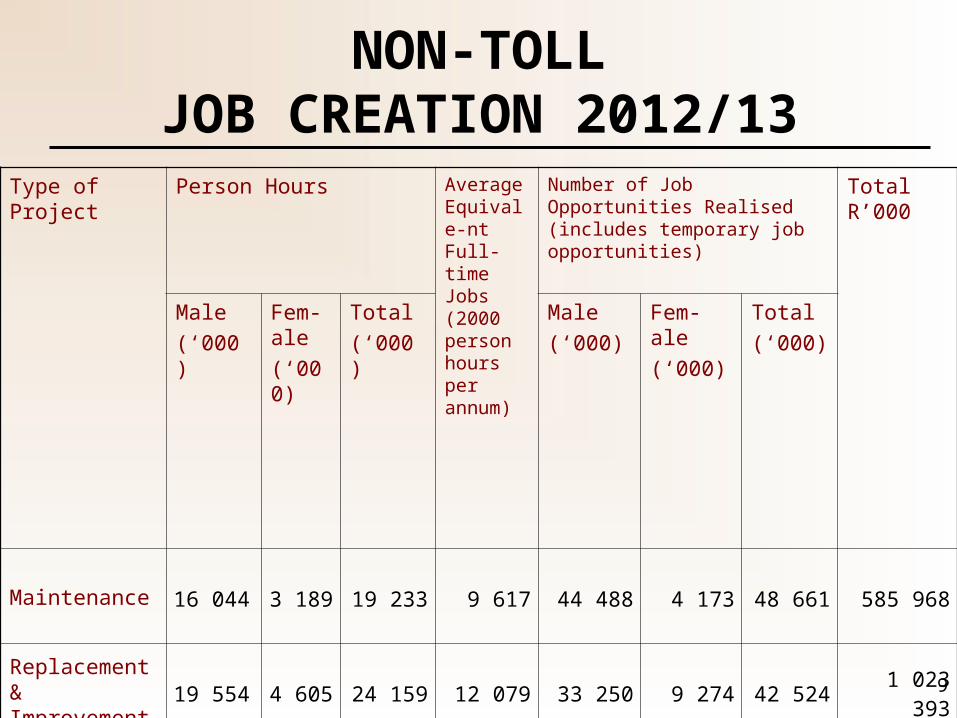
NON-TOLLJOB CREATION 2012/13
Type of Project Person Hours Average Equivale-nt Full-time Jobs (2000 person hours per annum)
Number of Job Opportunities Realised (includes temporary job opportunities)
Total R’000
Male
(‘000)
Fem-ale
(‘000)
Total
(‘000)
Male
(‘000)
Fem-ale
(‘000)
Total
(‘000)
Maintenance 16 044 3 189 19 233 9 617 44 488 4 173 48 661 585 968
Replacement & Improvement 19 554 4 605 24 159 12 079 33 250 9 274 42 524 1 023 393
Sub-total 35 598 7 794 43 392 21 696 77 738 13 447 91 185 1 609 361
9
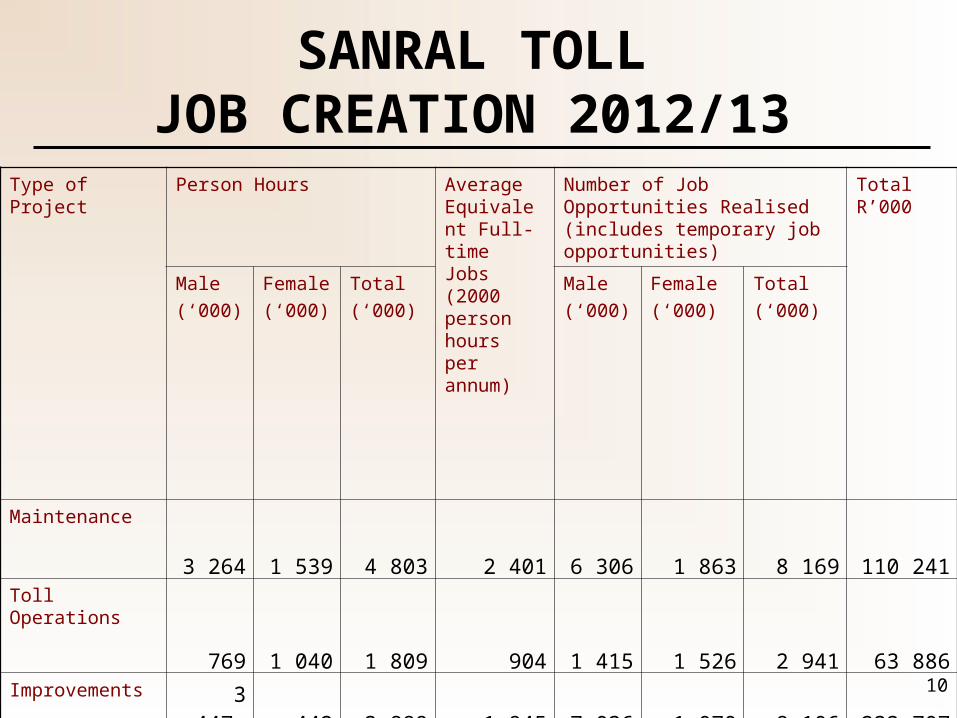
SANRAL TOLLJOB CREATION 2012/13
Type of Project Person Hours Average Equivalent Full-time Jobs (2000 person hours per annum)
Number of Job Opportunities Realised (includes temporary job opportunities)
Total R’000
Male
(‘000)
Female
(‘000)
Total
(‘000)
Male
(‘000)
Female
(‘000)
Total
(‘000)
Maintenance3 264 1 539 4 803 2 401 6 306 1 863 8 169 110 241
Toll Operations
769 1 040 1 809 904 1 415 1 526 2 941 63 886Improvements 3 447 442 3 889 1 945 7 036 1 070 8 106 233 707Sub-total
7 480 3 020 10 501 5 250 14 757 4 459 19 216 407 834Total 43 079 10 814 53 893 26 946 92 495 17 906 110 401 2 017 194
10
Overall Empowerment Rating: Level 2 (2009/10)
STAFF• Board approved Employment Equity Plan to
October 2014• Bursaries
SKILLS DEVELOPMENT• Scholarships• Bursaries• Internships• Funding to universities: Chairs in
Pavement/Transport/Maths and Science
TRANSFORMATION – Skills Development
11

SKILLS DEVELOPMENT - Community Outreach
• SANRAL’s presence at national career expos and exhibitions
• Roadshows at secondary schools – including presentations by community development specialists to schools
• Use of the database of the Department of Basic Education
• Attendance at university open days
12

SUPPORT: TERTIARY INSTITUTIONS
Best performing learner 2012 – WTTP. Glen Gowie School Polokwane
Chair in Pavement Engineering: University of Stellenbosch
Chair in Transport Planning: University of Cape Town
13
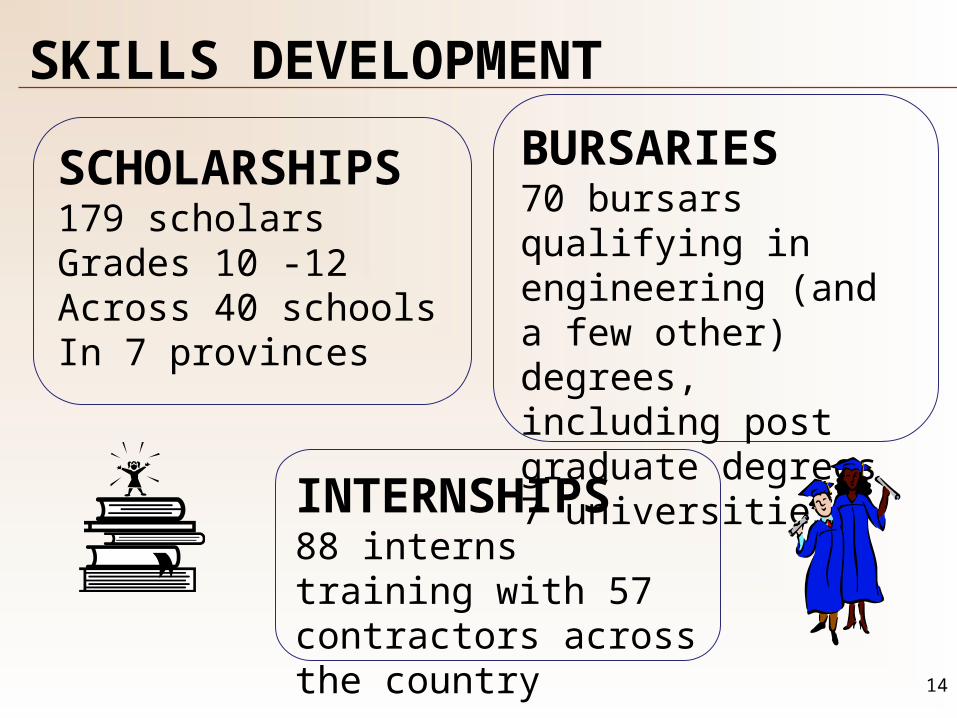
SKILLS DEVELOPMENT
SCHOLARSHIPS179 scholarsGrades 10 -12Across 40 schoolsIn 7 provinces
BURSARIES70 bursars qualifying in engineering (and a few other) degrees, including post graduate degrees7 universities
INTERNSHIPS88 interns training with 57 contractors across the country
14
CONTRACTORS• SMME Development in Routine
Maintenance Contracts• 72% of work to black SMMEs• 8% to other SMMEs• 20% to managing contractor responsible for
– Empowerment– Training– Support
TRANSFORMATION THROUGH PROJECTS
15

COMMUNITY DEVELOPMENT PROGRAMME Community based projects (generally safety
related) Pedestrian bridges Other bridges Roads
Economic opportunities in rural areas Employment of women and youth is
targeted Catalysts for opportunities such as tourism,
hospitality industry etc.
ROAD SAFETY PROJECTS: At least 12 new projects identified every year
TRANSFORMATION CONT’D
16

Community Development Projects
Projects No. of Projects
Expenditure Jobs Created Training
Community Development Projects (2012 -13)
43 R169 million 868 incl. 228 women252 youth3 disabled
R11.8 million
Community Development Projects (2009 -13)
64 R480 million 3117 incl.721 women714 youth11 disabled
R25.5 million
17

PEDESTRIAN MOVEMENT:UGU SIDEWALK
PreviousNow
18

SANRAL Road Safety Education and Awareness Programme
• SANRAL is taking road safety education back into schools
• Pedestrian hazardous locations have been identified for road safety education interventions in schools within a 5 kilometre radius from the national roads
• Workshops have been conducted at 397 schools, reaching 712 educators.
• Primary objectives of workshops:– To introduce the Road Safety Education Programme to
educators.– To provide educators with the relevant learning and
teaching support materials. – To facilitate the integration of road safety education into
learning areas.– To enable learners to acquire knowledge of road safety
related issues so as to participate safely in traffic.– To induce skills for survival and a positive attitude.
19

• Making the NDP a reality• Supports user charge• Protects the poor
• Opposition to user charge• Delays in project related approvals from
water affairs, provinces, environmental affairs etc.
• Law enforcement:• Traffic rules• Overloading by hauliers
• Driver behaviour – road safety• Reputational risk for SANRAL
CHALLENGES
20
• Insufficient funding for timely upgrades and
maintenance of the non-toll network
SIP-4 Progress
high-level planning and co-ordination between inter-modal transport and the three spheres of Government
CHALLENGES CONTD
21
22
Thank YouNazir Alli
FRAUD HOTLINE: 0800 204 558
Website: www.sanral.co.za