noncitrus fruits and nuts united states department of agriculture
TRANSCRIPT

United States Department of Agriculture National Agricultural Statistics Service
ISSN: 1948-2698
Noncitrus Fruits and Nuts 2012 Preliminary Summary January 2013

Noncitrus Fruits and Nuts 2012 Preliminary Summary (January 2013) 3 USDA, National Agricultural Statistics Service
Contents Noncitrus Fruit Highlights ...................................................................................................................................................... 6
Noncitrus Fruits and Nuts Bearing Acreage, Yield, Production, Price, and Value by Crop -
United States: 2010-2012 ........................................................................................................................................................ 8
Fruits and Nuts Bearing Acreage by Type – United States: 2010-2012 ............................................................................... 11
Noncitrus Fruits Utilized Production by Type of Utilization – United States: 2010-2012 ................................................... 11
Noncitrus Fruits Utilized Production – United States: 2012 Chart ....................................................................................... 12
Noncitrus Fruits Value of Utilized Production – United States: 2012 Chart ........................................................................ 12
Commercial Apple Bearing Acreage, Yield, Production, Price, and Value – States and United States: 2010-2012 ........... 14
Commercial Apple Fresh Market Utilization, Price, and Value – States and United States: 2010-2012 ............................. 17
Commercial Apple Processed Utilization, Price, and Value – States and United States: 2010-2012 ................................... 19
Commercial Apple Processed Utilization and Price by Use – States and United States: 2010-2012 ................................... 21
Unutilized Apple Production – States and United States: 2010-2012 .................................................................................. 22
Commercial Apple Bearing Acreage – United States: 2003-2012 Chart .............................................................................. 23
Commercial Apple Utilized Production – United States: 2003-2012 Chart ......................................................................... 23
Other Fruit Bearing Acreage, Yield, Production, Utilization, Price, and Value by Crop – States and
United States: 2010-2012 ...................................................................................................................................................... 24
Other Unutilized Fruit Production by Crop – States and United States: 2010-2012 ............................................................ 30
Other Processed Fruit Utilization and Price by Crop and Use – States and United States: 2010-2012 ................................ 30
Olive Production by Variety – California: 2010-2012 .......................................................................................................... 31
Dry Fruit Production and Price by Use – California: 2010-2012 ......................................................................................... 31
Fresh Basis Equivalents for Selected Dry Fruits – California: 2010-2012 .......................................................................... 31
Strawberry Area Planted, Harvested, Yield, Production, Price, and Value – States and United States: 2010-2012 ............ 32
Strawberry Utilization, Price, and Value by Utilization – States and United States: 2010-2012 ......................................... 33
Berry Area Harvested, Yield, Production, Utilization, Price, and Value by Crop – States and
United States: 2010-2012 ...................................................................................................................................................... 34
Unutilized Berry Production – States and United States: 2010-2012 ................................................................................... 38
Blackberry Area Harvested, Yield, Production, Utilization, Price, and Value by Variety – Oregon: 2010-2012 ................ 39
Unutilized Cultivated Blackberry Production by Variety – States and United States: 2010-2012 ....................................... 39

4 Noncitrus Fruits and Nuts 2012 Preliminary Summary (January 2013) USDA, National Agricultural Statistics Service
Sweet Cherry Bearing Acreage, Yield, Production, Utilization, Price, and Value – States and
United States: 2010-2012 ...................................................................................................................................................... 40
Tart Cherry Bearing Acreage, Yield, Production, Utilization, Price, and Value – States and
United States: 2010-2012 ...................................................................................................................................................... 42
Sweet and Tart Cherry Processed Utilization and Price by Use – States and United States: 2010-2012 ............................. 44
Unutilized Cherry Production by Crop – States and United States: 2010-2012 ................................................................... 45
Sweet Cherry Bearing Acreage – United States: 2003-2012 Chart ...................................................................................... 46
Tart Cherry Bearing Acreage – United States: 2003-2012 Chart .......................................................................................... 46
Cranberry Area Harvested, Yield, Production, Utilization, Price and Value – States and
United States: 2010-2012 ...................................................................................................................................................... 47
Grape Bearing Acreage, Yield, Production, Price, and Value – States and United States: 2010-2012 ................................ 48
Unutilized Grape Production – States and United States: 2010-2012 ................................................................................... 49
Grape Fresh and Processed Utilization, Price, and Value – States and United States: 2010-2012 ....................................... 50
Grape Processed Utilization and Price by Use – States and United States: 2010-2012 ........................................................ 52
Grape Processed Utilization by Variety – States and United States: 2010-2012 .................................................................. 53
Concord Grapes for Processing Marketing Year Average Prices – New York and Pennsylvania: 2010-2012 .................... 53
Peach Bearing Acreage, Yield, Production, Price, and Value – States and United States: 2010-2012 ................................. 54
Peach Utilized Production, Price, and Value by Utilization – States and United States: 2010-2012 ................................... 56
Peach Processed Utilization and Price by Use – States and United States: 2010-2012 ........................................................ 58
Unutilized Peach Production – States and United States: 2010-2012 ................................................................................... 58
Peach Bearing Acreage – United States: 2003-2012 Chart ................................................................................................... 59
Peach Bearing Utilized Production – United States: 2003-2012 Chart ................................................................................. 59
All Pear Bearing Acreage, Yield, Production, Utilization, Price, and Value – States and
United States: 2010-2012 ...................................................................................................................................................... 60
Unutilized Pear Production – States and United States: 2010-2012 ..................................................................................... 61
Pear Bearing Acreage, Yield, Production, Utilization, Price, and Value by Type – States and
United States: 2010-2012 ...................................................................................................................................................... 62
Tropical Fruit Acreage Harvested, Yield, Utilized Production, Utilization, Price, and Value by Crop –
Hawaii: 2010-2012 ................................................................................................................................................................ 64
Apple for Fresh Use Monthly Average Prices Received – States and United States: July 2011-August 2012 .................... 66

Noncitrus Fruits and Nuts 2012 Preliminary Summary (January 2013) 5 USDA, National Agricultural Statistics Service
Apples for Fresh Use Monthly Average Prices Received – United States: July 2008 - December 2012 ............................. 66
Grapes for Fresh Use Monthly Average Prices Received – United States: May 2008 - December 2012 ............................ 67
Peaches for Fresh Use Monthly Average Prices Received – United States: May 2008 - September 2012 .......................... 67
Pears for Fresh Use Monthly Average Prices Received – United States: July 2008 - December 2012 ................................ 67
Tree Nut Bearing Acreage, Yield, Production, Price, and Value by Crop – States: 2010-2012 ........................................... 68
Tree Nut Utilization and Meat Production by Crop – States and United States: 2010-2012 ................................................ 69
California Almonds Utilized Production – United States: 2003-2012 Chart ........................................................................ 70
California English Walnuts Utilized Production – United States: 2003-2012 Chart ............................................................ 70
Pecan Production, Price, and Value by Variety – States and United States: 2010-2012 ...................................................... 71
Crop Comments .................................................................................................................................................................... 72
Definition of Terms ............................................................................................................................................................... 74
Price and Value Definitions .................................................................................................................................................. 75
State MYA Price and Value Computations .......................................................................................................................... 75
United States MYA Price and Value Computations ............................................................................................................. 75
Marketing Seasons for Noncitrus Fruits ............................................................................................................................... 76
Marketing Seasons for Tree Nuts .......................................................................................................................................... 77
Statistical Methodology ........................................................................................................................................................ 78
Reliability of Selected Noncitrus Fruit Estimates ................................................................................................................. 78
Information Contacts ............................................................................................................................................................ 79

6 Noncitrus Fruits and Nuts 2012 Preliminary Summary (January 2013) USDA, National Agricultural Statistics Service
Noncitrus Fruit Highlights
In 2012, the Nation’s utilized production of the leading noncitrus fruit crops totaled 17.4 million tons, down 4 percent
from the 2011 utilized production. Utilized production increased from 2011 for Oregon cultivated blackberries, cultivated
blueberries, Maine wild blueberries, sweet cherries, cranberries, California olives, and strawberries. Utilized production
decreased from 2011 for apples, apricots, boysenberries, red raspberries, all California raspberries, tart cherries, California
dates, grapes, California kiwifruit, nectarines, peaches, pears, California plums, California prunes, and prunes and plums.
The value of utilized production for 2012 noncitrus fruit crops totaled 15.0 billion dollars, up 8 percent from 2011. The
value of utilized production for apples increased 9 percent, Oregon cultivated blackberries increased 4 percent, Oregon
black raspberries are up 3 percent, all California raspberries increased 7 percent, sweet cherries are up 1 percent,
cranberries are up 12 percent, grapes increased by 14 percent, nectarines are up 11 percent, California Olives are up
149 percent, peaches increased 7 percent, California plums are up 24 percent, prunes and plums increased 37 percent, and
strawberries are slightly above last year. However, the value of utilized production for apricots is slightly down, cultivated
blueberries are down 3 percent, Maine wild blueberries are down 5 percent, boysenberries are down 23 percent, red
raspberries decreased 12 percent, tart cherries decreased 27 percent, California dates are down 5 percent, and California
prunes decreased 13 percent from the previous year.

Noncitrus Fruits and Nuts 2012 Preliminary Summary (January 2013) 7 USDA, National Agricultural Statistics Service
This page intentionally left blank.

8 Noncitrus Fruits and Nuts 2012 Preliminary Summary (January 2013) USDA, National Agricultural Statistics Service
Noncitrus Fruits and Nuts Bearing Acreage, Yield, Production, Price, and Value by Crop - United States: 2010-2012 [Blank cells indicate estimation period has not yet begun]
Crop Bearing acreage Yield per acre
2010 2011 2012 2010 2011 2012
(acres) (acres) (acres) (tons fresh equivalent)
(tons fresh equivalent)
(tons fresh equivalent)
Noncitrus fruits Apples ....................................................................... Apricots ..................................................................... Avocados
1 ................................................................
Bananas (Hawaii) 1 2 .................................................
Blackberries, cultivated (Oregon) 2 ............................
Blueberries Cultivated
1 ............................................................
Wild (Maine) .......................................................... Boysenberries
1 .........................................................
Raspberries Black (Oregon) .................................................... Red ..................................................................... All (California) ..................................................... Cherries, Sweet ........................................................ Cherries, Tart ............................................................ Cranberries ............................................................... Dates (California) ...................................................... Figs (California) ......................................................... Grapes ...................................................................... Guavas (Hawaii)
1 2 ...................................................
Kiwifruit (California) ................................................... Nectarines ................................................................. Olives (California) ..................................................... Papayas (Hawaii)
1 2 .................................................
Peaches .................................................................... Pears ........................................................................ Plums (California) ..................................................... Prunes (California) .................................................... Prunes and Plums
3 ..................................................
Strawberries 2 ...........................................................
Total .........................................................................
341,950 12,150 59,930 1,100 7,500
69,610
(NA) 500
1,300 10,900 5,400
85,030 35,650 38,500 7,700 8,600
951,900
115 4,200
29,300 36,000 1,350
117,630 56,000 26,200 61,000 3,060
56,990
2,029,565
330,600 12,150 59,950 1,000 7,300
72,500
(NA) 500
1,100 11,000 5,400
85,820 36,000 38,500 8,400 8,600
960,100
110 4,200
27,900 41,500 1,300
112,480 54,400 25,500 58,000 2,810
57,420
2,024,540
327,800 12,150
6,800
77,700 (NA) 400
900 11,000 5,400
86,790 36,500 40,300 8,400 8,600
962,100
4,200 26,400 44,000
112,880 54,400 25,000 55,000 2,780
56,140
1,965,640
13.60 5.46 2.91 8.10 2.91
2.95 (NA) 2.10
0.67 3.04 7.50 3.68 2.67 8.84 3.77 4.76 7.85
5.65 7.79 7.96 5.72
11.20 9.78
14.50 5.39 2.13 3.95
25.10
(X)
14.30 5.49 4.39 8.70 3.61
3.02 (NA) 2.60
1.02 3.56
10.00 3.90 3.22
10.00 3.96 4.50 7.76
8.64 8.98 8.07 1.72
11.00 9.53
17.80 6.27 2.36 4.73
25.30
(X)
13.80 5.00
3.94
2.97 (NA) 2.44
1.20 3.15 9.00 4.89 1.17 9.98 3.70 4.50 7.63
7.05 7.16 3.64
8.67
15.80 4.60 2.27 4.76
26.90
(X)
(tons in-shell equivalent)
(tons in-shell equivalent)
(tons in-shell equivalent)
Tree nuts Almonds (California)
4 ...............................................
Hazelnuts (Oregon) ................................................... Macadamias (Hawaii) ................................................ Pecans ...................................................................... Pistachios (California) ............................................... Walnuts (California) .................................................. Total .........................................................................
740,000 29,000 15,000
(NA) 137,000 237,000
1,158,000
760,000 28,500 15,000
(NA) 153,000 245,000
1,201,500
780,000 29,000 15,000
(NA) 178,000 245,000
1,247,000
1.91 0.97 1.34 (NA) 1.91 2.13
(X)
2.24 1.35 1.64 (NA) 1.45 1.88
(X)
2.21 1.20 1.47 (NA) 1.55 1.92
(X)
See footnote(s) at end of table. --continued
Noncitrus Fruits and Nuts 2012 Preliminary Summary (January 2013) 9 USDA, National Agricultural Statistics Service
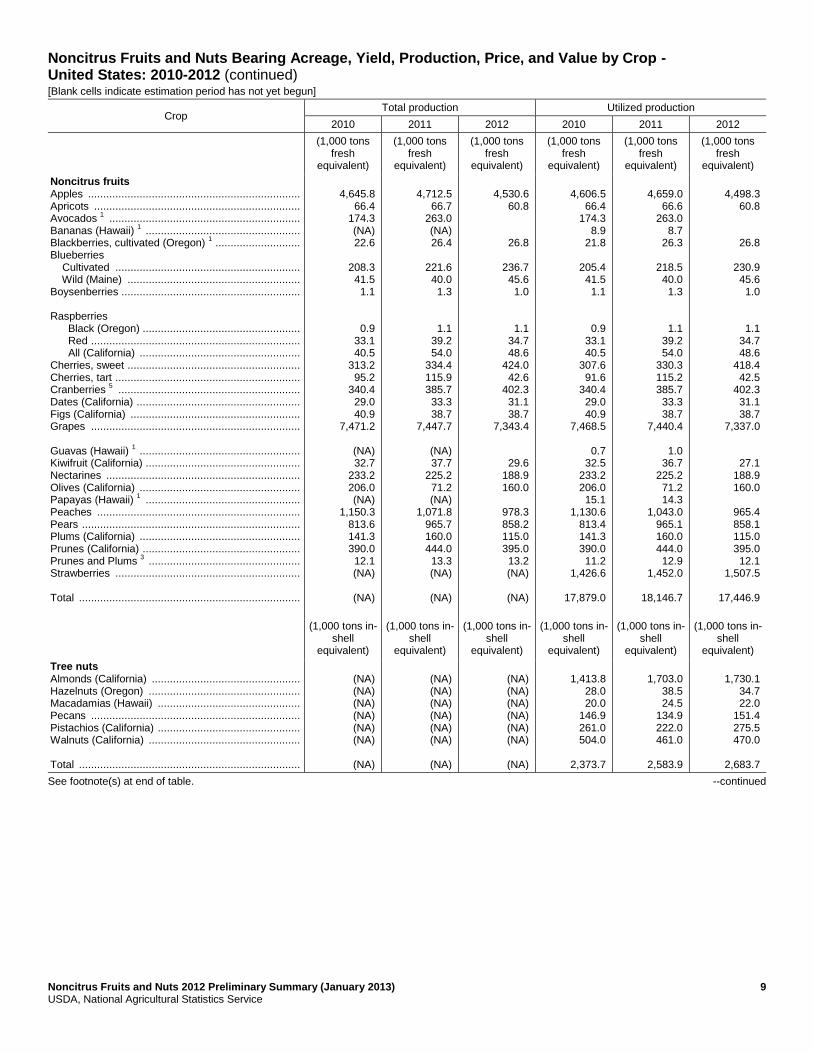
Noncitrus Fruits and Nuts Bearing Acreage, Yield, Production, Price, and Value by Crop - United States: 2010-2012 (continued) [Blank cells indicate estimation period has not yet begun]
Crop Total production Utilized production
2010 2011 2012 2010 2011 2012
(1,000 tons
fresh equivalent)
(1,000 tons fresh
equivalent)
(1,000 tons fresh
equivalent)
(1,000 tons fresh
equivalent)
(1,000 tons fresh
equivalent)
(1,000 tons fresh
equivalent)
Noncitrus fruits Apples ...................................................................... Apricots .................................................................... Avocados
1 ...............................................................
Bananas (Hawaii) 1 ...................................................
Blackberries, cultivated (Oregon) 1 ............................
Blueberries Cultivated ............................................................. Wild (Maine) ......................................................... Boysenberries ........................................................... Raspberries Black (Oregon) .................................................... Red ..................................................................... All (California) ..................................................... Cherries, sweet ......................................................... Cherries, tart ............................................................. Cranberries
5 ............................................................
Dates (California) ...................................................... Figs (California) ........................................................ Grapes ..................................................................... Guavas (Hawaii)
1 .....................................................
Kiwifruit (California) ................................................... Nectarines ................................................................ Olives (California) ..................................................... Papayas (Hawaii)
1 ...................................................
Peaches ................................................................... Pears ........................................................................ Plums (California) ..................................................... Prunes (California) .................................................... Prunes and Plums
3 ..................................................
Strawberries ............................................................. Total .........................................................................
4,645.8
66.4 174.3 (NA) 22.6
208.3 41.5 1.1
0.9 33.1 40.5
313.2 95.2
340.4 29.0 40.9
7,471.2
(NA) 32.7
233.2 206.0 (NA)
1,150.3 813.6 141.3 390.0 12.1 (NA)
(NA)
4,712.5
66.7 263.0 (NA) 26.4
221.6 40.0 1.3
1.1 39.2 54.0
334.4 115.9 385.7 33.3 38.7
7,447.7
(NA) 37.7
225.2 71.2 (NA)
1,071.8 965.7 160.0 444.0 13.3 (NA)
(NA)
4,530.6
60.8
26.8
236.7 45.6 1.0
1.1 34.7 48.6
424.0 42.6
402.3 31.1 38.7
7,343.4
29.6 188.9 160.0
978.3 858.2 115.0 395.0 13.2 (NA)
(NA)
4,606.5
66.4 174.3
8.9 21.8
205.4 41.5 1.1
0.9 33.1 40.5
307.6 91.6
340.4 29.0 40.9
7,468.5
0.7 32.5
233.2 206.0 15.1
1,130.6 813.4 141.3 390.0 11.2
1,426.6
17,879.0
4,659.0
66.6 263.0
8.7 26.3
218.5 40.0 1.3
1.1 39.2 54.0
330.3 115.2 385.7 33.3 38.7
7,440.4
1.0 36.7
225.2 71.2 14.3
1,043.0 965.1 160.0 444.0 12.9
1,452.0
18,146.7
4,498.3
60.8
26.8
230.9 45.6 1.0
1.1 34.7 48.6
418.4 42.5
402.3 31.1 38.7
7,337.0
27.1 188.9 160.0
965.4 858.1 115.0 395.0 12.1
1,507.5
17,446.9
(1,000 tons in-shell
equivalent)
(1,000 tons in-shell
equivalent)
(1,000 tons in-shell
equivalent)
(1,000 tons in-shell
equivalent)
(1,000 tons in-shell
equivalent)
(1,000 tons in-shell
equivalent)
Tree nuts Almonds (California) ................................................. Hazelnuts (Oregon) .................................................. Macadamias (Hawaii) ............................................... Pecans ..................................................................... Pistachios (California) ............................................... Walnuts (California) .................................................. Total .........................................................................
(NA) (NA) (NA) (NA) (NA) (NA)
(NA)
(NA) (NA) (NA) (NA) (NA) (NA)
(NA)
(NA) (NA) (NA) (NA) (NA) (NA)
(NA)
1,413.8
28.0 20.0
146.9 261.0 504.0
2,373.7
1,703.0
38.5 24.5
134.9 222.0 461.0
2,583.9
1,730.1
34.7 22.0
151.4 275.5 470.0
2,683.7
See footnote(s) at end of table. --continued

10 Noncitrus Fruits and Nuts 2012 Preliminary Summary (January 2013) USDA, National Agricultural Statistics Service
Noncitrus Fruits and Nuts Bearing Acreage, Yield, Production, Price, and Value by Crop - United States: 2010-2012 (continued) [Blank cells indicate estimation period has not yet begun]
Crop Price Value of utilized production
2010 2011 2012 2010 2011 2012
(dollars) (dollars) (dollars) (1,000 dollars) (1,000 dollars) (1,000 dollars)
Noncitrus fruits Apples ........................................................... pounds Apricots .............................................................. tons Avocados
1 ......................................................... tons
Bananas 1 (Hawaii) ....................................... pounds
Blackberries, cultivated (Oregon) .................. pounds Blueberries Cultivated .................................................. pounds Wild (Maine) .............................................. pounds Boysenberries ............................................... pounds Raspberries Black (Oregon) .......................................... pounds Red ........................................................... pounds All (California) ........................................... pounds Cherries, sweet .................................................. tons Cherries, tart ................................................. pounds Cranberries .................................................... barrels Dates (California) ............................................... tons Figs (California) .................................................. tons Grapes ............................................................... tons Guavas
1 (Hawaii) ......................................... pounds
Kiwifruit (California) ............................................ tons Nectarines .......................................................... tons Olives (California) .............................................. tons Papayas
1 (Hawaii) ........................................ pounds
Peaches ............................................................. tons Pears ................................................................. tons Plums (California) .............................................. tons Prunes (California)
6 ........................................... tons
Prunes and Plums 3 ........................................... tons
Strawberries ......................................................... cwt Total
7 .......................................................................
Tree nuts Almonds, shelled (California)
4 ...................... pounds
Hazelnuts (Oregon) ............................................ tons Macadamias (Hawaii) .................................... pounds Pecans .......................................................... pounds Pistachios (California) ................................... pounds Walnuts (California)
2 ......................................... tons
Total
7 .......................................................................
0.251
722.00 2,750.00
0.600 0.763
1.440 0.610 0.873
1.260 0.853 2.470
2,330.00 0.222 43.90
1,270.00 542.00 487.00
0.169
768.00 553.00 664.00 0.370
547.00 476.00 555.00
1,350.00 439.00 79.30
(X)
1.790 2,410.00
0.750 2.300 2.220
2,040.00
(X)
0.303
616.00 1,540.00
0.650 0.812
1.850 0.910 1.010
2.470 0.648 2.070
2,530.00 0.300 44.80
1,320.00 526.00 577.00
0.170
775.00 582.00 733.00 0.340
564.00 380.00 402.00
1,310.00 370.00 82.50
(X)
1.990 2,330.00
0.780 2.430 1.980
2,900.00
(X)
0.343
673.00
0.832
1.690 0.758 1.050
2.650 0.642 2.470
2,020.00 0.594 47.90
1,340.00
669.00
767.00 813.00
654.00 509.00 695.00
1,250.00 540.00 79.80
(X)
2.200 1,830.00
0.800 1.570 2.020
(X)
2,313,588
47,876 479,068 10,680 33,291
593,407 50,600 1,834
2,185 56,426
200,288 715,684 40,741
299,123 36,830 22,185
3,634,915
220 24,961
129,075 136,796 11,123
618,566 386,955 78,422
175,500 4,915
2,262,353
12,367,607
2,903,380 67,480 30,000
674,828 1,158,840 1,028,160
5,862,688
2,823,401
41,056 406,047 11,310 42,783
807,576 72,690 2,638
5,510 50,736
223,200 834,585 69,072
345,561 43,956 20,336
4,293,607
323 28,439
130,973 52,168 9,722
588,330 366,552 64,320
179,470 4,767
2,394,724
13,913,852
4,007,860 89,705 38,220
655,889 879,120
1,336,900
7,007,694
3,088,915
40,879
44,520
781,808 69,075 2,044
5,689 44,515
239,820 843,311 50,520
385,506 41,674
4,911,335
144,906 130,038
631,223 437,113 79,940
156,250 6,552
2,405,478
15,009,852
4,347,200 63,420 35,200
476,781 1,113,020
7,398,621
(NA) Not available. (X) Not applicable. 1
Estimates for 2012 will be published on July 17, 2013. 2
Harvested acreage. Yield based on utilized production. 3
Idaho, Michigan, Oregon, and Washington. 4
Yield based on in-shell equivalent. Shelling ratios are: 2010 - 0.580; 2011 - 0.596; 2012 - 0.578. 5
Production is rounded to the nearest 1,000 barrels prior to converting to tons fresh equivalent. 6
Price is for dried basis. 7
2012 value of production was estimated for crops with missing values. The 2011 price was used to compute 2012 fig, kiwifruit, and walnut values. The 2011 values for avocados, bananas, guavas, and papayas are carried forward.

Noncitrus Fruits and Nuts 2012 Preliminary Summary (January 2013) 11 USDA, National Agricultural Statistics Service
Fruits and Nuts Bearing Acreage by Type – United States: 2010-2012
Year Citrus fruits 1
Major deciduous fruits
2
Miscellaneous noncitrus
3
Nuts 4 Total
(acres) (acres) (acres) (acres) (acres)
2010 ............. 2011 ............. 2012 .............
826,500 811,300 804,300
1,719,870 1,705,760 1,701,800
309,695 318,780 263,840
1,158,000 1,201,500 1,247,000
4,014,065 4,037,340 4,016,940
1 Grapefruit, lemons, oranges, tangelos, and tangerines.
2 Commercial apples, apricots, cherries, grapes, nectarines, peaches, pears, plums, and prunes.
3 Avocados, bananas, berries, cranberries, dates, figs, guavas, kiwifruit, olives, papayas, and strawberries.
4 Almonds, hazelnuts, macadamia nuts, pistachios, and walnuts.
Noncitrus Fruits Utilized Production by Type of Utilization – United States: 2010-2012 [Blank cells indicate estimation period has not yet begun]
Year Utilized production 1 Fresh
Processed 2
Canned Dried Juice Frozen Wine Other
(1,000 tons) (1,000 tons) (1,000 tons) (1,000 tons) (1,000 tons) (1,000 tons) (1,000 tons) (1,000 tons)
2010 .......... 2011 .......... 2012 ..........
17,879.0 18,146.7 17,446.9
7,458.3 7,701.9
1,386.0 1,300.5
2,317.8 2,398.6
1,103.1 1,153.2
705.9 736.6
4,269.8 4,154.3
297.7 315.9
1 Cranberry quantity included in total utilized production, excluded from fresh and processed breakdowns.
2 Processed strawberries are included in frozen.

12 Noncitrus Fruits and Nuts 2012 Preliminary Summary (January 2013) USDA, National Agricultural Statistics Service
Grapes 7,337
Apples 4,498
Strawberries 1,508 Peaches
965 Pears 858
Sweet Cherries
418 Prunes (CA)
395
Other 1,467
0
1,000
2,000
3,000
4,000
5,000
6,000
7,000
8,000
Noncitrus Fruits Utilized Production by Major Fruit United States: 2012
(000) Tons fresh equivalent
Grapes 4,911
Apples 3,089
Strawberries 2,405
Sweet Cherries
843
Blueberries (Cultivated)
782 Peaches
631 Pears 437
Other 1,911
0
500
1,000
1,500
2,000
2,500
3,000
3,500
4,000
4,500
5,000
Million dollars
Noncitrus Fruits Value of Utilized Production by Major Fruit United States: 2012

Noncitrus Fruits and Nuts 2012 Preliminary Summary (January 2013) 13 USDA, National Agricultural Statistics Service
This page intentionally left blank.

14 Noncitrus Fruits and Nuts 2012 Preliminary Summary (January 2013) USDA, National Agricultural Statistics Service
Commercial Apple Bearing Acreage, Yield, Production, Price, and Value – States and United States: 2010-2012
State Bearing acreage Yield per acre
1
2010 2011 2012 2010 2011 2012
(acres) (acres) (acres) (pounds) (pounds) (pounds)
Arizona ..................................... California .................................. Colorado ................................... Connecticut ............................... Idaho ......................................... Illinois ........................................ Indiana ...................................... Iowa .......................................... Maine ........................................ Maryland ................................... Massachusetts .......................... Michigan ................................... Minnesota ................................. Missouri .................................... New Hampshire ........................ New Jersey ............................... New York .................................. North Carolina ........................... Ohio .......................................... Oregon ...................................... Pennsylvania ............................ Rhode Island ............................. Tennessee ................................ Utah .......................................... Vermont .................................... Virginia ...................................... Washington ............................... West Virginia ............................. Wisconsin ................................. United States ............................
1,200 18,000 1,400 2,100 2,600 2,200 1,800 1,000 3,100 1,850
4,000
35,000 2,600 1,800 1,900 2,000
42,000 6,800 6,300 4,200
21,000
300 800
1,400 2,800
11,800 153,000
4,900 4,100
341,950
1,200 17,500 1,300 2,100 2,600 2,200 1,700 1,000 3,100 1,750
4,000
34,000 2,450 1,800 1,900 1,900
42,000 6,900 4,300 4,100
21,000
300 800
1,400 2,800
11,800 146,000
4,900 3,800
330,600
1,000 17,500 1,200 2,100 2,600 2,100 1,500 1,000 3,100 1,800
4,000
34,200 2,400 1,600 1,900 1,900
42,000 6,700 4,000 4,000
21,000
300 700
1,400 2,800
11,800 146,000
4,000 3,200
327,800
14,200 15,600 10,000 11,000 23,100 23,600 14,400 3,800
10,000 23,000
9,250
16,300 7,310
18,300 11,100 21,500 30,500 20,000 13,200 28,600
23,400 8,670 9,380 8,570
12,500 16,900 36,300 13,100 9,020
27,200
9,170 16,000 6,920
10,500 23,100 18,200 11,800 4,000 9,350
22,900
9,630 28,800 9,590 8,330 9,470
18,900 29,000 20,300 15,500 22,600
21,800 8,330
10,600 13,600 12,000 18,600 37,100 13,700 13,500
28,500
8,000 17,100 14,200 7,860
28,800 15,200 3,000
700 9,680
19,400
7,000 3,360 4,670
21,900 8,160
18,400 17,100 5,000 8,250
32,500
23,500 5,670 9,140
10,000 9,110
19,500 44,500 22,800 7,380
27,600
See footnote(s) at end of table. --continued
Noncitrus Fruits and Nuts 2012 Preliminary Summary (January 2013) 15 USDA, National Agricultural Statistics Service
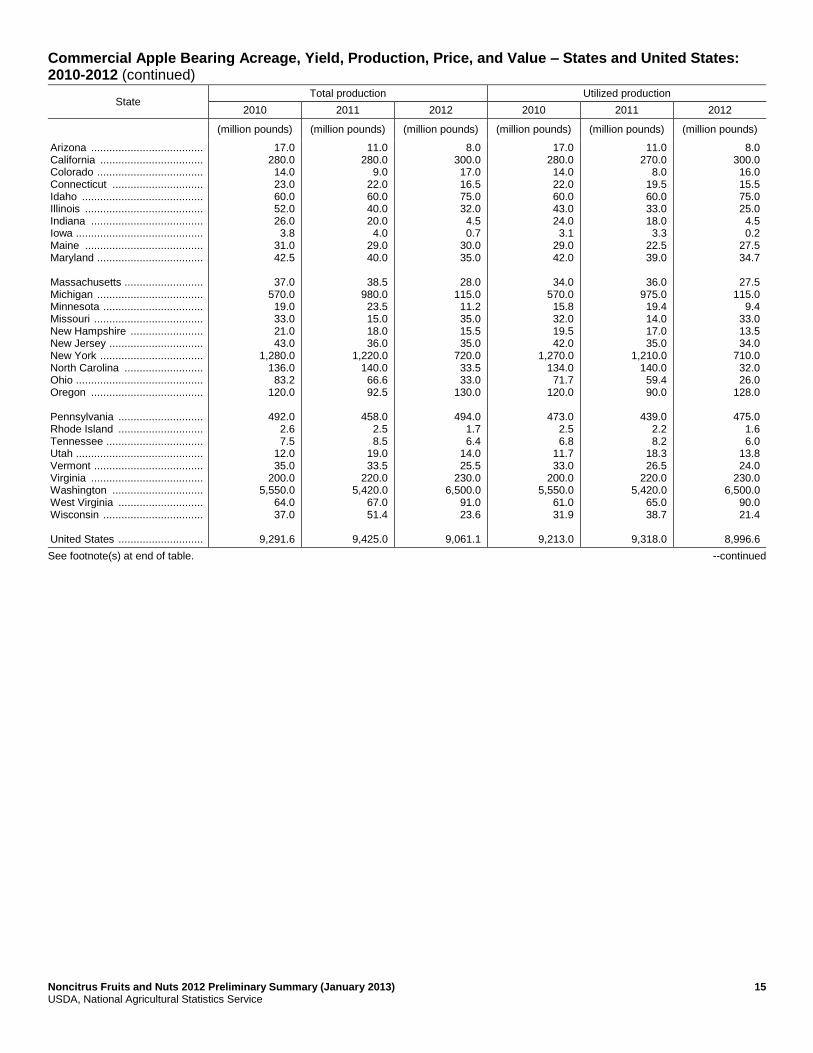
Commercial Apple Bearing Acreage, Yield, Production, Price, and Value – States and United States: 2010-2012 (continued)
State Total production Utilized production
2010 2011 2012 2010 2011 2012
(million pounds) (million pounds) (million pounds) (million pounds) (million pounds) (million pounds)
Arizona ..................................... California .................................. Colorado ................................... Connecticut .............................. Idaho ........................................ Illinois ....................................... Indiana ..................................... Iowa .......................................... Maine ....................................... Maryland ................................... Massachusetts .......................... Michigan ................................... Minnesota ................................. Missouri .................................... New Hampshire ........................ New Jersey ............................... New York .................................. North Carolina .......................... Ohio .......................................... Oregon ..................................... Pennsylvania ............................ Rhode Island ............................ Tennessee ................................ Utah .......................................... Vermont .................................... Virginia ..................................... Washington .............................. West Virginia ............................ Wisconsin ................................. United States ............................
17.0 280.0 14.0 23.0 60.0 52.0 26.0 3.8
31.0 42.5
37.0
570.0 19.0 33.0 21.0 43.0
1,280.0 136.0 83.2
120.0
492.0 2.6 7.5
12.0 35.0
200.0 5,550.0
64.0 37.0
9,291.6
11.0 280.0
9.0 22.0 60.0 40.0 20.0 4.0
29.0 40.0
38.5
980.0 23.5 15.0 18.0 36.0
1,220.0 140.0 66.6 92.5
458.0
2.5 8.5
19.0 33.5
220.0 5,420.0
67.0 51.4
9,425.0
8.0 300.0 17.0 16.5 75.0 32.0 4.5 0.7
30.0 35.0
28.0
115.0 11.2 35.0 15.5 35.0
720.0 33.5 33.0
130.0
494.0 1.7 6.4
14.0 25.5
230.0 6,500.0
91.0 23.6
9,061.1
17.0 280.0 14.0 22.0 60.0 43.0 24.0 3.1
29.0 42.0
34.0
570.0 15.8 32.0 19.5 42.0
1,270.0 134.0 71.7
120.0
473.0 2.5 6.8
11.7 33.0
200.0 5,550.0
61.0 31.9
9,213.0
11.0 270.0
8.0 19.5 60.0 33.0 18.0 3.3
22.5 39.0
36.0
975.0 19.4 14.0 17.0 35.0
1,210.0 140.0 59.4 90.0
439.0
2.2 8.2
18.3 26.5
220.0 5,420.0
65.0 38.7
9,318.0
8.0 300.0 16.0 15.5 75.0 25.0 4.5 0.2
27.5 34.7
27.5
115.0 9.4
33.0 13.5 34.0
710.0 32.0 26.0
128.0
475.0 1.6 6.0
13.8 24.0
230.0 6,500.0
90.0 21.4
8,996.6
See footnote(s) at end of table. --continued

16 Noncitrus Fruits and Nuts 2012 Preliminary Summary (January 2013) USDA, National Agricultural Statistics Service
Commercial Apple Bearing Acreage, Yield, Production, Price, and Value – States and United States: 2010-2012 (continued)
State Price per pound Value of utilized production
2010 2011 2012 2010 2011 2012
(dollars) (dollars) (dollars) (1,000 dollars) (1,000 dollars) (1,000 dollars)
Arizona ..................................... California .................................. Colorado ................................... Connecticut ............................... Idaho ......................................... Illinois ........................................ Indiana ...................................... Iowa .......................................... Maine ........................................ Maryland ................................... Massachusetts .......................... Michigan ................................... Minnesota ................................. Missouri .................................... New Hampshire ........................ New Jersey ............................... New York .................................. North Carolina ........................... Ohio .......................................... Oregon ...................................... Pennsylvania ............................ Rhode Island ............................. Tennessee ................................ Utah .......................................... Vermont .................................... Virginia ...................................... Washington ............................... West Virginia ............................. Wisconsin ................................. United States ............................
0.179 0.207 0.216 0.539 0.232 0.617 0.403 0.719 0.461 0.182
0.570 0.181 0.796 0.301 0.463 0.480 0.175 0.185 0.383 0.224
0.158 0.820 0.305 0.250 0.309 0.154 0.278 0.144 0.516
0.251
0.241 0.215 0.293 0.539 0.239 0.575 0.398 0.663 0.474 0.259
0.603 0.207 0.814 0.313 0.505 0.672 0.202 0.192 0.367 0.221
0.182 0.793 0.279 0.222 0.304 0.182 0.357 0.175 0.485
0.303
0.217 0.259 0.304 0.654 0.320 0.557 0.396 0.675 0.560 0.402
0.623 0.352 0.811 0.471 0.581 0.839 0.352 0.313 0.336 0.250
0.281 0.851 0.480 0.263 0.434 0.297 0.346 0.258 0.626
0.343
3,048 57,820 3,020
11,853 13,910 26,548 9,672 2,228
13,371 7,650
19,366
103,375 12,571 9,635 9,036
20,180 221,620 24,793 27,426 26,855
74,896 2,050 2,076 2,928
10,210 30,760
1,541,420 8,797
16,474
2,313,588
2,647 57,975 2,340
10,507 14,350 18,989 7,166 2,187
10,676 10,115
21,690
201,650 15,796 4,379 8,588
23,505 244,000 26,863 21,808 19,861
79,739 1,745 2,290 4,054 8,044
40,055 1,932,260
11,371 18,751
2,823,401
1,738 77,750 4,860
10,130 24,000 13,928 1,784
135 15,388 13,939
17,123 40,475 7,625
15,554 7,845
28,540 249,790 10,016 8,735
32,018
133,595 1,362 2,880 3,635
10,405 68,220
2,250,850 23,193 13,402
3,088,915
(D) Withheld to avoid disclosing data for individual operations. 1
Yield is based on total production, which includes unharvested production and fruit harvested but not sold due to market conditions.

Noncitrus Fruits and Nuts 2012 Preliminary Summary (January 2013) 17 USDA, National Agricultural Statistics Service
Commercial Apple Fresh Market Utilization, Price, and Value – States and United States: 2010-2012 [Equivalent packinghouse door returns for California, Michigan, New York, and Washington; price at point of first sale for all other States. Blank cells indicate estimation period has not yet begun.]
State Quantity Price per pound
2010 2011 2012 2010 2011 2012
(million pounds) (million pounds) (million pounds) (dollars) (dollars) (dollars)
Arizona ..................................... California .................................. Colorado ................................... Connecticut .............................. Idaho ........................................ Illinois ....................................... Indiana ..................................... Iowa .......................................... Maine ....................................... Maryland ................................... Massachusetts .......................... Michigan ................................... Minnesota ................................. Missouri .................................... New Hampshire ........................ New Jersey ............................... New York .................................. North Carolina .......................... Ohio .......................................... Oregon ..................................... Pennsylvania ............................ Rhode Island ............................ Tennessee ................................ Utah .......................................... Vermont .................................... Virginia ..................................... Washington .............................. West Virginia ............................ Wisconsin ................................. Other States
1 ...........................
United States ............................
2.0 115.0
8.0 18.5 40.0 (D)
19.0 (D)
24.0 14.0
27.0
210.0 (D)
22.0 14.5 30.0
560.0 56.0 56.2 85.0
190.0
(D) (D)
11.3 27.0 70.0
4,550.0 14.0 28.2
65.1
6,256.8
1.0 125.0
4.0 17.5 35.0 (D)
13.0 (D)
17.0 18.0
31.0
350.0 (D) 9.0
13.0 25.0
530.0 59.0 43.4 75.0
184.0
(D) (D)
17.5 16.0 60.0
4,550.0 19.0 32.5
57.2
6,302.1
0.849 0.373 0.310 0.620 0.315
(D) 0.484
(D) 0.540 0.390
0.700 0.300
(D) 0.405 0.600 0.640 0.263 0.276 0.460 0.290
0.258
(D) (D)
0.257 0.360 0.267 0.321 0.319 0.574
0.688
0.326
0.780 0.325 0.450 0.590 0.335
(D) 0.507
(D) 0.595 0.460
0.685 0.350
(D) 0.406 0.630 0.907 0.333 0.308 0.460 0.244
0.290
(D) (D)
0.228 0.445 0.364 0.402 0.365 0.563
0.699
0.394
See footnote(s) at end of table. --continued
18 Noncitrus Fruits and Nuts 2012 Preliminary Summary (January 2013) USDA, National Agricultural Statistics Service
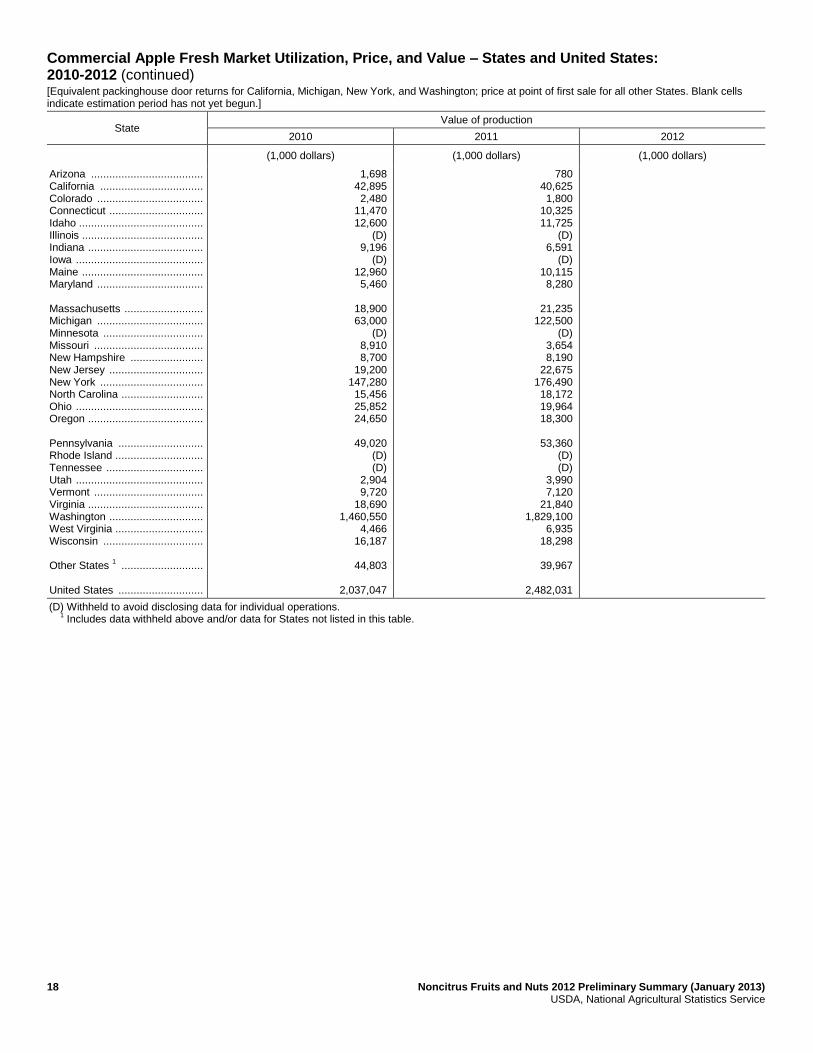
Commercial Apple Fresh Market Utilization, Price, and Value – States and United States: 2010-2012 (continued) [Equivalent packinghouse door returns for California, Michigan, New York, and Washington; price at point of first sale for all other States. Blank cells indicate estimation period has not yet begun.]
State Value of production
2010 2011 2012
(1,000 dollars) (1,000 dollars) (1,000 dollars)
Arizona ..................................... California .................................. Colorado ................................... Connecticut ............................... Idaho ......................................... Illinois ........................................ Indiana ...................................... Iowa .......................................... Maine ........................................ Maryland ................................... Massachusetts .......................... Michigan ................................... Minnesota ................................. Missouri .................................... New Hampshire ........................ New Jersey ............................... New York .................................. North Carolina ........................... Ohio .......................................... Oregon ...................................... Pennsylvania ............................ Rhode Island ............................. Tennessee ................................ Utah .......................................... Vermont .................................... Virginia ...................................... Washington ............................... West Virginia ............................. Wisconsin ................................. Other States
1 ...........................
United States ............................
1,698 42,895 2,480
11,470 12,600
(D) 9,196
(D) 12,960 5,460
18,900 63,000
(D) 8,910 8,700
19,200 147,280 15,456 25,852 24,650
49,020
(D) (D)
2,904 9,720
18,690 1,460,550
4,466 16,187
44,803
2,037,047
780 40,625 1,800
10,325 11,725
(D) 6,591
(D) 10,115 8,280
21,235
122,500 (D)
3,654 8,190
22,675 176,490 18,172 19,964 18,300
53,360
(D) (D)
3,990 7,120
21,840 1,829,100
6,935 18,298
39,967
2,482,031
(D) Withheld to avoid disclosing data for individual operations. 1
Includes data withheld above and/or data for States not listed in this table.

Noncitrus Fruits and Nuts 2012 Preliminary Summary (January 2013) 19 USDA, National Agricultural Statistics Service
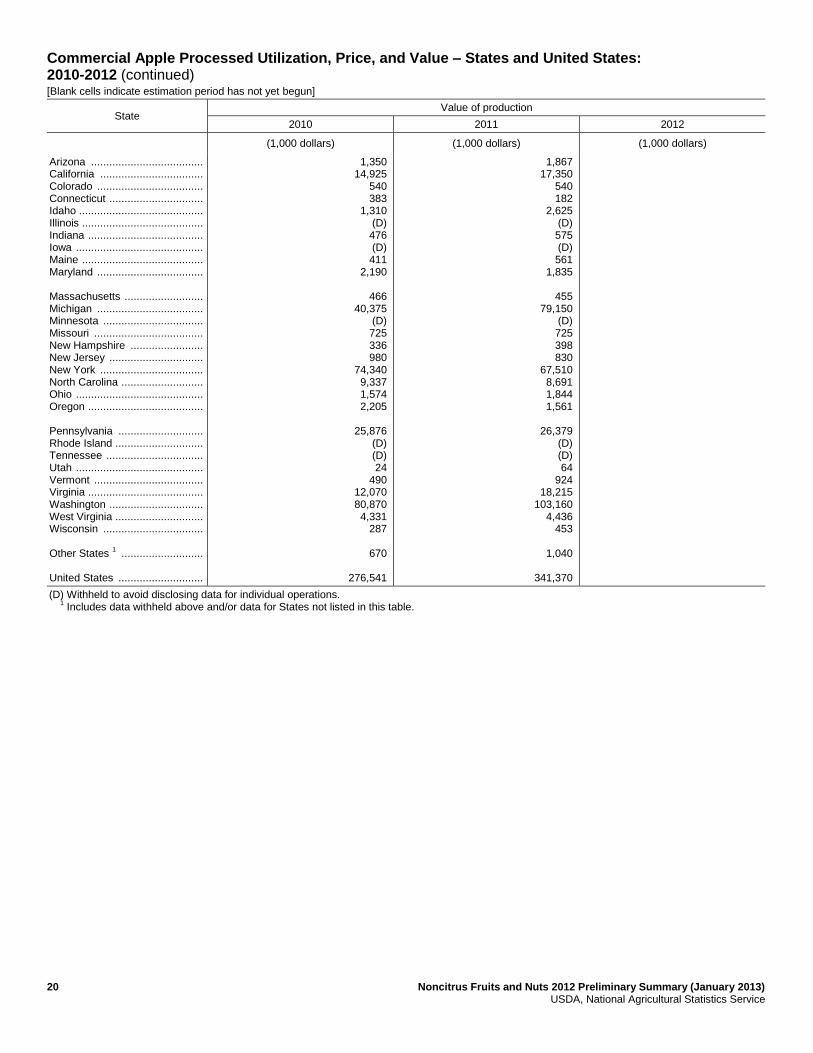
Commercial Apple Processed Utilization, Price, and Value – States and United States: 2010-2012 [Blank cells indicate estimation period has not yet begun]
State Quantity Price per ton
2010 2011 2012 2010 2011 2012
(million pounds) (million pounds) (million pounds) (dollars) (dollars) (dollars)
Arizona ..................................... California .................................. Colorado ................................... Connecticut .............................. Idaho ........................................ Illinois ....................................... Indiana ..................................... Iowa .......................................... Maine ....................................... Maryland ................................... Massachusetts .......................... Michigan ................................... Minnesota ................................. Missouri .................................... New Hampshire ........................ New Jersey ............................... New York .................................. North Carolina .......................... Ohio .......................................... Oregon ..................................... Pennsylvania ............................ Rhode Island ............................ Tennessee ................................ Utah .......................................... Vermont .................................... Virginia ..................................... Washington .............................. West Virginia ............................ Wisconsin ................................. Other States
1 ...........................
United States ............................
15.0 165.0
6.0 3.5
20.0 (D) 5.0 (D) 5.0
28.0
7.0 360.0
(D) 10.0 5.0
12.0 710.0 78.0 15.5 35.0
283.0
(D) (D) 0.4 6.0
130.0 1,000.0
47.0 3.7
6.1
2,956.2
10.0 145.0
4.0 2.0
25.0 (D) 5.0 (D) 5.5
21.0
5.0 625.0
(D) 5.0 4.0
10.0 680.0 81.0 16.0 15.0
255.0
(D) (D) 0.8
10.5 160.0 870.0 46.0 6.2
8.9
3,015.9
180.00 181.00 180.00 219.00 131.00
(D) 190.00
(D) 164.00 156.00
133.00 224.00
(D) 145.00 134.00 163.00 209.00 239.00 203.00 126.00
183.00
(D) (D)
120.00 163.00 186.00 162.00 184.00 155.00
220.00
187.00
373.00 239.00 270.00 182.00 210.00
(D) 230.00
(D) 204.00 175.00
182.00 253.00
(D) 290.00 199.00 166.00 199.00 215.00 231.00 208.00
207.00
(D) (D)
160.00 176.00 228.00 237.00 193.00 146.00
234.00
226.00
See footnote(s) at end of table. --continued
20 Noncitrus Fruits and Nuts 2012 Preliminary Summary (January 2013) USDA, National Agricultural Statistics Service
Commercial Apple Processed Utilization, Price, and Value – States and United States: 2010-2012 (continued) [Blank cells indicate estimation period has not yet begun]
State Value of production
2010 2011 2012
(1,000 dollars) (1,000 dollars) (1,000 dollars)
Arizona ..................................... California .................................. Colorado ................................... Connecticut ............................... Idaho ......................................... Illinois ........................................ Indiana ...................................... Iowa .......................................... Maine ........................................ Maryland ................................... Massachusetts .......................... Michigan ................................... Minnesota ................................. Missouri .................................... New Hampshire ........................ New Jersey ............................... New York .................................. North Carolina ........................... Ohio .......................................... Oregon ...................................... Pennsylvania ............................ Rhode Island ............................. Tennessee ................................ Utah .......................................... Vermont .................................... Virginia ...................................... Washington ............................... West Virginia ............................. Wisconsin ................................. Other States
1 ...........................
United States ............................
1,350 14,925
540 383
1,310 (D) 476 (D) 411
2,190
466 40,375
(D) 725 336 980
74,340 9,337 1,574 2,205
25,876
(D) (D) 24
490 12,070 80,870 4,331
287
670
276,541
1,867 17,350
540 182
2,625 (D) 575 (D) 561
1,835
455 79,150
(D) 725 398 830
67,510 8,691 1,844 1,561
26,379
(D) (D) 64
924 18,215
103,160 4,436
453
1,040
341,370
(D) Withheld to avoid disclosing data for individual operations. 1
Includes data withheld above and/or data for States not listed in this table.

Noncitrus Fruits and Nuts 2012 Preliminary Summary (January 2013) 21 USDA, National Agricultural Statistics Service
Commercial Apple Processed Utilization and Price by Use – States and United States: 2010-2012 [Blank cells indicate estimation period has not yet begun]
Use and State Quantity Price per ton
2010 2011 2012 2010 2011 2012
(million pounds) (million pounds) (million pounds) (dollars) (dollars) (dollars)
Canned California .............................. Maryland ............................... Michigan ............................... New York .............................. North Carolina ...................... Pennsylvania ........................ Virginia ................................. Washington .......................... West Virginia ........................ Other States
1 .......................
United States ........................ Juice and cider California .............................. Maryland ............................... Michigan ............................... New York .............................. North Carolina ...................... Ohio ...................................... Oregon ................................. Pennsylvania ........................ Virginia ................................. Washington .......................... West Virginia ........................ Other States
1 .......................
United States ........................
(D)
12.0 160.0 345.0 50.7
182.0 100.0 180.0 32.0
26.6
1,088.3
(D) 15.0 80.0
260.0 21.0
(D) 18.0 92.0 30.0
500.0 13.0
236.9
1,265.9
(D)
11.0 245.0 330.0 54.3
177.0 130.0 130.0 29.0
17.4
1,123.7
(D) 9.0
135.0 270.0 23.5 (D) 6.0
68.0 (D)
470.0 16.0
210.9
1,208.4
(D)
198.00 240.00 214.00 250.00 200.00 200.00 169.00 201.00
179.00
207.00
(D) 129.00 180.00 168.00 160.00
(D) 105.00 151.00 138.00 126.00 143.00
171.00
149.00
(D)
198.00 260.00 212.00 220.00 225.00 221.00 241.00 213.00
233.00
230.00
(D) 157.00 190.00 170.00 200.00
(D) 170.00 160.00
(D) 210.00 161.00
229.00
198.00
Frozen United States ........................ Dried United States ........................ Fresh slices United States ........................ Other
2
Maryland ............................... Michigan ............................... New York .............................. Other States
1 .......................
United States ........................
206.0
175.5
146.4
1.0 5.0 (D)
66.5
74.1
190.5
183.5
238.4
1.0 (D) (D)
70.0
71.0
198.00
143.00
377.00
68.00 280.00
(D)
246.00
241.00
246.00
214.00
357.00
78.00 (D) (D)
203.00
201.00
(D) Withheld to avoid disclosing data for individual operations. 1
Includes data withheld above and/or data for States not listed in this table. 2
Includes vinegar, wine, and slices for pie making.

22 Noncitrus Fruits and Nuts 2012 Preliminary Summary (January 2013) USDA, National Agricultural Statistics Service
Unutilized Apple Production – States and United States: 2010-2012
State Unharvested production Harvested not sold
2010 2011 2012 2010 2011 2012
(million pounds) (million pounds) (million pounds) (million pounds) (million pounds) (million pounds)
California .................................... Colorado ..................................... Connecticut ................................. Illinois .......................................... Indiana ........................................ Iowa ............................................ Maine .......................................... Maryland ..................................... Massachusetts ............................ Michigan ..................................... Minnesota ................................... Missouri ...................................... New Hampshire .......................... New Jersey ................................. New York .................................... North Carolina ............................. Ohio ............................................ Oregon ........................................ Pennsylvania .............................. Rhode Island ............................... Tennessee .................................. Utah ............................................ Vermont ...................................... West Virginia ............................... Wisconsin ................................... United States ..............................
- -
1.0 6.0 1.0 0.6 2.0 0.3 3.0
-
2.7 0.8 1.5 1.0
10.0 2.0 9.2
- 11.0 0.1
0.5 0.3 2.0 2.0 3.0
60.0
10.0 1.0 2.0 5.0 1.0 0.5 1.5 0.3 2.0 5.0
3.1 0.7 1.0 1.0
10.0 -
3.1 2.0 9.0 0.3
0.3 0.4 6.5 1.0
10.4
77.1
- 1.0 1.0 5.0
- 0.5 1.5
- 0.5
-
1.3 1.4 2.0 1.0
10.0 1.5 0.4 1.5 8.0 0.1
0.2 0.1 1.5 1.0 1.7
41.2
- - -
3.0 1.0 0.1
- 0.2
- -
0.5 0.2
- - - -
2.3 -
8.0 -
0.2 - -
1.0 2.1
18.6
- -
0.5 2.0 1.0 0.2 5.0 0.7 0.5
-
1.0 0.3
- - - -
4.1 0.5
10.0 -
- 0.3 0.5 1.0 2.3
29.9
- - -
2.0 - -
1.0 0.3
- -
0.5 0.6
- - - -
6.6 0.5
11.0 -
0.2 0.1
- -
0.5
23.3
- Represents zero.
Noncitrus Fruits and Nuts 2012 Preliminary Summary (January 2013) 23 USDA, National Agricultural Statistics Service
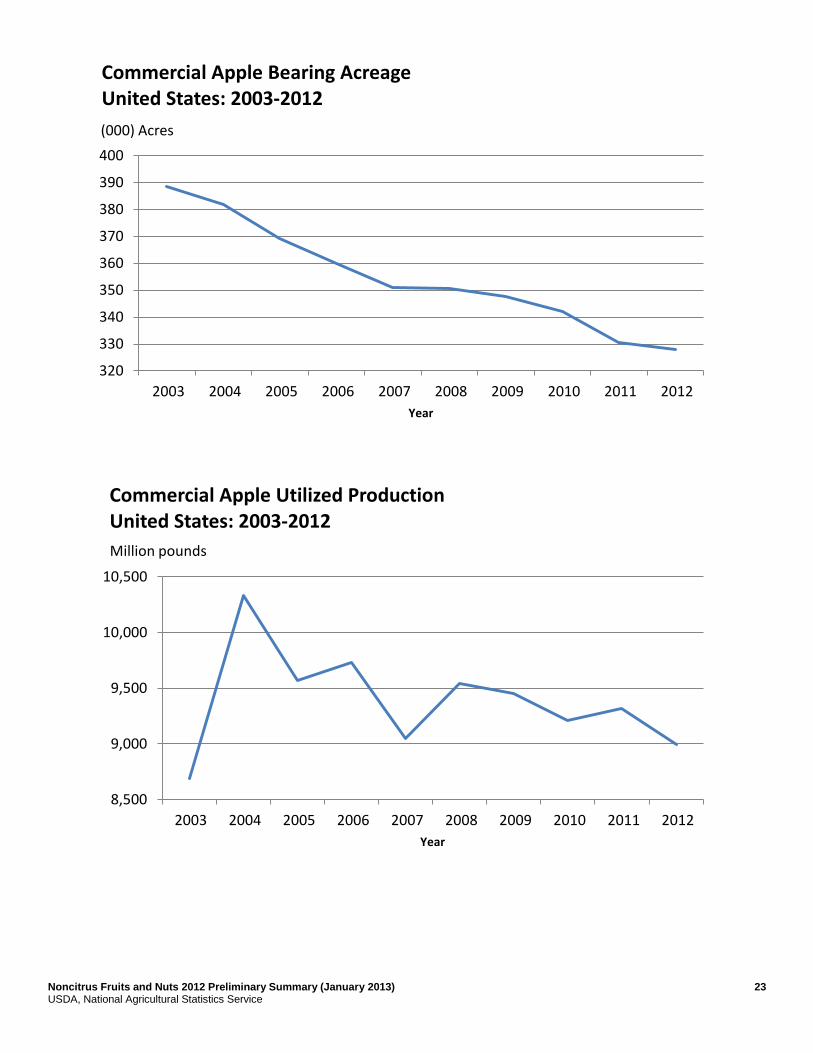
320
330
340
350
360
370
380
390
400
2003 2004 2005 2006 2007 2008 2009 2010 2011 2012
(000) Acres
Year
Commercial Apple Bearing Acreage United States: 2003-2012
8,500
9,000
9,500
10,000
10,500
2003 2004 2005 2006 2007 2008 2009 2010 2011 2012
Million pounds
Year
Commercial Apple Utilized Production United States: 2003-2012

24 Noncitrus Fruits and Nuts 2012 Preliminary Summary (January 2013) USDA, National Agricultural Statistics Service
Other Fruit Bearing Acreage, Yield, Production, Utilization, Price, and Value by Crop – States and United States: 2010-2012 [Blank cells indicate estimation period has not yet begun]
Crop, State, and season
Bearing acreage Yield per acre1
Production Utilization
Total Utilized Fresh Processed
(acres) (tons) (tons) (tons) (tons) (tons)
Apricots California 2010 .......................... 2011 .......................... 2012 .......................... Utah 2010 .......................... 2011 .......................... 2012 .......................... Washington 2010 .......................... 2011 .......................... 2012 .......................... United States 2010 .......................... 2011 .......................... 2012 .......................... Avocados
2
California 2010-2011 ................. 2011-2012 ................. 2012-2013 ................. Florida 2010-2011 ................. 2011-2012 ................. 2012-2013 ................. Hawaii 2010-2011 ................. 2011-2012 ................. 2012-2013 ................. United States 2010-2011 ................. 2011-2012 ................. 2012-2013 ................. Dates California 2010 .......................... 2011 .......................... 2012 ..........................
10,800 10,800 10,800
(D) (D) (D)
(D) (D) (D)
12,150 12,150 12,150
52,200 52,200
7,400 7,400
330 350
59,930 59,950
7,700 8,400 8,400
5.57 5.79 4.98
(D) (D) (D)
(D) (D) (D)
5.46 5.49 5.00
2.90 4.43
3.04 4.20
1.00 1.00
2.91 4.39
3.77 3.96 3.70
60,200 62,550 53,800
280 200 300
5,900 3,900 6,700
66,380 66,650 60,800
151,500 231,500
22,500 31,100
330 350
174,330 262,950
29,000 33,300 31,100
60,200 62,550 53,800
250 170 270
5,900 3,900 6,700
66,350 66,620 60,770
151,500 231,500
22,500 31,100
330 350
174,330 262,950
29,000 33,300 31,100
18,500 20,500 17,000
(D) (D) (D)
(D) (D) (D)
23,510 23,990 23,130
151,500 231,500
22,500 31,100
330 350
174,330 262,950
29,000 33,300 31,100
41,700 42,050 36,800
(D) (D) (D)
(D) (D) (D)
42,840 42,630 37,640
(NA) (NA)
(NA) (NA)
(NA) (NA)
(NA) (NA)
(NA) (NA) (NA)
See footnote(s) at end of table. --continued

Noncitrus Fruits and Nuts 2012 Preliminary Summary (January 2013) 25 USDA, National Agricultural Statistics Service
Other Fruit Bearing Acreage, Yield, Production, Utilization, Price, and Value by Crop – States and United States: 2010-2012 (continued) [Blank cells indicate estimation period has not yet begun]
Crop, State, and season
Price per ton Value of production
Fresh Processed All Fresh Processed Total
(dollars) (dollars) (dollars) (1,000 dollars) (1,000 dollars) (1,000 dollars)
Apricots 3
California 2010 ............................... 2011 ............................... 2012 ............................... Utah 2010 ............................... 2011 ............................... 2012 ............................... Washington 2010 ............................... 2011 ............................... 2012 ............................... United States 2010 ............................... 2011 ............................... 2012 ............................... Avocados
2
California 2010-2011 ...................... 2011-2012 ...................... 2012-2013 ...................... Florida 2010-2011 ...................... 2011-2012 ...................... 2012-2013 ...................... Hawaii 2010-2011 ...................... 2011-2012 ...................... 2012-2013 ...................... United States 2010-2011 ...................... 2011-2012 ...................... 2012-2013 ...................... Dates California 2010 ............................... 2011 ............................... 2012 ...............................
1,350.00 875.00
1,050.00
(D) (D) (D)
(D) (D) (D)
1,350.00 1,050.00 1,140.00
3,040.00 1,650.00
800.00 756.00
1,540.00 1,600.00
2,750.00 1,540.00
1,270.00 1,320.00 1,340.00
381.00 375.00 392.00
(D) (D) (D)
(D) (D) (D)
376.00 372.00 387.00
(X) (X)
(X) (X)
(X) (X)
(X) (X)
(X) (X) (X)
679.00 539.00 600.00
432.00
1,290.00 919.00
1,170.00 1,830.00 1,250.00
722.00 616.00 673.00
3,040.00 1,650.00
800.00 756.00
1,540.00 1,600.00
2,750.00 1,540.00
1,270.00 1,320.00 1,340.00
24,975 17,938 17,850
(D) (D) (D)
(D) (D) (D)
31,789 25,198 26,319
460,560 381,975
18,000 23,512
508 560
479,068 406,047
36,830 43,956 41,674
15,885 15,767 14,410
(D) (D) (D)
(D) (D) (D)
16,087 15,858 14,560
(X) (X)
(X) (X)
(X) (X)
(X) (X)
(X) (X) (X)
40,860 33,705 32,260
108 219 248
6,908 7,132 8,371
47,876 41,056 40,879
460,560 381,975
18,000 23,512
508 560
479,068 406,047
36,830 43,956 41,674
See footnote(s) at end of table. --continued

26 Noncitrus Fruits and Nuts 2012 Preliminary Summary (January 2013) USDA, National Agricultural Statistics Service
Other Fruit Bearing Acreage, Yield, Production, Utilization, Price, and Value by Crop – States and United States: 2010-2012 (continued)
Crop, State, and season
Bearing acreage Yield per acre 1
Production Utilization
Total Utilized Fresh Processed
(acres) (tons) (tons) (tons) (tons) (tons)
Figs 4
California 2010 ........................................... 2011 ........................................... 2012 ........................................... Kiwifruit California 2010 ........................................... 2011 ........................................... 2012 ........................................... Nectarines
5
California 2010 ........................................... 2011 ........................................... 2012 ........................................... Washington 2010 ........................................... 2011 ........................................... 2012 ........................................... United States 2010 ........................................... 2011 ........................................... 2012 ........................................... Olives California 2010 ........................................... 2011 ........................................... 2012 ........................................... Plums California 2010 ........................................... 2011 ........................................... 2012 ...........................................
8,600 8,600 8,600
4,200 4,200 4,200
28,000 26,500 25,000
1,300 1,400 1,400
29,300 27,900 26,400
36,000 41,500 44,000
26,200 25,500 25,000
4.76 4.50 4.50
7.79 8.98 7.05
8.04 8.15 7.20
6.31 6.57 6.36
7.96 8.07 7.16
5.72 1.72 3.64
5.39 6.27 4.60
40,910 38,660 38,660
32,700 37,700 29,600
225,000 216,000 180,000
8,200 9,200 8,900
233,200 225,200 188,900
206,000 71,200
160,000
141,300 160,000 115,000
40,910 38,660 38,660
32,500 36,700 27,100
225,000 216,000 180,000
8,200 9,200 8,900
233,200 225,200 188,900
206,000 71,200
160,000
141,300 160,000 115,000
3,960 3,960 3,960
29,800 33,300 26,600
225,000 216,000 180,000
8,200 9,200 8,900
233,200 225,200 188,900
(NA) (NA) (NA)
(D) (D) (D)
36,950 34,700 34,700
2,700 3,400
500
(NA) (NA) (NA)
(NA) (NA) (NA)
(NA) (NA) (NA)
206,000 71,200
160,000
(D) (D) (D)
See footnote(s) at end of table. --continued

Noncitrus Fruits and Nuts 2012 Preliminary Summary (January 2013) 27 USDA, National Agricultural Statistics Service
Other Fruit Bearing Acreage, Yield, Production, Utilization, Price, and Value by Crop – States and United States: 2010-2012 (continued) [Blank cells indicate estimation period has not yet begun]
Crop, State, and season
Price per ton Value of production
Fresh Processed All Fresh Processed Total
(dollars) (dollars) (dollars) (1,000 dollars) (1,000 dollars) (1,000 dollars)
Figs California 2010 ............................... 2011 ............................... 2012 ............................... Kiwifruit California 2010 ............................... 2011 ............................... 2012 ............................... Nectarines
5
California 2010 ............................... 2011 ............................... 2012 ............................... Washington 2010 ............................... 2011 ............................... 2012 ............................... United States 2010 ............................... 2011 ............................... 2012 ............................... Olives California 2010 ............................... 2011 ............................... 2012 ............................... Plums California 2010 ............................... 2011 ............................... 2012 ...............................
(D) (D)
(D) (D)
560.00 590.00 777.00
375.00 384.00 567.00
553.00 582.00 767.00
(X) (X) (X)
(D) (D) (D)
(D) (D)
(D) (D)
(X) (X) (X)
(X) (X) (X)
(X) (X) (X)
664.00 733.00 813.00
(D) (D) (D)
542.00 526.00
768.00 775.00
560.00 590.00 777.00
375.00 384.00 567.00
553.00 582.00 767.00
664.00 733.00 813.00
555.00 402.00 695.00
(D) (D)
(D) (D)
126,000 127,440 139,860
3,075 3,533 5,046
129,075 130,973 144,906
(X) (X) (X)
(D) (D) (D)
(D) (D)
(D) (D)
(X) (X) (X)
(X) (X) (X)
(X) (X) (X)
136,796 52,168
130,038
(D) (D) (D)
22,185 20,336
24,961 28,439
126,000 127,440 139,860
3,075 3,533 5,046
129,075 130,973 144,906
136,796 52,168
130,038
78,422 64,320 79,940
See footnote(s) at end of table. --continued

28 Noncitrus Fruits and Nuts 2012 Preliminary Summary (January 2013) USDA, National Agricultural Statistics Service
Other Fruit Bearing Acreage, Yield, Production, Utilization, Price, and Value by Crop – States and United States: 2010-2012 (continued)
Crop, State, and season
Bearing acreage Yield per acre 1
Production Utilization
Total Utilized Fresh Processed
(acres) (tons) (tons) (tons) (tons) (tons)
Prunes and plums Idaho 2010 ..................................... 2011 ..................................... 2012 ..................................... Michigan 2010 ..................................... 2011 ..................................... 2012 ..................................... Oregon 2010 ..................................... 2011 ..................................... 2012 ..................................... Washington 2010 ..................................... 2011 ..................................... 2012 ..................................... 4-State total 2010 ..................................... 2011 ..................................... 2012 ..................................... Prunes (dried basis) California 2010 ..................................... 2011 ..................................... 2012 .....................................
510 510 480
550 500 500
1,400 1,300 1,300
600 500 500
3,060 2,810 2,780
61,000 58,000 55,000
5.29 5.49 5.63
3.64 3.20 0.13
3.07 3.77 5.52
5.17 8.00 6.60
3.95 4.73 4.76
2.13 2.36 2.27
2,700 2,800 2,700
2,000 1,600
65
4,300 4,900 7,170
3,100 4,000 3,300
12,100 13,300 13,235
130,000 137,000 125,000
2,600 2,500 2,300
1,500 1,600
65
4,000 4,800 6,470
3,100 4,000 3,300
11,200 12,900 12,135
130,000 137,000 125,000
(D) (D) (D)
1,000
(D) (D)
2,800 1,700 3,220
(D) (D) (D)
7,700 7,030 7,330
- - -
(D) (D) (D)
500 (D) (D)
1,200 3,100 3,250
(D) (D) (D)
3,500 5,870 4,805
130,000 137,000 125,000
See footnote(s) at end of table. --continued

Noncitrus Fruits and Nuts 2012 Preliminary Summary (January 2013) 29 USDA, National Agricultural Statistics Service
Other Fruit Bearing Acreage, Yield, Production, Utilization, Price, and Value by Crop – States and United States: 2010-2012 (continued)
Crop, State, and season
Price per ton Value of production
Fresh Processed All Fresh Processed Total
(dollars) (dollars) (dollars) (1,000 dollars) (1,000 dollars) (1,000 dollars)
Prunes and plums Idaho 2010 ............................................ 2011 ............................................ 2012 ............................................ Michigan 2010 ............................................ 2011 ............................................ 2012 ............................................ Oregon 2010 ............................................ 2011 ............................................ 2012 ............................................ Washington 2010 ............................................ 2011 ............................................ 2012 ............................................ 4-State total 2010 ............................................ 2011 ............................................ 2012 ............................................ Prunes (dried basis) California 2010 ............................................ 2011 ............................................ 2012 ............................................
(D) (D) (D)
870.00
(D) (D)
498.00 441.00 813.00
(D) (D) (D)
551.00 482.00 745.00
(X) (X) (X)
(D) (D) (D)
180.00
(D) (D)
266.00 310.00 265.00
(D) (D) (D)
193.00 235.00 228.00
1,350.00 1,310.00 1,250.00
378.00 354.00 700.00
640.00 700.00 585.00
428.00 356.00 538.00
406.00 263.00 432.00
439.00 370.00 540.00
1,350.00 1,310.00 1,250.00
(D) (D) (D)
870 (D) (D)
1,394 750
2,618
(D) (D) (D)
4,240 3,389 5,458
(X) (X) (X)
(D) (D) (D)
90
(D) (D)
319 960 860
(D) (D) (D)
675 1,378 1,094
175,500 179,470 156,250
983 886
1,609
960 1,120
38
1,713 1,710 3,478
1,259 1,051 1,427
4,915 4,767 6,552
175,500 179,470 156,250
(D) Withheld to avoid disclosing data for individual operations. (X) Not applicable. 1
Yield is based on total production. 2
Estimates for 2012-2013 will be published on July 17, 2013. 3
Apricot processed price excludes dried. Processing value includes dried. 4
Small quantities of canned figs are included in fresh to avoid disclosure of individual operations. 5
Small quantities of processed nectarines are included in fresh to avoid disclosure of individual operations.

30 Noncitrus Fruits and Nuts 2012 Preliminary Summary (January 2013) USDA, National Agricultural Statistics Service
Other Unutilized Fruit Production by Crop – States and United States: 2010-2012
Crop and State Unharvested production Harvested not sold
2010 2011 2012 2010 2011 2012
Apricots Utah ................................................................. Kiwifruit California ......................................................... Prunes and plums Idaho ................................................................ Michigan .......................................................... Oregon ............................................................. United States ...................................................
10
-
- 470 150
620
20
-
300 -
100
400
10
-
400 -
700
1,100
20
200
100 30
150
280
10
1,000
- - -
-
20
2,500
- - -
-
- Represents zero.
Other Processed Fruit Utilization and Price by Crop and Use – States and United States: 2010-2012 [Blank cells indicate estimation period has not yet begun]
Crop, use, and State
Quantity Price per ton
2010 2011 2012 2010 2011 2012
(tons) (tons) (tons) (dollars) (dollars) (dollars)
Apricots (California) Canned ............................................................ Dried, fresh basis ............................................. Figs (California) Dried, fresh basis ............................................. Olives (California) Canned ............................................................ Crushed for Oil ................................................. Limited ............................................................. Undersized ....................................................... Prunes and plums
1
Canned ............................................................ Frozen ............................................................. Dried and Other ...............................................
20,100 10,000
36,950
125,000 36,000 37,000 8,000
1,395 455
1,650
17,150 12,000
34,700
26,500 42,000 2,200
500
1,460 560
3,850
16,500 9,500
34,700
78,500 74,000 6,400 1,100
755 550
3,500
390.00 400.00
406.00
862.00 532.00 270.00 -12.00
209.00 251.00 163.00
330.00 410.00
411.00
1,060.00 556.00 333.00 -13.00
203.00 280.00 240.00
419.00 315.00
1,110.00 550.00 346.00 -10.00
234.00 265.00 220.00
1 Idaho, Michigan, Oregon, and Washington.

Noncitrus Fruits and Nuts 2012 Preliminary Summary (January 2013) 31 USDA, National Agricultural Statistics Service
Olive Production by Variety – California: 2010-2012
Variety 2010 2011 2012
(tons) (tons) (tons)
Manzanillo ................................................. Sevillano .................................................... All other
1 ...................................................
Total ..........................................................
148,000 27,000 31,000
206,000
23,000 7,500
40,700
71,200
71,200 22,900 65,900
160,000
1 Includes production for varieties that were or will be used for canned, oil, and other specialty products.
Dry Fruit Production and Price by Use – California: 2010-2012 [Blank cells indicate estimation period has not yet begun]
Crop Quantity Price per ton
2010 2011 2012 2010 2011 2012
(tons) (tons) (tons) (dollars) (dollars) (dollars)
Fresh basis Apricots ............................................. Figs ................................................... Grapes Raisin ............................................ Table ............................................. Peaches Freestone ...................................... Prunes ............................................... Dried basis Apricots ............................................. Figs ................................................... Standard ........................................ Substandard .................................. Grapes Raisin
1 ..........................................
Table ............................................. Peaches Freestone ...................................... Prunes ...............................................
10,000 36,950
1,719,000
58,000
12,700 390,000
1,400 12,320 10,900 1,420
382,000 12,800
2,010
130,000
12,000 34,700
1,761,000
46,000
4,600 444,000
1,810 11,560 10,140 1,420
374,600
9,700
470 137,000
9,500
34,700
1,508,000 56,000
9,800
395,000
1,210 11,560 10,140 1,420
320,900 11,800
1,230
125,000
400.00 406.00
336.00 289.00
44.00
450.00
2,860.00 1,220.00 1,370.00
60.00
1,510.00 1,310.00
278.00
1,350.00
410.00 411.00
353.00 306.00
42.00
404.00
2,720.00 1,230.00 1,400.00
60.00
1,660.00 1,450.00
411.00
1,310.00
315.00
413.00 358.00
41.00
396.00
2,470.00
1,940.00 1,700.00
327.00
1,250.00 1 Includes substandard raisins diverted to other uses.
Fresh Basis Equivalents for Selected Dry Fruits – California: 2010-2012 [Based on 1 ton dry basis equivalent]
Crop 2010 2011 2012
(tons) (tons) (tons)
Apricots .................................................... Figs ........................................................... Grapes Raisin ........................................................ Table ......................................................... Peaches Freestone .................................................. Prunes ......................................................
7.14
3.00
4.50 4.53
6.32
3.00
6.63
3.00
4.70 4.74
9.79
3.24
7.85
3.00
4.70 4.75
7.97
3.16

32 Noncitrus Fruits and Nuts 2012 Preliminary Summary (January 2013) USDA, National Agricultural Statistics Service
Strawberry Area Planted, Harvested, Yield, Production, Price, and Value – States and United States: 2010-2012
State Area planted Area harvested
2010 2011 2012 2010 2011 2012
(acres) (acres) (acres) (acres) (acres) (acres)
California .............................. Florida ................................... Michigan ............................... New York .............................. North Carolina ....................... Ohio ...................................... Oregon .................................. Pennsylvania ........................ Washington ........................... Wisconsin ............................. United States ........................
38,600 8,800
950 1,600 1,600 1,100 2,100 1,100 1,500
820
58,170
38,000 9,900
850 1,600 1,600 1,100 2,200
990 1,500
820
58,560
38,500 8,900
750 1,600 1,600
740 2,200
920 1,500
720
57,430
38,600 8,800
750 1,400 1,500
730 1,900 1,100 1,500
710
56,990
38,000 9,900
700 1,400 1,500
730 2,000
990 1,500
700
57,420
38,500 8,700
650 1,400 1,500
660 2,000
820 1,300
610
56,140
State Yield per acre Production
2010 2011 2012 2010 2011 2012
(cwt) (cwt) (cwt) (1,000 cwt) (1,000 cwt) (1,000 cwt)
California .............................. Florida ................................... Michigan ............................... New York .............................. North Carolina ....................... Ohio ...................................... Oregon .................................. Pennsylvania ........................ Washington ........................... Wisconsin ............................. United States ........................
670 220 39 25
120 48
125 51 83 58
501
680 250 44 26
130 36
115 40 83 57
506
720 210 51 23
135 42
105 51 79 51
537
25,859 1,936
29 35
180 35
236 56
125 41
28,532
25,846 2,475
31 36
195 26
226 40
125 40
29,040
27,637 1,827
33 32
203 28
213 42
103 31
30,149
State Price per cwt Value of production
2010 2011 2012 2010 2011 2012
(dollars) (dollars) (dollars) (1,000 dollars) (1,000 dollars) (1,000 dollars)
California .............................. Florida ................................... Michigan ............................... New York .............................. North Carolina ....................... Ohio ...................................... Oregon .................................. Pennsylvania ........................ Washington ........................... Wisconsin ............................. United States ........................
70.10 187.00 141.00 197.00 135.00 272.00 69.00
207.00 61.10
157.00
79.30
75.20 148.00 146.00 235.00 140.00 210.00 66.50
212.00 71.80
161.00
82.50
76.80 110.00 146.00 215.00 145.00 168.00 71.30
164.00 100.00 151.00
79.80
1,813,557 362,032
4,089 6,895
24,300 9,520
16,291 11,592 7,640 6,437
2,262,353
1,943,757 366,300
4,522 8,460
27,300 5,460
15,034 8,480 8,971 6,440
2,394,724
2,121,574 200,970
4,826 6,880
29,435 4,704
15,189 6,888
10,331 4,681
2,405,478

Noncitrus Fruits and Nuts 2012 Preliminary Summary (January 2013) 33 USDA, National Agricultural Statistics Service
Strawberry Utilization, Price, and Value by Utilization – States and United States: 2010-2012
Utilization and State Production
2010 2011 2012
(1,000 cwt) (1,000 cwt) (1,000 cwt)
Fresh market California ............................................. Florida ................................................. Michigan .............................................. New York ............................................. North Carolina ..................................... Ohio ..................................................... Oregon ................................................ Pennsylvania ....................................... Washington ......................................... Wisconsin ............................................ United States ....................................... Processing California ............................................. Michigan .............................................. Oregon ................................................ Washington ......................................... United States .......................................
20,851 1,936
27 35
180 35 37 56 10 41
23,208
5,008 2
199 115
5,324
20,462 2,475
29 36
195 26 28 40 17 40
23,348
5,384 2
198 108
5,692
21,936 1,827
32 32
203 28 35 42 24 31
24,190
5,701 1
178 79
5,959
Utilization and State Price per unit Value of production
2010 2011 2012 2010 2011 2012
(dollars per cwt) (dollars per cwt) (dollars per cwt) (1,000 dollars) (1,000 dollars) (1,000 dollars)
Fresh market California ............................................. Florida ................................................. Michigan .............................................. New York ............................................. North Carolina ..................................... Ohio ..................................................... Oregon ................................................ Pennsylvania ....................................... Washington ......................................... Wisconsin ............................................ United States ....................................... Processing California ............................................. Michigan .............................................. Oregon ................................................ Washington ......................................... United States .......................................
80.30
187.00 147.00 197.00 135.00 272.00 166.00 207.00 189.00 157.00
90.80
27.80 60.00 51.00 50.00
29.20
86.10
148.00 152.00 235.00 140.00 210.00 148.00 212.00 231.00 161.00
94.10
33.80 57.00 55.00 46.70
34.80
88.40
110.00 149.00 215.00 145.00 168.00 139.00 164.00 177.00 151.00
91.20
32.00 58.00 58.00 77.00
33.40
1,674,335
362,032 3,969 6,895
24,300 9,520 6,142
11,592 1,890 6,437
2,107,112
139,222 120
10,149 5,750
155,241
1,761,778
366,300 4,408 8,460
27,300 5,460 4,144 8,480 3,927 6,440
2,196,697
181,979 114
10,890 5,044
198,027
1,939,142
200,970 4,768 6,880
29,435 4,704 4,865 6,888 4,248 4,681
2,206,581
182,432 58
10,324 6,083
198,897

34 Noncitrus Fruits and Nuts 2012 Preliminary Summary (January 2013) USDA, National Agricultural Statistics Service
Berry Area Harvested, Yield, Production, Utilization, Price, and Value by Crop – States and United States: 2010-2012
Crop, State, and year
Area harvested Yield per acre 1
Production Utilization
Total Utilized Fresh Processed
(acres) (pounds) (1,000 pounds) (1,000 pounds) (1,000 pounds) (1,000 pounds)
Cultivated blueberries Alabama
2
2010 ......................................... 2011 ......................................... 2012 ......................................... Arkansas
2
2010 ......................................... 2011 ......................................... 2012 ......................................... California
2
2010 ......................................... 2011 ......................................... 2012 ......................................... Florida
2
2010 ......................................... 2011 ......................................... 2012 ......................................... Georgia 2010 ......................................... 2011 ......................................... 2012 ......................................... Indiana 2010 ......................................... 2011 ......................................... 2012 ......................................... Michigan 2010 ......................................... 2011 ......................................... 2012 ......................................... Mississippi 2010 ......................................... 2011 ......................................... 2012 ......................................... New Jersey 2010 ......................................... 2011 ......................................... 2012 ......................................... New York
2
2010 ......................................... 2011 ......................................... 2012 ......................................... North Carolina 2010 ......................................... 2011 ......................................... 2012 ......................................... Oregon 2010 ......................................... 2011 ......................................... 2012 ......................................... Washington 2010 ......................................... 2011 ......................................... 2012 ......................................... United States 2010 ......................................... 2011 ......................................... 2012 .........................................
340 400 450
300 250 250
3,900 4,300 4,700
3,500 3,800 4,500
13,000 12,000 15,000
670 650 400
18,600 19,200 19,700
2,700 2,700 2,700
7,500 7,700 7,500
900 900 900
5,500 5,800 5,700
7,500 7,800 7,900
5,200 7,000 8,000
69,610 72,500 77,700
1,260 1,250 1,560
2,170 1,600 1,600
7,180 9,790 8,700
4,690 5,630 3,800
4,460 5,170 4,670
5,370 2,460 3,750
5,860 3,750 4,420
2,960 3,890 3,330
6,530 8,050 6,870
2,330 2,000 1,890
7,100 6,240 7,020
7,280 8,400 9,110
8,080 8,710 8,750
5,900 6,030 5,940
550 700 850
740 500 500
28,000 42,100 40,900
17,670 23,400 18,100
62,000 65,000 77,000
3,600 1,600 1,500
109,000 72,000 87,000
8,000
10,500 9,000
49,000 62,000 54,000
2,300 1,900 2,000
39,050 37,000 40,500
54,600 65,500 72,000
42,000 61,000 70,000
416,510 443,200 473,350
430 500 700
650 400 400
28,000 42,100 40,900
16,400 21,400 17,100
58,000 62,000 70,000
3,600 1,600 1,500
109,000 72,000 87,000
8,000
10,500 9,000
49,000 62,000 51,500
2,100 1,800 1,700
39,050 36,200 40,000
54,600 65,500 72,000
42,000 61,000 70,000
410,830 437,000 461,800
430 500 700
650 400 400
28,000 42,100 40,900
16,400 21,400 17,100
36,000 39,000 37,000
2,000 1,300 1,000
49,000 34,000 33,000
3,000 4,000 3,500
42,000 47,000 43,000
2,100 1,800 1,700
27,350 28,600 30,000
27,300 36,700 37,500
12,200 30,500 35,000
246,430 287,300 280,800
- - -
- - -
- - -
- - -
22,000 23,000 33,000
1,600
300 500
60,000 38,000 54,000
5,000 6,500 5,500
7,000 15,000 8,500
- - -
11,700 7,600
10,000
27,300 28,800 34,500
29,800 30,500 35,000
164,400 149,700 181,000
See footnote(s) at end of table. --continued

Noncitrus Fruits and Nuts 2012 Preliminary Summary (January 2013) 35 USDA, National Agricultural Statistics Service
Berry Area Harvested, Yield, Production, Utilization, Price, and Value by Crop – States and United States: 2010-2012 (continued)
Crop, State, and year
Price per pound Value of production
Fresh Processed All Fresh Processed Total
(dollars) (dollars) (dollars) (1,000 dollars) (1,000 dollars) (1,000 dollars)
Cultivated blueberries Alabama
2
2010 ................................................ 2011 ................................................ 2012 ................................................ Arkansas
2
2010 ................................................ 2011 ................................................ 2012 ................................................ California
2
2010 ................................................ 2011 ................................................ 2012 ................................................ Florida
2
2010 ................................................ 2011 ................................................ 2012 ................................................ Georgia 2010 ................................................ 2011 ................................................ 2012 ................................................ Indiana 2010 ................................................ 2011 ................................................ 2012 ................................................ Michigan 2010 ................................................ 2011 ................................................ 2012 ................................................ Mississippi 2010 ................................................ 2011 ................................................ 2012 ................................................ New Jersey 2010 ................................................ 2011 ................................................ 2012 ................................................ New York
2
2010 ................................................ 2011 ................................................ 2012 ................................................ North Carolina 2010 ................................................ 2011 ................................................ 2012 ................................................ Oregon 2010 ................................................ 2011 ................................................ 2012 ................................................ Washington 2010 ................................................ 2011 ................................................ 2012 ................................................ United States 2010 ................................................ 2011 ................................................ 2012 ................................................
1.760 1.700 2.120
1.780 1.730 1.650
2.710 2.410 3.270
2.880 3.230 3.630
1.710 1.850 2.000
1.640 1.950 2.320
1.700 2.150 2.000
1.600 2.000 2.400
1.340 1.600 1.640
2.150 2.200 2.290
1.870 2.000 2.100
1.460 1.990 2.040
2.380 2.560 1.490
1.860 2.140 2.190
(X) (X) (X)
(X) (X) (X)
(X) (X) (X)
(X) (X) (X)
0.720 0.920 0.610
0.620 1.150 1.000
0.850 1.200 1.050
0.800 1.350 1.300
0.890 1.300 1.210
(X) (X) (X)
0.600 1.200 0.800
0.870 1.520 0.900
0.860 1.440 0.950
0.818 1.280 0.923
1.760 1.700 2.120
1.780 1.730 1.650
2.710 2.410 3.270
2.880 3.230 3.630
1.330 1.510 1.340
1.190 1.800 1.880
1.230 1.650 1.410
1.100 1.600 1.730
1.280 1.530 1.570
2.150 2.200 2.290
1.490 1.830 1.780
1.170 1.780 1.490
1.300 2.000 1.220
1.440 1.850 1.690
757 850
1,484
1,157 692 660
75,980 101,461 133,743
47,272 69,122 62,073
61,560 72,150 74,000
3,280 2,535 2,320
83,300 73,100 66,000
4,800 8,000 8,400
56,280 75,200 70,520
4,521 3,957 3,893
51,145 57,200 63,000
39,858 73,033 76,500
29,036 78,080 52,150
458,946 615,380 614,743
(X) (X) (X)
(X) (X) (X)
(X) (X) (X)
(X) (X) (X)
15,840 21,160 20,130
992 345 500
51,000 45,600 56,700
4,000 8,775 7,150
6,230 19,500 10,285
(X) (X) (X)
7,020 9,120 8,000
23,751 43,776 31,050
25,628 43,920 33,250
134,461 192,196 167,065
757 850
1,484
1,157 692 660
75,980 101,461 133,743
47,272 69,122 62,073
77,400 93,310 94,130
4,272 2,880 2,820
134,300 118,700 122,700
8,800
16,775 15,550
62,510 94,700 80,805
4,521 3,957 3,893
58,165 66,320 71,000
63,609
116,809 107,550
54,664 122,000 85,400
593,407 807,576 781,808
See footnote(s) at end of table. --continued

36 Noncitrus Fruits and Nuts 2012 Preliminary Summary (January 2013) USDA, National Agricultural Statistics Service
Berry Area Harvested, Yield, Production, Utilization, Price, and Value by Crop – States and United States: 2010-2012 (continued)
Crop, State, and year
Area harvested Yield per acre 1
Production Utilization
Total Utilized Fresh Processed
(acres) (pounds) (1,000 pounds) (1,000 pounds) (1,000 pounds) (1,000 pounds)
Wild blueberries Maine 2010 ......................................... 2011 ......................................... 2012 ......................................... Boysenberries Oregon 2010 ......................................... 2011 ......................................... 2012 ......................................... Black raspberries Oregon 2010 ......................................... 2011 ......................................... 2012 ......................................... Red raspberries Oregon 2010 ......................................... 2011 ......................................... 2012 ......................................... Washington 2010 ......................................... 2011 ......................................... 2012 ......................................... United States 2010 ......................................... 2011 ......................................... 2012 ......................................... All raspberries California 2010 ......................................... 2011 ......................................... 2012 .........................................
(X) (X) (X)
500 500 400
1,300 1,100
900
1,300 1,200 1,200
9,600 9,800 9,800
10,900 11,000 11,000
5,400 5,400 5,400
(X) (X) (X)
4,200 5,200 4,880
1,340 2,030 2,390
3,940 5,000 5,500
6,360 7,380 6,400
6,070 7,120 6,300
15,000 20,000 18,000
83,000 79,900 91,100
2,100 2,625 1,950
1,750 2,230 2,150
5,120 6,000 6,600
61,010 72,300 62,700
66,130 78,300 69,300
81,000 108,000 97,200
83,000 79,900 91,100
2,100 2,600 1,950
1,740 2,230 2,150
5,120 6,000 6,600
61,010 72,300 62,700
66,130 78,300 69,300
81,000 108,000 97,200
500 600 500
200 100 50
140 30 50
1,020 1,000
800
610 400 450
1,630 1,400 1,250
(D) (D) (D)
82,500 79,300 90,600
1,900 2,500 1,900
1,600 2,200 2,100
4,100 5,000 5,800
60,400 71,900 62,250
64,500 76,900 68,050
(D) (D) (D)
See footnote(s) at end of table. --continued

Noncitrus Fruits and Nuts 2012 Preliminary Summary (January 2013) 37 USDA, National Agricultural Statistics Service
Berry Area Harvested, Yield, Production, Utilization, Price, and Value by Crop – States and United States: 2010-2012 (continued)
Crop, State, and year
Price per pound Value of production
Fresh Processed All Fresh Processed Total
(dollars) (dollars) (dollars) (1,000 dollars) (1,000 dollars) (1,000 dollars)
Wild blueberries Maine 2010 ................................................ 2011 ................................................ 2012 ................................................ Boysenberries Oregon 2010 ................................................ 2011 ................................................ 2012 ................................................ Black raspberries Oregon 2010 ................................................ 2011 ................................................ 2012 ................................................ Red raspberries Oregon 2010 ................................................ 2011 ................................................ 2012 ................................................ Washington 2010 ................................................ 2011 ................................................ 2012 ................................................ United States 2010 ................................................ 2011 ................................................ 2012 ................................................ All raspberries California 2010 ................................................ 2011 ................................................ 2012 ................................................
2.200 2.200 2.250
1.000 1.880 1.730
1.320 2.540 2.480
1.830 1.800 1.780
1.190 2.990 2.540
1.590 2.140 2.050
(D) (D) (D)
0.600 0.900 0.750
0.860 0.980 1.030
1.250 2.470 2.650
1.050 0.920 0.900
0.820 0.600 0.590
0.835 0.621 0.616
(D) (D) (D)
0.610 0.910 0.758
0.873 1.010 1.050
1.260 2.470 2.650
1.210 1.070 1.010
0.824 0.613 0.604
0.853 0.648 0.642
2.470 2.070 2.470
1,100 1,320 1,125
200 188 87
185 76
124
1,867 1,800 1,424
726
1,196 1,143
2,593 2,996 2,567
(D) (D) (D)
49,500 71,370 67,950
1,634 2,450 1,957
2,000 5,434 5,565
4,305 4,600 5,220
49,528 43,140 36,728
53,833 47,740 41,948
(D) (D) (D)
50,600 72,690 69,075
1,834 2,638 2,044
2,185 5,510 5,689
6,172 6,400 6,644
50,254 44,336 37,871
56,426 50,736 44,515
200,288 223,200 239,820
(D) Withheld to avoid disclosing data for individual operations. (X) Not applicable. 1
Yield is based on utilized production. 2
Small quantities of processed blueberries are included in fresh to avoid disclosure of individual operations.

38 Noncitrus Fruits and Nuts 2012 Preliminary Summary (January 2013) USDA, National Agricultural Statistics Service
Unutilized Berry Production – States and United States: 2010-2012
Crop and State Unharvested production Harvested not sold
2010 2011 2012 2010 2011 2012
(1,000 pounds) (1,000 pounds) (1,000 pounds) (1,000 pounds) (1,000 pounds) (1,000 pounds)
Black raspberries Oregon ................................................ Cultivated blueberries Alabama ............................................. Arkansas ............................................. Florida ................................................. Georgia ............................................... New Jersey ......................................... New York ............................................ North Carolina ..................................... United States ...................................... Boysenberries Oregon ................................................
10
110 90
970 4,000
- 100
-
5,270
-
-
180 10
1,200 3,000
- 100 800
5,290
25
-
120 10
500 6,000 2,500
300 500
9,930
-
-
10 -
300 - -
100 -
410
-
-
20 90
800 - - - -
910
-
-
30 90
500 1,000
- - -
1,620
-
- Represents zero.

Noncitrus Fruits and Nuts 2012 Preliminary Summary (January 2013) 39 USDA, National Agricultural Statistics Service
Blackberry Area Harvested, Yield, Production, Utilization, Price, and Value by Variety – Oregon: 2010-2012
Variety and year Area harvested Yield per acre 1
Production Utilization
Total Utilized Fresh Processed
(acres) (pounds) (1,000
pounds) (1,000
pounds) (1,000
pounds) (1,000
pounds)
Cultivated blackberries Marion 2010 .......................................................... 2011 .......................................................... 2012 .......................................................... Evergreen 2010 .......................................................... 2011 .......................................................... 2012 .......................................................... Other 2010 .......................................................... 2011 .......................................................... 2012 .......................................................... All 2010 .......................................................... 2011 .......................................................... 2012 ..........................................................
3,900 4,000 3,500
500 400 500
3,100 2,900 2,800
7,500 7,300 6,800
4,790 6,730 7,270
8,920 7,200 8,240
6,610 7,900 8,550
5,820 7,220 7,870
19,700 27,100 25,460
4,460 2,880 4,120
21,010 22,900 23,940
45,170 52,880 53,520
18,700 26,900 25,460
4,460 2,880 4,120
20,500 22,900 23,940
43,660 52,680 53,520
600 900 260
60 30 20
3,500 3,100 2,640
4,160 4,030 2,920
18,100 26,000 25,200
4,400 2,850 4,100
17,000 19,800 21,300
39,500 48,650 50,600
Variety and year Price per pound Value of production
Fresh Processed All Fresh Processed Total
(dollars) (dollars) (dollars) (1,000 dollars)
(1,000 dollars)
(1,000 dollars)
Cultivated blackberries Marion 2010 .......................................................... 2011 .......................................................... 2012 .......................................................... Evergreen 2010 .......................................................... 2011 .......................................................... 2012 .......................................................... Other 2010 .......................................................... 2011 .......................................................... 2012 .......................................................... All 2010 .......................................................... 2011 .......................................................... 2012 ..........................................................
1.270 1.210 1.130
1.400 1.500 1.300
1.740 1.660 2.210
1.670 1.560 2.110
0.690 0.780 0.800
0.640 0.690 0.700
0.650 0.720 0.720
0.667 0.750 0.758
0.709 0.794 0.803
0.650 0.699 0.703
0.836 0.847 0.884
0.763 0.812 0.832
762 1,089
294
84 45 26
6,090 5,146 5,834
6,936 6,280 6,154
12,489 20,280 20,160
2,816 1,967 2,870
11,050 14,256 15,336
26,355 36,503 38,366
13,251 21,369 20,454
2,900 2,012 2,896
17,140 19,402 21,170
33,291 42,783 44,520
1 Yield is based on utilized production.
Unutilized Cultivated Blackberry Production by Variety – States and United States: 2010-2012
Variety Unharvested production Harvested not sold
2010 2011 2012 2010 2011 2012
(1,000 pounds) (1,000 pounds) (1,000 pounds) (1,000 pounds) (1,000 pounds) (1,000 pounds)
Cultivated blackberries ........................................ Marion .................................................................... Other ......................................................................
1,510 1,000
510
200 200
-
- - -
- - -
- - -
- - -
- Represents zero.

40 Noncitrus Fruits and Nuts 2012 Preliminary Summary (January 2013) USDA, National Agricultural Statistics Service
Sweet Cherry Bearing Acreage, Yield, Production, Utilization, Price, and Value – States and United States: 2010-2012 [Blank cells indicate estimation period has not yet begun]
State and year Bearing acreage Yield per acre 1
Production Utilization
Total Utilized Fresh Processed
(acres) (tons) (tons) (tons) (tons) (tons)
California 2010 ..................... 2011 ..................... 2012 ..................... Idaho 2010 ..................... 2011 ..................... 2012 ..................... Michigan 2010 ..................... 2011 ..................... 2012 ..................... Montana 2010 ..................... 2011 ..................... 2012 ..................... New York 2010 ..................... 2011 ..................... 2012 ..................... Oregon 2010 ..................... 2011 ..................... 2012 ..................... Utah 2010 ..................... 2011 ..................... 2012 ..................... Washington 2010 ..................... 2011 ..................... 2012 ..................... Other States 2010 ..................... 2011 ..................... 2012 ..................... United States 2010 ..................... 2011 ..................... 2012 .....................
29,000 30,000 31,000
900 900 900
6,700 6,500 6,500
730 720 690
700 700 700
12,500 12,500 12,500
500 500 500
34,000 34,000 34,000
(X) (X) (X)
85,030 85,820 86,790
3.34 2.27 2.98
2.11 3.11 4.00
2.25 2.86 0.65
3.38 2.80 3.26
1.43 1.00 0.43
3.09 3.64 4.48
2.20 1.60 2.60
4.59 5.76 7.76
(X) (X) (X)
3.68 3.90 4.89
97,000 68,000 92,300
1,900 2,800 3,600
15,100 18,600 4,250
2,470 2,015 2,250
1,000 700 300
38,650 45,500 56,000
1,100 800
1,300
156,000 196,000 264,000
(X) (X) (X)
313,220 334,415 424,000
94,000 66,000 89,300
1,800 2,800 3,300
14,400 18,600 4,250
2,050 1,650 1,395
800 670 290
37,500 43,800 54,600
1,080 770
1,280
156,000 196,000 264,000
(X) (X) (X)
307,630 330,290 418,415
83,000 57,000 78,000
(D) (D) (D)
1,100 2,200
120
(D) (D) (D)
(D) (D) (D)
25,500 29,600 39,500
650 330 700
130,000 165,000 210,000
4,090 4,790 4,235
244,340 258,920 332,555
11,000 9,000
11,300
(D) (D) (D)
13,300 16,400 4,130
(D) (D) (D)
(D) (D) (D)
12,000 14,200 15,100
430 440 580
26,000 31,000 54,000
560 330 750
63,290 71,370 85,860
See footnote(s) at end of table. --continued

Noncitrus Fruits and Nuts 2012 Preliminary Summary (January 2013) 41 USDA, National Agricultural Statistics Service
Sweet Cherry Bearing Acreage, Yield, Production, Utilization, Price, and Value – States and United States: 2010-2012 (continued) [Blank cells indicate estimation period has not yet begun]
State and year Price per ton Value of production
Fresh Processed All Fresh Processed All
(dollars) (dollars) (dollars) (1,000 dollars) (1,000 dollars) (1,000 dollars)
California 2010 .......................... 2011 .......................... 2012 .......................... Idaho 2010 .......................... 2011 .......................... 2012 .......................... Michigan 2010 .......................... 2011 .......................... 2012 .......................... Montana 2010 .......................... 2011 .......................... 2012 .......................... New York 2010 .......................... 2011 .......................... 2012 .......................... Oregon 2010 .......................... 2011 .......................... 2012 .......................... Utah 2010 .......................... 2011 .......................... 2012 .......................... Washington 2010 .......................... 2011 .......................... 2012 .......................... Other States 2010 .......................... 2011 .......................... 2012 .......................... United States 2010 .......................... 2011 .......................... 2012 ..........................
3,090.00 3,430.00 3,270.00
(D) (D) (D)
2,290.00 2,410.00 4,280.00
(D) (D) (D)
(D) (D) (D)
2,392.00 2,240.00 1,517.00
1,860.00 2,760.00 2,300.00
2,720.00 3,120.00 2,140.00
2,480.00 2,790.00 2,710.00
2,800.00 3,080.00 2,340.00
204.00 193.00 240.00
(D) (D) (D)
545.00 777.00
1,360.00
(D) (D) (D)
(D) (D) (D)
899.00 800.00 972.00
521.00 502.00 421.00
388.00 393.00 773.00
241.00 412.00 429.00
486.00 538.00 761.00
2,750.00 2,990.00 2,890.00
2,230.00 2,620.00 2,640.00
678.00 970.00
1,440.00
1,960.00 2,470.00 1,450.00
2,820.00 3,140.00 3,700.00
1,910.00 1,770.00 1,370.00
1,330.00 1,470.00 1,450.00
2,330.00 2,690.00 1,860.00
(X) (X) (X)
2,330.00 2,530.00 2,020.00
256,470 195,510 255,060
(D) (D) (D)
2,519 5,302
514
(D) (D) (D)
(D) (D) (D)
60,996 66,304 59,922
1,209 911
1,610
353,600 514,800 449,400
10,157 13,375 11,476
684,951 796,202 777,982
2,245 1,740 2,712
(D) (D) (D)
7,246 12,740 5,619
(D) (D) (D)
(D) (D) (D)
10,790 11,360 14,684
224 221 244
10,093 12,186 41,748
135 136 322
30,733 38,383 65,329
258,715 197,250 257,772
4,011 7,337 8,706
9,765 18,042 6,133
4,026 4,068 2,019
2,255 2,106 1,073
71,786 77,664 74,606
1,433 1,132 1,854
363,693 526,986 491,148
(X) (X) (X)
715,684 834,585 843,311
(D) Withheld to avoid disclosing data for individual operations. (X) Not applicable. 1
Yield is based on total production.
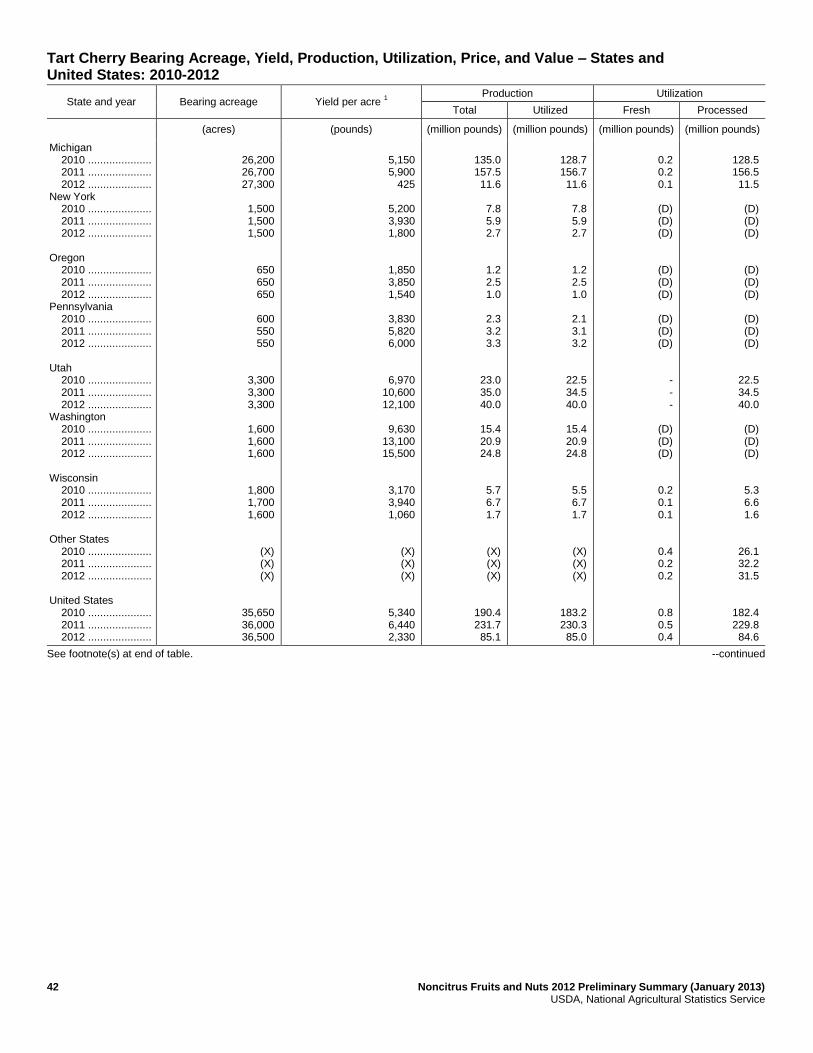
42 Noncitrus Fruits and Nuts 2012 Preliminary Summary (January 2013) USDA, National Agricultural Statistics Service
Tart Cherry Bearing Acreage, Yield, Production, Utilization, Price, and Value – States and United States: 2010-2012
State and year Bearing acreage Yield per acre 1
Production Utilization
Total Utilized Fresh Processed
(acres) (pounds) (million pounds) (million pounds) (million pounds) (million pounds)
Michigan 2010 ..................... 2011 ..................... 2012 ..................... New York 2010 ..................... 2011 ..................... 2012 ..................... Oregon 2010 ..................... 2011 ..................... 2012 ..................... Pennsylvania 2010 ..................... 2011 ..................... 2012 ..................... Utah 2010 ..................... 2011 ..................... 2012 ..................... Washington 2010 ..................... 2011 ..................... 2012 ..................... Wisconsin 2010 ..................... 2011 ..................... 2012 ..................... Other States 2010 ..................... 2011 ..................... 2012 ..................... United States 2010 ..................... 2011 ..................... 2012 .....................
26,200 26,700 27,300
1,500 1,500 1,500
650 650 650
600 550 550
3,300 3,300 3,300
1,600 1,600 1,600
1,800 1,700 1,600
(X) (X) (X)
35,650 36,000 36,500
5,150 5,900
425
5,200 3,930 1,800
1,850 3,850 1,540
3,830 5,820 6,000
6,970 10,600 12,100
9,630
13,100 15,500
3,170 3,940 1,060
(X) (X) (X)
5,340 6,440 2,330
135.0 157.5 11.6
7.8 5.9 2.7
1.2 2.5 1.0
2.3 3.2 3.3
23.0 35.0 40.0
15.4 20.9 24.8
5.7 6.7 1.7
(X) (X) (X)
190.4 231.7 85.1
128.7 156.7 11.6
7.8 5.9 2.7
1.2 2.5 1.0
2.1 3.1 3.2
22.5 34.5 40.0
15.4 20.9 24.8
5.5 6.7 1.7
(X) (X) (X)
183.2 230.3 85.0
0.2 0.2 0.1
(D) (D) (D)
(D) (D) (D)
(D) (D) (D)
- - -
(D) (D) (D)
0.2 0.1 0.1
0.4 0.2 0.2
0.8 0.5 0.4
128.5 156.5 11.5
(D) (D) (D)
(D) (D) (D)
(D) (D) (D)
22.5 34.5 40.0
(D) (D) (D)
5.3 6.6 1.6
26.1 32.2 31.5
182.4 229.8 84.6
See footnote(s) at end of table. --continued
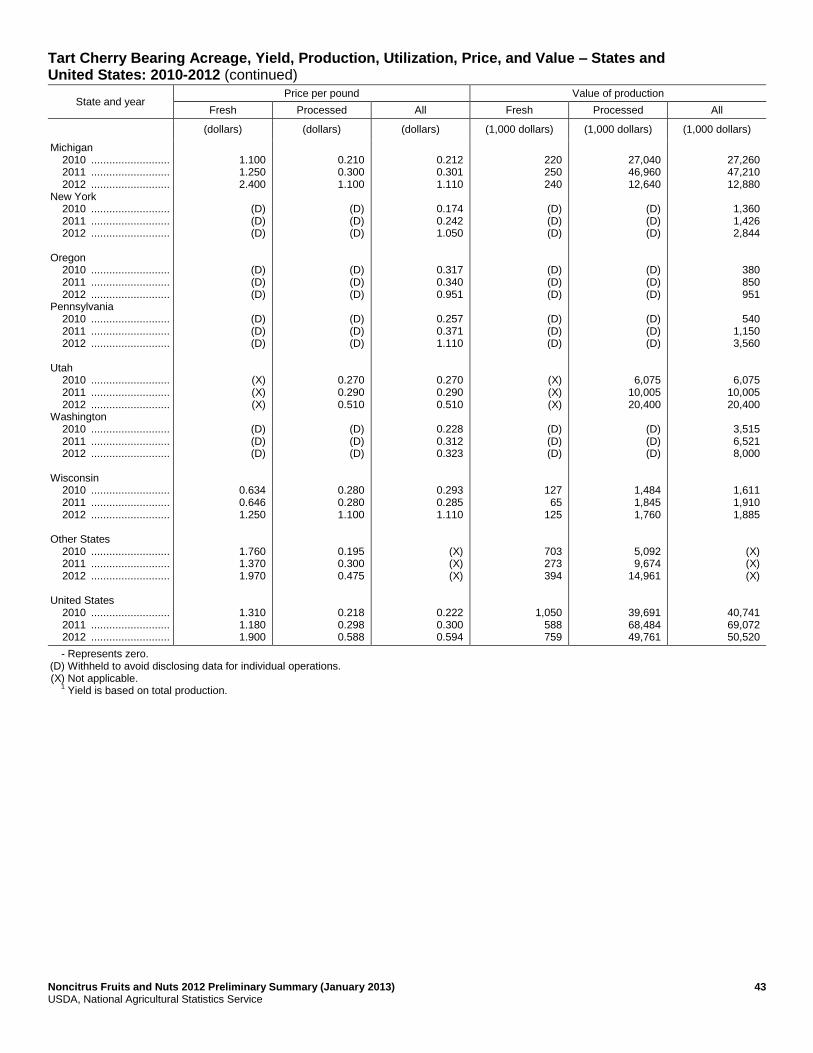
Noncitrus Fruits and Nuts 2012 Preliminary Summary (January 2013) 43 USDA, National Agricultural Statistics Service
Tart Cherry Bearing Acreage, Yield, Production, Utilization, Price, and Value – States and United States: 2010-2012 (continued)
State and year Price per pound Value of production
Fresh Processed All Fresh Processed All
(dollars) (dollars) (dollars) (1,000 dollars) (1,000 dollars) (1,000 dollars)
Michigan 2010 .......................... 2011 .......................... 2012 .......................... New York 2010 .......................... 2011 .......................... 2012 .......................... Oregon 2010 .......................... 2011 .......................... 2012 .......................... Pennsylvania 2010 .......................... 2011 .......................... 2012 .......................... Utah 2010 .......................... 2011 .......................... 2012 .......................... Washington 2010 .......................... 2011 .......................... 2012 .......................... Wisconsin 2010 .......................... 2011 .......................... 2012 .......................... Other States 2010 .......................... 2011 .......................... 2012 .......................... United States 2010 .......................... 2011 .......................... 2012 ..........................
1.100 1.250 2.400
(D) (D) (D)
(D) (D) (D)
(D) (D) (D)
(X) (X) (X)
(D) (D) (D)
0.634 0.646 1.250
1.760 1.370 1.970
1.310 1.180 1.900
0.210 0.300 1.100
(D) (D) (D)
(D) (D) (D)
(D) (D) (D)
0.270 0.290 0.510
(D) (D) (D)
0.280 0.280 1.100
0.195 0.300 0.475
0.218 0.298 0.588
0.212 0.301 1.110
0.174 0.242 1.050
0.317 0.340 0.951
0.257 0.371 1.110
0.270 0.290 0.510
0.228 0.312 0.323
0.293 0.285 1.110
(X) (X) (X)
0.222 0.300 0.594
220 250 240
(D) (D) (D)
(D) (D) (D)
(D) (D) (D)
(X) (X) (X)
(D) (D) (D)
127 65
125
703 273 394
1,050 588 759
27,040 46,960 12,640
(D) (D) (D)
(D) (D) (D)
(D) (D) (D)
6,075 10,005 20,400
(D) (D) (D)
1,484 1,845 1,760
5,092 9,674
14,961
39,691 68,484 49,761
27,260 47,210 12,880
1,360 1,426 2,844
380 850 951
540
1,150 3,560
6,075 10,005 20,400
3,515 6,521 8,000
1,611 1,910 1,885
(X) (X) (X)
40,741 69,072 50,520
- Represents zero. (D) Withheld to avoid disclosing data for individual operations. (X) Not applicable. 1
Yield is based on total production.
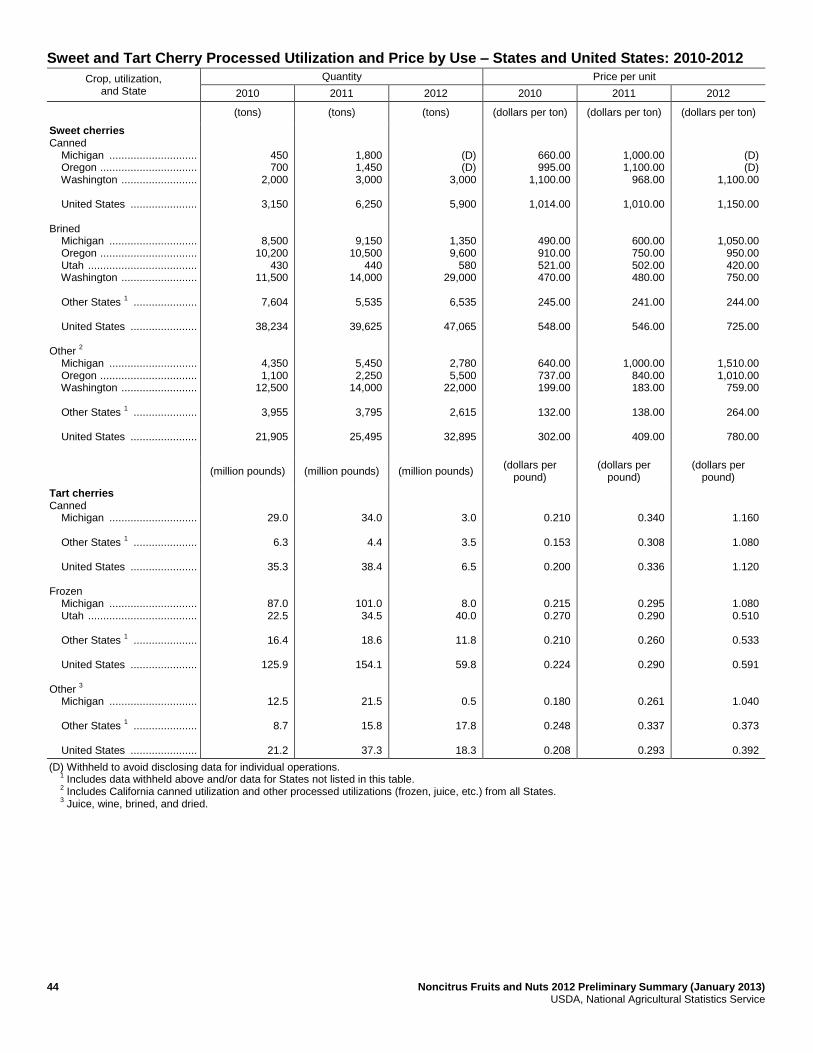
44 Noncitrus Fruits and Nuts 2012 Preliminary Summary (January 2013) USDA, National Agricultural Statistics Service
Sweet and Tart Cherry Processed Utilization and Price by Use – States and United States: 2010-2012
Crop, utilization, and State
Quantity Price per unit
2010 2011 2012 2010 2011 2012
(tons) (tons) (tons) (dollars per ton) (dollars per ton) (dollars per ton)
Sweet cherries Canned Michigan ............................. Oregon ................................ Washington ......................... United States ...................... Brined Michigan ............................. Oregon ................................ Utah .................................... Washington ......................... Other States
1 .....................
United States ...................... Other
2
Michigan ............................. Oregon ................................ Washington ......................... Other States
1 .....................
United States ......................
450 700
2,000
3,150
8,500 10,200
430 11,500
7,604
38,234
4,350 1,100
12,500
3,955
21,905
1,800 1,450 3,000
6,250
9,150 10,500
440 14,000
5,535
39,625
5,450 2,250
14,000
3,795
25,495
(D) (D)
3,000
5,900
1,350 9,600
580 29,000
6,535
47,065
2,780 5,500
22,000
2,615
32,895
660.00 995.00
1,100.00
1,014.00
490.00 910.00 521.00 470.00
245.00
548.00
640.00 737.00 199.00
132.00
302.00
1,000.00 1,100.00
968.00
1,010.00
600.00 750.00 502.00 480.00
241.00
546.00
1,000.00 840.00 183.00
138.00
409.00
(D) (D)
1,100.00
1,150.00
1,050.00 950.00 420.00 750.00
244.00
725.00
1,510.00 1,010.00
759.00
264.00
780.00
(million pounds) (million pounds) (million pounds)
(dollars per pound)
(dollars per pound)
(dollars per pound)
Tart cherries Canned Michigan ............................. Other States
1 .....................
United States ...................... Frozen Michigan ............................. Utah .................................... Other States
1 .....................
United States ...................... Other
3
Michigan ............................. Other States
1 .....................
United States ......................
29.0
6.3
35.3
87.0 22.5
16.4
125.9
12.5
8.7
21.2
34.0
4.4
38.4
101.0 34.5
18.6
154.1
21.5
15.8
37.3
3.0
3.5
6.5
8.0 40.0
11.8
59.8
0.5
17.8
18.3
0.210
0.153
0.200
0.215 0.270
0.210
0.224
0.180
0.248
0.208
0.340
0.308
0.336
0.295 0.290
0.260
0.290
0.261
0.337
0.293
1.160
1.080
1.120
1.080 0.510
0.533
0.591
1.040
0.373
0.392
(D) Withheld to avoid disclosing data for individual operations. 1
Includes data withheld above and/or data for States not listed in this table. 2
Includes California canned utilization and other processed utilizations (frozen, juice, etc.) from all States. 3
Juice, wine, brined, and dried.
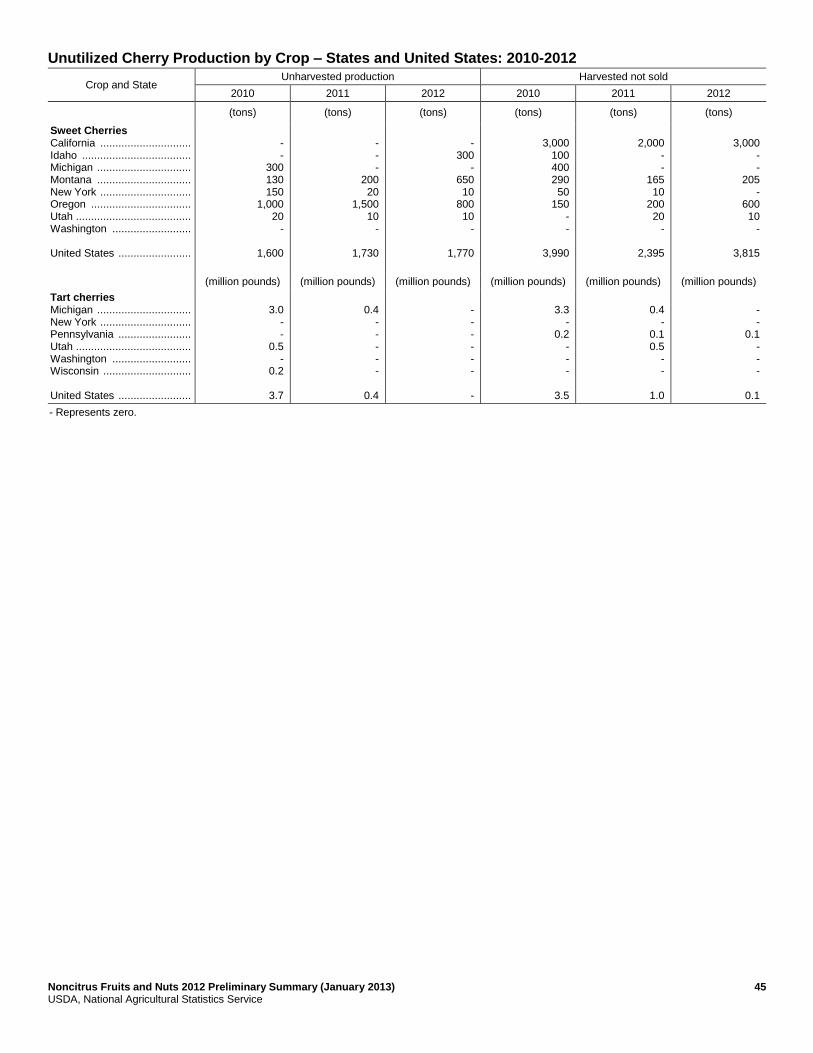
Noncitrus Fruits and Nuts 2012 Preliminary Summary (January 2013) 45 USDA, National Agricultural Statistics Service
Unutilized Cherry Production by Crop – States and United States: 2010-2012
Crop and State Unharvested production Harvested not sold
2010 2011 2012 2010 2011 2012
(tons) (tons) (tons) (tons) (tons) (tons)
Sweet Cherries California .............................. Idaho .................................... Michigan ............................... Montana ............................... New York .............................. Oregon ................................. Utah ...................................... Washington .......................... United States ........................
- -
300 130 150
1,000 20
-
1,600
- - -
200 20
1,500 10
-
1,730
-
300 -
650 10
800 10
-
1,770
3,000
100 400 290 50
150 - -
3,990
2,000
- -
165 10
200 20
-
2,395
3,000
- -
205 -
600 10
-
3,815
(million pounds) (million pounds) (million pounds) (million pounds) (million pounds) (million pounds)
Tart cherries Michigan ............................... New York .............................. Pennsylvania ........................ Utah ...................................... Washington .......................... Wisconsin ............................. United States ........................
3.0
- -
0.5 -
0.2
3.7
0.4
- - - - -
0.4
- - - - - -
-
3.3
- 0.2
- - -
3.5
0.4
- 0.1 0.5
- -
1.0
- -
0.1 - - -
0.1
- Represents zero.

46 Noncitrus Fruits and Nuts 2012 Preliminary Summary (January 2013) USDA, National Agricultural Statistics Service
70,000
75,000
80,000
85,000
90,000
2003 2004 2005 2006 2007 2008 2009 2010 2011 2012
Acres
Year
Sweet Cherry Bearing Acreage United States: 2003-2012
34,500
35,000
35,500
36,000
36,500
37,000
37,500
2003 2004 2005 2006 2007 2008 2009 2010 2011 2012
Acres
Year
Tart Cherry Bearing Acreage United States: 2003-2012

Noncitrus Fruits and Nuts 2012 Preliminary Summary (January 2013) 47 USDA, National Agricultural Statistics Service
Cranberry Area Harvested, Yield, Production, Utilization, Price and Value – States and United States: 2010-2012 [A barrel weighs 100 pounds]
Year and State Area harvested Yield per acre Production Utilization
Total Utilized Fresh Processed
(acres) (barrels) (barrels) (barrels) (barrels) (barrels)
Massachusetts 2010 ........................ 2011 ........................ 2012 ........................ New Jersey
1
2010 ........................ 2011 ........................ 2012 ........................ Oregon
1
2010 ........................ 2011 ........................ 2012 ........................ Washington 2010 ........................ 2011 ........................ 2012 ........................ Wisconsin 2010 ........................ 2011 ........................ 2012 ........................ United States 2010 ........................ 2011 ........................ 2012 ........................
13,000 13,000 13,000
3,100 3,000 3,000
2,700 2,800 2,900
1,700 1,700 1,700
18,000 18,000 19,700
38,500 38,500 40,300
145.5 178.2 163.3
181.3 170.0 183.3
106.3 128.9 139.7
63.6 68.1 80.6
220.0 245.0 245.2
176.8 200.4 199.6
1,891,000 2,317,000 2,123,000
562,000 510,000 550,000
287,000 361,000 405,000
108,200 115,700 137,000
3,960,000 4,410,000 4,830,000
6,808,200 7,713,700 8,045,000
1,891,000 2,317,000 2,123,000
562,000 510,000 550,000
287,000 361,000 405,000
108,200 115,700 137,000
3,960,000 4,410,000 4,830,000
6,808,200 7,713,700 8,045,000
112,000 110,000 83,000
- - -
- - -
27,200 20,500 41,000
80,000 110,000 130,000
219,200 240,500 254,000
1,779,000 2,207,000 2,040,000
562,000 510,000 550,000
287,000 361,000 405,000
81,000 95,200 96,000
3,880,000 4,300,000 4,700,000
6,589,000 7,473,200 7,791,000
Year and State Price per barrel
2 Value of utilized production
Fresh Processed All Fresh Processed All
(dollars) (dollars) (dollars) (1,000 dollars) (1,000 dollars) (1,000 dollars)
Massachusetts 2010 ........................ 2011 ........................ 2012 ........................ New Jersey
1
2010 ........................ 2011 ........................ 2012 ........................ Oregon
1
2010 ........................ 2011 ........................ 2012 ........................ Washington 2010 ........................ 2011 ........................ 2012 ........................ Wisconsin 2010 ........................ 2011 ........................ 2012 ........................ United States 2010 ........................ 2011 ........................ 2012 ........................
69.50 64.80 69.90
(X) (X) (X)
(X) (X) (X)
75.70 71.60 82.40
75.70 71.60 82.40
72.50 68.50 78.30
40.40 43.70 46.10
53.70 51.00 54.40
34.50 39.50 40.40
54.70 51.40 55.50
43.00 43.60 46.80
43.00 44.00 46.90
42.10 44.70 47.00
53.70 51.00 54.40
34.50 39.50 40.40
60.00 55.00 63.50
43.70 44.30 47.80
43.90 44.80 47.90
7,784 7,128 5,802
(X) (X) (X)
(X) (X) (X)
2,059 1,468 3,378
6,056 7,876
10,712
15,899 16,472 19,892
71,872 96,446 94,044
30,179 26,010 29,920
9,902 14,260 16,362
4,431 4,893 5,328
166,840 187,480 219,960
283,224 329,089 365,614
79,656
103,574 99,846
30,179 26,010 29,920
9,902 14,260 16,362
6,490 6,361 8,706
172,896 195,356 230,672
299,123 345,561 385,506
- Represents zero. (X) Not applicable. 1
Small quantities of fresh cranberries are included in processed to avoid disclosure of individual operations. 2
Weighted average of co-op and independent sales. Co-op prices represent pool proceeds less returns for processing non-cranberry products, capital stock dividends, capital stock retains, and other retains.

48 Noncitrus Fruits and Nuts 2012 Preliminary Summary (January 2013) USDA, National Agricultural Statistics Service
Grape Bearing Acreage, Yield, Production, Price, and Value – States and United States: 2010-2012
State and type Bearing acreage Yield per acre
1
2010 2011 2012 2010 2011 2012
(acres) (acres) (acres) (tons) (tons) (tons)
Arkansas ................................. California ................................ Wine ................................... Table ................................... Raisin .................................. Georgia ................................... Michigan ................................. Missouri .................................. New York ................................ North Carolina ......................... Ohio ........................................ Oregon .................................... Pennsylvania .......................... Texas ...................................... Virginia .................................... Washington ............................. Wine ................................... Juice ................................... United States ..........................
600 792,000 497,000 85,000
210,000 1,300
14,400 1,700
37,000 1,800
1,900
16,900 13,600 3,000 2,700
65,000 39,000 26,000
951,900
600 796,000 506,000 85,000
205,000 1,500
14,500 1,700
37,000 1,800
1,900
17,500 13,600 4,400 2,600
67,000 41,000 26,000
960,100
600 796,000 506,000 85,000
205,000 1,800
14,700 1,700
37,000 1,800
1,900
18,000 13,600 3,400 2,600
69,000 43,000 26,000
962,100
3.50 8.55 7.30
11.90 10.20 3.54 2.50 3.00 4.76 2.89
1.83 1.85 6.10 2.97 2.44 5.17 4.10 6.77
7.85
2.00 8.39 6.69
12.10 11.00 2.33 6.51 3.06 5.08 2.89
3.94 2.37 6.69 1.21 2.65 4.72 3.46 6.69
7.76
2.17 8.39 7.39
11.60 9.52 2.61 2.60 2.71 3.11 2.75
2.81 2.56 4.49 2.18 2.65 5.36 4.30 7.12
7.63
State and type Total production Utilized production
2010 2011 2012 2010 2011 2012
(tons) (tons) (tons) (tons) (tons) (tons)
Arkansas ................................. California ................................ Wine ................................... Table
2 ................................
Raisin 2 ...............................
Georgia ................................... Michigan ................................. Missouri .................................. New York ................................ North Carolina ......................... Ohio ........................................ Oregon .................................... Pennsylvania .......................... Texas ...................................... Virginia .................................... Washington ............................. Wine ................................... Juice ................................... United States ..........................
2,100 6,773,000 3,629,000 1,011,000 2,133,000
4,600 36,000 5,100
176,000 5,200
3,470
31,200 83,000 8,900 6,600
336,000 160,000 176,000
7,471,170
1,200 6,682,000 3,387,000 1,032,000 2,263,000
3,500 94,400 5,200
188,000 5,200
7,480
41,500 91,000 5,330 6,900
316,000 142,000 174,000
7,447,710
1,300 6,678,000 3,740,000
987,000 1,951,000
4,700 38,200 4,600
115,000 4,950
5,335
46,000 61,000 7,420 6,900
370,000 185,000 185,000
7,343,405
1,990 6,773,000 3,629,000 1,011,000 2,133,000
4,300 36,000 5,100
176,000 4,950
3,050
31,200 82,000 8,500 6,450
336,000 160,000 176,000
7,468,540
1,100 6,682,000 3,387,000 1,032,000 2,263,000
3,300 93,400 5,200
188,000 4,980
7,330
41,500 87,000 4,610 6,020
316,000 142,000 174,000
7,440,440
1,100 6,678,000 3,740,000
987,000 1,951,000
4,000 38,200 4,600
112,000 4,800
5,293
46,000 59,000 7,300 6,700
370,000 185,000 185,000
7,336,993
See footnote(s) at end of table. --continued
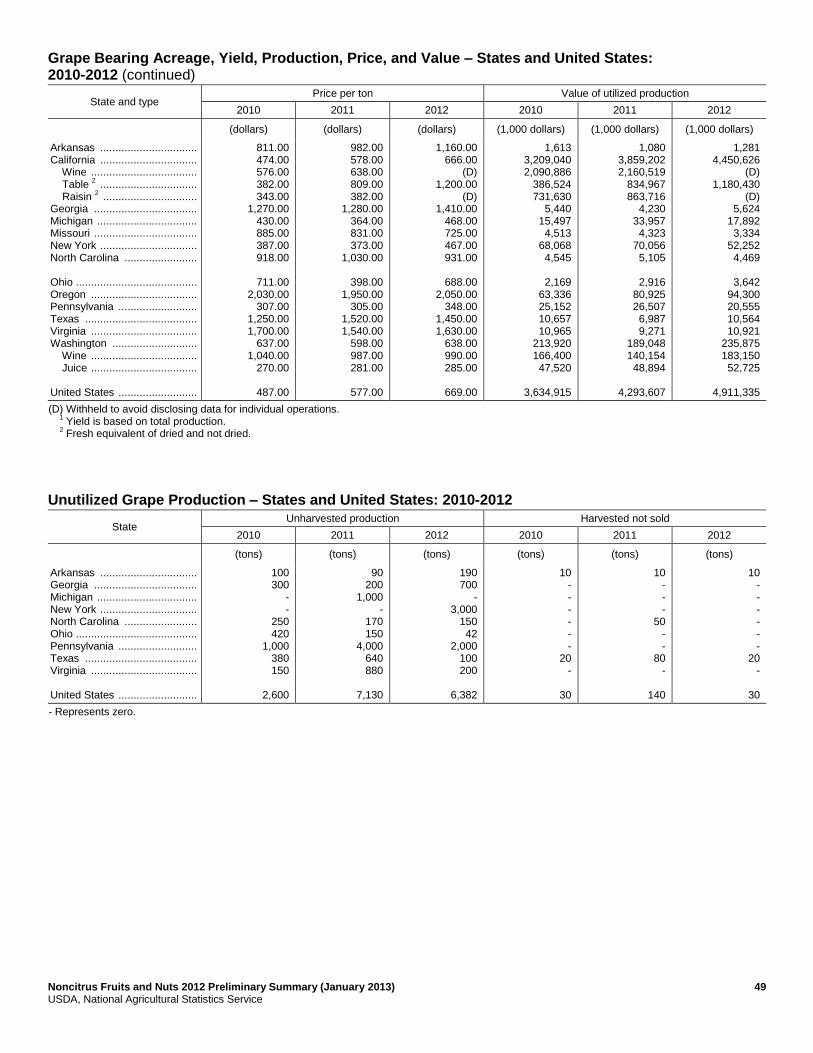
Noncitrus Fruits and Nuts 2012 Preliminary Summary (January 2013) 49 USDA, National Agricultural Statistics Service
Grape Bearing Acreage, Yield, Production, Price, and Value – States and United States: 2010-2012 (continued)
State and type Price per ton Value of utilized production
2010 2011 2012 2010 2011 2012
(dollars) (dollars) (dollars) (1,000 dollars) (1,000 dollars) (1,000 dollars)
Arkansas ................................ California ................................ Wine ................................... Table
2 ................................
Raisin 2 ...............................
Georgia .................................. Michigan ................................. Missouri .................................. New York ................................ North Carolina ........................ Ohio ........................................ Oregon ................................... Pennsylvania .......................... Texas ..................................... Virginia ................................... Washington ............................ Wine ................................... Juice ................................... United States ..........................
811.00 474.00 576.00 382.00 343.00
1,270.00 430.00 885.00 387.00 918.00
711.00
2,030.00 307.00
1,250.00 1,700.00
637.00 1,040.00
270.00
487.00
982.00 578.00 638.00 809.00 382.00
1,280.00 364.00 831.00 373.00
1,030.00
398.00 1,950.00
305.00 1,520.00 1,540.00
598.00 987.00 281.00
577.00
1,160.00 666.00
(D) 1,200.00
(D) 1,410.00
468.00 725.00 467.00 931.00
688.00
2,050.00 348.00
1,450.00 1,630.00
638.00 990.00 285.00
669.00
1,613 3,209,040 2,090,886
386,524 731,630
5,440 15,497 4,513
68,068 4,545
2,169
63,336 25,152 10,657 10,965
213,920 166,400 47,520
3,634,915
1,080 3,859,202 2,160,519
834,967 863,716
4,230 33,957 4,323
70,056 5,105
2,916
80,925 26,507 6,987 9,271
189,048 140,154 48,894
4,293,607
1,281 4,450,626
(D) 1,180,430
(D) 5,624
17,892 3,334
52,252 4,469
3,642
94,300 20,555 10,564 10,921
235,875 183,150 52,725
4,911,335
(D) Withheld to avoid disclosing data for individual operations. 1
Yield is based on total production. 2
Fresh equivalent of dried and not dried.
Unutilized Grape Production – States and United States: 2010-2012
State Unharvested production Harvested not sold
2010 2011 2012 2010 2011 2012
(tons) (tons) (tons) (tons) (tons) (tons)
Arkansas ................................ Georgia .................................. Michigan ................................. New York ................................ North Carolina ........................ Ohio ........................................ Pennsylvania .......................... Texas ..................................... Virginia ................................... United States ..........................
100 300
- -
250 420
1,000 380 150
2,600
90 200
1,000 -
170 150
4,000 640 880
7,130
190 700
- 3,000
150 42
2,000 100 200
6,382
10 - - - - - -
20 -
30
10 - - -
50 - -
80 -
140
10 - - - - - -
20 -
30
- Represents zero.

50 Noncitrus Fruits and Nuts 2012 Preliminary Summary (January 2013) USDA, National Agricultural Statistics Service
Grape Fresh and Processed Utilization, Price, and Value – States and United States: 2010-2012
Utilization, State, and type
Quantity Price per ton
2010 2011 2012 2010 2011 2012
(tons) (tons) (tons) (dollars) (dollars) (dollars)
Fresh California .................................... Wine ....................................... Table ....................................... Raisin ...................................... Michigan ..................................... Missouri ...................................... New York .................................... North Carolina ............................. Ohio ............................................ Pennsylvania .............................. Texas .......................................... Other States
1 .............................
United States .............................. Processed California .................................... Wine ....................................... Table ....................................... Raisin ...................................... Michigan ..................................... Missouri ...................................... New York .................................... North Carolina ............................. Ohio ............................................ Oregon
2 .....................................
Pennsylvania .............................. Texas .......................................... Virginia ........................................ Washington ................................. Wine ....................................... Juice ....................................... Other States
1 .............................
United States ..............................
984,000
40,000 829,000 115,000
1,100 60
4,000 450 40
300 400
2,760
993,110
5,789,000 3,589,000
182,000 2,018,000
34,900 5,040
172,000 4,500 3,010
31,200
81,700 8,100 6,450
336,000 160,000 176,000
3,530
6,475,430
975,000 40,000
831,000 104,000
1,100 60
5,000 380 80
400 810
1,850
984,680
5,707,000 3,347,000
201,000 2,159,000
92,300 5,140
183,000 4,600 7,250
41,500
86,600 3,800 6,020
316,000 142,000 174,000
2,550
6,455,760
994,000 40,000
831,000 123,000
450 50
3,000 380 53
300 100
2,050
1,000,383
5,684,000 3,700,000
156,000 1,828,000
37,750 4,550
109,000 4,420 5,240
46,000
58,700 7,200 6,700
370,000 185,000 185,000
3,050
6,336,610
474.00 770.00 420.00 760.00
2,400.00 1,300.00 1,480.00 3,100.00 1,280.00 1,300.00 1,330.00
1,600.00
485.00
474.00 574.00 211.00 319.00 368.00 880.00 361.00 700.00 704.00
2,030.00
303.00 1,250.00 1,700.00
637.00 1,040.00
270.00
746.00
487.00
974.00 712.00 947.00
1,290.00 2,400.00
950.00 1,800.00 2,540.00
738.00 1,500.00 1,870.00
1,940.00
983.00
510.00 637.00 239.00 338.00 339.00 830.00 334.00 900.00 394.00
1,950.00
299.00 1,440.00 1,540.00
598.00 987.00 281.00
675.00
515.00
1,330.00
(D) 1,370.00
(D) 2,450.00 1,150.00 1,690.00 2,455.00 1,773.00 1,500.00 1,240.00
2,040.00
1,340.00
550.00 637.00 269.00 397.00 445.00 720.00 433.00 800.00 677.00
2,050.00
343.00 1,450.00 1,630.00
638.00 990.00 285.00
895.00
564.00
See footnote(s) at end of table. --continued

Noncitrus Fruits and Nuts 2012 Preliminary Summary (January 2013) 51 USDA, National Agricultural Statistics Service
Grape Fresh and Processed Utilization, Price, and Value – States and United States: 2010-2012 (continued)
Utilization, State, and type
Value of utilized production
2010 2011 2012
(1,000 dollars) (1,000 dollars) (1,000 dollars)
Fresh California ....................................... Wine .......................................... Table ......................................... Raisin ........................................ Michigan ........................................ Missouri ......................................... New York ....................................... North Carolina ............................... Ohio ............................................... Pennsylvania ................................. Texas ............................................ Other States
1 ................................
United States ................................. Processed California ....................................... Wine .......................................... Table ......................................... Raisin ........................................ Michigan ........................................ Missouri ......................................... New York ....................................... North Carolina ............................... Ohio ............................................... Oregon
2 ........................................
Pennsylvania ................................. Texas ............................................ Virginia .......................................... Washington ................................... Wine .......................................... Juice .......................................... Other States
1 ................................
United States .................................
466,380 30,800
348,180 87,400 2,640
78 5,920 1,395
51 390 532
4,421
481,807
2,742,660 2,060,086
38,344 644,230 12,857 4,435
62,148 3,150 2,118
63,336
24,762 10,125 10,965
213,920 166,400 47,520
2,632
3,153,108
949,597 28,480
786,957 134,160
2,640 57
9,000 965 59
600 1,515
3,590
968,023
2,909,605 2,132,039
48,010 729,556 31,317 4,266
61,056 4,140 2,857
80,925
25,907 5,472 9,271
189,048 140,154 48,894
1,720
3,325,584
1,326,720
(D) 1,138,470
(D) 1,103
58 5,070
933 94
450 124
4,175
1,338,727
3,123,906 2,356,900
41,960 725,046 16,789 3,276
47,182 3,536 3,548
94,300
20,105 10,440 10,921
235,875 183,150 52,725
2,730
3,572,608
(D) Withheld to avoid disclosing data for individual operations. 1
Includes data withheld above and/or data for States not listed in this table. 2
Includes small quantities sold fresh.
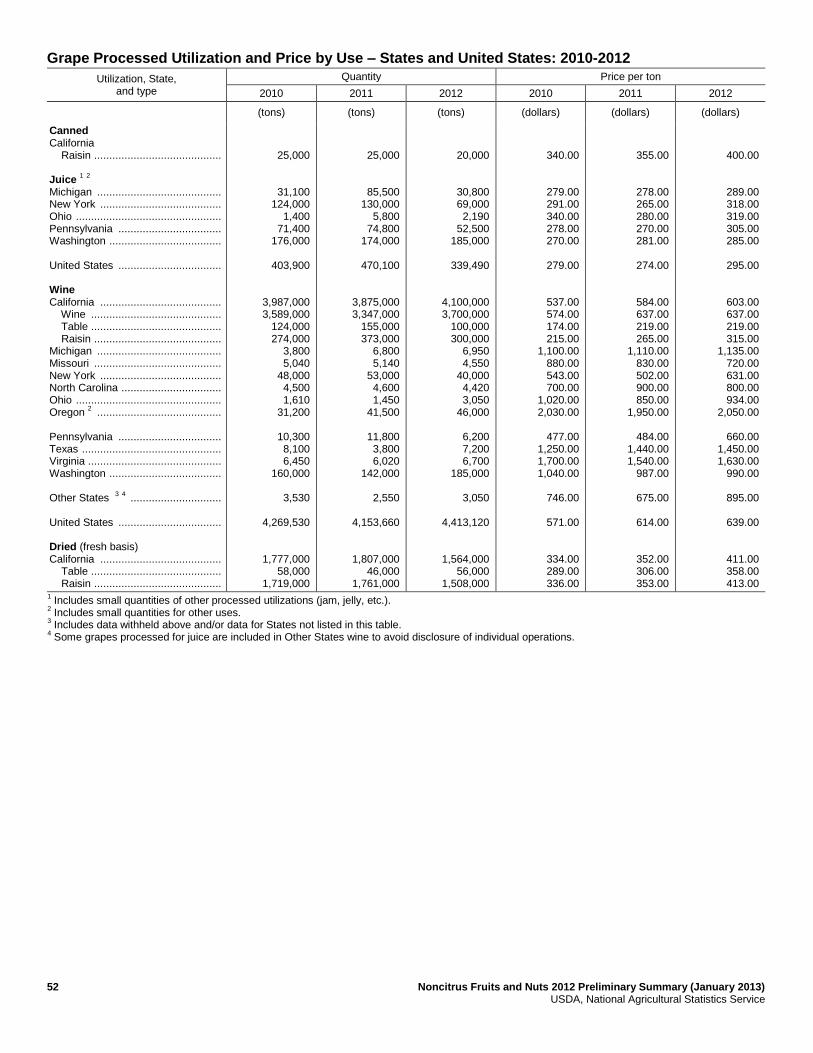
52 Noncitrus Fruits and Nuts 2012 Preliminary Summary (January 2013) USDA, National Agricultural Statistics Service
Grape Processed Utilization and Price by Use – States and United States: 2010-2012
Utilization, State, and type
Quantity Price per ton
2010 2011 2012 2010 2011 2012
(tons) (tons) (tons) (dollars) (dollars) (dollars)
Canned California Raisin .......................................... Juice
1 2
Michigan ......................................... New York ........................................ Ohio ................................................ Pennsylvania .................................. Washington ..................................... United States .................................. Wine California ........................................ Wine ........................................... Table ........................................... Raisin .......................................... Michigan ......................................... Missouri .......................................... New York ........................................ North Carolina ................................. Ohio ................................................ Oregon
2 .........................................
Pennsylvania .................................. Texas .............................................. Virginia ............................................ Washington ..................................... Other States
3 4 ..............................
United States .................................. Dried (fresh basis) California ........................................ Table ........................................... Raisin ..........................................
25,000
31,100 124,000
1,400 71,400
176,000
403,900
3,987,000 3,589,000
124,000 274,000
3,800 5,040
48,000 4,500 1,610
31,200
10,300 8,100 6,450
160,000
3,530
4,269,530
1,777,000 58,000
1,719,000
25,000
85,500 130,000
5,800 74,800
174,000
470,100
3,875,000 3,347,000
155,000 373,000
6,800 5,140
53,000 4,600 1,450
41,500
11,800 3,800 6,020
142,000
2,550
4,153,660
1,807,000 46,000
1,761,000
20,000
30,800 69,000 2,190
52,500 185,000
339,490
4,100,000 3,700,000
100,000 300,000
6,950 4,550
40,000 4,420 3,050
46,000
6,200 7,200 6,700
185,000
3,050
4,413,120
1,564,000 56,000
1,508,000
340.00
279.00 291.00 340.00 278.00 270.00
279.00
537.00 574.00 174.00 215.00
1,100.00 880.00 543.00 700.00
1,020.00 2,030.00
477.00
1,250.00 1,700.00 1,040.00
746.00
571.00
334.00 289.00 336.00
355.00
278.00 265.00 280.00 270.00 281.00
274.00
584.00 637.00 219.00 265.00
1,110.00 830.00 502.00 900.00 850.00
1,950.00
484.00 1,440.00 1,540.00
987.00
675.00
614.00
352.00 306.00 353.00
400.00
289.00 318.00 319.00 305.00 285.00
295.00
603.00 637.00 219.00 315.00
1,135.00 720.00 631.00 800.00 934.00
2,050.00
660.00 1,450.00 1,630.00
990.00
895.00
639.00
411.00 358.00 413.00
1 Includes small quantities of other processed utilizations (jam, jelly, etc.).
2 Includes small quantities for other uses.
3 Includes data withheld above and/or data for States not listed in this table.
4 Some grapes processed for juice are included in Other States wine to avoid disclosure of individual operations.
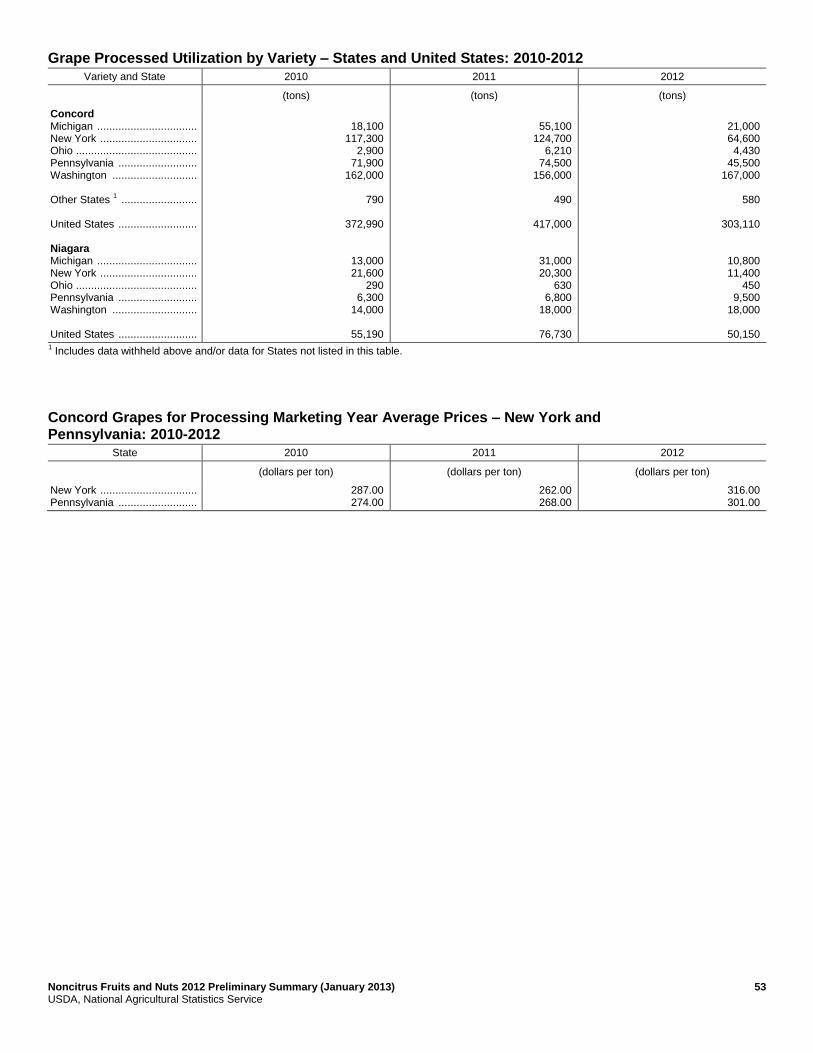
Noncitrus Fruits and Nuts 2012 Preliminary Summary (January 2013) 53 USDA, National Agricultural Statistics Service
Grape Processed Utilization by Variety – States and United States: 2010-2012
Variety and State 2010 2011 2012
(tons) (tons) (tons)
Concord Michigan ................................. New York ................................ Ohio ........................................ Pennsylvania .......................... Washington ............................ Other States
1 .........................
United States .......................... Niagara Michigan ................................. New York ................................ Ohio ........................................ Pennsylvania .......................... Washington ............................ United States ..........................
18,100
117,300 2,900
71,900 162,000
790
372,990
13,000 21,600
290 6,300
14,000
55,190
55,100
124,700 6,210
74,500 156,000
490
417,000
31,000 20,300
630 6,800
18,000
76,730
21,000 64,600 4,430
45,500 167,000
580
303,110
10,800 11,400
450 9,500
18,000
50,150 1 Includes data withheld above and/or data for States not listed in this table.
Concord Grapes for Processing Marketing Year Average Prices – New York and Pennsylvania: 2010-2012
State 2010 2011 2012
(dollars per ton) (dollars per ton) (dollars per ton)
New York ................................ Pennsylvania ..........................
287.00 274.00
262.00 268.00
316.00 301.00

54 Noncitrus Fruits and Nuts 2012 Preliminary Summary (January 2013) USDA, National Agricultural Statistics Service
Peach Bearing Acreage, Yield, Production, Price, and Value – States and United States: 2010-2012
State Bearing acreage Yield per acre
1
2010 2011 2012 2010 2011 2012
(acres) (acres) (acres) (tons) (tons) (tons)
Alabama ..................................... Arkansas ..................................... California .................................... Freestone ................................ Clingstone ............................... Colorado ..................................... Connecticut ................................. Georgia ....................................... Idaho ........................................... Illinois .......................................... Maryland ..................................... Massachusetts ............................ Michigan ..................................... Missouri ...................................... New Jersey ................................. New York .................................... North Carolina ............................. Ohio ............................................ Pennsylvania .............................. South Carolina ............................ Texas .......................................... Utah ............................................ Virginia ........................................ Washington ................................. West Virginia ............................... United States ..............................
1,900 1,200
50,000 27,000 23,000 2,400
400 10,800 1,300 1,600
850 430
4,000 1,700 6,100 1,600 1,100 1,200 4,400
15,500
5,400 1,500 1,000 2,300
950
117,630
2,200 1,200
47,500 25,000 22,500 2,400
400 10,200 1,300 1,600
800 430
3,700 1,500 5,500 1,600 1,100 1,200 4,400
15,500
4,300 1,500 1,000 2,200
950
112,480
2,400 1,200
47,000 24,000 23,000 2,500
400 9,900 1,300 1,600
800 430
3,600 1,500 5,300 1,600 1,100 1,400 4,400
17,000
4,000 1,500 1,000 2,200
750
112,880
3.16 2.50
16.30 14.30 18.80 5.83 3.00 3.70 5.69 5.69
4.71 4.07 3.50 2.47 5.90 3.69 5.00 5.20 4.82 7.10
2.59 2.87 6.21 6.09 5.58
9.78
2.59 1.50
16.30 15.20 17.50 5.00 3.00 3.53 5.85 5.80
4.86 4.07 4.50 3.40 5.82 4.25 4.82 5.03 4.02 6.13
1.23 2.87 6.50 6.00 6.00
9.53
2.29 2.50
15.20 14.30 16.00 6.80 3.38 3.36 5.85 4.61
5.43 3.60 0.55 2.40 5.66 1.63 4.82 3.54 4.73 4.41
2.75 3.53 6.50 5.91 5.60
8.67
State Total production Utilized production
2010 2011 2012 2010 2011 2012
(tons) (tons) (tons) (tons) (tons) (tons)
Alabama ..................................... Arkansas ..................................... California .................................... Freestone ................................ Clingstone ............................... Colorado ..................................... Connecticut ................................. Georgia ....................................... Idaho ........................................... Illinois .......................................... Maryland ..................................... Massachusetts ............................ Michigan ..................................... Missouri ...................................... New Jersey ................................. New York .................................... North Carolina ............................. Ohio ............................................ Pennsylvania .............................. South Carolina ............................ Texas .......................................... Utah ............................................ Virginia ........................................ Washington ................................. West Virginia ............................... United States ..............................
6,000 3,000
817,000 385,000 432,000
14,000 1,200
40,000 7,400 9,100
4,000 1,750
14,000 4,200
36,000 5,900 5,500 6,240
21,200 110,000
14,000 4,300 6,210
14,000 5,300
1,150,300
5,700 1,800
773,000 380,000 393,000 12,000 1,200
36,000 7,600 9,280
3,890 1,750
16,650 5,100
32,000 6,800 5,300 6,030
17,690 95,000
5,300 4,300 6,500
13,200 5,700
1,071,790
5,500 3,000
713,000 344,000 369,000 17,000 1,350
33,300 7,600 7,380
4,340 1,550 1,980 3,600
30,000 2,600 5,300 4,960
20,800 75,000
11,000 5,300 6,500
13,000 4,200
978,260
4,500 2,830
817,000 385,000 432,000 12,000 1,200
38,500 6,500 7,580
3,990 1,750
13,830 4,200
34,000 5,850 5,470 5,980
20,800 102,800
13,000 4,240 5,570
14,000 5,000
1,130,590
5,300 1,760
773,000 380,000 393,000 11,200 1,100
33,600 6,700 7,890
3,880 1,750
16,400 5,100
30,000 6,750 5,150 5,840
17,290 77,600
4,650 4,100 5,220
13,200 5,500
1,042,980
4,000 2,790
713,000 344,000 369,000 16,000 1,300
31,100 6,800 6,970
4,260 1,500 1,980 3,600
30,000 2,550 5,100 4,940
20,350 70,250
10,200 5,200 6,430
13,000 4,100
965,420
See footnote(s) at end of table. --continued

Noncitrus Fruits and Nuts 2012 Preliminary Summary (January 2013) 55 USDA, National Agricultural Statistics Service
Peach Bearing Acreage, Yield, Production, Price, and Value – States and United States: 2010-2012 (continued)
State Price per ton Value of utilized production
2010 2011 2012 2010 2011 2012
(dollars) (dollars) (dollars) (1,000 dollars) (1,000 dollars) (1,000 dollars)
Alabama ...................................... Arkansas ..................................... California ..................................... Freestone ................................ Clingstone ............................... Colorado ...................................... Connecticut ................................. Georgia ....................................... Idaho ........................................... Illinois .......................................... Maryland ...................................... Massachusetts ............................. Michigan ...................................... Missouri ....................................... New Jersey .................................. New York ..................................... North Carolina ............................. Ohio ............................................. Pennsylvania ............................... South Carolina ............................. Texas .......................................... Utah ............................................. Virginia ........................................ Washington ................................. West Virginia ............................... United States ...............................
1,030.00 1,350.00
354.00 386.00 325.00
1,870.00 2,100.00
817.00 908.00
1,060.00
1,140.00 2,760.00
921.00 1,300.00
920.00 1,200.00 1,090.00 1,580.00 1,150.00
955.00
2,100.00 691.00 683.00 620.00 925.00
547.00
1,050.00 1,550.00
374.00 447.00 303.00
2,000.00 2,100.00
930.00 1,160.00 1,260.00
1,220.00 3,140.00
731.00 1,200.00 1,220.00 1,240.00 1,000.00 1,640.00 1,360.00
970.00
2,000.00 1,010.00
858.00 592.00 852.00
564.00
1,240.00 1,650.00
464.00 588.00 348.00
1,580.00 2,300.00
961.00 1,340.00 1,390.00
1,190.00 3,200.00 1,330.00 1,200.00 1,320.00 1,580.00 1,220.00 1,560.00 1,060.00 1,050.00
1,850.00 1,080.00
933.00 627.00
1,300.00
654.00
4,632 3,821
289,096 148,728 140,368 22,440 2,520
31,460 5,900 8,065
4,559 4,825
12,731 5,460
31,280 7,023 5,962 9,448
23,881 98,130
27,300 2,929 3,804 8,675 4,625
618,566
5,565 2,728
289,197 170,019 119,178 22,400 2,310
31,260 7,800 9,918
4,735 5,495
11,995 6,120
36,600 8,352 5,150 9,578
23,462 75,247
9,300 4,144 4,479 7,809 4,686
588,330
4,960 4,604
330,694 202,297 128,397 25,280 2,990
29,892 9,098 9,672
5,078 4,800 2,624 4,320
39,600 4,022 6,222 7,706
21,653 74,023
18,870 5,633 5,999 8,153 5,330
631,223
1 Yield is based on total production.
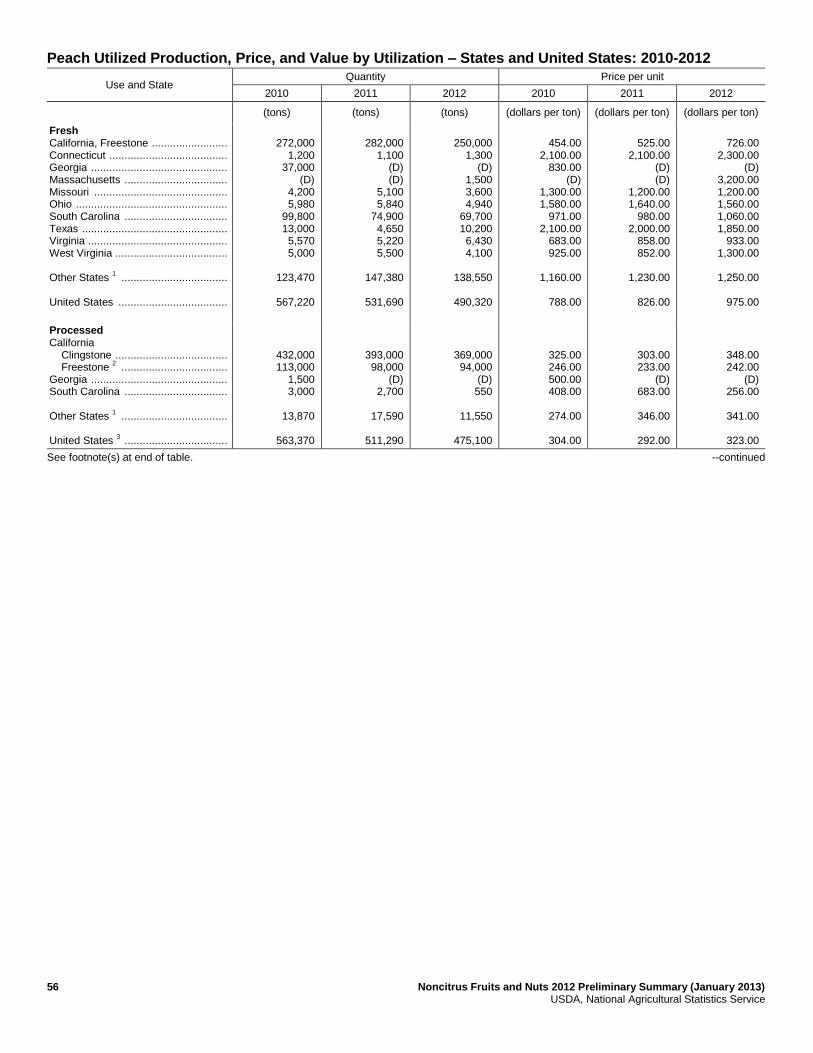
56 Noncitrus Fruits and Nuts 2012 Preliminary Summary (January 2013) USDA, National Agricultural Statistics Service
Peach Utilized Production, Price, and Value by Utilization – States and United States: 2010-2012
Use and State Quantity Price per unit
2010 2011 2012 2010 2011 2012
(tons) (tons) (tons) (dollars per ton) (dollars per ton) (dollars per ton)
Fresh California, Freestone ......................... Connecticut ....................................... Georgia ............................................. Massachusetts .................................. Missouri ............................................ Ohio .................................................. South Carolina .................................. Texas ................................................ Virginia .............................................. West Virginia ..................................... Other States
1 ...................................
United States ....................................
272,000
1,200 37,000
(D) 4,200 5,980
99,800 13,000 5,570 5,000
123,470
567,220
282,000
1,100 (D) (D)
5,100 5,840
74,900 4,650 5,220 5,500
147,380
531,690
250,000
1,300 (D)
1,500 3,600 4,940
69,700 10,200 6,430 4,100
138,550
490,320
454.00
2,100.00 830.00
(D) 1,300.00 1,580.00
971.00 2,100.00
683.00 925.00
1,160.00
788.00
525.00
2,100.00 (D) (D)
1,200.00 1,640.00
980.00 2,000.00
858.00 852.00
1,230.00
826.00
726.00
2,300.00 (D)
3,200.00 1,200.00 1,560.00 1,060.00 1,850.00
933.00 1,300.00
1,250.00
975.00
Processed California Clingstone ..................................... Freestone
2 ...................................
Georgia ............................................. South Carolina .................................. Other States
1 ...................................
United States
3 ..................................
432,000 113,000
1,500 3,000
13,870
563,370
393,000 98,000
(D) 2,700
17,590
511,290
369,000 94,000
(D) 550
11,550
475,100
325.00 246.00 500.00 408.00
274.00
304.00
303.00 233.00
(D) 683.00
346.00
292.00
348.00 242.00
(D) 256.00
341.00
323.00
See footnote(s) at end of table. --continued

Noncitrus Fruits and Nuts 2012 Preliminary Summary (January 2013) 57 USDA, National Agricultural Statistics Service
Peach Utilized Production, Price, and Value by Utilization – States and United States: 2010-2012 (continued)
Use and State Value of utilized production
2010 2011 2012
(1,000 dollars) (1,000 dollars) (1,000 dollars)
Fresh California, Freestone ........................... Connecticut ......................................... Georgia ............................................... Massachusetts ..................................... Missouri ............................................... Ohio ..................................................... South Carolina ..................................... Texas .................................................. Virginia ................................................ West Virginia ....................................... Other States
1 ......................................
United States ....................................... Processed California Clingstone ....................................... Freestone
2 ......................................
Georgia ............................................... South Carolina ..................................... Other States
1 ......................................
United States
3 .....................................
123,488
2,520 30,710
(D) 5,460 9,448
96,906 27,300 3,804 4,625
142,929
447,190
140,368 25,240
750 1,224
3,794
171,376
148,050
2,310 (D) (D)
6,120 9,578
73,402 9,300 4,479 4,686
181,332
439,257
119,178 21,969
(D) 1,845
6,081
149,073
181,500
2,990 (D)
4,800 4,320 7,706
73,882 18,870 5,999 5,330
172,551
477,948
128,397 20,797
(D) 141
3,940
153,275
(D) Withheld to avoid disclosing data for individual operations. 1
Includes data withheld above and/or data for States not listed in this table. 2
California Freestone quantity and value include dried, price excludes dried. 3
United States quantity, price, and value include dried.
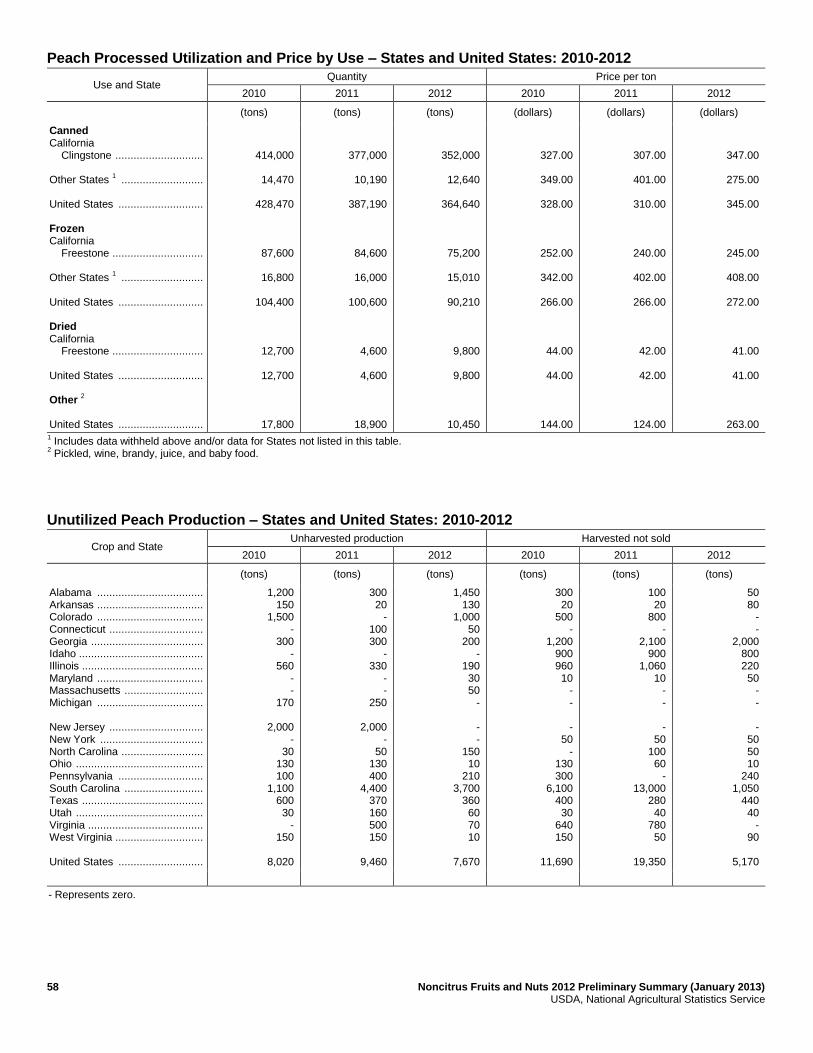
58 Noncitrus Fruits and Nuts 2012 Preliminary Summary (January 2013) USDA, National Agricultural Statistics Service
Peach Processed Utilization and Price by Use – States and United States: 2010-2012
Use and State Quantity Price per ton
2010 2011 2012 2010 2011 2012
(tons) (tons) (tons) (dollars) (dollars) (dollars)
Canned California Clingstone ............................. Other States
1 ...........................
United States ............................ Frozen California Freestone .............................. Other States
1 ...........................
United States ............................ Dried California Freestone .............................. United States ............................ Other
2
United States ............................
414,000
14,470
428,470
87,600
16,800
104,400
12,700
12,700
17,800
377,000
10,190
387,190
84,600
16,000
100,600
4,600
4,600
18,900
352,000
12,640
364,640
75,200
15,010
90,210
9,800
9,800
10,450
327.00
349.00
328.00
252.00
342.00
266.00
44.00
44.00
144.00
307.00
401.00
310.00
240.00
402.00
266.00
42.00
42.00
124.00
347.00
275.00
345.00
245.00
408.00
272.00
41.00
41.00
263.00 1 Includes data withheld above and/or data for States not listed in this table.
2 Pickled, wine, brandy, juice, and baby food.
Unutilized Peach Production – States and United States: 2010-2012
Crop and State Unharvested production Harvested not sold
2010 2011 2012 2010 2011 2012
(tons) (tons) (tons) (tons) (tons) (tons)
Alabama ................................... Arkansas ................................... Colorado ................................... Connecticut ............................... Georgia ..................................... Idaho ......................................... Illinois ........................................ Maryland ................................... Massachusetts .......................... Michigan ................................... New Jersey ............................... New York .................................. North Carolina ........................... Ohio .......................................... Pennsylvania ............................ South Carolina .......................... Texas ........................................ Utah .......................................... Virginia ...................................... West Virginia ............................. United States ............................
1,200 150
1,500 -
300 -
560 - -
170
2,000 -
30 130 100
1,100 600 30
- 150
8,020
300 20
- 100 300
- 330
- -
250
2,000 -
50 130 400
4,400 370 160 500 150
9,460
1,450 130
1,000 50
200 -
190 30 50
-
- -
150 10
210 3,700
360 60 70 10
7,670
300 20
500 -
1,200 900 960 10
- -
- 50
- 130 300
6,100 400 30
640 150
11,690
100 20
800 -
2,100 900
1,060 10
- -
- 50
100 60
- 13,000
280 40
780 50
19,350
50 80
- -
2,000 800 220 50
- -
- 50 50 10
240 1,050
440 40
- 90
5,170
- Represents zero.
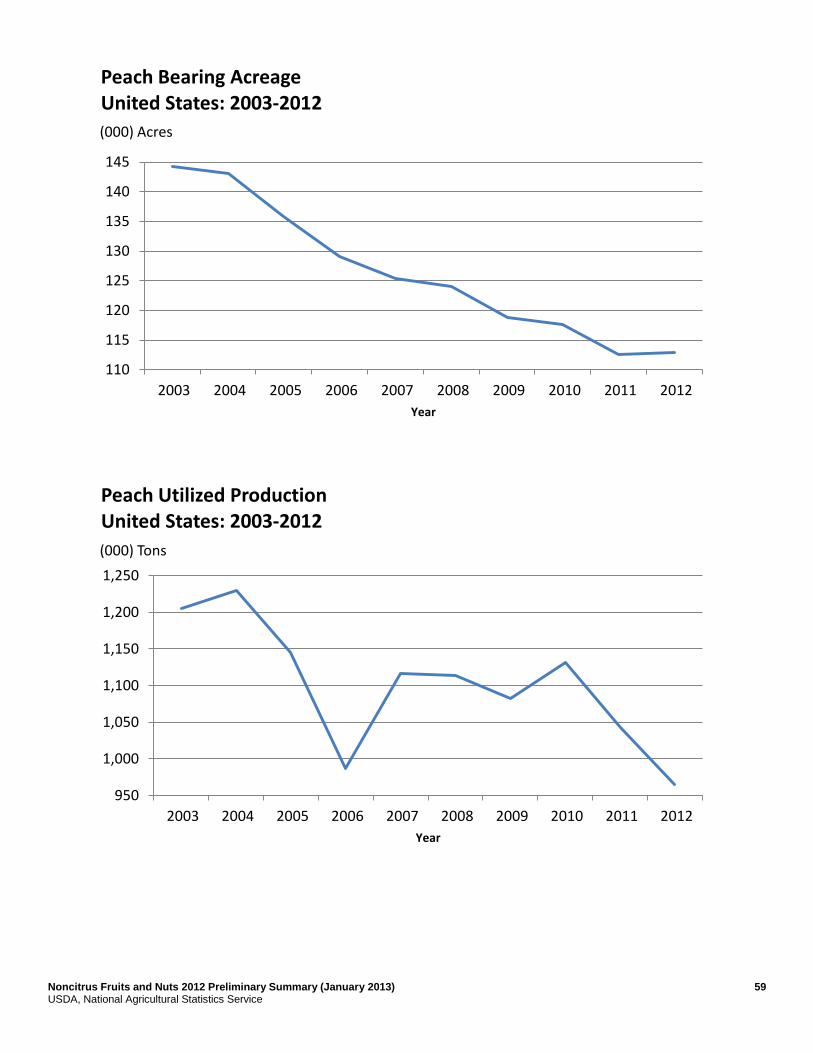
Noncitrus Fruits and Nuts 2012 Preliminary Summary (January 2013) 59 USDA, National Agricultural Statistics Service
110
115
120
125
130
135
140
145
2003 2004 2005 2006 2007 2008 2009 2010 2011 2012
(000) Acres
Year
Peach Bearing Acreage United States: 2003-2012
950
1,000
1,050
1,100
1,150
1,200
1,250
2003 2004 2005 2006 2007 2008 2009 2010 2011 2012
(000) Tons
Year
Peach Utilized Production United States: 2003-2012

60 Noncitrus Fruits and Nuts 2012 Preliminary Summary (January 2013) USDA, National Agricultural Statistics Service
All Pear Bearing Acreage, Yield, Production, Utilization, Price, and Value – States and United States: 2010-2012
State and year Bearing acreage Yield per acre 1
Production Utilization
Total Utilized Fresh Processed
(acres) (tons) (tons) (tons) (tons) (tons)
California 2010 ............................ 2011 ............................ 2012 ............................ Michigan 2010 ............................ 2011 ............................ 2012 ............................ New York 2010 ............................ 2011 ............................ 2012 ............................ Oregon 2010 ............................ 2011 ............................ 2012 ............................ Pennsylvania 2010 ............................ 2011 ............................ 2012 ............................ Washington 2010 ............................ 2011 ............................ 2012 ............................ United States
2
2010 ............................ 2011 ............................ 2012 ............................
14,000 14,000 14,000
800 700 700
1,200 1,200 1,200
16,200 16,200 16,200
800 800 800
23,000 21,500 21,500
56,000 54,400 54,400
15.70 18.00 15.40
1.13 6.29 0.06
6.92 10.10 2.58
11.90 14.00 15.30
3.00 2.78 1.38
17.00 21.80 18.20
14.50 17.80 15.80
220,000 252,000 215,000
900
4,400 40
8,300 12,100 3,100
192,000 227,000 248,000
2,400 2,220 1,100
390,000 468,000 391,000
813,600 965,720 858,240
220,000 252,000 215,000
900
4,400 40
8,200 11,600 3,100
192,000 227,000 248,000
2,300 2,110
990
390,000 468,000 391,000
813,400 965,110 858,130
(D) (D) (D)
(D) (D) (D)
(D) (D) (D)
(D) (D) (D)
(D) (D) (D)
(D) (D) (D)
531,430 643,710 558,320
(D) (D) (D)
(D) (D) (D)
(D) (D) (D)
(D) (D) (D)
(D) (D) (D)
(D) (D) (D)
281,970 321,400 299,810
See footnote(s) at end of table. --continued

Noncitrus Fruits and Nuts 2012 Preliminary Summary (January 2013) 61 USDA, National Agricultural Statistics Service
All Pear Bearing Acreage, Yield, Production, Utilization, Price, and Value – States and United States: 2010-2012 (continued)
State and year
Price per ton Value of production
Fresh Processed excludes
dried All Fresh
Processed includes
dried All
(dollars) (dollars) (dollars) (1,000 dollars) (1,000 dollars) (1,000 dollars)
California 2010 ...................... 2011 ...................... 2012 ...................... Michigan 2010 ...................... 2011 ...................... 2012 ...................... New York 2010 ...................... 2011 ...................... 2012 ...................... Oregon 2010 ...................... 2011 ...................... 2012 ...................... Pennsylvania 2010 ...................... 2011 ...................... 2012 ...................... Washington 2010 ...................... 2011 ...................... 2012 ...................... United States
2
2010 ...................... 2011 ...................... 2012 ......................
(D) (D) (D)
(D) (D) (D)
(D) (D) (D)
(D) (D) (D)
(D) (D) (D)
(D) (D) (D)
599.00 451.00 656.00
(D) (D) (D)
(D) (D) (D)
(D) (D) (D)
(D) (D) (D)
(D) (D) (D)
(D) (D) (D)
243.00 237.00 237.00
435.00 388.00 437.00
348.00 275.00 625.00
601.00 600.00 758.00
499.00 341.00 541.00
1,100.00 995.00 794.00
481.00 387.00 526.00
476.00 380.00 509.00
(D) (D) (D)
(D) (D) (D)
(D) (D) (D)
(D) (D) (D)
(D) (D) (D)
(D) (D) (D)
318,528 290,233 366,006
(D) (D) (D)
(D) (D) (D)
(D) (D) (D)
(D) (D) (D)
(D) (D) (D)
(D) (D) (D)
68,427 76,319 71,107
95,690 97,805 93,977
313 1,209
25
4,932 6,956 2,350
95,896 77,406
134,241
2,533 2,100
786
187,591 181,076 205,734
386,955 366,552 437,113
(D) Withheld to avoid disclosing data for individual operations. 1
Yield is based on total production. 2
Processed mostly canned, but includes small quantities dried and other uses not published separately to avoid disclosure of individual operations.
Unutilized Pear Production – States and United States: 2010-2012
State Unharvested production Harvested not sold
2010 2011 2012 2010 2011 2012
(tons) (tons) (tons) (tons) (tons) (tons)
New York ................... Pennsylvania ............. United States .............
100 -
100
500 10
510
- 20
20
- 100
100
- 100
100
- 90
90
- Represents zero.

62 Noncitrus Fruits and Nuts 2012 Preliminary Summary (January 2013) USDA, National Agricultural Statistics Service
Pear Bearing Acreage, Yield, Production, Utilization, Price, and Value by Type – States and United States: 2010-2012
Type, State and year
Bearing acreage Yield per acre 1
Production Utilization
Total Utilized Fresh Processed
(acres) (tons) (tons) (tons) (tons) (tons)
Bartlett 2
California 2010 ..................... 2011 ..................... 2012 ..................... Oregon 2010 ..................... 2011 ..................... 2012 ..................... Washington 2010 ..................... 2011 ..................... 2012 ..................... United States 2010 ..................... 2011 ..................... 2012 ..................... Other
3
California 2010 ..................... 2011 ..................... 2012 ..................... Oregon 2010 ..................... 2011 ..................... 2012 ..................... Washington 2010 ..................... 2011 ..................... 2012 ..................... United States 2010 ..................... 2011 ..................... 2012 .....................
10,000 10,000 10,000
4,200 4,200 4,200
10,000 9,500 9,500
24,200 23,700 23,700
4,000 4,000 4,000
12,000 12,000 12,000
13,000 12,000 12,000
29,000 28,000 28,000
17.00 19.50 16.50
11.20 11.20 14.50
16.80 19.80 19.10
15.90 18.10 17.20
12.50 14.30 12.50
12.10 15.00 15.60
17.10 23.30 17.50
14.40 18.50 16.00
170,000 195,000 165,000
47,000 47,000 61,000
168,000 188,000 181,000
385,000 430,000 407,000
50,000 57,000 50,000
145,000 180,000 187,000
222,000 280,000 210,000
417,000 517,000 447,000
170,000 195,000 165,000
47,000 47,000 61,000
168,000 188,000 181,000
385,000 430,000 407,000
50,000 57,000 50,000
145,000 180,000 187,000
222,000 280,000 210,000
417,000 517,000 447,000
55,000 64,000 55,000
31,000 29,000 30,000
63,000 68,000 76,000
149,000 161,000 161,000
(D) (D) (D)
(D) (D) (D)
(D) (D) (D)
373,000 469,000 393,500
115,000 131,000 110,000
16,000 18,000 31,000
105,000 120,000 105,000
236,000 269,000 246,000
(D) (D) (D)
(D) (D) (D)
(D) (D) (D)
44,000 48,000 53,500
See footnote(s) at end of table. --continued

Noncitrus Fruits and Nuts 2012 Preliminary Summary (January 2013) 63 USDA, National Agricultural Statistics Service
Pear Bearing Acreage, Yield, Production, Utilization, Price, and Value by Type – States and United States: 2010-2012 (continued)
Type, State and year
Price per ton Value of production
Fresh Processed excludes
dried All Fresh
Processed includes
dried All
(dollars) (dollars) (dollars) (1,000 dollars) (1,000 dollars) (1,000 dollars)
Bartlett 2
California 2010 .................... 2011 .................... 2012 .................... Oregon 2010 .................... 2011 .................... 2012 .................... Washington 2010 .................... 2011 .................... 2012 .................... United States 2010 .................... 2011 .................... 2012 .................... Other
3
California 2010 .................... 2011 .................... 2012 .................... Oregon 2010 .................... 2011 .................... 2012 .................... Washington 2010 .................... 2011 .................... 2012 .................... United States 2010 .................... 2011 .................... 2012 ....................
501.00 340.00 470.00
575.00 495.00 671.00
583.00 544.00 656.00
551.00 454.00 595.00
(D) (D) (D)
(D) (D) (D)
(D) (D) (D)
614.00 444.00 679.00
321.00 298.00 322.00
248.00 248.00 245.00
239.00 242.00 235.00
279.00 270.00 275.00
(D) (D) (D)
(D) (D) (D)
(D) (D) (D)
46.40 52.60 63.60
379.00 311.00 371.00
464.00 400.00 455.00
368.00 351.00 412.00
384.00 339.00 402.00
626.00 651.00 656.00
511.00 326.00 570.00
567.00 411.00 625.00
554.00 408.00 605.00
27,555 21,760 25,850
17,825 14,355 20,130
36,729 36,992 49,856
82,109 73,107 95,836
(D) (D) (D)
(D) (D) (D)
(D) (D) (D)
229,176 208,165 267,105
36,825 38,949 35,332
3,971 4,461 7,606
25,054 29,082 24,668
65,850 72,492 67,606
(D) (D) (D)
(D) (D) (D)
(D) (D) (D)
2,042 2,523 3,405
64,380 60,709 61,182
21,796 18,816 27,736
61,783 66,074 74,524
147,959 145,599 163,442
31,310 37,096 32,795
74,100 58,590
106,505
125,808 115,002 131,210
231,218 210,688 270,510
(D) Withheld to avoid disclosing data for individual operations. 1
Yield is based on total production. 2
Processed mostly canned, but includes small quantities dried and other uses not published separately to avoid disclosure of individual operations. 3
Processed mostly juice, but includes small quantities canned and other uses not published separately to avoid disclosure of individual operations.

64 Noncitrus Fruits and Nuts 2012 Preliminary Summary (January 2013) USDA, National Agricultural Statistics Service
Tropical Fruit Acreage Harvested, Yield, Utilized Production, Utilization, Price, and Value by Crop – Hawaii: 2010-2012 [Blank cells indicate estimation period has not yet begun]
Crop and year Acreage harvested Yield per acre Utilized production Utilization
Fresh Processed
(acres) (1,000 pounds) (1,000 pounds) (1,000 pounds) (1,000 pounds)
Bananas 2010 ........................................... 2011 ........................................... 2012 ........................................... Guavas 2010 ........................................... 2011 ........................................... 2012 ........................................... Papayas 2010 ........................................... 2011 ........................................... 2012 ...........................................
1,100 1,000
115 110
1,350 1,300
16.2 17.4
11.3 17.3
22.3 22.0
17,800 17,400
1,300 1,900
30,100 28,600
17,800 17,400
(NA) (NA)
29,200 27,700
(NA) (NA)
1,300 1,900
900 900
Crop and year Price Value of production
Fresh Processed All Fresh Processed Total
(dollars per
pound) (dollars per
pound) (dollars per
pound) (1,000 dollars) (1,000 dollars) (1,000 dollars)
Bananas 2010 ........................................... 2011 ........................................... 2012 ........................................... Guavas 2010 ........................................... 2011 ........................................... 2012 ........................................... Papayas 2010 ........................................... 2011 ........................................... 2012 ...........................................
0.600 0.650
(X) (X)
0.380 0.350
(X) (X)
0.169 0.170
0.030 0.030
0.600 0.650
0.169 0.170
0.370 0.340
10,680 11,310
(X) (X)
11,096 9,695
(X) (X)
220 323
27 27
10,680 11,310
220 323
11,123 9,722
(NA) Not available. (X) Not applicable.
Noncitrus Fruits and Nuts 2012 Preliminary Summary (January 2013) 65 USDA, National Agricultural Statistics Service
This page intentionally left blank.

66 Noncitrus Fruits and Nuts 2012 Preliminary Summary (January 2013) USDA, National Agricultural Statistics Service
Apple for Fresh Use Monthly Average Prices Received – States and United States: July 2011-August 2012 [Equivalent packinghouse-door returns for California, Michigan, New York, and Washington; price at point of first sale for other States. Prices for July and August 2012 are preliminary for all States and the United States except Washington. These two months represent the start of the 2012 crop marketing season in most States, but in Washington they are the final months of the 2011 crop marketing season]
State 2011 2012
July August September October November December January
(dollars per)
(pound) (dollars per)
(pound) (dollars per)
(pound) (dollars per)
(pound) (dollars per)
(pound) (dollars per)
(pound) (dollars per)
(pound)
California ..................... Michigan ...................... New York ..................... Ohio ............................. Pennsylvania ............... Virginia ......................... Washington .................. United States ...............
(NA) (NA) (NA)
0.640 (NA) (NA)
0.330
0.358
0.634 (NA) (NA)
0.510 (S)
(NA) 0.422
0.458
(S) 0.420 0.393 0.490
(S) 0.430 0.524
0.421
0.481 0.385 0.376 0.490
(S) 0.400 0.444
0.431
(NA) 0.350 0.363 0.430 0.306 0.400 0.433
0.344
(NA) 0.350 0.359 0.420 0.285 0.330 0.380
0.302
(NA) 0.320 0.314 0.450
(S) 0.320 0.373
0.320
State 2012
February March April May June July August
(dollars per) (pound)
(dollars per) (pound)
(dollars per) (pound)
(dollars per) (pound)
(dollars per) (pound)
(dollars per) (pound)
(dollars per) (pound)
California ..................... Michigan ...................... New York ..................... Ohio ............................. Pennsylvania ............... Virginia ......................... Washington .................. United States ...............
(NA) 0.320 0.300 0.400 0.288 0.350 0.355
0.306
(NA) 0.320 0.298 0.470 0.402 0.350 0.338
0.332
(NA) 0.300 0.285 0.520 (NA) (NA)
0.329
0.300
(NA) 0.300 0.285 0.520 (NA) (NA)
0.351
0.300
(NA) (NA)
0.323 0.670 (NA) (NA)
0.390
0.384
(NA) (NA) (NA)
0.590 (NA) (NA)
0.419
0.419
0.756 (NA) (NA)
0.590 0.526 (NA)
0.490
0.529
(NA) Not available. (S) Insufficient number of reports to establish an estimate.
Apples for Fresh Use Monthly Average Prices Received – United States: July 2008 - December 2012 [Equivalent packinghouse door returns for California, Michigan, New York, and Washington]
Year Jul Aug Sep Oct Nov Dec Jan 1 Feb Mar Apr May Jun
($/lb) ($/lb) ($/lb) ($/lb) ($/lb) ($/lb) ($/lb) ($/lb) ($/lb) ($/lb) ($/lb) ($/lb)
2008 ................ 2009 ................ 2010 ................ 2011 ................ 2012 ................
0.446 0.172 0.299 0.358 0.419
0.537 0.237 0.291 0.458 0.529
0.506 0.337 0.324 0.421 0.616
0.425 0.274 0.332 0.431 0.535
0.360 0.256 0.303 0.344 0.479
0.293 0.227 0.268 0.302 0.474
0.272 0.218 0.251 0.320
0.237 0.243 0.238 0.306
0.215 0.220 0.268 0.332
0.204 0.209 0.269 0.300
0.187 0.229 0.277 0.300
0.181 0.208 0.278 0.384
1 January of the following year.
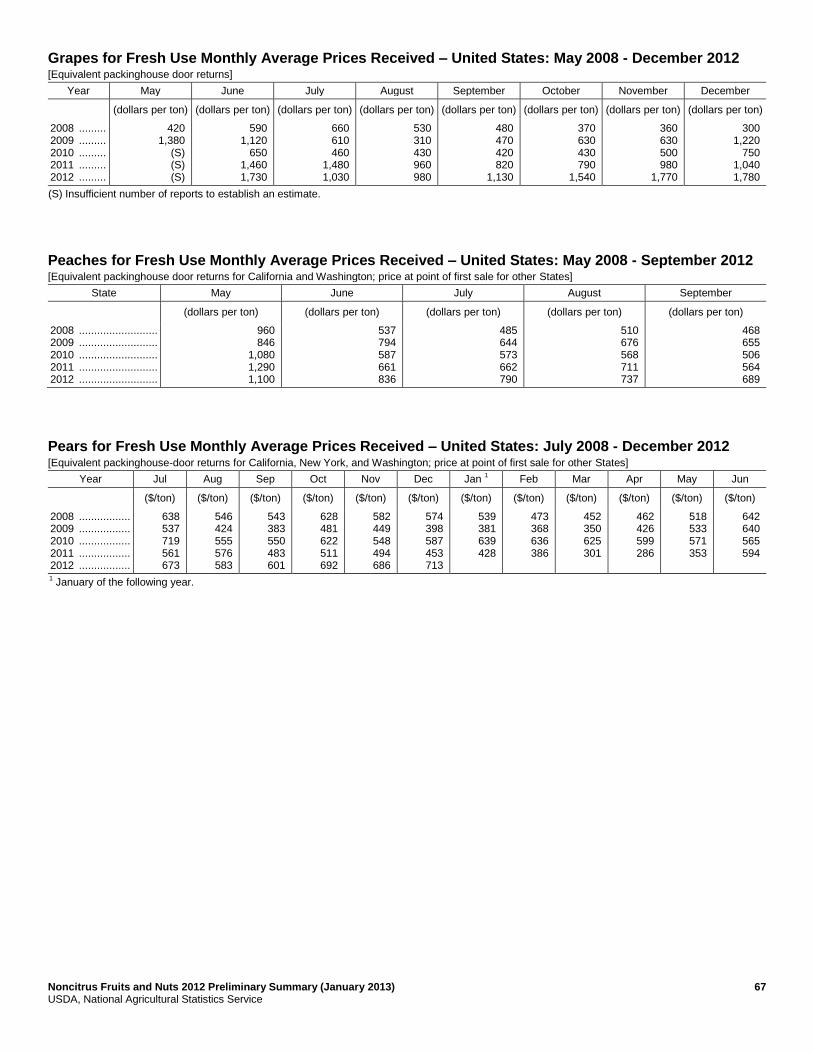
Noncitrus Fruits and Nuts 2012 Preliminary Summary (January 2013) 67 USDA, National Agricultural Statistics Service
Grapes for Fresh Use Monthly Average Prices Received – United States: May 2008 - December 2012 [Equivalent packinghouse door returns]
Year May June July August September October November December
(dollars per ton) (dollars per ton) (dollars per ton) (dollars per ton) (dollars per ton) (dollars per ton) (dollars per ton) (dollars per ton)
2008 ......... 2009 ......... 2010 ......... 2011 ......... 2012 .........
420 1,380
(S) (S) (S)
590 1,120
650 1,460 1,730
660 610 460
1,480 1,030
530 310 430 960 980
480 470 420 820
1,130
370 630 430 790
1,540
360 630 500 980
1,770
300 1,220
750 1,040 1,780
(S) Insufficient number of reports to establish an estimate.
Peaches for Fresh Use Monthly Average Prices Received – United States: May 2008 - September 2012 [Equivalent packinghouse door returns for California and Washington; price at point of first sale for other States]
State May June July August September
(dollars per ton) (dollars per ton) (dollars per ton) (dollars per ton) (dollars per ton)
2008 .......................... 2009 .......................... 2010 .......................... 2011 .......................... 2012 ..........................
960 846
1,080 1,290 1,100
537 794 587 661 836
485 644 573 662 790
510 676 568 711 737
468 655 506 564 689
Pears for Fresh Use Monthly Average Prices Received – United States: July 2008 - December 2012 [Equivalent packinghouse-door returns for California, New York, and Washington; price at point of first sale for other States]
Year Jul Aug Sep Oct Nov Dec Jan 1 Feb Mar Apr May Jun
($/ton) ($/ton) ($/ton) ($/ton) ($/ton) ($/ton) ($/ton) ($/ton) ($/ton) ($/ton) ($/ton) ($/ton)
2008 ................. 2009 ................. 2010 ................. 2011 ................. 2012 .................
638 537 719 561 673
546 424 555 576 583
543 383 550 483 601
628 481 622 511 692
582 449 548 494 686
574 398 587 453 713
539 381 639 428
473 368 636 386
452 350 625 301
462 426 599 286
518 533 571 353
642 640 565 594
1 January of the following year.

68 Noncitrus Fruits and Nuts 2012 Preliminary Summary (January 2013) USDA, National Agricultural Statistics Service
Tree Nut Bearing Acreage, Yield, Production, Price, and Value by Crop – States: 2010-2012 [Blank cells indicate estimation period has not yet begun]
Crop, State, and year
Bearing acreage Yield per acre 1 Utilized production Price per unit
Value of utilized production
(acres) (tons) (tons) (dollars per ton) (1,000 dollars)
English walnuts, in-shell California 2010 ................................. 2011 ................................. 2012 .................................
237,000 245,000 245,000
2.13 1.88 1.92
504,000 461,000 470,000
2,040 2,900
1,028,160 1,336,900
Hazelnuts, in-shell Oregon 2010 ................................. 2011 ................................. 2012 .................................
29,000 28,500 29,000
0.97 1.35 1.20
28,000 38,500 34,700
2,410 2,330 1,830
67,480 89,705 63,420
(acres) (pounds) (1,000 pounds) (dollars per pound) (1,000 dollars)
Almonds, shelled 2 3
California 2010 ................................. 2011 ................................. 2012 .................................
740,000 760,000 780,000
2,220 2,670 2,560
1,640,000 2,030,000 2,000,000
1.790 1.990 2.200
2,903,380 4,007,860 4,347,200
Macadamia nuts, in-shell Hawaii 2010 ................................. 2011 ................................. 2012 .................................
15,000 15,000 15,000
2,670 3,270 2,930
40,000 49,000 44,000
0.750 0.780 0.800
30,000 38,220 35,200
Pistachios, in-shell California 2010 ................................. 2011 ................................. 2012 .................................
137,000 153,000 178,000
3,810 2,900 3,100
522,000 444,000 551,000
2.220 1.980 2.020
1,158,840 879,120
1,113,020 1 Yield is based on utilized production.
2 Price and value are based on the edible portion of the crop only. Production includes inedible quantities of no value as follows: 2010 - 18.0 million pounds; 2011 - 16.0 million pounds; 2012 - 24.0 million pounds.
3 Shelling ratios are: 2010 - 0.580; 2011 - 0.596; 2012 - 0.578.

Noncitrus Fruits and Nuts 2012 Preliminary Summary (January 2013) 69 USDA, National Agricultural Statistics Service
Tree Nut Utilization and Meat Production by Crop – States and United States: 2010-2012 [Blank cells indicate estimation period has not yet begun. Estimates for 2012 will be published on July 17, 2013.]
Crop, State, and year
Utilized production Meat production of nuts sold shelled Sold in-shell Sold shelled
1
(tons) (tons) (tons)
English walnuts California 2010 ...................................................... 2011 ...................................................... 2012 ......................................................
141,000 125,000
363,000 336,000
159,000 146,000
Hazelnuts Oregon 2010 ...................................................... 2011 ...................................................... 2012 ......................................................
20,050 29,300
7,950 9,200
3,100 3,730
(1,000 pounds) (1,000 pounds) (1,000 pounds)
Pecans United States 2010 ...................................................... 2011 ...................................................... 2012 ......................................................
89,884 49,355
203,856 220,345
97,443 101,799
Pistachios California 2010 ...................................................... 2011 ...................................................... 2012 ......................................................
378,000 341,000 464,000
144,000 103,000 87,000
69,000 51,500 43,500
1 In-shell basis.

70 Noncitrus Fruits and Nuts 2012 Preliminary Summary (January 2013) USDA, National Agricultural Statistics Service
800,000
1,000,000
1,200,000
1,400,000
1,600,000
1,800,000
2,000,000
2,200,000
2003 2004 2005 2006 2007 2008 2009 2010 2011 2012
(000) Pounds Shelled basis
Year
California Almonds Utilized Production United States: 2003-2012
270,000
320,000
370,000
420,000
470,000
520,000
2003 2004 2005 2006 2007 2008 2009 2010 2011 2012
Tons In-shell basis
Year
California English Walnuts Utilized Production United States: 2003-2012

Noncitrus Fruits and Nuts 2012 Preliminary Summary (January 2013) 71 USDA, National Agricultural Statistics Service
Pecan Production, Price, and Value by Variety – States and United States: 2010-2012
Variety and State
Utilized production (In-shell basis)
Price per pound Value of utilized production
2010 2011 2012 2010 2011 2012 2010 2011 2012
(1,000
pounds) (1,000
pounds) (1,000
pounds) (dollars) (dollars) (dollars)
(1,000 dollars)
(1,000 dollars)
(1,000 dollars)
Improved varieties 1
Alabama ........................... Arizona ............................. Arkansas .......................... California .......................... Florida .............................. Georgia ............................ Louisiana .......................... Mississippi ........................ Missouri ............................ New Mexico ...................... Oklahoma ......................... South Carolina .................. Texas ............................... United States .................... Native and seedling Alabama ........................... Arkansas .......................... Florida .............................. Georgia ............................ Kansas ............................. Louisiana .......................... Mississippi ........................ Missouri ............................ Oklahoma ......................... South Carolina .................. Texas ............................... United States .................... All pecans Alabama ........................... Arizona ............................. Arkansas .......................... California .......................... Florida .............................. Georgia ............................ Kansas ............................. Louisiana .......................... Mississippi ........................ Missouri ............................ New Mexico ...................... Oklahoma ......................... South Carolina .................. Texas ............................... United States ....................
4,500
22,000 780
5,700 1,200
70,000 3,500 1,400
180 66,000
6,000 1,300
50,000
232,560
500 320 300
5,000 3,000
16,500 700 660
14,000 200
20,000
61,180
5,000 22,000 1,100 5,700 1,500
75,000 3,000
20,000 2,100
840
66,000 20,000 1,500
70,000
293,740
13,000 18,500 1,300 3,700 1,400
92,000 2,500 3,400
190 61,000
2,000 2,040
26,000
227,030
6,000 1,200 2,600
10,000 1,500 7,500 1,600 1,310 4,000
960 6,000
42,670
19,000 18,500 2,500 3,700 4,000
102,000 1,500
10,000 5,000 1,500
61,000 6,000 3,000
32,000
269,700
3,400
20,000 1,600 4,800 1,100
96,000 5,000 2,000
200 65,000
5,000 1,500
42,000
247,600
600 600 900
4,000 3,000
10,000 500
2,300 20,000
300 13,000
55,200
4,000 20,000 2,200 4,800 2,000
100,000 3,000
15,000 2,500 2,500
65,000 25,000 1,800
55,000
302,800
1.750 2.800 2.000 2.540 1.900 2.200 2.000 1.600 2.200 2.830
2.100 1.800 2.500
2.490
1.180 1.620 1.100 1.700 1.750 1.350 1.100 1.600 1.650 1.450 1.700
1.580
1.690 2.800 1.890 2.540 1.740 2.170 1.750 1.460 1.430 1.730
2.830 1.790 1.750 2.270
2.300
1.830 2.800 1.980 2.670 1.850 2.650 2.200 1.800 1.900 2.670
2.400 2.000 2.650
2.590
1.310 1.580 1.400 2.080 1.800 1.400 1.400 1.750 1.650 1.350 1.500
1.610
1.670 2.800 1.790 2.670 1.560 2.590 1.800 1.600 1.670 1.770
2.670 1.900 1.790 2.430
2.430
1.400 1.600 1.540 1.580 1.100 1.940 1.300 1.250 1.450 1.700
1.550 1.750 1.520
1.730
0.830 0.850 0.750 1.220 1.350 0.700 0.850 0.950 0.850 1.250 0.840
0.879
1.310 1.600 1.350 1.580 0.943 1.910 1.350 0.900 1.170 0.990
1.700 0.990 1.670 1.360
1.570
7,875
61,600 1,560
14,478 2,280
154,000 7,000 2,240
396 186,780
12,600 2,340
125,000
578,149
590 518 330
8,500 5,250
22,275 770
1,056 23,100
290 34,000
96,679
8,465 61,600 2,078
14,478 2,610
162,500 5,250
29,275 3,010 1,452
186,780 35,700 2,630
159,000
674,828
23,790 51,800 2,574 9,879 2,590
243,800 5,500 6,120
361 162,870
4,800 4,080
68,900
587,064
7,860 1,896 3,640
20,800 2,700
10,500 2,240 2,293 6,600 1,296 9,000
68,825
31,650 51,800 4,470 9,879 6,230
264,600 2,700
16,000 8,360 2,654
162,870 11,400 5,376
77,900
655,889
4,760
32,000 2,464 7,584 1,210
186,240 6,500 2,500
290 110,500
7,750 2,625
63,840
428,263
498 510 675
4,880 4,050 7,000
425 2,185
17,000 375
10,920
48,518
5,258 32,000 2,974 7,584 1,885
191,120 4,050
13,500 2,925 2,475
110,500 24,750 3,000
74,760
476,781 1 Budded, grafted, or topworked varieties.

72 Noncitrus Fruits and Nuts 2012 Preliminary Summary (January 2013) USDA, National Agricultural Statistics Service
Crop Comments
Apples: Utilized apple production for 2012 is estimated at 8.99 billion pounds, down 3 percent from 2011. New York’s
apple growers reported that their crop was negatively impacted by early warm weather in March which prompted
budding, followed by freezing in April and drought conditions in June and July. The Michigan apple crop potential was
drastically diminished from a series of severe frosts in April. This followed abnormally high temperatures in March that
had pushed budding far ahead of normal. As of mid-December, the harvest was two to three weeks ahead of normal due to
the hot summer and small crop. Washington apple growers reported good growing conditions, without losses from freezes
or frost, which allowed for more picking days and more fruit being harvested this year.
Grapes: Utilized grape production for 2012 is estimated at 7.34 million tons, down 1 percent from 2011. The California
crop, which accounts for 91 percent of the 2012 United States utilized grape production, is down slightly from the
previous year. The most notable decreases in utilized production were in Michigan, New York, and Pennsylvania where
the crop experienced unusually warm temperatures in March followed by a devastating freeze in April. In New York, the
utilized production was the lowest since 1977.
The grape crop in California developed well in 2012 due to the warm and dry weather. Yields for wine grapes were higher
than last year’s frost damaged crop in most of the growing region.
Peaches: Utilized peach production for 2012 is estimated at 965,420 tons, down 7 percent from the previous year. The
California crop, accounting for 74 percent of the United States utilized peach production, is down 8 percent from 2011.
In California, there were some reports of hail damage during the spring, which resulted in significant crop loss. An
adequate number of chilling hours benefited the Freestone crop. There were some reports of hail damage during the
spring, which resulted in significant crop loss.
Higher labor costs and a lack of workers to thin the California Clingstone crop were a big concern for growers as the crop
required a great deal of thinning. This year’s crop deliveries represented the third smallest crop in fifty years. The largest
yield decrease occurred in the early varieties, as yields improved as the harvest progressed. Sizes were reported to be
small, resulting in lower production.
In Georgia, drought conditions during most of the growing season lowered peach production from a year ago. Many
producers reported a lack of chill hours and hail storms negatively impacted this season’s crop.
In South Carolina, harvest started about two weeks early. A mild winter produced inadequate chill hours and subsequent
lower yields from 2011. Scattered hail storms were also reported during the season which did some damage, especially for
"Upstate" producers. Fruit was of good quality, but slightly undersized.
In New Jersey, growing conditions were ideal throughout the spring. Tree bloom and fruit sets were earlier than usual. As
a result, producers began harvesting early and mid-season varieties in June. Peach sizes and quality rated good to
excellent. In Michigan, hot weather in March caused peaches to blossom early. In April, several frosts killed most
blossoms across the state, resulting in about 60 percent of peach growers without a crop.
Pears: Utilized pear production for 2012 is estimated at 858,130 tons, down 11 percent from the revised 2011 estimate.
Five of the six estimating States (California, Michigan, New York, Pennsylvania, and Washington) showed decreased
production from last season.
Washington producers experienced mild spring weather conditions with no losses from frost. Several producers noted
reduced production of D'Anjou and Bosc varieties due to poor weather during pollination. Reports of hail and wind
damage from June and July storms were common. Production further declined due to fire blight.
In California rain and cool weather during the pollination period affected yields in some areas. Harvest began in July and
continued into October. The quality of the crop was reported to be good.

Noncitrus Fruits and Nuts 2012 Preliminary Summary (January 2013) 73 USDA, National Agricultural Statistics Service
Nearly all of Michigan’s crop was destroyed by April freezes. Only 15 percent of growers reported having a crop. In
New York, frost was a major issue, which negatively impacted this year's crop. March was unusually warm, causing early
budding, and was followed by several frosts in April. Many producers reported complete or near complete losses due to
these weather conditions. In Pennsylvania, the crop was significantly impacted by frost and pests. Adverse weather
impacting the pear crop was widespread with few orchards not suffering.
In Oregon, grower comments varied from a down year to fantastic one. Growers reported good pollination weather,
decent bloom weather, and very good growing conditions. Fire blight issues and some frost damage were reported.
Tree nuts: Utilized tree nut production for crop year 2012 is 2.68 million tons (in-shell basis), 4 percent above the
previous year. Almond utilized crop production, at 1.73 million tons is down 2 percent from 2011. Walnut utilized
production in 2012, at 470,000 tons, is up 2 percent from the previous year. Pistachio utilized production, at 275,500 tons
is 24 percent more than 2011. Pecan utilized production in 2012 is estimated at 151,400 tons, a 12 percent increase from
2011. The hazelnut crop, at 34,700 tons, is 1 percent below the previous year. Macadamia nut production is 22,000 tons,
down 10 percent from 2011.
Value of United States utilized nut production in 2012 is 7.40 billion dollars, up 6 percent from the 2011 value. The 2012
utilized almond crop is valued at 4.35 billion dollars, 8 percent more than the previous year. Pistachio utilized crop value
for 2012, at 1.11 billion dollars, is up 27 percent from previous year. The value of the 2012 utilized pecan crop decreased
27 percent to 477 million dollars. Hazelnut utilized crop value, at 63.4 million dollars, is 29 percent below last year. The
2012 utilized macadamia nut crop is valued at 35.2 million dollars, down 8 percent from 2011.

74 Noncitrus Fruits and Nuts 2012 Preliminary Summary (January 2013) USDA, National Agricultural Statistics Service
Definition of Terms
Bearing acreage: An orchard, grove, or vineyard is considered to be of bearing age when it can normally be expected to
produce a commercially significant quantity of the crop. Bearing age is a function of many factors including variety,
rootstock, year planted, etc.
Apple crop: Apple production estimates are published only for commercial orchards, according to the laws governing
crop production reports (7 U.S.C 411b). Commercial orchards, under these laws, are defined as orchards of 100 or more
bearing trees.
Harvested not sold: Fruit of marketable quality that was picked but not sold for various reasons up to 2 percent of total
production is considered normal seasonal loss and is excluded from total production. Reported values are above and
beyond these normal seasonal losses.
Total production: The quantity of a crop actually harvested plus quantities which would have been acceptable for fresh
market or processing but were not harvested because of economic or natural reasons are included in production estimates.
Unutilized production: The difference between total and utilized production, which is marketable fruit not harvested for
economic or natural reasons and harvested fruit not sold or utilized, is unutilized production.
Unharvested production: Marketable fruit produced, but not harvested for various reasons, is unharvested production.
Unharvested amounts up to 2 percent of total production are considered normal seasonal losses and are excluded from
total production. Published estimates of unharvested production represent quantities above and beyond these normal
seasonal losses.
Utilization: These estimates refer to the first utilization, not necessarily the final utilization of a crop. For example, frozen
fruit includes some fruit that may be later used for making preserves. Grade-outs for fresh market fruit which are
processed are included in the processing quantity. Fruit graded-out from canning or freezing and utilized for juice is
included with juice.
Utilized production: The amount of a crop sold plus the quantities used at home or held in storage represents utilized
production.
Yield per acre: Unless otherwise stated, yield per acre is based on total production.

Noncitrus Fruits and Nuts 2012 Preliminary Summary (January 2013) 75 USDA, National Agricultural Statistics Service
Price and Value Definitions
Price: Except where specified as monthly, prices in this report represent the Market Year Average (MYA) price. For a
crop sold for both fresh market and processing, the total crop MYA is a weighted average of the fresh and processing
prices.
Prices for fresh fruit represent the average price producers receive at the point of first sale. This is commonly referred to
as the average price as sold. The exception is fresh fruit sales in California, Michigan (apples only), New York (apples
only), and Washington which are equivalent returns at packinghouse door.
Prices for fruit sold for processing are equivalent returns for fruit delivered to the processing plant door except for
cranberries, California olives, and freestone peaches, which are priced at the first delivery point.
Value: Crop value estimates in this report cover the marketing season or crop year and should not be confused with cash
receipts which are based on a calendar year.
State MYA Price and Value Computations
Fresh Market Value
Fresh Market MYA * Fresh Market Utilization
Processed Value
Processed MYA * Processed Utilization
"All" Value
Fresh Market Value + Processed Value
"All" MYA
"All" Value / "All" Utilization
For commodities with components not identified by market channel, substitute breakdown name for fresh
market/processed and use the same procedure.
United States MYA Price and Value Computations
Fresh Market MYA
∑(Fresh Market Value For All States)
∑(Fresh Market Utilization For All States)
Processed MYA
∑(Processed Value For All States)
∑(Processed Utilization For All States)
"All" MYA
∑(Value For All States)
∑(Utilization For All States)
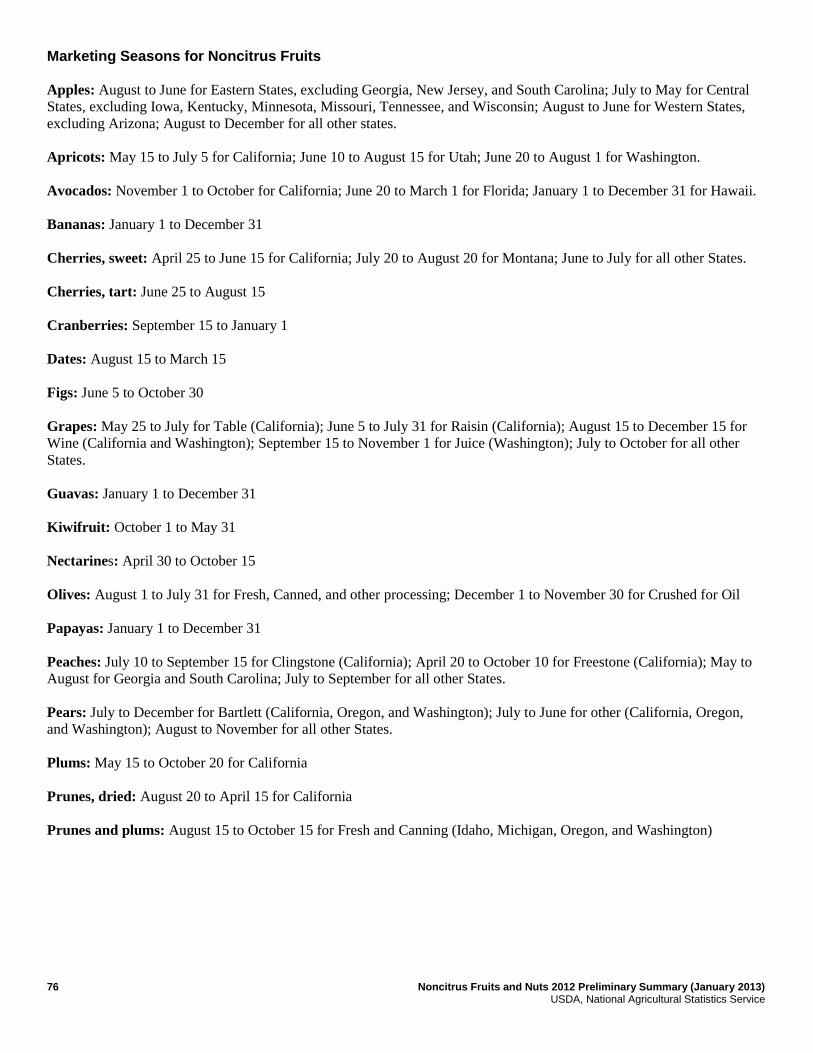
76 Noncitrus Fruits and Nuts 2012 Preliminary Summary (January 2013) USDA, National Agricultural Statistics Service
Marketing Seasons for Noncitrus Fruits
Apples: August to June for Eastern States, excluding Georgia, New Jersey, and South Carolina; July to May for Central
States, excluding Iowa, Kentucky, Minnesota, Missouri, Tennessee, and Wisconsin; August to June for Western States,
excluding Arizona; August to December for all other states.
Apricots: May 15 to July 5 for California; June 10 to August 15 for Utah; June 20 to August 1 for Washington.
Avocados: November 1 to October for California; June 20 to March 1 for Florida; January 1 to December 31 for Hawaii.
Bananas: January 1 to December 31
Cherries, sweet: April 25 to June 15 for California; July 20 to August 20 for Montana; June to July for all other States.
Cherries, tart: June 25 to August 15
Cranberries: September 15 to January 1
Dates: August 15 to March 15
Figs: June 5 to October 30
Grapes: May 25 to July for Table (California); June 5 to July 31 for Raisin (California); August 15 to December 15 for
Wine (California and Washington); September 15 to November 1 for Juice (Washington); July to October for all other
States.
Guavas: January 1 to December 31
Kiwifruit: October 1 to May 31
Nectarines: April 30 to October 15
Olives: August 1 to July 31 for Fresh, Canned, and other processing; December 1 to November 30 for Crushed for Oil
Papayas: January 1 to December 31
Peaches: July 10 to September 15 for Clingstone (California); April 20 to October 10 for Freestone (California); May to
August for Georgia and South Carolina; July to September for all other States.
Pears: July to December for Bartlett (California, Oregon, and Washington); July to June for other (California, Oregon,
and Washington); August to November for all other States.
Plums: May 15 to October 20 for California
Prunes, dried: August 20 to April 15 for California
Prunes and plums: August 15 to October 15 for Fresh and Canning (Idaho, Michigan, Oregon, and Washington)
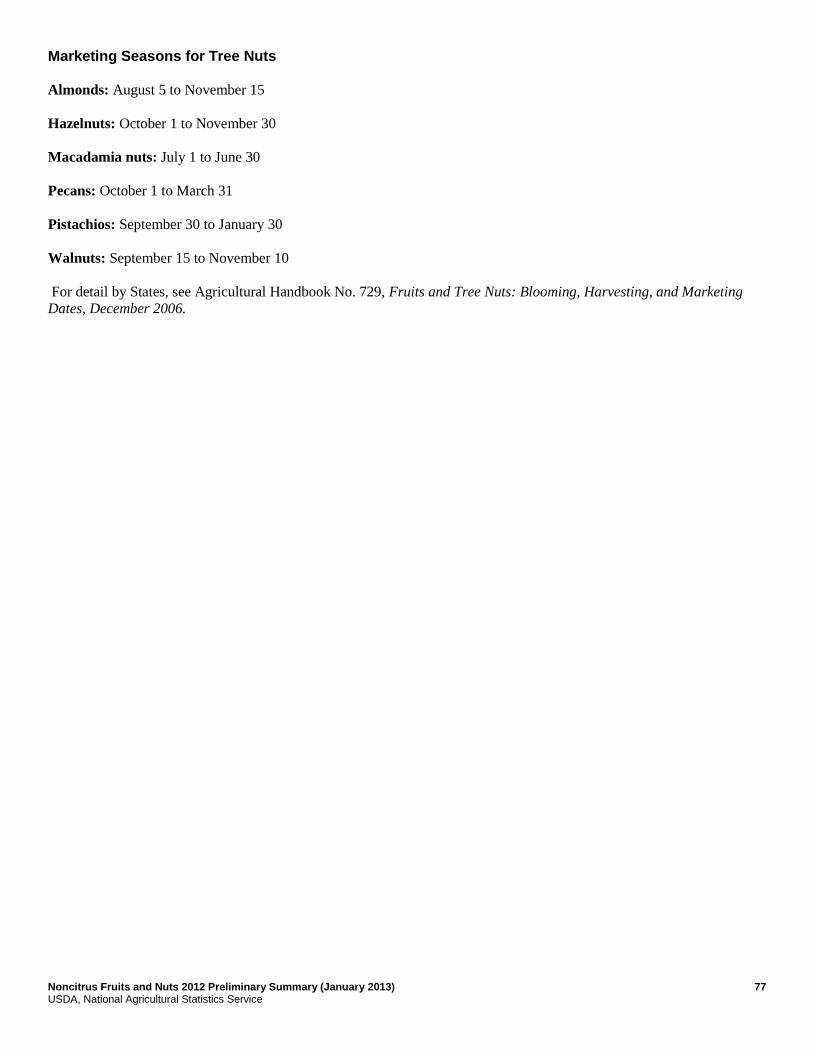
Noncitrus Fruits and Nuts 2012 Preliminary Summary (January 2013) 77 USDA, National Agricultural Statistics Service
Marketing Seasons for Tree Nuts
Almonds: August 5 to November 15
Hazelnuts: October 1 to November 30
Macadamia nuts: July 1 to June 30
Pecans: October 1 to March 31
Pistachios: September 30 to January 30
Walnuts: September 15 to November 10
For detail by States, see Agricultural Handbook No. 729, Fruits and Tree Nuts: Blooming, Harvesting, and Marketing
Dates, December 2006.

78 Noncitrus Fruits and Nuts 2012 Preliminary Summary (January 2013) USDA, National Agricultural Statistics Service
Statistical Methodology
Survey Procedures: Non-probability monthly grower surveys are used to collect crop condition, yield, acreage, and
production data. These fruit inquiries are generally mailed surveys during the growing season. Telephone follow-up of
mail survey non-respondents is used to ensure adequate coverage. Special grower disposition surveys are conducted at the
end of each season to provide additional details about the crop. They provide indications of the quantity used on farms,
the quantity sold directly to consumers, unharvested production, and production not sold or utilized. All fruit and nut
processors or shellers are also surveyed annually to determine quantity handle, utilization, and the origin of the
commodity.
Estimating Procedures: Information obtained from the non-citrus fruits and nuts grower surveys along with federal
administrative data is used to establish estimates of bearing acres, yield, total production, utilized production, price, and
value. These estimates are reviewed for errors, reasonableness, and consistency with historical estimates.
Revision Policy: Final survey indications and check data for most non-citrus fruits and nuts are available prior to
submitting utilization estimates. As a result revisions are allowed for a few crops in the spring. End-of-season estimates of
production are made following harvest and are subject to revision the following year based on a thorough review of all
available data.
Reliability: To assist users in evaluating the reliability of the January noncitrus fruit total production estimates, the "Root
Mean Square Error," a statistical measure based on past performance, is computed. The deviation between the first
January total production estimate and the final estimate is expressed as a percentage of the final estimate. The average of
squared percentage deviations for the latest 20-year period is computed. The square root of the average becomes
statistically the "Root Mean Square Error." Probability statements can be made concerning expected differences in the
current estimate relative to the final end-of-season estimate, assuming that factors affecting this year's estimate are not
different from those influencing recent years. For example, the "Root Mean Square Error" for the January apple total
production estimate is 2.8 percent. This means that chances are 2 out of 3 that the current production estimate will not be
above or below the final estimate by more than 2.8 percent. Chances are 9 out of 10 (90 percent confidence level) that the
difference will not exceed 4.8 percent.
The following table is included with a 20-year record for selected crops of the differences between the first January total
production estimate and the final estimate. Using apples again as an example, changes between the first January estimate
and the final estimate during the last 20 years have averaged 108.9 thousand tons, ranging from 2.5 thousand tons to
351.4 thousand tons. The first January estimate has been below the final estimate 6 times and above 14 times. This does
not imply that the January estimate this year is likely to understate or overstate the final production.
Reliability of Selected Noncitrus Fruit Estimates
Crop
Root mean square error
20-year record of differences between initial estimate
and final estimate
Percent
90 percent
confidence interval
Quantity Years
Average Smallest Largest Below final
Above final
(1,000) (1,000) (1,000) (number) (number)
Apples .......................................... tons Grapes ......................................... tons Peaches ....................................... tons Pears ........................................... tons
2.8 3.9 1.3 3.2
4.8 6.7 2.2 5.5
108.9 197.8 12.0 22.9
2.5 8.6 (Z) 1.0
351.4 838.8 29.9 63.9
6 17 9
15
14 3 9 5
(Z) Less than half of the unit shown.

Noncitrus Fruits and Nuts 2012 Preliminary Summary (January 2013) 79 USDA, National Agricultural Statistics Service
Information Contacts
Listed below are the commodity statisticians in the Crops Branch of the National Agricultural Statistics Service to contact
for additional information. E-mail inquiries may be sent to [email protected]
Lance Honig, Chief, Crops Branch ....................................................................................................... (202) 720-2127
Jorge Garcia-Pratts, Head, Fruits, Vegetables and Special Crops Section............................................ (202) 720-2127
Debbie Flippin – Fresh and Processing Vegetables, Onions, Strawberries ..................................... (202) 720-2157
Fred Granja – Apples, Apricots, Cherries, Plums, Prunes, Tobacco .............................................. (202) 720-4288
Chris Hawthorn – Citrus, Coffee, Grapes, Sugar Crops, Tropical Fruits ........................................ (202) 720-5412
Dave Losh – Hops ............................................................................................................................ (360) 709-2400
Dan Norris – Austrian Winter Peas, Dry Edible Peas, Lentils, Mint,
Mushrooms, Peaches, Pears, Wrinkled Seed Peas, Dry Beans .................................................. (202) 720-3250
Daphne Schauber – Berries, Cranberries, Potatoes, Sweet Potatoes .............................................. (202) 720-4285
Erika White – Floriculture, Maple Syrup, Nursery, Tree Nuts ....................................................... (202) 720-4215

Access to NASS Reports For your convenience, you may access NASS reports and products the following ways:
All reports are available electronically, at no cost, on the NASS web site: http://www.nass.usda.gov
Both national and state specific reports are available via a free e-mail subscription. To set-up this free
subscription, visit http://www.nass.usda.gov and in the “Follow NASS” box under “Receive reports by Email,”
click on “National” or “State” to select the reports you would like to receive.
For more information on NASS surveys and reports, call the NASS Agricultural Statistics Hotline at (800) 727-9540,
7:30 a.m. to 4:00 p.m. ET, or e-mail: [email protected].
The United States Department of Agriculture (USDA) prohibits discrimination in all its programs and activities on the
basis of race, color, national origin, age, disability, and where applicable, sex, marital status, familial status, parental
status, religion, sexual orientation, political beliefs, genetic information, reprisal, or because all or a part of an individual's
income is derived from any public assistance program. (Not all prohibited bases apply to all programs.) Persons with
disabilities who require alternative means for communication of program information (Braille, large print, audiotape, etc.)
should contact USDA's TARGET Center at (202) 720-2600 (voice and TDD).
To file a complaint of discrimination, write to USDA, Assistant Secretary for Civil Rights, Office of the Assistant
Secretary for Civil Rights, 1400 Independence Avenue, S.W., Stop 9410, Washington, DC 20250-9410, or call toll-free at
(866) 632-9992 (English) or (800) 877-8339 (TDD) or (866) 377-8642 (English Federal-relay) or (800) 845-6136
(Spanish Federal-relay). USDA is an equal opportunity provider and employer.