nondestructive testing of concrete box … testing of concrete box girder bridges using thermal...
TRANSCRIPT

NONDESTRUCTIVE TESTING OF CONCRETE BOX
GIRDER BRIDGES USING THERMAL IMAGING
By
KENNETH J. DUPUIS
A thesis submitted in partial fulfillment of
the requirements for the degree of
MASTER OF CIVIL ENGINEERING
WASHINGTON STATE UNIVERSITY Department of Civil and Environmental Engineering
MAY 2008

To the Faculty of Washington State University:
The members of the Committee appointed to examine the thesis of KENNETH J.
DUPUIS find it satisfactory and recommend that it be accepted.
Chair
ii

Acknowledgment
I would like to thank the Civil and Environmental Engineering Department of
Washington State University, Dr. David Pollock, Karl Olsen, the Wood Materials and
Engineering Laboratory (specifically Robert Duncan and Scott Lewis), and the Washington State
Department of Transportation.
Funding for this project was provided by the Federal Highway Administration through
contract number DTFH61-05-C-00008. The prestressing strands and steel ducts were donated by
Central Pre-Mix Prestress Company of Spokane, WA. The plastic ducts were donated by
General Technologies Inc, of Stafford, TX.
iii

NONDESTRUCTIVE TESTING OF CONCRETE BOX GIRDER
BRIDGES USING THERMAL IMAGING
Abstract
By Kenneth J. Dupuis Washington State University
May 2008
Chair: David G. Pollock
In recent years, thermal imaging has become a common nondestructive inspection
method used in the field. This research investigates thermal imaging as a viable option in the
detection of simulated voids in post-tensioning ducts in concrete specimens, the simulated void
size and orientation with respect to adjacent steel tendons, the application of through-heating
with thermal imaging of the unheated concrete surface, the detection of actual voids and
delaminations during field inspections of concrete bridges, and the duration of heat input with
respect to the quality of thermal images that are obtainable.
Field inspections of concrete box girder bridges, along with lab inspections of specimens
simulating post-tensioned box girder bridge walls, have led to the following conclusions. First,
the method of heating is an essential part of inspection depending on the type and location of
defects. Near-surface defects such as delaminations, poorly consolidated concrete, and spalled
concrete are detectable with through-thickness heating, as well as with same-surface heating.
However, internal defects or embedded material such as post-tensioning ducts or voids inside
those ducts are most easily detected with through-thickness heating.
iv

Additional conclusions from this research involve specimen parameters. Concrete
thickness is very important in terms of minimizing heat loss and obtaining a temperature gradient
in a known direction. Inspections of 20 cm (8 in.) test specimens resulted in thermal images
showing defects and tendons more clearly than inspections of 30 cm (12 in.) test specimens.
Also, void size and void orientation with respect to adjacent steel tendons inside the post-
tensioning ducts is critical. Simulated voids located between the heated surface and the tendons
were most often detectable. However, simulated voids located at the same depth as adjacent
tendons were not detectable since the steel tended to mask the presence of any simulated voids.
v

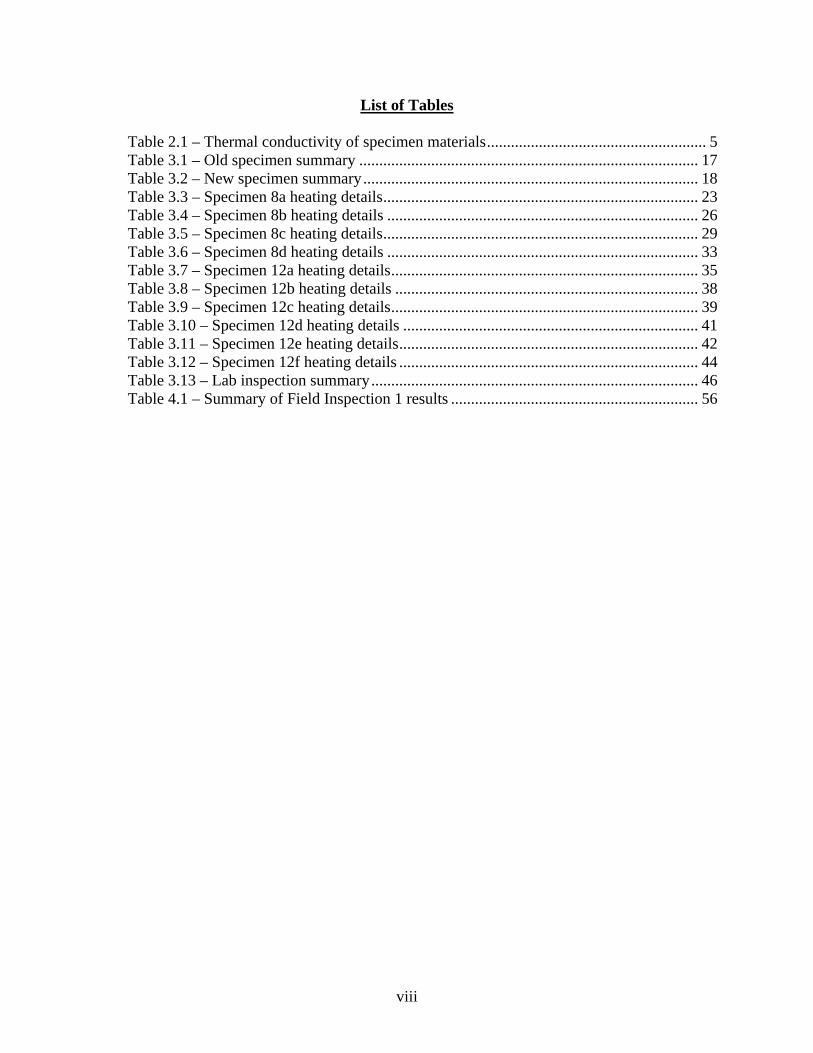
Table of Contents Acknowledgment.......................................................................................................................... iii Abstract......................................................................................................................................... iv List of Tables .............................................................................................................................. viii List of Figures............................................................................................................................... ix Chapter 1 – Introduction and Objectives ................................................................................... 1
1.1 Introduction................................................................................................................... 1 1.2 Problem Statement........................................................................................................ 1 1.3 Objectives....................................................................................................................... 2
Chapter 2 – Literature Review .................................................................................................... 4 2.1 Thermal Imaging Background .................................................................................... 4 2.2 Previous Research Conducted at Washington State University............................... 5 2.3 Other Studies ................................................................................................................. 8
Chapter 3 – Specimen Lab Inspections..................................................................................... 12 3.1 Specimen Description ................................................................................................. 12 3.2 Test Set-up for Thermal Imaging of Lab Specimens............................................... 19 3.3 Thermal Imaging of Lab Specimens ......................................................................... 22
Objective ............................................................................................................................... 22 Inspection Procedures ........................................................................................................... 22 Specimen 8a .......................................................................................................................... 22 Specimen 8b.......................................................................................................................... 26 Specimen 8c .......................................................................................................................... 29 Specimen 8d.......................................................................................................................... 33 Specimen 12a ........................................................................................................................ 35 Specimen 12b........................................................................................................................ 37 Specimen 12c ........................................................................................................................ 39 Specimen 12d........................................................................................................................ 41 Specimen 12e ........................................................................................................................ 42 Specimen 12f ........................................................................................................................ 44 Conclusions........................................................................................................................... 46
Chapter 4 – Bridge Field Inspections........................................................................................ 50 4.1 Field Inspection 1 ........................................................................................................ 50
Objectives ............................................................................................................................. 50 Thermal Imaging Inspection ................................................................................................. 50 Inspection Procedure............................................................................................................. 52 Summary of Results.............................................................................................................. 56 Heating Location # 1............................................................................................................. 57 Heating Location # 2............................................................................................................. 59 Heating Location # 3............................................................................................................. 60 Heating Location # 4............................................................................................................. 61 Heating Location # 5............................................................................................................. 62 Heating Location # 6............................................................................................................. 65 Heating Location # 7............................................................................................................. 66 Heating Location # 8............................................................................................................. 67 Heating Location # 9............................................................................................................. 69 Heating Location # 10........................................................................................................... 71
vi

Heating Location # 11........................................................................................................... 73 Conclusions........................................................................................................................... 75
4.2 Field Inspection 2 ........................................................................................................ 76 Objectives ............................................................................................................................. 76 Inspection Procedures ........................................................................................................... 76 Heating Location # 1............................................................................................................. 77 Heating Location # 2............................................................................................................. 81 Conclusions........................................................................................................................... 82
4.3 Field Inspection 3 ........................................................................................................ 83 Objectives ............................................................................................................................. 83 Inspection Procedures ........................................................................................................... 83 Heating Location # 1............................................................................................................. 84 Heating Location # 2............................................................................................................. 86 Conclusions........................................................................................................................... 89
Chapter 5 – Summary ................................................................................................................ 91 Works Cited................................................................................................................................. 93
vii
List of Tables
Table 2.1 – Thermal conductivity of specimen materials....................................................... 5Table 3.1 – Old specimen summary ..................................................................................... 17 Table 3.2 – New specimen summary.................................................................................... 18 Table 3.3 – Specimen 8a heating details............................................................................... 23 Table 3.4 – Specimen 8b heating details .............................................................................. 26 Table 3.5 – Specimen 8c heating details............................................................................... 29 Table 3.6 – Specimen 8d heating details .............................................................................. 33 Table 3.7 – Specimen 12a heating details............................................................................. 35 Table 3.8 – Specimen 12b heating details ............................................................................ 38 Table 3.9 – Specimen 12c heating details............................................................................. 39 Table 3.10 – Specimen 12d heating details .......................................................................... 41 Table 3.11 – Specimen 12e heating details........................................................................... 42 Table 3.12 – Specimen 12f heating details ........................................................................... 44 Table 3.13 – Lab inspection summary.................................................................................. 46 Table 4.1 – Summary of Field Inspection 1 results .............................................................. 56
viii

List of Figures
Literature Review Figure 2.1 – Photographs showing test sheds and specimens................................................. 6Figure 2.2 – Wooden test frame with concrete specimen....................................................... 7
Specimen Description
Figure 3.1 – Typical concrete specimen ............................................................................... 12Figure 3.2 – Typical 7-wire strands and simulated void in PT-duct..................................... 15 Figure 3.3 – Typical specimen formwork with PT-ducts and rebar cage............................. 15 Figure 3.4 – Typical concrete specimen showing various simulated void orientations ....... 16 Figure 3.5 – New specimens for thermal imaging................................................................ 18
Test Setup
Figure 3.7 – Test setup showing infrared heater and test frame ........................................... 20 Figure 3.8 – Test setup showing aluminum-covered plywood sides and insulation ............ 20 Figure 3.9 – Test setup with heater suspended above the concrete specimen ...................... 21
Lab Specimens
Figure 3.10 – Thermal image of Specimen 8a...................................................................... 23 Figure 3.11 – Thermal image of Specimen 8a...................................................................... 24 Figure 3.12 – Thermal image of Specimen 8a showing a cool spot ..................................... 25 Figure 3.13 – Thermal image of Specimen 8b...................................................................... 27 Figure 3.14 – Thermal image of Specimen 8b taken from the bottom face ......................... 28 Figure 3.15 – Thermal image of Specimen 8b...................................................................... 29 Figure 3.16 – Thermal image of Specimen 8c from solar radiation ..................................... 30 Figure 3.17 – Thermal image of Specimen 8c...................................................................... 31 Figure 3.18 – Thermal image of Specimen 8c...................................................................... 32 Figure 3.19 – Illustration showing PT-ducts conducting heat over simulated void ............. 33 Figure 3.20 – Thermal image of Specimen 8d...................................................................... 34 Figure 3.21 – Thermal image of Specimen 8d...................................................................... 34 Figure 3.22 – Thermal image of Specimen 12a.................................................................... 36 Figure 3.23 – Thermal image of Specimen 12a.................................................................... 37 Figure 3.24 – Thermal image of Specimen 12b.................................................................... 38 Figure 3.25 – Thermal image of Specimen 12c.................................................................... 40 Figure 3.26 – Thermal image of Specimen 12d.................................................................... 42 Figure 3.27 – Thermal image of Specimen 12e.................................................................... 43 Figure 3.28 – Thermal image of Specimen 12f .................................................................... 45 Figure 3.29 – Illustration of heat flow through a PT-duct and simulated void..................... 49
Field Inspection 1
Figure 4.1 – Thermal image and photo of box girder bridge under ambient conditions ...... 53 Figure 4.2 – Typical orientations of lift truck and heater to heated surface ......................... 55 Figure 4.3 – Thermal image and photograph of Heating Location # 1................................. 57 Figure 4.4 – Thermal image of Heating Location # 1........................................................... 58 Figure 4.5 – Thermal image and enlarged area of Heating Location # 2 ............................. 60
ix

Figure 4.6 – Thermal image and photograph of Heating Location # 3................................. 61 Figure 4.7 – Thermal image of Heating Location # 4........................................................... 62 Figure 4.8 – Thermal image of Heating Location # 5........................................................... 63 Figure 4.9 – Thermal image and photograph of Heating Location # 5................................. 64 Figure 4.10 – Thermal image of Heating Location # 6......................................................... 66 Figure 4.11 – Thermal image and photo of Heating Location # 7........................................ 67 Figure 4.12 – Thermal image and photo of Heating Location # 8........................................ 69 Figure 4.13 – Thermal image of Heating Location # 9......................................................... 71 Figure 4.14 – Thermal image and photo of Heating Location # 10...................................... 72 Figure 4.15 – Thermal image and photo of Heating Location # 11...................................... 74 Figure 4.16 – Thermal image of Heating Location # 11....................................................... 74
Field Inspection 2
Figure 4.17 – Thermal image of Span 4 under ambient conditions...................................... 77 Figure 4.18 – Photo of Heating Location # 1 showing discoloration ................................... 78 Figure 4.19 – Thermal images of Heating Location # 1, side by side .................................. 79 Figure 4.20 – Thermal image of Heating Location # 1 at mid-interval................................ 79 Figure 4.21 – Thermal image progression of Heating Location # 1..................................... 80 Figure 4.22 – Thermal image of Heating Location # 1 showing excavation of flaw ........... 81 Figure 4.23 – Thermal images of Heating Location # 2 ....................................................... 82
Field Inspection 3
Figure 4.24 – Photo of Heating Location # 1........................................................................ 84 Figure 4.25 – Thermal image of Heating Location # 1 30 min. after heating began............ 85 Figure 4.26 – Thermal images of Heating Location # 1 ....................................................... 86 Figure 4.27 – Thermal image of Heating Location # 2 showing heater setup...................... 87 Figure 4.28 – Thermal image of Heating Location # 2 taken of the unheated surface......... 88 Figure 4.29 – Thermal image of Heating Location # 2 taken of the heated surface............. 89
x

Chapter 1 – Introduction and Objectives
1.1 Introduction
Structures in civil engineering are often in demand for long periods of time. During the
structural life of a bridge, for example, a decrease in structural capacity can occur due to things
like aging, substandard materials, new loading scenarios, and deterioration. Many forms of
deterioration cannot be located by visual means. A nondestructive technique is therefore needed
to help assess and locate problem areas in suspect bridges.
Specifically, post-tensioned (PT) concrete box girder bridges may encounter PT-strand
corrosion due to the presence of water or moisture that accumulates in air voids adjacent to or
surrounding the strands. The voids may be present due to improper grouting techniques used at
the time of construction. Corrosion in the PT-strands results in a decreased effective area of the
post-tensioning steel, providing less capacity that may ultimately lead to failure.
1.2 Problem Statement
The current problem with post-tensioning systems is that there are no nondestructive
procedures or techniques available to easily inspect grouted PT-ducts in concrete box girder
bridges. Once the grout is pumped into the duct and allowed to cure, there are only a couple
ways to locate problems, and they either damage the system (such as drilling small test holes into
the duct) or are too costly to be implemented (such as radiographic inspection).
Thermal imaging is a nondestructive method that is gaining broader usage as more
equipment is developed. The project described in this report involves the use thermal imaging to
1

inspect grouted PT-ducts in concrete box girder bridges. This project also explores thermal
imaging detection of near-surface voids and delaminations in concrete bridges.
This research, in conjunction with the Washington State Department of Transportation
(WSDOT), involved three field inspections of bridges along with laboratory inspections of
constructed concrete specimens. Field Inspection 1 was completed August 6th – 9th, 2007 on the
Spokane Street/I-5 Interchange in Seattle, WA. Field Inspection 2 was completed August 13th –
14th, 2007 on a bridge crossing over the northbound lanes of I-5 near the Spokane Street
Interchange. Field Inspection 3 was conducted August 14th – 15th, 2007 on the State Route 16,
Pearl Street Overpass in Tacoma, WA. The laboratory inspections were conducted at the Wood
Materials and Engineering Laboratory (WMEL) in Pullman, WA during the summer months
(June through September) of 2007. This report presents the results and conclusions from these
inspections.
1.3 Objectives
The purpose of this research was to determine if thermal imaging is a feasible
nondestructive technique for locating and assessing problem areas in pre-cast box girder bridges.
Specific objectives include:
• Determine if thermal imaging is helpful in locating/assessing near-surface defects
such as delaminations, poorly consolidated concrete, air voids, and exposed
reinforcing steel on the bottom surface of pre-cast box girder bridges
• Determine if thermal imaging is helpful in locating embedded post-tensioning
ducts and tendons, and detecting internal voids in vertical webs or walls of pre-
cast, post-tensioned box girder bridges.
2

• Determine the thicknesses of concrete for which thermal imaging can viably be
applied and the heating time duration required to produce images showing post-
tensioning ducts, air voids, or near-surface defects.
• Determine an efficient test set-up and equipment orientation to effectively inspect
regions of pre-cast, post-tensioned box girder bridges.
3

Chapter 2 – Literature Review
2.1 Thermal Imaging Background
Thermography, or thermal imaging, is a type of nondestructive inspection using infrared
radiation. Thermal imaging cameras are used to detect radiation in the infrared range of the
electromagnetic spectrum, or the part of the spectrum we perceive as heat. Infrared energy is
electromagnetic radiation that is not visible because its wavelength is too long to be detected by
the human eye. Unlike visible light, in the infrared world everything with a temperature above
absolute zero emits thermal radiation and the higher an object’s temperature, the greater the
radiation emitted (Cengel 2007). Thermal imaging cameras detect infrared energy emitted from
an object and then convert this energy reading into a display of the material surface temperature.
With thermal imaging, it is often necessary to obtain a temperature differential or thermal
gradient in an object so that heat will propagate through the material in a known direction. This
is done by introducing some energy (or heat) into the system, which will cause a variation in
surface temperatures based on the material properties. Thermal imaging can be employed to
detect imperfections that disrupt the heat energy transfer created by the energy source. The main
heat transfer mechanism in this study is conduction, or the transfer of heat from a more energetic
state to a less energetic state. When heat is directed through a material, it is conducted at a
certain speed based on material thermal properties. Imperfections are essentially different
materials embedded in the system, resulting in different rates of heat conduction. For example,
when steel is embedded in concrete, it will transmit heat at a faster and more efficient rate than
the concrete around it. An air void, on the other hand, tends to act as an insulator, transferring
4
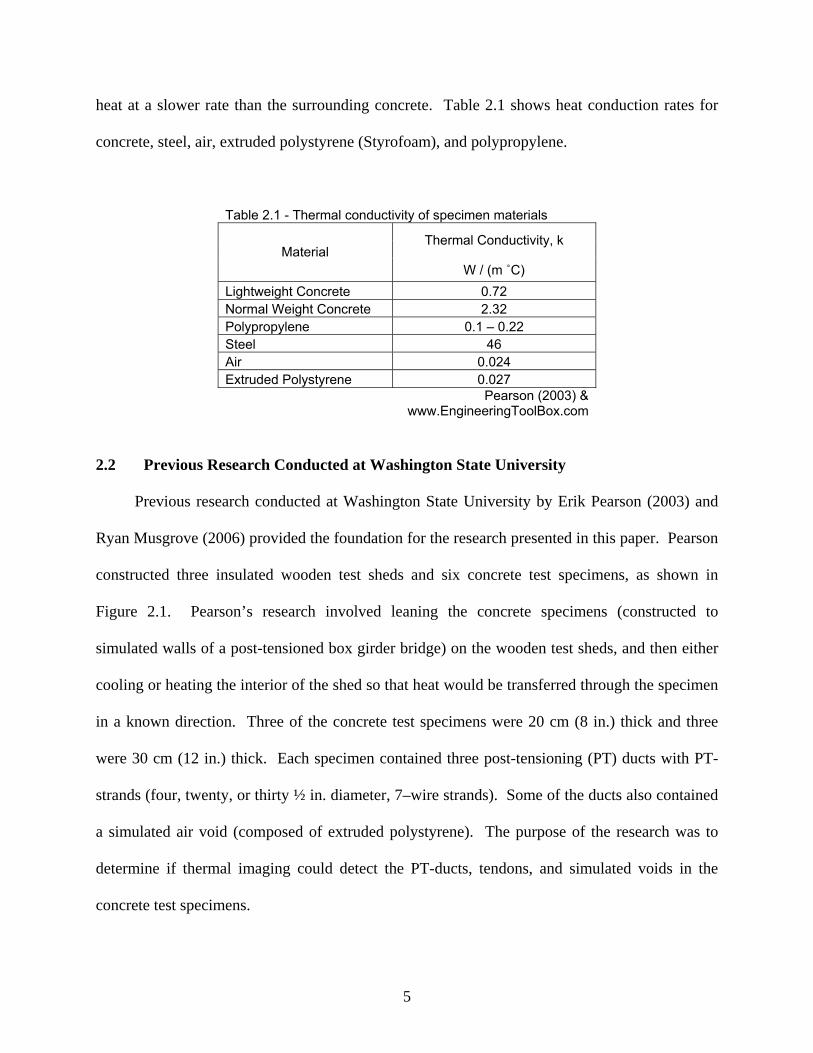
heat at a slower rate than the surrounding concrete. Table 2.1 shows heat conduction rates for
concrete, steel, air, extruded polystyrene (Styrofoam), and polypropylene.
Table 2.1 - Thermal conductivity of specimen materials
Thermal Conductivity, k Material
W / (m ˚C) Lightweight Concrete 0.72 Normal Weight Concrete 2.32 Polypropylene 0.1 – 0.22 Steel 46 Air 0.024 Extruded Polystyrene 0.027
Pearson (2003) &
www.EngineeringToolBox.com
2.2 Previous Research Conducted at Washington State University
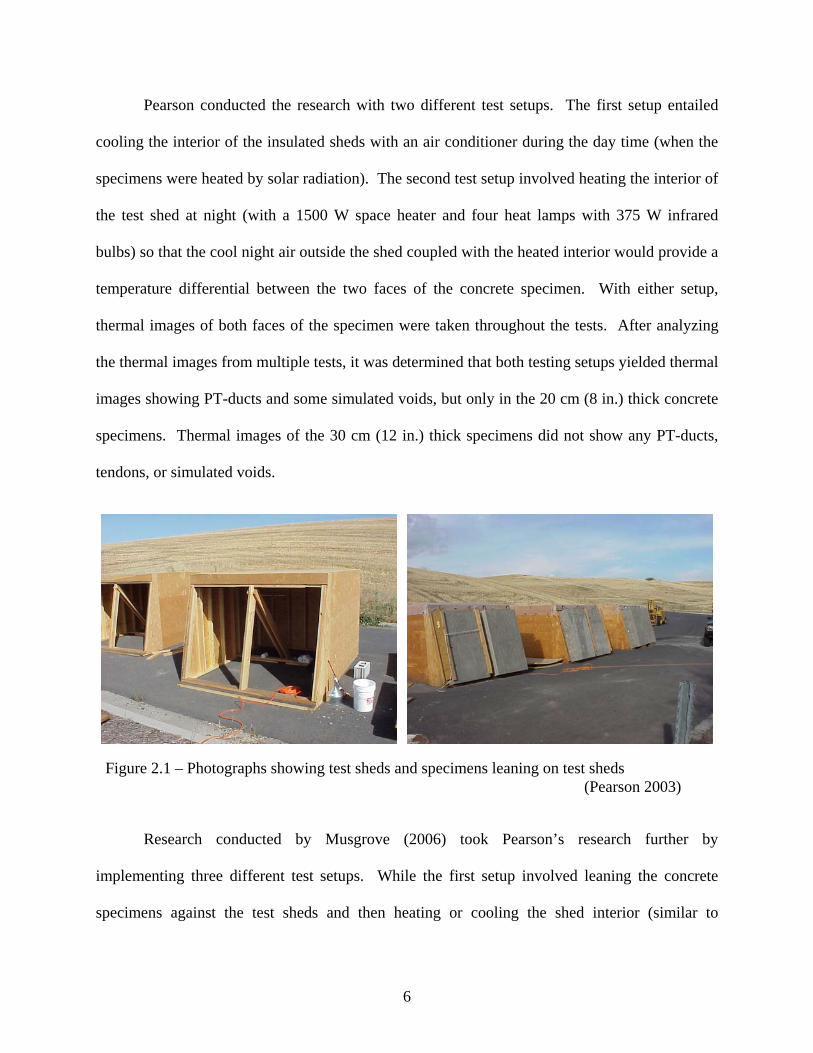
Previous research conducted at Washington State University by Erik Pearson (2003) and
Ryan Musgrove (2006) provided the foundation for the research presented in this paper. Pearson
constructed three insulated wooden test sheds and six concrete test specimens, as shown in
Figure 2.1. Pearson’s research involved leaning the concrete specimens (constructed to
simulated walls of a post-tensioned box girder bridge) on the wooden test sheds, and then either
cooling or heating the interior of the shed so that heat would be transferred through the specimen
in a known direction. Three of the concrete test specimens were 20 cm (8 in.) thick and three
were 30 cm (12 in.) thick. Each specimen contained three post-tensioning (PT) ducts with PT-
strands (four, twenty, or thirty ½ in. diameter, 7–wire strands). Some of the ducts also contained
a simulated air void (composed of extruded polystyrene). The purpose of the research was to
determine if thermal imaging could detect the PT-ducts, tendons, and simulated voids in the
concrete test specimens.
5
Pearson conducted the research with two different test setups. The first setup entailed
cooling the interior of the insulated sheds with an air conditioner during the day time (when the
specimens were heated by solar radiation). The second test setup involved heating the interior of
the test shed at night (with a 1500 W space heater and four heat lamps with 375 W infrared
bulbs) so that the cool night air outside the shed coupled with the heated interior would provide a
temperature differential between the two faces of the concrete specimen. With either setup,
thermal images of both faces of the specimen were taken throughout the tests. After analyzing
the thermal images from multiple tests, it was determined that both testing setups yielded thermal
images showing PT-ducts and some simulated voids, but only in the 20 cm (8 in.) thick concrete
specimens. Thermal images of the 30 cm (12 in.) thick specimens did not show any PT-ducts,
tendons, or simulated voids.
Figure 2.1 – Photographs showing test sheds and specimens leaning on test sheds (Pearson 2003)
Research conducted by Musgrove (2006) took Pearson’s research further by
implementing three different test setups. While the first setup involved leaning the concrete
specimens against the test sheds and then heating or cooling the shed interior (similar to
6

Pearson), the other two used two other methods of heating. The second setup involved placing
the specimen on a wooden test frame (shown in Figure 2.2) and then heating one face with
electric silicone rubber flexible heating blankets. Thermal images were then taken throughout
the heating process, which usually lasted at least four hours. The third test setup involved
placing the concrete specimen on the wooden frame (Figure 2.2) and heating one face with a
Fostoria 13.5 kW infrared heater.
Figure 2.2 – Wooden test frame with concrete specimen (Musgrove 2006)
The research conducted by Musgrove produced results similar to those from Pearson’s
research. PT-ducts and some of the simulated voids could be detected in thermal images, but the
methods of heating cause some uneven heating scenarios, especially with the heating blankets.
7

The blankets caused hot spots to form on the specimen due to uneven heat application to the
concrete surface. Also, with the Fostoria infrared heater, only 2/3 of the specimen could be
effectively heated, so thermal images did not encompass the complete specimen.
The research presented in this paper takes Pearson’s and Musgrove’s research further, by
using the Fostoria infrared heater and newly constructed specimens with a new test frame and
setup to heat one face of the specimen more completely and efficiently.
2.3 Other Studies
In recent years, thermal imaging has been explored for the inspection of civil structures.
Most of the applications involved passive heating to identify areas of heat loss in building
envelopes (Wiggenhauser 2002). Thermal imaging in civil engineering is not limited to
buildings, however, as recent studies show. One study, conducted in 2002 by Maierhofer et al.,
used active heating to inspect 150 cm x 150 cm x 50 cm (59 in. x 59 in. x 20 in.) concrete test
specimens with embedded polystyrene blocks designed to simulate air voids (due to the close
proximity of the thermal conductivities of air and polystyrene, see Table 2.1). Multiple sizes of
polystyrene blocks were located at different embedment depths. The active heating implemented
was in the form of three 2400 W infrared heaters. The heaters were kept at a distance of 15 cm
(6 in.) away from the heated surface and were dynamically moved across the surface by
computers in order to obtain the best possible homogeneous heating.
The results from the inspections indicated that all the simulated voids were detected.
Though total heating times were up to 60 minutes, thermal images taken after a heat time of only
10 minutes showed shallow (up to approximately 10 cm or 4 in. deep) simulated voids with high
contrast after a short cool down time of 9 minutes. Also for the 10 minute heat time, deeper
8

(more than 10 cm or 4 in.) simulated voids were detected after a longer cool down time of 58
minutes. The simulated voids embedded in the test specimens were fairly large at 20 cm x 20 cm
x 10 cm (8 in. x 8 in. x 4 in.) and 10 cm x 10 cm x 10 cm (4 in. x 4 in. x 4 in.). It is important to
note that the thermal images were taken of the heated surface, so there was no through-heating
applied.
The study conducted by Maierhofer et al. also investigated gluing reinforcing laminate
strips to one side of a specimen with no embedded simulated voids. The strips were attached to
the concrete with different glue thicknesses, and areas without glue were designed to simulate
delaminations. The specimen with reinforcing laminate strips was then heated for very short
periods of time (15 seconds), and thermal images were taken of the heated surface. After zero
cool down time, simulated delaminations were easily visible in the thermal image. Thermal
images with longer cool down times lost detail and contrast between the delaminations and the
rest of the specimen. Results from this research indicated that thermography is a useful tool for
detecting defects in concrete up to a depth of 10 cm (4 in.) as well as for the fast and efficient
location of delaminations of carbon fibre reinforcing laminates glued on the concrete
(Maierhofer, et al. 2002).
In another study, Maierhofer et al. (2007) discussed how impulse-thermography is one of
the best nondestructive testing methods for the detection of near-surface voids in concrete
structures. Their main objective was to see how material properties affected thermal imaging.
During their research, three test specimens were constructed each containing four voids sized 10
cm x 10 cm x 5 cm (4 in. x 4 in. x 2 in.) at depths of 6 cm and 10 cm (2 in. and 4 in.). Simulated
voids were composed of polystyrene and integrated gas into concrete. Of the four test
specimens, specimen 1 was composed of normal concrete, specimen 2 had less density and
9

compressive strength due to air-entraining agents added to the cement mixture, in specimen 3 the
larger aggregates were replaced by porous aggregates in normal cement, and specimen 4 differed
in the type of reinforcement mats that the simulated voids were behind.
The heating duration varied from 5 to 30 minutes in the study conducted by Maierhofer,
et al. (2006). After the heat input was removed, thermal images were taken as the surface cooled
down. From the images and transient curves gained at near-surface voids, it was clear that
material properties effect what is detectable with thermal imaging. During hydration, thermal
images were influenced greatly due to the changes in thermal conductivity. Pore content of the
cement matrix and aggregate porosity have a clear influence on thermal properties, and thus on
what is detected in the thermal images. In terms of the reinforcing mats, the results show that the
steel only has a slight influence on simulated void detectability. This indicates that
reinforcement should not affect how other anomalies are detected in thermal images taken in the
field.
Wiggenhauser (2002) discusses the different uses of thermography in the field. As
mentioned before, thermal imaging has been used widely in identification of heat losses in
building envelopes. Other applications include locating regions of excess moisture in plaster,
delaminations of plaster, and the presence of formwork under plaster. Thermography has also
been useful in detecting delaminations in the near-surface region (up to 10 cm or 4 in.) of
concrete in bridges and highways.
The two studies conducted by Maierhofer et al. (2002 and 2006) show how well thermal
imaging can work as a nondestructive inspection technique for detecting large simulated voids in
concrete. The research presented in this report expands on previous work by investigating:
• The detection of simulated voids in PT-ducts in concrete specimens
10

• The application of through-thickness heating and thermal imaging of the unheated
surface
• The detection of actual voids and delaminations (rather that simulated voids) during field
inspections of concrete bridges
11

Chapter 3 – Specimen Lab Inspections
3.1 Specimen Description
Four concrete specimens were constructed during the month of June, 2007 to simulate the
walls of post-tensioned box girder bridges. The objective was to detect simulated air voids
within grouted post-tensioning ducts, thus locating areas where the post-tensioning steel strands
are vulnerable to corrosion. Figure 3.1 displays a typical specimen and some corresponding
terminology used throughout the project.
The concrete used to construct the specimens was a seven-sack mix with 1.9-cm (0.75
in.) angular basaltic rock aggregate and a 28-day compressive strength of 34.5 MPa (5000 psi).
The concrete had a slump of approximately 13 cm (5 in.). The four specimens were constructed
in two thicknesses: one at 20 cm (8 in.) and three at 30 cm (12 in.). Each specimen had face
dimensions of 152 cm by 102 cm (60 in. by 40 in.). These dimensions were chosen to conform
with older specimens that were previously inspected and to fit the new thermal imaging test
Figure 3.1 – Typical concrete specimen
12

frame and heater in an efficient manner (Pearson 2003). Since there were six older specimens,
the total number of specimens for inspection was ten: four 20 cm (8 in.) specimens and six 30 cm
(12 in.) specimens.
Each specimen contained three post-tensioning ducts 10-cm (4 in.) in diameter. The
ducts were spaced at 38 cm (15 in.) on center and made of either galvanized steel or
polypropylene (plastic). The ducts were numbered 1-3 for each specimen. The ducts were 102
cm (40 in.) long, oriented parallel with the 102 cm end of the specimen and perpendicular to the
152 cm (60 in.) edge. Each duct in the new specimens contained fourteen 7-wire strands sized
1.5 cm (0.6 in.) in diameter (AASHTO M203 Grade 270) and a piece of extruded polystyrene
(Styrofoam) to simulate an air void. A typical duct with post-tensioning steel strands and
simulated air void is shown in Figure 3.2.
Styrofoam was chosen to simulate air because of their similar thermal conductivities (see
Table 2.1). However, even though the thermal conductivities of air and Styrofoam are similar,
Styrofoam may be a better insulator. This is because of the heat mechanisms that occur as heat
is transferred through air voids. Heat is transferred through an air void by conduction, radiation,
and convection (often neglected), whereas heat is transferred through a simulated air void
(Styrofoam) by conduction only. Consequently, the thermal resistance of an air void is actually
based on the thermal conductivity of air and the emissivity of the surfaces in contact with the air.
Therefore, the thermal resistance of an air void is actually lower than that of Styrofoam. Typical
R-values (measure of resistance) for a 25 mm (1.0 in.) thick plane air space with ordinary
surfaces (normal building surfaces like concrete or wood with εeffective = 0.82) is Rair = 1.0
ft2*h*°F/Btu (Cengel 2007). A typical R-value for a 25 mm (1.0 in.) thick rigid foam insulation
(Styrofoam) is RStyrofoam = 5.0 ft2*h*°F/Btu (ASHRAE Handbook: Fundamentals 2007). This
13

means that a 25 mm (1 in.) thickness of Styrofoam has approximately five times the thermal
resistance of a 25 mm (1 in.) thick planar air space. For this research, it is important to recognize
that an air void inside a PT-duct of a box girder bridge is not planar, has varying thickness, and
probably will not have an effective emissivity of 0.82 (due to the different surfaces in contact
with the air). Due to these differences between a planar air space and an air void, coupled with
the fact that previous research used Styrofoam to simulate air voids, the research presented in
this paper also used Styrofoam to simulate air voids.
The Styrofoam simulated voids in the new specimens were fabricated in three different
sizes (thickness x length): 2.5 cm x 41 cm (1 in. x 16 in.), 1.25 cm x 41 cm (0.5 in. x 16 in.), and
1.3 cm x 20 cm (0.5 in. x 8 in.). One simulated void was attached at the mid-length of each duct
using plastic zip ties fastened through four drilled holes. The ducts were then grouted with PTX
cable grout as post-tensioning strands would be in a typical bridge. To facilitate placement of
the grout, the specimens were placed on edge. The grout was then mixed with water as directed
and poured into each duct after the post-tensioning steel strands were in place. Each specimen
also contained reinforcement in the form of a rebar cage with approximately 2.5 cm (1 in.) of
concrete cover at each face. The rebar cage was comprised of #4 Grade 60 reinforcing steel
spaced approximately 4 cm (10 in.) on center, as shown in Figure 3.3.
14

When describing the concrete specimens, the top face must be differentiated from the
bottom face. For all the 30 cm (12 in.) thick specimens (both old and new), the top face is
referred to as the face with the least amount of concrete cover to the ducts. The top face for the
older, 20 cm (8 in.) thick specimens was denoted as the face closest to the simulated voids. The
Post-tensioning strands
Simulated Void
Figure 3.2 – Typical 7-wire strands and simulated void in post-tensioning duct
Figure 3.3 – Typical specimen formwork with post-tensioning ducts and rebar cage
15

top face in the newer, 20 cm (8 in.) thick specimen was arbitrarily chosen, but kept constant
throughout heating inspections. Figure 3.4 shows the different simulated void orientations
between the old and new specimens.
A specimen identification scheme was developed to encompass new specimens as well as
previously constructed specimens. The specimen identification scheme reports the specimen
thickness (in inches) followed by a letter indicating its position in the construction sequence of
both the new and old specimens. There were six old specimens, designated 8a-8c and 12a-12c.
Unlike the new specimens, not all the post-tensioning ducts in the old specimens contained
simulated voids or the same number of strands. Also, the simulated voids in the old specimens
Figure 3.4 – Typical concrete specimen showing various simulated void orientations
16

were thicker and shorter: 5, 10, or 15 cm long (2, 4, or 6 in. long). The old specimens and their
respective attributes are summarized in Table 3.1, and are further described in Pearson (2003)
and Conner (2004).
Table 3.1 - Old specimen summary
Cover From Top Face
Cover From Bottom Face Simulated Voids
Specimen Specimen Thickness Duct Duct
Material (cm) (in.) (cm) (in.)
Strands Per Duct No. of
Voids Length (cm)
Length (in.)
1 Steel 5 2 5 2 20 - - -
2 Steel 5 2 5 2 30 - - - 8a 20 cm (8 in.)
3 Steel 5 2 5 2 30 1 15 6
1 Plastic 5 2 5 2 30 - - -
2 Plastic 5 2 5 2 4 1 15 6 8b 20 cm (8 in.)
3 Steel 5 2 5 2 4 1 15 6
1 Plastic 2.5 to 7.5 1 to 3 2.5 to
7.5 1 to 3 20 - - -
2 Plastic 2.5 to 7.5 1 to 3 2.5 to
7.5 1 to 3 20 2 5, 10 2, 4 8c 20 cm (8 in.)
3 Plastic 2.5 to 7.5 1 to 3 2.5 to
7.5 1 to 3 20* - - -
1 Steel 10 4 10 4 30 - - -
2 Steel 7.5 3 12.5 5 20 - - - 12a 30 cm (12 in.)
3 Steel 5 2 15 6 30 - - -
1 Plastic 10 4 10 4 30 - - - 2 Plastic 7.5 3 12.5 5 20 - - - 12b 30 cm
(12 in.) 3 Steel 10 4 10 4 4 1 15 6
1 Plastic 2.5 to 7.5 1 to 3 12.5 to
17.5 5 to 7 20* - - -
2 Plastic 2.5 to 7.5 1 to 3 12.5 to
17.5 5 to 7 20 2 5, 10 2, 4 12c 30 cm (12 in.)
3 Plastic 2.5 to 7.5 1 to 3 12.5 to
17.5 5 to 7 30 2 5, 10 2, 4
* = corroded tendons
Among the new specimens, there was only one 20 cm (8 in.) thick specimen and it was
identified as 8d. This was the smallest thickness possible to ensure a minimum 5 cm (2 in.) of
concrete cover to each face for the 10 cm (4 in.) post-tensioning ducts placed at mid-thickness of
the specimen. Three of the new specimens were each 30 cm (12 in.) thick and differed in the
type of post-tensioning duct, size of simulated air void, and the amount of cover to each duct. 30
17

cm (12 in.) is a common web thickness for many concrete box girder bridges. These specimens
were identified as 12d, 12e, and 12f. Table 3.2 summarizes the new specimens. Figure 3.5
illustrates the new specimens constructed for inspection with thermal imaging.
Table 3.2 - New specimen summary
Cover Simulated Void (thickness x length) Specimen Specimen
Thickness Duct Duct Material Top
Face (cm)
Top Face (in.)
Bot Face (cm)
Bot Face (in.) (cm) (in.)
1 Plastic 5 2 5 2 2.5 x 41 1 x 16
2 Steel 5 2 5 2 2.5 x 41 1 x 16 8d 20 cm (8 in.)
3 Steel 5 2 5 2 1.25 x 41 0.5 x 16
1 Steel 5 2 15 6 2.5 x 41 1 x 16
2 Steel 10 4 10 4 2.5 x 41 1 x 16 12d 30 cm (12 in.)
3 Steel 10 4 10 4 1.25 x 20 0.5 x 8
1 Plastic 5 2 15 6 1.25 x 41 0.5 x 16
2 Steel 10 4 10 4 1.25 x 41 0.5 x 16 12e 30 cm (12 in.)
3 Steel 5 2 15 6 1.25 x 41 0.5 x 16
1 Plastic 5 2 15 6 2.5 x 41 1 x 16
2 Plastic 10 4 10 4 2.5 x 41 1 x 16 12f 30 cm (12 in.)
3 Plastic 10 4 10 4 1.25 x 41 0.5 x 16
Figure 3.5 – New specimens for thermal imaging and GPR inspection
18

3.2 Test Set-up for Thermal Imaging of Lab Specimens
A test frame for thermal imaging inspection was fabricated using 3x3 steel hollow
structural sections (HSS). See Figures 3.7 and 3.8. To support the concrete specimens, the
frame was composed of four legs connected by horizontal members with welded all-around
connections to provide adequate moment capacity. There were four areas of contact between the
frame and the specimen: two along the entire length of each 102 cm (40 in.) end and two that
were 20 cm (8 in.) in length at the midpoint of each 152 cm edge. Reflective insulation
(Relfectix with an R-value of 14.3 ft2*h*°F/Btu, 97% reflectivity, and an allowable contact
temperature up to 82 °C or 180 °F) was applied between frame/specimen contact areas and
around the edges/ends of the specimen. The insulation helped reduce edge effects as heat
propagated through the specimens. Edge effects for inspection with thermal imaging entail
losing heat through the edges and ends of the specimen. The goal was to achieve near uniform
heat transfer through the specimen thickness to the unheated surface (surface for which thermal
images were recorded), thus improving detection of internal features by the thermal imaging
camera.
There were two different test set-ups. The first test set-up simulated field inspections
where the heat source is directed at one face of a concrete member while thermal images are
recorded from the opposite face. The second test set-up simulated field conditions in which
access is provided to only one face of a concrete member, so both the heat source and thermal
imaging camera must be directed at the same face. The heater used with each set-up was a heavy
duty metal sheath infrared heater made by Fostoria (model # CH-1324-3A rated at 13.5 KW, 240
volts, and 33.0 amps).
19

The first test set-up involved placing the infrared heater underneath the specimen and
heating while thermal images were taken from above. The infrared heater was located 69 cm (27
in.) from the bottom of the specimen, and aluminum-covered plywood sides were installed
around the heater and the test frame to direct most of the radiant heat toward the specimen. The
inside of the test frame was also lined with reflective tape to reduce the amount of heat
conducted through the frame. Each specimen was then inspected with a FLIR (ThermaCAM
P60) thermal imaging camera suspended 4 m (13 ft.) above the unheated face of the specimen.
Figures 3.6 and 3.7 show the frame set-up.
The second test setup was implemented to allow thermal images to be taken from the
same side as the heated surface. The specimens were placed on the test frame and insulated as
before, but with this setup the infrared heater was suspended above the specimen. A frame made
from steel unistruct was built and the infrared heater was suspended above the specimen using
Figure 3.6 – Test set-up showing infrared heater and test frame supporting a concrete specimen
Figure 3.7 – Test set-up showing aluminum-covered plywood sides and insulation on edges/ends of a concrete specimen
20

two lengths of chain. The infrared heater was held between 25 and 30 cm (10 to 12 in.) directly
above the heated surface of the concrete specimen. There were no aluminum-covered plywood
sides directing the radiant heat toward the specimen in this setup. Each specimen was heated for
a period of time (heat time details are further described in section 3.3), then the heater was
removed and thermal images were taken from 4 m (13 ft.) above the specimen (similar to the
first test setup). The second test setup is illustrated in Figure 3.8.
Figure 3.8 – Test set-up with heater suspended above a concrete specimen
21

3.3 Thermal Imaging of Lab Specimens
Objective
The objective of inspecting the lab specimens was to determine whether thermal imaging
may be helpful in locating/assessing problem areas in simulated walls of post-tensioned box
girder bridges. Specifically, the thermal imaging inspections focused on locating simulated air
voids in grouted post-tensioning ducts (PT-ducts), since these are areas where the post-
tensioning steel strands are vulnerable to corrosion.
Inspection Procedures
Lab specimens were inspected using three different methods which were similar to the
inspection procedures implemented in field inspection of bridges. Method 1 involved placing the
specimen on the test frame and heating from underneath while taking thermal images of the
unheated surface from above. In Method 2, the heater was suspended above the specimen,
heated for a period of time, and then removed so that thermal images of the heated surface could
be obtained. The last procedure, Method 3, involved exposing the specimen to direct sunlight for
a relatively long duration of time, and then placing it on the test stand for thermal imaging of the
heated surface. With all three methods, it was important to obtain a temperature gradient
between the two faces of the specimen. The temperature gradient caused heat energy to
propagate through the specimen, which is essential to acquire thermal images where inherent
flaws are detected and seen as surface temperature differences.
Specimen 8a
Specimen 8a was inspected three times using two methods: Method 1 to inspect the top
and bottom face, and Method 3 for the top face. Specimen 8a was an older specimen that was 20
cm (8 in.) thick and contained three steel PT-ducts spaced 38 cm (15 in.) on center. Duct 3
22

contained a simulated air void, approximately 15 cm (6 in.) long. Table 3.3 provides heating
details for the specimen inspections.
Table 3.3 - Specimen 8a heating details
Date Procedure Inspected Face Start Heating End Heating Heat Time
(hh:mm) 7/12/2007 Method 3 Top 6:00 AM 1:15 PM 7:15 7/13/2007 Method 1 Top 8:22 AM 12:52 PM 4:30 9/7/2007 Method 1 Bottom 7:50 AM 11:50 AM 4:00
The first inspection completed on Specimen 8a was on July 12th, 2007 using inspection
Method 3 (sun radiation). By the end of the energy input stage, temperatures were 105.1 °F on
the top face (heated surface) and 86.4 °F on the bottom face (unheated surface), for a temperature
gradient of 18.7 °F (similar temperature gradients were achieved for Method 3 inspection of
other 8 in. thick specimens). Although the Method 3 inspection did not reveal any PT-ducts, it
did reveal some of the reinforcing steel present in the specimen, as shown in Figure 3.9. A noted
in the image, the rebar is signified by the cooler lines because the reinforcing steel conducts heat
at a faster rate than the concrete around it. Therefore, while taking thermal images of the heated
surface, the rebar appears cooler than the concrete.
88.0°F
123.8°F
90
100
110
120
Typical rebar
Figure 3.9 – Thermal image of Specimen 8a
23

The second inspection of Specimen 8a was completed on July 13th, 2007 using inspection
Method 1. This inspection took images of the unheated surface, and PT-ducts were visible in
thermal images after only 1:30 (hh:mm) of heat time, as shown in Figure 3.10. All three ducts
are visible as hotter strips between cooler regions. This demonstrates that, since all three PT-
ducts are steel, they conduct the heat through the specimen faster than the surrounding concrete.
This is an indication of how steel PT-ducts should appear during field inspections of pre-stressed
concrete box girder bridges when taking thermal images of the unheated surface under similar
temperature conditions.
80.8°F
95.2°F
85
90
95
Duct 1 Duct 3
Duct 2
Figure 3.10 – Thermal image of Specimen 8a
The next image, shown in Figure 3.11, is Specimen 8a at the end of heating. The PT-
ducts are more clearly visible and the steel reinforcement can be seen. With surface
temperatures on the unheated surface at an average of 112 °F (as shown by Box 1 in Figure
3.11), Duct 3 shows what looks like a cool spot at its center, as denoted by the circle. This is the
location of the simulated air void in Duct 3. Styrofoam acts as an insulator, thus heat transfers
through the simulated void at a slower rate than through the concrete or grout. In this instance,
24
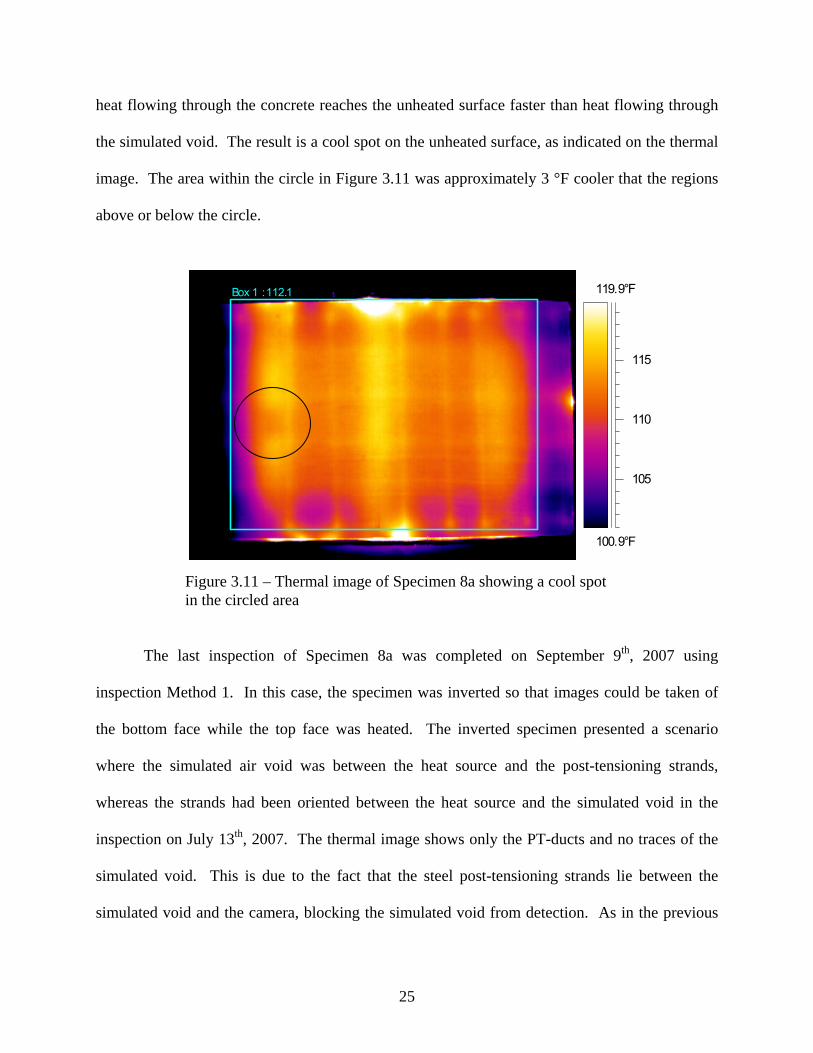
heat flowing through the concrete reaches the unheated surface faster than heat flowing through
the simulated void. The result is a cool spot on the unheated surface, as indicated on the thermal
image. The area within the circle in Figure 3.11 was approximately 3 °F cooler that the regions
above or below the circle.
100.9°F
119.9°F
105
110
115
Box 1 : 112.1
Figure 3.11 – Thermal image of Specimen 8a showing a cool spot in the circled area
The last inspection of Specimen 8a was completed on September 9th, 2007 using
inspection Method 1. In this case, the specimen was inverted so that images could be taken of
the bottom face while the top face was heated. The inverted specimen presented a scenario
where the simulated air void was between the heat source and the post-tensioning strands,
whereas the strands had been oriented between the heat source and the simulated void in the
inspection on July 13th, 2007. The thermal image shows only the PT-ducts and no traces of the
simulated void. This is due to the fact that the steel post-tensioning strands lie between the
simulated void and the camera, blocking the simulated void from detection. As in the previous
25

inspections, temperature differences between the PT-ducts and the solid concrete to either side
were in the range of 2 °F to 4 °F.
Specimen 8b
Specimen 8b was inspected six different times. Inspection Method 1 was used for four of
the six inspections, with three inspections of the top face and one of the bottom face. The other
two inspections were each of the top face, one utilizing Method 2 and one utilizing Method 3.
Specimen 8b was an older specimen that was 20 cm (8 in.) thick and contained three PT-ducts
spaced 38 cm (15 in.) on center (Ducts 1 and 2 were plastic, and Duct 3 was steel). Ducts 2 and
3 each contained a simulated air void, approximately 15 cm (6 in.) long. Table 3.4 provides
heating details for the specimen inspections.
Table 3.4 - Specimen 8b heating details
Date Procedure Inspected Face Start Heating End Heating Heat Time
(hh:mm) 7/2/2007 Method 1 Top 10:00 AM 4:45 PM 6:45 7/5/2007 Method 1 Top 9:35 AM 4:40 PM 7:05 7/10/2007 Method 1 Top 10:30 AM 4:30 PM 6:00 7/12/2007 Method 3 Top 6:00 AM 1:45 PM 7:45 7/18/2007 Method 1 Bottom 9:37 AM 11:37 AM 2:00 9/24/2007 Method 2 Top 9:15 AM 1:30 PM 4:15
The first three inspections completed on this specimen were all done using inspection
Method 1. The inspection that took place on 7/2/2007 was the very first inspection of any of the
specimens, so it was primarily a learning trial to evaluate optimum heating conditions. As
shown in the image on the left in Figure 3.12, the two plastic PT-ducts were detected as cooler
regions and the steel duct was detected as a warmer region. A cool spot was observed in the
middle of plastic Duct 2 that could represent a simulated air void. The image on the right of the
Figure 3.12, however, shows a thermal image from the inspection that took place on 7/5/2007
26

(the inspection from 7/10/2007 provides an identical image). Here, the region in the middle of
Duct 2 shows a hot spot, rather than the cool spot that was detected on 7/2/2007. The reason for
this discrepancy is not clear.
85.5°F
107.9°F
90
95
100
105
123.6°F
159.7°F
130
140
150
Duct 1Duct 2 Duct 3
Figure 3.12 – Thermal images of Specimen 8b a) left image showing inspection from 7/2/2007 b) right image showing inspection from 7/5/2007
Figure 3.13 shows a thermal image of the bottom face of Specimen 8b from an inspection
conducted on 7/18/2007. This inspection intentionally had much less heat time than the other
inspections (only two hours, see Table 3.4). The reason for the shorter heat time was to see what
difference it made in the thermal image when compared to other inspections with longer heat
times. The resulting images were similar to images obtained from longer heat times, except that
hot spots did not reach quite as large temperature differences with respect to the regions around
them. For example, the hot spot in Duct 3 was approximately 4 °F warmer than the rest of Duct
3 with the inspection from 7/18/2007, whereas other inspections of Specimen 8b obtained an
almost 20 °F temperature difference.
27
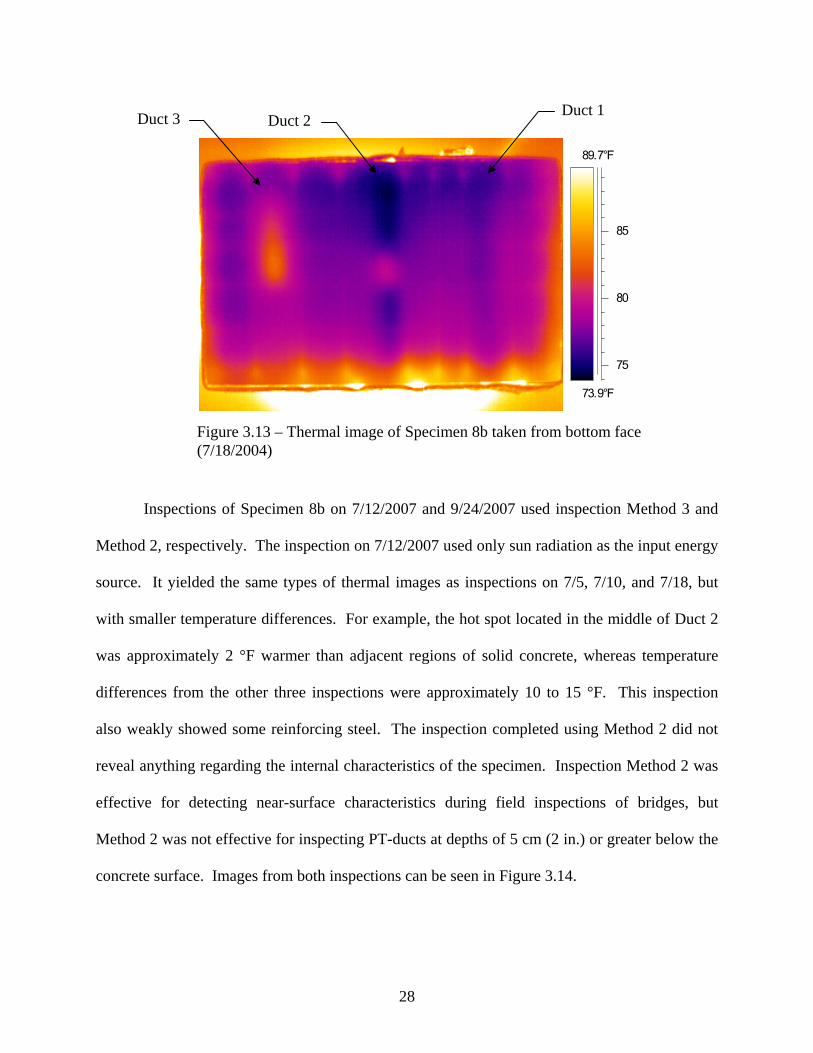
Inspections of Specimen 8b on 7/12/2007 and 9/24/2007 used inspection Method 3 and
Method 2, respectively. The inspection on 7/12/2007 used only sun radiation as the input energy
source. It yielded the same types of thermal images as inspections on 7/5, 7/10, and 7/18, but
with smaller temperature differences. For example, the hot spot located in the middle of Duct 2
was approximately 2 °F warmer than adjacent regions of solid concrete, whereas temperature
differences from the other three inspections were approximately 10 to 15 °F. This inspection
also weakly showed some reinforcing steel. The inspection completed using Method 2 did not
reveal anything regarding the internal characteristics of the specimen. Inspection Method 2 was
effective for detecting near-surface characteristics during field inspections of bridges, but
Method 2 was not effective for inspecting PT-ducts at depths of 5 cm (2 in.) or greater below the
concrete surface. Images from both inspections can be seen in Figure 3.14.
73.9°F
89.7°F
75
80
85
Duct 2 Duct 1 Duct 3
Figure 3.13 – Thermal image of Specimen 8b taken from bottom face (7/18/2004)
28

93.8°F
172.9°F
100
120
140
160
103.5°F
111.9°F
104
106
108
110
Figure 3.14 – Thermal images of Specimen 8b a) left image showing Method 3 inspection from 7/12/2007 b) right image showing Method 2 inspection from 9/24/2007
Specimen 8c
Specimen 8c was inspected three times: one used Method 3 to inspect the top face, and
the other two used Method 1 to inspect the top and bottom faces. Specimen 8c was an older
specimen that was 20 cm (8 in.) thick and contained three plastic PT-ducts. During construction,
the PT-ducts were not held in position when the concrete was placed, so the ducts shifted. The
ducts are therefore closer together than in the other specimens and concrete cover to either face
ranges from 2.5 to 7.5 cm (1 to 3 in.). Duct 2 contained two simulated air voids, one
approximately 5 cm (2 in.) long and the other 10 cm (4 in.) long. The two voids were placed
approximately at third points along the duct. Table 3.5 provides heating details for the specimen
inspections.
Table 3.5 - Specimen 8c heating details
Date Procedure Inspected Face Start Heating End Heating Heat Time
(hh:mm) 7/11/2007 Method 3 Top 6:00 AM 10:30 AM 4:30 7/11/2007 Method 1 Top 11:10 AM 4:50 PM 5:40 7/17/2007 Method 1 Bottom 9:06 AM 2:12 PM 5:06
29

The first inspection of Specimen 8c was completed using Method 3, where solar radiation
was the only source of heat input. Figure 3.15 shows a thermal image taken after bringing the
specimen indoors. The three PT-ducts are clearly visible (numbered 1, 2, and 3), as are the two
simulated voids in Duct 2 (hot spots). Temperature differences between the simulated voids and
the rest of the duct are approximately 2.5 to 4 °F. This image shows that, with a temperature
gradient of 13.2 °F between the top and bottom faces due to ambient exposure to solar radiation,
PT-ducts and simulated voids located within approximately one inch of the heated surface are
discernable from the rest of the specimen.
81.5°F
105.5°F
85
90
95
100
105321
5 d
10 cm (4 in.) void
cm (2 in.) voi
Figure 3.15 – Thermal image of Specimen 8c from solar radiation
The simulated voids appear as hot spots in Figure 3.15 because the image was taken of
the heated surface. The radiant heat from the sun propagated through the concrete until it
reached the simulated voids. At this point, the simulated voids slowed the rate of heat transfer,
keeping more heat closer to the heated surface and making the simulated voids look like hot
spots. As shown in Figure 3.15, the ducts (all plastic) also show up as warmer areas. This is
30

because the plastic acts as an insulator, slowing the rate at which heat flows through the
specimen compared to surrounding concrete.
The second inspection of Specimen 8c was conducted using inspection Method 1. The
inspection took place approximately one hour after the first inspection ended, and instead of
heating the top face, the bottom face of the specimen was heated and thermal images were taken
of the top face. The heat transfer that took place was now due to energy input from the infrared
heater, instead of solar radiation. The ducts and one of the simulated voids were detected as
cooler areas. The 10 cm (4 in.) simulated void was visible, with a 2 to 7 °F temperature
difference from the rest of Duct 2 (as shown by points 1, 2, and 3 in Figure 3.17). The 5 cm (2
in.) simulated void was not visible, but this may be due to rebar interference or to the fact that
the 5 cm (2 in.) long simulated void has less effect on heat flow than the 10 cm (4 in.) long
simulated void (as a result of its smaller size). The rebar (warmer lines), ducts, and simulated
void can be seen in Figure 3.16.
118.9°F
158.8°F
120
130
140
150
1 : 131.0
2 : 137.7
3 : 133.3
Figure 3.16 – Thermal image of Specimen 8c taken on 7/11/2007
10 cm (4 in.) simulated void
31

The last inspection of Specimen 8c was completed on 7/17/2007. Method 1 was used, so
the top face was heated and thermal images were taken of the bottom face. Thermal images
showing the PT-ducts were obtained after only 3.5 hours of heat time, as shown in Figure 3.17.
The thermal image does not show any sign of the two simulated voids present in Duct 2. This
may be a result of the fact that the voids were oriented underneath the tensioning strands inside
the duct. The strands conduct heat better than concrete or air, so they are more likely to be at
consistent temperatures throughout their length. In other words, all the strands increase in
temperature at a rate that is not affected by the simulated voids, thus the thermal image shows
ducts with uniform temperatures. Figure 3.18 further illustrates why the simulated ducts were
not detected.
97.7°F
135.8°F
100
110
120
130
Figure 3.17 – Thermal image of Specimen 8c from 7/17/2007
32

Figure 3.18 – Illustration showing PT-strands conducting heat over simulated void
Specimen 8d
Specimen 8d was inspected three times: two inspections used Method 1 on the top and
bottom face, and the third inspection used Method 2 on the top face. Specimen 8d was one of
the newer specimens at 20 cm (8 in.) thick and contained three PT-ducts (one plastic and two
steel) spaced at 38 cm (15 in.) on center. All three ducts contained a simulated air void (sizes
shown in Table 2). Table 3.6 provides heating details for the specimen inspections.
Table 3.6 - Specimen 8d heating details
Date Procedure Inspected Face Start Heating End Heating Heat Time
(hh:mm) 7/24/2007 Method 1 Top 8:30 AM 11:45 AM 3:15 9/10/2007 Method 1 Bottom 8:45 AM 1:00 PM 4:15 9/21/2007 Method 2 Top 9:10 AM 1:35 PM 4:25
The first inspection of Specimen 8d took place on 7/24/2007 using Method 1. At this
point, it was concluded that a 20 cm (8 in.) thick specimen required between three and four hours
of radiant heat input to produce thermal images showing PT-ducts, thus Specimen 8d was heated
for 3:15 (hh:mm). Figure 3.19 shows a thermal image from this inspection, where the two steel
33

ducts (Ducts 2 and 3) are displayed as warmer regions and the plastic duct (Duct 1) is cooler.
The thermal image, however, does not reveal the simulated air voids.
86.0°F
100.7°F
90
95
100
Duct 1
Duct 2
Duct 3
Figure 3.19 – Thermal image of Specimen 8d taken 7/24/2007
The second inspection of Specimen 8d was completed on 9/10/2007 using Method 1 to
inspect the bottom face. The thermal image, provided in Figure 3.20, was much like the previous
inspection where the two steel ducts were detected as warmer regions and the plastic duct as
cooler. However, as with the prior inspection, no simulated voids were visible.
90.7°F
118.2°F
95
100
105
110
115
Figure 3.20 – Thermal image of Specimen 8d taken 9/10/2007
34
The last inspection of Specimen 8d was completed on 9/21/2007 using inspection Method
2. The top face of the specimen was heated for 4:25 (hh:mm) and then thermal images of the top
face were taken for two hours after heating ceased. This inspection did not yield any thermal
images showing the PT-ducts or even any steel reinforcement. Therefore, no thermal images of
this inspection are provided.
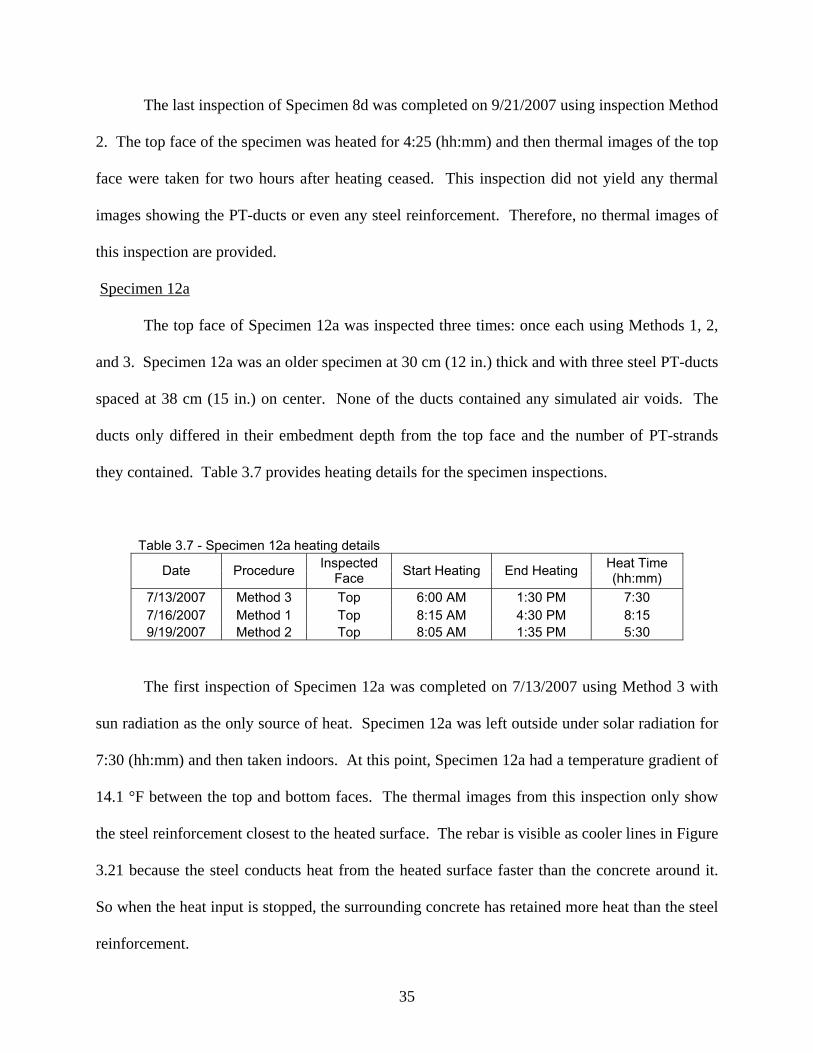
Specimen 12a
The top face of Specimen 12a was inspected three times: once each using Methods 1, 2,
and 3. Specimen 12a was an older specimen at 30 cm (12 in.) thick and with three steel PT-ducts
spaced at 38 cm (15 in.) on center. None of the ducts contained any simulated air voids. The
ducts only differed in their embedment depth from the top face and the number of PT-strands
they contained. Table 3.7 provides heating details for the specimen inspections.
Table 3.7 - Specimen 12a heating details
Date Procedure Inspected Face Start Heating End Heating Heat Time
(hh:mm) 7/13/2007 Method 3 Top 6:00 AM 1:30 PM 7:30 7/16/2007 Method 1 Top 8:15 AM 4:30 PM 8:15 9/19/2007 Method 2 Top 8:05 AM 1:35 PM 5:30
The first inspection of Specimen 12a was completed on 7/13/2007 using Method 3 with
sun radiation as the only source of heat. Specimen 12a was left outside under solar radiation for
7:30 (hh:mm) and then taken indoors. At this point, Specimen 12a had a temperature gradient of
14.1 °F between the top and bottom faces. The thermal images from this inspection only show
the steel reinforcement closest to the heated surface. The rebar is visible as cooler lines in Figure
3.21 because the steel conducts heat from the heated surface faster than the concrete around it.
So when the heat input is stopped, the surrounding concrete has retained more heat than the steel
reinforcement.
35

107.0°F
118.4°F
108
110
112
114
116
118
Figure 3.21 – Thermal image of Specimen 12a taken 7/13/2007
The second inspection of Specimen 12a was conducted on 7/16/2007 using inspection
Method 1 procedures. Specimen 12a was heated for 8:15 (hh:mm) because, at the time, it was
not clear how long a 30 cm (12 in.) thick specimen needed heat input to produce thermal images
showing PT-ducts. The steel PT-ducts could be identified in thermal images after approximately
four hours of heat time, but the best image was taken after approximately 6:30 (hh:mm). The
thermal image of Specimen 12a did not show the crisp differences between the ducts and the
solid concrete visible in thermal images of the 20 cm (8 in.) specimens. Temperature differences
between the ducts and surrounding concrete were only approximately 2 °F with Specimen 12a,
whereas temperature differences were roughly 7 to 10 °F with the 20 cm (8 in.) thick specimens.
Figure 3.22 shows a thermal image from this inspection.
36

88.6°F
108.7°F
90
95
100
105
Duct 2
Duct 1
Duct 3
Figure 3.22 – Thermal image of Specimen 12a taken 7/16/2007
The last inspection of Specimen 12a was conducted on 9/19/2007 using inspection
Method 2. Specimen 12a was heated for a total of 5:30 (hh:mm) and thermal images were taken
for approximately 1:45 (hh:mm) after heating ceased. During the time thermal images were
taken, the average surface temperature on the heated surface decreased from 271 to 145 °F. As
with the third inspection of Specimen 8d, Method 2 procedures with Specimen 12a didn’t
produce any images showing the PT-ducts. The thermal images did not show the reinforcing
steel either, so an image is not included in this report. Since inspection Method 2 did not yield
any thermal images showing the PT-ducts, it seems to be useful only when inspecting near-
surface characteristics during field inspections.
Specimen 12b
Specimen 12b was inspected twice: once each using Methods 1 and 3 (both inspections
were of the top face). Specimen 12b was an older specimen at 30 cm (12 in.) thick and with
three PT-ducts (two were plastic and one was steel) spaced at 38 cm (15 in.) on center. Only
37
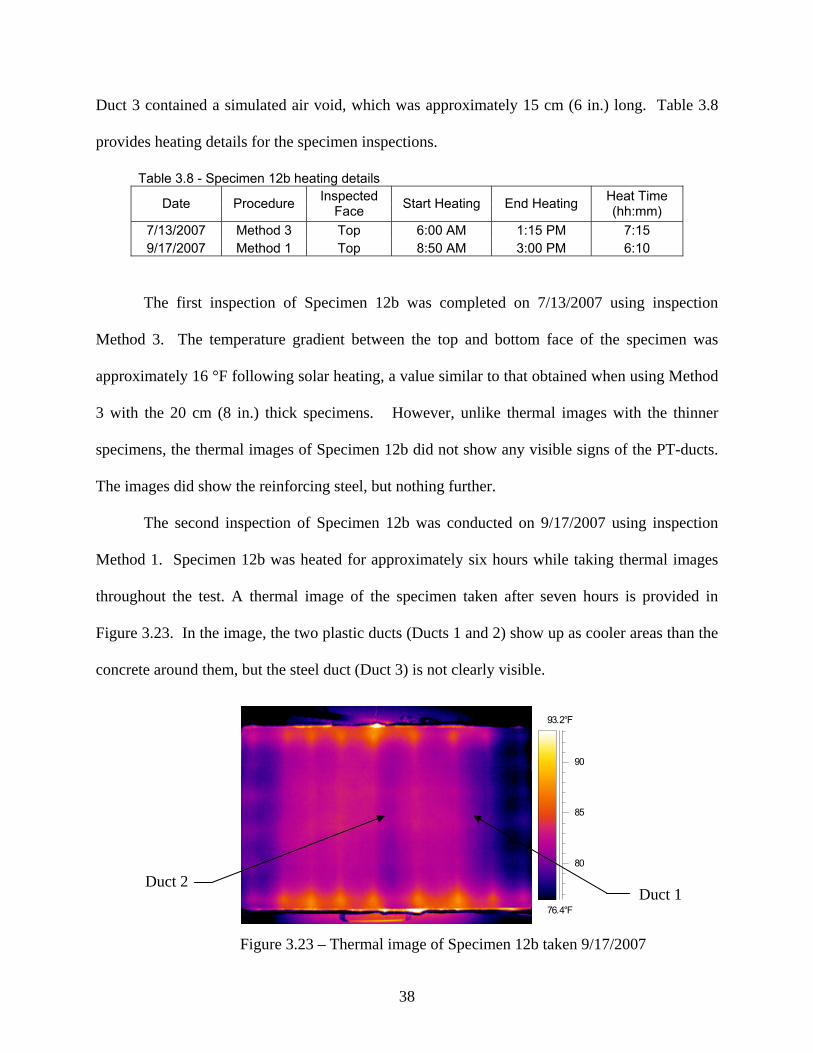
Duct 3 contained a simulated air void, which was approximately 15 cm (6 in.) long. Table 3.8
provides heating details for the specimen inspections.
Table 3.8 - Specimen 12b heating details
Date Procedure Inspected Face Start Heating End Heating Heat Time
(hh:mm) 7/13/2007 Method 3 Top 6:00 AM 1:15 PM 7:15 9/17/2007 Method 1 Top 8:50 AM 3:00 PM 6:10
The first inspection of Specimen 12b was completed on 7/13/2007 using inspection
Method 3. The temperature gradient between the top and bottom face of the specimen was
approximately 16 °F following solar heating, a value similar to that obtained when using Method
3 with the 20 cm (8 in.) thick specimens. However, unlike thermal images with the thinner
specimens, the thermal images of Specimen 12b did not show any visible signs of the PT-ducts.
The images did show the reinforcing steel, but nothing further.
The second inspection of Specimen 12b was conducted on 9/17/2007 using inspection
Method 1. Specimen 12b was heated for approximately six hours while taking thermal images
throughout the test. A thermal image of the specimen taken after seven hours is provided in
Figure 3.23. In the image, the two plastic ducts (Ducts 1 and 2) show up as cooler areas than the
concrete around them, but the steel duct (Duct 3) is not clearly visible.
76.4°F
93.2°F
80
85
90
Duct 2
Duct 1
Figure 3.23 – Thermal image of Specimen 12b taken 9/17/2007
38

Specimen 12c
Specimen 12c was inspected twice: once each using Methods 1 and 2 (both inspections
were of the top face). Specimen 12c was an older specimen at 30 cm (12 in.) thick and with
three plastic PT-ducts spaced at 38 cm (15 in.) on center. Ducts 2 and 3 each contained two
simulated air voids that were 5 cm (2 in.) and 10 cm (4 in.) long. The simulated voids were
located at approximately third points along the duct. Table 3.9 provides heating details for the
specimen inspections.
Table 3.9 - Specimen 12c heating details
Date Procedure Inspected Face Start Heating End Heating Heat Time
(hh:mm) 7/23/2007 Method 1 Top 11:00 AM 4:15 PM 5:15 9/26/2007 Method 2 Top 8:45 AM 2:45 PM 6:00
The first inspection of Specimen 12c took place on 7/23/2007 using inspection Method 1.
Since Specimen 12c contained four simulated voids in plastic ducts, thermal images were
promising. The simulated voids in Ducts 2 and 3 were all visible, as denoted in Figure 3.24.
Temperature differences between simulated void locations and their surrounding regions were
only approximately 0.5 to 1.0 °F. This temperature difference is an unusually small value
compared to other inspections, but the simulated voids show up clearly because the image
temperature range was only about 6 °F. The voids are represented as cool spots in the thermal
image, which follows the heat theory presented in prior inspection analysis.
39

94.2°F
100.9°F
96
98
100Voids in Duct 3
Voids in Duct 2
Figure 3.24 – Thermal image of Specimen 12c taken 7/23/2007
The second inspection of Specimen 12c was conducted on 9/26/2007 using inspection
Method 2. Heating input lasted six hours, and then thermal images were taken for the following
two hours. After examining the thermal images, it was concluded that they show no simulated
voids, PT-ducts, or even any reinforcing steel. Average surface temperatures went from 272 °F
just after heating stopped to 145 °F when the last thermal image was taken. As with previous
inspections, Method 2 failed to produce any thermal images showing PT-ducts or simulated
voids. If inspection Method 2 were ever going to show any specimen attributes in 30 cm (12 in.)
thick specimens, it would have been with Specimen 12c because it contained three plastic PT-
ducts and four simulated voids. Inspections of specimens with plastic ducts seem to yield
thermal images showing more inherent flaws than steel ducts, and simulated voids in the older
specimens were better suited for detection due to their orientation and larger size than simulated
voids in the newer specimens.
40
Specimen 12d
Specimen 12d was inspected twice using inspection Method 1 (both inspections were of
the top face). The difference between the two inspections was the initial unheated surface
temperature. During the first inspection, the initial unheated surface temperature was
approximately 75 °F. On the very next day, the second inspection was completed with an initial
unheated surface temperature of about 105 °F, an increase of 30 °F. The objective was to see the
effect of initial unheated surface temperature on thermal images. Specimen 12d was a newer
specimen at 30 cm (12 in.) thick and with three steel PT-ducts spaced at 38 cm (15 in.) on center.
All three ducts contained simulated voids (sizes shown in Table 3.2). Table 3.10 provides
heating details for the specimen inspections.
Table 3.10 - Specimen 12d heating details
Date Procedure Inspected Face Start Heating End Heating Heat Time
(hh:mm) 7/26/2007 Method 1 Top 9:00 AM 3:50 PM 6:50 7/27/2007 Method 1 Top 8:00 AM 3:00 PM 7:00
The first inspection of Specimen 12d was conducted on 7/26/2007 using inspection
Method 1. Even though Specimen 12d was heated for almost seven hours, the thermal images
did not show the steel PT-ducts very clearly. One such image can be seen in Figure 3.25 (left
side), where the PT-ducts are distinguishable as slightly warmer strips between cooler regions.
The reason for this lack of visibility in a 30 cm (12 in.) thick specimen isn’t clear. Older 30 cm
(12 in.) thick specimen inspections showed PT-ducts more clearly when heated for
approximately the same length of time. The absence of temperature difference at duct locations
in the thermal image of Specimen 12d may be due to the fact that it was much newer and thus
had more moisture in the concrete. Older specimens had cured for over three years, whereas
Specimen 12d had only cured for about two months before being inspected.
41
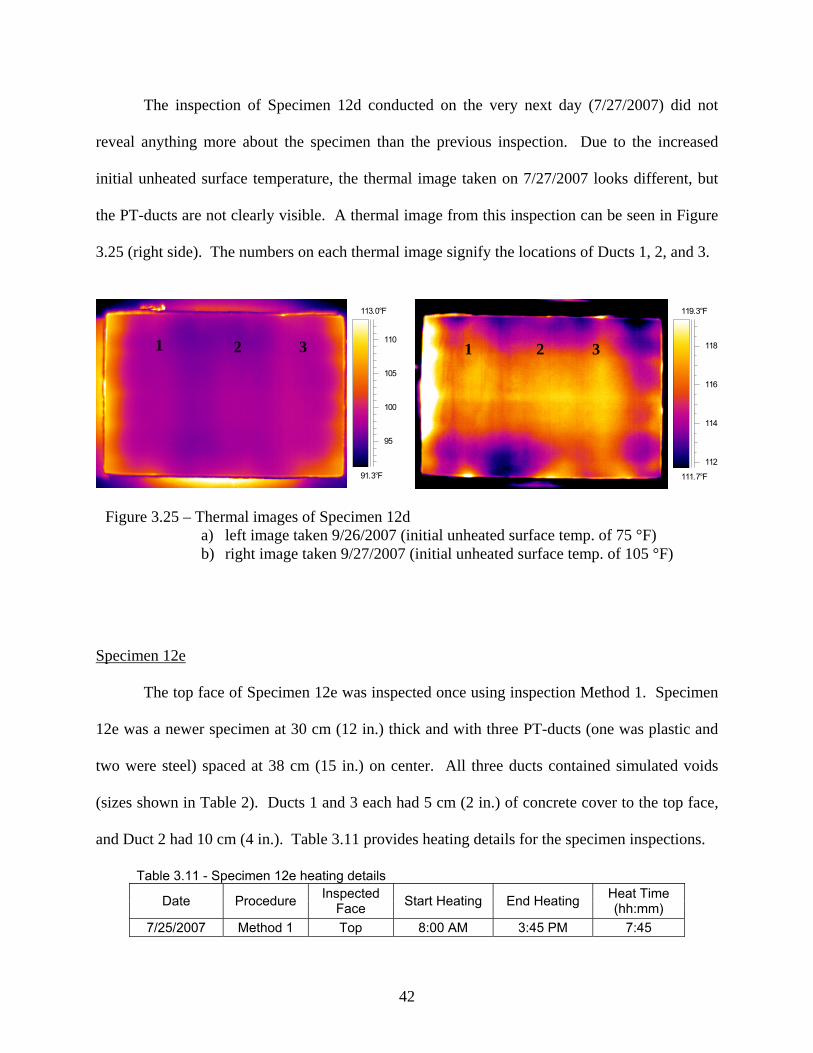
The inspection of Specimen 12d conducted on the very next day (7/27/2007) did not
reveal anything more about the specimen than the previous inspection. Due to the increased
initial unheated surface temperature, the thermal image taken on 7/27/2007 looks different, but
the PT-ducts are not clearly visible. A thermal image from this inspection can be seen in Figure
3.25 (right side). The numbers on each thermal image signify the locations of Ducts 1, 2, and 3.
111.7°F
119.3°F
112
114
116
1181 2 3
91.3°F
113.0°F
95
100
105
1103 2 1
Figure 3.25 – Thermal images of Specimen 12d a) left image taken 9/26/2007 (initial unheated surface temp. of 75 °F) b) right image taken 9/27/2007 (initial unheated surface temp. of 105 °F)
Specimen 12e
The top face of Specimen 12e was inspected once using inspection Method 1. Specimen
12e was a newer specimen at 30 cm (12 in.) thick and with three PT-ducts (one was plastic and
two were steel) spaced at 38 cm (15 in.) on center. All three ducts contained simulated voids
(sizes shown in Table 2). Ducts 1 and 3 each had 5 cm (2 in.) of concrete cover to the top face,
and Duct 2 had 10 cm (4 in.). Table 3.11 provides heating details for the specimen inspections.
Table 3.11 - Specimen 12e heating details
Date Procedure Inspected Face Start Heating End Heating Heat Time
(hh:mm) 7/25/2007 Method 1 Top 8:00 AM 3:45 PM 7:45
42

The inspection of Specimen 12e was conducted on 7/25/2007. The bottom face of the
specimen was heated for almost eight hours, and thermal images were taken of the unheated top
face throughout the inspection. Thermal images began revealing PT-ducts after about 4:30
(hh:mm). The clearest images, however, were not obtained until the end of heating because that
was the point when temperature variations at specimen edges were at a minimum in the thermal
image. Minimum temperature variations result in smaller temperature ranges on thermal images
(the range of Specimen 12e was about 10 °F in Figure 3.26), thus smaller temperature
differences are easier to detect. Figure 3.26 shows a thermal image taken near the end of
heating. The two steel ducts are shown as warmer areas and the plastic duct as a cooler region.
The image also shows that the average unheated surface temperature was almost 97 °F. A few
rebar are displayed as well, but there are no clear, visible signs of any of the simulated voids
located at the middle of each PT-duct.
90.6°F
100.1°F
92
94
96
98
100 : 96.9
Duct 2 (steel)
Duct 3 (steel)
Duct 1
(plastic)
Figure 3.26 – Thermal image of Specimen 12e taken 7/25/2007
43

Specimen 12f
Specimen 12f was inspected twice: once using Method 1 and once using Method 2 (both
inspections were of the top face). Specimen 12f was a newer specimen at 30 cm (12 in.) thick
and with three plastic PT-ducts spaced at 38 cm (15 in.) on center. All three ducts contained
simulated voids (sizes shown in Table 3.2). Ducts 1 and 3 each had 5 cm (2 in.) of concrete
cover to the top face, and Duct 2 had 10 cm (4 in.). Table 3.12 provides heating details for the
specimen inspections.
Table 3.12 - Specimen 12f heating details
Date Procedure Inspected Face Start Heating End Heating Heat Time
(hh:mm) 9/12/2007 Method 1 Top 8:50 AM 3:10 PM 6:20 9/14/2007 Method 2 Top 9:30 AM 2:30 PM 5:00
The first inspection of Specimen 12f took place on 9/12/2007 using inspection Method 1.
Specimen 12f was heated for approximately six hours, and thermal images of the unheated
surface were taken throughout. Since Specimen 12f contained three plastic PT-ducts, the
thermal image showed three cooler strips between warmer regions. Figure 3.27 shows a thermal
image of the inspection conducted 9/12/2007. Even though two of the ducts (Ducts 2 and 3) had
5 cm (2 in.) more concrete cover to the top face than Duct 1, the ducts in the thermal image look
similar. There are no simulated voids visible in the thermal image.
44

94.6°F
103.6°F
96
98
100
102
Figure 3.27 – Thermal image of Specimen 12f taken 9/12/2007
The second inspection of Specimen 12f was performed on 9/14/2007 using inspection
Method 2. The top face of Specimen 12f was heated for approximately five hours, and when the
infrared heater was removed from the test stand, thermal images of the heated surface were taken
for an additional hour. Again, as with all previous inspections completed using Method 2, the
thermal images did not produce any visible signs of PT-ducts or simulated voids. None of the
steel reinforcement showed up either.
45

Conclusions
After considering the results obtained from all ten inspected specimens, a few
conclusions can be drawn. Table 3.13 provides a summary of what was detected during each
inspection. Inspections were evaluated based on whether rebar, PT-ducts, and/or simulated voids
were detected. If an inspection produced thermal images that revealed these embedded objects,
then the appropriate box was marked by an X.
Table 3.13 - Lab Inspection Summary What was detected?
Specimen Test Method
Inspected Specimen
Face Rebar PT-ducts Simulated voids
Method 3 Top X Method 1 Top X X X 8a Method 1 Bottom X X Method 1 Top X X X Method 1 Top X X X Method 1 Top X X X Method 3 Top X X X Method 1 Bottom X X X
8b
Method 2 Top X Method 3 Top X X X Method 1 Top X X X 8c Method 1 Bottom X X Method 1 Top X X Method 1 Bottom X X 8d Method 2 Top Method 3 Top X Method 1 Top X X 12a Method 2 Top Method 3 Top X 12b Method 1 Top X Method 1 Top X X X 12c Method 2 Top Method 1 Top X X 12d Method 1 Top X X
12e Method 1 Top X X Method 1 Top X X 12f Method 2 Top
46

Method 1 involved heating one face of a specimen and then taking thermal images from
the opposite face (unheated surface). Method 2 entailed heating a surface and then taking images
from that same heated surface. Finally, Method 3 used direct solar radiation as the source of heat
input, where the specimen was placed on the test frame after heating and thermal images were
taken of that same heated surface.
The most important deduction taken from these inspections was that PT-ducts and
simulated voids were more detectable in the 20 cm (8 in.) thick specimens than in the 30 cm (12
in.) thick specimens. While inspections of the 20 cm (8 in.) thick specimens revealed the
majority of their simulated voids, only one thicker specimen inspection (12c) indicated the
presence of simulated voids (four voids in two ducts). Also, PT-ducts were much clearer and
visible in the thermal images of the thinner specimens. The idea that it is harder to detect
specimen characteristics in thicker specimens than in thinner ones is logical. Inspection of the 30
cm (12 in.) thick specimens results in less clear thermal images because, as the heat propagates
through more concrete, it conducts three-dimensionally and the presence of hot or cold spots is
observed.
Another conclusion involves the heating methods used. From Table 3.13, one can see
that Method 1 was the most productive method of the three. This method utilized through
heating, or heating one face of the specimen and then taking thermal images of the unheated
face. As the heat propagated through the specimen, heat flow rates were either increased or
decreased as embedded materials were encountered. This feature of heat transfer was then
recorded by the thermal camera on the unheated surface as a hot or cool spot relative to the
surrounding concrete. It is known that air and plastic each have a slower rate of heat transfer
47

than concrete, so these effects showed up as cool areas. Steel, on the other hand, has a faster
heat transfer rate, which yielded warmer areas.
Method 3 resulted in some excellent thermal images as well. The method was used on
three 20 cm (8 in.) thick and two 30 cm (12 in.) thick specimens, but was only successful in two
of the thinner ones (although rebar could be detected in all inspections). Images obtained using
this method revealed PT-ducts and simulated voids in Specimens 8b and 8c.
Method 2 was the least effective method of the three. It was added to the inspection
schedule after completing field inspections of bridges on August 6-9 and 13-15, 2007 where it
produced many thermal images showing flaws and near-surface characteristics (delamination,
poorly consolidated concrete, etc…). However, Method 2 was not effective for detecting PT-
ducts and simulated voids in the concrete lab specimens. Out of five different inspections with
Method 2, none detected any PT-ducts or simulated voids. Therefore, Method 2 procedures
should only be used to find close-to-surface irregularities and not characteristics more than 5 cm
(2 in.) from the surface (such as PT-ducts).
Another conclusion from these inspections concerns the simulated voids. Throughout the
inspections, all simulated voids displayed on thermal images were located in the older
specimens. This means that only the larger simulated voids were detected. These simulated
voids were cut to fit snugly between the PT-strands and the inner surface of the duct, and to be as
wide as the duct would allow. The newer specimens contained simulated voids with either 2.5
cm (1 in.) or 1.25 cm (0.5 in.) wide sections in the direction of heat flow. The voids in the newer
specimens were not detectable due to their decreased size and their orientation between the PT-
strands and the unheated surface of the specimen. Figure 3.28 illustrates the orientation of the
new vs. old simulated voids with respect to the direction of heat flow. The new simulated voids
48

were only 2.5 cm (1 in.) or 1.25 cm (0.5 in) thick and located adjacent to the PT-strands, whereas
the older simulated voids were almost the width of the duct and were located between the strands
and the unheated surface of the specimen.
Figure 3.28 – Illustration of heat flow through PT-duct and simulated void
The final critical observation from these inspections is that, when the simulated voids
were visible, they were located within plastic PT-ducts. None of the simulated voids in steel
ducts were detected during lab inspections. One theory as to why this happens is that the steel
ducts transfer most of the heat around the simulated void, thus bypassing the location of the
simulated void. A plastic duct conducts heat at a slower rate than steel, so it presents a better
probability of detecting voids during inspection.
49

Chapter 4 – Bridge Field Inspections
4.1 Field Inspection 1
Location: Spokane Street/I-5 Interchange, Seattle, WA
Dates: August 6th – 9th, 2007
Objectives
The objective of this field inspection was to determine whether thermal imaging may be
helpful in locating/assessing near-surface defects on the bottom surface of precast concrete box
girders on the Spokane Street Interchange exit from I-5 in Seattle, WA. Possible problems with
the bridge include poorly consolidated concrete, delamination, air voids, and exposed reinforcing
steel.
Thermal Imaging Inspection
When conducting thermal imaging inspections in the field, it is important to note certain
factors that can affect imaging results. Most of these factors result from environmental
conditions. One such condition involves wind and how it can cool a surface through convection.
Cooling of the surface in question is usually not desirable because thermal images require
temperature differences in order to detect inherent flaws and other characteristics. Temperature
differences are most easily obtained with uniform heat input and constant ambient conditions.
Another factor that affects thermal imaging results is the distance between the infrared
camera and the surface to be inspected. As the distance increases, there is a bigger chance for
atmospheric conditions to reduce the amount of infrared energy that passes between the thermal
camera and the surface in question. One such atmospheric condition is the moisture in the air.
50

Moisture can absorb some of the infrared energy between the camera and surface, so the camera
will detect lower surface temperatures than are actually present.
Other factors affecting thermal images depend on the inspection surface. Surface
properties like emissivity, reflectivity and roughness change both how the camera “sees” a
surface and how that surface absorbs and emits radiant energy. To begin with, the emissivity of
a material is the ratio of radiation emitted by a surface to the radiation emitted by a black body at
the same temperature. A true black body would have an emissivity equal to one, while any real
object would have an emissivity less than one.
Reflectivity, on the other hand, is the fraction of radiation reflected by a surface. In
thermal imaging, highly reflective surfaces tend to reflect radiant energy from other objects
nearby. This can lead to inaccurate surface temperature measurements using an infrared camera.
Also, highly reflective surfaces make it more difficult to absorb thermal energy. With an
infrared heater, or any other heat source for that matter, the rays tend to reflect from the surface
instead of being absorbed.
Surface roughness also affects how radiant energy is absorbed by an object. Surface
roughness is a measurement of the small-scale variations in the height of a physical surface. A
ray will make contact with a surface once, and if it is not absorbed, it is reflected. Rougher
surfaces allow reflected rays to make contact with the surface more often, thus giving the surface
more chances to absorb the energy.
Environmental conditions and surface characteristics (like reflectivity, emissivity and
surface roughness) affect thermal images in one main way. Since they all influence temperature
differences that thermal images require to detect flaws and other attributes, they tend to alter
image resolution. If the temperature differences decrease, as is the case with cooling through
51

wind conduction, greater distance between the surface and thermal camera, or highly reflective
surfaces, then thermal images will not show flaws or embedded materials very clearly. On the
other hand, if undesirable environmental conditions are minimized, the surface roughness is
high, and reflectivity low, the thermal images may show clearly defined embedded objects and
other characteristics.
Generally, thermal imaging inspection must take all these factors into account. It is
important to know wind speeds, ambient temperatures, what materials are involved, and how all
these conditions affect the thermal images and how to interpret them. Any of these factors could
produce thermal images that do not reveal the true conditions within the material.
Inspection Procedure
The inspected bridge was part of the Spokane Street Interchange exit from I-5 in Seattle,
WA and carried traffic traveling eastward from Spokane Street onto I-5 (northbound). The
bridge is identified as 5/537S by the Washington State Department of Transportation (WSDOT),
and all heating locations are based on a WSDOT drawing of the bridge. Inspection locations
ranged from Pier 9 to Pier 14, and locations were designated by the bridge span in which they
occurred. Bridge spans were named for the lower of the two piers to which they were attached.
For example, Heating Location #1 took place in Span 11, so it was conducted between Piers 11
and 12. The locations are further described either by distance from a particular edge of the
bridge (denoted by compass direction), or by markers already in place on the inspected surface.
The thickness of the box girder floor was measured at approximately 15 cm (6 in.).
The thermal imaging camera was often used to locate possible heating locations based on
ambient conditions. Images were taken and hot or cold regions in the image were identified as
potential problem areas. Figure 4.1 shows a thermal image of the bridge under typical ambient
52

conditions from which a heating location might be determined. The arrow points to a location
which should be a solid color inside a rectangle of yellow indicating a uniform temperature
distribution. The yellow areas in the image signify locations of interior webs of the box girder.
However, a closer look at the image reveals a few areas with higher surface temperatures than
the surrounding concrete within the rectangle. This signal of inconsistency may indicate a
problem area.
Possible problem area
Figure 4.1 – Thermal image and photograph of box girder bridge under ambient conditions
Once a heating location was determined, there were two heating options to choose from
(identified as Method 1 and 2 throughout this report). To help place the infrared heater and
thermal imaging camera closer to the bottom surface of the box girder, a lift truck was provided
by WSDOT. Method 1 entailed placing the infrared heater inside the concrete box girder bridge
and applying infrared energy to its floor. This arrangement allowed thermal images to be taken
from the unheated outer surface (i.e., from the outer surface of the box girder floor) throughout
the entire heating process. Taking images while simultaneously heating the floor of the box
53

girder permits one to observe how internal flaws are revealed as heat propagates through the
concrete. It also provides data regarding the length of time it takes the heat energy to flow
through the concrete. Method 1 was used infrequently because it required access to the inside of
the box girder bridge, and there were only a few locations that permitted access. In order to use
inspection Method 1, an access hatch to the box girder was opened and the infrared heater was
hoisted inside. The infrared heater was oriented face down on four masonry blocks, keeping the
top of the heater approximately 61 cm (24 in.) from the surface of the concrete floor. The blocks
were positioned at the corners of the rectangular heater to allow most of the infrared rays to be
directed at the heated surface without interference.
The other type of inspection, Method 2, involved positioning the lift truck underneath the
bottom surface of a box girder bridge and placing the infrared heater on the lift truck platform
facing upward. The lift was then elevated until the top of the infrared heater was approximately
76 to 107 cm (30 to 42 in.) from the heated surface. The range of distances from the infrared
heater to the surface resulted in varied heated surface areas during inspections of various
locations. Figure 4.2 shows a sample photograph and thermal image of the lift platform holding
the infrared heater near the bottom surface of a concrete box girder bridge. After the infrared
heater was in place, it was turned on and heating commenced. Heating times ranged from
approximately one to three hours based on the suspected problem associated with the heated
surface, as well as the inspection timeframe. Following the energy input portion of the
inspection, the infrared heater was removed and thermal images were taken. Images were
acquired at specific time intervals until sequential images showed no substantial change in
temperature patterns. One main feature associated with this inspection setup was that the images
54

were taken of the heated surface. This means that the camera was located on the same side of the
concrete as the heater.
Figure 4.2 – Typical orientation of lift truck and heater to heated surface (Method 2)
55

Summary of Results
Table 4.1 provides a summary of the inspection location, inspection method used, and
what was (or was not) detected for each heating location on the Spokane Street/I-5 Interchange
Bridge.
Table 4.1 - Summary of Field Inspection 1 Results Heating Location Inspection Location Inspection
Method What Was (or was not) Detected
1 Span 11 - between marker #1 and marker #3 Method 2
Visual discoloration, temperature variations (up to 10 ˚F) indicating small flaws
2 Span 11 - between marker #7 and marker # 9 Method 2 Visual discoloration, two hot spots
(confirmed delamination)
3 Span 10 - 12 ft. north from south edge and at midspan Method 2 Visual discoloration, fairly uniform
heat distribution, no major flaws
4 Span 14 - 10 ft. west from Pier 14 and 5 ft. north from Pier 14 (north pier)
Method 2 Very small surface irregularities, no major flaws
5 Span 14 - just west edge of expansion joint and 10-15 ft. east of Pier 15 (north pier)
Method 2 Visual discoloration, exposed rebar, delamination, poorly consolidated concrete
6 Span 17 - just west of expansion joint and middle of the bridge Method 2 Surface texture characteristics
7 Span 14 - approx. 36 ft. west of Pier 14 (south pier) and approx. 5 ft. south of northern edge
Method 1 Unheated surface discoloration due to leaching, uniform heat distribution
8 Span 11 - approx. 22 ft. east of Pier 12(north pier) and at south edge of bridge
Method 2 Visual discoloration, high temperature differences (12 ˚F to 24 ˚F), possible delamination
9 Span 11 - approx. 13.5 ft. from west edge of southern access hatch and on at south edge of bridge
Method 1 Visual discoloration, high temperature differences (10 ˚F to 25 ˚F), possible delamination
10 Span 11 - just west of expansion joint and 14 ft. south from north edge of bridge
Method 2 Visual discoloration, high temperature differences (18 ˚F), possible delamination
11 Span 11 - approx. 13 ft. from north edge of bridge and approx. 6 ft. west of northern-most access hatch
Method 2 Visual discoloration, temperature differences (7 ˚F), possible delamination and spalled concrete
56

Heating Location # 1
Heating Location # 1 was inspected on August 6th, 2007 using inspection Method 2. The
inspection position was in Span 11 between marker # 1 and marker # 3 (markers were attached to
the surface during prior WSDOT inspections). The surface was heated for a time span of 1:45
(hh:mm). The top of the heater was placed approximately 76 cm (30 in.) from the heated
surface, which was 7.1 m (23.2 ft.) from the ground. This location was chosen because it was an
area that had already been inspected by WSDOT, as indicated by the white chalk in Figure 4.3.
The objective was to see how the thermal images displayed what was previously discovered.
Figure 4.3 shows a thermal image and a corresponding photograph of the heated surface.
74.9°F
134.4°F
80
100
120
Figure 4.3 – Thermal image and photograph of Heating Location # 1
57

The irregularities from Heating Location #1 can be seen more clearly if the thermal
image in Figure 4.3 is enlarged, as in Figure 4.4. The points denoted with a white symbol (points
1, 2, and 3 in Figure 4.4) display different surface temperatures within fairly close proximity to
each other. From the center of the heated area, point 1 is hottest at 112.2 °F and point 2 is lower
at 99.8 °F, as expected (the center of the heated area should be the hottest, with surface
temperatures decreasing farther away from the center). However, it is evident that point 3 is
hotter than point 2, even though it is farther away from the heated center. This shows that there
was an irregularity at this location.
83.3°F
120.2°F
90
100
110
120
1 : 112.22 : 99.8
5 : 111.04 : 101.5 7 : 107.5
6 : 111.9
3 : 105.0
Figure 4.4 – Thermal image of Heating Location # 1
The green and black colors in Figure 4.4 also indicate areas where there were noticeable
temperature differences within close proximity. There was roughly a 10 °F difference between
58

points 4 and 5, which were only a few inches apart. Also, points 6 and 7 show a surface
temperature increase at distances farther away from the heated center, replicating the effect at
points 2 and 3. These irregularities could be a sign of many things. From the photo in Figure
4.3, there are some areas with discoloration. As this is reproduced in the thermal images, these
may be locations of poorly consolidated concrete or delamination.
Heating Location # 2
Heating Location # 2 was inspected on August 6th, 2007 using inspection Method 2. The
inspection point was in Span 11, between marker # 7 and marker # 9. This location was near the
south edge of the bridge, while Heating Location # 1 was near the north edge. The heating time
was 1:25 (hh:mm). As in the first inspection, the top of the heater was placed approximately 76
cm (30 in.) from the heated surface and the total height to the surface was 7.1 m (23.2 ft.) from
the ground. This location was chosen due to markings that indicated the surface had previously
been inspected by WSDOT.
Figure 4.5 shows a thermal image of Heating Location # 2. The black mark on the left
side of the image is marker # 9, and marker # 7 would be on the right side if it were within the
viewing range. This image is a very good example of delamination, as indicated by the two
“spots” located to the right of the marker # 9. These two areas look like hot spots because of the
delamination (separated layers within the concrete) that keeps the heat from propagating farther
into the floor of the box girder. The heat propagates at a slower rate due to a layer of air present
at the delamination interface. The air acts as an insulator, keeping more heat within the layer of
concrete nearest the heat source. The delaminations in the thermal image were confirmed by
WSDOT inspectors through tapping the surface with a hammer after thermal imaging was
completed. Figure 4.5 also shows three points that demonstrate the temperature differences in
59

the vicinity of hot spots. The temperature difference between points 1 and 2 is approximately 14
°F and can be attributed to the delamination occurring between the two points.
69.2°F
128.6°F
80
100
120
Figure 4.5 – Thermal image and enlarged area showing spot temperatures of Heating Location # 2
Marker #9
Heating Location # 3
Heating Location # 3 was inspected on August 7th, 2007 using inspection Method 2. The
inspection position was at midspan of Span 10, approximately 3.6 m (12 ft.) north of the south
edge of the bridge. The surface was heated for a time span of 2:00 (hh:mm). The top of the
heater was placed approximately 107 cm (42 in.) from the heated surface, which was 9.9 m (32.5
ft.) above the ground. The initial ambient temperature in the vicinity of the inspection location
was 63.7 °F and average the wind speed was about 5 mph, with gusts up to 12 mph.
Heating Location # 3 did not reveal very many irregularities. A thermal image of this
location is provided in Figure 4.6, and it only shows one small irregularity denoted by the circle.
Using the thermal imaging software, temperatures at the irregularity and at a location just to the
right of it were 66.3 °F and 68.5 °F, respectively. This is a 2.2 °F difference, which is not very
60

big considering the temperature range of the image is approximately 28 °F. Due to the relatively
small temperature change and the lack of other irregularities around the point, it would probably
not be classified as a point of significance. Heating Location # 3 would therefore be a good
example of a surface with no apparent problems after inspection.
Figure 4.6 – Thermal image and photo of Heating Location # 3 Point 1
61.8°F
90.5°F
70
80
90
Heating Location # 4
Heating Location # 4 was inspected on August 7th, 2007 using inspection Method 2. The
inspection position was in Span 14, approximately 3.0 m (10 ft.) west of Pier 14 and 1.5 m (5 ft.)
north of the south column of Pier 14. The surface was heated for a time span of 2:48 (hh:mm).
The top of the heater was placed approximately 107 cm (42 in.) from the heated surface, which
was 4.9 m (16 ft.) above the ground. At this location, the initial ambient temperature was 65.7
°F and the average wind speed was 1.5 mph, with gusts up to 2.8 mph.
Figure 4.7 shows a thermal image of Heating Location # 4. Many small irregularities
were detected in this image. An example is at points 1 and 2 in the middle of the image. Point 1
is closer to the heated center than point 2, but it is almost 3 °F cooler. Based on more analysis of
61
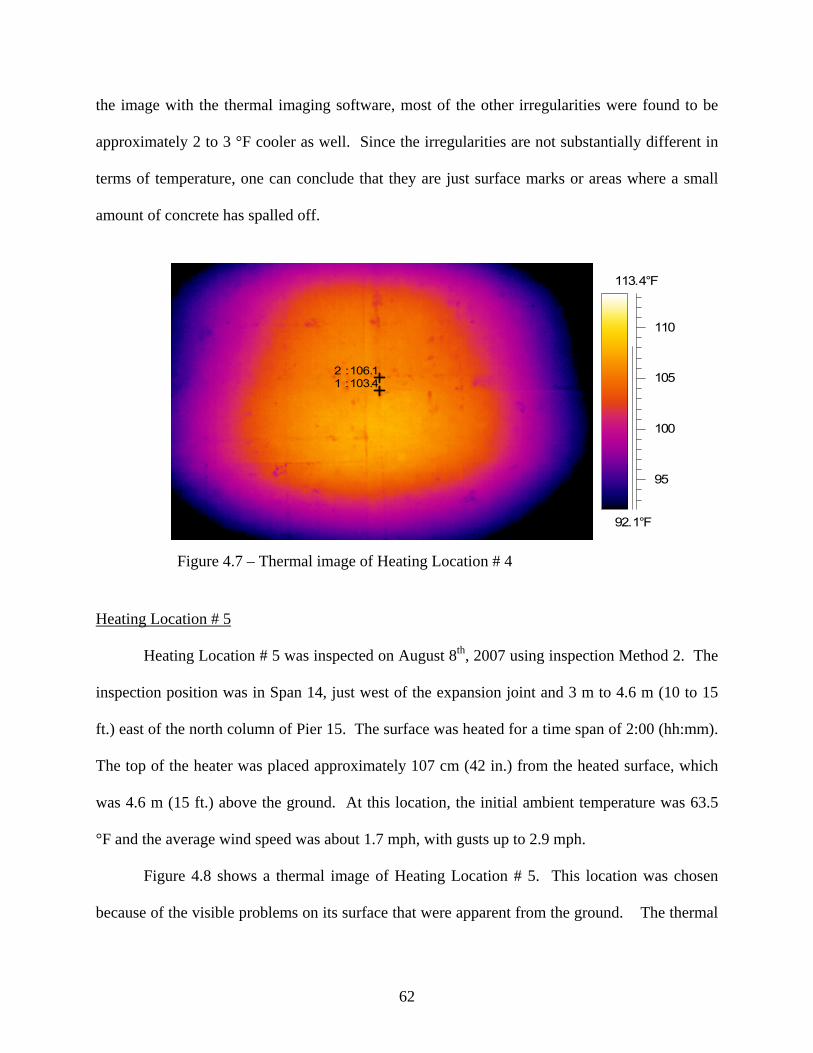
the image with the thermal imaging software, most of the other irregularities were found to be
approximately 2 to 3 °F cooler as well. Since the irregularities are not substantially different in
terms of temperature, one can conclude that they are just surface marks or areas where a small
amount of concrete has spalled off.
92.1°F
113.4°F
95
100
105
110
1 : 103.42 : 106.1
Figure 4.7 – Thermal image of Heating Location # 4
Heating Location # 5
Heating Location # 5 was inspected on August 8th, 2007 using inspection Method 2. The
inspection position was in Span 14, just west of the expansion joint and 3 m to 4.6 m (10 to 15
ft.) east of the north column of Pier 15. The surface was heated for a time span of 2:00 (hh:mm).
The top of the heater was placed approximately 107 cm (42 in.) from the heated surface, which
was 4.6 m (15 ft.) above the ground. At this location, the initial ambient temperature was 63.5
°F and the average wind speed was about 1.7 mph, with gusts up to 2.9 mph.
Figure 4.8 shows a thermal image of Heating Location # 5. This location was chosen
because of the visible problems on its surface that were apparent from the ground. The thermal
62

image in Figure 4.8 is filled with a lot of different types of irregularities, as shown by the great
differences in color (indicating different temperatures). Irregularities include spalled concrete,
delamination, exposed steel reinforcement (rebar), and poorly consolidated concrete.
Temperature differences in this image reach approximately 15 °F (like points 1 and 2 shown).
71.5°F
101.7°F
80
90
100
1 : 82.72 : 97.9
Figure 4.8 – Thermal image of Heating Location # 5
Figure 4.9 shows both a photograph and thermal image of Heating Location # 5. This
figure is helpful because one can see exactly how each area in the photograph appears the
thermal image. An example is the steel reinforcement. It is seen exposed in the photo, and then
as a warmer line in the image, designated by circled area 1 in the Figure 4.9. Most of the
longitudinal rebar can be traced in a similar manner.
63

71.5°F
101.7°F
80
90
100
2
2
1
1
Figure 4.9 –Thermal image and photo of Heating Location # 5
Circled area 2 in Figure 4.9 shows an interesting irregularity. The area doesn’t display
anything significant in the photograph except a small amount of discoloration, but the thermal
image demonstrates inconsistencies in the material in the form of great temperature differences.
The thermal imaging software showed an approximate 5 °F difference between areas within the
64
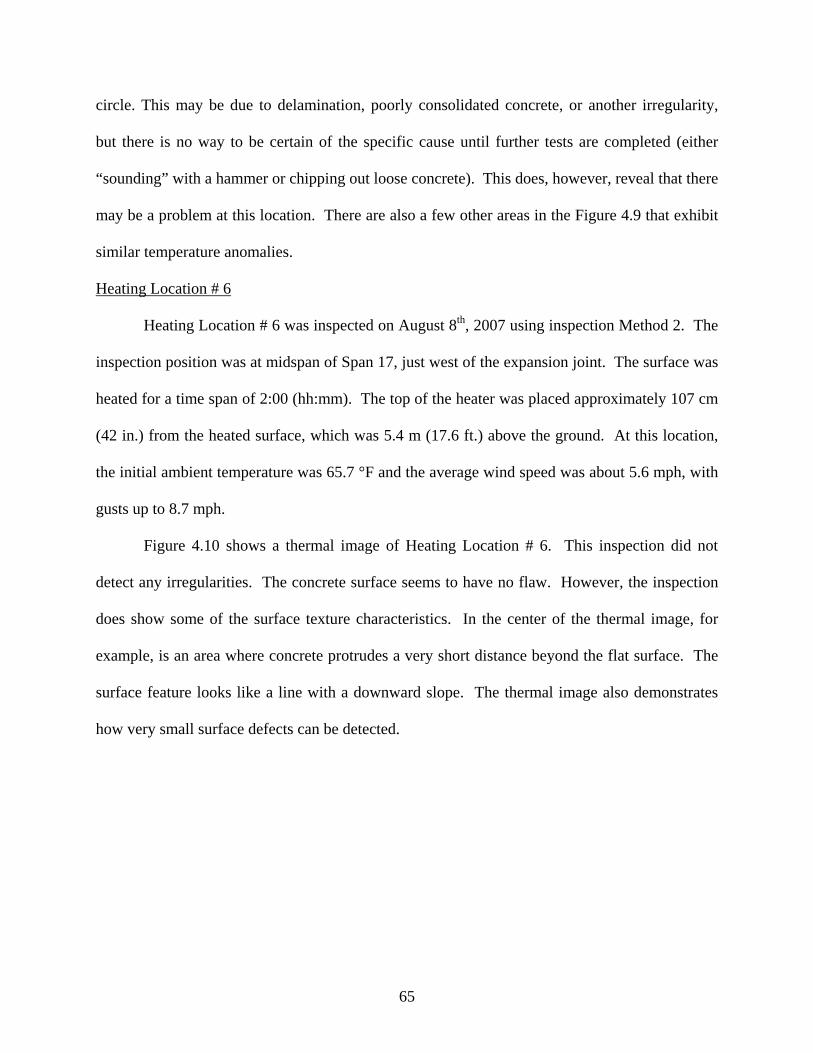
circle. This may be due to delamination, poorly consolidated concrete, or another irregularity,
but there is no way to be certain of the specific cause until further tests are completed (either
“sounding” with a hammer or chipping out loose concrete). This does, however, reveal that there
may be a problem at this location. There are also a few other areas in the Figure 4.9 that exhibit
similar temperature anomalies.
Heating Location # 6
Heating Location # 6 was inspected on August 8th, 2007 using inspection Method 2. The
inspection position was at midspan of Span 17, just west of the expansion joint. The surface was
heated for a time span of 2:00 (hh:mm). The top of the heater was placed approximately 107 cm
(42 in.) from the heated surface, which was 5.4 m (17.6 ft.) above the ground. At this location,
the initial ambient temperature was 65.7 °F and the average wind speed was about 5.6 mph, with
gusts up to 8.7 mph.
Figure 4.10 shows a thermal image of Heating Location # 6. This inspection did not
detect any irregularities. The concrete surface seems to have no flaw. However, the inspection
does show some of the surface texture characteristics. In the center of the thermal image, for
example, is an area where concrete protrudes a very short distance beyond the flat surface. The
surface feature looks like a line with a downward slope. The thermal image also demonstrates
how very small surface defects can be detected.
65

79.0°F
103.8°F
80
85
90
95
100
Figure 4.10 – Thermal image of Heating Location # 6
Heating Location # 7
Heating Location # 7 was inspected on August 8th, 2007 using inspection Method 1. The
inspection position was in Span 14, approximately 11 m (36 ft.) west of Pier 14 and 1.5 m (5 ft.)
south of the northern edge of the bridge. The surface was heated for a time span of 3:00
(hh:mm). This location was heated longer than in other inspections because Method 1 was used,
where heating took place from inside the box girder. Through-thickness heating takes longer to
detect flaws in the thermal images because energy must propagate through the whole thickness
of the concrete. The top of the heater was placed approximately 61 cm (24 in.) above the heated
surface inside the box girder, and the box girder was 4.7 m (15.5 ft.) above the ground. At this
location, the initial temperature inside the girder was 69.0 °F and there was no wind.
Figure 4.11 shows a thermal image and photo of the unheated surface from Heating
Location # 7. This area was chosen because of discoloration due to leaching on the bottom
surface of the box girder. The leaching may have been caused by water pooling inside the box
girder at this location, and then leaching through. However, the thermal image in Figure 4.11
66
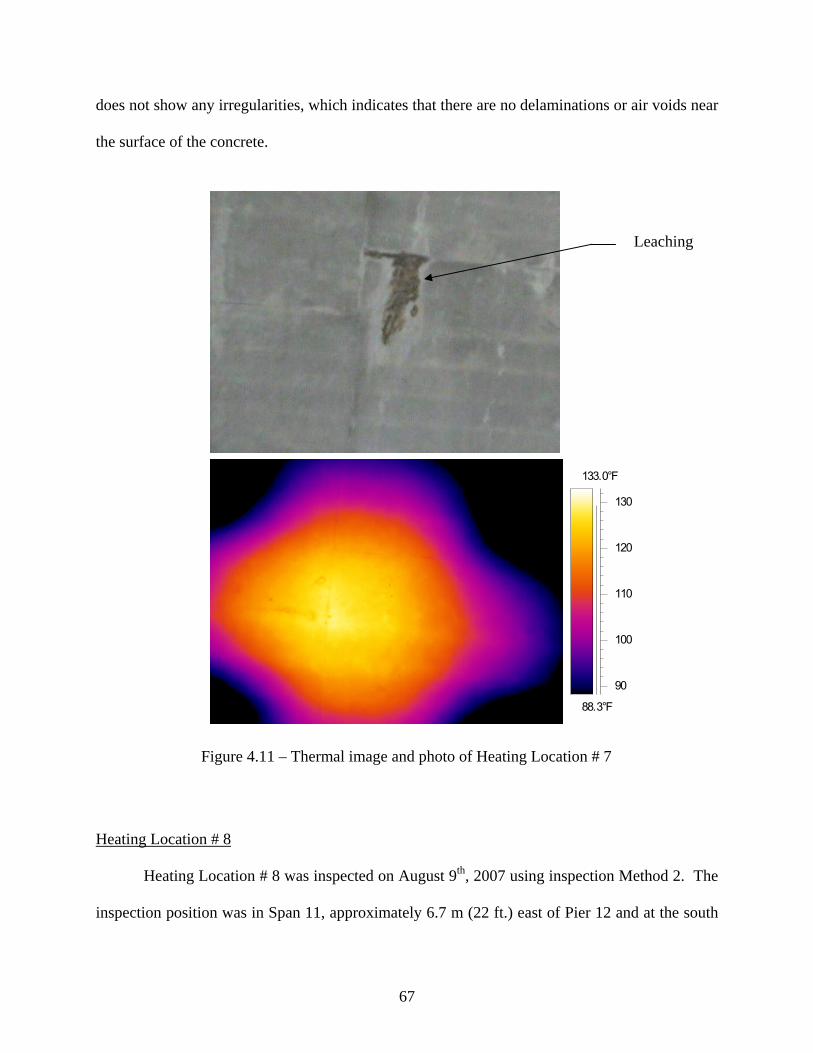
does not show any irregularities, which indicates that there are no delaminations or air voids near
the surface of the concrete.
88.3°F
133.0°F
90
100
110
120
130
Leaching
Figure 4.11 – Thermal image and photo of Heating Location # 7
Heating Location # 8
Heating Location # 8 was inspected on August 9th, 2007 using inspection Method 2. The
inspection position was in Span 11, approximately 6.7 m (22 ft.) east of Pier 12 and at the south
67

edge of the bridge. The surface was heated for a time span of 1:30 (hh:mm). The top of the
heater was placed approximately 107 cm (42 in.) from the heated surface, which was 7.2 m (23.5
ft.) above the ground. At this location, the initial ambient temperature was 62.0 °F and the
average wind speed was about 0.7 mph, with gusts up to 1.2 mph. With this inspection, the
camera was not located directly underneath the heating location when taking thermal images. It
was actually directed at an angle to the heated surface so that, when the infrared heater was
lowered down for a moment, a thermal image could be obtained. This process was completed
multiple times throughout the heating process in order to assess progressive changes in surface
temperature during the heating process.
Figure 4.12 shows a photo and thermal image of Heating Location # 8. From the photo,
one can see that the surface had been marked during previous WSDOT inspection. The
markings were somewhat unclear, or at least they did not match up with anything in the thermal
image. The image, however, does show a great deal about the surface. In the middle of the
heated surface area were a few flaws that varied greatly from the areas around them.
Temperature differences ranged from approximately 12 °F to 24 °F between the irregularities
and the surrounding concrete. The left side of the image revealed some flaws as well, but they
were not very clear because heat was not directly applied to that area. The flaws on the left side
of the thermal image do demonstrate, however, that a lot of direct heat is not necessary for flaws
to be detected.
68

62.2°F
138.5°F
80
100
120
Figure 4.12 – Thermal image and photo of Heating Location # 8
Heating Location # 9
Heating Location # 9 was inspected on August 8th, 2007 using inspection Method 1. The
inspection position was in Span 11, approximately 4.1 m (13.5 ft.) from the west edge of the
southern-most access hatch and just at the south edge of the bridge. The surface was heated for a
69

time span of 2:10 (hh:mm). This location was inspected like Heating Location # 7, where the
infrared heater was placed inside the box girder and images were taken of the unheated surface.
The top of the heater was placed approximately 61 cm (24 in.) above the heated surface inside
the box girder, and the box girder was 7.2 m (23.5 ft.) above the ground. At this location, the
initial temperature inside the girder was 64.5 °F and there was no wind.
Figure 4.13 shows a thermal image of Heating Location # 9. There is great thermal
variation in this image with temperature differences between 10 °F and 25 °F in the middle of the
heated area. With Method 1 heating, irregularities like delamination appear as cool regions
because the images were taken of the unheated surface. At delaminations, heat propagates at a
slower rate than through a section of concrete with no irregularities, and thus a cool spot occurs
on the unheated surface of a delaminated region.
The thermal image in Figure 4.13 was taken near the end of the heating process, at
approximately 1:55 (hh:mm) after heating began. When heat propagates through a material as in
Method 1, thermal images may still be obtained after the heat input has been removed. Even
with no heat source, the heat already within the concrete will still propagate toward regions of
lover temperature. During this inspection, thermal images were taken for two hours following
the removal of the heat source.
70
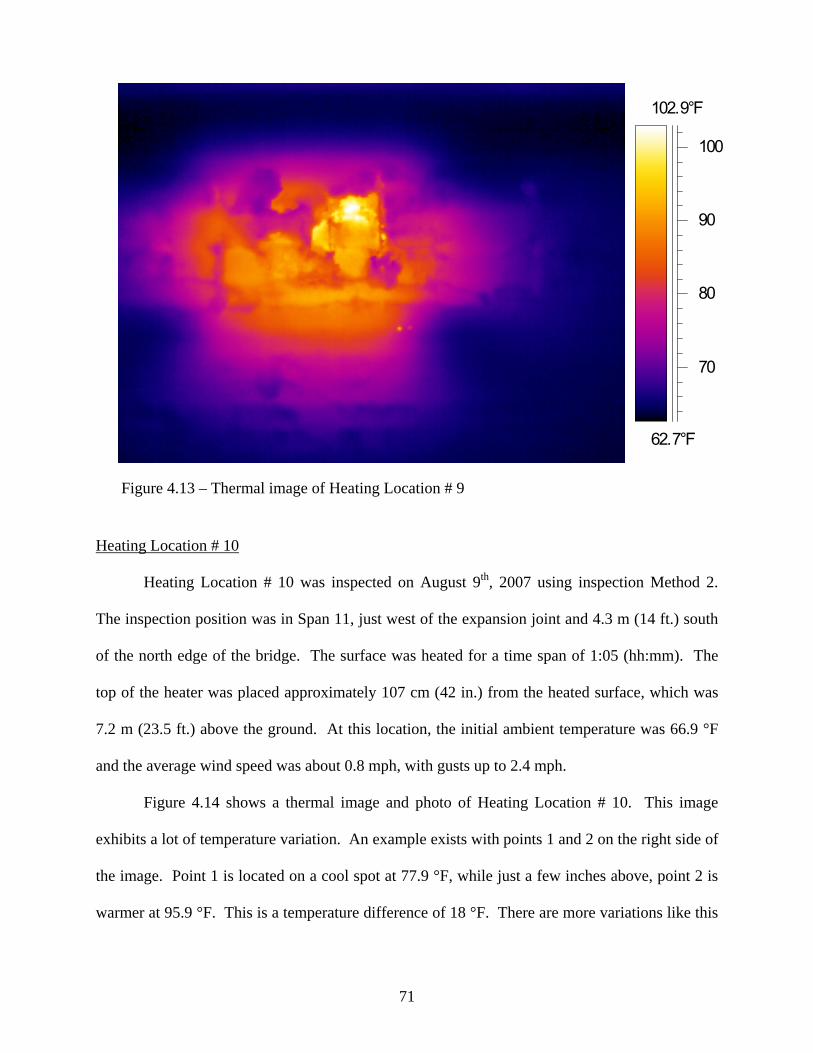
62.7°F
102.9°F
70
80
90
100
Figure 4.13 – Thermal image of Heating Location # 9
Heating Location # 10
Heating Location # 10 was inspected on August 9th, 2007 using inspection Method 2.
The inspection position was in Span 11, just west of the expansion joint and 4.3 m (14 ft.) south
of the north edge of the bridge. The surface was heated for a time span of 1:05 (hh:mm). The
top of the heater was placed approximately 107 cm (42 in.) from the heated surface, which was
7.2 m (23.5 ft.) above the ground. At this location, the initial ambient temperature was 66.9 °F
and the average wind speed was about 0.8 mph, with gusts up to 2.4 mph.
Figure 4.14 shows a thermal image and photo of Heating Location # 10. This image
exhibits a lot of temperature variation. An example exists with points 1 and 2 on the right side of
the image. Point 1 is located on a cool spot at 77.9 °F, while just a few inches above, point 2 is
warmer at 95.9 °F. This is a temperature difference of 18 °F. There are more variations like this
71

throughout the image, thus indicating that near-surface irregularities are present. Also, around
the edges of the heated area, discolorations are visible indicating inconsistencies in the concrete
surface. When looking at both the thermal image and photograph, it appears that temperature
differences occur where visual discoloration is present.
74.8°F
122.5°F
80
90
100
110
120
1 : 77.92 : 95.9
Figure 4.14 – Thermal image and photo of Heating Location # 10
72

Heating Location # 11
Heating Location # 11 was inspected on August 9th, 2007 using inspection Method 2.
The inspection position was in Span 11, approximately 4 m (13 ft.) from the north edge of the
bridge and 1.8 m (6 ft.) west of the northern-most access hatch. The surface was heated for a
time span of 0:40 (hh:mm). The top of the heater was placed approximately 107 cm (42 in.)
from the heated surface, which was 7.2 m (23.5 ft.) above the ground. At this location, the initial
ambient temperature was 70.4 °F and the average wind speed was about 0.9 mph, with gusts up
to 2.3 mph. Images obtained during this inspection were taken from the same platform that the
infrared heater rested on. The camera was located approximately 3 m (10 ft.) west of the
infrared heater, so images were taken at an angle to the heated surface.
Figure 4.15 shows a thermal image and photo of Heating Location # 11 that were taken
approximately 10 minutes after heating began. Visible flaws were present on the heated surface
and temperature differences between warm and cool areas were approximately 7 °F. The
thermal image shows that not much heat time is needed to detect surface irregularities and obtain
a significant temperature variation. Figure 4.15 also shows what looks like spalled concrete
(denoted by circle 1) and an area of delamination (denoted by circle 2).
Figure 4.16 shows a thermal image of Heating Location # 11 taken approximately 40
minutes after heating commenced. When comparing Figures 4.15 and 4.16, it is evident that a
lot of surface detail was lost as the heating time increased. This is likely due to the camera’s
automatic adjustment to a broader temperature range. Broader temperature ranges result in less
detailed images.
73

69.5°F
83.1°F
70
72
74
76
78
80
82
2
1
2
1
Figure 4.15 – Thermal image and photo of Heating Location # 11 approx. 10 min. after heating began
77.2°F
109.5°F
80
90
100
Figure 4.16 – Thermal image of Heating Location # 11 approx. 40 min. after heating began
74

Conclusions
The main conclusion drawn from Field Inspection 1 was that defects in near-surface
locations can be detected using thermal imaging. The numerous heating locations inspected
using both inspection Method 1 and Method 2 show flaws such as delamination, poorly
consolidated concrete, exposed rebar, and air voids. The flaws detected occasionally mimicked
what was seen visually, as with Heating Location # 5 (exposed rebar). However, some of the
flaws detected in thermal images were not detectable from visual inspection alone. Most of the
heating locations were actually chosen based on visual inspections beforehand or based on
thermal images taken under ambient conditions.
The thermal images indicated temperature differences up to 25 °F between areas that
were usually less than 7.5 to 10 cm (6 to 8 in.) apart. Areas close together like this should have
almost identical temperatures because they receive similar heat intensity. The temperature
differences show up well in the thermal images, especially if a narrow temperature range for the
image can be used (appropriate ranges depend on actual surface temperatures recorded on the
thermal image). Also, as with Heating Location # 11, not much heat time is needed to produce
an image showing near-surface flaws. Figures 4.15 and 4.16 show images taken after only 10
minutes and 40 minutes, respectively, and the irregularities are easily discernable from the
concrete around them.
75

4.2 Field Inspection 2
Location: Seattle, WA
Dates: August 13th – 14th, 2007
Objectives
The objective of this field inspection was to determine whether thermal imaging may be
helpful in assessing discolored regions on the bottom surface of a precast concrete box girder
bridge crossing over the northbound lanes of I-5 near the Spokane Street Interchange in Seattle,
WA. The bridge is labeled 5/537E-N by WSDOT. This area was designated a possible problem
region based on excessive leaching on the bottom side of the box girder.
Inspection Procedures
Inspection Method 1 involved placing the heater on four masonry blocks inside the box
girder, heating the floor surface, and taking thermal images of the unheated surface beneath the
box girder throughout the heating process. Inspection Method 2 entailed heating the exterior
bottom surface of the box girder and taking thermal images of that same heated surface after
heating was concluded. The thickness of the box girder floor was measure to be approximately
15 cm (6 in.).
Before any inspections took place, thermal images of the bottom surface of the box girder
under ambient conditions were analyzed to see if problem areas could be identified. Figure 4.17
shows a thermal image of the bridge (Span 4) under ambient conditions that encompasses most
of the span. This thermal image displays the access hatches used during one inspection (Heating
Location # 2). However, it does not reveal any specific problem areas. Without thermal
identification to locate problem areas, visual analysis was used in conjunction with access
limitations to determine heating locations. The positioning limits were based on access provided
76

by WSDOT lane closures on I-5. In Figure 4.17, only the area from the right side of the image to
approximately the two hatches was available for inspection. This allowed for two inspections,
one using Method 1 and the other using Method 2. The two heating locations were then chosen
based on what regions presented the most visible irregularities. It is important to note that
inspection of this box girder bridge took place at night. Setup started around 10:00 pm on
August 13th, and the final inspection ended at about 2:00 am on August 14th, for a total
inspection time of four hours.
66.2°F
77.0°F
68
70
72
74
76
South Access Hatch
North Access Hatch
Figure 4.17 – Thermal image of Span 4 under ambient conditions
Heating Location # 1
Heating Location # 1 was inspected on August 13th, 2007 using inspection Method 2.
The inspection position was in Span 4, just west of Pier 3. The surface was heated for a time
span of 0:40 (hh:mm). The top of the heater was placed approximately 107 cm (42 in.) below
the heated surface. This region was chosen due to the extensive leaching on its surface, as
77

displayed in Figure 4.18. The leaching shows up as the white area stretching across the photo,
and encircled by the orange line.
Leaching
Figure 4.18 – Photo of Heating Location # 1 showing extensive discoloration due to leaching
With this inspection, thermal images were taken throughout the heating process. The
camera was placed on the lift platform approximately 3 m (10 ft.) to one side of the heater.
Figure 4.19 shows two thermal images side by side that were taken approximately four minutes
after heating began. Each image shows one half of the heated surface. The circled region
demonstrates that after a fairly short heat time, surface characteristics and flaws were visible in
thermal images. There were also other visible irregularities in the middle of Figure 4.19.
78

70.7°F
86.2°F
75
80
85
58.0°F
99.7°F
60
70
80
90
Flaws
Figure 4.19 – Thermal images of Heating Location # 1, side by side
The thermal images in Figure 4.19 were taken in order to help locate areas that, with
further heat input, might reveal sub-surface flaws. The circled region shows what looks like a
flaw, so the heater was moved so that its center was directly underneath this region, and then
heating commenced again. From here, thermal images were taken every two minutes. Figure
4.20 shows a single image from the progression of images. Figure 4.21 shows a typical image
progression during heating, or what one would see from the camera display.
77.4°F
136.1°F
80
100
120
Figure 4.20 – Thermal image of Heating Location # 1 at middle of heating interval
79
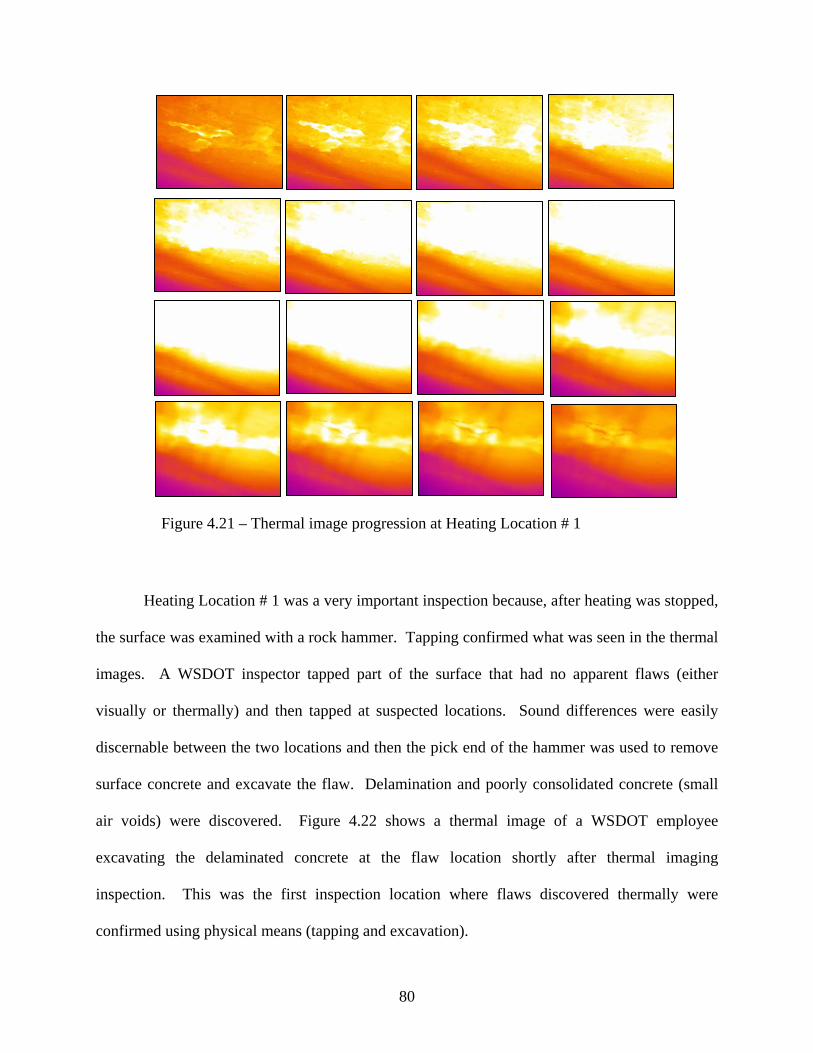
Figure 4.21 – Thermal image progression at Heating Location # 1
Heating Location # 1 was a very important inspection because, after heating was stopped,
the surface was examined with a rock hammer. Tapping confirmed what was seen in the thermal
images. A WSDOT inspector tapped part of the surface that had no apparent flaws (either
visually or thermally) and then tapped at suspected locations. Sound differences were easily
discernable between the two locations and then the pick end of the hammer was used to remove
surface concrete and excavate the flaw. Delamination and poorly consolidated concrete (small
air voids) were discovered. Figure 4.22 shows a thermal image of a WSDOT employee
excavating the delaminated concrete at the flaw location shortly after thermal imaging
inspection. This was the first inspection location where flaws discovered thermally were
confirmed using physical means (tapping and excavation).
80

74.7°F
90.2°F
75
80
85
90
Figure 4.22 – Thermal image of Heating Location # 1: excavating a detected flaw
Heating Location # 2
Heating Location # 2 was inspected on August 14th, 2007 using inspection Method 1.
The inspection position was in Span 4 inside the box girder from the south access hatch
(reference Figure 4.17). The surface was heated for a time span of 1:15 (hh:mm). The heater
was placed inside the box girder on four masonry blocks, approximately 61 cm (24 in.) from the
heated surface. This region was chosen due to extensive leaching on the exterior surface.
Further inspection of the box girder interior revealed a very moist environment, which suggests
that drainage water often accumulates (most likely in low spots where water cannot drain).
Thermal images from Heating Location # 2 do not reveal anything about the leaching or
the unheated surface. Steel reinforcement inside the concrete and one hot spot are shown in the
81

images. Figure 4.23 is comprised of two thermal images that show the reinforcing steel as cool
lines between warmer regions. The hot spot, which is located inside the circled region in both
thermal images, may be a delamination.
74.7°F
127.8°F
80
90
100
110
120
83.3°F
107.4°F
85
90
95
100
105
Figure 4.23 – Thermal images of Heating Location # 2
Conclusions
Field Inspection 2, conducted at an I-5 overpass in Seattle, WA, was very successful
because what was detected with thermal imaging was confirmed by “tapping” and excavation of
the heated surface (at Heating Location # 1). The thermal images (Figures 4.19 and 4.20)
suggested some sort of flaw (hypothesized as delamination), which was then verified by a
WSDOT employee using a rock hammer to excavate the flaw. These inspections also confirmed
that flaws can be visible in thermal images after only about 10 minutes of heat input (such as at
Heating Location # 1).
82

4.3 Field Inspection 3
Location: State Route 16, Pearl Street Overpass, Tacoma, WA
Dates: August 14th – 15th, 2007
Objectives
The objective of this field inspection was to determine whether thermal imaging may be
helpful in locating embedded tendons and detecting internal voids in the vertical webs of a
precast, post-tensioned (PT) concrete box girder bridge on Route 16 crossing over Pearl Street in
Tacoma, WA. This bridge was inspected because grouting problems had been reported during
construction. The idea was to use thermal imaging to detect any air voids present inside the post-
tensioning ducts. Improperly grouted ducts that contain air voids could lead to corrosion of the
steel tendons if moisture is allowed to accumulate in the system. The PT-ducts in this bridge
were metal.
Inspection Procedures
The Pearl Street overpass presented a different type of thermal imaging inspection than in
Field Inspections 1 and 2. Investigating post-tensioning ducts located in the bridge web
(interior) and wall (exterior) was the main focus for the Pearl Street overpass. The web and wall
were each 30 cm (12 in.) thick. Therefore longer heat times had to be implemented than in
previous field inspections (Field Inspections 1 and 2 involved inspecting 15 cm or 6 in. thick
concrete). Each web or wall had three PT-ducts running longitudinally through the box girder,
and their position varied vertically along the span. Access to only one chamber inside the box
girder was provided. Also, both inspection Method 1 and 2 were used.
83

Heating Location # 1
Heating Location # 1 was inspected on August 14th, 2007 using inspection Method 2.
Figure 4.24 shows the inspection point of the interior web inside the box girder, which was
located approximately at midspan of the bridge, 12.2 m (40 ft.) from the edge of the access
hatch. The surface was heated for a total time of 3:00 (hh:mm). This location entailed orienting
the heater horizontally (so that the longer edge of the heater ran longitudinally along the box
girder) on masonry blocks to raise the heater above the floor. The heater was approximately 61
cm (24 in.) from the heated surface and thermal images were obtained both during heating and
for one hour afterward. During heating, the infrared camera was situated to the side of the heater
and angled toward the heated surface.
Figure 4.24 – Photo of Heating Location # 1
84

Figure 4.25 shows a thermal image of Heating Location # 1 taken approximately 30
minutes after heating commenced. This image illustrates the state of the concrete surface and its
characteristics. A few hot and cool spots can be seen, but this image primarily reveals surface
characteristics of the concrete
83.6°F
165.0°F
100
120
140
160
Figure 4.25 – Thermal image of Heating Location # 1 (30 minutes after heating began)
The next two thermal images, shown in Figure 4.26, do not reveal anything regarding
materials embedded in the concrete box girder web. The first image on the left was taken after
2:55 mark (hh:mm) of heating. The second image on the right was taken after the camera was
moved directly in front of the heated surface, about 0:45 (hh:mm) after heating ended. There are
no PT-ducts visible in any of the thermal images, which indicates a couple of different things.
First, three hours of heat input may not be enough to provide thermal images showing PT-ducts
embedded in 30 cm (12 in.) thick concrete. Second, it is likely that the inspection setup was not
85

ideal for detecting the ducts. Inspection Method 2 involves taking thermal images from the same
side as the heat input, and specimen inspections conducted in the lab indicated that Method 2
does not yield images showing inner-surface characteristics. Also, due to the confined area
inside the box girder, the camera could not be placed as far from the heated surface as desired.
Thus the camera lens could not capture the entire heated surface area. Unfortunately, since the
opposite face of the box girder web was not accessible, inspection Method 2 was the only option
available.
91.5°F
180.3°F
100
120
140
160
180
89.9°F
125.1°F
90
100
110
120
Figure 4.26 –Thermal images of Heating Location # 1: a) after 2:55 (hh:mm) of heating (left) b) 0:45 (hh:mm) after heating stopped (right)
Heating Location # 2
Heating location # 2 was inspected on August 15th, 2007 using inspection Methods 1 and
2. The inspection point was located approximately 3.9 m (12.7 ft.) from the edge of the access
hatch to the center line of the heater. This inspection investigated the outer wall of the box
girder, where the surface was heated for a total heat time of 5:00 (hh:mm). The heater was
oriented vertically (i.e., the longer edge of the heater was vertical). The front of the heater was
positioned parallel to the wall, approximately 35.5 cm (14 in.) from the interior wall surface.
86

The heater was not elevated, so both the box girder wall and floor were heated, as shown in
Figure 4.27. Thermal images were obtained both during heating and for 40 minutes after heating
ended.
73.0°F
289.9°F
100
150
200
250
Figure 4.27 – Thermal image of Heating Location # 2 showing heater setup The inspection setup for this location allowed for two kinds of thermal images to be
obtained. The first kind of image was of the unheated surface, taken from ground level outside
the box girder (Method 1). The heated surface was approximately 9.1 m (30 ft.) above the
camera, and due to this large distance, images had less detail and a large viewing window.
Figure 4.28 shows one such image taken about three hours after heating began. From the image,
one can see that the heated surface (wall) was not as warm as the floor of the box girder. This is
due to the fact that the wall is thicker than the floor (12 in. versus 8 in.), and it takes longer for
heat to propagate through thicker concrete. After only three hours of heat input, there were no
PT-ducts or flaws visible in the thermal image. In Figure 4.28, circled area 1 shows the floor,
87

while circled area 2 shows the wall of the box girder. Thermal images taken of the unheated
surface after five hours of heating did not reveal the PT-ducts in the box girder wall.
70.6°F
103.8°F
80
90
100
2
1
Figure 4.28 – Thermal image of Heating Location # 2 taken of the unheated surface
Images of the heated surface were also obtained from inside the box girder after heating
ended. Figure 4.29 displays one such image where surface characteristics are visible. However,
as with Figures 4.27 and 4.28, the image does not show any PT-ducts. The flaws shown are
mostly surface irregularities and or small surface voids. Points 1 and 2 in the Figure 4.29 show a
temperature difference of approximately 24 °F in a span of only a few inches.
88

195.4°F
251.4°F
200
210
220
230
240
250
1 : 208.2
2 : 232.3
Figure 4.29 – Thermal image of Heating Location # 2 taken of the heated surface
Conclusions
Field Inspection 3, conducted on a box girder bridge crossing over Pearl Street in
Tacoma, WA, was a useful inspection in terms of defining thermal imaging limits. Neither
heating location (inside web or outside wall) produced thermal images showing post-tensioning
ducts (the initial goal). Images from Heating Location # 1 suggested that taking images from the
heated surface is not ideal for locating internal concrete attributes or flaws. Also, the web was
30 cm (12 in.) thick, which presents the test setup with more problems. Thicker concrete
provides a larger heat sink for dissipating the input energy, which makes it difficult to obtain a
sufficiently high temperature gradient from the heated surface to the unheated surface.
89

Heating Location # 2 used through-heating for five hours, but did not result in any
thermal images showing PT-ducts or other internal concrete characteristics. One reason is that
the thermal camera was much farther away from the unheated surface than in any other
inspections conducted (in the field or the lab) due to the height of the bridge above ground. An
increased distance also increases the thermal range that the camera reads, therefore making it
more difficult to detect smaller temperature differences on the surface. Also, edge effects may
have affected the results in terms of heat energy dissipation. In the lab, specimen edges and ends
were covered with two layers of insulation to help keep the heat energy within the specimen. In
the field, however, the heat not only propagates through the concrete thickness, but also along
the length and height of the box girder wall. The temperature gradient is reduced, resulting in
thermal images that do not reveal internal conditions of the concrete.
90

Chapter 5 – Summary
The research presented in this report has led to many conclusions about thermal imaging
and its usefulness in inspection of concrete box girder bridges. One of the most important
deductions from the thermal images regards the inspection setup. The Method 1 heating scenario
involved through-thickness heating (thermal images were taken of the unheated surface) and
Methods 2 and 3 involved taking thermal images of the heated surface (Method 2 used applied
heat whereas Method 3 used ambient conditions). Method 1 seemed to provide the best thermal
results. In inspections of lab specimens, simulated voids inside the PT-ducts were detected most
often with the Method 1 setup. This setup was also able to detect near-surface defects in the
field inspections. The Method 2 inspection setup was the least effective method to detect PT-
ducts, but worked very well in detecting near-surface defects.
Another conclusion from this research regards the thicknesses of concrete that can be
inspected using thermal imaging to detect embedded defects. In the lab, inspections of the 20 cm
(8 in.) specimens proved to be the most effective in terms of producing thermal images that
showed the PT-ducts and most of the simulated voids inside them. Inspection of the 30 cm (12
in.) thick specimens produced images showing the PT-ducts, but only one of the simulated voids
was detected. Images of the thinner specimens were crisper that those of the thicker specimens,
showing higher contrast between anomalies and the rest of the specimen. The reason for the
improved results when inspecting thinner concrete is that thicker specimens have more concrete
to dissipate heat energy, resulting in relatively uniform surface temperatures. This was also
demonstrated in Field Inspection 3, where the webs and walls of the Pearl Street overpass on
91

State Route 16 were 30 cm (12 in.) thick and thermal imaging inspection did not identify the PT-
ducts.
One of the most intriguing results confirms some of the past research discussed in
Chapter 2 (Literature Review). Results from Field Inspections 1 and 2 showed that near-surface
defects were easily detectable using either Method 1 or Method 2. Defects such as delamination,
spalled concrete, poor consolidation, and exposed rebar were identified in field inspections of
bridges. Also, inspections from two field sites revealed that, for a thermal image to show near-
surface defects, heat times do not need to be very long. An example is with Heating Location #
1 in Field Inspection 2, where the surface was heated for a total time of 40 minutes. Throughout
the heating, however, thermal images were taken and images taken within five to ten minutes
show defects very clearly.
The last conclusion drawn from the inspections conducted in the lab and field concerns
the sizes of voids that can be detected. During the inspections performed in the lab, only the
older, larger simulated voids in plastic PT-ducts were detected. None of the newer, smaller
simulated voids were detected, suggesting that void size and void orientation with respect to
adjacent steel tendons are critical parameters for detectability. The newer simulated voids were
designed to replicate voids that may occur at harp points in PT-ducts in the field. Also, since no
simulated voids were detected in metal PT-ducts, it is assumed that the metal conducts the heat
energy around the void, thus making it difficult to detect with thermal imaging.
92
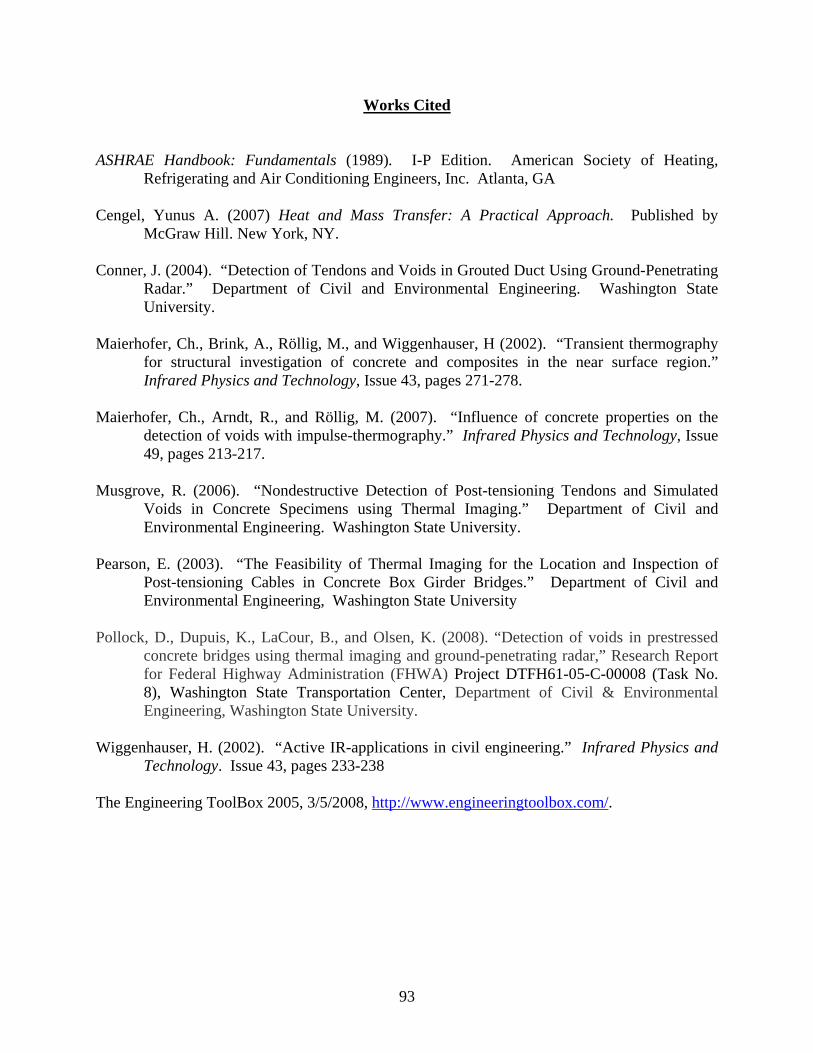
Works Cited
ASHRAE Handbook: Fundamentals (1989). I-P Edition. American Society of Heating,
Refrigerating and Air Conditioning Engineers, Inc. Atlanta, GA Cengel, Yunus A. (2007) Heat and Mass Transfer: A Practical Approach. Published by
McGraw Hill. New York, NY. Conner, J. (2004). “Detection of Tendons and Voids in Grouted Duct Using Ground-Penetrating
Radar.” Department of Civil and Environmental Engineering. Washington State University.
Maierhofer, Ch., Brink, A., Röllig, M., and Wiggenhauser, H (2002). “Transient thermography
for structural investigation of concrete and composites in the near surface region.” Infrared Physics and Technology, Issue 43, pages 271-278.
Maierhofer, Ch., Arndt, R., and Röllig, M. (2007). “Influence of concrete properties on the
detection of voids with impulse-thermography.” Infrared Physics and Technology, Issue 49, pages 213-217.
Musgrove, R. (2006). “Nondestructive Detection of Post-tensioning Tendons and Simulated
Voids in Concrete Specimens using Thermal Imaging.” Department of Civil and Environmental Engineering. Washington State University.
Pearson, E. (2003). “The Feasibility of Thermal Imaging for the Location and Inspection of
Post-tensioning Cables in Concrete Box Girder Bridges.” Department of Civil and Environmental Engineering, Washington State University
Pollock, D., Dupuis, K., LaCour, B., and Olsen, K. (2008). “Detection of voids in prestressed
concrete bridges using thermal imaging and ground-penetrating radar,” Research Report for Federal Highway Administration (FHWA) Project DTFH61-05-C-00008 (Task No. 8), Washington State Transportation Center, Department of Civil & Environmental Engineering, Washington State University.
Wiggenhauser, H. (2002). “Active IR-applications in civil engineering.” Infrared Physics and
Technology. Issue 43, pages 233-238 The Engineering ToolBox 2005, 3/5/2008, http://www.engineeringtoolbox.com/.
93