noninvasive diagnosis of seedless fruit using deep
TRANSCRIPT
Noninvasive Diagnosis of Seedless Fruit Using Deep Learning in Persimmon
Kanae Masuda1, Maria Suzuki1, Kohei Baba2, Kouki Takeshita2, Tetsuya Suzuki3,Mayu Sugiura3, Takeshi Niikawa3, Seiichi Uchida2 and Takashi Akagi1*
1Graduate School of Environmental and Life Science, Okayama University, Okayama 700-8530, Japan2Department of Advanced Information Technology, Kyushu University, Fukuoka 819-0395, Japan3Gifu Prefectural Agricultural Technology Center, Gifu 501-1152, Japan
Noninvasive diagnosis of internal traits in fruit crops is a high unmet need; however it generally requirestime, costs, and special methods or facilities. Recent progress in deep neural network (or deep learning)techniques would allow easy, but highly accurate diagnosis with single RGB images, and the latest applicationsenable visualization of “the reasons for each diagnosis” by backpropagation of neural networks. Here, wepropose an application of deep learning for image diagnosis on the classification of internal fruit traits, inthis case seedlessness, in persimmon fruit (Diospyros kaki). We examined the classification of seedlessness inpersimmon fruit by using four convolutional neural networks (CNN) models with various layer structures.With only 599 pictures of ‘Fuyu’ persimmon fruit from the fruit apex side, the neural networks successfullymade a binary classification of seedless and seeded fruits with up to 85% accuracy. Among the four CNNmodels, the VGG16 model with the simplest layer structure showed the highest classification accuracy of 89%.Prediction values for the binary classification of seeded fruits were significantly increased in proportion toseed numbers in all four CNN models. Furthermore, explainable AI methods, such as Gradient-weightedClass Activation Mapping (Grad-CAM) and Guided Grad-CAM, allowed visualization of the parts andpatterns contributing to the diagnosis. The results indicated that finer positions surrounding the apex, whichcorrespond to hypothetical bulges derived from seeds, are an index for seeded fruits. These results suggest thenovel potential of deep learning for noninvasive diagnosis of fruit internal traits using simple RGB images andalso provide novel insights into previously unrecognized features of seeded/seedless fruits.
Key Words: convolution neural network, fruit internal trait, image diagnosis, seed number, visual explanations.
IntroductionIn most fruit crops, seedlessness is a desirable trait,
both for fresh consumption and in processed fruits. Awide variety of techniques for the production of seed‐less fruits, such as treatment with phytohormones orchemical compounds, utilization/breeding of aneu‐ploidy/polyploidy or genetically seedless cultivars, havebeen developed (Rotino et al., 1997; Varoquaux et al.,2000). Representative practices are gibberellin treat‐ment in table grapes (Weaver and Pool, 1965; Kimuraet al., 1996), utilization of triploids in banana or water‐
Received; September 14, 2020. Accepted; November 25, 2020.First Published Online in J-STAGE on January 27, 2021.This work was supported by PRESTO from Japan Science andTechnology Agency (JST) [JPMJPR15Q1] to T.A., Grant-in-Aid forScientific Research on Innovative Areas from JSPS [19H04862] toT.A. and Grant-in-Aid for JSPS Fellows for [19J23361] to K.M.* Corresponding author (E-mail: [email protected]).
melon (Kihara, 1951; Henderson, 1977), selection ofparthenocarpic cultivars in tomato (Lukyanenko, 1991;Mazzucato et al., 1998), and breeding of stenospermo‐carpic cultivars in grape (Bouquet and Danglot, 1996).
Noninvasive prediction of internal traits or disordersin fruit is important for the selection of highly qualifiedfruit. Internal traits that have been investigated includeapple firmness and soluble solids content (Peng and Lu,2007), peach firmness (Lu and Peng, 2006), tart cher‐ries pit presence (Qin and Lu, 2005), tomato mechani‐cal damage (Milczarek et al., 2009), and pickle internaldefects (Ariana and Lu, 2010). Many noninvasive as‐sessments of internal fruit traits were developed basedon optical magnetic resonance imaging (MRI), twodimensional (2D) X-ray, near-infrared (NIR), and vibra‐tion for a variety of agricultural and food products(Milczarek et al., 2009; Cubero et al., 2011; Lorenteet al., 2011). A nondestructive tool for assessing inter‐nal traits or disorders is required to offer better quality
The Horticulture Journal 90 (2): 172–180. 2021.doi: 10.2503/hortj.UTD-248
JSHS
�e Japanese Society for
Horticultural Sciencehttp://www.jshs.jp/
© 2021 The Japanese Society for Horticultural Science (JSHS), All rights reserved.

products. However, in contrast to the described tech‐niques for stable production of seedless fruits, noninva‐sive prediction of seedlessness or seed numbers in fruitcrops is little developed, although it would be very use‐ful for commercial production (Varoquaux et al., 2000).In addition, problems when applying these tools on siteremain because special facilities and high costs are gen‐erally involved (Donis-González et al., 2014). On theother hand, experts can detect some internal traits fromthe outer appearance, although such “empirical” abili‐ties are cultivated only after long observational experi‐ence. Besides, manual prediction by experts isinefficient in terms of time and cost, and may not besuitable for ongoing “smart” agricultural techniques.
Deep neural network (or simply deep learning)frameworks may allow users to reproduce the profes‐sional eyes with “empirical” ability to predict fruitinternal traits, including seedlessness. Deep learningassists in addressing the increasing complexity and vol‐ume of imaging data and is increasing in popularity.Within the fields of image processing and diagnosis, theapplication of Convolutional Neural Networks (CNN)is considered a breakthrough (Shin et al., 2016). Forplants, to date, deep learning frameworks have beensuccessfully applied to the detection of stresses/diseases(Ramcharan et al., 2017; Ferentinos, 2018; Ghosalet al., 2018; Singh et al., 2018). On the other hand,there are only a few applications of deep neural net‐works to predict fruit internal traits, such as damagedetection in blueberry fruits (Wang et al., 2018) ordetection of internal disorders in persimmon fruits(Akagi et al., 2020). A major issue in image diagnosisby deep learning has been that the explanatory factorsin the image could not be detected. “Visual reason topredict the phenomenon” often directly indicates theearly symptoms or the phenomenon itself, contributingto site-specific physiological interpretation. Regardingthis issue, recent progress in the field has enabled “ex‐plainable artificial intelligence”, in which a sensitivityanalysis of the neural network, such as Gradient-weighted Class Activation Mapping (Grad-CAM)(Selvaraju et al., 2017), provides visual explanatory fac‐tors on the original image.
In this study, we focused on the prediction of seed‐lessness or seed numbers in persimmon (Diospyros kakiThunb.) fruits using deep neural networks. Persimmonis a major fruit crop, especially in East Asia. A wide va‐riety of hexaploid persimmon cultivars include variousnumbers of seeds (n = 0–8) in the fruit and mixed seed‐ed and seedless fruits are offered to consumers in mar‐kets, except for genetically seedless cultivars such asthe nonaploid ‘Hiratanenashi’. Despite the fact that per‐simmon fruits with seeds are commercially undesirable,as for most other fruit crops (Varoquaux et al., 2000),practical prediction tools for seed numbers have notbeen developed. The substantial shape of the fruit isthought to be unaffected by seed numbers, although
some experts are able to detect seedlessness in a fewmajor cultivars, such as ‘Fuyu’. Here, we aimed to de‐velop deep learning frameworks to predict seedlessnessin persimmon fruits using ‘Fuyu’ without empirical ex‐perience. We also examined the back-propagation of thetrained neural network models to visualize the charac‐teristics of seeded/seedless persimmon fruits. These re‐sults would develop into a novel effective technique todiagnose seedlessness only from simple photo images,and provide insights into “key points” in understandingfruit internal structures from outer appearances, withoutthe need for long empirical observational ability.
Materials and MethodsAssessment of seedlessness in persimmons
A total of 599 fully matured ‘Fuyu’ persimmon fruitswere harvested from four independent trees (38, 57, 58,and 92 years old) in late November 2018, at GifuPrefectural Agricultural Technology Center, Gifu, Japan(N35.441721, E136.699894). The fruits were placed ona gray-background sheet for photos from the fruit apexside using a digital camera (COOLPIX P520; NikonCorporation, Japan). The LED positional light(KANSAI RACK, Japan) was set just above the cameraand the fruits. The distances from the camera and thepositional light to the fruits were 40 cm and 60 cm, re‐spectively. The detailed settings of the camera were F-value of F/4, exposure time of 1/50 second, ISO-400,default white balance (auto), and the size of the imagewas 1600 × 1200 pixels. The images were taken in adim room to avoid the influence of external light. The‘Fuyu’ fruits were dissected to visually annotate seednumbers (n = 0–8) after taking the photos.
Image processing and construction of neural networksThis study followed typical three steps in classifica‐
tion with CNN assessment, given in Figure 1, (i) imageinput, (ii) training of images, and (iii) classification, fol‐lowed by (iv) backpropagation of the neural network(described later). The images were resized into 224 × 224 pixels to adjust the deep learning framework whichwas pre-trained with the standard image set fromImageNet (224 × 224 pixels) <http://www.image-net.org/> that could classify an internal disorder in persim‐mon fruit with high accuracy (Akagi et al., 2020). Notethat although the aspect ratio was changed from theoriginal images (1600 × 1200 pixels), we confirmedthat this change had no significant effect on classifica‐tion ability compared with using cropped images withthe same aspect ratio, as well as for diagnosis of inter‐nal disorders (Akagi et al., 2020) and quick softening(M. Suzuki, K. Masuda, and T. Akagi unpublished data)in persimmon fruit. The resized images were randomlyseparated into the training set (75%) and the test set(25%). Four standard deep neural network models,VGG16 (Simonyan and Zisserman, 2014), Resnet50(He et al., 2016), InceptionV3 (Szegedy et al., 2016a),
Hort. J. 90 (2): 172–180. 2021. 173

and InceptionResnetV2 (Szegedy et al., 2016b), wereexamined. Specifically, we used the implementationfound in the Keras library <http://keras.io/ja/>. For thedata augmentation process to increase the generaliza‐tion ability of the networks, new image samples weregenerated from the training images by random combi‐nations of brightness changes, horizontal flips, verticalflips, and rotation using the “ImageDataGenerator func‐tion” in Keras. We applied the “class-weight” option,which is available in Keras for balancing the categorieswith different sample numbers. Training and testing
(iii)
clas
sific
atio
n
(ii) training of images with CNN(VGG16, Resnet50, InceptionV3,
InceptionResnetV2)
seedless
Positive
Negative
(iv) backpropagationof neural networks
“Biological”interpretation
‘Fuyu’ persimmonn = 599
(i) im
age
inpu
t
seeded(between 1–8)
Annotation of seedless
Internal fruit quality
Fig. 1. The flow of deep learning diagnosis of seedless persimmonfruit and a visual explanation. Images from the apex side of atotal of 599 ‘Fuyu’ persimmon fruits were applied to CNN deeplearning analysis to classify into two categories depending onseed number. This flow consists of (i) image input, (ii) trainingof images, (iii) classification, and (iv) backpropagation of neu‐ral networks.
with those models were run on Ubuntu 18.04(DeepStation DK1000, 16GB RAM, GPU = 1; UEICorporation, Japan). We applied stochastic gradient de‐scent (SGD) for the optimizer, with a learning rate of0.001. The detailed settings of the neural network frameare summarized in Table 1A. The training process wasterminated when the loss values for the test set startedincreasing.
Evaluation of CNN models and feature extractionTo evaluate the classification performance by the
neural network models, we first derived receiver-operating characteristics (ROC) (Fan et al., 2006),which evaluated rate transition of the true-positive rate(TPR) and false-positive rate (FPR), as an index of clas‐sification accuracy. The area under the ROC curve(AUC) was calculated, which is a common metric inclassification accuracy. The feature distribution of thepositive and negative samples was visualized on a two-dimensional plane by using t-distributed StochasticNeighbor Embedding (t-SNE) (Maaten and Hinton,2008).
Visual explanation of classification resultsTo produce a “visual explanations” of the individual
classification results by the neural network model,Grad-CAM (Gradient-weighted Class ActivationMapping) and Guided Grad-CAM were applied(Selvaraju et al., 2017) on the step (iv) backpropagationof neural network in Figure 1. Grad-CAM is based on asensitivity analysis of the unit outputs of a certain layerin the network and produces a coarse localization map
Table 1. Setting (A), and accuracy and loss (B) in classification of seeded and seedless fruits for the four CNN models used in this study.(A)
Network VGG16 Resnet50 InceptionV3 InceptionResnetV2
Epoch 30 20 20 20
Solver type Stochastic Gradient Descent (SGD)learning rate 0.001 0.001 0.001 0.001momentum 0.9 0.9 0.9 0.9decay 1.0E-06 1.0E-06 1.0E-06 1.0E-06
Batch size 32 32 32 32
Datafile size 224 × 224 224 × 224 224 × 224 224 × 224
Data augmentation None TRUE TRUE TRUErotation 180° 180° 180°brightness 0.8 and 1.2 0.8 and 1.2 0.8 and 1.2horizontal/vertical TRUE TRUE TRUE
(B)
Network VGG16 Resnet50 InceptionV3 InceptionResnetV2
Accuracy train 1.00 0.95 0.88 0.87test 0.89 0.86 0.91 0.85
Loss train 0.01 0.12 0.22 0.24test 0.24 0.31 0.25 0.28
Table 1. Setting (A), and accuracy and loss (B) in classification of seeded and seedless fruits for the four CNN models used in this study.
174 K. Masuda, M. Suzuki, K. Baba, K. Takeshita, T. Suzuki, M. Sugiura, T. Niikawa, S. Uchida and T. Akagi
highlighting the weighted regions on the original image.An implementation of Grad-CAM and Guided Grad-CAM using the iNNvestigate library (Alber et al., 2019)can be found at <https://github.com/uchidalab/softmaxgradient-lrp>.
Distribution of relevance levelsDistributions of relevance levels in Guided Grad-
CAM, along with the distance from the outer contour ofthe fruitlet were calculated using all test images (intotal, 107 seeded and 42 seedless fruit images) andaveraged among the seedless and seeded test samples,respectively. The distribution is represented as atwo-dimensional histogram H(r,d) (Fig. 5A–D), wherer is the relevance level (given by an explainable-AImethod) and d is the (normalized) distance from theouter contour. To generate the histogram, the fruitletregion is first extracted from each fruit image using acolor clustering-based binarization technique, where allpixels in the image are clustered into two clusters byRGB values. Mathematical morphology operations arethen applied to the fruitlet region image to remove frag‐mental connected components (i.e., noises). Third,distance transformation is applied to determine thedistance from the fruit outer contour at each pixel. Notethat the distance is normalized so that the maximumdistance becomes 1. Finally, the two-dimensional his‐togram H(r,d) is obtained by counting the number ofpixels with the relevance level r and the normalizeddistance d.
ResultsDeep neural networks discriminate seedlessness inpersimmon fruits
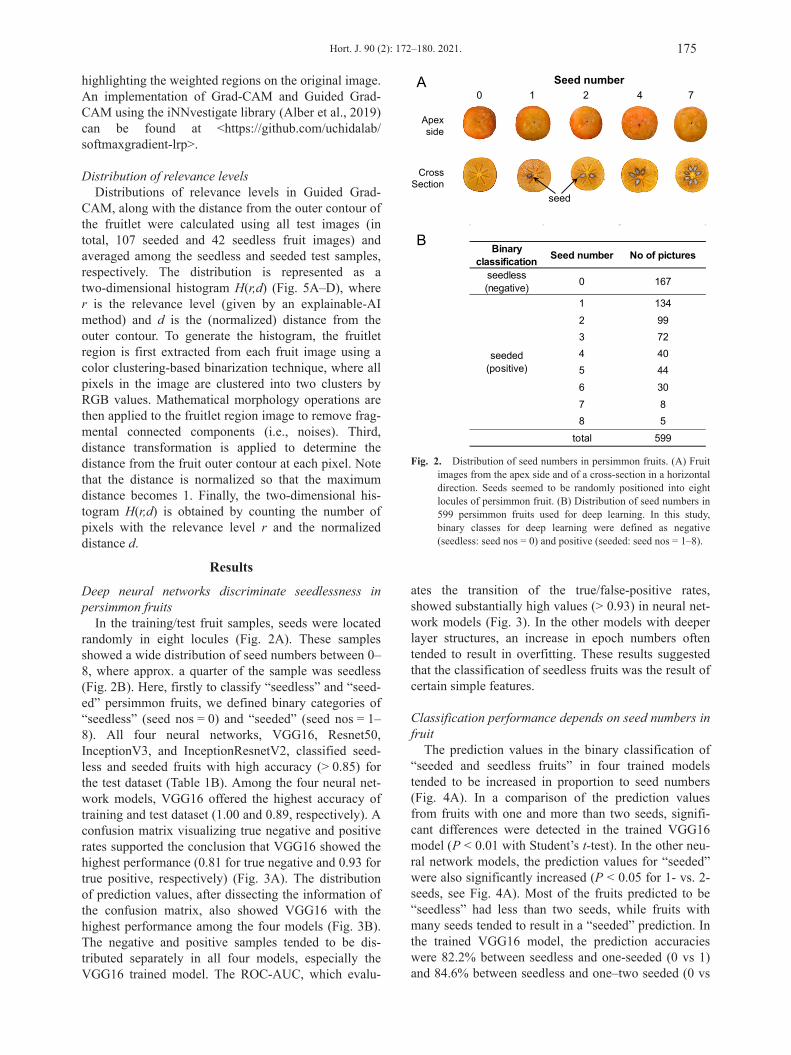
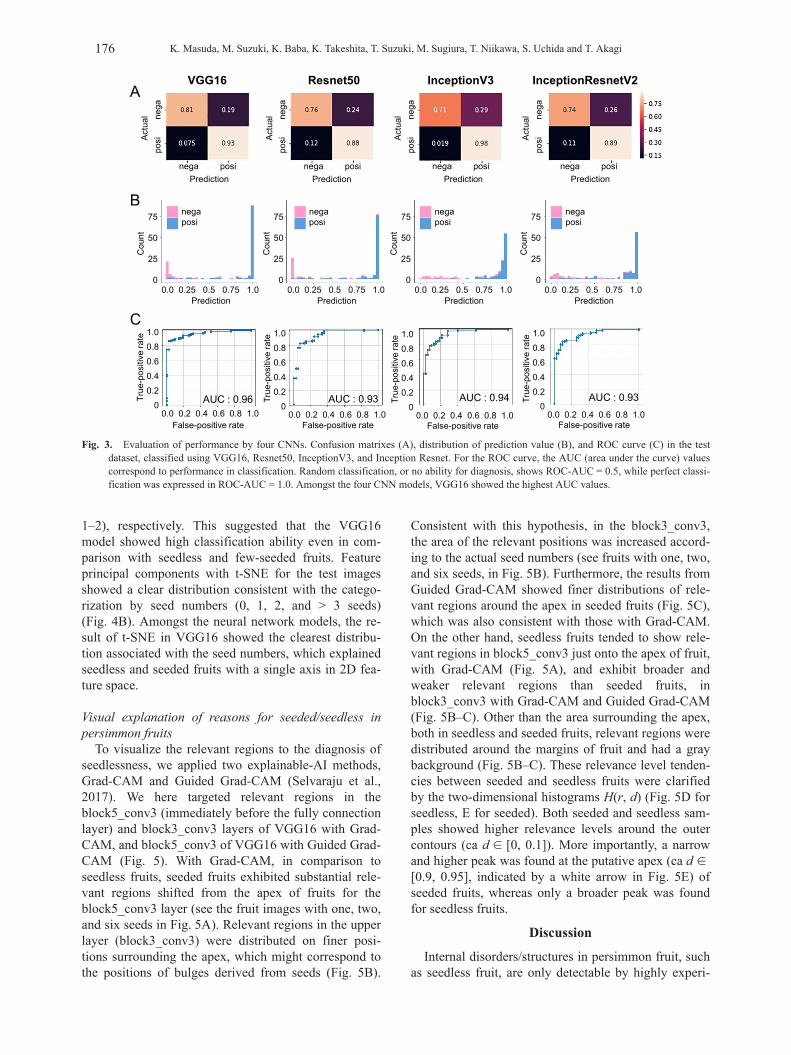
In the training/test fruit samples, seeds were locatedrandomly in eight locules (Fig. 2A). These samplesshowed a wide distribution of seed numbers between 0–8, where approx. a quarter of the sample was seedless(Fig. 2B). Here, firstly to classify “seedless” and “seed‐ed” persimmon fruits, we defined binary categories of“seedless” (seed nos = 0) and “seeded” (seed nos = 1–8). All four neural networks, VGG16, Resnet50,InceptionV3, and InceptionResnetV2, classified seed‐less and seeded fruits with high accuracy (> 0.85) forthe test dataset (Table 1B). Among the four neural net‐work models, VGG16 offered the highest accuracy oftraining and test dataset (1.00 and 0.89, respectively). Aconfusion matrix visualizing true negative and positiverates supported the conclusion that VGG16 showed thehighest performance (0.81 for true negative and 0.93 fortrue positive, respectively) (Fig. 3A). The distributionof prediction values, after dissecting the information ofthe confusion matrix, also showed VGG16 with thehighest performance among the four models (Fig. 3B).The negative and positive samples tended to be dis‐tributed separately in all four models, especially theVGG16 trained model. The ROC-AUC, which evalu‐
ates the transition of the true/false-positive rates,showed substantially high values (> 0.93) in neural net‐work models (Fig. 3). In the other models with deeperlayer structures, an increase in epoch numbers oftentended to result in overfitting. These results suggestedthat the classification of seedless fruits was the result ofcertain simple features.
Classification performance depends on seed numbers infruit
The prediction values in the binary classification of“seeded and seedless fruits” in four trained modelstended to be increased in proportion to seed numbers(Fig. 4A). In a comparison of the prediction valuesfrom fruits with one and more than two seeds, signifi‐cant differences were detected in the trained VGG16model (P < 0.01 with Student’s t-test). In the other neu‐ral network models, the prediction values for “seeded”were also significantly increased (P < 0.05 for 1- vs. 2-seeds, see Fig. 4A). Most of the fruits predicted to be“seedless” had less than two seeds, while fruits withmany seeds tended to result in a “seeded” prediction. Inthe trained VGG16 model, the prediction accuracieswere 82.2% between seedless and one-seeded (0 vs 1)and 84.6% between seedless and one–two seeded (0 vs
Apex side
Cross Section
B
A Seed number0 1 2 74
seed
Binaryclassification Seed number No of pictures
seedless(negative) 0 167
1 1342 993 724 405 446 307 88 5
total 599
seeded(positive)
Fig. 2. Distribution of seed numbers in persimmon fruits. (A) Fruitimages from the apex side and of a cross-section in a horizontaldirection. Seeds seemed to be randomly positioned into eightlocules of persimmon fruit. (B) Distribution of seed numbers in599 persimmon fruits used for deep learning. In this study,binary classes for deep learning were defined as negative(seedless: seed nos = 0) and positive (seeded: seed nos = 1–8).
Hort. J. 90 (2): 172–180. 2021. 175
1–2), respectively. This suggested that the VGG16model showed high classification ability even in com‐parison with seedless and few-seeded fruits. Featureprincipal components with t-SNE for the test imagesshowed a clear distribution consistent with the catego‐rization by seed numbers (0, 1, 2, and > 3 seeds)(Fig. 4B). Amongst the neural network models, the re‐sult of t-SNE in VGG16 showed the clearest distribu‐tion associated with the seed numbers, which explainedseedless and seeded fruits with a single axis in 2D fea‐ture space.
Visual explanation of reasons for seeded/seedless inpersimmon fruits
To visualize the relevant regions to the diagnosis ofseedlessness, we applied two explainable-AI methods,Grad-CAM and Guided Grad-CAM (Selvaraju et al.,2017). We here targeted relevant regions in theblock5_conv3 (immediately before the fully connectionlayer) and block3_conv3 layers of VGG16 with Grad-CAM, and block5_conv3 of VGG16 with Guided Grad-CAM (Fig. 5). With Grad-CAM, in comparison toseedless fruits, seeded fruits exhibited substantial rele‐vant regions shifted from the apex of fruits for theblock5_conv3 layer (see the fruit images with one, two,and six seeds in Fig. 5A). Relevant regions in the upperlayer (block3_conv3) were distributed on finer posi‐tions surrounding the apex, which might correspond tothe positions of bulges derived from seeds (Fig. 5B).
Consistent with this hypothesis, in the block3_conv3,the area of the relevant positions was increased accord‐ing to the actual seed numbers (see fruits with one, two,and six seeds, in Fig. 5B). Furthermore, the results fromGuided Grad-CAM showed finer distributions of rele‐vant regions around the apex in seeded fruits (Fig. 5C),which was also consistent with those with Grad-CAM.On the other hand, seedless fruits tended to show rele‐vant regions in block5_conv3 just onto the apex of fruit,with Grad-CAM (Fig. 5A), and exhibit broader andweaker relevant regions than seeded fruits, inblock3_conv3 with Grad-CAM and Guided Grad-CAM(Fig. 5B–C). Other than the area surrounding the apex,both in seedless and seeded fruits, relevant regions weredistributed around the margins of fruit and had a graybackground (Fig. 5B–C). These relevance level tenden‐cies between seeded and seedless fruits were clarifiedby the two-dimensional histograms Η(r, d) (Fig. 5D forseedless, E for seeded). Both seeded and seedless sam‐ples showed higher relevance levels around the outercontours (ca d ∈ [0, 0.1]). More importantly, a narrowand higher peak was found at the putative apex (ca d ∈ [0.9, 0.95], indicated by a white arrow in Fig. 5E) ofseeded fruits, whereas only a broader peak was foundfor seedless fruits.
DiscussionInternal disorders/structures in persimmon fruit, such
as seedless fruit, are only detectable by highly experi‐
AUC : 0.96
VGG16
AUC : 0.93
Resnet50
AUC : 0.94
InceptionV3
AUC : 0.93
InceptionResnetV2A
BPrediction
Actu
al
nega posine
gapo
si
0.0 0.2 0.4 0.6 0.8 1.0
1.00.80.60.40.2
0
True
-pos
itive
rate
C
0.0 0.2 0.4 0.6 0.8 1.0
1.00.80.60.40.2
0
True
-pos
itive
rate
0.0 0.2 0.4 0.6 0.8 1.0
1.00.80.60.40.2
0Tr
ue-p
ositi
ve ra
te
0.0 0.2 0.4 0.6 0.8 1.0
1.00.80.60.40.2
0
True
-pos
itive
rate
Prediction0.0 0.25 0.5 0.75 1.0
75
50
25
0
Cou
nt
Prediction0.0 0.25 0.5 0.75 1.0
75
50
25
0
Cou
nt
Prediction0.0 0.25 0.5 0.75 1.0
75
50
25
0
Cou
nt
Prediction0.0 0.25 0.5 0.75 1.0
75
50
25
0
Cou
nt
negaposi
negaposi
negaposi
negaposi
Prediction
Actu
al
nega posi
nega
posi
Prediction
Actu
al
nega posi
nega
posi
Prediction
Actu
al
nega posi
nega
posi
False-positive rate False-positive rate False-positive rate False-positive rate
Fig. 3. Evaluation of performance by four CNNs. Confusion matrixes (A), distribution of prediction value (B), and ROC curve (C) in the testdataset, classified using VGG16, Resnet50, InceptionV3, and Inception Resnet. For the ROC curve, the AUC (area under the curve) valuescorrespond to performance in classification. Random classification, or no ability for diagnosis, shows ROC-AUC = 0.5, while perfect classi‐fication was expressed in ROC-AUC = 1.0. Amongst the four CNN models, VGG16 showed the highest AUC values.
176 K. Masuda, M. Suzuki, K. Baba, K. Takeshita, T. Suzuki, M. Sugiura, T. Niikawa, S. Uchida and T. Akagi

enced experts. Even though this is possible, it is oftendifficult to pass on the relevant skills to reproduce thediscriminating techniques, or to explain the reasons forthe diagnosis because the features for seedlessness aredetermined by considering multiple factors and are notexplainable from a single factor. Our results suggestthat a noninvasive diagnosis of seedlessness may beimmediately reproducible with CNN-based deep neuralnetworks using simple pictures of persimmon fruits.Noninvasive diagnosis of fruit internal traits would bein high demand, regardless of fruit crop species, asdetection of internal status generally requires specialmethods or facilities, such as acoustic vibration(Nakano et al., 2018) or ultrasonic inspection (Gaete-Garretón et al., 2005; Mizrach, 2008). Here, we pro‐posed the application of deep neural networks withsimple fruit images using normal cameras, in whichdiagnosis by the trained model took < 0.1 seconds perfruit. This substantially reduces both cost and time for
the selection of seedless fruit and additionally would beuseful to apply to the detection of other fruit internaltraits.
Amongst the four models used in this study, VGG16,which carries the simplest layer structure, was the best-fitted for classification of seedlessness in persimmonfruits with 89% accuracy (Figs. 3 and 4), which washigher than the 70–80% accuracy of the highly experi‐enced fruit selection experts. This suggests that relative‐ly simple features may be involved in the differencebetween seedless and seeded fruits. The number oftraining/test images (n = 599) in our analysis was muchless than other studies with deep neural networks, suchas typical image recognition contests (n >100,000 inImage-net Large Scale Visual Recognition Challenge:ILSVRC). This situation may relate to the inconsistentdiagnostic abilities among the models, in which CNNwith highly complicated layers showed no significantimprovement in classification. The fact that VGG16
Resnet50
Pred
ictio
n
A VGG16
B Resnet50VGG16
InceptionV3 InceptionResnetV2
**** ** * ** *
Seeds number Seeds number Seeds number Seeds number
1.00
0.75
0.50
0.25
0.000 1 2 >3 0 1 2 >3 0 1 2 >3 0 1 2 >3
** ** *
Pred
ictio
n
Pred
ictio
n
Pred
ictio
n
InceptionV3 InceptionResnetV2
Seeds number
1st dimensional feature
2nd
dim
ensi
onal
feat
ure
1st dimensional feature
2nd
dim
ensi
onal
feat
ure
2nd
dim
ensi
onal
feat
ure
2nd
dim
ensi
onal
feat
ure
1st dimensional feature1st dimensional feature
1.00
0.75
0.50
0.25
0.00
1.00
0.75
0.50
0.25
0.00
1.00
0.75
0.50
0.25
0.00
Fig. 4. Distribution of prediction values and features, along with seed numbers. Each model was trained for binary classification of seeded/seed‐less fruits. (A) Distribution of the prediction values, in seedless (seed nos = 0), 1-, 2-, and > 3-seed samples. They showed a clear tendencyof increase in prediction values in proportion to seed numbers. * and ** indicate P = 0.05 and 0.01, respectively, for statistical significance.(B) Visualization of two-dimensional t-SNE features in the convolution layer immediately before full-connection in each CNN model, ac‐cording to the seed numbers. Outlined gold, and filled green, blue, and pink circles show samples with 0, 1, 2, and > 3 seeds, respectively.Outlined/filled squares with each color give averages with standard error (SE) bars.
Hort. J. 90 (2): 172–180. 2021. 177

with simple CNN could diagnose well is another meritfor the backpropagation of CNN. Backpropagation ofthe neural networks using Grad-CAM and GuidedGrad-CAM enabled us to visualize the reason(s) thatthe network could classify seedless and seeded fruits. InCNN with complicated layers, such as InceptionV3 orResnet50, it is hard to backpropagate the layers furtherfrom the full-connection layer, while CNN with simplelayer structure can allow visualizing of the upper layers,where the features are not highly pooled yet. As indi‐cated in our results (Fig. 5), often visualization of upperlayers may provide finer (or easier) interpretations forphysiological or morphological research. Alternatively,
0 1 62bl
ock3
_con
v3
seeded
bloc
k5_c
onv3
Negative : 99.9%Positive : 0.1%
Negative : 0.1%Positive : 99.9%
Negative : 0.1%Positive : 99.9%
Negative : 0.1%Positive : 99.9%
A
B
bloc
k3_c
onv3
C
seedless
Gra
d-C
amG
rad-
Cam
Gui
ded
Gra
d-C
am
E
seedless
seeded
Normalized distance from outer contour
Rel
evan
ce le
vel o
f G
uide
d G
rad-
CAM
rele
vanc
e le
vel o
f G
uide
d G
rad-
CAM
seeded
Normalized distance from outer contour
Orig
inal
imag
e
D
Rel
evan
ce le
vel o
f G
uide
d G
rad-
CAM
Rel
evan
ce le
vel o
f G
uide
d G
rad-
CAM
E F
Fig. 5. Visualization of explanation factors in classification ofseeded/seedless fruits. (A) Original images of the fruits withseedless and 1–6 seeds. Visualization of the distribution of rele‐vant regions in (B) VGG16 block5_conv3 and (C) block3_conv3 with Grad-CAM, and in (D) VGG16 block5_conv3 withGuided Grad-CAM, in seedless, 1-seed, 2-seeds, and 6-seedsamples. The relevant regions in the block5_conv3 (immediate‐ly before full connection) with Grad-CAM showed ambiguousand wide distribution, while the shallower layer (black3_conv3)with Grad-CAM or with Guided Grad-CAM showed finer dis‐tributions surrounding the apex and the outer contours. (E–F)Two-dimensional histograms of relevance levels with GuidedGrad-CAM, Η(r, d), where r is the relevance level of a pixeland d is the normalized distance of the pixel from the outercontour (d = 0) to the center (d = 1). A white arrow in the seed‐ed fruit histogram (F) gives a peak that corresponds to the posi‐tion of bulges due to seeds.
the application of Guided Grad-CAM, which is im‐proved Grad-CAM to show finer localization of rele‐vance values, also might work better. Although notexamined in this study, a combination of other back‐propagation methods, such as layer-wise relevancepropagation (LRP) (Bach et al., 2015) and its derivatetools may provide a better understanding.
In our analysis, CNN was trained to classify the pic‐tures into binary categories, seedless and seeded fruits,although seed numbers are originally a quantitativephenotype. Importantly, distributions of prediction val‐ues for these two categories were increased in propor‐tion to the seed numbers (Fig. 4). This suggested thatCNN models for “regression” potentially work to esti‐mate seed numbers as a quantitative phenotype. Asindicated in the results section, this tendency wascaptured also in the application of explainable-AI meth‐ods, where the relevant regions for positive classifica‐tion tended to be distributed more widely around theapex in fruit with more seeds (Fig. 5B–C). Future workassociating the relevant regions and the actual internalstructure (or seed positions) would give a proper under‐standing of physiological or morphological interpreta‐tion.
For practical use of the CNN models, there are threemain issues; image quality, conditions when taking im‐ages, and accuracy to select seedless fruits. First, nor‐mal cameras attached to the fruit sorting lines (at leastin Japan) take approx. 310,000 pixels (640 × 480 pix‐els) images (Kurita et al., 2006). Since we successfullyapplied approx. 50,000 pixels (224 × 224 pixels), whichwas resized from 2,000,000 pixels (1600 × 1200 pixels)original images, for the CNN models in this study, inputimage quality from normal cameras would be sufficientfor use of our CNN models. Second, although this studyarranged well-uniformed conditions for taking imagesthat mimicked fruit sorting lines, the actual conditionsfor seedless diagnosis may be diverse. More fruit im‐ages in a wider variety of backgrounds might be able toimprove classification ability for practical use. Testdiagnosis on site, with specific picture background andlight conditions, will be required for practical use.Third, the probability of “actual seedless” fruits in the“predicted seedless” class depends on the threshold ofthe prediction values. For instance, to maximize theprobability of seedless fruit with the VGG16 model (seeFig. 3B for the distribution of prediction values), classi‐fication with threshold prediction values of 0.15 result‐ed in 87.9% seedless fruit in the predicted seedlesscategory, which was substantially higher than 81.0%with the threshold of 0.5. Making these potential im‐provements in the future would enable practical predic‐tion tools for seedless fruits.
ConclusionOur application of deep learning with four CNN
models classified seeded/seedless fruits with high accu‐
178 K. Masuda, M. Suzuki, K. Baba, K. Takeshita, T. Suzuki, M. Sugiura, T. Niikawa, S. Uchida and T. Akagi

racy from only 599 RGB images of outer appearances.Among the four CNNs, VGG16 with the simplest layerstructure offered the highest performance. An increasein prediction values in proportion to the seed numberssuggested a potential “regression” approach to quantita‐tively estimate seed numbers in future. Visualization ofan explanation map with Grad-CAM and Guided Grad-CAM properly pointed out substantial contributors inthe images, which may provide interpretation or in‐sights into physiological or morphological aspects inseedless fruit research. Our results suggest that deeplearning can immediately produce “professional eyes”on fruit internal traits, which are usually cultivated withdecades of experience, and also explain the reasons forthe discrimination.
AcknowledgementsWe thank Ryohei Kuroki in the Graduate School of
Information Science and Electrical Engineering,Kyushu University, for setting up an analysis environ‐ment for deep learning and providing technical codesfor convolutional neural networks.
Literature CitedAkagi, T., M. Onishi, K. Masuda, R. Kuroki, K. Baba, K.
Takeshita, T. Suzuki, T. Niikawa, S. Uchida and T. Ise. 2020.Explainable deep learning reproduce a “professional eye” onthe diagnosis of internal disorders in persimmon fruit. PlantCell Physiol. 61: 1967–1973.
Alber, M., S. Lapuschkin, P. Seegerer, M. Hägele, K. T. Schütt,G. Montavon, W. Samek, K. R. Muller, S. Dähne and P. J.Kindermans. 2019. iNNvestigate neural networks!. J. Mach.Learn. Res. 20: 1–8.
Ariana, D. P. and R. Lu. 2010. Hyperspectral waveband selectionfor internal defect detection of pickling cucumbers andwhole pickles. Comput. Electron. Agri. 74: 137–144.
Bach, S., A. Binder, G. Montavon, F. Klauschen, K. R. Müllerand W. Samek. 2015. On pixel-wise explanations for non-linear classifier decisions by layer-wise relevance propaga‐tion. PLoS One. DOI: 10.1371/journal.pone.0130140.
Bouquet, A. and Y. Danglot. 1996. Inheritance of seedlessness ingrapevine (Vitis vinifera L.). Vitis 35: 35–42.
Cubero, S., N. Aleixos, E. Moltó, J. Gómez-Sanchis and J.Blasco. 2011. Advances in machine vision applications forautomatic inspection and quality evaluation of fruits andvegetables. Food Bioproc. Technol. 4: 487–504.
Donis-González, I. R., D. E. Guyer, A. Pease and F. Barthel.2014. Internal characterization of fresh agricultural productsusing traditional and ultrafast electron beam X-ray computedtomography imaging. Biosyst. Eng. 117: 104–113.
Fan, J., S. Upadhye and A. Worster. 2006. Understanding receiveroperating characteristic (ROC) curves. CJEM 8: 19–20.
Ferentinos, K. P. 2018. Deep learning models for plant diseasedetection and diagnosis. Comput. Electron. Agric. 145: 311–318.
Gaete-Garretón, L., Y. Vargas‐Hernndez, C. León‐Vidal and A.Pettorino‐Besnier. 2005. A novel noninvasive ultrasonicmethod to assess avocado ripening. J. Food Sci. 70: 187–191.
Ghosal, S., D. Blystone, A. K. Singh, B. Ganapathysubramanian,A. Singh and S. Sarkar. 2018. An explainable deep machine
vision framework for plant stress phenotyping. Proc. Natl.Acad. Sci. USA 115: 4613–4618.
He, K., X. Zhang, S. Ren and J. Sun. 2016. Deep residual learn‐ing for image recognition. In CVPR 770–778.
Henderson, W. R. 1977. Effect of cultivar, polyploidy and recip‐rocal hybridization on characters important in breedingtriploid seedless watermelon hybrids. J. Am. Soc. Hort. Sci.1023: 293–297.
Kihara, H. 1951. Triploid watermelons. Proc. Amer. Soc. Hort.Sci. 58: 217–230.
Kimura, P. H., G. Okamoto and K. Hirano. 1996. Effects of gib‐berellic acid and streptomycin on pollen germination andovule and seed development in Muscat Bailey A. Am. J.Enol. Vitic. 47: 152–156.
Kurita, M., N. Kondo and K. Ninomiya. 2006. Defect detectionfor tomato grading by use of six color CCD cameras. Jpn.Soc. High Technol. Agric. 18: 135–144.
Lorente, D., N. Aleixos, J. U. A. N. Gómez-Sanchis, S. Cubero,O. L. García-Navarrete and J. Blasco. 2011. Recent ad‐vances and applications of hyperspectral imaging for fruitand vegetable quality assessment. Food Bioproc. Technol. 5:1121–1142.
Lu, R. and Y. Peng. 2006. Hyperspectral scattering for assessingpeach fruit firmness. Biosyst. Eng. 93: 161–171.
Lukyanenko, A. N. 1991. Parthenocarpy in tomato. Theor. Appl.Genet. 14: 167–177.
Maaten, L. V. D. and G. Hinton. 2008. Visualizing data using t-SNE. J. Mach. Learn. Res. 9: 2579–2605.
Mazzucato, A., A. R. Taddei and G. P. Soressi. 1998. Theparthenocarpic fruit (pat) mutant of tomato (Lycopersiconesculentum Mill.) sets seedless fruits and has aberrant antherand ovule development. Development 125: 107–114.
Milczarek, R. R., M. E. Saltveit, T. C. Garvey and M. J.McCarthy. 2009. Assessment of tomato pericarp mechanicaldamage using multivariate analysis of magnetic resonanceimages. Postharvest Biol. Technol. 52: 189–195.
Mizrach, A. 2008. Ultrasonic technology for quality evaluation offresh fruit and vegetables in pre-and postharvest processes.Postharvest Biol. Technol. 48: 315–330.
Nakano, R., H. Akimoto, F. Fukuda, T. Kawai, K. Ushijima, Y.Fukamatsu, Y. Kubo, Y. Fujii, K. Hirano, K. Morinaga andN. Sakurai. 2018. Nondestructive detection of split pit inpeaches using an acoustic vibration method. Hort. J. 87:281–287.
Peng, Y. and R. Lu. 2007. Prediction of apple fruit firmness andsoluble solids content using characteristics of multispectralscattering images. J. Food Eng. 82: 142–152.
Qin, J. and R. Lu. 2005. Detection of pits in tart cherries by hy‐perspectral transmission imaging. Transactions of the ASAE48: 1963–1970.
Ramcharan, A., K. Baranowski, P. McCloskey, B. Ahmed, J.Legg and D. P. Hughes. 2017. Deep learning for image-based cassava disease detection. Front. Plant Sci. 8: 1852.DOI: 10.3389/fpls.2017.01852.
Rotino, G. L., E. Perri, M. Zottini, H. Sommer and A. Spena.1997. Genetic engineering of parthenocarpic plants. Nat.Biotech. 15: 1398–1401.
Selvaraju, R. R., M. Cogswell, A. Das, R. Vedantam, D. Parikhand D. Batra. 2017. Grad-cam: Visual explanations fromdeep networks via gradient-based localization. In ICCV618–626. DOI: 10.1007/s11263-019-01228-7.
Shin, H. C., H. R. Roth, M. Gao, L. Lu, Z. Xu, I. Nogues, J. Yao,D. Mollura and R. M. Summers. 2016. Deep convolutionalneural networks for computer-aided detection: CNN archi‐tectures, dataset characteristics and transfer learning. IEEE
Hort. J. 90 (2): 172–180. 2021. 179

Trans. Med. Imag. 35: 1285–1298.Simonyan, K. and A. Zisserman. 2014. Very deep convolutional
networks for large-scale image recognition. arXiv:1409.1556. < https://arxiv.org/abs/1409.1556>.
Singh, A. K., B. Ganapathysubramanian, S. Sarkar and A. Singh.2018. Deep learning for plant stress phenotyping: trends andfuture perspectives. Trends Plant Sci. 23: 883–898.
Szegedy, C., S. Ioffe, V. Vanhoucke and A. Alemi. 2016a.Inception-v4, inception-resnet and the impact of residualconnections on learning. arXiv:1602.07261. <https://arxiv.org/abs/1602.07261>.
Szegedy, C., V. Vanhoucke, S. Ioffe, J. Shlens and Z. Wojna.2016b. Rethinking the inception architecture for computer
vision. arXiv: 1512.00567. <https://arxiv.org/abs/1512.00567>.
Varoquaux, F., R. Blanvillain, M. Delseny and P. Gallois. 2000.Less is better: new approaches for seedless fruit production.Trends Biotech. 18: 233–242.
Wang, Z., M. Hu and G. Zhai. 2018. Application of deep learningarchitectures for accurate and rapid detection of internalmechanical damage of blueberry using hyperspectral trans‐mittance data. Sensors 18: 1126. DOI: 10.3390/s18041126.
Weaver, R. J. and R. M. Pool. 1965. Relation of seededness andringing to gibberellin-like activity in berries of Vitis vinifera.Plant Physiol. 40: 770–776.
180 K. Masuda, M. Suzuki, K. Baba, K. Takeshita, T. Suzuki, M. Sugiura, T. Niikawa, S. Uchida and T. Akagi