nonlinear analysis of rc structure with massive infill
TRANSCRIPT
a*Corresponding author, PhD, E-mail: [email protected] bPh.D., E-mail:[email protected] cPh.D., E-mail:[email protected]
Nonlinear analysis of RC structure with massive infill wall exposed to shake table
Onur Onat*1a, Paulo B. Lourenço2b and Ali Koçak3c
1Department of Civil Engineering, Tunceli University, Tunceli, Turkey
2 ISISE, Department of Civil Engineering, University of Minho, Guimarães,Portugal 3Department of Civil Engineering, Yıldız Technical University, İstanbul,Turkey
Abstract. This study aims to present nonlinear time history analysis results of double leaf cavity wall (DLCW) reinforced concrete structure exposed to shake table tests. Simulation of the model was done by a Finite Element (FE) program. Shake table experiment was performed at the National Civil Engineering Laboratory in Lisbon, Portugal. The results of the experiment was compared with numeric DLCW model and numeric model of reinforced concrete structure with unreinforced masonry wall (URM). Both DLCW and URM models have two bays and two stories. Dimensions of the tested structure and finite element models are 1:1.5 scaled according to Cauchy Froude similitude law. The URM model has no experimental results but the purpose is to compare us performance level with the DLCW model. Results of the analysis were compared with experimental response and were evaluated according to ASCE/SEI 41-06 code.
Keywords: infill wall; nonlinear time history analysis; finite element; shake table
1. Introduction
Earthquake is the biggest natural challenge for Turkey and for many countries. There are three main faults that divide Turkey territory into parts. North and South are the most active faults when compared to the third one. North Anatolian Fault (NAF) is a long and active fault laid from east to west, passing close to Black sea region. East Anatolian Fault (EAF) starts from the point where NAF starts crossing the Mediterranean region as seen from Figure 1.

Fig. 1 Active fault map of Turkey (CSEM, EMCS) Recent earthquakes in Turkey very close to present day were the 2011 Simav and 2011 Van
earthquakes. The magnitude of the Simav earthquake was low compared with the Van earthquake, with only M5.8 (Yön et al. 2013). The biggest fatality was witnessed in Van with 607 people killed, 1301 people injured and 2307 multistory building collapsed (Kızılkanat et al. 2011, Sayın et al. 2014 and Yön et al. 2015). After this last earthquake, the performance of structures started to be evaluated not only with the main bearing elements, such as columns and beams, but also with external infills and partition walls. External infills and partition walls have a considerable contribution to the structural system, namely decreasing the interstory drift by 65% (Ersoy and Üzümcü, 1971). The ratio of h/l (height/length) and scale of the specimen were investigated, and it was emphasized that the scale of the specimen related to h/l ratio affects the stiffness up to 17% (Mehrabi et al, 1996). One of the studied also revealed that the out-of-plane capacity of infill walls was mostly related to the shear capacity of bed joint materials (Flaganan, 1999). Then, the collapse mechanism was investigated and the strength and in-plane behavior of infill wall were reported (Shing and Mehrabi, 2002). Symmetry and asymmetry of the openings were studied, being found that if a symmetric opening is located in the middle of the wall, then the peak and ultimate load decreases. Finally, it was found that openings can contribute for a more beneficial behavior like dissipating energy if they located close to columns (Kakaletsis and Karayannis, 2007).
One of the best ways to assess performance of structural systems in a realistic manner is shake table experiments. The contribution of concrete masonry was tested and compared in terms of ductility, energy dissipation capacity and interstory drift, using 1:3 reduced scale four-story specimens. The test results proved that the structural system with concrete masonry resisted, even if heavily damaged, a 0.95g strong ground motion. The specimen with brick infill wall collapsed at 0.84g. However, the structure with the brick infill wall dissipated more energy than the structure with concrete wall due to crushing of brick masonry (Liauw and Kwan, 1992). A shake table experiment was also implemented by prototype structures instead of full scale or reduced scale

complete structures. Infill wall effect was investigated by prototype structures and found that out-of-plane cracks and failure occurred near the columns and beams, as observed in real structures (Hashemi and Mosalam, 2006). The effect of interaction between a reinforced wall and a lightweight reinforced concrete frame was investigated by shake table experiment and also verified by numerical simulation. Both experimental and numeric results found that cracks were concentrated at the bottom part of the specimen. Moreover, the numerical simulation corroborated the in-plane action of the experiment (Ile et al., 2008). The effect of supplementary steel hysteric damping was investigated by shake table and allowed to observe that supplementary damping increased the global damping ratio up to 14% and the lateral demand capacity was increased between 33% and 50% (Toranzo et al., 2009). In-plane and out-of-plane actions were investigated together in a prototype structure with poor reinforcement detailing. For this purpose, 14 scaled historical ground motions were applied to the specimen. The obtained dynamic response, load resistance and failure mechanism were reported and demonstrated that in-plane action loosen the structure and then out-of-plane behavior triggered the failure mechanism (Stavridis et al., 2012).
It is believed that these experimental studies should be verified in terms of their reliability in light of the present studies, in order not to carry out always such time and money consuming experimental studies. Moreover, it is believed that seismic engineering software tools are more and more important to evaluate structural performance with nonlinear analysis methods (Krawlinker, 2006). Nonlinear time-history analysis was performed on a 56-story residential reinforced concrete structure to evaluate in terms of LS (Life Safety) and CP (Collapse Prevention) limits (Epackachi et al., 2010). The limit load assessment of two leaf cavity wall reinforced concrete structures was implemented by pushover analysis and it revealed that two leaf cavity wall reinforced concrete structure resisted 35% more load than a single leaf thickness infill wall reinforced concrete structure (Onat et al., 2015). Still, performance of double leaf cavity infill wall needs to be evaluated with nonlinear time history analysis, while considering the damping ratio, to assess performance with realistic material data on the basis of experimental shake table results. In this paper, nonlinear time history analysis was performed on two finite element models. These models are of the same geometry except for the infill wall thickness. DLCW (Double leaf cavity wall) is composed of 18 cm double layered infill wall while URM (Unreinforced masonry) model has 13 cm thickness single layer infill wall. Finite element model of these buildings were prepared with DIANA software. Then, nonlinear dynamic analyses were performed on both models. Classical Rayleigh damping was considered. Finally, displacements were compared with experimental results and interstory drifts were evaluated in terms of ASCE/SEI 41-06 (ASCE, 2007). 2. Description of the model The DLCW model was composed of two layers. The thickness of the exterior leaf is 9 cm, thickness of the interior leaf is 7 cm and there is 2 cm gap between these layers. The DLCW model can be seen in Fig. 2. The complete view of the tested structure can be seen in Figure 3.

a) Exterior leaf
b) Double leaf infill wall
Fig. 2 DLCW (Leite, 2014)
Fig. 3 Tested DLCW reinforced concrete structure (Leite, 2014) 2.1 Shake table experiment
The experimental program was only performed for the DLCW structure, while the URM model was analyzed after validation of the first structure and has no experimental results. Nonlinear time history analysis was performed on URM model to see the performance differences between DLCW and URM model. The DLCW structure was exposed to earthquake load in four steps and
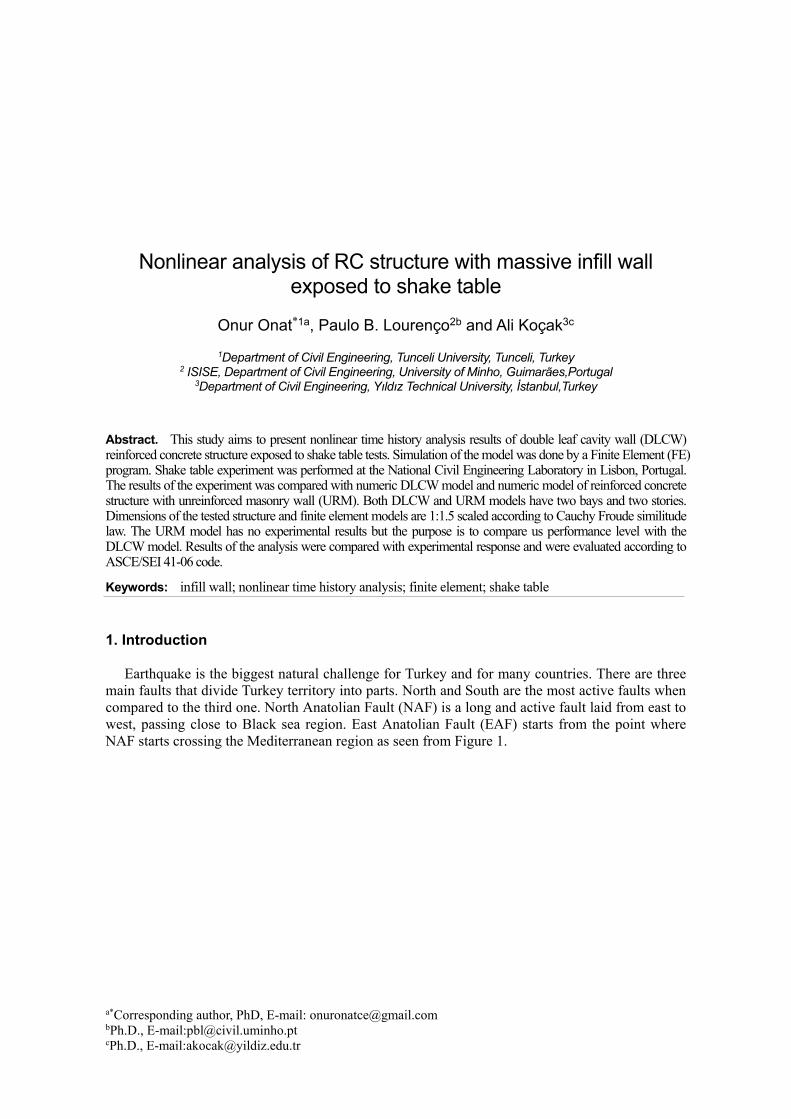
the summary of the artificial earthquake characteristics can be seen in Table 1. The response spectra of the four steps in both transversal and longitudinal direction can be seen in Figure 4.
Table 1 Summary of accelerations according to step numbers
Step Number Earthquake Percentage
(%)
Return Period (Years)
PGA (m/sn2)
Transversal Longitudinal
Step1 10 225 1.33 1.73
Step2 63 475 2.13 2.92
Step3 100 2475 7.25 10.27
Step4 150 1.5x2475 9.64 10.51
a)Transversal direction b)Longitudinal direction
Fig. 4 Design response spectra of four steps in both direction
The comparison level of this numerical test is the third step, which is the critical once as it corresponds to design. Probability of exceedance at this step is 10% in 50 years and the input accelerations can be seen in Figure 5. The total duration of the earthquake is 40 seconds (30 seconds for the intense phase). However, due to the destructive duration of the earthquake, time history analysis was only performed with first the first 34 seconds.
0
5
10
15
20
25
30
0 1 2 3 4
Acceleration (m/sn2)
Period (s)
EC8 Step1
EC8 Step2
EC8 Step3
EC8 Step4
0
5
10
15
20
25
30
0 1 2 3 4
Acceleration (m/sn2)
Period (s)
EC8 Step1
EC8 Step2
EC8 Step3
EC8 Step4

a) Input acceleration in transversal direction b) Input acceleration in longitudinal direction Fig. 5 Input acceleration of 100% earthquake that was used in experiments and time history analysis
2.2 Parameterization and adopted material models
Before the experimental work in the shake table, the materials used were characterized in the laboratory (Pereira, 2013) and the parameters found are tabulated in Table 2.
Table 2 Parameters of concrete and infill belong to both TLCW and URM models
Type of material
Elastic Modulus (MPa)
Compressive Strength (MPa)
Compressive fracture energy
(N/mm)
Tensile Strength (MPa)
Mode-I fracture energy
(N/mm) Concrete 30400 29.5 47.2 2.32 0.051
Infill 1800 1.26 2.0 0.20 0.013
Constitutive material models are needed for the numeric model, based on experimental observations. For this purpose, the Total Strain Fixed Crack model was used for reinforced concrete members and the Total Strain Rotating Crack model was used for infill wall (CEB-FIB, 2012). Interface elements were used around infill wall to simulate tensile crack, frictional slip and crushing of mortar between reinforced concrete frame and infill wall. For this purpose, the combined cracking-shear-crush model was used in these analyses (Lourenço and Rots, 1997). Note that while fixed crack models replicate well the behavior of reinforced concrete structures, they tend to provide over-stiff responses and excess of shear capacity in unreinforced structures. More complex material models are available for masonry, such as an orthotropic model (Lourenço et al., 1998), but they require a large amount of data, not available in many cases. In the present case, as the interface plays an important role, the adopted model for the masonry infill was kept reasonably simple, as isotropic (before cracking). The adopted material model for concrete and masonry describes compression and tensile
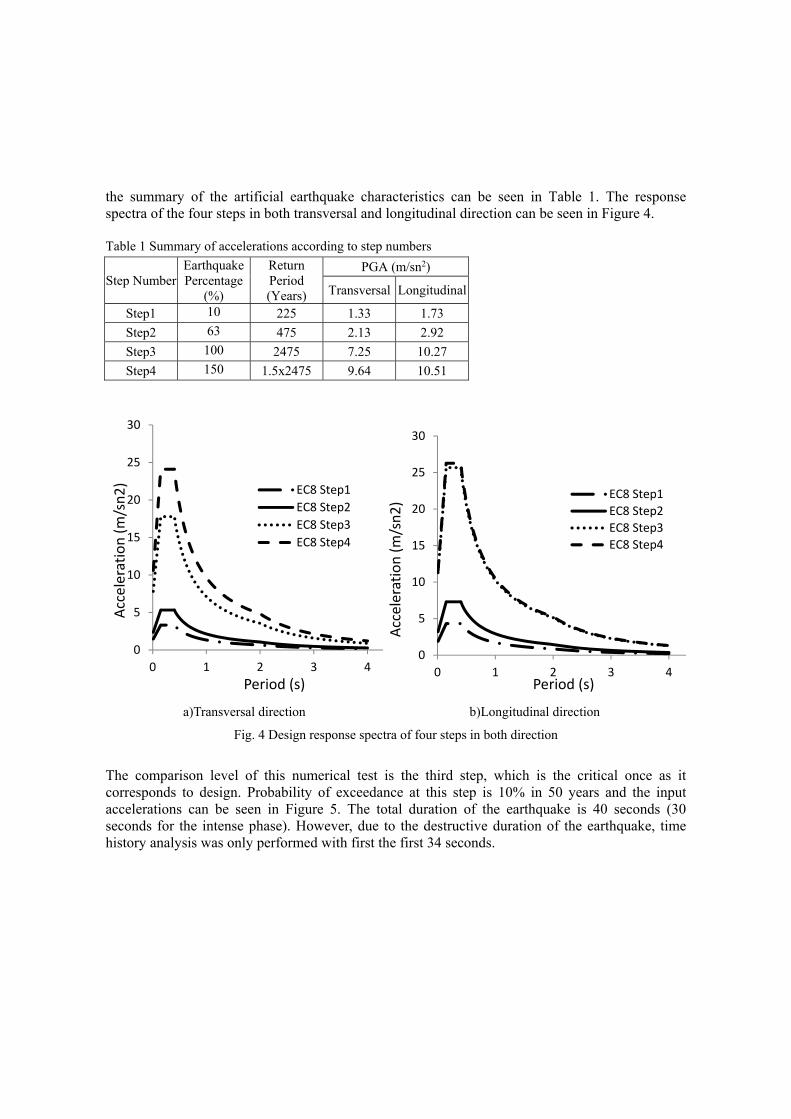
behavior of material with an adequate stress-strain relationship. This total strain material model was developed along the lines of the Modified Compression Field Theory (Vecchio and Collins, 1986), following a smeared approach for the fracture energy (Selby and Vecchio, 1993). The fundamental difference between the fixed and rotating concepts is the direction of principal stresses after the onset of cracking. Propagation of cracks is fixed to local coordinates in the first case, whereas propagation of cracks rotates according to the principal stresses axes in the second case. The interface model was formulated (Lourenço and Rots, 1997) for plane stress and then implemented in 3D model (Zijl, 2000). This interface model is based on multi-surface plasticity, including a Coulomb Friction model integrated with a tension cut-off and an elliptical compression cap to relate the interface traction to the interface shear , as shown in Fig. 6. Inelastic behavior occurs in all failure modes and is preceded by hardening in the case of the cap mode (Lourenço and Rots, 1997).
Fig. 6 Coulomb friction model combined with tension cut-off and cap mode (Lourenço and Rots, 1997)
The elastic normal and shear stiffness of interface elements was calculated by Eq. (1) and Eq. (2) below (Lourenço and Rots, 1997).
(1)
(2)
Here, and are the elastic modulus of masonry unit and mortar respectively. and are the shear modulus of masonry unit and mortar respectively, and is the thickness of the joint. Linear and nonlinear interface properties were calculated and adopted for the numerical model as shown in Table 3.

Table 3 Linear and nonlinear properties of interface element
Kn (N/mm3) Ks (N/mm3) Tensile Strength (MPa)
Mode-I Fracture Energy (N/mm)
Mode-II Fracture Energy (N/mm)
Friction data
c (cohesion)(MPa)
Ø (friction angle)
Ψ (dilatancy angle)
175 75 0.30 0.012 0.030 0.6 0.75 0.01
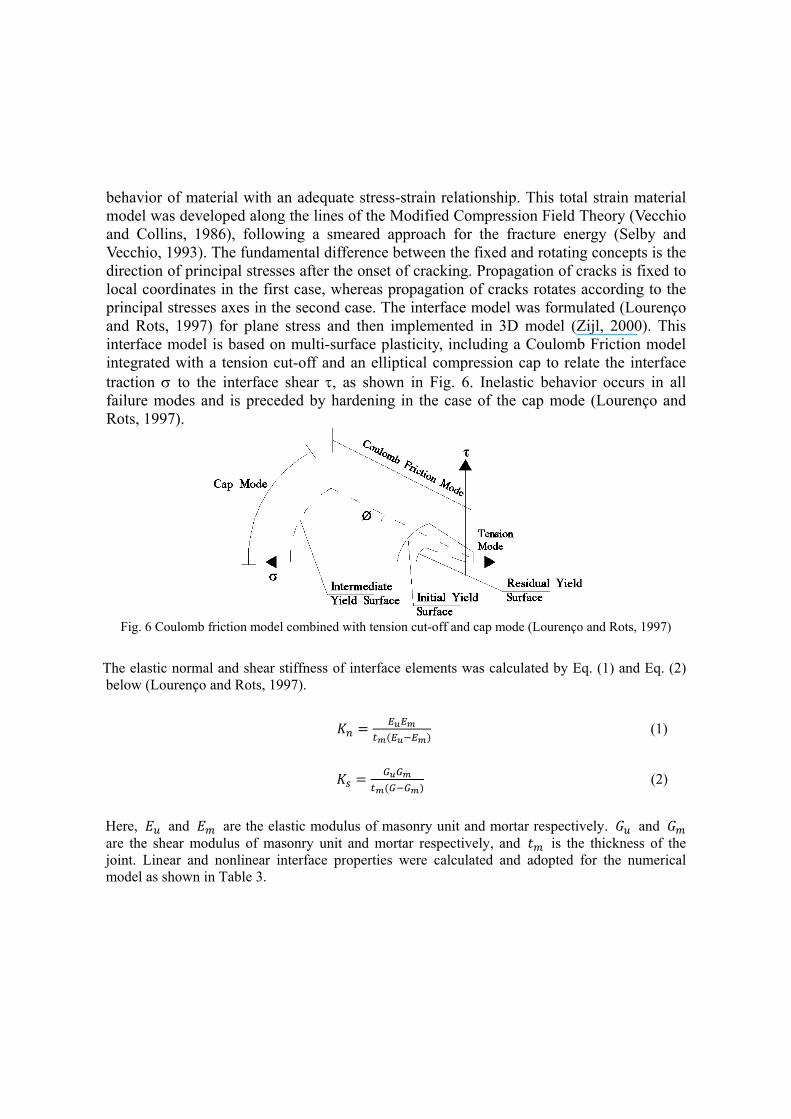
2.3 Description of the numeric model The numerical model was developed in DIANA 9.4.4 (TNO, 2012). The main bearing elements like beams and columns were modeled with three noded curved beam elements, called CL18B as seen in Fig. 7. Infill walls were modeled with layered eight noded curved shell elements called CQ40L, as seen in Fig. 8. Slabs were modeled with eight noded curved shell elements called CQ40S, as shown in Fig. 9. Finally, the interface, which is one of the most important parts of the model where significant inelastic phenomena occur, was modeled with three noded beam to shell interface elements called CL24I. The topology and displacements of interface element can be seen in Fig. 10. After building the model shown in Fig. 10, nonlinear analysis method was carried out.
Fig. 7 CL18B beam element used for beams and columns
Fig. 8 CQ40L layered curved shell elements for infill wall
Fig. 9 CQ40S three nodes curved shell elements for slabs
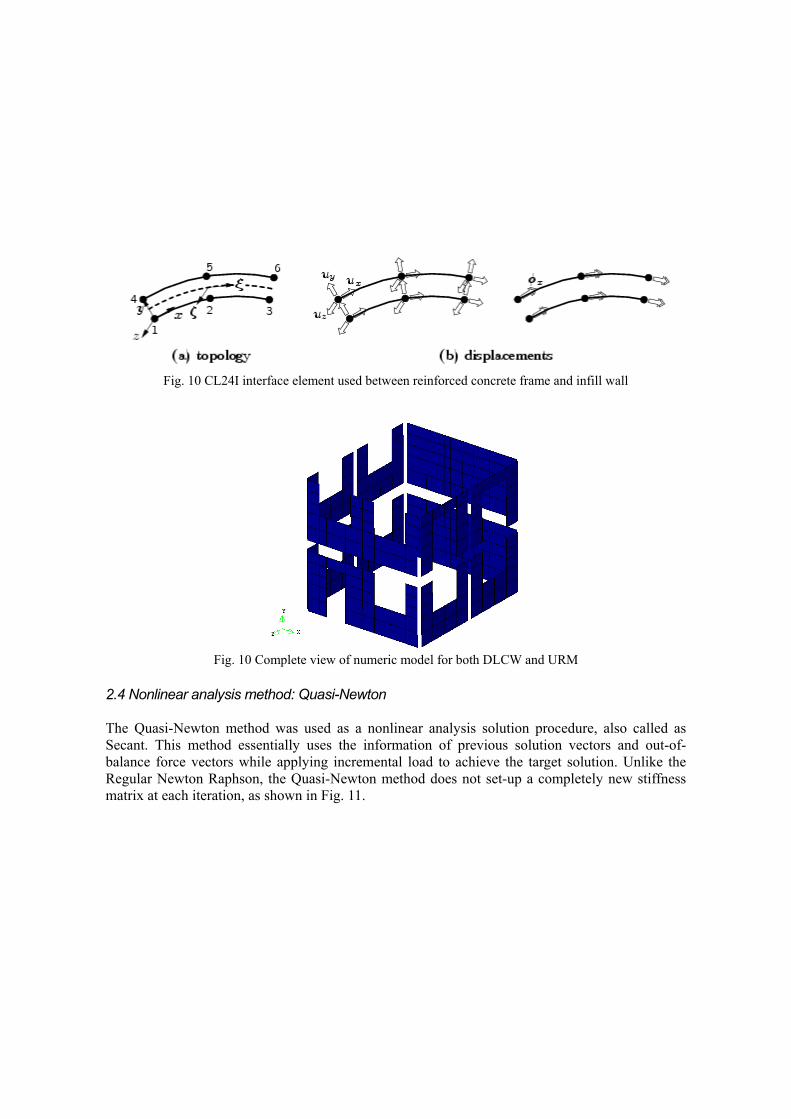
Fig. 10 CL24I interface element used between reinforced concrete frame and infill wall
Fig. 10 Complete view of numeric model for both DLCW and URM 2.4 Nonlinear analysis method: Quasi-Newton The Quasi-Newton method was used as a nonlinear analysis solution procedure, also called as Secant. This method essentially uses the information of previous solution vectors and out-of-balance force vectors while applying incremental load to achieve the target solution. Unlike the Regular Newton Raphson, the Quasi-Newton method does not set-up a completely new stiffness matrix at each iteration, as shown in Fig. 11.
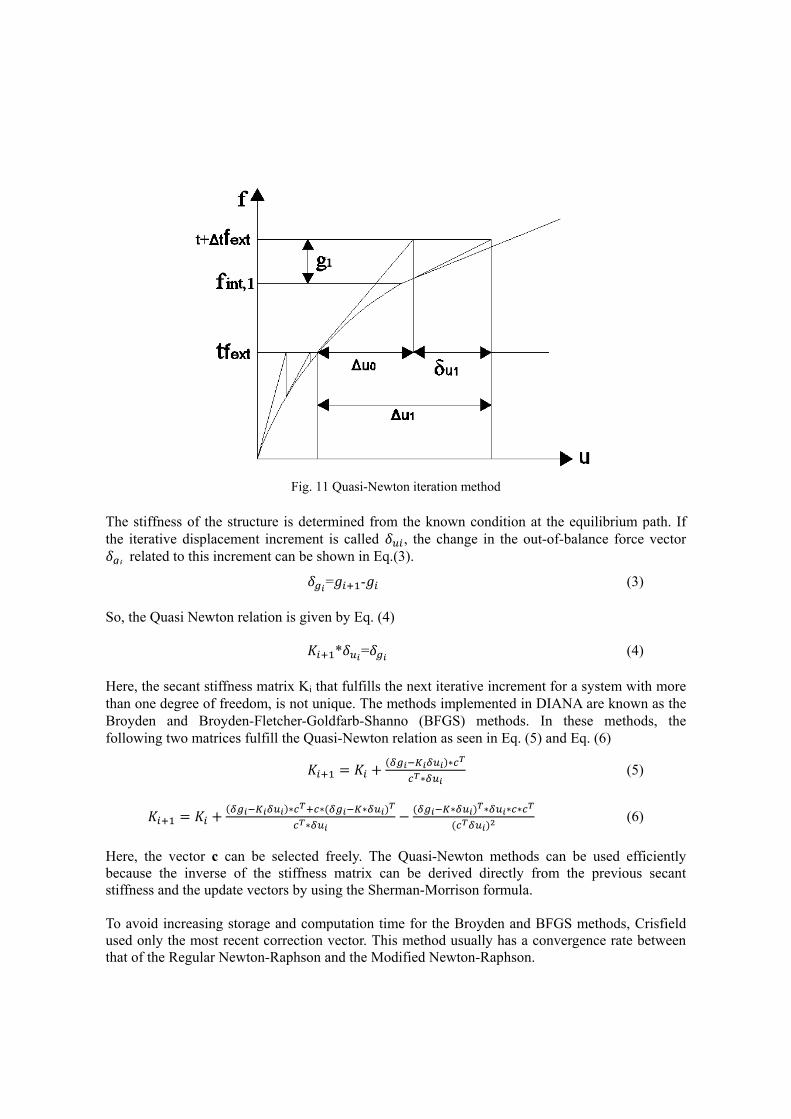
Fig. 11 Quasi-Newton iteration method
The stiffness of the structure is determined from the known condition at the equilibrium path. If the iterative displacement increment is called , the change in the out-of-balance force vector
related to this increment can be shown in Eq.(3).
= - (3)
So, the Quasi Newton relation is given by Eq. (4)
* = (4)
Here, the secant stiffness matrix Ki that fulfills the next iterative increment for a system with more than one degree of freedom, is not unique. The methods implemented in DIANA are known as the Broyden and Broyden-Fletcher-Goldfarb-Shanno (BFGS) methods. In these methods, the following two matrices fulfill the Quasi-Newton relation as seen in Eq. (5) and Eq. (6)
∗
∗ (5)
∗ ∗ ∗
∗
∗ ∗ ∗ ∗ (6)
Here, the vector c can be selected freely. The Quasi-Newton methods can be used efficiently because the inverse of the stiffness matrix can be derived directly from the previous secant stiffness and the update vectors by using the Sherman-Morrison formula. To avoid increasing storage and computation time for the Broyden and BFGS methods, Crisfield used only the most recent correction vector. This method usually has a convergence rate between that of the Regular Newton-Raphson and the Modified Newton-Raphson.

3. Analysis results Nonlinear time history analysis was carried out in four stages. As stated before, the most important and critical step is the third stage. The DLCW experimental prototype was heavily damaged and resisted all loads during the experiment, and then the structure collapsed at the beginning of stage 4. The analysis results were controlled in four points, located to corner of the structure, and the instrumentation can be seen in Fig. 12.
a)Instrumentation to measure displacement b)Control point of FE model corresponding to
instrumentation Fig. 12 Instrumentation on structure at laboratory to measure two way displacement
After time history analysis, experimental and numeric results of DLCW were tabulated in Table 4 for a comparison. As shown, generally there is a good correlation between experimental and numeric results in the first two stages. However, there is a perfect match between experimental and numeric results in stage 3. The response signal comparison can be seen in Figure 13, which presents the displacement comparison of experimental and numeric measurements along transversal direction. Fig. 14 shows the same comparison in the longitudinal direction. The time step of applied input signal is 0.002 second and the time step of FE model is 0.01 second.

Table 4 Comparison of experimental and numeric results of DLCW model according to node 95 and 255
Experimental (Transversal)
Numeric (Transversal)
Match (%)Experimental (Longitudinal)
Numeric (Longitudinal)
Match (%)
Stage1 Positive
2nd Floor 0.90 0.75 83.0 0.99 0.90 91.0
1st Floor 0.50 0.45 90.0 0.70 0.55 79.0
Stage1 Negative
2nd Floor -0.80 -0.68 85.0 -0.80 -0.82 97.5
1st Floor -0.58 -0.40 69.0 -0.69 -0.50 73.0
Stage2 Positive
2nd Floor 1.90 1.50 79.0 1.50 1.40 93.0
1st Floor 0.90 0.75 83.0 1.00 0.80 80.0
Stage2 Negative
2nd Floor -1.65 -1.35 82.0 -1.35 -1.20 89.0
1st Floor -1.05 -0.85 81.0 -1.20 -0.92 77.0
Stage3 Positive
2nd Floor 5.63 5.25 93.0 7.41 7.42 99.0
1st Floor 2.90 3.40 83.0 5.66 5.22 92.0
Stage3 Negative
2nd Floor -5.41 -5.50 98.0 -6.21 -6.67 93.0
1st Floor -3.63 -3.92 92.0 -4.52 -4.48 99.2
Fig. 13 Measured displacement from node number 95 along transversal direction at Stage 3

Fig. 14 Measured displacement from node number 255 along longitudinal direction at Stage 3
After these analyses in four stages, the experimental crack propagation is presented in Fig. 15. The damage is also compared with DLCW and URM models, as shown in Figure 16 at stage 3, which corresponds to 100% of the earthquake load. Black lines in Fig. 15 shows heavy damages and the major cracks that propagated at the end of stage 3 during the shake table experiment. The crack propagation and damage of numerical models can be seen in Fig. 16, for both DLCW and URM models.

a)North b)South
c)East d)West
Fig. 15 Experimental crack propagation at stage 3 corresponding to 100% of the earthquake load (Leite, 2014)
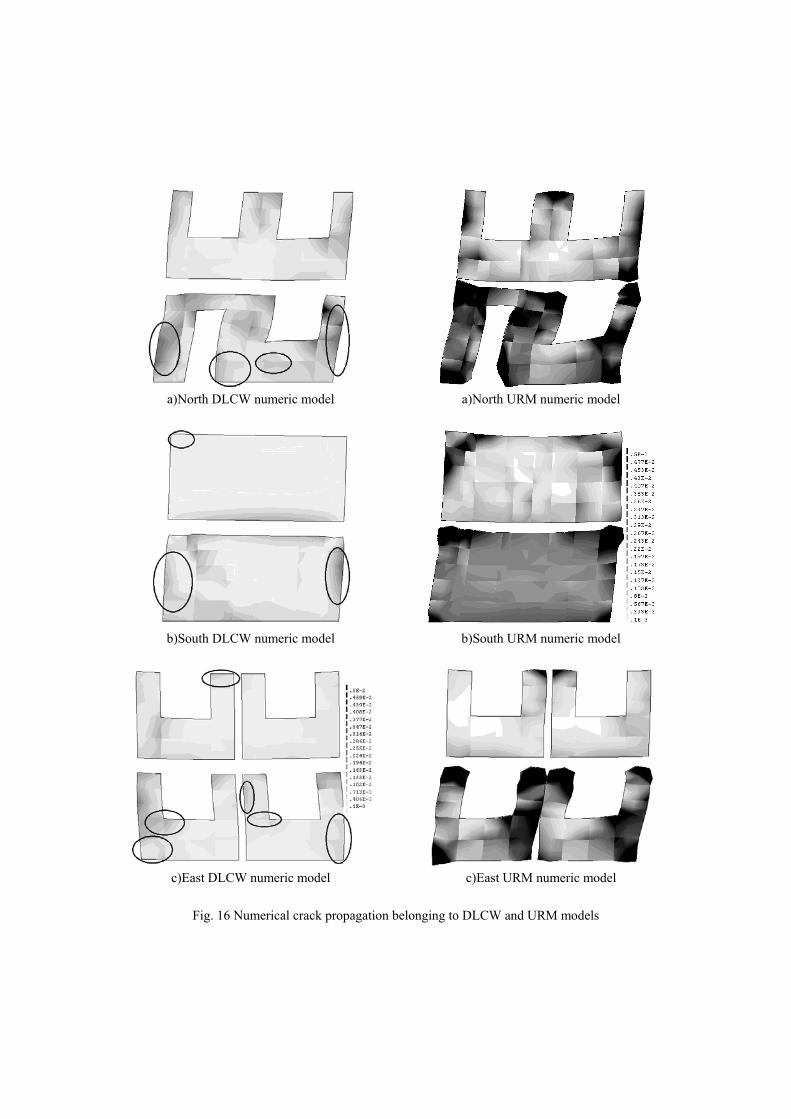
a)North DLCW numeric model a)North URM numeric model
b)South DLCW numeric model b)South URM numeric model
c)East DLCW numeric model c)East URM numeric model
Fig. 16 Numerical crack propagation belonging to DLCW and URM models

d)West DLCW numeric model d)West URM numeric model
Fig. 16 Continued As seen from Fig. 16, the differences between the two models in resisting the strong ground motion is clear from their crack propagation. To better understand the differences and to see the correlation between experimental and numeric results, the comparison of relative displacement is given in Fig. 17. Relative displacements are a strong evidence of the presence of higher displacements in URM model when compared to DLCW model and the experimental results. Finally, these displacements were evaluated according to ASCE/SEI 41-06 (ASCE, 2007) in terms of interstory drifts, as seen in Fig. 18.
a) Relative displacements in transversal direction b) Relative displacements in longitudinal direction
Fig. 17 Comparison of relative displacements at stage 3
0
2
4
‐20 ‐10 0 10 20
STOREY LEV
EL (m)
RELATIVE DISPLACEMENT (mm)
EXPERIMENTALFE DLCWFE URM
0
2
4
‐20 ‐10 0 10 20
STOREY LEV
EL (m)
RELATIVE DISPLACEMENT (mm)
EXPERIMENTAL
FE DLCW
FE URM

Fig. 18 Interstory drift in transversal direction In transversal direction, the first story drift of experimental model and DLCW numeric model are beyond the IO (Immediate Occupancy) level. The second story of experimental results also passed beyond the IO level, while the DLCW model was kept under the IO level. The first story of the URM model passed beyond LS (Life Safety( level. This means that this model could not exhibit sufficient performance to resist this type of load safely, meaning that it is unable to prevent economic and life loss for both side positive and negative. The evaluation of interstory drifts in the longitudinal direction can be seen in Fig. 19. In the longitudinal direction, the experimental results show that the first story of structure displaced more, so the interstory drift ratio of the structure passed beyond IO level and stand very close to Life LS level. The DLCW numeric model performance is similar to the experimental results in terms of drifts at first story. The second story interstory drift of DLCW finite element model is very close to IO level. However, the finite element URM model displaced more than the DLCW model as expected, and damage occurred after the analysis as seen from the crack patterns. The performance level of the finite element URM model at first story is very close to Collapse Prevention (CP) line. However, there are not so much differences between URM finite element model and the DLCW finite element model at first story. According to the interstory drift ratio, there is not any difference between first story and second story of experimental results of DLCW model. However, there is a relatively high difference between the first story and second story of finite element DLCW model. These differences are very clear in Fig. 18 and Fig. 19. The main reason of these differences is related to flexible foundation due to connection between foundation of tested specimen and shake table. This flexible foundation makes the structure sensitive to soft story failure.
0
2
4
‐0,80 ‐0,60 ‐0,40 ‐0,20 0,00 0,20 0,40 0,60 0,80
STOREY LEV
EL (m)
INTERSTOREY DRIFT (%)
EXPERIMENTAL
FE DLCW MODEL
FE URM MODEL
IO
LS
CP

Fig. 19 Interstory drift in longitudinal direction The performance of both structures in terms of base shear versus roof displacement can be seen in Fig. 20, until the end of Stage 3. As stated before, the experimental model collapsed at the beginning of the Stage 4. However, the accelerations from Stage 4 was applied to both finite element models to obtain the base shear and maximum roof displacement. Experimental DLCW model resisted a maximum of 217 kN lateral load in transversal direction and of 289 kN in lthe ongitudinal direction at Stage 3. However, at the same stage, the finite element DLCW model resisted a maximum of 280 kN lateral load in transversal direction and of 332 kN in longitudinal direction. On the other hand, the finite element URM model resisted a maximum of 261 kN in the transversal direction and of 240 kN in the longitudinal direction. The experimental DLCW model displaced 5.6 mm in transversal direction and 7.4 mm in longitudinal direction at Stage 3. Moreover, the finite element DLCW model displaced 5.5 mm in transversal direction and 7.4 mm in longitudinal direction. In addition, the finite element URM model displaced 11.6 mm in transversal direction and 11.0 mm in longitudinal direction. There is a good match between experimental and finite element DLCW models in terms of displacement. Match ratio between experimental and finite element models are 2.3% in transversal direction and 0.3% in longitudinal direction. According to Stage 4, the maximum base shear of DLCW model is 338 kN and 361 kN in transversal and longitudinal directions, respectively. Moreover, the maximum base shear of URM model are 300 kN and 310 kN in transversal and longitudinal direction, also respectively.
0
2
4
‐0,8 ‐0,6 ‐0,4 ‐0,2 0 0,2 0,4 0,6 0,8
STOREY LEV
EL (m)
INTERSTOREY DRIFT (%)
EXPERIMENTAL
FE DLCW MODEL
FE URM MODEL
IO
CP

Therefore, DLCW model carries 12.7% more load in transversal direction and 16.4 % in longitudinal direction respectively, when compared with URM model.
Fig. 20 Base shear comparison of two FE model
4. Conclusions
Two case studies of a reinforced concrete frame infilled with masonry involving numerical simulation were considered to predict experimental results. A DLCW (double leaf cavity wall in masonry) and a URM (single leaf unreinforced masonry) model was used for nonlinear time history analysis and then the results were evaluated under ASCE/SEI 41-06 code. The nonlinear time history analysis was performed in four stages for both two models. The conclusions of the paper can be listed below:
Quasi-Newton solution procedures were adopted on the numeric model and allowed to obtain adequate results. The Secant Crisfield types solution procedure was used to prevent increasing storage and to decrease computation time. The advantage of this method was 7% less time and 7% less space for calculation. The finite element DLCW model showed a good match with experimental results in terms of displacements and damage maps. In terms of displacements the match ratio between
0
50
100
150
200
250
300
350
400
0 5 10 15 20
Base Shear Force (KN)
Roof Displacement (mm)
DLCW Transversal
DLCW Longitudinal
URM Transversal
URM Longitudinal
EXP DLCW Trans
EXP DLCW Long

numerical and experimental results is 2.3% in transversal direction and 0.3% in longitudinal direction at Stage 3. The DLCW model resisted a stronger ground motion than the URM model. The DLCW model carries 12.7% more load than the URM model in the transversal direction and 16.4% more load than the URM model in the longitudinal direction. The DLCW model showed a brittle behavior but kept the structure stable at early stages. So the DLCW model displaced 44% less in the transversal direction and 50% less in the longitudinal direction, when compared with the URM model. However, the finite element DLCW structure resisted all strong ground motion successfully on the base of maximum displacement. The same ground motion could not be resisted by URM model until the end of earthquake. After a certain time series, the URM model collapsed with a heavy crack map and only the RC elements resisted strong ground motion. The ultimate experimental displacement is unknown due to unavailable experimental data belonging to stage 4. However, this data can be estimated according to the finite element DLCW model. DLCW model is a better application for earthquake prone territory, provided that the two leaves are well connected. The finite element prediction showed a good match, especially in stage 3, with an acceptable 4% average error in the longitudinal direction and 8.5% in the transversal direction under ideal boundary conditions. The first story of the models displaced significantly, which causes soft story collapse. The structure exposed to earthquake in the laboratory collapsed at the beginning of the stage 4, along the transversal direction as indicated by the first vibration mode. Collapse of the numeric model was the same as the tested model on shake table.
References American Society of Civil Engineers, (2007), Seismic Rehabilitation of Existing Building, ASCE/SEI 41-06 Comite Euro – International du Beton, (2012), “CEB-FIB Model Code 2010 - Final draft volume 1 Epackachi, S., Mirghaderi, R., Esmaili, O., Behbahani, A. A. T., Vahdani, S., (2012), “Seismic evaluation of
a 56-story residential reinforced concrete high-rise building based on nonlinear dynamic time history analysis”, The Structural Design of Tall and Special Buildings”, 21, 233-248
Flaganan, R. D., Bennett, R. M., (1999), “Bidirectional behavior of structural clay tile infilled frames”, Journal of Structural Engineering ASCE, 125(3), 236-244
Ersoy, U., Üzsoy, S., (1971), The Behavior and Strength of Infilled Frame, TUBITAK MAG-205 Technical Report, Ankara
Hashemi, A., Mosalam, K. M., (2006), “Shake table experiment on reinforced concrete structure containing masonry infill wall”, Earthquake Engineering and Structural Dynamics, 35, 1827-1852
http://www.emsc-csem.org/Earthquake/202/Earthquake-M7-2-Eastern-Turkey, CSEM, EMCS, 03.04.2015 Ile, N., Nguyen, X-H., Kotronis, P., Mazars, J., Reynouard, J. M., (2008), “Shaking table tests of light rc
walls: numeric simulations”, Journal of Earthquake Engineering, 12(6), 849-878 Mehrabi, A. B., Shing, P. B., Schuller, M. P., Noland, J. L., (1997), “Experimental evaluation of masonry-
infilled rc frames”, Journal of Structural Engineering ASCE, 118, 228-237 Ministry of Environment and Urbanism, (1996), “Turkey Earthquake Map” Shing, B., Mehrabi, A. B., (2002), “Behavior and analysis of masonry infilled frames”, Progress in

Structural Engineering and Materials, 4, 320-331 Kakaletsis, D., Karayannis, C., (2007), “Experimental investigation of infilled r/c frames with eccentric
openings”, Structural Engineering and Mechanics, 26(3), 231-250 Kızılkanat, A., Coşar, A., Koçak, A., Güney, D., Selçuk, M. E., Yıldırım, M., (2011), 23 October 2011 Van
Earthquake Technical Investigation Report, Yıldız Technical University Press Krawlinker, H., (2006), “Importance of good nonlinear analysis”, The Structural Design of Tall ans Special
Buildings”, 15, 515-531 Leite, J., (2014), “Design of masonry walls for building enclosures subjected to extreme actions”, PhD
Thesis, Minho University, Portugal Liauw, T. C., Kwan, A. K. H., (1992), “Experimental study of shear wall and infilled frame on shake table”,
Earthquake Engineering 10th World Conference, Balkema, Rotterdam Lourenço, P. B., Rots, J. G., (1997), “A multi-surface interface model for the analysis of masonry structures”,
Journal of Structural Engineering ASCE, 123(7), 660-668 Lourenço, P. B., Rots, J. G., Blaauwendraad, J., (1998), “Continuum model for masonry:parameter
estimation and validation”, Journal of Structural Engineering ASCE, 124(6), 642-652 Onat, O., Lourenço, P. B., Koçak, A., (2015), “Experimental and numerical analysis of RC structure with
two leaf cavity wall subjected to shake table”, Structural Engineering and Mechanics, 55(5), 1037-1053 Pereira, M. F. P., (2013), “Avalidaçao do desempenho das envolventes dos edificios face a acçao dos
sismos”, PhD Thesis, Minho University, Portugal Sayın, E., Yön, B., Calayır, Y., Gör, M., (2014), “Construction failures of masonry and adobe buildings
during the 2011 Van earthquakes in Turkey”, Structural Engineering and Mechanics, 51(3), 503-518 Selby, R. G., Vecchio, F. J., (1993), Three-dimensional constitutive relations for reinforced concrete”
Technical Report 93-02, University of Toronto, Department of Civil Engineering, Toronto, Canada TNO, (2012), Displacement method Analyser, User’s manual, Release 9.4.4, Netherlands Toranzo, L. A., Restrepo, J. I., Mander, J. B., Carr, A. J., (2009), “Shake table test of confined-masonry
rocking walls with supplementary hysteric damping”, Journal of Earthquake Engineering, 13, 882-898 Vechio, F. J., Collins, M. P., (1986), “The modified compression filed theory for reinforced concrete
elements subjected to shear”, ACI Journal, 83(22), 219-231 Yön, B., Sayın, E., Köksal, T. S., (2013), “Seismic response of the buildings during the May 19, 2011 Simav,
Turkey earthquake” Earthquakes and Structures, 5(3), 343-357 Yön, B., Sayın, E., Calayır, Y., Ulucan, Z. Ç., Karataş, M., Şahin, H., Alyamaç, K. E., Bildik, A. T., (2015),
“Lessons and learned from recent destructive Van, Turkey earthquakes”, Earthquake and Structures, 9(2), 431-453
Zijl, V. G. P. A. G., (2000), “Computational modeling of masonry creep and shrinkage”, PhD thesis, Delft University of Technology
View publication statsView publication stats