nonlinear dynamic analysis of rc frames using cyclic...
TRANSCRIPT

Structural Engineering and Mechanics, Vol. 17, No. 3-4 (2004) 357-378 357
Nonlinear dynamic analysis of RC frames using cyclic moment-curvature relation
Hyo-Gyoung Kwak†, Sun-Pil Kim‡ and Ji-Eun Kim‡
Department of Civil and Environmental Engineering, Korea Advanced Institute of Science and Technology, 373-1 Gusong-dong, Yuseong-gu, Daejeon 305-701, Korea
(Received January 17, 2003, Accepted November 17, 2003)
Abstract. Nonlinear dynamic analysis of a reinforced concrete (RC) frame under earthquake loading isperformed in this paper on the basis of a hysteretic moment-curvature relation. Unlike previous analyticalmoment-curvature relations which take into account the flexural deformation only with the perfect-bondassumption, by introducing an equivalent flexural stiffness, the proposed relation considers the rigid-body-motion due to anchorage slip at the fixed end, which accounts for more than 50% of the totaldeformation. The advantage of the proposed relation, compared with both the layered section approachand the multi-component model, may be the ease of its application to a complex structure composed ofmany elements and on the reduction in calculation time and memory space. Describing the structuralresponse more exactly becomes possible through the use of curved unloading and reloading branchesinferred from the stress-strain relation of steel and consideration of the pinching effect caused by axialforce. Finally, the applicability of the proposed model to the nonlinear dynamic analysis of RC structuresis established through correlation studies between analytical and experimental results.
Key words: RC frame; earthquake loading; anchorage slip; pinching effect; Bauschinger effect;moment-curvature relationship.
1. Introduction
Reinforced concrete (RC) frame structures in regions of high seismic risk generally experiencemany earthquakes, developing inelastic deformations when subjected to strong ones. Present seismicdesign recommendations (FEMA-273 1997, Seaoc 1999) also intend that structures respondelastically only to small magnitude earthquakes, but should be expected to experience differentdegrees of damage during moderate and strong ground motions. Accordingly, a complete assessmentof the seismic resistant design of RC frame structures often requires a nonlinear dynamic analysis.The nonlinear dynamic responses of RC frame structures under earthquake excitations are usuallydeveloped at certain critical regions, which are often located at points of maximum internal forcessuch as the beam-column joints. This means that an accurate numerical model able to simulate thehysteretic behavior of RC columns and beams is necessary in order to exactly predict the nonlinearresponse of the frame structures. Since earthquake-induced energy is dissipated through the
† Associate Professor‡ Graduate Student

358 Hyo-Gyoung Kwak, Sun-Pil Kim and Ji-Eun Kim
formation of plastic hinges in the beams and columns, the determination of influence factors thataffect to the nonlinear response at a joint is an essential step in the construction of a numericalmodel. Typically, initial stiffness, bond-slip, anchorage slip, shear span ratio, and axial force effectsare some of the influence factors that must be included in the numerical model because the majorsources of deformation in RC frame structures are the flexural rotation, shear deformation includingshear sliding, and the bond-slip. The hysteretic load-deformation behavior of a frame member arisesfrom a combination of these deformation mechanisms.
Many analytical models have been proposed to date for the nonlinear analysis of RC framestructures; these range from very refined and complex local models to simplified global models(D’Ambrisi and Filippou 1997, Kwak and Kim 2001, Taucer et al. 1991). In the case of framestructures, a numerical model based on the moment-curvature relation is often used. Since the firstintroduction of bilinear moment-curvature relationship by Clough and Johnson (1966), manymechanical models for the hysteretic moment-curvature relationship have been proposed to analyzethe behavior of RC beams subjected to cyclic loading. Such models include cyclic stiffnessdegradation (Chung et al. 1998, Dowell et al. 1998, Takeda et al. 1970). Also, further modificationsto take into account the pinching effect due to shear force and strength degradation after yielding ofsteel have been introduced (Roufaiel and Meyer 1987). In addition, by using the bilinear, instead ofa trilinear, hysteretic curve, a more simplified model has been proposed. Recently, the inclusion ofthe axial load effect has received the attention of many researchers (Assa and Nishiyama 1998,Watson and Park 1994). Nevertheless, these models still have limitations in simulating exactstructural behavior by excluding bond-slip and the Bauschinger effect.
In this paper, a curved hysteretic moment-curvature relationship is introduced. Unlike previouslyproposed models, bond slip effects are taken into account by defining the initial loading branch onthe basis of the monotonic moment-curvature relationship introduced in previous paper (Kwak andKim 2002). The following curved hysteretic unloading and reloading branches are defined; thefixed-end rotation at the beam-column joint interface and the pinching effect caused by the appliedshear force are also taken into consideration. The validity of the proposed model is established bycomparing the analytical predictions with results from experimental and previous analytical studies.A correlation study between analytical results and experimental values from an RC frame structuresubject to an earthquake loading testifies to the applicability of the introduced model to thenonlinear dynamic analysis of RC frame structures.
2. Proposed moment-curvature relation
The moment-curvature relation of a section is uniquely defined according to the dimensions of theconcrete section and the material properties of concrete and steel. Since the gradient of the moment-curvature relation represents the elastic bending stiffness EI, which includes all the section propertiesin a typical loading condition, using the moment-curvature relation instead of taking the layeredsection approach abbreviates the accompanying sophisticated calculations in the non-linear analysissuch as the determination of the neutral axis and the change of the elastic stiffness. This is why thenon-linear analysis of RC beams based on the moment-curvature relation is used in this study.
Under cyclic loading, the shape of the moment-curvature relation of RC sections is very muchgoverned by the shape of the cyclic stress-strain loop for the steel because the applied moment iscarried very largely by the steel reinforcement placed in a section after the first yield excursion. In

Nonlinear dynamic analysis of RC frames using cyclic moment-curvature relation 359
addition, the Bauschinger effect of the steel causes the moment-curvature relationships to be curvedafter the first yield excursion and follows the rounding and pinching in the moment-curvature loops.This implies that there will be less energy dissipation per cycle than in the generally assumedparallelogram of classical elastoplastic behavior (Clough and Johnston 1966, Takeda et al. 1970).
All of the hysteretic moment-curvature relations proposed to date are based on the assumption ofa perfect bond while defining an initial elastic loading branch. In addition, linear inelasticunloading-reloading branches have been assumed (Clough and Johnston 1966, Chung et al. 1998,Roufaiel and Meyer 1987, Spadea and Bencardino 1997). These assumptions, however, may lead toa greater difference in structural response as the deformation increases. Accordingly, to improve thestructural behavior of RC beams under cyclic loading and large deformations, the bond slip effectneed to be considered, and a curved idealization of the moment-curvature relation, introduced in thispaper by referring to the cyclic stress-strain curve of steel (Menegotto and Pinto 1973), takes intoaccount the bond-slip effect. The proposed model is presented in two steps: construction of themonotonic envelope curve and definition of subsequent hysteretic moment-curvature curves; themodel can be divided into four different regions as described below.
Region 1 (An initial elastic branch with stiffness EI00 in Fig. 1): This region characterizes elasticloading and unloading as long as the positive yield moment My or negative yielding moment −My isnot exceeded. Unlike the previously introduced hysteretic models(Chung et al. 1998, Clough andJohnston 1966, Roufaiel and Meyer 1987, Takeda et al. 1970), the bond-slip effect is already takeninto consideration while defining the initial stiffness EI00 in Fig. 1. Selection of an initial elasticbranch dominantly affects the structural behavior because it serves as an initial reference asymptotewhenever subsequent inelastic unloading or reloading begins (see subsequent asymptotes with EI00
in Fig. 1). If it is defined on the basis of the perfect bond assumption as well as the previousmodels, the stiffness degradation, gradually increased with the increase of deformation, cannot besimulated effectively. If a perfect bond is assumed, the stiffness of the initial unloading asymptotewill be greater than EI00, and it will be followed by stiffer subsequent unloading branches than thosedefined in Fig. 1. Especially at the beam-column joint where the structural response is dominantly
Fig. 1 Proposed moment-curvature relation in beam (Kwak and Kim 2002)

360 Hyo-Gyoung Kwak, Sun-Pil Kim and Ji-Eun Kim
affected by bond-slip, use of the elastic branch considering the bond-slip effect gives a more exactstructural response under cyclic loading. More details for the derivation procedure of the monotonicskeleton curve can be found in the previous paper (Kwak and Kim 2002).
Region 2 (curved region of point A to point B in Fig. 1): When unloading or reloading starts, themoment-curvature response of a section initiates with a very similar shape to the stress-strainrelation of steel; that trend continues during the closing of cracks because the structural behavior inthis region is dominantly affected by the amount of longitudinal tension and compressionreinforcement embedded. Consequently, this phenomenon makes it possible to define the moment-curvature relation by the following formula inferred from the hysteretic curve of steel (Pinto andGiuffre’ 1970), and its application is limited in the region from the moment reversal point (pointA(φr, Mr) in Fig. 1) to the crack closing moment (point B in Fig. 1) at which theunloading or reloading curve meets the initial elastic branch.
(1)
where
Eq. (1) represents a curved transition from a straight line asymptote with slope EI0i to anotherasymptote with slope EI1i (see Fig. 1) at the i-th load reversal after yielding of the RC section. EI0i
is the modified flexural stiffness of the initial elastic stiffness EI00, and the difference between EI0i
and EI00 represents a progressive stiffness reduction due to concrete cracking and local bonddeterioration of the concrete-steel interface. EI0i is somewhat smaller than EI00, and it graduallydecreases as deformation increases. The calculation of EI0i can be inferred from Fig. 1. EI1i is theslope of a straight line connecting the point D(φ0, M0), where the two asymptotes of curve (a) andthe initial reference asymptote with slope EI00 meet, and the point C(φmax, Mmax) where the lastcurvature reversal with moment of equal sign took place (see Fig. 1). Unlike the steel model wherethe hardening parameter has a fixed ratio (Menegotto and Pinto 1973, Pinto and Giuffre’1970), thehardening parameter p in Eq. (1) changes according to the loading history and is assumed to have aratio between slope EI0i and EI1i at the i-th load reversal because an already cracked section cannotsustain as many moments as an uncracked section due to the presence in the compression region ofopen cracks. The points D(φ0, M0) and A(φr, Mr) will be updated after each curvature reversal.
Two basic changes, compared to the previous straight line approximations, are implemented in thispaper: (1) use of the initial elastic branch considering the bond-slip effect; and (2) adoption of thecurved hysteretic loop on the range from the moment reversal point to the crack closing moment.The straight lines, which were defined as the unloading and reloading paths in the previous models,are utilized with the asymptotes in defining the curved hysteretic loop in this study.
Moreover, a critical issue in the curved hysteretic loop is the determination of parameter G inEq. (1), since it influences the shape of the transition curve even though the influence of the Gvalue may not be great in the structural behavior. The G value in Eq. (1), however, cannot bedetermined easily because the shape of the transition curve depends on many variables, i.e., theamount of compression and tensile steel and its relative ratio, the amount of effective strainhardening, the moment to shear ratio, shape of the cross section, etc. To solve this problem whilemaintaining the basic concept used in defining ξ, which represents the normalized plasticdeformation in the steel model, the layered section approach is adopted on the basis of the material
φn′ Mn′,( )
M* p φ*⋅ 1 p–( ) φ*⋅1 φ* G+( )
1 G⁄------------------------------+=
φ* φ φr–φ0 φr–----------------= M* M Mr–
M0 Mr–-------------------=,

Nonlinear dynamic analysis of RC frames using cyclic moment-curvature relation 361
models used (Menegotto and Pinto 1973, Taucer et al. 1991).When an RC section is subjected to monotonic or cyclic loading, the moment-curvature relation of
the section is uniquely defined according to the dimensions of the concrete section and the materialproperties of concrete and steel. If the curvature is increased in steps corresponding to the curvatureductility ratio (φ /φy) increments of one unit, the moment-curvature relation can be constructedthrough the layered section approach, as shown in Fig. 3(a). With an arbitrary assumed Gj value foreach ξj value, the moment corresponding to each curvature φi can be calculated from Eq. (1).Since the transition curve maintains a convex form due to the dominant influence of steel embeddedin a section and since its shape depends on the parameter Gj, the repeated assumptions of Gj by thebi-section method may be continued until the summation of differences between the moment by thelayered section approach, Mlayer, and that by Eq. (1), M*, satisfies the specified tolerance. In advance,a value Gj corresponding to ξj, which gives the minimum difference, can be finally determined onthe basis of a square root of the sum of the squares (SRSS). Fig. 2 represents a typical example forthe calculation of error norm.
Mi*
Fig. 2 Calculation of error
Fig. 3 Determination of G value

362 Hyo-Gyoung Kwak, Sun-Pil Kim and Ji-Eun Kim
After determining the values Gj that correspond to each ξj, the relation between G and ξ isconstructed by the nonlinear regression. Fig. 3 shows the analytically constructed moment-curvaturerelation, the variation of G according to the loading history for a typical section, and the obtainedregression curve of G(ξ ). The same G0 value used in the steel model is assumed.
During unloading and reloading from an inelastic, a significant reduction in stiffness occurs as thenumber of alternating loading cycles increases. Accordingly, neglecting loss of stiffness may lead toan over-estimation of the energy absorption capacity of the structure and also to a reduction of loadcarrying capacity of the structure. Most importantly, the constitutive model for the hystereticmoment-curvature curve proposed to date considers the stiffness degradation on the basis of theTakeda model (1970). The same rule is also taken into consideration in this paper (see Fig. 1).
Region 3 (linear region from point B to point C in Fig. 1): The second branch of the reloadingcurve describes the behavior after crack closure up to the second branch of the primary moment-curvature curve. Since the structural behavior in this region represents the proportional increment ofthe load carrying capacity, the moment-curvature curve is assumed with the following linear relation
(2)
where EI2i is the slope of straight-line connecting the points B and C(φmax, Mmax) at the i-thload reversal.
Region 4 (yielding region after the point C in Fig. 1): The second branch of the primary moment-curvature curve can be expressed as:
(3)
where EI10 is flexural stiffness of the monotonic envelope after yielding.
3. Modification of moment-curvature relation
3.1 Shear effect on moment-curvature relation
As is well known through experimental study (Fang et al. 1993, Ma et al. 1976, Popov et al.1972), for beams with a shorter span or with a higher nominal shearing stress, it takes fewer cyclesto reach failure and the recorded load-deflection hysteretic loops exhibit a progressive pinching ofloops due to shear deformations. This in turn leads to a reduction in the energy dissipation capacityof the beam. To reflect the pinching effect according to the shear span length into a hystereticmoment-curvature relation representing the bending behavior, Meyer et al. (1987) proposed amodification of the reloading branch on the basis of the empirical results (Ma et al. 1976, Popov et al.1972). Because of its simplicity in application and computational convenience, determination of thecharacteristic point B'(φp, Mp) on the original elastic loading curve, by which the new asymptotewith the bending stiffness is defined (see Fig. 4), follows the same criteria as those proposedby Meyer et al.
(4)
where αp = 0 for a/d < 1.5, αp = 0.4 ·a/d − 0.6 for 1.5 <a/d < 4.0, αp = 1 for a/dû 4.0, a = the shearspan length, d = the effective depth of a section, and Mn and φn are the moment and curvature at thepoint N(φn, Mn) in Fig. 4.
M EI2i φ⋅ Mmax EI2i φmax⋅–( )+=
φn′ Mn′,( )
M EI10 φ⋅ Mmax EI10 φmax⋅–( )+=
EI1ip
Mp αp Mn, φp αp φn⋅=⋅=

Nonlinear dynamic analysis of RC frames using cyclic moment-curvature relation 363
Namely, the pinching effect is taken into consideration in the hysteretic moment-curvature relationby using , the slope of asymptote connecting points D(φ0, M0) and B'(φp, Mp), instead of EI1i
used in Fig. 1. The hardening parameter p of the curved reloading branch is determined on the basisof the two straight line asymptotes with stiffness EI0i and (see Fig. 4).
3.2 Axial force effect on moment-curvature relation
When an RC beam section is subjected to axial load, no unique moment-curvature relation can beexpected because the axial load influences the curvature. As inferred from the P − M diagram of anRC section, the ultimate resisting moment M increases almost proportionally to the axial load Puntil the RC section reaches the balanced failure point in the P − M intersection diagram. However,it is evident that the ductility of the section is significantly reduced by the presence of the axialload. Because of the brittle behavior of an RC section at even moderate levels of axial compressiveload, to improve the ductility of the RC section, the ACI 318 (1995) recommends that the ends ofcolumns in ductile frames in earthquake areas must be confined by closely spaced transversereinforcement when the axial force is greater that 0.4 of the balanced load Pb.
In advance, as well known through the experimental studies (Low and Moehle 1987, Park et al.1972, Wight and Sozen 1975), the hysteretic moment-curvature relation of an RC section subjectedto axial load represents a marked pinching of loops because the axial force acts to close open cracksand cause a sudden increase in stiffness after crack closing. Consequently, ignoring the increase ofthe ultimate resisting moment and the pinching phenomenon in the RC beams subjected to the axialforce may lead to an incorrect structural response. However, as mentioned in previous experimentalstudies (Low and Moehle 1987, Park et al. 1972, Wight and Sozen 1975), the presence of an axialcompressive load slows the decay in strength and stiffness of RC beams with cycling and relievesthe pinching phenomenon by the shear force. Therefore, it may not be necessary to consider theaxial force effect simultaneously with the shear force effect while defining a hysteretic moment-curvature relation.
EI1ip
EI1ip
Fig. 4 Consideration of shear effect

364 Hyo-Gyoung Kwak, Sun-Pil Kim and Ji-Eun Kim
To reflect the axial force effect into a hysteretic moment-curvature relation, modifications of themonotonic skeleton curve and of the unloading and reloading branches are required. Firstly, themonotonic skeleton moment-curvature curve ( in Fig. 5) can be constructed by beam analysiswith an axial force in accordance with the proposed algorithm in the companion paper. If it isassumed that the line in Fig. 5 corresponds to the monotonic skeleton curve for the beamwithout an axial force in Fig. 1 and the line in Fig. 5 to the straight line asymptote inFig. 1, respectively, then the modified asymptote in Fig. 5 can be constructed on the basis ofthe energy equilibrium condition.
Since external work by axial force lower than the balanced load Pb can be ignored due to thenegligibly small axial deformation, the internal energy represented by the area within the hystereticloop must maintain a constant value regardless of the applied force. This implies that the area of thetriangle ∆DBF will be the same as that of the triangle ∆FMC in Fig. 5. Point B in Fig. 5 whichdefines the modified crack closing point, is finally determined through calculation of the constant kin Fig. 5. When the constant k is represented by , it can besimplified as the following equation from the area equality of two triangles (∆DBF = ∆FMC):
(5)
Moreover, the remaining procedures to define the curved reloading and unloading branches andthe following straight line branches are the same as those introduced in the proposed moment-curvature relation in Fig. 1. Finally proposed moment-curvature relation considering axial forceeffect can be seen in Fig. 6.
OEC
OIMDFM DC
DBC
k Mm Mc′–( ) Mmax Mm–( )⁄=
kMy Mmax–
M0
------------------------=
Fig. 5 Consideration of axial force effect

Nonlinear dynamic analysis of RC frames using cyclic moment-curvature relation 365
3.3 Consideration of fixed-end rotation
Unlike the critical region located in the vicinity of beam mid-span as well as the ends of long-span beams, the behavior of the critical region at the beam-column joint of relatively short-spanbeams may be greatly affected both by the shear and also by the details of anchoring the beamreinforcements. In particular, slippage of the main bars from the anchorage zone accompanies therotation of the beam fixed-end, θfe, which cannot be simulated with any mechanical model, and thisrigid body deformation may be increased as the deformation increases (see Fig. 7). Consequently, itsexclusion may lead to an over-estimation of the energy absorption capacity of the structure.Accordingly, to simulate the structural behavior more exactly, we need to take into account thefixed-end rotation because most of the structural behaviors under lateral loads are concentrated atthe beam-column joints with narrow width, especially in the case of slender multi-story buildings.
This range is called the plastic hinge length. Various empirical expressions have been proposed byinvestigators for the equivalent length of the plastic hinge length lp. Since the structure is modeledwith beam elements whose displacement field is defined by the average deformation of both endnodes, the ultimate capacity can be overestimated if the plastic hinge length is not preciously takeninto consideration. In this study, the relatively simple equation of lp = 0.25d + 0.075z, proposed bySawyer (1964), was used, where d and z are the effective depth of section and distance from thecritical section to the point of contraflexure, respectively. Since the plastic hinge length increases inproportion to the axial force, therefore, it may be difficult to estimate the plastic hinge length of anaxially loaded member by this simple equation only. Accordingly, the plastic hinge length of lp = xhproposed by Bayrak and Sheikh (1997) was established as an upper limit value for the plastic hingelength, where h is the section depth and x is the experimental parameter ranged from 0.9 to 1.0.
To account for the fixed-end rotation in the numerical analyses, it is common to reduce thestiffness, EI, in the moment-curvature relation for the elements located at the ends of beam with therange of the plastic hinge length lp (see Fig. 8(b) and Fig. 9). If a beam with the rotational stiffnesskθ at both ends is subjected to a horizontal force P, as shown in Fig. 8(a), the correspondinghorizontal drift ∆1 can be obtained.
Fig. 6 Proposed moment-curvature relation considering axial force effect

366 Hyo-Gyoung Kwak, Sun-Pil Kim and Ji-Eun Kim
(6)
where the first term means the contribution by the bending deformation of the beam and the secondterm by the end rotational stiffness kθ.
When the same force acts on a beam with the reduced stiffness EIeq at the both ends, as shown inFig. 8(b), the horizontal deflection ∆2 also can be calculated by the moment area method.
(7)
From the equality condition of , the equivalent stiffness EIeq can be determined by
(8)
Where ,
∆1PL3
12EI------------ PL2
2kθ---------+=
∆2P EIeqL2
3 2EILp 4Lp2 6LpL2 3L2
2+ +( )+( )12EIeqEI
------------------------------------------------------------------------------------------------=
∆1 ∆2≡
1EIeq
---------- 1β kθ L⋅ ⋅-------------------- 1
EI------+=
β α 1 2α– 4 3α2⁄+( )= α l p L⁄=
Fig. 7 Rigid body deformation at the beam-column joint
Fig. 8 Consideration of the equivalent stiffness
Nonlinear dynamic analysis of RC frames using cyclic moment-curvature relation 367
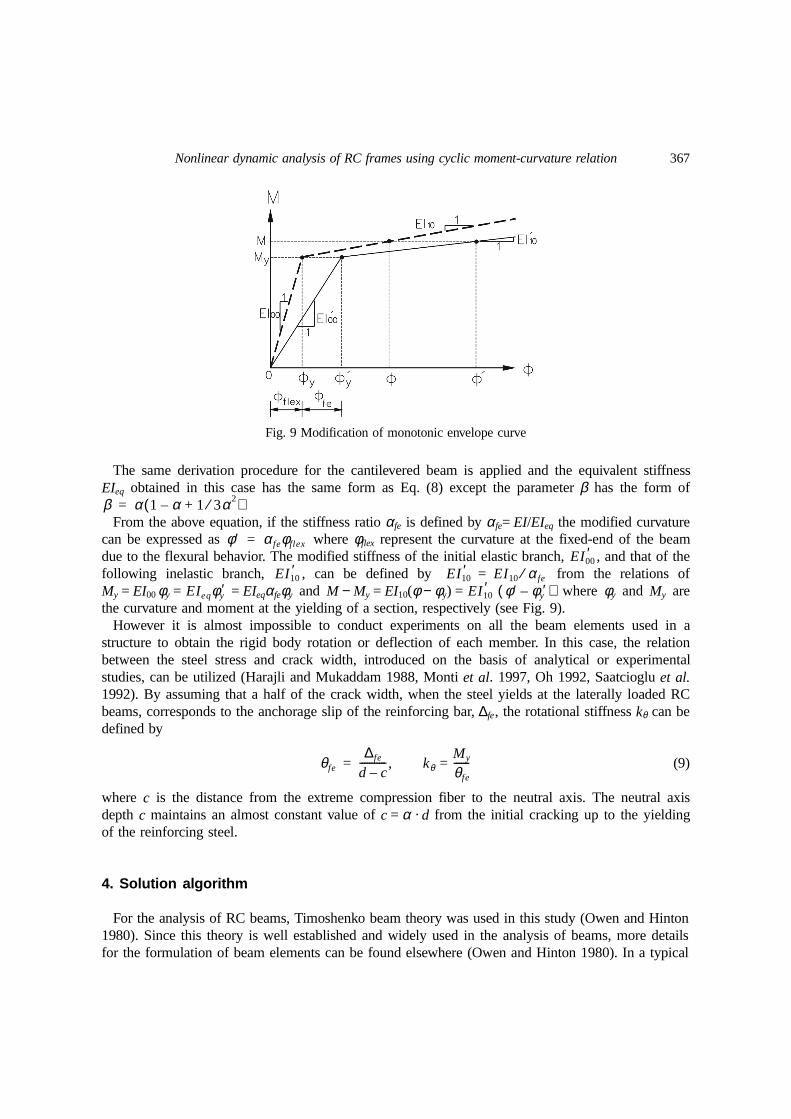
The same derivation procedure for the cantilevered beam is applied and the equivalent stiffnessEIeq obtained in this case has the same form as Eq. (8) except the parameter β has the form of
From the above equation, if the stiffness ratio αfe is defined by αfe= EI/EIeq the modified curvaturecan be expressed as where φflex represent the curvature at the fixed-end of the beamdue to the flexural behavior. The modified stiffness of the initial elastic branch, , and that of thefollowing inelastic branch, , can be defined by from the relations ofMy = EI00φy = = EIeqαfeφy and M − My = EI10(φ − φy) = where φy and My arethe curvature and moment at the yielding of a section, respectively (see Fig. 9).
However it is almost impossible to conduct experiments on all the beam elements used in astructure to obtain the rigid body rotation or deflection of each member. In this case, the relationbetween the steel stress and crack width, introduced on the basis of analytical or experimentalstudies, can be utilized (Harajli and Mukaddam 1988, Monti et al. 1997, Oh 1992, Saatcioglu et al.1992). By assuming that a half of the crack width, when the steel yields at the laterally loaded RCbeams, corresponds to the anchorage slip of the reinforcing bar, ∆fe, the rotational stiffness kθ can bedefined by
(9)
where c is the distance from the extreme compression fiber to the neutral axis. The neutral axisdepth c maintains an almost constant value of c = α · d from the initial cracking up to the yieldingof the reinforcing steel.
4. Solution algorithm
For the analysis of RC beams, Timoshenko beam theory was used in this study (Owen and Hinton1980). Since this theory is well established and widely used in the analysis of beams, more detailsfor the formulation of beam elements can be found elsewhere (Owen and Hinton 1980). In a typical
β α 1 α– 1 3α2⁄+( )=
φ′ αfeφflex=EI00
′EI10
′ EI10′ EI10 αfe⁄=
EIeqφy′ EI10′ φ′ φy′–( )
θfe
∆fe
d c–-----------, kθ
My
θfe
------==
Fig. 9 Modification of monotonic envelope curve

368 Hyo-Gyoung Kwak, Sun-Pil Kim and Ji-Eun Kim
Timoshenko beam, it is usual to assume that normal to the neutral axis before deformation remainsstraight but not necessarily normal to the neutral axis after deformation. In addition, the effects ofshear deformation are not taken into consideration in simulating nonlinear behavior since the normalbending stresses reach a maximum at the extreme fibers, where the transverse shear stresses are attheir lowest value, and reach a minimum at mid-depth of the beam, where the transverse shearstresses are highest. Thus, the interaction between transverse shear stresses and normal bendingstresses is relatively small and can be ignored. This means that the flexural rigidity EI is replaced bythat corresponding to the curvature calculated from the nodal displacements by φ = (θi − θj)/l ,whereas the shear rigidity of beam element GA is assumed to be unchanged, where θi and θj meanthe rotational deformations at the both end nodes, and l is the element length.
Since the global stiffness matrix of the structure depends on the displacement increments, thesolution of equilibrium equations is typically accomplished with an iterative method through theconvergence check. The nonlinear solution scheme selected in this study uses the tangent stiffnessmatrix at the beginning of each load step in combination with a constant stiffness matrix during thesubsequent correction phase; that is, the incremental-iterative method. All the remaining algorithmsfrom the construction of an element stiffness matrix to the iteration at each load step are the sameas those used in the classical nonlinear analysis of RC structures. More details can be foundelsewhere (Kwak and Filippou 1990, Kwak and Kim, S.P. 2001, Kwak and Kim, D.Y. 2001, Owenand Hinton 1980).
In this paper, only the dynamic equilibrium equation for a multi-degrees of freedom system isbriefly introduced. When a structure is subjected to ground acceleration , the incrementalequation of dynamic equilibrium can be written as
(10)
where ∆u, and are the incremental displacement, velocity, and acceleration vectors duringthe time step ∆t, respectively. M, C, and K are the mass, damping, and stiffness matrices,respectively. ∆P is the increment of external loads during the time step ∆t and is given by∆P = , where {1} is a unit vector. A lumped mass matrix M and Reyleigh dampingmatrix C are used in the analysis. The time history analysis of a structure is based on the averageacceleration method which is one of two special cases of Newmark’s method because it does notrequire iteration in solving Eq. (10). More details can be found in the reference (Chopra 1995).
5. Numerical applications
5.1 RC beams subject to cyclic loadings
In order to establish the applicability of the proposed hysteretic moment-curvature relation, twoRC beams are investigated and discussed. These beams are specimen 40.048 (COLUMN1)experimented on by Wight and Sozen (1975) and specimen 1 (COLUMN2) experimented on byLow and Moehle (1987). The material properties of each specimen are summarized in Table 1.
The first specimen 40.048 consists of a reinforced concrete cantilever beam with a span length of87.6 cm, which was subjected to cyclic concentrated lateral and axial loads at the free end (seeFig. 10). The plastic deformation is concentrated at the end of the beam with narrow width,
u··g
M u··∆ C u·∆ K u∆+ + P∆ M 1{ } u··g∆–= =
u·∆ u··∆
M 1{ } u··g∆–

Nonlinear dynamic analysis of RC frames using cyclic moment-curvature relation 369
accompanying fixed-end rotation that occurs in addition to elastic rotation at the large deformationstage. To simulate more exact structural behavior with the beam element formulated on the basis ofthe average deformation in an element, separate consideration of this region is required in the finiteelement modeling. The plastic hinge length, lp, is determined to be 20 cm, which is three timesgreater than the concrete cover. Accordingly, the specimen is modeled along the entire span with anelement of l = 10 cm.
As introduced by the load-deflection relations shown in Fig. 11, a direct application of the Takedamodel (1970), which was designed for a beam element without an axial load, leads to an incorrect
Table 1 Material properties used in application
SPECIMEN Ec
(kg/cm2)Es
(kg/cm2)fc
(kg/cm2)fy
(kg/cm2)ρ
(Ast/bd)ρ'
(Asc/bd)P
(kg)
COLUMN1 244643 2046625 266 5060 0.012 0.012 18160COLUMN2 310684 2046625 429 5060 0.010 0.010 4545
Fig. 10 Details of COLUMN1 (unit: cm)
Fig. 11 Load-deflection relation of COLUMN1

370 Hyo-Gyoung Kwak, Sun-Pil Kim and Ji-Eun Kim
structural response. This is because the classical hysteretic moment-curvature relations for the beamelement (Clough and Johnston 1966, Dowell et al. 1998, Roufaiel and Meyer 1987, Takeda et al.1970) do not take into account the increase of the ultimate resisting moment and the pinchingphenomenon due to the axial load. On the other hand, the proposed model effectively estimates theultimate resisting capacity and simulates the pinching phenomenon even at the large deformationstage (see Fig. 11(b)). Accordingly, more exact prediction of structural response for RC columnsand/or prestressed concrete beams subjected to an axial force requires the consideration of the axialforce effect.
The second specimen (COLUMN2) is selected to show the effects of bond-slip and fixed-endrotation on the structural response. The geometry and cross section dimensions are presented in Fig. 12,and this example structure is modeled along the entire span with an element of l = 5 cm fromconsideration of the plastic hinge length.
This structure was analyzed by Filippou et al. (1991) on the basis of the layered section approach,and Fig. 13(a) shows the obtained load-deflection relation. Unlike the Takeda model (1970), thenumerical results by Filippou et al. also simulate the ultimate resisting capacity effectively becausethe axial force effect is included in their formulation by considering the axial force equilibriumcondition on a section. However, the layered section approach represents slightly stiffer structuralbehavior than the experimental data. This difference seems to be caused by ignoring the bond-slipeffect and fixed-end rotation. Since the layered section approach is based on equilibrium andcompatibility conditions between each imaginary layer, the bond-slip effect cannot be taken account,and unrealistic stiffer structural behavior deepens as the deformation increases, followingoverestimation of the energy absorbing capacity of a structure. In particular, the stiffness degradationis generally accompanied by a decrease of shear stiffness as the deformations increase. However, thelayered section approach has a limitation in simulating this phenomenon because it is based on thebending behavior.
On the other hand, as shown in Fig. 13(b), the proposed model effectively simulates the stiffnessdegradation and pinching phenomenon due to the application of axial load. This result seems toarise from the fact that the bond-slip effect and fixed-end rotation have already been included duringconstruction of the monotonic skeleton curve of the moment-curvature relation (see Fig. 1). Morecomparison of analytical results with experimental studies for RC beam members can be foundelsewhere (Kwak and Kim 1998, 2002).
Fig. 12 Details of COLUMN2 (unit: cm)

Nonlinear dynamic analysis of RC frames using cyclic moment-curvature relation 371
5.2 RC frame structure subject to dynamic loading
The ability of the introduced model in describing the dynamic response of RC frame structures isassessed by correlation study between analytical and experimental results. The RC frame structure isspecimen RCF2, which has been tested on the shaking table by Clough and Gidwani (1976). Asshown in Fig. 14, this structure is a two-story, one-bay RC frame subject to a simulated strong basemotion and is a 0.7 scale model of a two-story office building representative of common design andconstruction practice. The concrete blocks were added on every floor to take into account theinfluence by the floor mass and self-weight when a base acceleration acts, and the N69W Taftrecord from the Arvin-Tahachapi earthquake of July 1952, scaled to peak acceleration of 0.57 g andreferred to as W2 (see Fig. 15), was used.
Fig. 13 Load-deflection relation of COLUMN2
Fig. 14 Idealization of RCF2 Fig. 15 N69W Taft Record W2, Scaled to 0.57 g

372 Hyo-Gyoung Kwak, Sun-Pil Kim and Ji-Eun Kim
Since the response of this frame structure is dominantly affected by flexural and anchorage slip ofreinforcing bar but strength degradation due to shear deformations is expected to be small, theinfluence of the anchorage slip on the nonlinear response of RC frame structure can effectively beinvestigated through this example structure. The nonlinear responses of RC columns seem to bemore remarkable in this example structure than with most building structures because smallerbending stiffness EI are assigned to columns (see Table 2). The geometry and reinforcing details ofthe test frame as well as the arrangement of the shaking table and the conduct of the test aredescribed in detail in Reference (Clough and Gidwani 1976). Also, the section properties mentionedby Dámbrisi and Filippou (1997) are used for the correlation study in this paper. The values ofsection properties for each member can be found in Table 2. The axial force effect is taken intoconsideration in these values. According to the equation proposed by Saywer (1964), the plastichinge length lp is determined to be 20 cm. Therefore, the end regions of each member are modeledwith an element of l = 5 cm, and the other regions at each member are equally idealized by using 10elements.
The time history response of the example structure, obtained by using the Takeda model in whichthe linear inelastic unloading-reloading branches have been assumed, are compared withexperimental data in Fig. 16 and Fig. 17 because this linear model is popularly used in the timehistory analyses (Takeda et al. 1970). First, as shown in Fig. 16 representing the time histories forthe bottom and top floor displacement, a little difference between experimental and analytical resultsis observed. In particular, in spite of the quite satisfactory agreement in the maximum displacementvalues, a slight phase shift at the initial stage results in a noticeable discrepancy between theexperimental and analytical results in the last stage of the response time history. This phenomenonseems to be caused by the overestimation of the structural stiffness. Because the bond-slip effect isnot taken into account in the Takeda model, the bending stiffness EI at the unloading, reloading, andloading phases is overestimated, and this accompanies the underestimation of deformations and adecrease in the response period in the analytical results as the time history continues.
In advance, as mentioned in the previous example structure COLUMN1, a direct application ofthe Takeda model leads to an incorrect structural response because the axial force effect is notconsidered. Correlations of story shear between analytical results by Takeda model in Fig. 17 andexperimental data in Fig. 18 also show that the Takeda model slightly underestimates the ultimateresisting capacity of columns located at bottom and top story and pinching phenomenon is noteffectively simulated. This result indirectly explains why the classical hysteretic moment-curvaturerelations designed for the beam element can not be used without any modification in the analysis ofa beam subjected to a relatively large axial load.
Table 2 Section properties used in RCF2
Member Story My+
(103 kg · cm)EI+
(106 kg · cm2)My
−
(103 kg · cm)EI−
(106 kg · cm2)
GirderBottom 267 4480 829 4480
Top 236 3476 737 3477
ColumnBottom 239 1141 239 1141
Top 223 1463 223 1463

Nonlinear dynamic analysis of RC frames using cyclic moment-curvature relation 373
Fig. 16 Correlation of displacement response using Takeda model
Fig. 17 Relation between story shear and story drift by Takeda model
Fig. 18 Relation between story shear and story drift by experiment

374 Hyo-Gyoung Kwak, Sun-Pil Kim and Ji-Eun Kim
The numerical results obtained on the basis of a hysteretic moment-curvature relation with themonotonic skeleton curve constructed by considering the axial force effect (see Fig. 5) are shown inFig. 19. Still, a noticeable discrepancy between experimental and analytical results remains in thisfigure in spite of consideration of the axial force effect. This difference can be attributed to aninaccurate consideration or exclusion of the anchorage slip concentrically occurred at the end regionof each member. Fig. 19 also shows that the overestimation of the stiffness induced by ignoring theanchorage slip causes a slight phase shift at the initial loading stage results but leads to aremarkable decrease in the structural displacement as the loading stage continues while representingan increasing discrepancy between the experimental and analytical results. Therefore, the quitesatisfactory correlation between experiment and analysis can not be expected without consideringthe anchorage slip effect.
As mentioned in Eq. (8), determination of the equivalent stiffness EIeq with consideration of theanchorage slip effect requires the calculation of the end rational stiffness kθ. Therefore, the valuekθ = 57.6 × 10⁶ kg · cm as determined by Dámbrisb and Fillippou (1997) on the basis of thenumerical simulation is also adopted in this paper. As mentioned before, however, the end rotationalstiffness kθ can not be usually defined as an unique value prior to the numerical simulation, and it isalso impossible to conduct experiments for all the members in a structure to obtain the rigid bodyrotation. In this case, the analytical approach introduced in Eq. (9) can be used. The plastic hingelength and the equivalent stiffness mentioned in Eq. (8) are lp = 20 cm and EIeq = 639 × 106 kg · cm2,respectively, in this example structure.
Fig. 20 and Fig. 21 show the final numerical results, which represent very good agreement withexperimental results. Comparison of these figures with Fig. 19 and Fig. 17 indirectly illustrates whythe previous numerical models may have some difficulties in the modeling of beam-column jointsand why the fixed-end rotation and the pinching effect due to the applied axial must be taken intoconsideration to obtain a more realistic simulation of the structural behavior. If the anchorage-slipeffect is not considered, larger differences from the experimental data are expected in the dynamicloading case than in the cyclic loading and/or monotonic loading cases since the slopes of the initialelastic branch and subsequent inelastic unloading-reloading curves in a hysteretic moment-curvature
Fig. 19 Correlation of displacement response ignoring the anchorage slip effect

Nonlinear dynamic analysis of RC frames using cyclic moment-curvature relation 375
relation are overestimated. This overestimation may cause a rapid decrease in the structural responseas the loading stage increases and also may give a different collapse condition from the experimentwhen a structure with multi-degrees of freedom is subjected to a severe dynamic loading.
Careful investigation of the obtained numerical results in Fig. 20 and Fig. 21 yields the followingobservations: (1) The maximum response value for the bottom story displacement is increased bymore than 30% as the anchorage slip effect is taken into account; (2) In general, very satisfactoryagreement between experimental and analytical results is observed for the displacement timehistories through the entire time range. Nevertheless, a slight discrepancy still exists in the last stageof the response time history. This result seems to be caused by the fact that a gradual stiffnessdegradation, even at the same loading condition, is induced in the experiment after the yielding ofreinforcing bar due to an increase of crack opening and anchorage slip; (3) The story shears inFig. 21 reveal that most nonlinear responses and damages to the example structure are concentrated
Fig. 20 Correlation of displacement response considering the anchorage slip effect
Fig. 21 Relation between story shear and story drift by the introduced model

376 Hyo-Gyoung Kwak, Sun-Pil Kim and Ji-Eun Kim
at the bottom-story columns, while the top-story columns suffer little damage. The characteristicpinching of the hysteretic relation, caused by the axial force effect and the anchorage slip, seems tobe evident in Fig. 21(a). Moreover, this figure indirectly explains the importance of considering theplastic hinge region in a member, where decrease of the bending stiffness are concentrated; (4)Finally, these figures confirm that the numerical model introduced in this paper can effectively beapplied to the nonlinear dynamic analysis of RC frame structures.
6. Conclusions
This paper concentrates on the introduction of a moment-curvature relation of an RC section thatcan simulate the cyclic behavior of RC beams. Unlike most mathematical or mechanical modelsfound in the literature, the proposed model has taken into account the bond-slip effect, theBauschinger effect of the steel, axial force effect, and fixed-end rotation at the fixed end of a beam.A modification of the proposed moment-curvature relation has also been introduced to take intoaccount the stiffness degradation and pinching effect on the basis of the Meyer model (1987) in thecase of shear dominant structures. A modification of the hysteretic moment curvature relation toconsider an increase of the ultimate resisting capacity and the pinching phenomenon in the axiallyloaded RC beams is also introduced on the basis of the energy conservation. The application of theproposed model extends to an RC frame structure subject to dynamic loading. However, in spite ofmany numerical and mechanical models considering the strength degradation (Chung et al. 1998,Dowell et al. 1998, Takeda et al. 1970) and axial hysteretic behavior (Cheng 2001), these effect arenot included in the proposed model. An additional concern for the strength degradation under cyclicloading beyond the yield strength may be required to estimate the exact damage level undergone bya section after a certain number of cycles. The system identification (SI) method may be applied toconstruct a strength degradation model that can give a more rational damage assessment.Furthermore, since vertical ground motion can cause columns in tension and compression, relationbetween axial and transverse hysteretic behavior can be considered in order to achieve acomprehensive response behavior.
Through correlation studies between analytical results and experimental values from typical RCbeam and frame tests, the following conclusions are obtained: (1) The inclusion of pinching effect isimportant in structures dominantly affected by shear; (2) to accurately predict the structural behaviorof the beam to column subassemblage where the nonlinear response is concentrated, a modificationof the moment-curvature relation to consider the fixed end rotation due to anchorage slip is stronglyrequired; (3) to effectively simulate axially loaded RC beams, the axial load effect must beconsidered; and, finally, (4) the proposed model can be effectively used to predict the structuralresponse under cyclic loading, and its application can effectively be extended to the dynamicanalysis of a frame structure.
Acknowledgements
The research presented in this paper was sponsored by the Smart Infra-Structure TechnologyCenter. Their support is greatly appreciated.

Nonlinear dynamic analysis of RC frames using cyclic moment-curvature relation 377
References
ACI 318 (1995), Building Code Requirements for Structural Concrete.Assa, B. and Nishiyama, M. (1998), “Prediction of load-displacement curve of high-strength concrete columns
under simulated seismic loading”, ACI Structural Journal, 95(5), 547-557.Bayrak, O. and Sheikh, S.A. (1997), “High-strength concrete columns under simulated earthquake loading”, ACI
Structural Journal, 94(6), 708-722.Cheng, F.Y. (2001) “Cheng-Lou axial hysteresis model for RC columns and wall”, Matrix Analysis of Structural
Dynamics-Application and Earthquake Engineering, Marcel Dekker, Incs., New York, 967-977.Chopra, A.K. (1995), Dynamics of Structures: Theory and Applications to Earthquake Engineering, Prentice
Hall, Englewood Cliffs, New Jersey.Chung, Y.S., Meyer, C. and Shinozuka, M. (1998), “Modeling of concrete damage”, ACI Structural Journal,
86(3), 259-271.Clough, R.W. and Johnston, S.B. (1966), “Effect of stiffness degradation on earthquake ductility requirements”,
Proc. of Japan Earthquake Engineering Symposium, October.Clough, R.W. and Gidwani, J. (1976), “Reinforced concrete frame 2: Seismic testing and analytical correlation”,
Earthquake Engrg. Research Center Report No. EERC 76-15, Univ. of California, Berkeley, Calif.D’Ambrisi, A. and Filippou, F.C. (1997), “Correlation studies on an RC frame shaking-table specimen”, Earthq.
Eng. Struct. Dyn., 26, 1021-1040.Dowell, R.K., Seible, F. and Wilson, E.L. (1998), “Pivot hysteresis model for reinforced concrete members”, ACI
Structural Journal, 95(5), 607-617.Fang, I.K., Yen, S.T., Wang, C.S. and Hong, K.L. (1993), “Cyclic behavior of moderately deep HSC beam”, J.
Struct. Eng., ASCE, 119(9), 2537-2592.FEMA-273 (1997), FEMA, NEHRP Guidelines for the Seismic Rehabilitation of Buildings, Federal Emergency
Management Agency, Washington, D.C.Harajli, M.H. and Mukaddam, M.A. (1988), “Slip of steel bars in concrete joints under cyclic loading”, J.
Struct. Eng., ASCE, 114(9), 2017-2039.Kwak, H.G. and Filippou, F.C. (1990), “Finite element analysis of reinforced concrete structures under
monotonic loads”, Report No. UCB/SEMM-90/14, Structural Engineering Mechanics and Materials, Universityof California, Berkeley.
Kwak, H.G. and Kim, J.E. (1998), “Material nonlinear analysis of RC beams based on moment-curvaturerelations”, Journal of the Computational Structural Engineering Institute of Korea, 11(4), 233-245.
Kwak, H.G. and Kim, S.P. (2001), “Bond-slip behavior under monotonic uniaxial loads”, Eng. Struct., 23(3),298-309.
Kwak, H.G. and Kim, S.P. (2002), “Nonlinear analysis of RC beams based on moment-curvature relation”,Comput. Struct., 80, 615-628.
Kwak, H.G. and Kim, D.Y. (2001), “Nonlinear analysis of RC shear walls considering tension-stiffening effect”,Comput. Struct., 79(5), 499-517.
Low, S.S. and Moehle, J.P. (1987), “Experimental study of reinforced concrete columns subjected to multi-axialcyclic loading”, Earthquake Engrg. Research Center Report No. EERC 87-14, Univ. of California, Berkeley,Calif.
Ma, S.M., Bertero, V.V. and Popov, E.P. (1976), “Experimental and analytical studies on the hysteretic behaviorof reinforced concrete rectangular and T-beam”, Earthquake Engrg. Research Center Report No. EERC 76-2,Univ. of California, Berkeley, Calif.
Menegotto, M. and Pinto, P.E. (1973), “Method of analysis for cyclically loaded reinforced concrete plane frameincluding changes in geometry and nonelastic behavior of elements under combined normal force andbending”, Proceedings of IABSE Symposium on “Resistance and ultimate Deformability of Structures Actedon by Well Defined Repeated Loads”, Lisbon.
Mo, Y.L. (1994), “Dynamic behavior of concrete structures”, Developments in Civil Engineering, 44.Monti, G., Filippou, F.C. and Spacone, E. (1997), “Analysis of hysteretic behavior of anchored reinforcing bars”,
ACI Structural Journal, 94(2), 248-261.

378 Hyo-Gyoung Kwak, Sun-Pil Kim and Ji-Eun Kim
Oh, B.H. (1992), “Flexural analysis of reinforced concrete beams containing steel fibers”, J. Struct. Eng., ASCE,118(10), 2821-2836.
Owen, D.R.J. and Hinton, E. (1980), Finite Elements in Plasticity, Pineridge Press Limited.Park, R., Kent, D.C. and Sampton, R.A. (1972), “Reinforced concrete members with cyclic loading”, J. of the
Struct. Div., ASCE, 98(7), 1341-1360.Pinto, P.E. and Giuffre’, A. (1970), “Comportamento del cemento armato per sollecitazioni cicliche di forte
intensita”, Giornale del Genio Civile, 5.Popov, E.P., Bertero, V.V. and Krawinkler, H. (1972), “Cyclic behavior of three reinforced concrete flexural
members with high shear”, Earthquake Engrg. Research Center Report No. EERC 72-5, Univ. of California,Berkeley, Calif.
Roufaiel, M.S.L. and Meyer, C. (1987), “Analytical modeling of hysteretic behavior of reinforced concreteframe”, J. Struct. Eng., 113(3), 429-444.
Saatcioglu, M., Alsiwat, J.M. and Ozcebe, G. (1992), “Hysteretic behavior of anchorage slip in RC members”, J.Struct. Eng., ASCE, 118(9), 2439-2458.
Sawyer, H.A. (1964), “Design of concrete frames for two failure states”, Proc. of the Int. Sym. on the FlexuralMechanics of Reinforced Concrete, ASCE-ACI, Miami, November, 405-431.
Seaoc (1999), Tentative Guidelines for Performance Based Seismic Engineering, SEAOC Blue Book, StructuralEngineers Association of California.
Spadea, G. and Bencardino, F. (1997), “Behavior of fiber-reinforced concrete beams under cyclic loading”, J.Struct. Eng., ASCE, 123(5), 660-668.
Takeda, T., Sozen, M.A. and Nielsen, N.N. (1970), “Reinforced concrete response to simulated earthquake”, J. ofthe Struct. Div., ASCE, 96(12).
Taucer, T., Spacone, E. and Filippou, F.C. (1991), “A fiber beam-column element for seismic response analysisof reinforced concrete structures”, Earthquake Engrg. Research Center Report No. EERC 91-17, Univ. ofCalifornia, Berkeley, Calif.
Watson, S. and Park, R. (1994), “Simulated seismic load tests on reinforced concrete column”, J. Struct. Eng.,ASCE, 120(6), 1825-1849.
Wight, J.K. and Sozen, M.A. (1975), “Strength decay of RC columns under shear reversals”, J. of the Struct.Div., ASCE, 101(5), 1053-1065.