nonlinear pharmacokinetics prepared by, jahanvi h. patel roll no:09mph103 dept: pharmaceutical...
TRANSCRIPT

Nonlinear Pharmacokinetics
Prepared By,Jahanvi H. Patel Roll No:09MPH103Dept: Pharmaceutical Technology & Biopharmaceutics
Guided By:Dhaivat C. Parikh

Non linear pharmacokinetics:
• In some cases, the kinetics of a pharmacokinetic process change from predominantly first order to predominantly zero order with increasing dose or chronic medication.
• A mixture of both first order and zero order kinetics is called as mixed order kinetics. Also known as nonlinear kinetics or dose dependent kinetics.
• Eg. vitamin C, naproxen, riboflavin.• The kinetics of such capacity limited processes can
be described by the Michaelis-Menten kinetics.

Linear Pharmacokinetics Non Linear Pharmacokinetics
Pharmacokinetic parameters for a drug would not change with change in dose
Pharmacokinetic parameters for a drug can change with change in dose.
Dose Independent Dose dependent
First Order kinetics Also called as Mixed order, Saturated kinetics, capacity limited
All semilog plots of C vs t for diff. doses are superimposable.
Not superimposable

Examples of Drugs Showing Nonlinear Kinetics
Cause Drug
GI Absorption
Absorption is carrier mediated.
Riboflavin, gebapentin, L-dopa, baclofen, ceftibuten
Drugs with low solubility in GI but relatively high dose
Chorothiazide, griseofulvin, danazol
Presystemic hepatic metabolism attains saturation
Propranolol
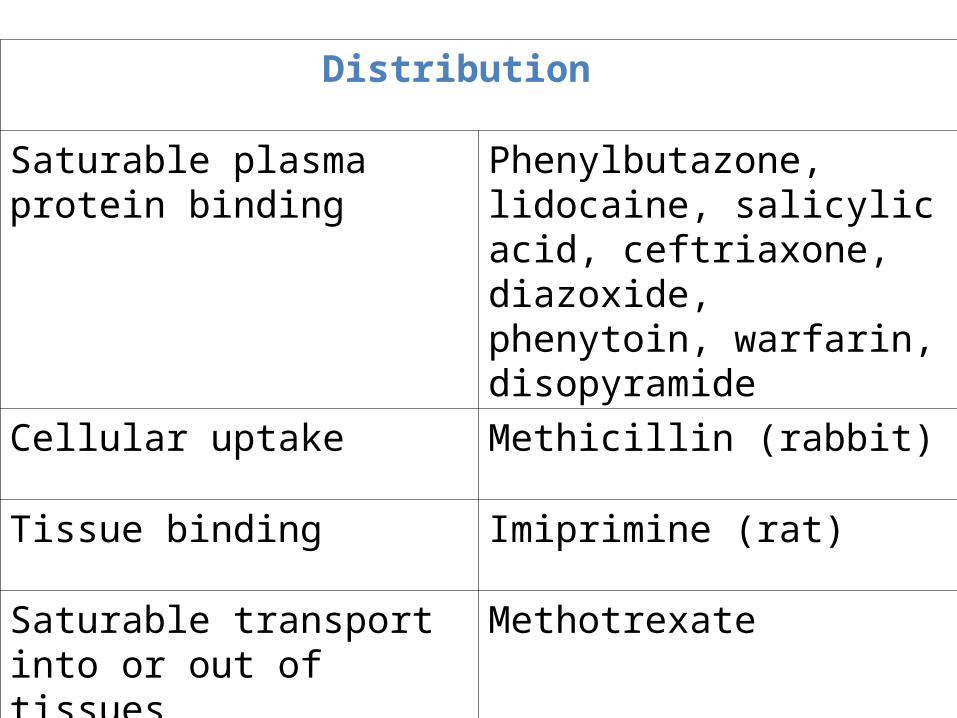
Distribution
Saturable plasma protein binding
Phenylbutazone, lidocaine, salicylic acid, ceftriaxone, diazoxide, phenytoin, warfarin, disopyramide
Cellular uptake Methicillin (rabbit)
Tissue binding Imiprimine (rat)
Saturable transport into or out of tissues
Methotrexate
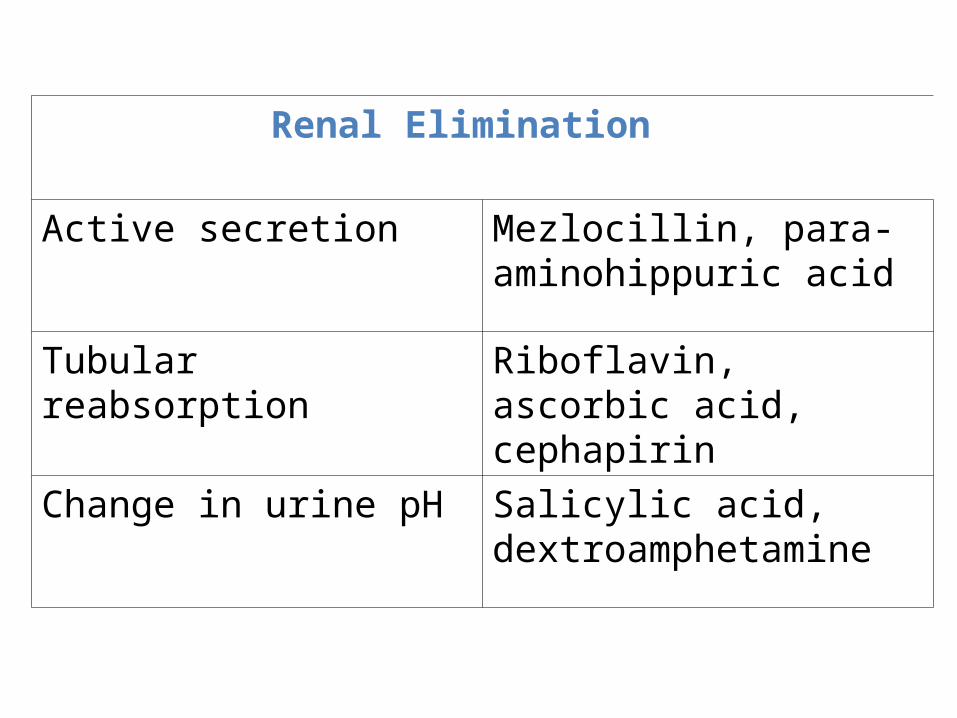
Renal Elimination
Active secretion Mezlocillin, para-aminohippuric acid
Tubular reabsorption Riboflavin, ascorbic acid, cephapirin
Change in urine pH Salicylic acid, dextroamphetamine
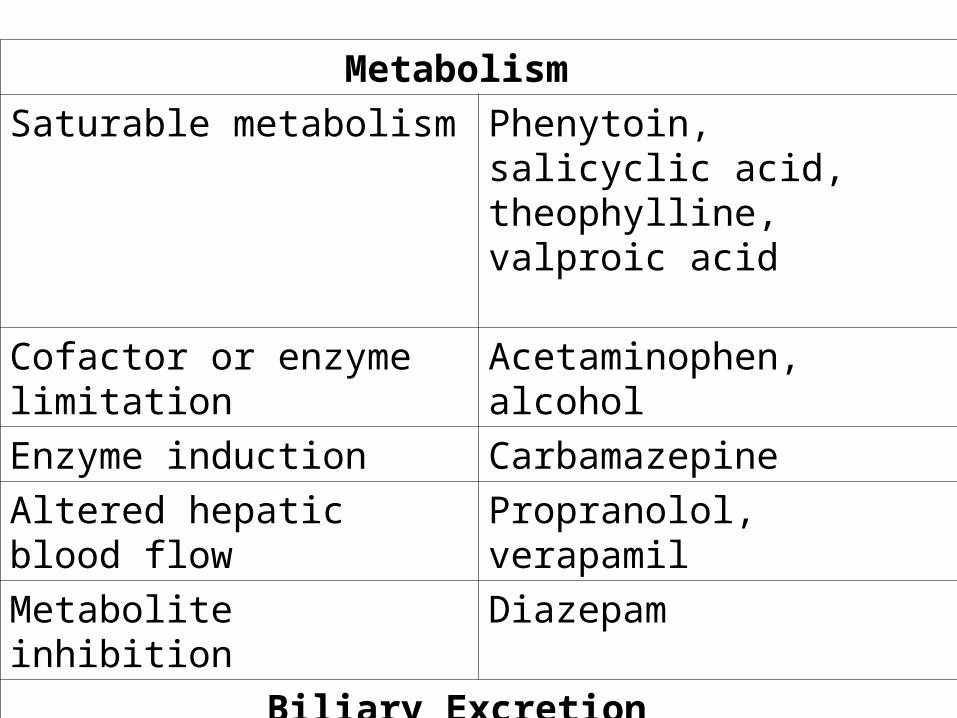
Metabolism Saturable metabolism Phenytoin, salicyclic acid,
theophylline, valproic acid
Cofactor or enzyme limitation Acetaminophen, alcohol
Enzyme induction Carbamazepine
Altered hepatic blood flow Propranolol, verapamil
Metabolite inhibition Diazepam
Biliary Excretion Biliary secretion Iodipamide,
sulfobromophthalein sodium
Enterohepatic recycling Cimetidine, isotretinoin
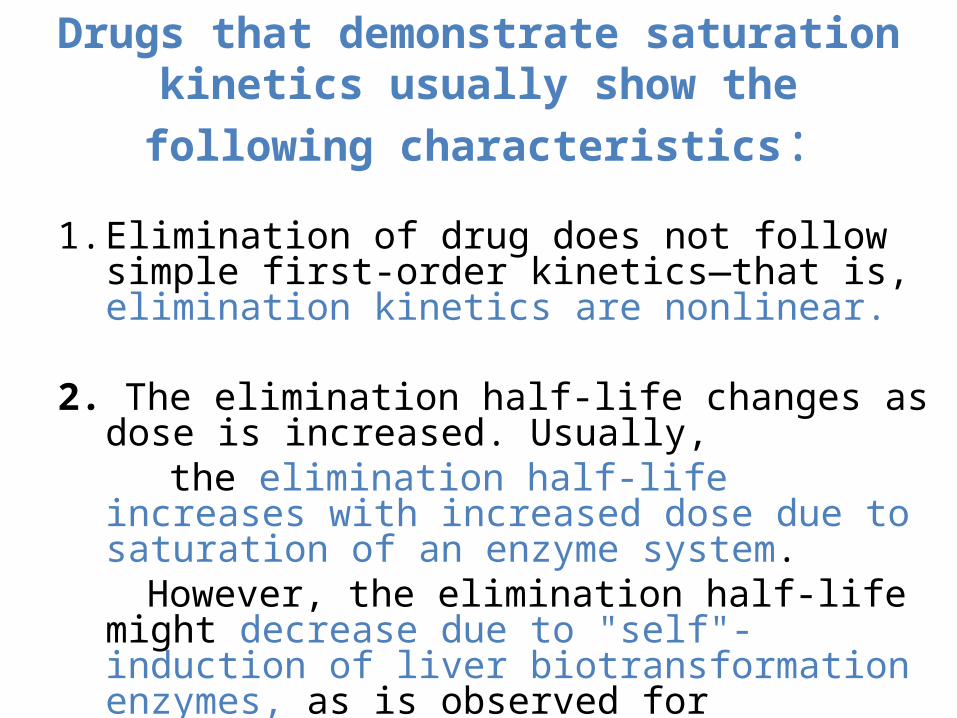
Drugs that demonstrate saturation kinetics usually show
the following characteristics:
1. Elimination of drug does not follow simple first-order kinetics—that is, elimination kinetics are nonlinear.
2. The elimination half-life changes as dose is increased. Usually,
the elimination half-life increases with increased dose due to saturation of an enzyme system.
However, the elimination half-life might decrease due to "self"-induction of liver biotransformation enzymes, as is observed for carbamazepine.

3. The area under the curve (AUC) is not proportional to the amount of bioavailable drug.
4. The saturation of capacity-limited processes may
be affected by other drugs that require the same enzyme or carrier-mediated system
(ie,competition effects).
5. The composition and/or ratio of the metabolites of a drug may be affected by a change in the dose.
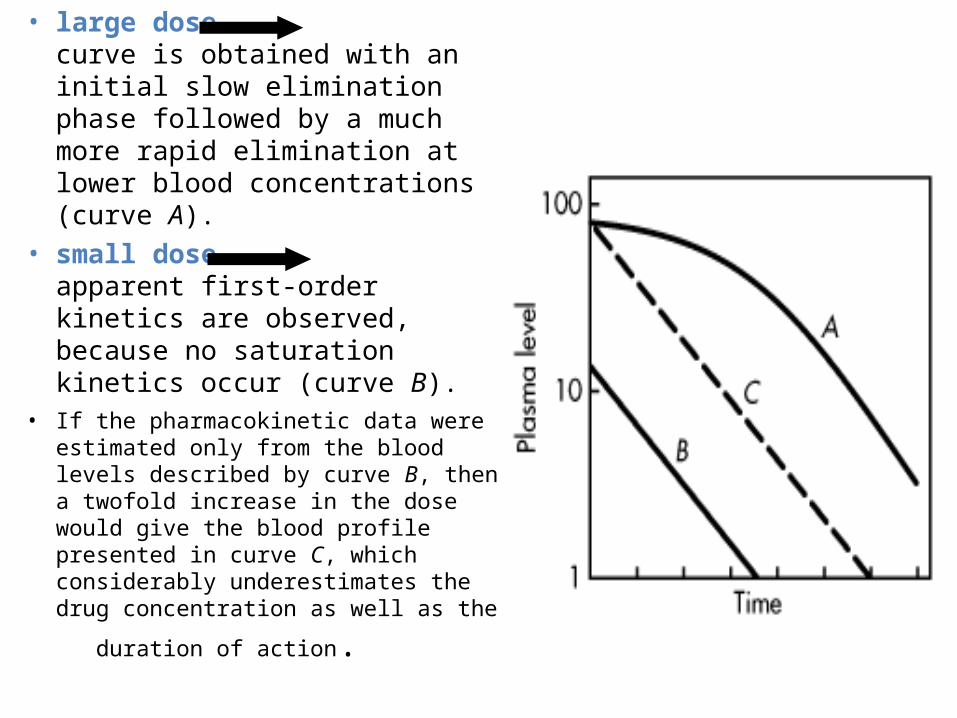
• large dose curve is obtained with an initial slow elimination phase followed by a much more rapid elimination at lower blood concentrations (curve A).
• small dose apparent first-order kinetics are observed, because no saturation kinetics occur (curve B).
• If the pharmacokinetic data were estimated only from the blood levels described by curve B, then a twofold increase in the dose would give the blood profile presented in curve C, which considerably underestimates the drug concentration as well as the
duration of action.

Curve A = Saturated kineticsCurve C = Dose Independent KineticsA plot of the areas under the plasma level–time curves
at various doses should be linear.
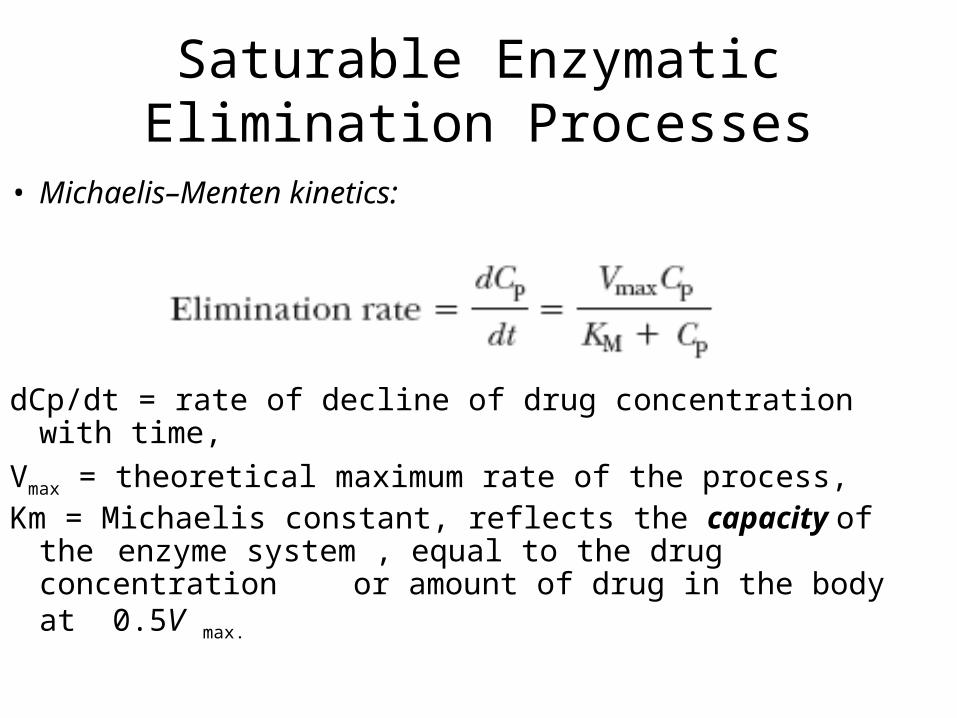
Saturable Enzymatic Elimination Processes
• Michaelis–Menten kinetics:
dCp/dt = rate of decline of drug concentration with time,
Vmax = theoretical maximum rate of the process,Km = Michaelis constant, reflects the capacity of the
enzyme system , equal to the drug concentration or amount of drug in the body at 0.5V max.

C p >> K m C p = K m C p << K m
• saturation of the enzymes occurs.•The value for K M is negligible.•The rate of elimination proceeds at a constant rate
•Rate of process is = one half of its max. rate
• -dc/dt = Vmax/2
•rate of drug elimination becomes a first-order process
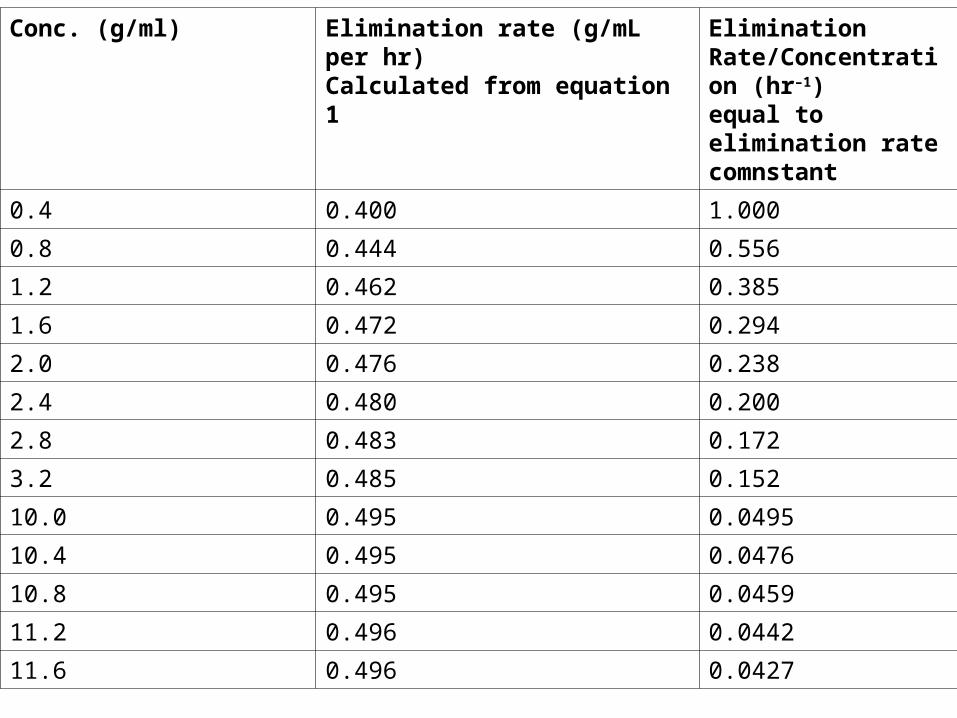
Conc. (g/ml) Elimination rate (g/mL per hr)Calculated from equation 1
Elimination Rate/Concentration (hr–1)equal to elimination rate comnstant
0.4 0.400 1.000
0.8 0.444 0.556
1.2 0.462 0.385
1.6 0.472 0.294
2.0 0.476 0.238
2.4 0.480 0.200
2.8 0.483 0.172
3.2 0.485 0.152
10.0 0.495 0.0495
10.4 0.495 0.0476
10.8 0.495 0.0459
11.2 0.496 0.0442
11.6 0.496 0.0427

Problem: from above dataUsing the hypothetical drug considered in (V max = 0.5
g/mL per hour, K M = 0.1 g/mL), how long would it take for the plasma drug concentration to decrease from 20 to 12 g/mL?
• Solution • Because 12 g/mL is above the saturable level, as
indicated in , elimination occurs at a zero-order rate of approximately 0.5 g/mL per hour.
• 0.5 g/ml 1 Hr• 8 g/ml 16Hr
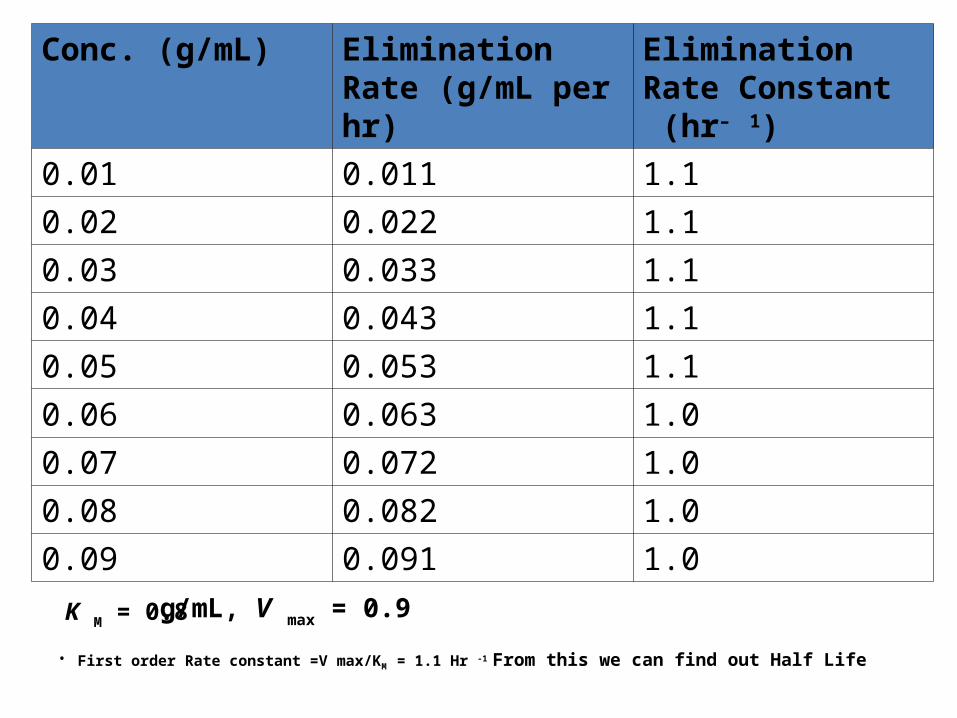
• First order Rate constant =V max/KM = 1.1 Hr -1 From this we can find out Half Life
Conc. (g/mL)
Elimination Rate (g/mL per hr)
Elimination Rate Constant (hr– 1)
0.01 0.011 1.1
0.02 0.022 1.1
0.03 0.033 1.1
0.04 0.043 1.1
0.05 0.053 1.1
0.06 0.063 1.0
0.07 0.072 1.0
0.08 0.082 1.0
0.09 0.091 1.0
K M = 0.8 g/mL, V max = 0.9
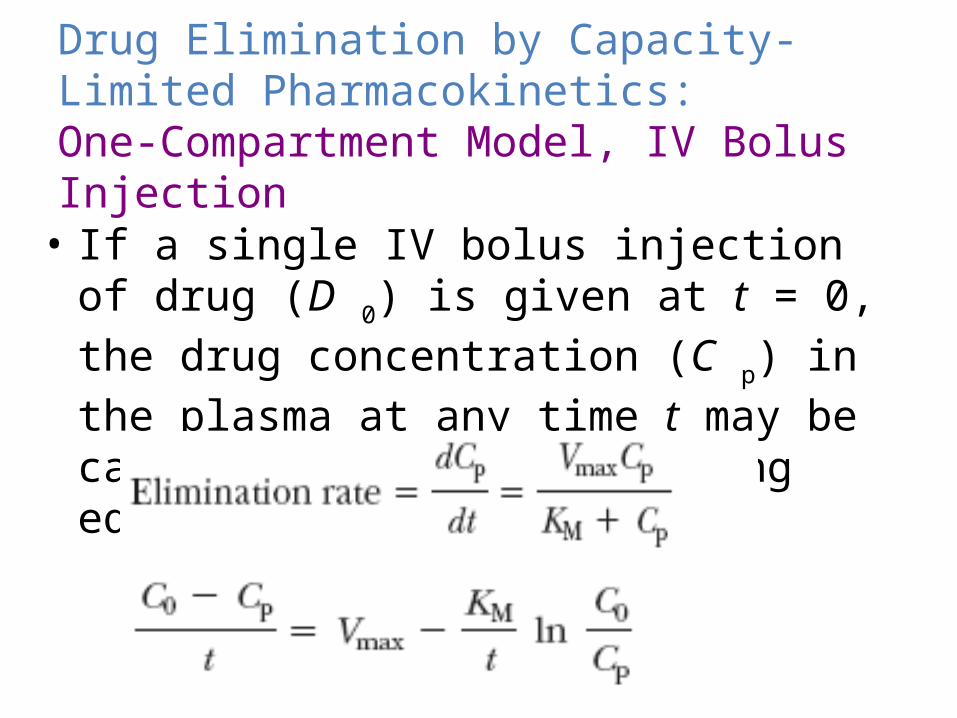
Drug Elimination by Capacity-Limited Pharmacokinetics: One-Compartment Model, IV Bolus Injection• If a single IV bolus injection of drug (D 0) is
given at t = 0, the drug concentration (C p) in the plasma at any time t may be calculated by an integrating equation,
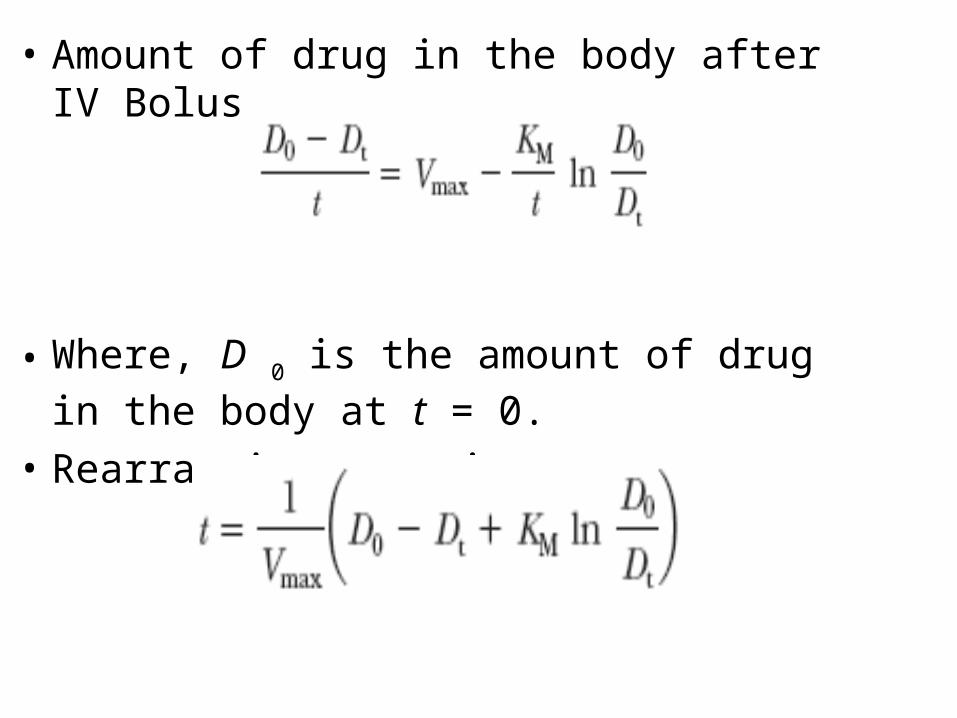
• Amount of drug in the body after IV Bolus ,
• Where, D 0 is the amount of drug in the body at t = 0.
• Rearranging equation:
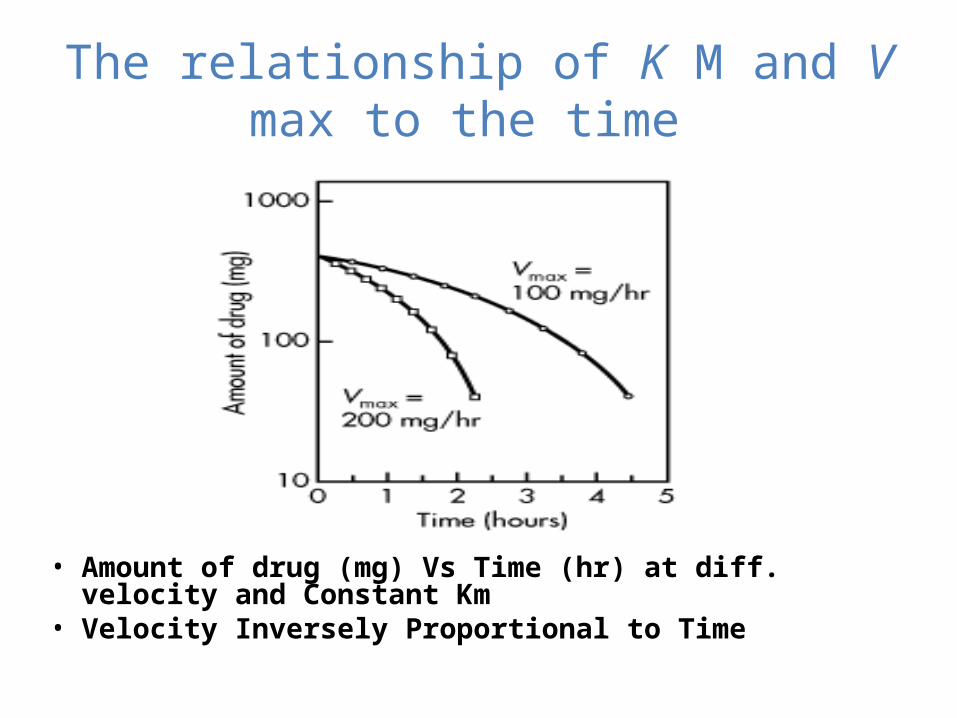
• Amount of drug (mg) Vs Time (hr) at diff. velocity and Constant Km
• Velocity Inversely Proportional to Time
The relationship of K M and V max to the time

• Amount of drug (mg) Vs Time (hr) at diff. KM and Constant Vmax
• Km is directly proportional to Time.• As Km is incereases time required to decline the
drug amt increases
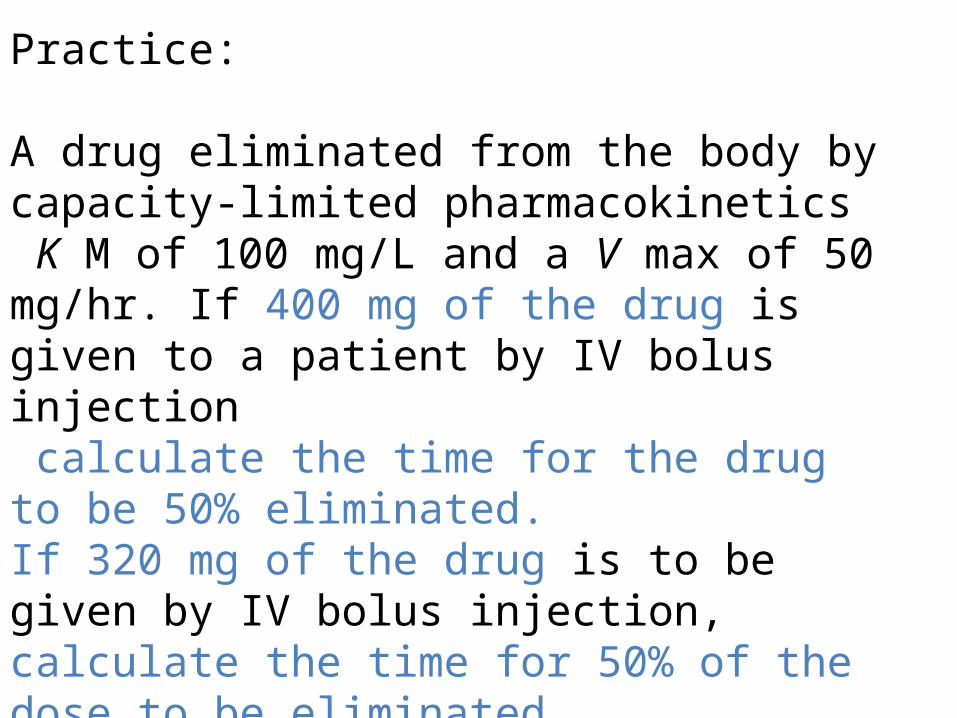
Practice:
A drug eliminated from the body by capacity-limited pharmacokinetics K M of 100 mg/L and a V max of 50 mg/hr. If 400 mg of the drug is given to a patient by IV bolus injection calculate the time for the drug to be 50% eliminated. If 320 mg of the drug is to be given by IV bolus injection, calculate the time for 50% of the dose to be eliminated.

small changes in the dose will produce large differences in the time for 50% drug elimination. Because of Saturation
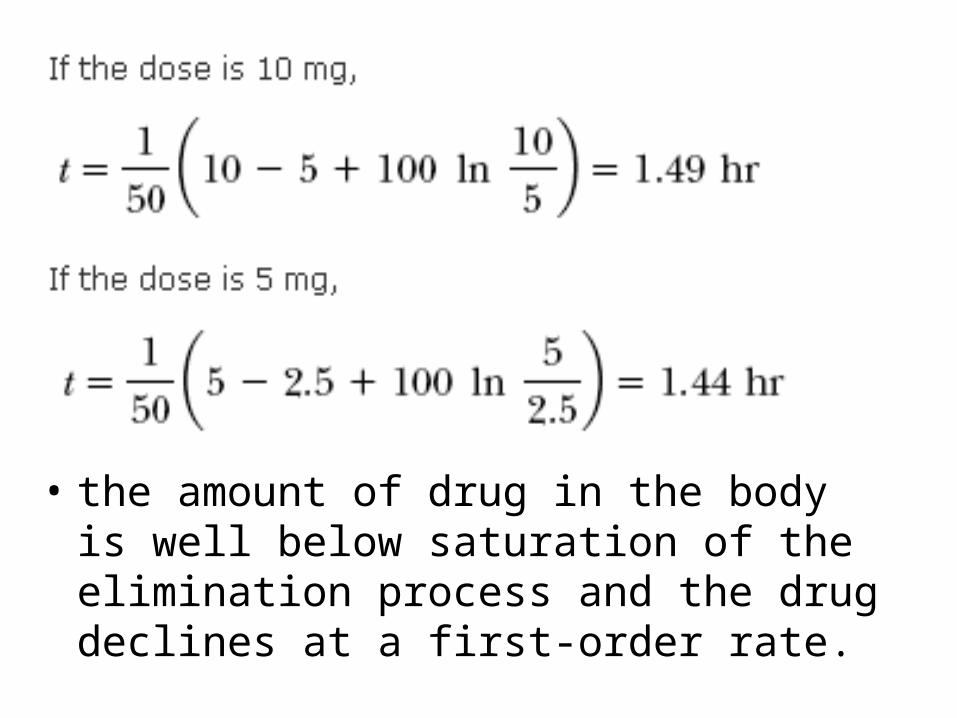
• the amount of drug in the body is well below saturation of the elimination process and the drug declines at a first-order rate.
Determination of K M and V max
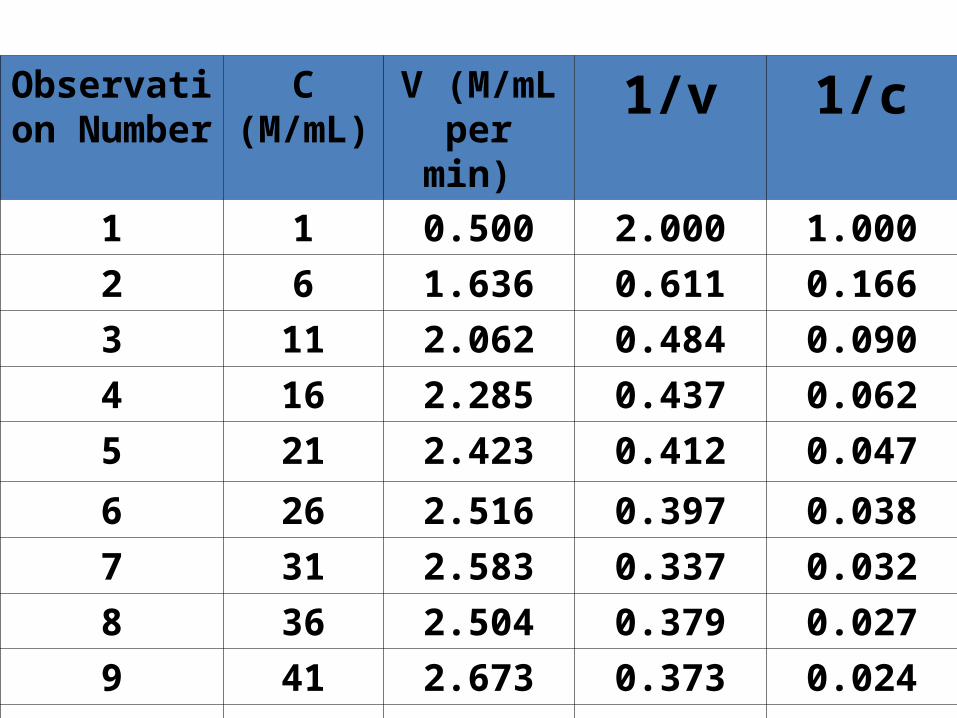
C (V (1/V (mL per min/1/C (mL/
Observation Number
C (M/mL)
V (M/mL per min)
1/v 1/c
1 1 0.500 2.000 1.000
2 6 1.636 0.611 0.166
3 11 2.062 0.484 0.090
4 16 2.285 0.437 0.062
5 21 2.423 0.412 0.047
6 26 2.516 0.397 0.038
7 31 2.583 0.337 0.032
8 36 2.504 0.379 0.027
9 41 2.673 0.373 0.024
10 46 2.705 0.369 0.021
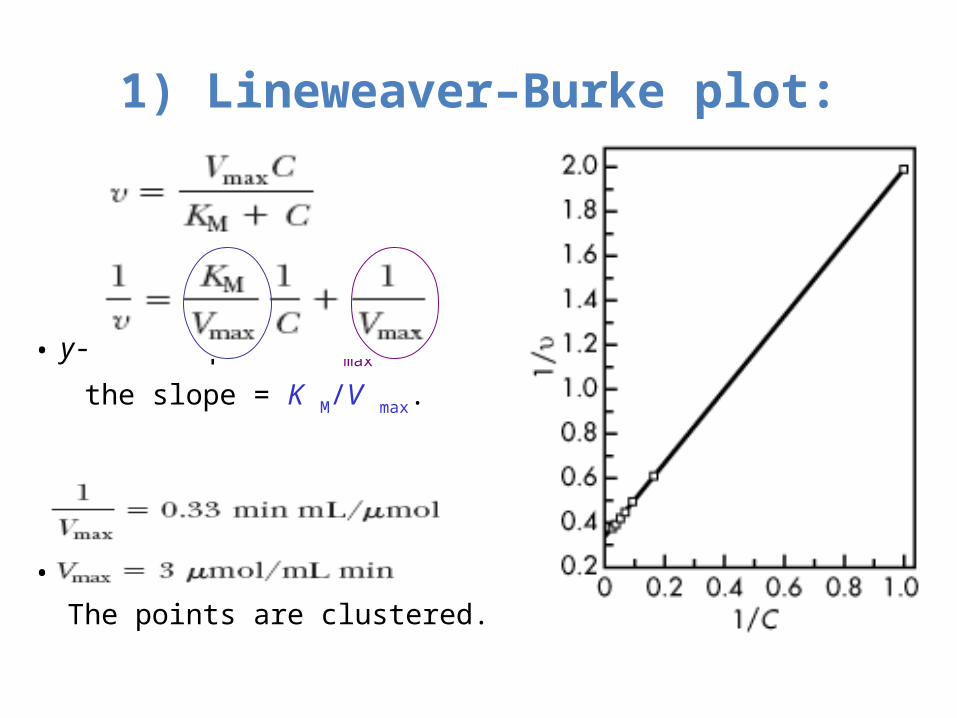
1) Lineweaver–Burke plot:
• y-intercept =1/V max
the slope = K M/V max.
• Disadvantage: The points are clustered.
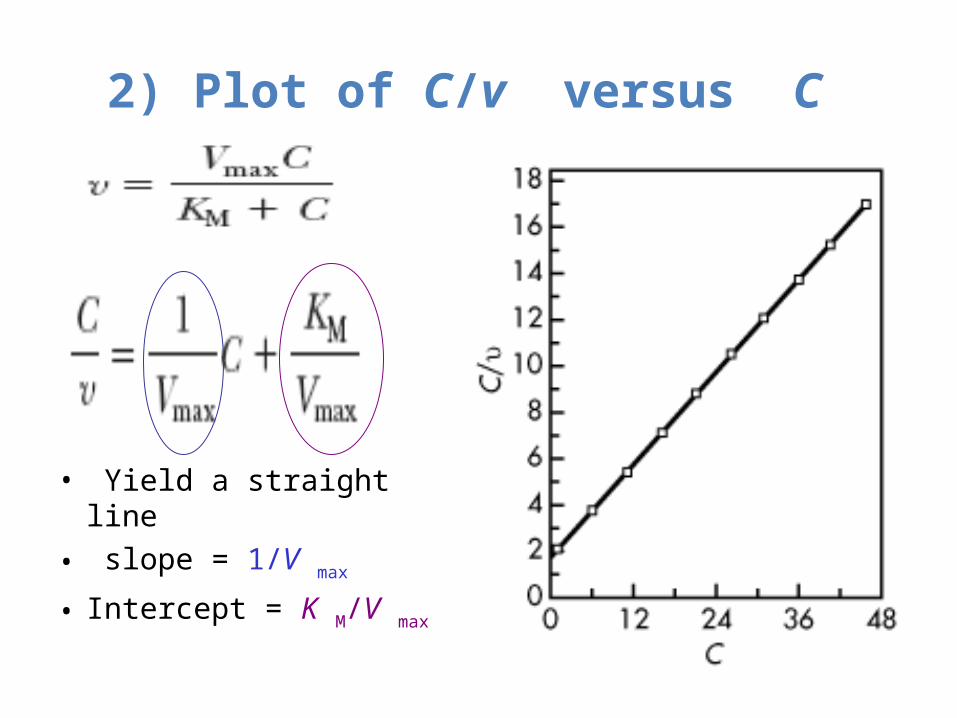
2) Plot of C/v versus C
• Yield a straight line • slope = 1/V max
• Intercept = K M/V max
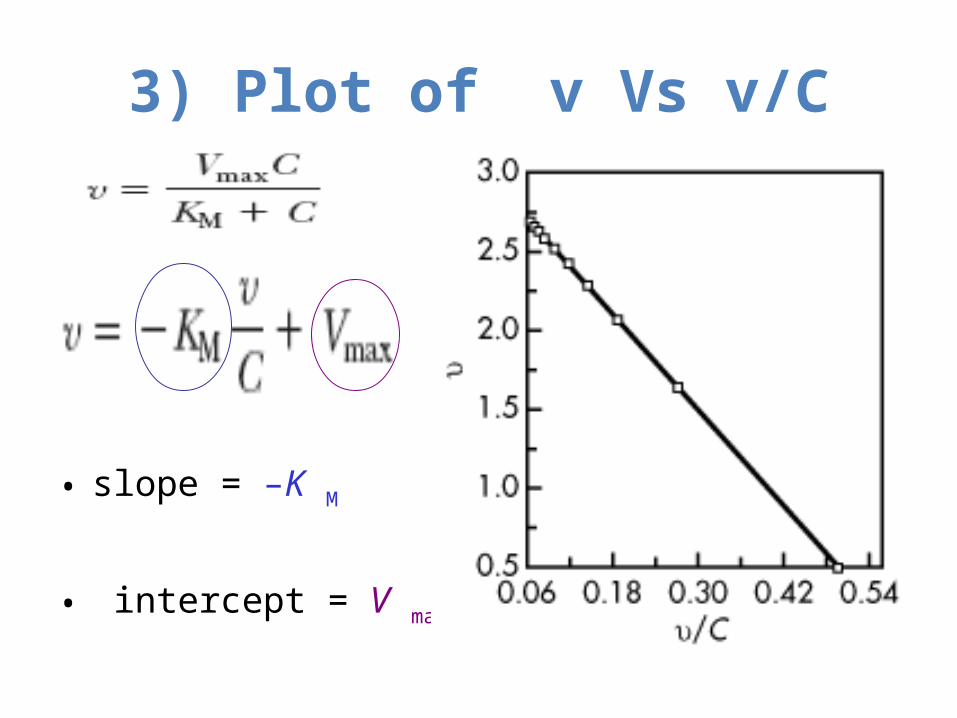
3) Plot of v Vs v/C
• slope = –K M
• intercept = V max

4) From steady state plasm drug concentration:
• At steady state• the rate of drug metabolism (v) = rate of
drug input R (dose/day).• Inverting above equation:
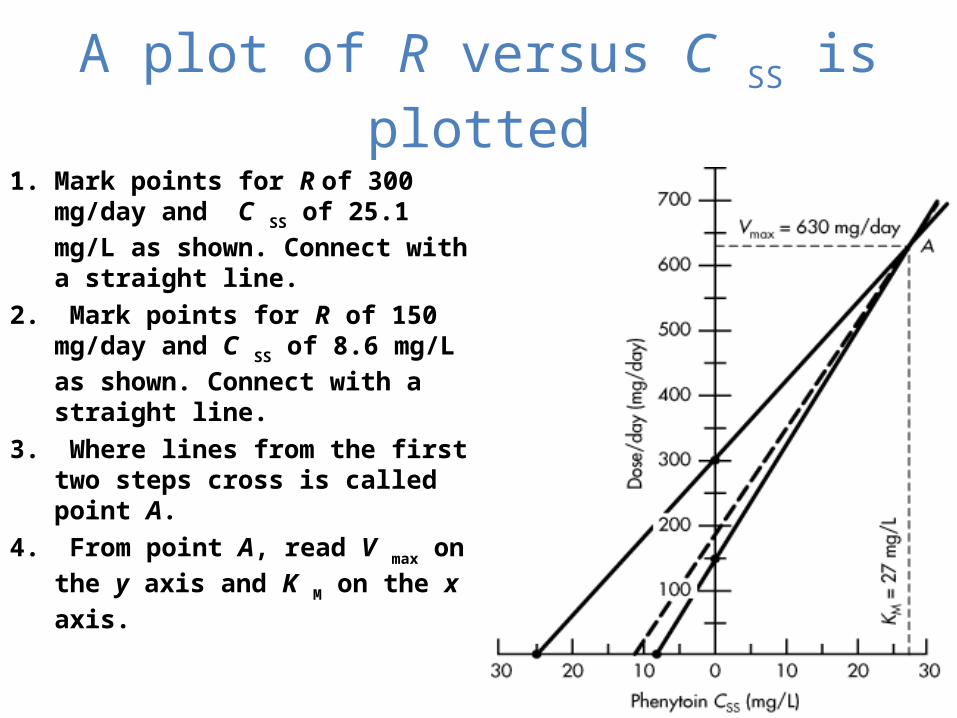
A plot of R versus C SS is plotted
1. Mark points for R of 300 mg/day and C SS of 25.1 mg/L as shown. Connect with a straight line.
2. Mark points for R of 150 mg/day and C SS of 8.6 mg/L as shown. Connect with a straight line.
3. Where lines from the first two steps cross is called point A.
4. From point A, read V max on the y axis and K M on the x axis.
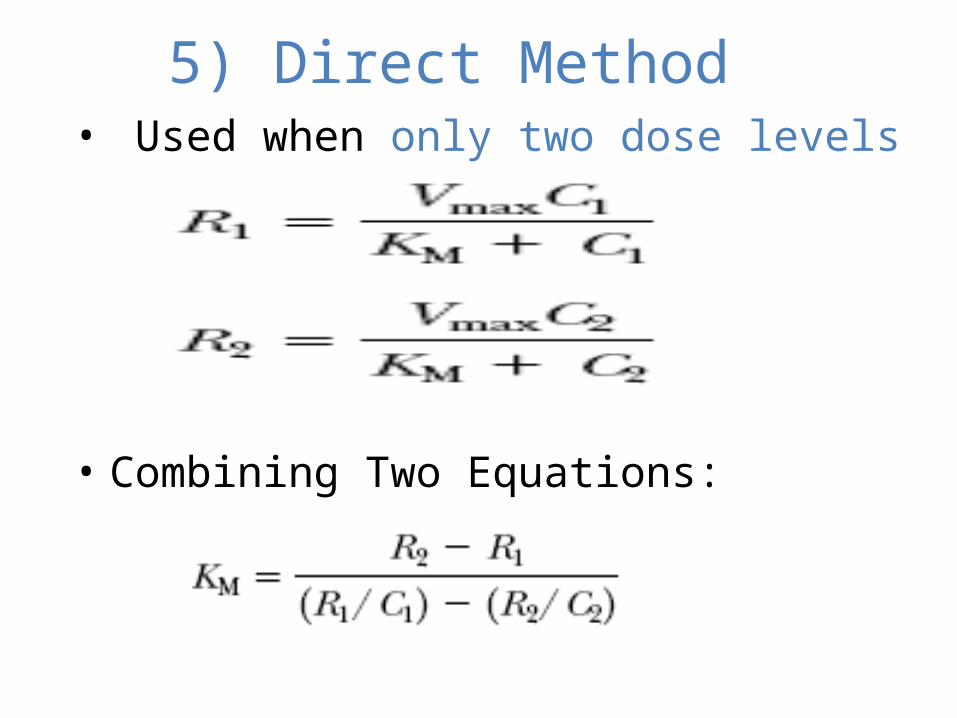
5) Direct Method• Used when only two dose levels
• Combining Two Equations:
• C 1 is steady-state plasma drug concentration after dose 1,
• C 2 is steady-state plasma drug concentration after dose 2,
• R 1 is the first dosing rate,• R 2 is the second dosing rate.

Interpretation of K M and V max • An understanding of Michaelis–Menten kinetics provides
insight into the nonlinear kinetics and helps to avoid dosing a drug at a concentration near enzyme saturation.
• Eg. Conc. = 8.6mg/L Km =27.3 mg/L dose = 300mg/day V max = 626 mg/day50% V max, ie, 0.5 x 626 mg/day or 313 mg/day.
subject is receiving 300 mg of phenytoin per day, theplasma drug concentration of phenytoin is 8.6 mg/L, which is considerably below the K M of 27.3 mg/L
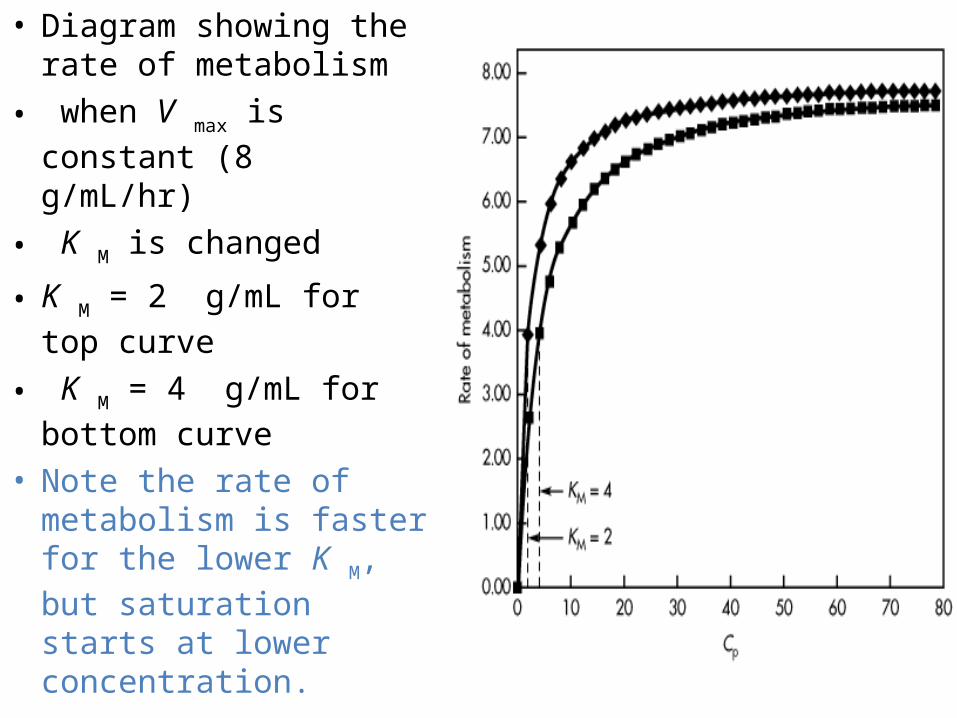
• Diagram showing the rate of metabolism
• when V max is constant (8 g/mL/hr)
• K M is changed
• K M = 2 g/mL for top curve
• K M = 4 g/mL for bottom curve
• Note the rate of metabolism is faster for the lower K M, but saturation starts at lower concentration.
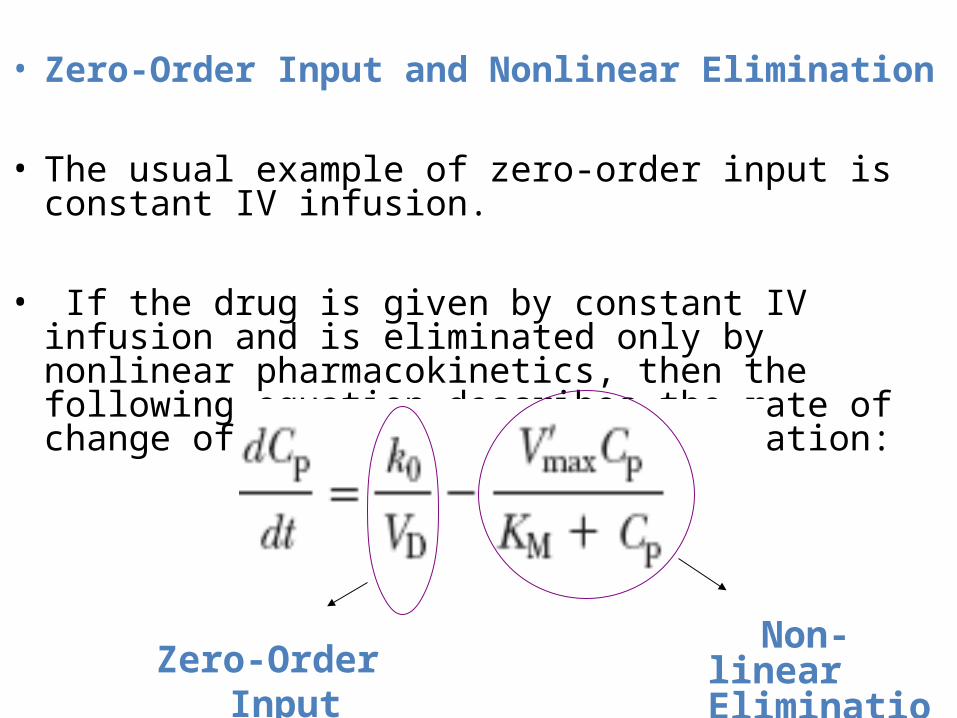
• Zero-Order Input and Nonlinear Elimination
• The usual example of zero-order input is constant IV infusion.
• If the drug is given by constant IV infusion and is eliminated only by nonlinear pharmacokinetics, then the following equation describes the rate of change of the plasma drug concentration:
Non- linear EliminationZero-Order Input
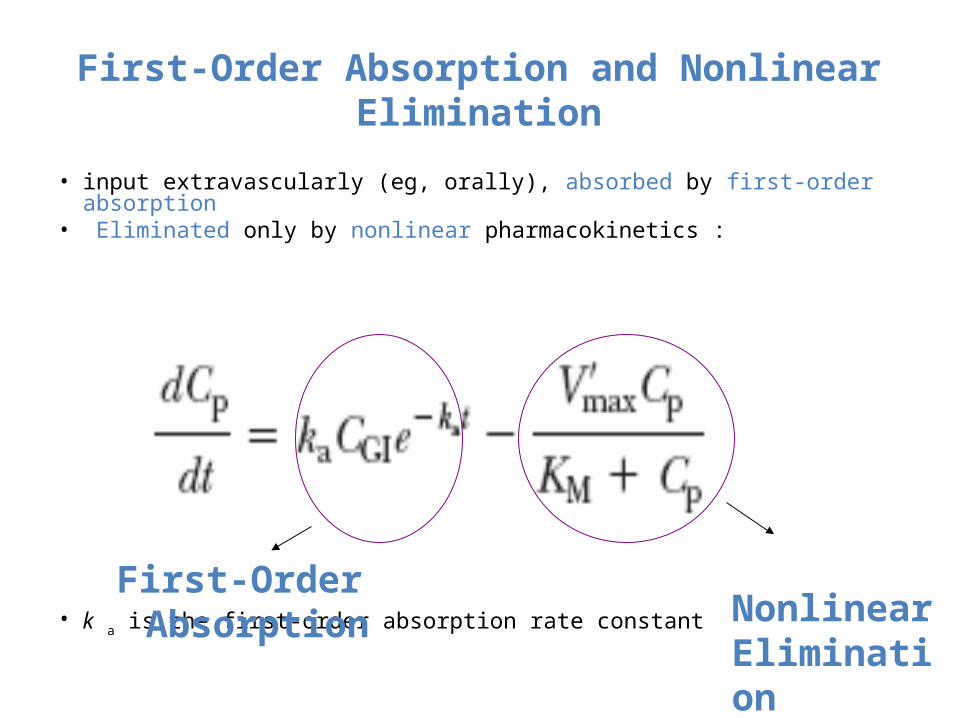
First-Order Absorption and Nonlinear Elimination
• input extravascularly (eg, orally), absorbed by first-order absorption • Eliminated only by nonlinear pharmacokinetics :
• k a is the first-order absorption rate constant
Nonlinear Elimination
First-Order Absorption

• drug is eliminated by parallel pathways consisting of both linear and nonlinear pharmacokinetics:
• k is the first-order elimination rate constant.
Definition:
• Chronopharmacokinetics deals with the study of the temporal changes in absorption, distribution, metabolism and elimination and thus takes into account the influence of time of administration on these different steps.
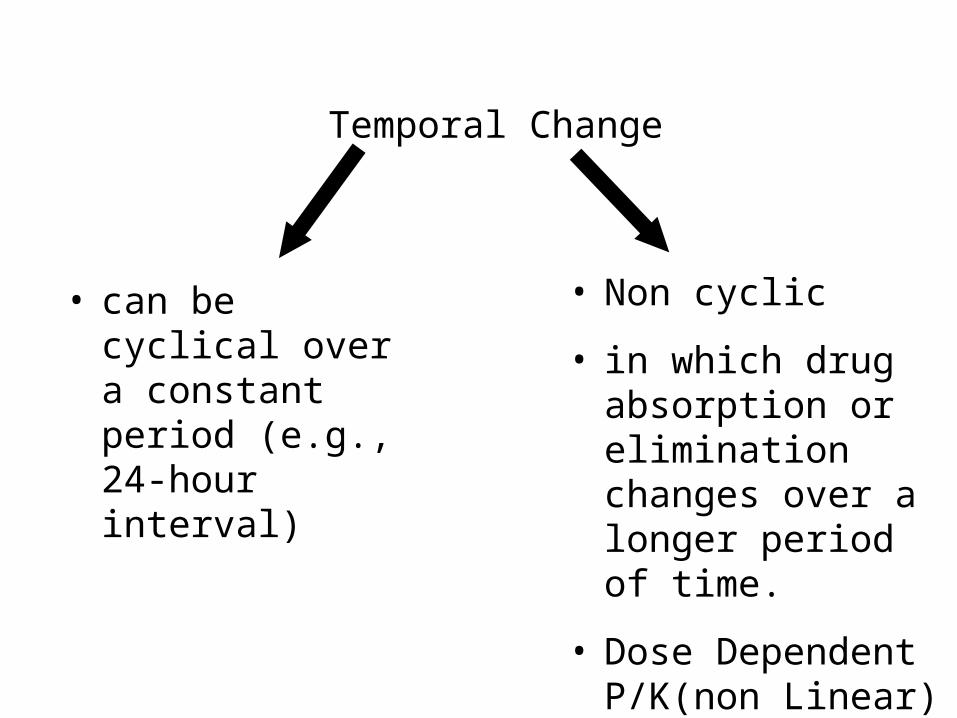
Temporal Change
• Non cyclic
• in which drug absorption or elimination changes over a longer period of time.
• Dose Dependent P/K(non Linear)
• can be cyclical over a constant period (e.g., 24-hour interval)