nonlinear viscoelasticity of cheese - foodeng.wisc.edu · 1995). therefore, the rheology of each...
TRANSCRIPT
Biorheology 35:3 (1998) 171–191
Nonlinear viscoelasticity of cheese
Salman Tariq,∗ A. Jeffrey Giacomin,∗ and Sundaram Gunasekaran†
∗ Department of Mechanical Engineering and Rheology Research Center, University of Wisconsin–Madison,Madison, WI, USA
† Department of Biological Systems Engineering and Wisconsin Center for Dairy Research, University ofWisconsin–Madison, Madison, WI, USA
Received 7 May 1998; accepted in revised form 28 August 1998
Abstract
Cheese viscoelasticity is commonly measured using steady uniaxial compression, steady uniaxialextension, shear and compressive creep, and stress relaxation in shear and compression. Viscoelasticproperties for many cheeses have also been studied using small amplitude oscillatory shear (SAOS).However, there is little on the measurement ofnonlinearviscoelastic properties. The large deformationtest usually conducted on cheese to study nonlinear viscoelasticity is uniaxial compression, but this testhardly departs from linear behavior. In this work, thenonlinearviscoelasticity of four cheese varietieswas studied usinglarge amplitudeoscillatory shear (LAOS). A sliding plate rheometer incorporatinga shear stress transducer was used. The data were evaluated using spectral analysis, and results arepresented mainly in the form of shear stress versus shear rate loops.
Keywords:Cheese; nonlinear viscoelasticity; oscillatory shear
1. Introduction
The rheological properties of dairy products have been studied for over half a century.Cheese is the most diverse group of dairy products, and considered to be the most academ-ically interesting and challenging. Unlike many dairy products which are biologically, bio-chemically, and chemically stable, cheeses are biologically and biochemically dynamic, andconsequently, inherentlyunstable(Fox, 1993). The process of cheesemaking is fascinating,both in itself and to rheologists, considering that a nearly Newtonian raw material (milk) pro-duces such a diversity of mostlyviscoelasticproducts. Up to 2000 cheese varieties have been
Reprint requests to: A. Jeffrey Giacomin, Chair, Rheology Research Center, University of Wisconsin–Madison,309 Mech. Engr. Building, 1513 University Avenue, Madison, WI 53706-1572, USA; Fax: 608-265-2316; e-mail:[email protected]
0006-355X/98 $8.00 1998 IOS Press. All rights reserved

172 S. Tariq et al. / Biorheology (1998) 171–191
developed, of which 700 have been described, with no two alike (Holsinger et al., 1995; Olson,1995). Therefore, the rheology of each cheese variety is unique.
Rheological measurements on cheese using mechanical instruments are performed (1) forquality control by cheese makers and (2) for scientists to study cheese texture (Tunick andNolan, 1992). The textural properties of cheese can be as important as flavor, and comprisea significant part of the total sensory score awarded by cheese graders (Farkye and Fox,1990). For example, texture is a major determinant of quality in cheddar (Ma et al., 1996),followed by flavor and appearance. Therefore, an objective instrumental method of measuringcheese rheological properties would be valuable, especially when used in conjunction withits chemical properties. For example, the effects of pH on cheese during manufacturing andmaturation are well recognized, and the most demonstrable effect of pH is to impart brittlenesswhen pH falls below 5 in hard cheeses (Olson et al., 1996). Therefore, research into the originsof cheese texture is an important dairy science. The ultimate goal of cheese rheologists is tocorrelate the results of various instrumental tests to subjective evaluations by sensory panelsand consumers (Tunick and Nolan, 1992).
The cheese varieties studied here were (1) natural mozzarella, (2) natural pizza cheese,(3) natural cheddar, and (4) process mozzarella. The effects of temperature, age, and fat contentwere evaluated, and comparisons were made to the Lodge rubberlike liquid theory to establishthe amount of nonlinearity.
Mozzarella is a prominent member of the pasta filata, or stretched curd, cheese varietiesthat originated in Italy. Pasta filata cheeses are distinguished by their characteristic fibrousstructure and melting and stretching properties. This unique fibrous structure is obtained bymixing and molding the cheese curd in hot water at a pH of approximately 5.2 using opendischarge single screw extrusion. Mozzarella is primarily used as an ingredient in preparedfoods such as pizza and lasagna. Pizza cheese isunstretchedmozzarella. During manufacture,instead of processing the curd in hot water by the usual mixing and molding, the curd issteamed to a semi-plastic state and then pressed into blocks to produce what is called pizzacheese (Kindstedt, 1993). While mozzarella has a well defined fiber orientation, pizza cheeseis isotropic. In our testing, mozzarella was sheared in the fiber orientation direction. Cheddaris a popular cheese variety, with most of its production concentrated in the former Britishcolonies (Olson, 1995). It is used in many food products, such as burgers and sandwiches.Process cheese products are alternatives to natural cheeses produced directly from milk. Theyare produced by blending shredded natural cheeses differing in type and degree of maturitywith emulsifying agents (primarily phosphates and citrates), and by heating the blend underpartial vacuum with constant agitation until homogeneous (Caric and Kalab, 1993). Heattreatment destroys dangerous microorganisms and destroys any phosphates in cheese madefrom unpasteurized milk. Hence, a diversity of process cheese products can be made to satisfyconsumer and food ingredient demands.
2. Theory
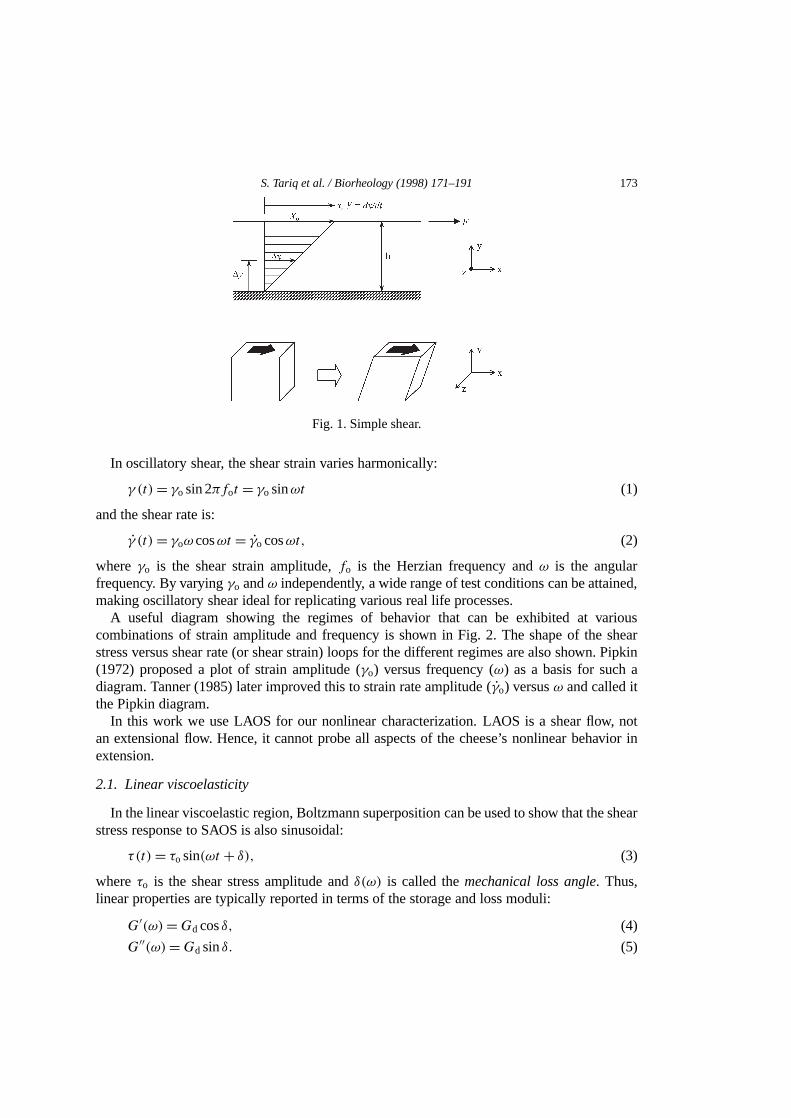
Consider thesimple shearflow generated between two parallel plates with a constant gap(Fig. 1). One plate is fixed, while the other moves in its own plane subject to a forceF actingin the plane. This deformation causes a change in shape without change in volume.
S. Tariq et al. / Biorheology (1998) 171–191 173
Fig. 1. Simple shear.
In oscillatory shear, the shear strain varies harmonically:
γ (t)= γo sin 2πfot = γo sinωt (1)
and the shear rate is:
γ̇ (t)= γoω cosωt = γ̇o cosωt, (2)
whereγo is the shear strain amplitude,fo is the Herzian frequency andω is the angularfrequency. By varyingγo andω independently, a wide range of test conditions can be attained,making oscillatory shear ideal for replicating various real life processes.
A useful diagram showing the regimes of behavior that can be exhibited at variouscombinations of strain amplitude and frequency is shown in Fig. 2. The shape of the shearstress versus shear rate (or shear strain) loops for the different regimes are also shown. Pipkin(1972) proposed a plot of strain amplitude (γo) versus frequency (ω) as a basis for such adiagram. Tanner (1985) later improved this to strain rate amplitude (γ̇o) versusω and called itthe Pipkin diagram.
In this work we use LAOS for our nonlinear characterization. LAOS is a shear flow, notan extensional flow. Hence, it cannot probe all aspects of the cheese’s nonlinear behavior inextension.
2.1. Linear viscoelasticity
In the linear viscoelastic region, Boltzmann superposition can be used to show that the shearstress response to SAOS is also sinusoidal:
τ(t)= τo sin(ωt + δ), (3)
whereτo is the shear stress amplitude andδ(ω) is called themechanical loss angle. Thus,linear properties are typically reported in terms of the storage and loss moduli:
G′(ω)=Gd cosδ, (4)
G′′(ω)=Gd sinδ. (5)

174 S. Tariq et al. / Biorheology (1998) 171–191
Fig. 2. Pipkin diagram showing shear stress versus shear rate (or versus shear strain) loops for theregimes in oscillatory shear.
Gd is thedynamic modulus, Gd ≡ τo/γo, andG′(ω) andG′′(ω) are the in-phase and out-of-phase components of stress given by Eq. (3).
In oscillatory shear, the Lodge rubberlike liquid theory predicts a sinusoidal shear stressgiven by Eq. (3). It also predicts asinusoidalfirst normal stress difference with a frequencyof 2ω and a nonzero offset or average value equal toγ 2
oG′(ω) (Lodge, 1964; Giacomin and
Dealy, 1993). The second normal stress difference is predicted to be zero.Mechanical analog models can simulate a material’s response (Ferry, 1980). These models
can be constructed by some suitable combination of springs (obeying Hooke’s law) andviscous dashpots (obeying Newton’s law). One of the most common mechanical analogs usedin modeling linear behavior is thegeneralizedMaxwell model:
τij =t∫
−∞
∑k
Gke(−(t−t ′)/λk)γ̇ij (t ′)dt ′, (6)
whereGk andλk are the initial modulus and relaxation time of each Maxwell element. The(Gi, λi) set is called thediscrete relaxation spectrumof the material. Using Eq. (6), thefunctions defined in Eqs. (4) and (5) can now be represented in terms ofGi,λi (Dealy andWissbrun, 1990):
S. Tariq et al. / Biorheology (1998) 171–191 175
G′(ω)=N∑i=1
Gi(ωλi)2
[1+ (ωλi)2] , (7)
G′′(ω)=N∑i=1
Gi(ωλi)
[1+ (ωλi)2] . (8)
The discrete relaxation spectrum,(Gi, λi) , can be obtained from SAOS test data using curvefitting techniques. In this research, theparsimonious modelingtechnique developed by Winteret al. (1993) was used (IRIS Development, Amherst, MA).
2.2. Nonlinear viscoelasticity
There is no unifying theory that describes nonlinear viscoelasticity, and for most polymericliquids, the stress response in LAOS isnot sinusoidal. After a few cycles, the shear stressbecomes a standing wave that can be represented by a Fourier series ofoddharmonics:
τ(t)=M∑
m=1,odd
τm sin(mωt + δm), (9)
whereτm(ω,γo) and δm(ω,γo) are the amplitudes and phase angles of the odd harmonics.They depend upon both the strain amplitude and frequency, and since only odd valuedharmonics are observed, a plot of shear stress versus shear rate will always give a two-foldsymmetric loop (Fig. 2). For cheese, the number of the highest significant harmonic does notnormally exceed five. The existence of higher harmonics makes the property definitionsG′(ω)andG′′(ω) meaningless for a nonlinear viscoelastic response.
The cyclic integral of the shear stress with respect to the shear strain gives the energydissipation per cycle per unit volume,WL (Onogi and Matsumoto, 1981):
WL =∮τ dγ = πτ1γo sinδ1. (10)
Hence, all the energy dissipation is in the first harmonic. From the second law ofthermodynamics,WL > 0; combining this with Eq. (10), the following inequality is obtained:
06 δ16 π. (11)
Measured values of the phase angle for the first harmonic are always in the first quadrant,06 δ16 π/2, and by convention, phase angles for the higher harmonics lie between 0 and 2π
radians.LAOS test data are best evaluated with spectral analysis. A discrete Fourier transform (DFT)
of the digitally sampled stress wave,τ(n1t), determines the amplitudes and phase angles,which are then used to characterize the cheese at the given test condition. The DFT yields aset of complex numbers, the amplitudes and phase contents of which are:∣∣τd(k1ω)
∣∣=√Re2[τd(k1ω)] + Im2[τd(k1ω)], (12)
δd(k1ω)= tan−1[
Im[τd(k1ω)]Re[τd(k1ω)]
], (13)

176 S. Tariq et al. / Biorheology (1998) 171–191
Fig. 3. 3D amplitude spectrum for 4 week old reduced-fat mozzarella at 40◦C with fo = 0.4 Hz. Thehigher, odd harmonics rise with strain amplitude.
where Im and Re mean the imaginary and real parts. The left side of Eq. (12) can be plottedagainst frequency to give anamplitude spectrumof the stress response in oscillatory shear.A more useful way to evaluate and compare nonlinear viscoelastic behavior is to plot theamplitude spectrum for increasing strain amplitudes in three dimension(τ, f, γo) , as shownin Fig. 3. The higher, odd harmonics exceed the signal noise with increasing strain amplitude.Low strain amplitudes create a flat bed, while higher values create peaks and valleys, the peaksbeing the odd harmonics. Plots like this can therefore be used to approximate the conditionsat which the stress response will no longer be sinusoidal, and the degree of nonlinearitywith respect to the strain amplitude. Other useful plots are the effect ofγo on τm(ω,γo)
andδm(ω,γo).The DFT provides a complete mathematical description of the nonlinear viscoelastic
response to LAOS. However, these results are more complex than the linear viscoelastic case,whereG′(ω) andG′′(ω) can be used. They now consist of amplitudes and phase angles for asmany harmonics as can be identified in the response. Therefore, an extremely useful techniqueto characterize material response in LAOS is with shear stress versus shear rate loops (Dealyand Wissbrun, 1990; Tee and Dealy, 1975). For the linear viscoelastic case these loops areellipses, but with higher harmonics, the loops distort (Fig. 2). Although higher harmonicsmight not exceed 5% of the fundamental, they profoundly affect the loop shape (Giacominand Dealy, 1993). These loops provide both qualitative and quantitative information aboutcheese rheology. Such loops may be useful for comparing cheese behavior in industry.
3. Method
The sliding plate rheometer(SPR) developed by Giacomin et al. (1989) was used forthe LAOS tests (Fig. 4). Unlike classical shear rheometers, such as rotational rheometers,

S. Tariq et al. / Biorheology (1998) 171–191 177
Fig. 4. Interlaken sliding plate rheometer incorporating Dealyshear stress transducer(SST). The SSTis flush-mounted on the fixed plate and measures the shear stress locally, thereby eliminating error dueto flow heterogeneity.
the SPR generates a homogeneous, simple shear flow field, except near the sample edges.We measure the shear stress locally in the region of uniform deformation, away from thefree boundaries, using a Dealy (1984)shear stress transducerthat is flush-mounted on thefixed plate. This eliminates error due to flow heterogeneity near the sample edges, a problemprimarily associated with rotational rheometers.
3.1. Sample preparation and testing
Fresh full-fat and reduced-fat pizza cheese, reduced-fat mozzarella, and reduced-fat cheddarblocks were obtained from the University of Wisconsin dairy plant and refrigerated at 4◦Cuntil sample preparation. The blocks were vacuum packed to prevent moisture loss andcontamination. Table 1 shows the average cheese compositions. A food slicer sliced the cheeseinto samples with the desired thickness (approximately 1.2 mm); mozzarella was sliced in thefiber orientation direction. A laboratory knife was used to trim the edges, and the sampleswere cut to approximately 50× 80× 1.2 mm dimensions. Each sample was then carefullywrapped in plastic and placed in an airtight zipper bag to maintain freshness. KraftTM fat-free process mozzarella singles were obtained from a grocery store and refrigerated at 4◦Cuntil sample preparation. Before testing, the square slices were cut into rectangles measuringapproximately 50× 80× 1.5 mm.
Tests on process mozzarella were conducted at two temperatures: 30 and 35◦C, and ata test frequency of 0.25 Hz. The tests on natural cheese were conducted over 12 weeks at

178 S. Tariq et al. / Biorheology (1998) 171–191
Table 1Composition of thenaturalcheeses
Cheese age, Cheese Fat, Moisture, MNFP1, FDM2, Salt, S/M3, pH
weeks type % % % % % %
1 RF Pizza4 12.4 53.2 60.7 26.7 1.95 3.67 5.48
1 FF Pizza 21.1 51.4 6501 43.4 2.01 3.91 5.39
1 RF Ched 13.0 46.4 53.3 24.3 1.66 3.58 5.15
1 RF Mozza 10.2 52.2 58.1 21.3 1.32 2.53 5.39
4 RF Pizza 12.8 53.1 60.9 27.3 1.89 3.56 5.44
4 FF Pizza 21.6 51.2 65.3 44.3 1.94 3.79 5.33
4 RF Ched 11.8 46.8 53.1 22.2 1.74 3.72 5.10
4 RF Mozza 7.5 52.4 56.6 15.8 1.27 2.42 5.31
6 RF Pizza 11.5 52.9 59.8 24.4 1.56 2.95 5.41
6 FF Pizza 18.0 51.6 62.9 37.2 1.78 3.45 5.29
6 RF Ched 9.5 46.5 51.4 17.8 1.51 3.25 5.00
6 RF Mozza 9.9 52.3 58.0 20.8 1.44 2.75 5.25
12 RF Pizza 11.3 53.0 59.8 24.0 2.07 3.90 5.34
12 FF Pizza 20.3 49.9 62.6 40.5 1.39 2.79 5.21
12 RF Ched 10.3 47.2 52.6 19.5 1.63 3.45 5.00
12 RF Mozza 8.25 52.4 55.3 17.3 1.32 2.52 5.071 Moisture-in-the-nonfat-portion;2 Fat in the dry matter;3 Salt/moisture;4 FF= full fat, RF= reduced fat, Pizza= pizza cheese, Ched= cheddar, and Mozza= mozzarella.
the following intervals from the manufacture date: 1, 4, 6, and 12 weeks. Two temperatureswere studied: 40◦C at which the cheeses were solid, and 60◦C at which the cheeses hadmelted. Mozzarella was sheared in the fiber orientation direction. The test frequency forboth temperatures was 0.4 Hz, aimed to approximate the real-life chewing frequency. A freshsample was used for each new strain magnitude, and the tests were repeated using the samesample to check for repeatability.
A parallel disk rheometer (Bohlin-CVO Melt Rheometer, Bohlin Instruments Inc., Cran-bury, NJ) was used to measure linear viscoelastic properties of six week old reduced-fat moz-zarella and cheddar (40 and 60◦C) and fat-free process mozzarella (30 and 35◦C). The linearviscoelastic range was first determined by measuring dynamic properties using SAOS strainsweep tests. SAOS frequency sweep measurements were then made, and the storage and loss
S. Tariq et al. / Biorheology (1998) 171–191 179
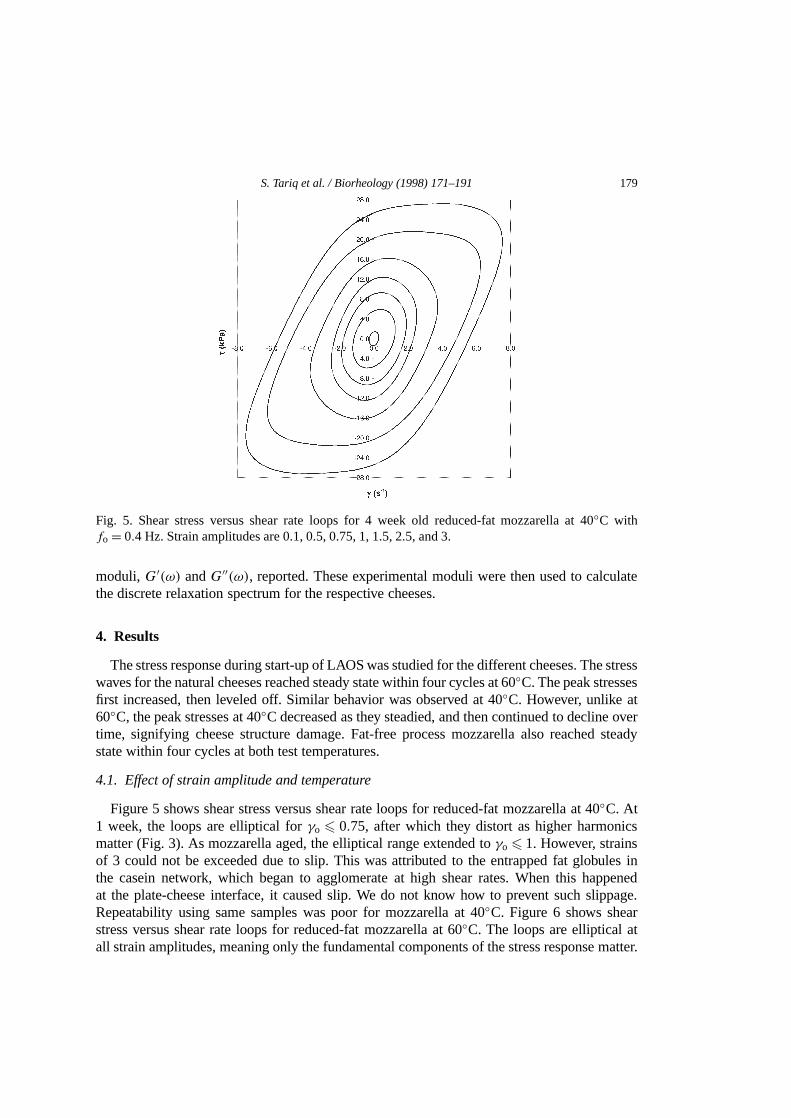
Fig. 5. Shear stress versus shear rate loops for 4 week old reduced-fat mozzarella at 40◦C withfo= 0.4 Hz. Strain amplitudes are 0.1, 0.5, 0.75, 1, 1.5, 2.5, and 3.
moduli,G′(ω) andG′′(ω), reported. These experimental moduli were then used to calculatethe discrete relaxation spectrum for the respective cheeses.
4. Results
The stress response during start-up of LAOS was studied for the different cheeses. The stresswaves for the natural cheeses reached steady state within four cycles at 60◦C. The peak stressesfirst increased, then leveled off. Similar behavior was observed at 40◦C. However, unlike at60◦C, the peak stresses at 40◦C decreased as they steadied, and then continued to decline overtime, signifying cheese structure damage. Fat-free process mozzarella also reached steadystate within four cycles at both test temperatures.
4.1. Effect of strain amplitude and temperature
Figure 5 shows shear stress versus shear rate loops for reduced-fat mozzarella at 40◦C. At1 week, the loops are elliptical forγo 6 0.75, after which they distort as higher harmonicsmatter (Fig. 3). As mozzarella aged, the elliptical range extended toγo6 1. However, strainsof 3 could not be exceeded due to slip. This was attributed to the entrapped fat globules inthe casein network, which began to agglomerate at high shear rates. When this happenedat the plate-cheese interface, it caused slip. We do not know how to prevent such slippage.Repeatability using same samples was poor for mozzarella at 40◦C. Figure 6 shows shearstress versus shear rate loops for reduced-fat mozzarella at 60◦C. The loops are elliptical atall strain amplitudes, meaning only the fundamental components of the stress response matter.

180 S. Tariq et al. / Biorheology (1998) 171–191
Fig. 6. Shear stress versus shear rate loops for 1 week old reduced-fat mozzarella at 60◦C withfo= 0.4 Hz. Strain amplitudes are 1, 1.5, 2, 2.5, 3, 4, 6, and 8. All the loops are ellipses.
Fig. 7. Shear stress versus shear rate loops for 6 week old full-fat pizza cheese at 40◦C withfo= 0.4 Hz.Strain amplitudes are 0.1, 0.5, 0.75, 1, 1.5, 2, 2.5, 3, and 4. Twisting atγo= 4 is caused by slip.
S. Tariq et al. / Biorheology (1998) 171–191 181
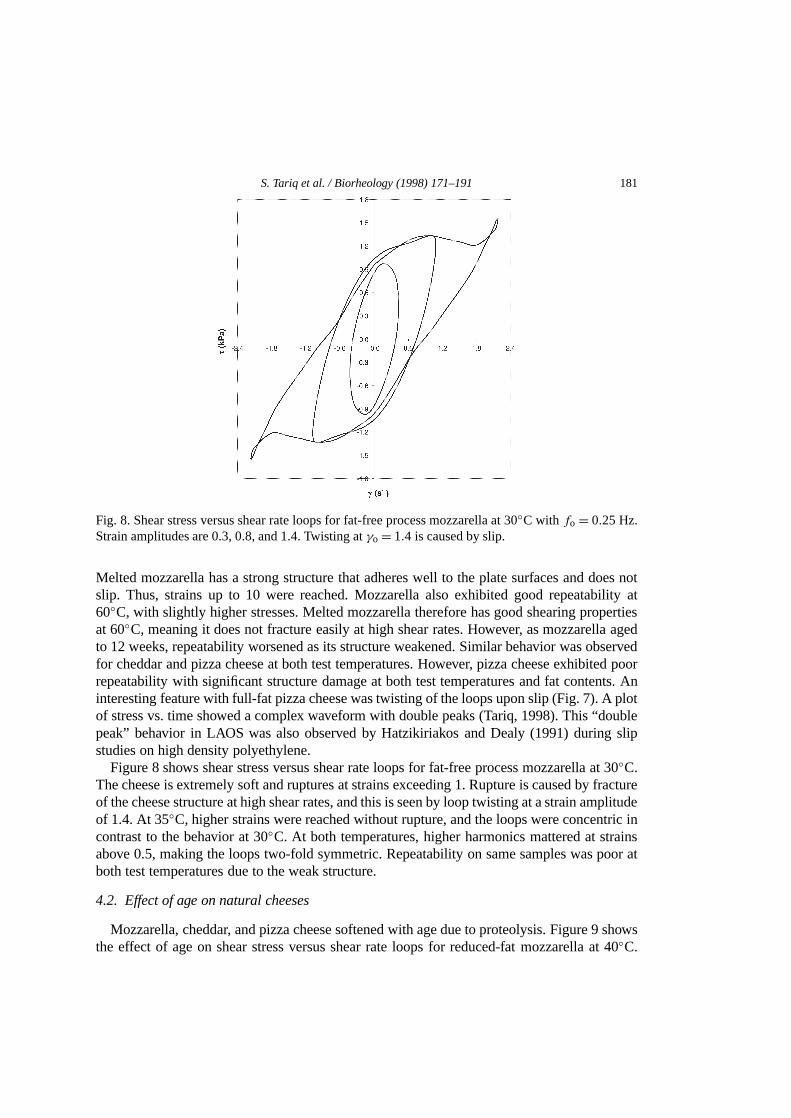
Fig. 8. Shear stress versus shear rate loops for fat-free process mozzarella at 30◦C with fo= 0.25 Hz.Strain amplitudes are 0.3, 0.8, and 1.4. Twisting atγo= 1.4 is caused by slip.
Melted mozzarella has a strong structure that adheres well to the plate surfaces and does notslip. Thus, strains up to 10 were reached. Mozzarella also exhibited good repeatability at60◦C, with slightly higher stresses. Melted mozzarella therefore has good shearing propertiesat 60◦C, meaning it does not fracture easily at high shear rates. However, as mozzarella agedto 12 weeks, repeatability worsened as its structure weakened. Similar behavior was observedfor cheddar and pizza cheese at both test temperatures. However, pizza cheese exhibited poorrepeatability with significant structure damage at both test temperatures and fat contents. Aninteresting feature with full-fat pizza cheese was twisting of the loops upon slip (Fig. 7). A plotof stress vs. time showed a complex waveform with double peaks (Tariq, 1998). This “doublepeak” behavior in LAOS was also observed by Hatzikiriakos and Dealy (1991) during slipstudies on high density polyethylene.
Figure 8 shows shear stress versus shear rate loops for fat-free process mozzarella at 30◦C.The cheese is extremely soft and ruptures at strains exceeding 1. Rupture is caused by fractureof the cheese structure at high shear rates, and this is seen by loop twisting at a strain amplitudeof 1.4. At 35◦C, higher strains were reached without rupture, and the loops were concentric incontrast to the behavior at 30◦C. At both temperatures, higher harmonics mattered at strainsabove 0.5, making the loops two-fold symmetric. Repeatability on same samples was poor atboth test temperatures due to the weak structure.
4.2. Effect of age on natural cheeses
Mozzarella, cheddar, and pizza cheese softened with age due to proteolysis. Figure 9 showsthe effect of age on shear stress versus shear rate loops for reduced-fat mozzarella at 40◦C.
182 S. Tariq et al. / Biorheology (1998) 171–191
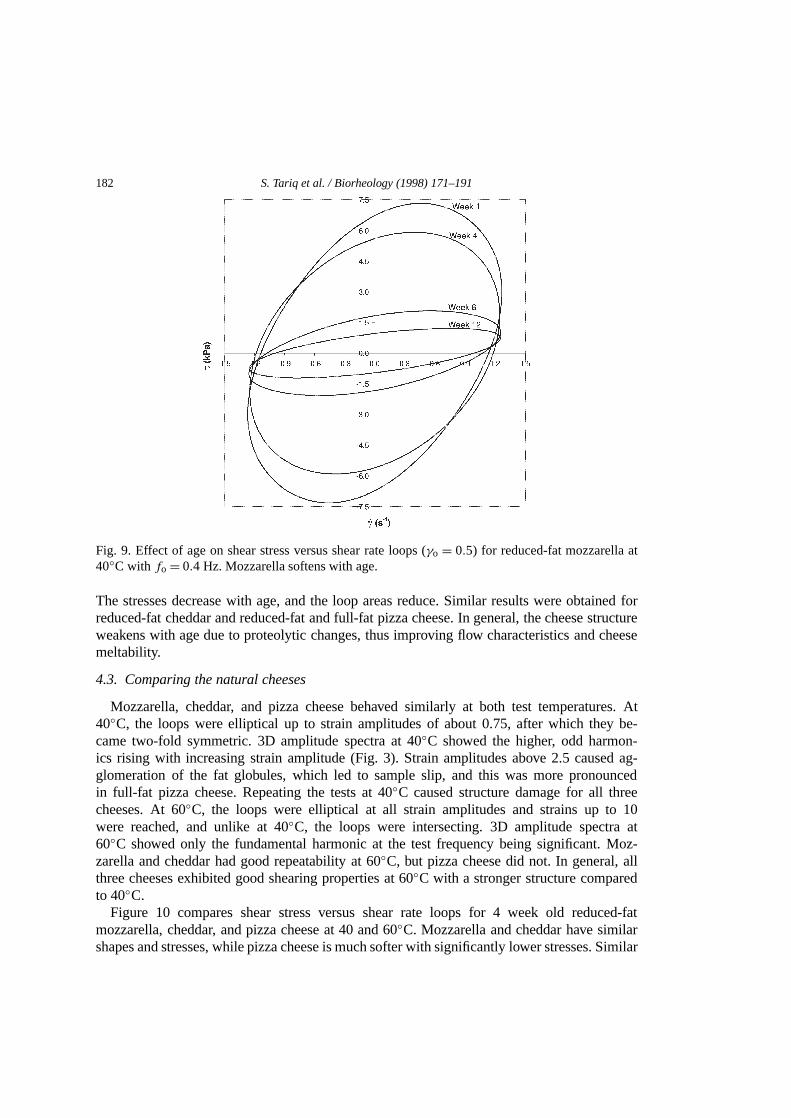
Fig. 9. Effect of age on shear stress versus shear rate loops (γo = 0.5) for reduced-fat mozzarella at40◦C with fo= 0.4 Hz. Mozzarella softens with age.
The stresses decrease with age, and the loop areas reduce. Similar results were obtained forreduced-fat cheddar and reduced-fat and full-fat pizza cheese. In general, the cheese structureweakens with age due to proteolytic changes, thus improving flow characteristics and cheesemeltability.
4.3. Comparing the natural cheeses
Mozzarella, cheddar, and pizza cheese behaved similarly at both test temperatures. At40◦C, the loops were elliptical up to strain amplitudes of about 0.75, after which they be-came two-fold symmetric. 3D amplitude spectra at 40◦C showed the higher, odd harmon-ics rising with increasing strain amplitude (Fig. 3). Strain amplitudes above 2.5 caused ag-glomeration of the fat globules, which led to sample slip, and this was more pronouncedin full-fat pizza cheese. Repeating the tests at 40◦C caused structure damage for all threecheeses. At 60◦C, the loops were elliptical at all strain amplitudes and strains up to 10were reached, and unlike at 40◦C, the loops were intersecting. 3D amplitude spectra at60◦C showed only the fundamental harmonic at the test frequency being significant. Moz-zarella and cheddar had good repeatability at 60◦C, but pizza cheese did not. In general, allthree cheeses exhibited good shearing properties at 60◦C with a stronger structure comparedto 40◦C.
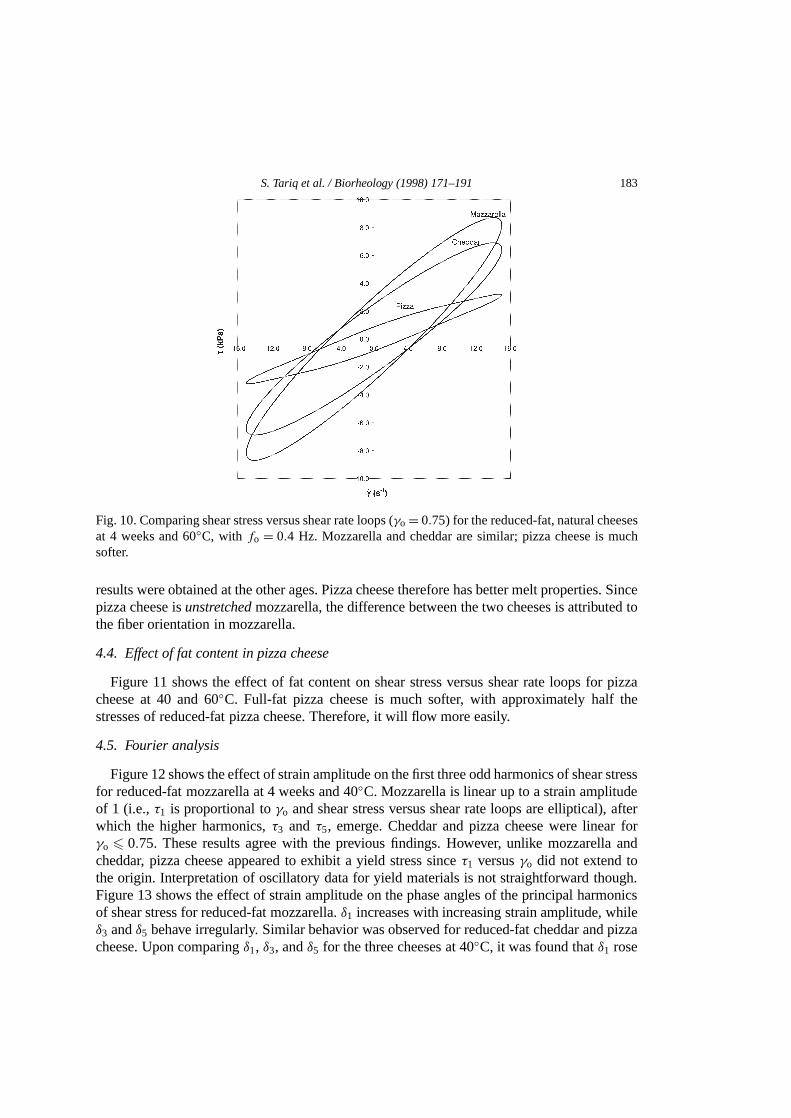
Figure 10 compares shear stress versus shear rate loops for 4 week old reduced-fatmozzarella, cheddar, and pizza cheese at 40 and 60◦C. Mozzarella and cheddar have similarshapes and stresses, while pizza cheese is much softer with significantly lower stresses. Similar
S. Tariq et al. / Biorheology (1998) 171–191 183
Fig. 10. Comparing shear stress versus shear rate loops (γo= 0.75) for the reduced-fat, natural cheesesat 4 weeks and 60◦C, with fo = 0.4 Hz. Mozzarella and cheddar are similar; pizza cheese is muchsofter.
results were obtained at the other ages. Pizza cheese therefore has better melt properties. Sincepizza cheese isunstretchedmozzarella, the difference between the two cheeses is attributed tothe fiber orientation in mozzarella.
4.4. Effect of fat content in pizza cheese
Figure 11 shows the effect of fat content on shear stress versus shear rate loops for pizzacheese at 40 and 60◦C. Full-fat pizza cheese is much softer, with approximately half thestresses of reduced-fat pizza cheese. Therefore, it will flow more easily.
4.5. Fourier analysis
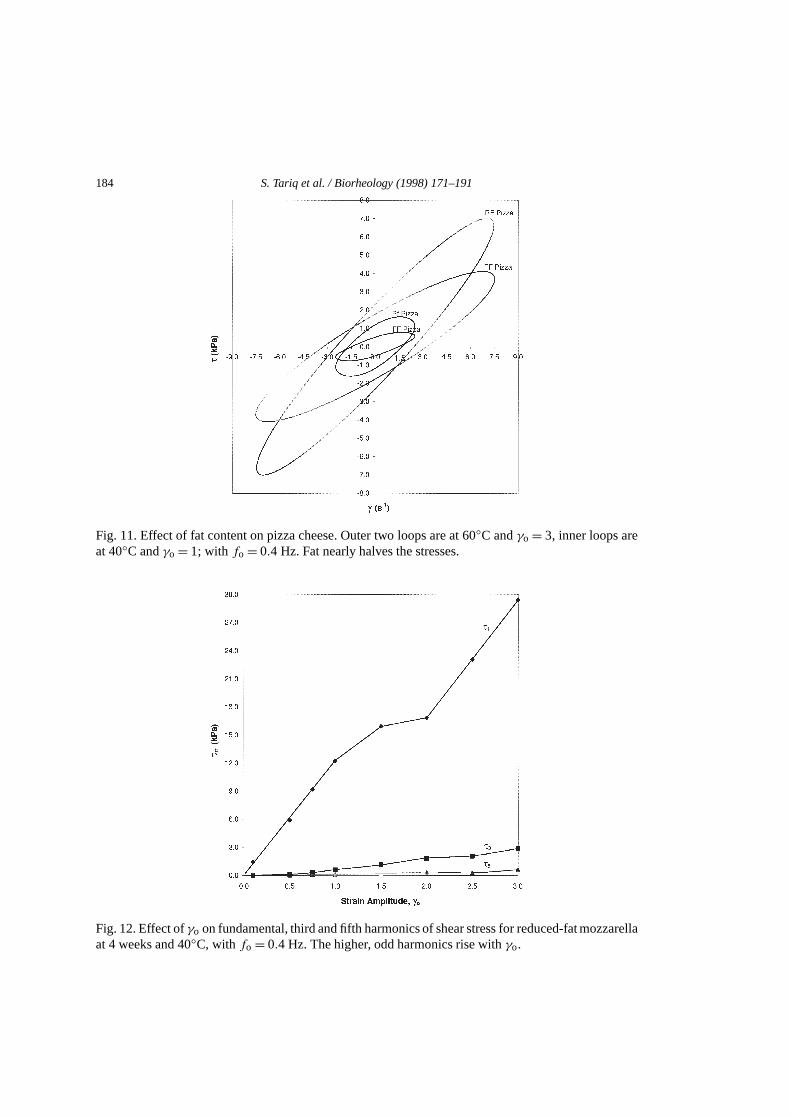
Figure 12 shows the effect of strain amplitude on the first three odd harmonics of shear stressfor reduced-fat mozzarella at 4 weeks and 40◦C. Mozzarella is linear up to a strain amplitudeof 1 (i.e.,τ1 is proportional toγo and shear stress versus shear rate loops are elliptical), afterwhich the higher harmonics,τ3 and τ5, emerge. Cheddar and pizza cheese were linear forγo 6 0.75. These results agree with the previous findings. However, unlike mozzarella andcheddar, pizza cheese appeared to exhibit a yield stress sinceτ1 versusγo did not extend tothe origin. Interpretation of oscillatory data for yield materials is not straightforward though.Figure 13 shows the effect of strain amplitude on the phase angles of the principal harmonicsof shear stress for reduced-fat mozzarella.δ1 increases with increasing strain amplitude, whileδ3 andδ5 behave irregularly. Similar behavior was observed for reduced-fat cheddar and pizzacheese. Upon comparingδ1, δ3, andδ5 for the three cheeses at 40◦C, it was found thatδ1 rose
184 S. Tariq et al. / Biorheology (1998) 171–191
Fig. 11. Effect of fat content on pizza cheese. Outer two loops are at 60◦C andγo= 3, inner loops areat 40◦C andγo= 1; with fo= 0.4 Hz. Fat nearly halves the stresses.
Fig. 12. Effect ofγo on fundamental, third and fifth harmonics of shear stress for reduced-fat mozzarellaat 4 weeks and 40◦C, with fo= 0.4 Hz. The higher, odd harmonics rise withγo.

S. Tariq et al. / Biorheology (1998) 171–191 185
Fig. 13. Effect ofγo on the phase angles of the principal harmonics of shear stress for reduced-fatmozzarella at 4 weeks and 40◦C, with fo= 0.4 Hz.δ1 rises withγo, while δ3 andδ5 are not monotonicwith γo.
Fig. 14. Comparing phase angles of the fifth harmonic (δ5 ) for the reduced-fat, natural cheeses at4 weeks and 40◦C, with fo = 0.4 Hz. δ5 for all cheeses follow a similar trend, with mozzarella andcheddar almost overlapping atγo/γmax> 0.4.
186 S. Tariq et al. / Biorheology (1998) 171–191
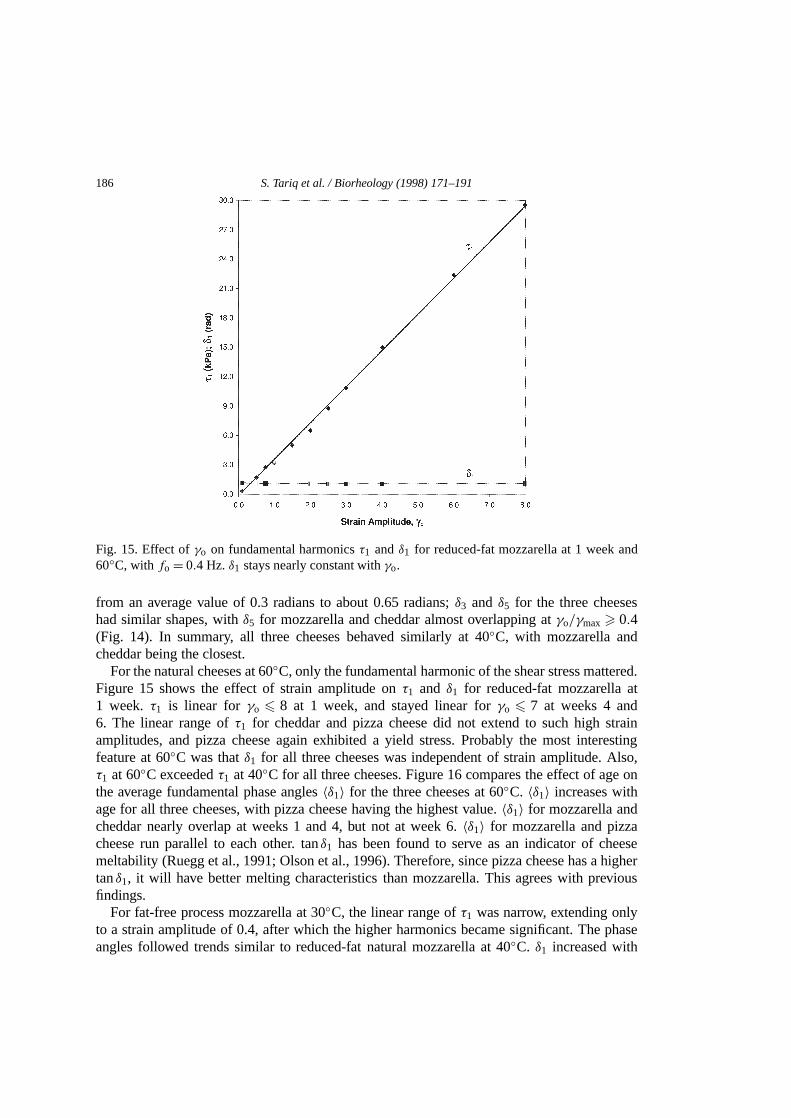
Fig. 15. Effect ofγo on fundamental harmonicsτ1 andδ1 for reduced-fat mozzarella at 1 week and60◦C, with fo= 0.4 Hz.δ1 stays nearly constant withγo.
from an average value of 0.3 radians to about 0.65 radians;δ3 and δ5 for the three cheeseshad similar shapes, withδ5 for mozzarella and cheddar almost overlapping atγo/γmax> 0.4(Fig. 14). In summary, all three cheeses behaved similarly at 40◦C, with mozzarella andcheddar being the closest.
For the natural cheeses at 60◦C, only the fundamental harmonic of the shear stress mattered.Figure 15 shows the effect of strain amplitude onτ1 and δ1 for reduced-fat mozzarella at1 week. τ1 is linear for γo 6 8 at 1 week, and stayed linear forγo 6 7 at weeks 4 and6. The linear range ofτ1 for cheddar and pizza cheese did not extend to such high strainamplitudes, and pizza cheese again exhibited a yield stress. Probably the most interestingfeature at 60◦C was thatδ1 for all three cheeses was independent of strain amplitude. Also,τ1 at 60◦C exceededτ1 at 40◦C for all three cheeses. Figure 16 compares the effect of age onthe average fundamental phase angles〈δ1〉 for the three cheeses at 60◦C. 〈δ1〉 increases withage for all three cheeses, with pizza cheese having the highest value.〈δ1〉 for mozzarella andcheddar nearly overlap at weeks 1 and 4, but not at week 6.〈δ1〉 for mozzarella and pizzacheese run parallel to each other. tanδ1 has been found to serve as an indicator of cheesemeltability (Ruegg et al., 1991; Olson et al., 1996). Therefore, since pizza cheese has a highertanδ1, it will have better melting characteristics than mozzarella. This agrees with previousfindings.
For fat-free process mozzarella at 30◦C, the linear range ofτ1 was narrow, extending onlyto a strain amplitude of 0.4, after which the higher harmonics became significant. The phaseangles followed trends similar to reduced-fat natural mozzarella at 40◦C. δ1 increased with

S. Tariq et al. / Biorheology (1998) 171–191 187
Fig. 16. Effect of age onaveragefundamental phase angles (〈δ1〉) for the reduced-fat, natural cheesesat 6 weeks and 60◦C, with fo= 0.4 Hz. 〈δ1〉 increases with age for all three cheeses.
increasing strain amplitude, while the higher harmonics,δ3 andδ5, were irregular with shapessimilar to natural mozzarella.
4.6. Comparisons to the Lodge rubberlike liquid
The discrete relaxation spectrum for select cheeses was calculated from SAOS test datausing parsimonious modeling. To expose the departures from linearity, we decided tonormalize the shear stress with the Lodge rubberlike liquid prediction:
τ(t)
τo= τ(t)
γo
√(G′)2+ (G′′)2 (14)
A peak value ofτ(t)/τo falling below one indicated nonlinear behavior.For 6 week old reduced-fat mozzarella and cheddar at 40 and 60◦C, four to six(Gi, λi) pairs
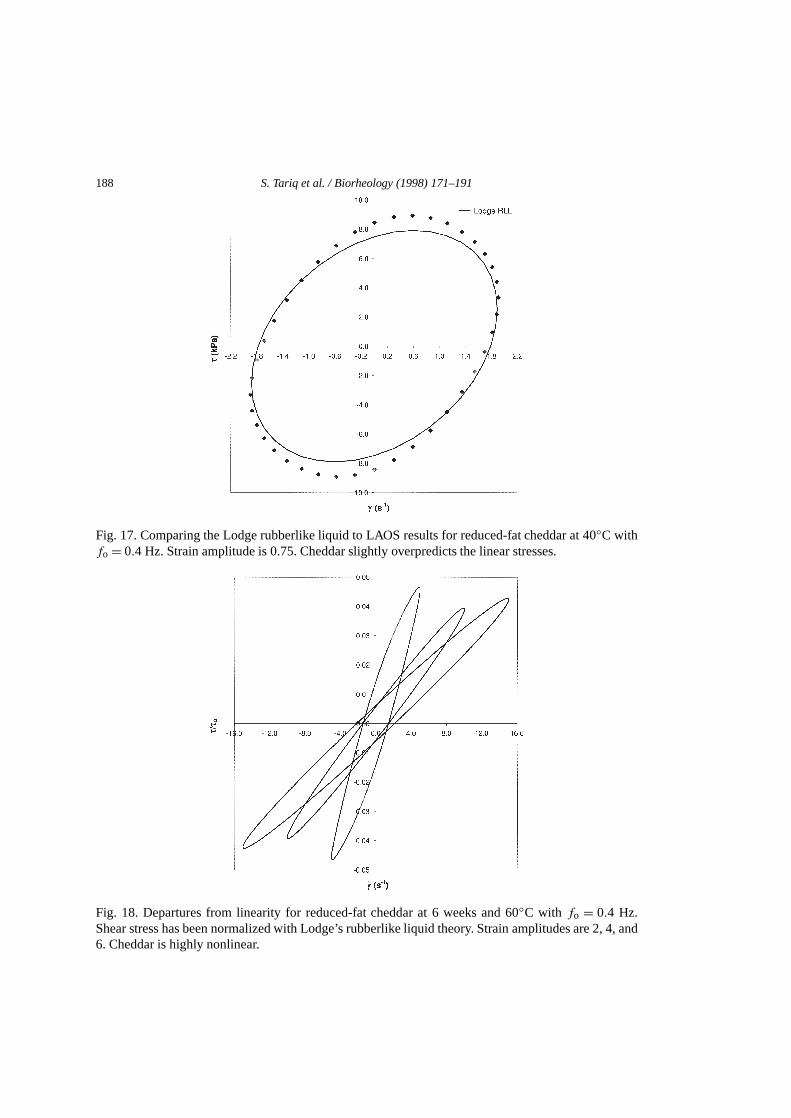
sufficed to fit experimental data reasonably. Figure 17 compares the Lodge rubberlike liquidto LAOS results for reduced-fat cheddar at 40◦C. There is reasonable agreement. Cheddar wasalmost linear at 40◦C, though it slightly over predicted the stresses; but at 60◦C it was highlynonlinear, predicting only 4–5% of the linear stresses (Fig. 18). Unlike cheddar, mozzarellawas nonlinear at 40◦C, predicting 24–40% of the linear stresses. At 60◦C, mozzarella becamehighly nonlinear, predicting only 8–12% of the linear stresses. Therefore, although the shearstress versus shear rate loops for both cheeses are elliptical at 60◦C, they are still highlynonlinear. We are unaware of any constitutive equation that predicts nonlinearity without loopdistortion.
188 S. Tariq et al. / Biorheology (1998) 171–191
Fig. 17. Comparing the Lodge rubberlike liquid to LAOS results for reduced-fat cheddar at 40◦C withfo= 0.4 Hz. Strain amplitude is 0.75. Cheddar slightly overpredicts the linear stresses.
Fig. 18. Departures from linearity for reduced-fat cheddar at 6 weeks and 60◦C with fo = 0.4 Hz.Shear stress has been normalized with Lodge’s rubberlike liquid theory. Strain amplitudes are 2, 4, and6. Cheddar is highly nonlinear.

S. Tariq et al. / Biorheology (1998) 171–191 189
Fig. 19. Departures from linearity for fat-free process mozzarella at 30◦C with fo = 0.25 Hz. Shearstress has been normalized with Lodge’s rubberlike liquid theory. Strain amplitudes are 0.3, 0.8, and1.4. Process mozzarella is highly nonlinear.
For fat-free process mozzarella at 30 and 35◦C, five to nine(Gi, λi) pairs sufficed to fitexperimental data reasonably. Fat-free process mozzarella was highly nonlinear (Fig. 19) atboth test temperatures, and this behavior resembled reduced-fat natural mozzarella.
5. Conclusion
LAOS adequately measured the nonlinear viscoelasticity of cheese, and spectral analysisproved useful in characterizing and comparing the different cheese types. Natural mozzarella,pizza cheese, and cheddar demonstrated similar behavior in both the melted and solid states.They exhibited a strong structure with good shearing properties at 60◦C, but not at 40◦C. Theloops were elliptical at all strain amplitudes at 60◦C, but highly nonlinear when comparedto the Lodge rubberlike liquid. Pizza cheese was softer than mozzarella, with better meltproperties. The difference between the two cheeses was attributed to fiber orientation inmozzarella. All three natural cheeses softened with age due to proteolysis, thus weakeningthe structure and improving flow properties. Process fat-free mozzarella was much softercompared to the natural cheeses, and highly nonlinear. Fat reduction in pizza cheese roughlydoubled the stress amplitudes. This underscores the contemporary industrial challenge offormulating reduced-fat pizza cheese while matching its texture to full-fat pizza cheese.
LAOS was therefore extremely useful in evaluating and comparing cheese rheologies.However, work is needed in overcoming slip at 40◦C, so that large strain behavior canbe studied. More work is also needed in understanding how nonlinear viscoelasticityaffects cheese texture. Other constitutive theories should also be evaluated to gain a better
190 S. Tariq et al. / Biorheology (1998) 171–191
understanding of the nature of cheese in relation to its chemical and physical structure. Thereare no known constitutive equations that predict intersecting loops (such as those in Figs. 7 and8), and none that predict nonlinearity without loop distortion (i.e., strain amplitude dependentloops that remain elliptical).
Mozzarella mixing during manufacture employs open discharge single screw extrusion,and classical screw design requires only the steady shear viscosity curve (Baird and Collias,1995). In the plastics industry, the Cox–Merz rule is frequently used to obtain the steady shearviscosity:
η(γ̇ )= ∣∣η∗(ω)∣∣; ω= γ̇ , (15)
where |η∗(ω)| is the complex viscosity. In future work, the relationship betweenη(γ̇ ) and|η∗(ω)| for molten mozzarella should therefore be explored experimentally.
Acknowledgement
The authors acknowledge Professor Norman F. Olson and Dr Ya-Chun Wang for their helpfulsuggestions. Financial support was provided by the Wisconsin Center for Dairy Research.
References
Baird DG, Collias DI. Polymer Processing: Principles and Design. Newton, Massachusetts:Butterworth–Heinemann; 1995.
Caric M, Kalab M. Processed cheese products. In: Cheese: Chemistry, Physics and Microbiology.Volume 2. Fox PF, Ed., London: Chapman & Hall; 1993. pp. 467–505.
Dealy JM, Wissbrun KF. Melt Rheology and Its Role in Plastics Processing. New York: Van NostrandReinhold; 1990.
Dealy JM. US Patent No 4 464 928. 14 August 1984.Farkye NY, Fox PF. Objective indices of cheese ripening. Trends in Food Science & Technology,
1990;1:37–40.Ferry JD. Viscoelastic Properties of Polymers. 3rd Ed., New York: John Wiley; 1980.Fox PF. Cheese: an overview. In: Cheese: Chemistry, Physics and Microbiology. Volume 1. Fox PF,
Ed., London: Chapman & Hall; 1993. pp. 1–36.Giacomin AJ, Dealy JM. Large-amplitude oscillatory shear. In: Techniques in Rheological Measure-
ment. Collyer AA, Ed., London, New York: Chapman and Hall; 1993. pp. 99–121.Giacomin AJ, Samurkas T, Dealy JM. A novel sliding plate rheometer for molten plastics. Polymer
Engineering Science, 1989;29:499–504.Hatzikiriakos SG, Dealy JM. Wall slip of molten high density polyethylene. I. Sliding plate rheometer
studies. Journal of Rheology, 1991;35:497–523.Holsinger VH, Smith PW, Tunick MH. Overview: cheese chemistry and rheology. In: Chemistry of
Structure-Function Relationships in Cheese. Malin EL, Tunick MH, Eds., New York: Plenum Press;1995. pp. 1–6.
Kindstedt PS. Mozzarella and pizza cheese. In: Cheese: Chemistry, Physics and Microbiology.Volume 2. Fox PF, Ed., London: Chapman & Hall; 1993. pp. 337–362.
Lodge AS. Elastic Liquids. New York: Academic Press; 1964.Ma L, Drake MA, Barbosa-Canovas GV, Swanson BG. Viscoelastic properties of reduced-fat and full-
fat cheddar cheese. Journal of Food Science, 1996;61:821–823.

S. Tariq et al. / Biorheology (1998) 171–191 191
Olson NF. Cheese. In: Biotechnology: Enzymes, Biomass, Food and Feed. 2nd Ed., Volume 9.Rehm H-J, Reed G, Eds., VCH Weinheim; 1995. pp. 353–384.
Olson NF, Gunasekaran S, Bogenrief DD. Chemical and physical properties of cheese and theirinteractions. Netherlands Milk & Dairy Journal, 1996;50:279–294.
Onogi S, Matsumoto T. Rheological properties of polymer solutions and melts containing suspendedparticles. Polymer Engineering Reviews, 1981;1:45–87.
Pipkin AC. Lectures in Viscoelastic Theory. New York: Springer-Verlag; 1972.Ruegg M, Eberhard P, Popplewell LM, Peleg M. Melting properties of cheese. In: International Dairy
Federation. Bull. 268. Brussels, Belgium; 1991. pp. 36–43.Tanner RI. Engineering Rheology. Oxford: Oxford University Press; 1985.Tariq S. Measuring nonlinear viscoelasticity of cheese using oscillatory shear. MS Thesis. University
of Wisconsin–Madison; 1998.Tee TT, Dealy JM. Nonlinear viscoelasticity of polymer melts. Transactions of The Society of Rheol-
ogy, 1975;19:595–615.Tunick MH, Nolan EJ. Rheology of cheese. In: Physical Chemistry of Food Processes. Volume I:
Fundamental Aspects. Baianu IC, Ed., New York: Van Nostrand Reinhold Co.; 1992. pp. 273–290.Winter HH, Baumgaertel M, Soskey PR. A parsimonious model for viscoelastic liquids and solids. In:
Techniques in Rheological Measurement. Collyer AA, Ed., London, New York: Chapman & Hall;1993. pp. 123–160.