nonprofit leadership: a study of governance changes over time
TRANSCRIPT

Publications
5-2015
Nonprofit leadership: A Study of Governance Changes over Time Nonprofit leadership: A Study of Governance Changes over Time
Daisha M. Merritt Embry-Riddle Aeronautical University, [email protected]
Follow this and additional works at: https://commons.erau.edu/publication
Part of the Business Administration, Management, and Operations Commons, Leadership Studies
Commons, and the Organizational Behavior and Theory Commons
Scholarly Commons Citation Scholarly Commons Citation Merritt, D. M. (2015). Nonprofit leadership: A Study of Governance Changes over Time. , (). Retrieved from https://commons.erau.edu/publication/1491
This Dissertation is brought to you for free and open access by Scholarly Commons. It has been accepted for inclusion in Publications by an authorized administrator of Scholarly Commons. For more information, please contact [email protected].

Nonprofit leadership: A study of governance changes over time
Daisha M. Merritt
A dissertation submitted to the Graduate Faculty of
JAMES MADISON UNIVERSITY
In
Partial Fulfillment of the Requirements
for the degree of
Doctor of Philosophy
School of Strategic Leadership Studies
May 2015

ii
Dedication
I dedicate my dissertation work to all those students out there still working to find
a topic and to those who are standing beside me being hooded. A special feeling of
gratitude to my family: Mom you always provided me with words of encouragement and
sentiments of love.

iii
Acknowledgements
I would like to give thanks and appreciate to my committee for their continued
support and encouragement: Dr. Margaret F. Sloan, my committee chair; Dr. Karen A.
Ford, director of the School of Strategic Leadership Studies, Dr. Lori Britt; Dr. Katrina
Miller-Stevens; and Dr. Natalie Ammarell. I offer my sincere appreciation for the
learning opportunities provided by my committee.
My completion of this dissertation could not have been accomplished without the
academic, moral, and encouraging support of the students in the School of Strategic
Leadership Studies. To Dr. Jodi Hagen, a graduate of the SSLS for helping me with
library database issues and data mining. To Brooke Rhodes, coordinator of students at the
SSLS, her every timely and supportive words, emails, and genuine being provided
positive daily support.
Finally, to my loving, supportive, and always there for me family, I Love You.
Mom and The Bakers, you always had an ear to listen and gave me positive daily
affirmations and unwavering support. Your encouragement when the times got rough are
much appreciated. It was a blessing of comfort and relief to know that you were there for
me.

iv
Table of Contents
Dedication ......................................................................................................ii
Acknowledgements ........................................................................................iii
List of Tables .................................................................................................vii
List of Figures ................................................................................................ix
Abstract ..........................................................................................................x
Chapter 1
Introduction ........................................................................................1
Defining the Nonprofit Sector ...........................................................3
The Nonprofit Sector Today ..............................................................7
Sarbanes-Oxley ..................................................................................8
Implications of Sarbanes-Oxley for the Nonprofit Organization ......10
Independent and competent audit committee ....................................11
Responsibilities of auditors ................................................................12
Certified financial statements ............................................................12
Insider transactions and conflicts of interest ......................................13
Disclosures .........................................................................................13
Whistle-blower protection .................................................................14
Document destruction ........................................................................14
Problem and Research Statement.......................................................17
Chapter 2
Literature and Theory ........................................................................19
Organizational Change Leadership ....................................................19

v
Nonprofit Governance .......................................................................22
Institutionalism ..................................................................................25
New Institutionalism ..........................................................................27
Institutional Isomorphism ..................................................................28
Research Question .............................................................................29
Hypotheses .........................................................................................30
Chapter 3
Methodology ......................................................................................32
Sample and Selection .........................................................................33
Phase One...........................................................................................38
Data Mining .......................................................................................39
Phase Two ..........................................................................................40
Factor analysis theory ........................................................................40
Interpretation of the factor analysis ...................................................41
Factor Analysis .................................................................................42
Composite governance variables .......................................................46
Phase Three ........................................................................................47
Chapter 4
Results ................................................................................................53
Trend Analysis ...................................................................................53
Dependent variables ...........................................................................53
T-test ..................................................................................................55
Regression Models .............................................................................56

vi
Robustness Tests ................................................................................60
Categorization of reported governance ..............................................63
T-tests .................................................................................................65
Chapter 5
Discussion ..........................................................................................67
Limitations .........................................................................................68
Generalizability ..................................................................................71
Conclusion .........................................................................................72
Implications........................................................................................76
Further Research ................................................................................77
Conclusion Summary .........................................................................78
Endnotes .........................................................................................................80
Appendix ........................................................................................................81
References ......................................................................................................91

vii
List of Tables
Multi-phase sequential quantitative research design .....................................3/32
IRS 990 tax form nonprofit governance measures ........................................16
Means, standard deviations, and correlations of independent variables ........35
Means, standard deviations, and correlations of dependent variables ...........35
Mean total net assets ......................................................................................37
Mean number of board members ...................................................................37
Factor analysis component matrix .................................................................45
Policy, documentation, and auditing components .........................................46
Descriptive statistics for dependent change governance variables ................47
Phase 3 ...........................................................................................................50
Variable construction .....................................................................................51
Trend analysis
Reported governance changes ............................................................54
Changes over-time in governance practices ......................................55
T-test
T-test, comparison of 2008 reported governance practices
with 2012 ...........................................................................................56
Regression models
Regression analysis summary for measures predicting changes in:
All governance variables....................................................................58
Policy governance variables ..............................................................58
Documentation governance variables ................................................59

viii
Auditing governance variables ..........................................................59
Robustness tests
Regression analysis summary for measure predicting changes in:
All governance variables, full dataset ................................................60
Policy governance variables, full dataset ...........................................62
Documentation governance variables, full dataset ............................62
Auditing governance variables, full dataset .......................................63
Descriptive statistics for organizations that reported no changes in governance policies
and practices...................................................................................................64
Descriptive statistics for organizations that reported no changes in governance policies
and practices:
High category .....................................................................................64
Low category .....................................................................................65
T-test, comparison of high/low reported governance groups:
Mean age ............................................................................................66
Meat total net assets ...........................................................................66

ix
List of Figures
IRS 990 tax form, Parts VI and XII ...............................................................81
Isomorphic Institutionalism diagram .............................................................83
Winsorization ................................................................................................84
Means, standard deviations, and correlations of independent variables,
entire dataset ..................................................................................................85
Factor analysis extracted components
2008....................................................................................................86
2009....................................................................................................87
2010....................................................................................................88
2011....................................................................................................89
2012....................................................................................................90

x
Abstract
This is a leadership study understood through board governance in nonprofit
organizations. The study sought to discover if there were indicators of coercive
institutional isomorphism occurring in human service nonprofit organizations in the
United States. IRS 990 tax forms were compiled from 2008- 2012 to determine if there
were increasing levels of reported governance practices. Methodology included factor
analysis, comparison of means, trend analysis, and regression models. Results indicated
that there is an overall trend of increasing reported practices of governance in human
service nonprofit organizations. Board size is the most significant indicator associated
with changes in reported governance practices. Additionally, there is some support for
age and total net assets as isomorphic institutional indicators of change. Discussion and
conclusion remarks delve further into reasoning and unpacking of reported governance
trends over time with emphasis placed on the leadership implications.
Keywords: nonprofit governance, institutional isomorphism, coercive isomorphism,
factor analysis, regression, trend analysis, organizational leadership

Chapter 1
Introduction
The nonprofit sector in America has expanded and grown in form, function, and
orientation. Literature on America’s nonprofit sector has exploded in recent years.
Nonprofit organizations play a significant role in the American economy and the social
structure of daily life. The birth of the nonprofit sector came from the need for diversity
and variance in preferences as well as distrust, un-faithfulness, and lack of resources from
the public (government) and private (business) sectors. Differences between the sectors
(public, private, nonprofit) are at times, significant. And, at other junctures, they are
blurred and intertwined. Nonprofit organizations are mission driven and value based
verses for-profit ventures that are power and profit driven. Academic and practitioner
based nonprofit research has mushroomed and best practices and comparative processes
are plentiful in scholarly publications. The nonprofit field has swelled due to the growing
heterogeneous population with diverse needs and interests, in addition to skepticism and
failures of government, political systems, and social ideologies (Smith, 1991). Doctoral
dissertations and scholarly organizations have assisted in the expansion of know-how and
knowledge within the field, while delving deeper into questions about the nonprofit
sector. These include: How to define nonprofit? What makes it distinct? Is there historical
evidence for the existence and presence of the nonprofit sector? All of these questions
have multiple purposes but one factor in common; they seek to understand the nonprofit
sector from a leadership perspective. Nonprofit leadership is not a new or even a newly
minted concept; it is the linchpin to the strength, perseverance, and success of the
nonprofit sector.

2
Through quantitative research, the focus of my dissertation, on nonprofit
leadership, endeavors to understand leadership through reported governance policies,
practices, and procedures. Specifically, the purpose of this dissertation is to research,
uncover, and discuss any possible changes of reported governance policies, practices, and
procedures in the nonprofit sector as a possible result of coercive isomorphic changes
(DiMaggio & Powell, 1983). Supported by the foundational theory of institutionalism, I
aim to discover if coercive isomorphism is changing governance practices in human
service nonprofit organizations. My study hypothesizes that there will be increases in
reported governance practices over time and less changes in reported governance
practices in large or older organizations. In order to test and understand my research
question, I am structuring my dissertation as follows: 1) first a section focused on the
nonprofit sector, including what defines the sector and what challenges it faces today, this
sets the stage for a focus on governance in nonprofit organizations; 2) then a discussion
on current literature and theory focused on nonprofit governance is presented; 3)
followed by a focus on institutionalism and institutional isomorphism with an emphasis
on coercive isomorphism.
My research design follows a multi-phase sequential quantitative approach (Table
1) that seeks to uncover statistical evidence regarding coercive isomorphic changes
happening over time in human service nonprofit organizations in the United States. The
research design consists of three distinct phases: phase one involves data mining and data
collection, phase two presents an exploratory factor analysis (EFA), and phase three
offers methodology which is directly tied to both parts of the hypothesis, resulting in
computation and interpretation of trend analysis, t-tests, and multiple regression models.

3
Following the method section are results which indicate support of the hypothesis that
organizations are reporting increased practices of governance policies, practices, and
procedures over time. Results also support that larger and older organizations report more
consistent governance practices. These larger and older organizations also exhibit fewer
changes to their governance policies and practices over time. Finally, a conclusion
discusses the results and explains an inability to account for all aspects of governance,
while also discussing the study’s limitations, implications, and generalizability. Also
offered in the conclusion, are future research ideas for furthering this line of inquiry as
well as supporting the need for more publically available nonprofit data. It is my hope as
a nonprofit researcher to be able to translate evidence supported research into practical
guides or best practice options for the daily practitioner. My dissertation, focused on
nonprofit leadership understood through reported governance is my first step to fulfill this
endeavor.
Table 1
Multi-phase sequential quantitative research design
Phases
1 Data Mining IRS 990 Tax forms
2 Factor Analysis Extracted Components
3 Trend graphing
T-test
Regression Model
Hypotheses: H1a & H1b
Defining the Nonprofit Sector
The nonprofit sector is comprised of social benefit organizations that are not
government oriented or profit driven (IRS). Other names that are often used are third
sector, not-for-profit, independent, or voluntary sector (Powell & Steinberg, 2006).
Unpacking these definitions and delving into distinctions that make charitable

4
organizations different can often be understood through characteristics and traits.
Leadership within an organization is the pivotal component to ensuring that the
organization is following legal mandates, as well as organizational vision, mission, and
purpose.
Offering a concise definition for the nonprofit sector is difficult and potentially
misleading. The definition offered here presents the essence of the nonprofit sector in
America, understood through a positive notion of what the sector can do and how it is
situated; rather than the normal route of defining, that focuses on limitations, lack of
abilities, and offering negative connotations. For the purpose of this study, the definitions
laid out will allow the reader to garner the spirit of the nonprofit sector through a focus
on positive characteristics and values.
The nonprofit sector is a product of the history of the United States of America
(Gies, 1990). The emergence of the colonial era helped develop the rise of the nonprofit
sector. The need for the growth in the social fabric of America was due to the sheer desire
for survival that could only be gained through trust and reciprocity with your neighbor.
The rise of associations and associational life originated in the colonial era in order to
offer mutual assistance and increase the distribution of resources between neighbors (Ott
& Dicke, 2012). Immediately following the American colonial era, writer and traveler
Alexis de Tocqueville adventured to America from France to discover and qualitatively
analyze America’s 19th
century society. Tocqueville observed that the social fabric of
America was based on associational life, enabling the banding together of citizens with
similar issues, passions, and problems. The nonprofit sector is defined by Tocqueville as
the “social state… [that] is essentially democratic” (pg. 52, 1835). Continuing to

5
understand that the nonprofit sector as a product of history, we can use these definitions,
parameters of distinction, and differential qualities to delineate the social benefit
organizations from government and for-profit businesses.
Developing a definition of the nonprofit sector is a long and arduous process.
Thanks to several researchers (Smith, 1991, 1994; Smith, Stebbins, & Dover, 2006), the
nonprofit sector has been defined through what constitutes a nonprofit organization
including its legalities, functional purpose, and operational structure. Though the
following criteria is not exhaustive, it offers characteristics that lead to aid the legally
constituted, nongovernmental entities that are incorporated under state law as social
benefit corporations. All nonprofit organizations require the following qualities (Salamon
& Anheier, 1997):
Public service mission
Organized as a nonprofit/charitable organization
Cannot have self-interest or private financial gains
Exempt from paying federal tax
Offer tax-exempt donations/ gifts
Major categories of nonprofit organizations are defined through the National Taxonomy
of Exempt Entities (NTEE) system, which is used by the Internal Revenue Service (IRS),
the Foundation Center, and the National Center for Charitable Statistics (NCCS). The
NCCS is the national clearinghouse for data on nonprofit organizations in the United
States. The NTEE system was developed in the 1980s in order to offer a way to
“facilitate collection, tabulation, presentation, and analysis of data… promote
uniformity and comparability in the presentation of statistical and other data…

6
provide better quality information as the basis for public policy debate and
decision-making for the nonprofit sector and for society at large” (Sumariwalla,
1986).
The NTEE codes include 26 major group classifications that are organized into 10
categories:
I. Arts, Culture, and Humanities
II. Education
III. Environment and Animals
IV. Health
V. Human Services
VI. International, Foreign Affairs
VII. Public, Societal Benefit
VIII. Religion Related
IX. Mutual/ Membership Benefit
X. Unknown, Unclassified
NTEE codes are essential to nonprofit research as they offer a numeric, alphabetic, and in
most circumstances a digital footprint to verify data. For the purpose of this study, NTEE
codes will play a major part in understanding and upholding uniformity to the study
results.
All of these varied organizations make up America’s nonprofit sector. Though the
idea and definition of the nonprofit sector may be vague and opaque, the role of the
nonprofit sector in society is tangible and purposeful.

7
The Nonprofit Sector Today
The term nonprofit organization tends to bring images of small struggling co-ops
to mind, however the nonprofit sector today is as much a part of the national economy as
the department store where you buy your suit or the grocery store where you buy coffee.
Assets from America’s nonprofit organizations total over $4 trillion (IRS, 2013). It is
through strong and informed leadership that the nonprofit sector has grown to become
such an integral part of the national economy.
There are approximately 1.44 million nonprofit organizations registered with the
IRS (2013), which is an increase of over 8 percent from 2002 (The Nonprofit Sector in
Brief, 2014). Over 5.4 percent of the US gross domestic product (GDP) is from 501c3
organizations resulting in the sector’s contribution of over $880 billion (The Nonprofit
Sector in Brief, 2014). Included in the 1.44 million nonprofits is a diverse group of
organizations, both in mission and size. Public charities account for over 75 percent of
the sector’s revenues, expenses, and assets (NCCS, 2012). In 2013, total private giving
reached over $335 billion, signaling an increase of over 4 percent from 2002 (The
Nonprofit Sector in Brief, 2014). However, according to Giving USA, philanthropic
giving is lower than its peak in 2007, prior to the recession. In 2013, 25 percent of adults
volunteered, which led to the contribution of 8.1 volunteer hours per person in 2013, this
is also down from pre-recession time (The Nonprofit Sector in Brief, 2014).
In order to classify as a nonprofit, an organization must comply with the
previously stated characteristics, as well as state regulations. The IRS is the governing
body who imposes regulations on 501c3 organizations. In 2011, over 200,000 nonprofits
lost their tax-exempt status because of their failure to comply with regulations (Urban

8
Institute, 2012). Of those 200,000 organizations, 50 percent were human service or public
benefit organizations (NTEE major code V & VII). Along with the classification of the
nonprofit sector, there are environmental influences such as political and legal issues.
Sarbanes-Oxley
Nonprofit organizations, as mentioned previously offer concrete and recognizable
services in society. The nonprofit sector was born out of the growth of a heterogeneous
society, the need for diverse interest, and as a reaction to government and for-profit
market shortcomings (Powell & Steinberg, 2006). This means, to a simplistic extent, that
nonprofits have grown to become a part of the nation’s economy and by extension, have
been impacted by the political, economic, and social decisions of the government and
private sectors. Nonprofit organizations and specifically their governance practices and
policies are influenced by legislation that occurs at the national level. It is the board of
directors’ and the leadership’s responsibility to determine the applicability of and ensure
the compliance with legal matters in nonprofit organizations.
In 2002, the Sarbanes-Oxley legislation came into force and introduced
substantial changes to the regulation of financial practices and corporate governance in
for-profit organizations. The Sarbanes-Oxley Act of 2002 is mandatory for all legally
registered, publically traded for-profit businesses. The Act is named after Senator Paul
Sarbanes and Representative Michael Oxley who conceived the structure and deadlines
associated with the legislation (SEC, 2002). The Act is constructed into 11 titles, in
regards to compliance; the sections that are most relevant to nonprofit organizations are
302, 401, 404, 409, 802, and 906 (SEC, 2002). President Bush signed the Act into law
July 30, 2002 stating that the Sarbanes-Oxley Act is “the most far reaching reform of
9
American business practices since the time of Franklin Delano Roosevelt” (SEC, 2002).
The Sarbanes-Oxley Act aims to rebuild public trust in the private sector, which came
about as a response to corporate scandals regarding accounting. It is a requirement for
publically traded companies to conform to the new standards of financial and auditing
proceduresi. The US law passed in 2002 aims to strengthen corporate governance and
restore consumer confidence. The Sarbanes-Oxley act directly affects publically traded
companies and places regulations on what companies must do to ensure auditors’
independence. Furthermore, the Act dictates the process for electing competent audit
committee members and ensuring adequate reporting procedures. The Act also closes
most of the loopholes relating to document destruction and whistler-blower protection.
This applies to both for-profit and nonprofit entities. As previously stated, there are 11
titles to Public Law 107-204, 107th
Congress, Sarbanes-Oxley Act:
I. Public Company Accounting Oversight Board
II. Auditor Independence
III. Corporate Responsibility
IV. Enhanced Financial Disclosures
V. Analyst Conflicts of Interest
VI. Commission Resources and Authority
VII. Studies and Reports
VIII. Corporate and Criminal Fraud Accountability
IX. White-Collar Crime Penalty Enhancements
X. Corporate Tax Returns
XI. Corporate Fraud and Accountability

10
The Act addresses insider transactions and conflicts of interest, independent and
competent audit committees, responsibilities of auditors, certification of financial
statements, disclosures, whistle-blower protection, and document destruction (SEC,
2002). Additionally, within the written law, there are definitional parameters that set the
stage for understanding the who, what, when, and why of the specific regulations and
appropriate applications. The law focuses on American publically traded corporations;
however, two specific compliances apply to nonprofit organizations: document
destruction and whistle-blower protection (SEC, 2002). Additionally, organizations such
as Board Source and the Independent Sector assert that there are several aspects of the
law that can and should apply to the nonprofit sector (Board Source, 2003; 2006). In their
joint publication The Sarbanes-Oxley Act and Implications for Nonprofit Organizations,
2003/2006, Board Source and the Independent Sector offer recommendations that
nonprofits voluntarily incorporate provisions of the act that make good governance sense.
Implications of Sarbanes-Oxley for the Nonprofit Organization
Implications for nonprofits derived from the 2002 Act include recommendations
on promoting effective oversight that include having a conflict of interest statement,
ensuring there is an audit committee, certifying financial statements, procedures for
destruction of documents, policies for whistle-blower protection, and having written
disclosures for committee members-specifically the audit committee. It is the board of
directors and the leadership’s responsibility to determine the applicability of and ensure
the compliance of legal matters within nonprofit organizations. The following is a review
of the Sarbanes-Oxley Act, how the provisions affect nonprofit leadership, and
recommendations for implementation.

11
Independent and competent audit committee. The Act requires that there be
audit committees and that each member of the audit committee be a member of the board.
They also must be independent, defined as not being part of the management team and
not receiving compensation. This provision also states that there needs to be a disclosure
of at least one “financial expert” that serves on the audit committee. However, a
definition for financial expert is not specified. This section also outlines that the audit
committee is responsible for hiring, setting compensation, and overseeing the auditor’s
activities. Furthermore, the audit committee should explicitly set rules, procedures, and
practices. The relevance to nonprofit boards includes the recommendation that they
establish audit committees. These could be formed through financial committees. It also
lays out the good practice of establishing independent audits and complete review of
auditing practices.
Many states have taken it upon themselves to regulate nonprofit auditing practices
through the attorney general’s office. For example in California, the state legislation
passed the Nonprofit Integrity Act of 2004, which stipulates that nonprofit organizations
whose revenues exceed $2 million must have an independent auditor (California's
Nonprofit Integrity Act, 2004). However, not all nonprofits are required to undertake a
full audit and place the responsibility on their board of directors. Several nonprofits have
outside requirements for completing audits. Nonprofit organizations that receive over
$500,000 from federal funds are automatically required to complete audits as laid out by
their grant contract (Board Source, 2003). It is highly recommended that the governance
boards take the time to determine the cost-benefit of conducting audits, both internal and
independent audits (Board Source, 2003). Moreover, both Board Source and The

12
Independent Sector strongly recommend that all nonprofit boards take the necessary steps
to complete an annual fiscal financial review. Even though most nonprofit board
members are volunteers, financial literacy should be included in board orientation (Board
Source, 2003). This section of the act also lends nicely to the suggestion that auditing
companies should consider offering pro-bono audits for social benefit organizations
(Independent Sector, 2009:2010).
Responsibilities of auditors. The Sarbanes-Oxley Act prohibits that auditing
companies from offering other financial services to the same organization. For example,
one company cannot be responsible for the bookkeeping, computer information systems,
appraisal services, human resources, etc. Additionally, the same individual or company
performing the audit must rotate every five years. Implications for nonprofit
organizations include changing auditors as laid out in the Act (SEC, 2002). It would also
be beneficial for nonprofit organizations to use different partners or firms for other
management responsibilities as well (bookkeeping, appraisal, etc.) (Board Source, 2003).
This section of the act also discusses relevant disclosures for internal controls and
practices (SEC, 2002). Again, Board Source and The Independent Sector (2003) suggest
that it would be beneficial to nonprofit organizations to include written disclosures in
their policies, which would thereby increase transparency.
Certified financial statements. Sarbanes-Oxley set forth the provisions that the
chief executive and chief financial officer must certify financial statements. This includes
certifying for appropriateness, operations, and fairness. Criminal sanctions are associated
with false certifications. Executive directors, board presidents, and the head of the
financial committee should independently review and certify the audit. This again
13
increases transparency as well as integrity within the nonprofit organization. A key
financial document for 501c3 organizations is the IRS 990 tax form (Appendix A). The
form requires a signature from leadership within the organization. Unfortunately,
research from a number of studies reveals that the accuracy of IRS 990 tax forms is low
and unreliable (Board Source, 2003). Many of these errors are directly related to failure
to complete the form, misinterpretation, or a lack of understanding of the form, as well as
the inaccurate reporting of fundraising costs and other financial expenditures (Jackson,
2007; Behn, DeVries, & Lin, 2007). These reporting errors support the provision laid out
that nonprofit leadership needs to examine and reexamine their financial statements for
accuracy, reliability, and completeness, which in turn should be appropriately recorded
and reported on the IRS 990 tax form.
Insider transactions and conflicts of interest. Sarbanes-Oxley prohibits loans to
company leadership and management. The nonprofit sector is already highly regulated
concerning monetary functions and transactions. State laws set forth that 501c3
organizations “cannot have self-interest or private financial gains” (Salamon & Anheier,
1997). Penalties are associated with private inurement and excessive personal benefit.
Therefore, providing loans to company leadership and management is not a specific issue
or concern of nonprofit organizations; however, it is recommended to continue the
practice of not lending monies to staff or board members.
Disclosures. Multiple disclosures are required for compliance to the Sarbanes-
Oxley Act. These include information on internal controls, correction of past financial
statements, material off balance sheet transactions, material changes in operations, and
financial situations. Nonprofits currently do not have to file these reports since they are

14
not publically traded. It is important that nonprofits provide this information on the IRS
990 tax form for their funders, donors, clients, media, and the general public. It is
required that 501c3 organizations make their IRS 990 tax form publically available and
free to anyone who requests them, either in writing or in person (IRS, 2008). This also
leads to the recommendation that nonprofit organizations should file their IRS 990 tax
form yearly and electronically. This increases nonprofit transparency and accountability
to the public.
Whistle-blower protection. The Sarbanes-Oxley Act set-forth protection for
whistle-blowers that has become an amendment to the federal criminal code. Whistle-
blowers are persons who risk their careers by reporting suspected illegal activities within
their organization of employment (Whistleblower, 2011).The Act allows for criminal
penalties for action taken in retaliation against whistle-blowers. Implications for the
nonprofit sector are straightforward, since this provision applies to all organizations –
for-profit and nonprofit. Nonprofit organizations need to start protecting themselves by
increasing professionalization and professional practices of accounting, human resources,
financial statements, bookkeeping, and board of directors meeting documentation.
Written policies are highly encouraged to eliminate any unclear directives and establish a
record of ethical and clear-cut guidelines for decision-making. Nonprofits need to adopt
and implement clearly written policies especially concerning complaints and actions
needed in order to prevent retaliation.
Document destruction. The Act clearly identifies that it is a crime to falsify,
alter, change, destroy, or re-create any document. This provision of the Act also amended
the federal criminal code; it is applicable to all organizations- for-profit and nonprofit.
15
Nonprofits should maintain accurate records of all proceedings, especially legal and those
that lead to decisions. Board meeting minutes need documentation and approval by a
quorum of board members. Employee/staff files, major transactions, fundraising efforts,
real estate, and other contracts should all be filed and accessible. This includes paper
documents, digital memos, and voicemails.
The Sarbanes-Oxley Act has been in place since 2002, with recommendations for
the nonprofit sector arising in 2003 and further revisions in 2006 (Board Source, 2003;
2006). As one result of the Act, the IRS has increased the questions and included sections
related to governance and auditing (Part VI & XII) on the IRS 990 tax form (Table 2).
This was the first time since 1979 that the federal government revised the IRS 990 tax
form. The government’s reasoning behind the revisions was to increase transparency, add
accountability, and enhance governance (Bakale, 2009; Halloran & Higgins, 2008;
Smoker & Mammano, 2009). State and federal governments do not require completion of
the governance section of the IRS 990 tax form and only organizations with assets over
$25,000 USD are required to file an IRS 990 tax form. However, it is a vital part of the
available data regarding nonprofit organizations in the United States. The National Center
for Charitable Statistics is the clearinghouse for digitalized IRS 990 tax form data.

16
Table 2
IRS 990 tax form nonprofit governance measures
Variable Description Variable Location
on IRS 990 form
Coding
Family/business relationships between personnel Part VI Question 2 0=yes 1=no
Management function outsources Part VI Question 3 0=yes 1=no
Organizational document changes Part VI Question 4 0=yes 1=no
Material diversion of assets Part VI Question 5 0=yes 1=no
Documentation of governing body meetings Part VI Question 8a 1=yes 0=no
Documentation of authorized committee meetings Part VI Question
8b
0=yes 1=no
Key organizations personnel unreachable Part VI Question 9 1=yes 0=no
Governing body review of 990 form prior to filing Part VI Question
11
1=yes 0=no
Written conflict of interest policy Part VI Question
12a
1=yes 0=no
Key personnel in org disclose conflicts of interest Part VI Question
12b
1=yes 0=no
Compliance enforcement of conflict of interest
policy
Part VI Question
12c
1=yes 0=no
Written whistle-blower policy Part VI Question
13
1=yes 0=no
Written document retention and destruction policy Part VI Question
14
1=yes 0=no
CEO or top executives’ compensation approved Part VI Question
15a
1=yes 0=no
Key personnel compensation approved Part VI Question
15b
1=yes 0=no
Applicable forms disclosed on organizations’ own
website
Part VI Question
18
1=yes 0=no
Contact information for organization provided in
governance section
Part VI Question
20
1=yes 0=no
Accounting method Part XII Question 1 1=accrual
0=other
Organization’s financial statement compiled or
reviewed by independent accountant
Part XII Question
2a
1=yes 0=no
Organization’s financial statement compiled or
reviewed by independent accountant
Part XII Question
2b
1=yes 0=no
Organization has an audit committee Part XII Question
2c
1=yes 0=no
Note. IRS 990 tax form information utilized in this study and for the purpose of measuring
governance.

17
Problem and Research Statement
Even though Sarbanes-Oxley was enacted in 2002 and the IRS implemented
higher levels of questioning on the IRS 990 tax form in 2008, all with the purpose of
increasing transparency and accountability, there is little to no scholarly research focused
on governance trends, implementation, or usage of the IRS 990 tax form, since it is
relatively new and difficult to access. This could be associated with the fact that the new
sections on governance and auditing have yet to be made digital through the Urban
Institute’s NCCS database. The lack of available digital data could be a reason for the
lack of research on the Sarbanes-Oxley Act’s implications, effects, and repercussion
within the nonprofit sector. This lack of oversight and follow-through of connecting
collected data to the researcher and therefore being able to translate research results for
the practitioner is the basis of this study. If research cannot be simply and clearly
conducted then how are results going to be able to be generalized and put into action to
increase the public knowledge of nonprofit organizations? It is the purpose and goal of
this dissertation to take steps to understand the governance data collected on the IRS 990
tax form and statistically interpret any potential trends and helpful insights for the
nonprofit practitioner. Being able to numerically code answers from the governance and
auditing sections will allow for a quantitative analysis of the data. This can then be
tracked for trends or holes in the collected governance data. It is my hope that results will
encourage further use of IRS 990 tax form data while also advocating for more publically
accessible data sets for the nonprofit sector.
There is a need for research about nonprofit governance that deals with current
events, has the ability to utilize new data, and can help to determine if there are changes

18
occurring within the field. In order to examine these possibilities, I have sought out
literature and scholarly research regarding the nonprofit sector, specifically research and
publications focusing on the practitioners and quantitative methodological approaches.
The nonprofit sector today has suffered from the 2008 global financial crisis and the
housing bubble burst. Pressures, influences, and consequential reactions from
sociopolitical changes, both good and bad and extreme and not extreme, all have some
level of effect on the nonprofit field. Additionally, the growing importance of the
nonprofit sector has also led to further scrutiny by the public. Issues of accountability and
performance have been raised. However, in order to answer these inquiries, there needs to
be current data collected and then made available to the researcher. This study aims to
take a step in that direction, by using the previously stated governance and auditing data
from the IRS 990 tax form to determine: first relatedness to governance practices and
then potential changes occurring over time. Following this line of inquiry and based on
the environmental context and whole economy changes that are occurring I have
formulated the research question to an overarching inquiry:
Is coercive isomorphism changing reported governance practices in human
service nonprofit organizations?
In order to offer further explanation and justification for this research directive, I define
and discuss relevant research including models and theory. I begin with an umbrella
approach, first discussing organizational change leadership, then moving on to nonprofit
governance, and narrowing the scope down to institutionalism. This is then followed by a
discussion of new institutionalism innovations and culminating with coercive isomorphic
institutional change. Finally, the research question is reiterated and hypotheses outlined.

19
Chapter 2
Literature and Theory
The increased attention on nonprofit organization post Sarbanes-Oxley led to an
upsurge in research literature. In nonprofit organizations, the governing body is the board
of directors. The board is the leadership of the organization and has oversight
responsibilities that include legal, ethical, and fiduciary components.
Organizational Change Leadership
Organizational theory is a foundation and research platform of the social sciences.
Organizational change, a category of organizational theory, has multi-disciplinary roots.
Organizational change targets multiple different activities, dimensions, and levels of
analysis. Activities include reporting changes in relationships and in funding for
organizations. Different dimensions include areas related to planning, the magnitude of
the change, and the continuity of the change process. Additionally, organizational
changes have different levels of analysis ranging from the organizational level (the one
examined in this study), to the group, to the individual, as well as a macro function
focusing on the entire system as a unit of analysis. Models of change that are often
researched in organizational change include Lewin’s force field model (1951),
Weisbrod’s six box model (1976), Nadler and Tuchman’s congruence model (1983), and
Burke-Litwin’s model of organizational performance and change (1992, 2009). Each of
the preceding models have specific purposes ranging from managing problems, objective
setting, and goodness of fit regarding organizational objectives. In organizational change
theory, organizations are not objects or things, rather they are living, breathing, and
operating entities. They are concepts that have come to life and were developed through

20
actions, dialogue, vision, and passion. Organizations are not only influential to those
within the organization, but play an active role in civil society. When focusing on
nonprofit organizations, these operations not only fulfill a need of a good or service to the
public but are also guided by the needs and wishes of their constituents. Organizations
are socially constructed as mechanisms for change.
Organizational change has three different approaches: selection, adaption, and
embeddedness (Galazkiewicz & Bielefeld, 1998). Selection models include looking at the
environment for potential reasons or sources of change and include organizational
ecology (Hannan & Freeman, 1977) and some aspects of institutional theory (DiMaggio
& Powell, 1991). Adaptation models look at the attributes that make it possible to achieve
outcomes and include theoretical designs such as resource dependency (Pfeffer &
Salanick, 1978), contingency theory (Lawrence & Lorsch, 1967; Fiedler, 1972), part of
the foundation of institutional theory (DiMaggio & Powell, 1983), and economic based
transaction theory (Williamson, 1975). The third model of organizational change is
embeddedness from sociology literature and it strives to place change within different
social structures. Grannovetter (1985) empirically studied and conceptualized
embeddedness theory, whereby there are strong and weak ties in society that dictate how
decisions are made and how resources are attained, thus developing the embedded
approach.
Organizational change includes multi-faceted definitions and conforms to allow
for various definitional parameters (Powell & Bromley, 2013). Theories related to
organizational change are malleable and able to adjust to various situational differences
and concepts. Environmental effects on organizational behaviors have been researched

21
and hypothesized for years. However, it was not until the mid-1900s that academicians
accepted organizational change theory (Poole & Van de Ven, 2004). At times, it is simple
to see that change has occurred, however, there are other instances that leave uncertainty
or an unclear path to understanding these changes. The emergence of studies related to
the ecological environment and the area where organizations live and candor thrives has
affected organizational change literature. This allows and expands the nature of the
research to focus on external environments rather than internal environments (Hawley,
1950; Lawrence & Lorsch, 1967; Warren, 1967). In 1950, Hawley concluded that an
organizational environment was derived from an ecological community based on
geographic location. This led to an understanding that organizations within close
proximity to others cooperated, competed, and potentially copied each other.
Expanding and contrasting the ecological environment is the institutional
environment which includes culture and influences on organizational behavior.
Institutional environment deals with defining and enforcing appropriate behaviors (Scott,
1995). This also deals with conferring organizational legitimacy (Scott, 1995). Scott’s
study focused on sociopolitical legitimacy (Baum & Powell, 1995; Hannan & Carroll,
1995), whereas ecologists research legitimacy through constructive legitimacy.
Constructive legitimacy is cognitive and process oriented. Sociopolitical legitimacy
related to behavioral conformity is the concept of violation or punishment based on laws,
norms, or standards. Another research avenue of legitimacy focuses on changes in laws
or passage of legislation (Singh, Tucker, & Meinhard, 1991). This is not constructive
legitimacy or sociopolitical, rather it is a broader understanding of institutionalism where
overnight— through the passage of a law or legislation—organizations become noticed,
22
regulated, or legitimate in the eyes of the public. This line of inquiry deals with
exogenous institutional change (Hannon & Carroll, 1995).
Within the organizational change and organizational legitimacy, the governance
of the organization is important. The board of directors of a nonprofit organization has
duties to follow and abide by, these include the duty of care, the duty of loyalty, and duty
of obedience. Each of these duties influence organizational legitimacy. The following
sections discuss and apply legitimacy as understood through institutionalism in the
context of this research study.
Nonprofit Governance
Organizational change leadership manifests in different way, depending on the
situational construct. For nonprofit organizations, the board, as the governing body can
be seen as the leadership of the organization. And governance in nonprofit organization is
studies through board actions, decisions, and procedures.
Governance is progressive and ever changing, as governance models are evolving
tools of leadership. Governance theorems regarding nonprofit organizations focus on the
board of directors or trustees. The responsibilities that are associated with these
individuals are based on principles of leadership, oversight, and organizational structure
(BoardSource, 2010). All of these principles have a common factor in nonprofit
organizations, which is the mission. A nonprofit organization is mission based and
mission driven. An organization’s mission encompasses the purpose of the organization
and acts as a north star for the future.
Governance as a theory and practice is an integral part of daily organizational
behaviors and structure within all nonprofit organizations (Powell & Steinberg, 2006).

23
Governance theories are vast and defined while utilization has been found to be
collaborative and to take the form of hybrid models (Gill, 2002).
Governance theory is a traditional hierarchical arrangement. A top down
organizational structure of governance is the traditional model, whereby the board tells
management what they want accomplished. The failures remain that the board is often
dilettante and ends up being a follower to management (Ballantyne & Associates, 2006).
However, current literature on governance and roles of boards offers a wide array of
models; there is not a one size fits all, rather many theorems that offer frameworks to
understanding models of governance. Research has noted that several issues and
obstacles exist in conceptualizing and measuring governance effectiveness and
implementation (Nobbie & Brundney, 2003).
This dissertation focuses on institutional isomorphism theory from organizational
literature. However, a broad understanding of other nonprofit governance theories and
conceptual foundations is imperative to understand other possible error terms,
environmental conditions, and sectorial relations. Therefore, the following section briefly
outlines nonprofit governance models.
Governance models range from economic based agency theory (Fama & Jenson,
1983) and institutional theory (Powell & DiMaggio, 1991) to power relationship based
models (Murray, Bradshaw, & Wolpin, 1992; Hillard, 2008; Jager & Rehli, 2012)ii.
Power, as a concept of governance, is the ability to implement one’s will against
opposition (Jager & Rehli, 2012). Governance models based on power relationships have
been studied from board and CEO relationships to determine the differences between
power sharing, CEO dominant, chair dominant, fragmented and powerless (Murray,

24
Bradshaw, & Wolpin, 1992). A trust based model of governance involving CEO and
board partnerships with the community and offering a stepladder approach, while framed
in social capital theory, has also been studied (Hillard, 2008). Results offer a trust-
building framework as the first step of the model, followed by interactions between the
board chair and the executive director allowing for the formation of a relationship that
could offer mutual benefits. There are three different levels of benefits: managing,
planning, and leading, each with incremental increases in building social capital. The
third addition to the governance trust model is interpersonal interaction stemming from
prior knowledge as a proactive component to social capital building through governance.
Another avenue of governance research is through roles, specifically roles of
board chairs and executive directors. Deductive models of governance focus on
relationships between executives and the board through qualitative analysis. Results
indicate that relationships matter in organizational structure, behaviors, and resource
environments (Brown & Guo, 2010). The findings in Brown & Guo’s (2010) study align
with previous work compiled by Hillman and Dalziel (2003), which detailed resource
dependency, and indicated that it was a driving factor in board member contributions.
“Governance framework reflects the recognition by scholars and practitioners
alike that solving important public problems today means considering the wider net of
actors working on these problems” (Benjamin, 2010, pg 612). Governance in a nonprofit
organization is adaptable and inclusive of economic, political, and social theories, while
also supporting the notion that organizations are influenced by outside actors and
environmental changes (DiMaggio & Powell, 1991; Benjamin, 2010).

25
Nonprofit governance, as researched by Cornforth, is defined as the “systems and
processes concerned with ensuring the overall direction, control, and accountability of an
organization” (Cornforth, 2004: 2011, pg 6). This definition is the foundation of this
study. Understanding how to operationalize a definition is contextually important in order
to define the parameters of the overall research endeavor. The above definition for
nonprofit governance is operationalized through this study by means of the IRS 990 tax
form and Part VI and XII that collect data on reported governance policies, practices and
procedures of nonprofit organizations in the United States. To unpack and operationalize
the above definition of nonprofit governance I specifically examine the reported systems,
as seen through policies, the processes as seen through practices, and procedures as
derived from self-reported information in the IRS 990 tax form.
The need to first and foremost understand what nonprofit governance is and the
extent to which the knowledge of policies, practices, and procedures can help the
practitioner is underrated. This is part of the problem that my dissertation is addressing,
specifically seeking to uncover what policies and practices of governance are being
reported. There is a dire need and a research gap when it comes to reporting and the
utilization of reported documents. Not only is there a lack of understanding of IRS tax
documents, but the IRS increased the number of questions on the 990 tax form, and never
offered detailed analysis on those forms or assistance to nonprofit organization as to how
the form should be filled out or what benefit completing the forms produced (IRS, 2008-
2013). Nonprofit governance focusing on the “systems and processes concerned with
ensuring the overall direction, control, and accountability of an organization” (Cornforth,
2004: 2011, pg 6) is the operationalized definition for this study and is combined with

26
institutional theory. Institutional theory is one of the most developed, studied, and
understood theories of cross-disciplinary research (Cornforth & Brown, 2014).
Institutional theory has been used to determine and further narrow my dissertation’s
research objective.
Institutionalism
In its simplest form, institutionalism is a set of rules. They form the foundation for
behaviors within organizations. As with the above areas of research, institutionalism is
multifaceted. Institutional theory has the ability to be conceptualized and understood as a
broad connection between multiple disciplines, all with a shared understanding that
defines this theoretical orientation. The link or thread that connects all the disciplinary
views is the endeavor to discover and follow the relationships between social structures
and organizations. However, that is the extent to which there are similarities, the
definition of institutions differ from scholar to scholar. Institutions are conceptualized
differently, focal features of organizations differ, and focus of research arguments are
dissimilar (Powell & Bromley, 2013). This robust theoretical orientation lends itself
nicely to understanding organizational leadership.
Institutional theory is a prominent theoretical perspective found in business and
public administration research and asserts that an organization’s environment is
influential (DiMaggio & Powell, 1983). Institutional theory dictates that organizations
seek legitimacy through their environments including internal personnel, stakeholders,
and external constituents. Institutional theory further stipulates that in order for an
organization to be valid, the organization will adopt and submit to the values, norms,
expectations and practices of the environment to which they belong and operate

27
(Cornforth & Brown, 2014). Organizations, as explained through institutional theory,
adhere to the norms and values of their environment, and replicate practices of ‘good
governance’ in order to be internally and externally viewed as a genuine organization.
Institutional theory, as proposed by DiMaggio and Powell in 1983 and later
defined and expanded as new institutionalism in 1991, is a mechanism for understanding
and interpreting organizational change. Similar to organizational charts, families of
theories can be visualized as a hierarchical ladder. Institutionalism is a subcategory of
organizational change, which is a category under organizational theory, in the social
sciences. Within organizational literature, institutional theory is the foundation for both
the adaption change and selective change theoretical models (Galaskiewicz & Bielefeld,
1998).
New Institutionalism. Institutional theory is an old analysis, striving to
understand influential social factors. However, the theoretical approach is sufficiently
novel as to be considered contemporary and often examined as a new distinctive
approach (DiMaggio & Powell, 1991: 2012). The main reasons behind the new concept is
the lack of agreement on macro and micro features, their differences of importance of
cognitive and normative aspects of institutions and the overall importance of networks.
New institutionalism is therefore not necessarily a new concept, rather an approach that
has been utilized for centuries, though has recently grown in observance in the social
sciences (Powell & DiMaggio, 2012). Active research lines have recently emerged in
economics, political science, and sociology providing strength behind the new
institutionalism movement in research literature. This further lends strength to the use of
the theoretical foundation of the institutionalism to the study of organizations and their

28
leadership in scholarly research. The main differences in the “new” verses “old” view of
institutionalism is the focus of the research. “Old” institutionalism focused on policies
and routines in an effort for an organization to be self-sustaining. “New” institutionalism
focuses on the external environment and the socially constructed pressures that effect
organizations. These external pressures create templates of how organizations should be
and how they should be functioning, thereby leading to legitimacy among organizations.
New institutional studies focus on isomorphism, decoupling, and distribution, including
the later works from DiMaggio and Powell (1991). Focusing on the external
environment, institutional isomorphism as laid out and defined by DiMaggio and Powell
will be parsed out as the focus of the remaining review of literature.
Institutional isomorphism. Further defining elements of institutional theory,
DiMaggio and Powell (1983:1991) discussed three mechanisms of institutional
isomorphic change: coercive, mimetic, and normative (Appendix B). Coercive is defined
through pressures from other organizations or outside entities. Within coercive
isomorphism, there are characteristics of conformity. Mimetic means imitation-more
specifically on the organizational level of analysis, imitation of other outside agencies.
Normative isomorphic change refers to pressures both internal and external to the
organization. Isomorphism, according DiMaggio and Powell in their 1983 article, is a
constraining process that forces one unit in a population to resemble other units that face
the same set of environmental conditions. Literature suggests and research results
indicate that, in general, organizations compete for resources, consumers, and power, all
of which are contextual factors related to nonprofit governance (Pfeffer & Salancik,
1978; Ostrower & Stone, 2006: 2010; Brown & Gou, 2010). Institutional isomorphism

29
theory provides predictors for diagnosing isomorphic change, utilizing different
predictors depending on the domain of analysis. At the organizational level of analysis,
these include organizations being more dependent upon other organizations, changes in
structure to replicate those of other firms, centralization of resources, ambiguity of goals,
and greater reliance on professional staff in order to create a more professionalized
environment (DiMaggio & Powell, 1983). Institutional isomorphism theory posits that
isomorphic changes in organizations enables agencies to interact with each other on the
same level, thereby increasing each other’s legitimacy.
For the purpose of my dissertation the analysis takes place at the organization
level. Additionally, only coercive isomorphic change will be discussed, as I am only able
to understand and examine the coercive factors through the available data and
methodology. Coercive institutional isomorphism theory is used to understand and
interpret the reported governance changes that are hypothesized in this study.
Research question
Based on the environmental context and economic changes that are currently
occurring, and given my interest in nonprofit governance, I moved from first being
interested in issues, to focusing on and reviewing the literature. Then I sought out
research ideas that focused on areas of strategic leadership. The changes in the IRS 990
tax form took place starting with the 2008 tax year, therefore this study starts as a blank
slate in 2008; I am not looking prior to 2008, thereby in order to focus on the questions
spurred by the 2002 Sarbanes-Oxley Act. Because of the changes that have occurred and
continue to ignite concern among the public, I anticipate the data will provide evidence of
increased use of governance practices, such as whistleblower policies, conflict of interest

30
statements, auditing committees, and third party reviewers. With the guidance of coercive
institutional isomorphism theory and the indicators laid out through the research
literature, I have structured the following research question:
Is coercive isomorphism changing reported governance practices in human
service nonprofit organizations?
Hypotheses
As earlier discussed institutional isomorphism offers the challenge to researchers
to discover changes over time, which is the purpose of my dissertation study. The first
hypothesis indicates that I expect to see increasing practices of reported governance over
time. However, increasing governance is in no way reflecting the notion that more
governance is better governance, rather there are more policies, practices, and procedures
reported through the IRS 990 tax form. These policies, practices, and procedures reported
through questions on the IRS 990 tax form are operationalized as the governance
practices being carried out by the organizations. My second hypothesis seeks to
determine if there are similarities between organizations that report consistent and stable
governance practices or the inverse. This is identified through indicators as laid out
through institutional isomorphism theory. These include agency size and age, which
according to institutional isomorphism theory are indicators that lead to more
homogeneity and consistency in practices, specifically in larger and older organizations
(DiMaggio & Powell, 1983: 1991; Powell & Bromley, 2013).
H1a: Human service nonprofit organizations will report increasing practices of
governance over time.

31
H1b: Human service nonprofit organizations that are larger and older will report
more consistent governance practices, thereby exhibiting fewer changes to their
governance policies and practices over time.

32
Chapter 3
Methodology
My research design seeks to uncover statistical evidence regarding coercive
isomorphic changes happening over time in human service nonprofit organizations in the
United States. Using a multi-phase sequential quantitative approach allows me to gain as
full of a model as possible. The research design consists of three distinct phases: phase
one data mining and data collection, phase two an exploratory factor analysis (EFA), and
phase three statistical analysis which is directly tied to both parts of the hypotheses,
resulting in computation and interpretation of trend analysis, t-test, multiple regression
models, and follow up robustness tests (Table 1).
Table 1
Multi-phase Sequential Quantitative Research Design
Phase Method Support
1 Data Mining IRS 990 Tax forms
2 Factor Analysis Extracted Components
3 Trend graphing
T-test
Regression Model
Hypotheses: H1a & H1b
In their review of governance, Ostrower and Stone (2006) report that there is a
need for new and additional types of data in order to further governance research. The
research conducted and compiled for my dissertation is meeting this need, by mining data
that is underutilized. Reported data from the IRS 990 tax form is publically available
information, yet it is not being fully utilized and the benefits associated with this data are
not yet realized. My methodology section builds on the information from the above
chapters, including the discussion of the nonprofit sector today, the literature review, and

33
institutional isomorphism theory that offers exogenous and endogenous factors
influencing organizational legitimacy.
Sample and Selection
Variables utilized in the database include EIN codes, location of operation, total
net assets for each year (2008- 2012), year of formation, number of board members and
Parts VI and XII from the IRS 990 tax form. The EIN code for each organization is used
as an identifier to look up each IRS 990 tax form. The location variable is based on the
US Census Bureau classification of United States regions: Northeast, South, West, and
Midwest. The location of operation variables are dummy coded in order to use this
categorical variable as a predictor variable. Total net assets are taken directly from the
IRS 990 tax form. Because of the large asset sizes, the logarithm for the total net assets is
utilized. The year of formation or age variable is calculated as 2012-year of formation.
The number of board members is included as a control variable, based on nonprofit
governance literature that supports the importance of boards in nonprofit organizations.
As shown in Table 2, information extracted from the IRS 990 tax form includes policies,
practices, procedures, and board size variables. Table 3 presents the descriptive statistics
for the independent variables and Table 4 includes the dependent variables. Furthermore,
I have winsorized my data at the 90th
percentile (Appendix C).
The sample size started at 1000 human service nonprofit organizations in the
United States. After cleaning the data there were 959 in my total sample. This was further
reduced to 888, when it was discovered that there were several organizations that did not
list any board members. Once again the sample was reduced for the intial regression
testing, due to 432 organizations exhibiting no change in their reported governance

34
policies, practices and procedures for the five year period of study. Therefore the sample
decreased to 456. However, through the robustness testing the regression models were
conducted on the entire sample of 888. Additionally, the 432 organizations that reported
no changes in reported governance practices were also further investigated, through
robustness testing.

35
Table 3
Means, standard deviations, and correlations of independent variables
Correlations
Measure M SD 1 2 3 4 5 6
1. Mean
assets 2008-
2012 (log10)
5.852 .023
2. Mean
number of
board
members
2008- 2012
12.37 .354 .156**
3. Age of
organization 26.01 .535 .280** .203**
4. Location:
Northeast .20 .013 .073* .010 .010
5. Location:
Midwest .23 .014 -.024 .044
-
.277**
-
.277**
6. Location:
South .33 .016 -.020 .008
-
.356**
-
.391**
-
.391**
7. Location:
West .23 .014 -.018 -.055
-
.271**
-
.297**
-
.382**
-
.382**
Notes: N= 888; * p < .05, **p < .01, ***p< .001
Table 4
Means, standard deviations, and correlations of dependent variables
Correlations
Measure M SD 1 2 3
1. All governance
variables 1.22 2.42
2. Policy
governance
composite
.51 1.452 .673**
3. Documentation
governance
composite
.62 .936 .822** .309**
4. Auditing
governance
composite
.24 .562 .083* .012 .041
Notes: N= 888; * p < .05, **p < .01, ***p<.001

36
In order to better understand my data I also looked at the spread of the
independent coercive isomorphic variable of total net assets and the control variable,
board size for each year of the study. The total net assets variable (Graph 1) shows a gain
of total net assets from 2008 to 2011, but a decrease in 2012 is shown. This could be
because there is an organization that in 2012 is an outlier and reports a $13,232,608 loss.
The control variable, board size showed minimal changes over time (Graph 2). There is a
one hundredth of a point increase between 2008 and 2011, with four hundredths of a
point increase in 2012. The mean number of board members in 2008 is 12.76 rising to
12.81 in 2012. However, there are several organizations that report 0 board members and
two that report 184. This is problematic, because it is a federal requirement that nonprofit
organizations have a board of directors. Of the 959 organizations researched, 67
organizations showed an average board size of 0. The mean board size was computed as,
the number of board members for ((2008+ 2009+ 2010+ 2011+ 2012)/ 5). Because the
statistic showed that there were so many boards that ended up with an average size of 0, I
chose to decrease my sample size to include only those boards that had on average one
board member. Per federal law, nonprofit organizations are required to have an oversight
board in order to operate. This measure of board size could be wrong due to input error,
self-reporting error, or simply error in misunderstanding the question. Additionally, I
removed the organizations (2) that reported 184 board members, as this was an extreme
outlier. Furthermore, when reviewing the total net assets, one organization was removed,
because I believed there to be reporting error. At year one they reported -$154,171 total
net assets, year two they reported $4,316, and year five they reported $3,183, creating a
negative on average total net assets, and therefore I also, could not transform it into a

37
logarithm. Additionally I removed any organization that reported negative mean total net
assets.
Note: N= 959
Note: N= 888
$3,212,265
$3,309,454
$3,421,529
$3,532,697
$1,870,565
$0
$500,000
$1,000,000
$1,500,000
$2,000,000
$2,500,000
$3,000,000
$3,500,000
$4,000,000
2008 2009 2010 2011 2012
US
Do
llar
s
Graph 1
Mean Total Net Assets
Mean Total Net…
12.5
12.5
12.51
12.51
12.55
12.47
12.48
12.49
12.5
12.51
12.52
12.53
12.54
12.55
12.56
2008 2009 2010 2011 2012
Num
ber
of
Bo
ard
Mem
ber
s
Graph 2
Mean Number of Board Members
Mean Number of Board
Members

38
Phase One
The multiphase quantitative study starts with the creation of a database including
1000 human service public charity organizations that were randomly selected from all
human service organizations in the NCCS core database. This study utilizes a sample of
501c3, human service operating charities in the United States of America. As of 2012,
there were over 60,000 organizations classified under the NTEE major code ‘HU’ or
human service. This study’s sample size is just under 2% of the reported population.
However, human service organizations range from crime and legal related entities to
youth development organizations and relief centers. The NTEE code of human service
was specifically chosen because of the range of goods and services included under the
NTEE code. Additionally, human service organizations were chosen to bound the
parameters of the study and initially retrieve research results from one subsector of
nonprofit organizations, instead of obtaining a random sample from all nonprofit
organizations.
In order to address validity, 1000 organization were chosen to have a large
enough sample size to account for missing variables and conduct the regression analysis
without worry about the degree of operationalization of the data construct. Data derived
from IRS 990 tax forms have been collected and downloaded from Guidestar. Guidestar
is a 501c3 organization that gathers and makes publicly available information on IRS
registered nonprofit organizations (Guidestar, 2013). The database includes the
organization’s Employee Identification numbers (EIN), location of incorporation, age of
the organization, total net assets, board size, and questions related to governance
practices including Part VI Section A Questions 1a, 1b, 2, 3, 4, 5, 8a, 8b, 9; Part VI

39
Section B Questions 11a, 12a, 12b, 12c, 13, 14, 15a, 15b, 15; Part IV Section C
Questions 18, 20; Part XII Questions 2a, 2b, 2c (Appendix A & Table 2).
Each IRS 990 tax form has been individually read, reviewed, and coded by the
researcher. Coding to answers from Part VI and Part XII is in increasing practice of
governance; for example, Part VI Question 11 asks, if the governing body reviews the
IRS 990 tax form prior to filing, if the organization check yes, they are coded as 1.
Answers to the questions are dichotomous, ‘yes’ or ‘no;’ coding of these measures are ‘1’
and ‘0.’ Coding was specifically conducted to include ‘1’ to positively identify if a
governance policy or practice is being utilized. A ‘0’ represents that the organization does
not utilize the governance policy or practice.
Data Mining
The resulting data base includes all of the governance variables on the IRS 990
tax form (Table 2). Each of those 21 variables are coded 0 or 1 in respect to increasing
governance. The resulting ordinal variables were then transcribed into an excel data
sheet. This process of coding and recording was repeated for the 2008, 2009, 2010, 2011,
and 2012 forms, for the 1000 human service organizations. Variables that were
additionally extracted from the NCCS data base included total assets, location of
incorporation, ruling date for origination of organizations, and number of board members.
All of this information, once compiled, resulted in a multi-layer complex data set. As far
as I know, this is the only data set that has governance information individually extracted
and coded from the IRS 990 tax forms over multiple years. The data was cleaned by
matching up the available data per year for each EIN number, making sure there were no
duplicates, only using full IRS 990 tax forms, and using only completed tax forms. Once

40
the data was cleaned there were 959 organizations left in the data set. Specifically, the
total number of observations decreased once EIN numbers were compared and data was
included for each year. For example, I started with 1121 EIN numbers for 2011, which
decreased to 1081 when matched to 2012, again decreased to 1073 when matched to
information available in 2010, decreasing again to 1061in 2009, and finally resulted to a
total number of 1029 observations in 2008. The number further decreased when IRS 990
forms were extracted to include only full IRS 990 tax forms, not EZ forms. This was
further reduced because not all organizations completed the governance and auditing
sections on the IRS form 990. Therefore, there is an N = 959 in the final data set.
Phase Two
The second part of the study is twofold; first, it includes the use of exploratory
factor analysis (EFA). EFA discovers latent variables that exist within a construct. In this
instance, the construct is the governance section of the IRS 990 tax form. The second
portion of phase two is an explanation and creation of composite variables from the
results of the factor analysis.
Factor analysis theory. Factor analysis allows for understanding as to whether
there are unobserved or latent variables. Discovering the latent variables is the
cornerstone of factor analysis theory (Tucker & MacCallum,1997). Factor analysis theory
focuses on the relationship between observed variables and latent variables; the latent
variables have systematic influences on the observed variables. The answer to a
constructed question yields an observed factor, and that factor is influenced by
underlying latent factors. Relationships between observed and latent factors are linear,
according to factor analysis theory (Tucker & MacCallum, 1997). Latent variables divide

41
into common factors and specific factors. Common factors are latent variables that have
influence over many observed variables. Specific factors are latent variables that are only
influencing a specific observed variable. The final variable in factor analysis is the error
term or the error of measurement in each initial observed variable. The errors of
measurement in factor analysis are additional factors that are not related to any other
factor. Instead of confirmatory factor analysis, exploratory factor analysis (EFA) is
utilized in this study because I did not want to impose a preconceived structure on the
measures of nonprofit governance. Specifically, phase two uses principal component
factor analysis (PCA). This technique is used when the data is highly correlated. It was
expected and anticipated that the data would be highly correlated throughout this study,
because all of the data is directly related to governance policies, practices, and procedures
of 501c3 organizations. PCA allows data to sub-divide into smaller sets or groupings.
PCA is able to maintain a high level of variance among variables and has been utilized in
studies of governance concerning the for-profit sector (Larcker, Richardson, & Tuna,
2007) and in the nonprofit sector (Yetman & Yetman, 2013). In these studies, PCA
identified the common variance and unobserved latent variables of governance. In
addition, promax rotation is conducted with the governance data for my study, which is
preferred over varimax orthogonal rotation, to account for the highly correlated variables.
Interpretation of the factor analysis. The second part of phase two includes
interpretation of the derived results from the PCA. After completion of the factor
analysis, factors are extracted. The factor analysis results are discussed based on the
findings from the review of literature and theory, in order to determine if they coincide
with the reasoning behind the 2008 IRS 990 tax form changes and governance best

42
practices. The researcher asks the question: do common variables load together in the
factor analysis? In an effort to gain an understanding and form an interpretation of the
PCA results. This last step offers the opportunity to determine if the related measures of
nonprofit governance have loaded together through the factor analysis. In this study, the
use of factor analysis creates a representation of nonprofit governance dimensions that
provide direction in further understanding of nonprofit governance and provides the
variables utilized in the following phases of data analysis.
Results were anticipated to be in-line with a preliminary study I conducted
through my research practicum at James Madison University in the School of Strategic
Leadership Studies (2014). This included an exploratory factor analysis of a sample of
508 human service public charities in 2011. The sample did not have gross receipt
parameters, since studies into agency problems and governance have previously focused
on larger organizations (specifically ones with gross receipts of greater than $1 million)
(Yetman & Yetman, 2013). The factor analysis resulted in eight components extracted
from the 21 nonprofit governance questions identified. Results indicated that information
gathered on the IRS 990 tax form could lead to a better understanding of an
organization’s governance policies and practices.
Factor Analysis
Factor analysis for each year was conducted (Appendix E, F, G, H, I) resulting in
between six and eight extracted components, explaining a cumulative total variance from
64.71-55.10%. The main three extracted components included the following IRS 990 tax
form governance questions: Part VI Q8a, Q8b, Q9, Q11, Q12a, Q12b, Q12c, Q13, Q14,
Q15a, Q15b and Part XII Q1, Q2a, Q2b. I then repeated the factor analysis to include all

43
of the years combined. For further clarification, the 21 reported governance questions
from Part VI and Part XII for 959 organizations, for year 2008, 2009, 2010, 2011, and
2012 were combined into one dataset. A factor analysis was completed on the 21 reported
governance measures.
Results (Table 5) showed eight extracted components, derived through a principal
component analysis extraction method. The components provided a total explained
variance of 64.441%. The top three components explain 38% of total variance (Table 6).
The first extracted component included 12 governance factors, Part VI: Q11,
Q12a, Q12b, Q12c, Q13, Q14, Q15a, Q15b and Part XII: Q1, Q2a, Q2b, Q2c. These
components explained 24.02% of the variance and had an Eigen value of 5.05. Factors
are be based on a .4 factor loading or higher (Larcker, Richardson, & Tuna, 2007;
Yetman & Yetman, 2012). The first component includes governance questions such as,
written conflict of interest policy, written whistle blower policy, approval of
compensations. The auditing questions regarding the organization’s having an auditing
committee and if financial statements were reviewed by an outside auditor, were also
included within this extracted component.
The second extracted component had an Eigen value of 1.71 and explained 8.13%
of variance. This component included three governance questions, Part VI: Q8a, Q8b,
and Q9. These governance questions included documentation of governing board
meetings, documentation of committee meetings, and whether key members of the
organization are reachable.
The third extracted component had an Eigen value of 1.44 and explained 6.84%
of the variance. This component included three governance questions from Part XII: Q1,

44
Q2a, and Q2b. All of these questions discuss auditing, including having an auditing
committee and if financial statements were reviewed by an outside auditor. These factors
were also included in the first extracted component. According to factor analysis theory,
when factors load onto multiple components, the variables are highly correlated (Tucker
& MacCallum, 1997). In the case of my factors, it was expected that they would be
highly correlated, as they were all derived from the same form, regarding governance
practices in nonprofit organizations and resulting from the need for more transparency
and accountability post Sarbanes-Oxley. The third extracted component deals with
auditing questions, however, the IRS 990 tax form Part XII: Q1, Q2a, and Q2b factored
into two separate components; therefore these questions have been removed from the first
component and only kept in the third component, thereby only counting them once.
The results from the factor analysis are used for regression modeling to determine
the relationships between the changes in dependent variables and the independent
variables.

45
Table 5
Factor analysis component matrix
Components
Factors 1 2 3 4 5 6 7 8
Part VI Q2 .012 .061 .373 .096 -.141 -.644 .246 -.134
Part VI Q3 .000 .260 .093 .656 .312 .153 .284 -.107
Part VI Q4 -.134 .123 .162 .208 .031 .141 -.729 -.261
Part VI Q5 .047 .263 .184 .277 -.187 -.096 .071 .737
Part VI Q8a .261 .587 .187 -.348 -.332 .131 -.005 -.044
Part VI Q8b .238 .667 .196 -.247 -.126 .130 .014 -.104
Part VI Q9 .008 .513 .289 .131 .282 .283 .082 .006
Part VI Q11 .472 .114 -.062 -.119 -.008 .057 .055 .155
Part VI Q12a .698 .090 -.220 -.014 .097 -.086 -.072 .109
Part VI Q12b .657 .318 -.322 .142 .134 -.330 -.095 -.147
Part VI Q12c .674 .272 -.314 .177 .074 -.327 -.085 -.143
Part VI Q13 .771 -.084 -.179 -.014 .041 -.003 -.081 .030
Part VI Q14 .727 -.159 -.188 -.082 -.067 .138 -.019 .096
Part VI Q15a .747 -.152 -.044 .177 -.258 .254 .058 -.008
Part VI Q15b .617 -.167 -.066 .257 -.292 .332 .055 .040
Part VI Q18 .236 -.055 -.136 -.267 .311 .198 .503 -.244
Part VI Q20 .176 .077 .000 -.313 .604 -.049 -.187 .400
Part XII Q1 .490 -.265 .415 -.007 .075 -.108 -.015 .066
Part XII Q2a .551 -.182 .513 .046 .238 .101 -.038 -.118
Part XII Q2b .614 -.372 .485 -.066 .070 -.047 -.081 -.005
Part XII Q2c .484 .011 .234 -.140 -.152 -.147 .059 -.158
Notes: N= 4795

46
Table 6
Policy, Documentation, and Auditing Components
Component Description Governance variables
1 Policy
Part VI Questions 11, 12a, 12b, 12c, 13,14, 15a,
15b
2 Documentation Part VI Questions 8a, 8b, 9
3 Auditing Part XII Questions 1, 2a, 2b
Note: Top three extracted components from the 2008-2012 factor analysis on 21
governance questions, resulting in 4795 observations.
Composite governance variables. To assess the primary variable of interest, the
change in reported governance practices, the top three variables, representing over 30%
of the variance, are used in composite as the dependent governance variables. This results
in three dependent variables per year (2008, 2009, 2010, 2011, and 2012). The new
composite variables are utilized in phase three for trend analysis and t-test. These
composite variables are used to create the change variables. These change variables
represent changes in reported governance from time one (T1) = 2008 until time five (T5)
= 2012. The change variables therefore utilize the following equation: T5- T1= change
variable. These change variables are used in the regression models. Descriptive statistics
(Table 7), show the three composite change variables (N= 888). The range of the reported
governance variables displays the values of reported governance for the sample. The
policy governance change variable has a range of -8 to 8 (M= .51, SD= 1.45). The
documentation governance change variable has a range of -3 to 3 (M= .62, SD= .94) and
the auditing governance change variable has a range of -2 to 2, (M=.24, SD= .56). All of
the change variables means are small and standard deviations are large for the sample,
meaning there is a large spread of the data.

47
Table 7
Descriptive statistics for dependent change governance variables
Measure M SD
Range
Min/ Max Variance
Skewness
Statistic/ Std. Error
Kurtosis
Statistic/
Std.
Error
All governance
variables 1.22 2.42 -19/14 5.85 .69/.08
13.33/.16
Policy
governance
composite
.51 1.45 -8/8 2.11 2.69/.08
11.28/.16
Documentation
governance
composite
.62 .94 -3/3 .88 1.13/.08
1.41/.16
Auditing
governance
composite
.24 .56 -2/2 .32 -.042/.08
.39/.16
Notes: N=888
Phase Three
The third step in the research design includes a trend analysis, t-test, and
regression models (Table 8).
Trend analysis utilizes the new composite variables which are plotted yearly to
determine if there are changes of reported governance measures over time. Based on this
study’s foundational theory of coercive institutional isomorphism, it is expected that there
is an increasing reported use of the governance policies, practices and procedures. This
also directly tests hypothesis H1a:
H1a: Human service nonprofit organizations will report increasing practices of
governance over time.
All of the reported governance variables for each organization are summed for
2008 and then again in 2012. The means of the sum of reported governance measures
across all 888 organizations for 2008 and 2012 are compared through a t-test. The t-test

48
offers the opportunity to compare whether two groups have difference average values. In
this case, a t-test was chosen in order to determine if there is a statistically significant
difference in the mean reported governance variables from 2008 compared to 2012. The
t-test further relates to hypothesis H1a, mathematically measuring time one (2008) to
time five (2012).
Multiple regression models are the final step of this study. Regression analysis
seeks to understand the extent to which nonprofit organizations are changing their
reported governance practices. Regression analysis offers the opportunity to determine
directionality and determine changes that have occurred over time with respect to
multiple variables. Since the data is time series oriented, regression lends itself nicely to
the creation of a potential model that would explain changes. In this study, I hypothesize
that there will be increasing reports of governance policies, practices, and procedures,
and regression will offer the method to discover if this behavior is present. In addition,
the second part of my hypothesis states:
H1b: Human service nonprofit organizations that are larger and older will
report more consistent governance practices, thereby exhibiting fewer
changes to their reported governance policies and practices over time.
The composite variables for the three strongest extracted components from the factor
analysis are used to create the change variables for the regression models. Independent
variables, which are derived directly from institutional isomorphism literature, include
location, age of the organization, and size. For the purpose of my study, size is
operationalized as the total net assets. Board size is taken into consideration and used as a
control variable based on the literature review and support that boards in nonprofit

49
organization are responsible for all legal matters. And, research has shown that the
optimal board size is 14 members (Board Source, 2003). Location is taken into
consideration as an independent variable. The age variable represents the year of the
organization’s formation. Regression models will be run for all three dependent change
variables as well as a full governance change model using the sum of all reported
governance practices per year (Table 8 & 9). Regression results are predicted to show
changes over time in the reported governance measures, thereby supporting hypothesis
H1a, as well as specifically supporting H1b through results that indicate coercive
isomorphic changes leading to homogeneity of organizations based on size, age, and
location as theorized in institutional isomorphism theory.

50
Table 8
Phase 3
Statistical Method
Mathematical Description Description of variables
Trend Analysis Changes over time
aggregate governance
variables
Line graph of mean
governance practices per
year. Computed as sum of
governance answers on
the IRS 990 tax form per
year.
Changes over time per
composite variable
Line graph of mean
governance practices per
year per composite
variables: Policy,
Documentation, Auditing
T-test Comparison over time Comparison of sum of
governance practices
reported on the IRS 990
tax form in 2008
compared to 2012
Regression Models Governance full model Change DV = T5-T1, for
the aggregate sum of all
the variables
IV = all (size, age,
location)
Composite variables
model
Change DV= T5- T1, for
Policy, Documentation,
Auditing Composite
variables
IV = all
Note: Phase 3 is the third step in the multi-phase sequential quantitative research
design.

51
Table 9
Variable construction
Variable Type Description Data Source Source Expected
sign
Independent
Control
Variable
Size Number of
board members
NCCS
Database;
IRS 990 tax
form, Part VI
Line 1a
Nonprofit
Governance
Literature
Positive/
Negative
Independent
Variable
Size Log of net
assets
NCCS
Database;
IRS 990 tax
form, Part 1
Line 22
Institutional
Isomorphism
Theory
Positive
Independent
Variable
Age Year of
formation:
(2012- year of
formation)
NCCS
Database;
IRS 990 tax
form, Line L
Institutional
Isomorphism
Theory
Positive
Independent
Variable
Location Region of
operation:
Northeast,
South, West,
Midwest;
transformed as
a fixed effect
or dummy
codded
variable for
statistical
analysis
NCCS
Database;
IRS 990 tax
form, Line M
Institutional
Isomorphism
Theory
Positive/
Negative
Dependent
Variable
Policy Part VI Q11,
Q12a, Q12b,
Q12c, Q13,
Q14, Q15a,
Q15b
Guidestar.org;
IRS 990 tax
form
Factor
Analysis,
extracted
component 1,
24% variance
Dependent
Variable
Documentation Part VI Q8a,
Q8b, Q9
Guidestar.org;
IRS 990 tax
form
Factor
Analysis,
extracted
component 2,
6% variance
Dependent
Variable
Auditing Part XII Q1,
Q2a, Q2b
Guidestar.org;
IRS 990 tax
form
Factor
Analysis,
extracted
component 3,
7% variance
Note: N= 959

52
Overall this study endeavors to understand whether there are changes in reported
governance policies and practices over time. Furthermore, the study seeks to offer
practical applications for the use of these tax documents for practitioners, partners, and
associates of the nonprofit sector. The use of exploratory factor analysis allows for an
understanding of the relationship between the asked questions. Trend analysis helps
visually to answer if changes have occurred during the study period. The t-test offers a
method for understanding the relationship between the means of reported governance at
the introduction of the governance questions on the IRS 990 tax form in 2008 and five
years later in 2012. And finally, regression offers the method to determining what
variables are impacting the changes that have occurred since the implementation of the
new reporting practices.

53
Chapter 4
Results
Results indicate changes in reported governance practices over the five year time
period. The sequential, multi-phase, quantitative study yielded interesting results that
lend partial support to both Hypotheses 1a and 1b. Results show a positive trend in
increasing reported governance practices since the inclusion of the new sections of
governance and auditing on the IRS 990 tax form and post Sarbanes-Oxley. The
following results section aims to provide a breakdown of the statistical results, while the
conclusion section will relate these results to the research question: Is coercive
isomorphism changing reported governance practices in human service nonprofit
organizations?
The results section starts at phase three of the research design. Statistical methods
include trend analysis, t-test, and regression models. These are followed by robustness
testing in order to further find evidence supporting Hypothesis H1b.
Trend Analysis
Trend analysis is used mathematically, as well as visually, to gain a general
answer to the research objective, which is: Are there changes occurring in reported
governance practices over the 5 year period of study? As expected, trend analysis
demonstrates increasing levels of governance between the introduction of the governance
sections on the IRS 990 tax form in 2008 and 2012.
Dependent variables. The dependent variables derived from the governance
questions on the IRS 990 tax form were compiled into composite change variables. These
variables displayed increasing reported governance changes over time. When considering

54
all of the 21 governance variables, studied over the five-year period, there has been a
steady, positive change (Graph 3). Results from the trend analysis also indicated that
when the composite component variables were computed for changes over time, the
resulting graph indicates a steady increase of reported governance practices. These areas
of change over the five year period, are Policy and Documentation, while Auditing has
seen a slight, one-hundredth of a point decrease in 2012 (Graph 4).
Note: N= 888
13.08
13.55
13.75
14.14
14.3
12.4
12.6
12.8
13
13.2
13.4
13.6
13.8
14
14.2
14.4
2008 2009 2010 2011 2012
Sum
of
rep
ort
ed g
over
nan
ce v
aria
ble
s
Graph 3
Reported Governance Changes
Governance Reporting
Changes

55
Note: N= 888
T-test
A t-test was conducted to compare the average reported governance practices in
2008 and in 2012 (Table 10). Results indicated statistical significance, (.000, 2-tailed
test). This statistical significance indicates whether the difference between the 2008 and
2012 means is likely to represent an actual difference in the populations. Confidence
intervals set at 95% resulted in an upper and lower bound of minimal difference. There
was a significant difference between 2008 governance reporting (M= 13.08, SD= 4.35)
and 2012 governance reporting (M= 14.30, SD= 4.31), t(887)= 89.67, p=.000. These
result suggested that there was a difference between 2008 and 2012 reported governance
measure and there has been an increase in governance practices from 2008- 2012.
4.01 4.19 4.27 4.36
4.52
1.97 2.19 2.28
2.56 2.59
1.59 1.61 1.83 1.83 1.82
0
0.5
1
1.5
2
2.5
3
3.5
4
4.5
5
2008 2009 2010 2011 2012
Mea
n o
f gover
nan
ce p
ract
ices
Graph 4
Changes over time in governance practices
Policy, out of 8
Documentation, out of 3
Auditing, out of 3

56
Table 10
T-test, comparison of 2008 reported governance practices with 2012
Measure M SD t p
95% Confidence Interval
Lower/ Upper
Sum of all
governance
variables 2008 13.08 4.35 89.67 .000*** 14.02/14.59
Sum of all
governance
variables 2012
14.30 4.31 98.90 .000*** 12.80/ 13.37
Notes: N= 888; ***p< .001
Regression Models
For the regression models, all organizations that did not demonstrate reported
change in governance were removed. When reviewing the data in preparation for the
regressions, there were several organizations that on average reported no change in
reported governance practices. In the dataset of 888 organizations, a staggering 432
organizations had mean overall reported governance change score of zero meaning on
average these organizations reported no changes in their reported governance policies and
practices. This says a lot about human service nonprofits organizations. Nearly half of my
random sample has not changed their reported governance policies and practices post
Sarbanes-Oxley and additionally over a five-year period. Therefore, I decided to remove
those organization that had a mean governance change score of zero. This resulted in a
new sample size of 456 human service nonprofit organizations. Thereby, taking into
account only those organizations that reported on average some changes in governance, I
ran four regression models: all reported governance change, reported policy governance
change, reported documentation governance change, and reported auditing governance
change (Table 11-14). The reported nonprofit governance practices from 2008-2012 are

57
significantly predicted by the control variable, board size (Beta= .04, p= .00) and the
coercive isomorphic indicator age of the organization (Beta=.02, p= .07). The overall
model fit was R2=.033, indicating that there are many more indicators that are influencing
reported governance changes over time. For the second regression model, I looked at
whether the institutional isomorphic indicators were predicting the reported policy
governance variables. None of the institutional isomorphic indicators were found to be
significant. However, the control variable, board size was significant (Beta= .02, p= .00),
overall model fit R2=.029. The third regression model predicted reported documentation
practices, results again indicated only the control variable to be significant, board size
(Beta= .01, p= .04). The fourth and final regression model predicted the use of auditing
practices. These results were in line with the previous models, however the coefficient for
board size is negative, and the p- value is significant but only at the 90%, (Beta= -.00, p=
.10).
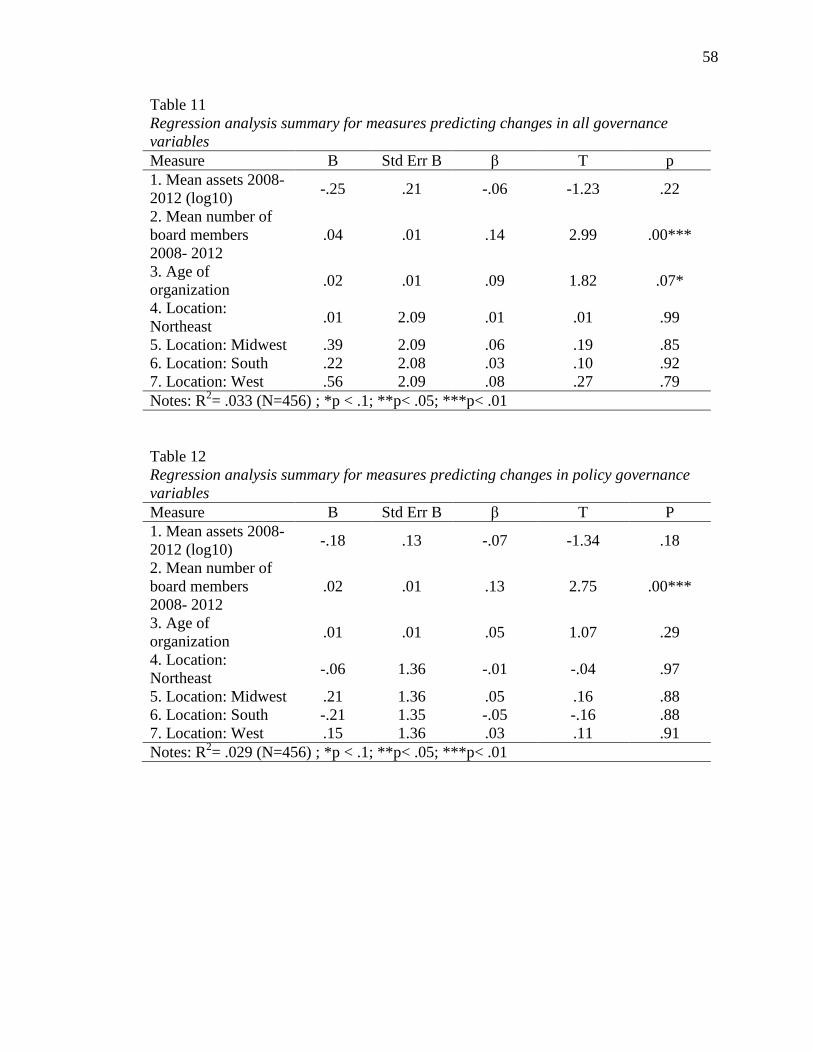
58
Table 11
Regression analysis summary for measures predicting changes in all governance
variables
Measure B Std Err B β T p
1. Mean assets 2008-
2012 (log10) -.25 .21 -.06 -1.23 .22
2. Mean number of
board members
2008- 2012
.04 .01 .14 2.99 .00***
3. Age of
organization .02 .01 .09 1.82 .07*
4. Location:
Northeast .01 2.09 .01 .01 .99
5. Location: Midwest .39 2.09 .06 .19 .85
6. Location: South .22 2.08 .03 .10 .92
7. Location: West .56 2.09 .08 .27 .79
Notes: R2= .033 (N=456) ; *p < .1; **p< .05; ***p< .01
Table 12
Regression analysis summary for measures predicting changes in policy governance
variables
Measure B Std Err B β T P
1. Mean assets 2008-
2012 (log10) -.18 .13 -.07 -1.34 .18
2. Mean number of
board members
2008- 2012
.02 .01 .13 2.75 .00***
3. Age of
organization .01 .01 .05 1.07 .29
4. Location:
Northeast -.06 1.36 -.01 -.04 .97
5. Location: Midwest .21 1.36 .05 .16 .88
6. Location: South -.21 1.35 -.05 -.16 .88
7. Location: West .15 1.36 .03 .11 .91
Notes: R2= .029 (N=456) ; *p < .1; **p< .05; ***p< .01

59
Table 13
Regression analysis summary for measures predicting changes in documentation
governance variables
Measure B Std Err B β t p
1. Mean assets 2008-
2012 (log10) -.06 .07 -.04 -.80 .43
2. Mean number of
board members
2008- 2012
.01 .00 .10 2.11 .04**
3. Age of
organization .00 .00 .07 1.46 .15
4. Location:
Northeast .58 .71 .24 .81 .42
5. Location: Midwest .70 .71 .30 .98 .33
6. Location: South .67 .71 .32 .95 .35
7. Location: West .75 .71 .32 1.05 .30
Notes: R2=.021 (N=456) ; *p < .1; **p< .05; ***p< .01
Table 14
Regression analysis summary for measures predicting changes in auditing governance
variables
Measure B Std Err B β t p
1. Mean assets 2008-
2012 (log10) -.03 .04 -.04 -.72 .48
2. Mean number of
board members
2008- 2012
-.00 .00 -.08 -1.68 .10*
3. Age of
organization .00 .00 .07 1.37 .17
4. Location:
Northeast .32 .43 .22 .75 .45
5. Location: Midwest .14 .43 .10 .32 .75
6. Location: South .34 .43 .19 .56 .58
7. Location: West .29 .43 .21 .69 .49
Notes: R2= .022 (N=456) ; *p < .1; **p< .05; ***p< .01
60
Robustness Tests
In order to further support and test for robustness, regression models on the full
data set, N= 888, were also conducted. Additionally, conducting robustness test on a
larger sample allows for further testing to the second part of the hypothesis:
H1b: Human service nonprofit organizations that are larger and older will
report more consistent governance practices, thereby exhibiting fewer
changes to their governance policies and practices over time.
Four regression models were conducted with an N of 888. One for each of the three
extracted components and a final model for the change in all of the reported governance
practices, during the study period (2008-2012). Tables 15-18 present the regression
results. Reported nonprofit governance practices from 2008-2012 are significantly
predicted by board size (Beta= .02, p= .01). The overall model fit was R2=.016, once
again indicating that there are many more indicators not being taken into consideration.
For the second regression model, reporting of policy variables was predicted, and board
size was significant (Beta= .01, p= .01), overall model fit R2=.071. The third regression
model predicted reported documentation practices for the nonprofit human service
sample. Results indicated no significance in any coercive isomorphic predictors or the
control variable. The fourth regression model predicted the use of auditing practices.
These results indicated that when predicting reported auditing governance practices, total
net assets is a significant negative predictor (Beta= -.05, p=.04), and overall model fit
R2= .021. These overall results were similar with the first set of regression results.
This second set of regression models was conducted to offer a fuller model
compared to the first regression models where all of the organizations that reported no

61
changes in their governance practices were removed. The second regression testing
allows for a comparison and further supports the initial results. Results from the
robustness test that included a larger population were similar among all four models.
With this information in mind, it gives more support to the original findings. Moreover,
brings to light that there is a good possibility that given an even larger population, the
results would hold constant. Results from the all of the regression models, support
nonprofit governance literature that states boards are an important and influential part of
nonprofit organizations. Regression results indicated that board size was a significant
predictor for the use of more reported governance policies and practices.
Table 15
Regression analysis summary for measures predicting changes in all governance
variables, full dataset
Measure B
Std Err
B β t p
1. Mean assets
2008- 2012 (log10) -.18 .11 -.06 -1.59 .11
2. Mean number of
board members
2008- 2012
.02 .01 .09 2.76 .01***
3. Age of
organization .01 .01 .06 1.72 .09*
4. Location:
Northeast .19 1.093 .03 .17 .85
5. Location:
Midwest .39 1.091 .07 .36 .72
6. Location: South .22 1.087 .04 .21 .84
7. Location: West .50 1.091 .09 .46 .65
Notes: R2= .016 (N=888); *p < .1; **p< .05; ***p< .01

62
Table 16
Regression analysis summary for measures predicting changes in policy governance
variables, full dataset
Measure B Std Err B β t p
1. Mean assets 2008-
2012 (log10) -.12 .07 -.06 -1.78 .08*
2. Mean number of
board members
2008- 2012
.01 .01 .09 2.76 .01***
3. Age of
organization .00 .00 .04 1.01 .31
4. Location:
Northeast .05 .66 .01 .07 .95
5. Location:
Midwest .19 .66 .06 .29 .78
6. Location: South -.07 .65 -.02 -.11 .92
7. Location: West .16 .66 .05 .25 .80
Notes: R2= .017 (N=888); *p < .1; **p< .05; ***p< .01
Table 17
Regression analysis summary for measures predicting changes in documentation
governance variables, full dataset
Measure B Std Err B β t p
1. Mean assets 2008-
2012 (log10) -.05 .04 -.04 -1.15 .25
2. Mean number of
board members
2008- 2012
.01 .00 .06 1.74 .08*
3. Age of
organization .00 .00 .05 1.28 .20
4. Location:
Northeast .35 .43 .15 .83 .40
5. Location: Midwest .41 .42 .19 .97 .33
6. Location: South .36 .42 .18 .86 .39
7. Location: West .45 .42 .20 1.06 .29
Notes: R2=.009 (N=888); *p < .1; **p< .05; ***p< .01

63
Table 18
Regression analysis summary for measures predicting changes in auditing
governance variables, full dataset
Measure B Std Err B β t p
1. Mean assets 2008-
2012 (log10) -.05 .03 -.07 -2.03 .04**
2. Mean number of
board members
2008- 2012
-.00 .00 -.06 -1.87 .06**
3. Age of
organization .00 .00 .03 .96 .34
4. Location:
Northeast .3 .25 .23 1.28 .20
5. Location:
Midwest .16 .25 .12 .65 .52
6. Location: South .24 .25 .20 .94 .35
7. Location: West .30 .25 .22 1.17 .24
Notes: R2= .021 (N=888); *p < .1; **p< .05; ***p< .01
Categorization of reported governance. Further robustness tests were
conducted on the group of human service nonprofit organization who reported no
changes in their reported governance policies and practices over the five year period.
There were 432 organizations who reported no changes in their governance policies and
practices (Table 19) between 2008 and 2014. This sample was broken down into two
groups, based on their reported governance practices from the 21 variables listed on the
IRS 990 tax form. Groups exhibiting high reported governance (reported governance of
greater than 10) and those who reported low governance (less than or equal to 10) were
formed. Interestingly, out of the organizations that reported no changes in their
governance practices, 344 out of 432 were categorized into the high governance group
(Table 20) and 123 into the low reported governance category (Table 21). This means
that 344 organizations reported 11 or more governance policies and practices over the
five year period. Conclusions can be drawn from this smaller sample that organizations

64
were already potentially practicing multiple forms of governance prior to the introduction
of the governance section on the IRS 990 tax form in 2008. This could also provide
support against coercive institutional isomorphism occurring in human service nonprofit
organizations, because they were already practicing many of the newly reported
governance policies. In other words, 344 human service nonprofit organizations did not
change their reported governance practices as a result of the new questions on the IRS
990 tax form.
Table 19
Descriptive statistics for organizations that reported no change in governance
policies and practices
Measure M SD Range
Min/ Max
Skewness
Statistic/
Std. Error
Kurtosis
Statistic/
Std.
Error
Age 26.05 15.25 3/78 .98/.12 .61/.23
Total net assets
(log10) 5.87 .69 4.49/7.08 -.14/.12 -.66/.23
Notes: N=432
Table 20
Descriptive statistics for organizations that reported no change in governance
practices, high category
Measure M SD Range
Min/ Max
Skewness
Statistic/
Std. Error
Kurtosis
Statistic/
Std. Error
Age 26.15 15.13 4/78 1.05/.14 .88/.28
Total net assets
(log10) 5.94 .64 4.50/7.08 -.11/.14 -.54/.28
Notes: N=309

65
Table 21
Descriptive statistics for organizations that reported no change in governance
practices, low category
Measure M SD Range
Min/ Max
Skewness
Statistic/
Std. Error
Kurtosis
Statistic/
Std. Error
Age 25.79 15.61 3/66 .82/.22 .33/.43
Total net assets
(log10) 5.71 .78 4.50/7.08 .02/.22 -.99/.43
Notes: N=123
T-tests. T-tests were conducted in order to statically understand if there was a
significant difference between the high and low governance groups, based on the
coercive isomorphic indicators age and total net assets (Table 22 & 23). Results indicated
statistical significance, (.000, 2-tailed test) for both age of the organization and total net
assets of the organization. This statistical significance indicates there is a difference
between the high and low reported governance groups based on the isomorphic indicators
of age and size (total net assets). Confidence intervals set at 95% resulted in an upper and
lower bound of minimal difference. There was a significant difference between the mean
age of the high and low reported governance groups, t(308)= 30.38, p=.000. Significant
results were also indicated between the mean total net assets of the high and low reported
governance groups, t(308), p=.000. These result support hypothesis H1b; larger and older
nonprofit human service organizations reported higher levels of governance.

66
Table 22
T-test, comparison of high/ low reported governance groups mean age
Measure M SD t p 95% Confidence Interval
Lower/ Upper
Mean age of high
governance group 26.15 15.13 30.38 .000*** 24.46/ 27.85
Mean age of low
governance group 25.79 15.61 18.33 .000*** 23.00/ 28.57
Notes: N= 432; ***p< .001
Table 23
T-test, comparison of high/low reported governance groups mean total net assets
Measure M SD t p 95% Confidence Interval
Lower/ Upper
Mean total net assets
(log10) of high
governance group 5.94 .64 163.37 .000*** 5.87/ 6.01
Mean total net assets
(log10) of low
governance group
5.71 .78 81.53 .000*** 5.57/ 5.85
Notes: N= 432; ***p< .001
67
Chapter 5
Discussion
The statistical analysis of the reported governance practices from the IRS 990 tax
form indicate that there have been increases in reported governance policies and practices
in human service nonprofit organizations since the introduction of the new governance
sections in 2008. The factor analysis offered the avenue to codifying the variables from
the IRS 990 governance sections. The extracted components supported the literature and
theory review based on nonprofit governance. The trend analysis visually showed the
changes of reported governance policies and practices over time. The results provided
support to hypothesis H1a: Human service nonprofit organizations will report increasing
practices of governance over time. In order to follow up in these results, a t-test was
conducted. Results indicated that there was a significant difference in 2008 and 2012
reported governance practices. The t-test results offered further support for H1a.
Therefore, it can be concluded that there are increasing practices of reported governance
in nonprofit human service organizations since the 2008 change in the IRS 990 tax form,
which was initially prompted by the 2002 Sarbanes-Oxley Act.
Regression results were conducted to determine if specific coercive isomorphic
indicators directly related to changes in reported governance practices. Results revealed
the control variable board size, and the coercive isomorphic indicators of age and total
net assets as significant predictors. The age of an organization and the mean total net
assets had minimal support revealed through the robustness regression models. However,
the control variable, board size, was the only significant predictor across both the initial
regression models and the robust regression models.

68
Findings within this dissertation study indicate further support to the previous
research that board size influences organizational decision making. As seen through the
regression models, the size of the board significantly relates to changes in reported
governance practices in the human service nonprofit subsector. Per federal guidelines, all
nonprofit organizations are required to have boards of directors. Whether this was put
into place as an oversight mechanism or in an advisory role, this study as well as previous
studies provide support that all nonprofits need to have boards and that these boards
significantly impact the organizational environment. Mean board size for this study was
12.37 with a standard deviation of .35, signifying that there is little spread of the number
of board members across the sample size of 888. This study is in alignment with the
previously research on the optimal board size of 14 members (Ostrower, 2006). The
optimal board size of 14 members was derived from studies that researched
communication, team dynamics, and the ability to come to consensus on issues.
Additional studies related to board size indicate that it has a curvilinear relationship with
governance, specifically focusing on decision-making, communication, team
development, and task-orientation. In this dissertation, I used board size as a control
variable because of the importance of boards in nonprofit organizations. Further, this
study did not discuss or research effectiveness, capacity, or efficiency; therefore,
conclusions cannot be drawn to the relationship between boards and reported use of
governance mechanisms. And it is not the intent of this dissertation to give results that
imply larger boards are better boards or that larger boards lead to better governance. Nor
does more governance equal better governance. Therefore, it is imperative for readers of
this dissertation to understand that board relationships are not linear, but rather can be

69
depicted through a parabola. And there could be a point of diminishing returns related to
board size and decision making. Overall, it is evident that the board is an influential
component to the leadership of nonprofit organizations. The board makes oversight
decisions and guides the organization based on their mission and vision, but more board
members does not yield better leadership, just as more governance does not mean better
governance.
Through the continued testing of hypothesis H1b: Human service nonprofit
organizations that are larger and older will report more consistent governance practices,
thereby exhibiting fewer changes to their governance policies and practices over time.
Robustness test, in the form of t-tests, were completed. Results indicated a statistically
significant difference between the means of age and total net assets of organizations
reporting no changes in their governance practices in two different t-tests, between
groups of high and low governance. Results supported coercive institutional isomorphic
theory that organizations who are more mature and are larger (based on total net assets)
are less likely to change practices over time. Results could be understood as organizations
that are older and larger are more stable and secure in their environment, therefore
environmental changes are not having as much of an effect on them as newer and smaller
nonprofit organizations. This directly ties to organizational theory, specifically
environmental ecology, through the liability of newness and liability of smallness, stating
that smaller organizations have a lower capacity, they are unable to make as many
changes or provide as many responses because of environmental triggers (Hannan &
Freeman, 1977:1984; Singh & Lumsden, 1990). Furthermore, there could be an argument
made that older organizations exhibit a hierarchical structure and house a higher level of

70
capacity, compared to smaller organizations; therefore, these organizations have policies
and procedures in place to gather needed information and make an informed supported
decisions. Liability of smallness and liability of newness theories purport that smaller
organizations have lower capacity ability and have a tendency to make quick uninformed
decisions that need to be amended or overturned (Poole & Van de Ven, 2004).
Furthermore, smaller and newer organizations potentially do not have the maturity or
organizational ability to recognize or pick up on coercive signals as quickly and in as
much of a timely manner as their larger and older counterparts.
Limitations
There was not an already constructed and verified database with IRS 990 tax form
data for Part VI and XII, prior to this study. This made it difficult and increased the error
term. Not only did I hand code each and every Part VI and Part XII for 1000
organizations over a five year period, but I also input those individually into an excel data
sheet. Therefore, one of the major limitations to this study and points of concern is the
potential researcher error. Further limitations exist in that data itself. Since this is self-
reported data, there could be a case for box checking and/or misunderstanding of the
questions. Previous research and publications alluded to the notion that nonprofit
organizations were not completing the IRS 990 tax form’s new section because of lack of
proper education and information regarding those new sections (Guidestar, 2009;
Independent Sector, 2010). Organizations might feel compelled to respond affirmatively
to the governance questions which would also bias the data towards higher governance
levels.

71
Another limitation concerns the variable construction. When constructing the
change variables, I had to take ordinal variables, those coded zero and one and aggregate
them to create the change variables. This was the only way to run a linear regression.
When aggregating the variables, there is a loss of information. You cannot decipher each
variable component for itself; meaning that when you combine or aggregate multiple
variables into a composite variable you are unable to parse out further information from
within that new composite variable. Therefore, the model was not able to detect specific
changes based on individual questions related to the IRS 990 tax form. In addition, when
aggregating the numbers, and computing time five (T5)- time one (T1), there is another
potential loss of information. An organization could end up showing no changes when
they actually increased or decreased their reported governance, however this was
accounted for in the follow-up analysis.
Generalizability
A randomized sample of 501c3, human service operating charities in the United
States of America, derived from the NCCS core dataset, which is a nationally recognized
database, was utilized in this study; therefore, this study is generalizable to the nonprofit
human service sector. As of 2012, there were over 60,000 organizations classified under
the NTEE major code ‘HU’ or human service. The study’s sample size included nearly
2% of the reported population. Human service nonprofit organizations include criminal
and legal entities, youth development organizations, and relief centers. The NTEE code
of human service was specifically targeted because of the range of goods and services
included under this code. Results from this study focus on leadership as seen through the
board of directors of nonprofit human service organizations. This study is replicable and

72
easily transferable to another nonprofit sub-sector. Furthermore, even though this study
utilized an organizational level of analysis, the individual nonprofit executive director
and the nonprofit board president can relate to the overall message of the results: coercive
isomorphic forces have the ability to change reporting behavior. Whether or not they
actually change root governance behaviors is still open to questions. Furthermore, the
IRS 990 tax form can be used to understand an organization and the questions presented
in the governance section can be used to learn more about an organization. These results
are informative to the general public, in understanding that there are increasing reported
use of governance policies and practices thereby potentially increasing the transparency
and accountability of the nonprofit sector.
Conclusion
The results from this study have implications for leadership in the nonprofit sector
as understood through reported governance practices. Not only was information utilized
that was publically available, it was utilized in a manner that has not been done before.
Results are in alignment with coercive institutional isomorphism theory and nonprofit
governance literature. It was found that the coercive isomorphic indicators of age and
total net assets are significant in predicting changes in nonprofit governance reported
practices. Additionally, the control variable of board size was found to have a significant
impact on reported nonprofit governance policies and practices according to the IRS 990
tax form. As discussed in the literature review, coercive institutional isomorphism theory
was originally founded, researched, and tested on the for-profit sector. Though over time
studies have applied institutionalism to the nonprofit sector (Cornforth & Brown, 2014;
Cornforth, 2011), it is not as common of a scholarly occurrence. Therefore, in addition to

73
the results yielded through my quantitative dissertation, the research designed supported
and guided through coercive institutional isomorphism is a positive contribution to the
nonprofit scholarly community.
Results suggest that there are changes occurring in reported governance practices
in the nonprofit sector, but the test models clearly present evidence that there are
variables not being accounted for. What are these variables? Are they unique to the
human service sector of operating charities in the United States or are there other
influences impacting the nonprofit sector in general? This dissertation clearly uncovered
that there were changes, suggesting the use of more governance policies and practices in
nonprofit human service organizations post Sarbanes-Oxley. However, the exact cause or
effect has yet to be determined.
These results indicate that there is evidence of an increased usage of reported
governance policies, practices, and procedures since the 2002 Sarbanes-Oxley Act and
the implementation of the new IRS 990 tax form questions. This is understood through
the IRS 990 tax form’s governance questions. Results from this study have the ability to
assist nonprofit leadership, specifically nonprofit boards and nonprofit practitioners.
There are over 1.4 million 501c3 social benefit organizations operating in America. It is
the increasing task and challenge of researchers to become familiar with and to utilize all
available data to assist nonprofit practitioners. This dissertation offers an understanding
of the new governance questions on the IRS 990 tax form related to changes in reported
practices in human service nonprofit organizations. As seen in this study, through the
completion of a factors analysis, results indicated that the IRS 990 tax form Part VI and
Part XII questions were in alignment with purported governance best practices: policies

74
and procedures, documentation of meetings, and the use of auditing committees. These
further relate to essential components of organizational leadership: policies,
documentation, communication, and board meeting practices.
The results from this study are available to assist the seasoned practitioner, the
new nonprofit director, government agencies, and other regulatory bodies. This provides
an understanding and evidence that nonprofit organizations are not in limbo, but rather
are continually changing and passion driven organizations. This shows that they are
affected, in one or another, by their organizational environment. However, this also
means that organizations need to be aware of their external environments. Organizational
change theory presents the foundation for understanding that the organizational
environment is influential to organizational decisions. Through adaption to the
environment, selection of the specific type of environment you want to reside in, or
embeddedness into the environment, it is essential that organizations learn to work with
and for their surroundings. Therefore, it is the responsibility of the organizational leaders
to understand what types of coercive measures they may want to consider, recognize, and
potentially avoid. These could include understanding the economic and socioeconomic
region the organization operates in or being connected to the public sphere and paying
attention to new rules and regulations at the state level. Through the results of this study
that supported Hypothesis H1b, coercive isomorphic indicators of age and total net assets
are significant indicators of change. Organizations need to be aware of their mission,
vision, values, and understand their organizational maturity. When focusing on potential
influences that might be coercive, it is imperative for organizations to have by-laws and

75
understand their decision making processes, in order to not make knee jerk reactions to
their environmental changes.
Furthermore, it has been the objective of this research, to utilize data, via
statistical representation, and represent how it applies to the practitioner. Hypothesis H1a,
was supported and organizations were found to positively report usage of more
governance policies, practices, and procedures over time. Support was found for
hypothesis, H1b: Human service nonprofit organizations that are larger and older
reported more consistent governance practices, thereby exhibiting fewer changes to their
governance policies and practices over time. Age and total net assets were found to be
significantly different, through the robustness t-test, when the organizations were
classified into high and low reported governance categories. This lends support that
larger and older organization are more stable.
However, when the initial regression models were conducted, age and total net
assets were not found to be significant indicators. This could lend support to the
advancement and development of smaller and newer nonprofit organizations. Perhaps
these new and therefore less experienced nonprofit organizations are starting on a better
more knowledgeable level or more secure footing or understanding than their
predecessors. This could be due to many factors, most of which need to be asked through
interviews and a qualitative study. However, the most prominent factor may be that the
new nonprofit organizations are being formed with more informed and knowledgeable
leaders. This dissertation does not delve into individual leadership or motivation to lead,
but it could be that nonprofit leaders are coming to nonprofits with more experience than
in the past or that the formation of new nonprofits are being completed and carried out by

76
more seasoned professionals. This would be a great future research line, seeking to
understand the different education and experience levels of executive directors and staff
members, compared to isomorphic institutional indicators.
Nonprofit organizations, as researched throughout this study, were found to have
elements of conformity. However, this was only evident when measuring the reported
practices of governance on an aggregate scale. Based on the literature and the theoretical
framework, conformity leads to a higher level of public perceived legitimacy. Though
results confirmed my hypotheses, research results are not generalizable to the entire
nonprofit sector, since I only studied human service nonprofit organizations. However, it
would be useful for this study to be replicated in other nonprofit sub-sectors.
Furthermore, there needs to be replicate studies that are able to offer a continuation of
this line of inquiry to further track and report changes over time.
Implications
Leadership in the American nonprofit sector has many influences and results from
this research are twofold, both aimed to allow for practitioner understanding as well as a
strong contribution to the scholarly community. The need for results to be available,
comprehensible, and interpretable for the nonprofit leader is crucial. Not only do research
results yield a better and more widespread understanding of the nonprofit field, but also
research supported practices aid the nonprofit director in securing grants, increasing
acceptability, and substantiating and maintaining best practices. The research design,
literature reviewed, foundational theory support, and the discussion offer a strong base
for comprehensive understanding. Additionally, my endeavor to gather data from IRS
990 tax forms and then code it into a comprehensible and manageable format provided a

77
basis for continued coding of this data. If complete data from the IRS 990 tax forms was
coded and made available through databases such as The Urban Institute’s NCCS system,
scholarly researchers would then have access and the ability to confer multiple theories
and best practices. Furthermore, availability of any data from the nonprofit sector helps to
increase know-how and to support nonprofit leaders.
Specifically, results that indicated support for board size as an indicator are
crucial to the overall nonprofit sector. Choosing the right board, the most knowledgeable
boards, and the board that fits with the organizational mission is imperative for nonprofit
practitioners. Through this study, result indicated the significance of boards as an
influential contributor to reported governance change over five years. Previous studies
have expanded on the overall significance of boards and board members (Gill, Flynn, &
Reissing, 2005; Ostrower & Stone, 2006; Cornforth, 2011). Implications from this study
related to boards and there overall impact as an indicator of change add a contribution to
the nonprofit scholarly research field as well as assist the practitioner in understanding
the importance of boards.
Future Research
My dissertation lays the groundwork for multiple future studies, as well as my
own research agenda. I plan to continue to research nonprofit organizations throughout
my academic tenure. As an organizational leadership scholar, I have situated my research
interest completely within the nonprofit sector. The foundation that my dissertation
establishes is an incredible help and asset to my research career. A few lines of inquiry
that I hope to carry out over the next few years include a qualitative examination of the
results offered through this study. I anticipate conducting interviews with nonprofit

78
directors and their board presidents, attempting to follow-up on the IRS 990 tax form
reported governance policies, practices, and procedures. Additionally, it would be a
unique and stand-alone mixed methods endeavor to survey nonprofit organizations that
report having an audit committee and discuss the use of an independent auditor verses an
in-house audit. Other lines of inquiry include broadening the scope of this research
design, to include more of the nonprofit sector in order to offer more cross sectional
insights and generalizability. Other researchers might take up the challenge to find
relationships between objective economic measures and reported policies and practices,
such that there might be connections between grant awards, government support, or even
compensations and reported governance practices. Other lines of inquiry could delve into
a philanthropic lens, offering an understanding if agencies who report more or consistent
use of governance mechanisms received larger or more stable funding streams.
My main research agenda, post dissertation, is to advocate and promote the use
and inclusion of publically available data to nonprofit researchers and practitioners. I
intend to continue collecting 501c3 IRS 990 tax form data and adding to my database.
However, I believe that data such as this should be available, at no cost, to the masses.
This is especially true, if this data will help strengthen the nonprofit field, as shown to be
the case in the conclusion of my dissertation.
Conclusion Summary
This study focused on nonprofit leadership as seen through the reported
governance in social benefit organizations in the United States. Results in this study are
helpful to nonprofit organizations. As depicted in the trend analysis the changes included
on the IRS 990 tax form have an influence on the reported governance measure being

79
carried out by human service nonprofit organizations. Key findings of this dissertation
study reflect support of the hypotheses, that nonprofit organizations are exhibiting
increased reported governance practices since governance questions were added to the
IRS 990 form in 2008. Older and larger human service nonprofit organization report
more consistent use of governance practices, indicating coercive isomorphism, imposed
by the new forms, are influencing reporting behavior. With continued availability of data
sources and constructed databases, the arena of nonprofit sector research will hopefully
expand exponentially. This will further lead to better informed evidence-based best
practices.

80
Endnotes
i The creation and establishment of an over-arching Public Company Accounting Oversight Board
(PCAOB), under the Security and Exchange Commission (SEC), was a product of the Act. The PCAOB’s
purpose is to oversee the activities of the auditing profession. ii Historically, resource dependency theory (Pfeffer & Salancik, 1978), agency theory, and institutional
theory (DiMaggio & Powell, 1983) are used to understand nonprofit governance. Recent literature notes the
need to combine theories and apply a more multi-disciplinary view to the overall nonprofit sector, and
particularly nonprofit governance (Cornforth, 2004; Ostrower & Stone, 2010). To address the shortcomings
in research, scholars offer combined theory approaches, with perspectives from various disciplines. As
noted previously, resource dependency theory and institutional theory were among the most frequently
used single-dimensional theoretical approaches. Guo and Acar (2005) combined those two theories with
network theory to understand formal and informal collaborations. Results indicated that multiple
environmental factors influence forms of collaboration. In 2011, Jegers and Wellens also combined
resource dependency theory with institutional theory, while incorporating the literature on participatory
governance practices. Jegers and Wellens’ study focused on offering guidelines pertaining to beneficiaries
of nonprofit organizations, specifically discussing how benefactors should be involved regarding
governance and policy. There have been attempts to utilize a combined methodology. Cornforth and Brown
attempted to raise issues related to the varied co-modeling of multiple theories to fill informational gaps to
shed further understanding on particular practices within the field.

81
Appendix A
IRS 990 Tax Form Part VI & Part XII

82

83
Appendix B
Institutional Isomorphism diagram

84
Appendix C
Winsorization equation
FREQUENCIES VARIABLES Meanassets2008_2012log10 /format = notable /
PERCENTILES = 5 95.
COMPUTE winsor_assets = Meanassets2008_2012log10.
if Meanassets2008_2012log10 <=4.49355 windsor_assets= 4.49355.
if Meanassets2008_2012log10 >=7.07552 windsor_assets= 7.07552.

85
Appendix D: Correlation of independent variables, entire dataset
Means, standard deviations, and correlations of independent variables, entire
dataset
Correlations
Measure M SD 1 2 3 4 5 6
1. Mean
assets 2008-
2012 (log10)
5.833 .798
2. Mean
number of
board
members
2008- 2012
11.87 13.230 .123**
3. Age of
organization 29.92 92.096 .004 -.002
4. Location:
Northeast .21 .410 .064* -.040 -.017
5. Location:
Midwest .23 .421 .002 -.017
-
.285**
-
.285**
6. Location:
South .33 .469 -.039 .095**
-
.363**
-
.379**
-
.379**
7. Location:
West .23 .418 -.018 -.048
-
.282**
-
.295**
-
.375**
-
.375**
Notes: * p < .05, **p < .01. (N=958)

86
Appendix E: Factor Analysis 2008
Factor analysis, extracted component matrix, 2008
Components
1 2 3 4 5 6 7
Factors
Part VI Q2 .003 -.027 .304 .294 .547 -.348 -.163
Part VI Q3 .004 .200 .030 .690 .012 .357 .050
Part VI Q4 -.112 .157 .128 .279 -.316 .305 -.320
Part VI Q5 .074 .350 .170 .143 .050 -.201 .679
Part VI Q8a .258 .593 .287 -.293 -.162 -.149 -.110
Part VI Q8b .247 .633 .275 -.214 -.096 -.099 -.196
Part VI Q9 .012 .520 .336 .055 -.120 .280 .076
Part VI Q11 .482 .135 -.050 -.130 .062 .041 .110
Part VI Q12a .750 .145 -.241 .046 .178 .039 .041
Part VI Q12b .708 .297 -.284 .188 .240 -.026 -.157
Part VI Q12c .708 .267 -.274 .218 .200 -.086 -.146
Part VI Q13 .765 -.102 -.154 -.043 .029 .022 -.006
Part VI Q14 .721 -.142 -.182 -.149 -.111 -.012 .087
Part VI Q15a .727 -.125 -.062 .107 -.395 -.138 .078
Part VI Q15b .602 -.118 -.105 .160 -.486 -.112 .143
Part VI Q18 ,237 -.059 -.189 -.269 .078 .413 -.261
Part VI Q20 .214 .142 -.022 -.325 .324 .473 .323
Part XII Q1 .483 -.283 .383 -.010 .118 .071 .147
Part XII Q2a .534 -.304 .476 .101 .010 .254 -.061
Part XII Q2b .588 -.393 .486 -.031 .040 .071 .025
Part XII Q2c .484 -.082 .297 .091 .037 -.230 -.288

87
Appendix F: Factor Analysis 2009
Factor analysis, extracted components matrix, 2009
Components
1 2 3 4 5 6
Factors
Part VI Q2 -.004 .046 .378 .090 .333 -.530
Part VI Q3 .016 .305 .103 .576 .206 .305
Part VI Q4 -.140 .156 .165 .140 .084 .484
Part VI Q5 .050 .269 .215 .418 -.120 -.303
Part VI Q8a .230 .541 .277 -.298 -.383 -.125
Part VI Q8b .203 .629 .257 -.235 -.213 -.034
Part VI Q9 -.040 .436 .342 .027 .026 .364
Part VI Q11 .467 .152 -.016 -.145 -.074 -.032
Part VI Q12a .718 .179 -.217 -.007 .131 -.036
Part VI Q12b .691 .348 -.292 .078 .318 -.074
Part VI Q12c .587 .290 .290 .111 .291 -.119
Part VI Q13 .770 -.065 -.178 .019 .014 .024
Part VI Q14 .726 -.133 -.189 -.053 -.173 .018
Part VI Q15a .724 -.134 -.054 .217 -.316 .057
Part VI Q15b .612 -.130 -.079 .304 .387 .124
Part VI Q18 .234 -.019 -.139 -.370 -.042 .292
Part VI Q20 .192 .069 .001 -.356 .486 .183
Part XII Q1 .487 -.288 .382 .031 .082 -.012
Part XII Q2a .553 -.243 .485 -.019 .131 .229
Part XII Q2b .615 -.365 .460 -.047 .072 .013
Part XII Q2c .514 -.105 .257 -.124 .031 -.162

88
Appendix G: Factor Analysis 2010
Factor analysis, extracted components matrix, 2010
Components
1 2 3 4 5 6
Factors
Part VI Q2 .009 .112 .420 .070 -.223 -.503
Part VI Q3 -.003 .370 .108 .557 .217 .208
Part VI Q4 -.148 .160 .156 .133 .238 .312
Part VI Q5 .000 .263 .254 .492 -.258 -.213
Part VI Q8a .184 .563 .179 -.386 -.378 .160
Part VI Q8b .198 .656 .161 -.292 -.128 .091
Part VI Q9 -.073 .374 .252 .041 .422 .291
Part VI Q11 .468 .119 -.059 -.119 -.074 .013
Part VI Q12a .713 .128 -.237 .045 .033 -.099
Part VI Q12b .672 .322 -.329 .123 .164 -.248
Part VI Q12c .689 .261 -.312 .151 .120 -.255
Part VI Q13 .773 -.045 -.176 .002 .024 .027
Part VI Q14 .724 -.147 -.170 -.058 -.123 -.125
Part VI Q15a .745 -.158 -.015 .177 -.207 .268
Part VI Q15b .608 -.172 .021 .279 -.247 .349
Part VI Q18 ,250 -.019 -.158 -.357 .163 .201
Part VI Q20 .178 .043 -.036 -.167 .539 -.319
Part XII Q1 .493 -.228 .424 .052 .082 .099
Part XII Q2a .568 -.122 .484 -.070 .275 .123
Part XII Q2b .630 -.274 .474 -.093 .120 -.043
Part XII Q2c .511 -.022 .284 .158 -.080 -.156

89
Appendix H: Factor Analysis 2011
Factor analysis, extracted component matrix, 2011
Components
1 2 3 4 5 6 7 8
Factors
Part VI Q2 .012 -.050 .267 .462 .403 .212 .428 -.080
Part VI Q3 -.020 .267 .307 -.440 .312 .317 -.205 -.044
Part VI Q4 -.154 -.093 .090 .302 .120 -.290 -.438 .414
Part VI Q5 .055 -.052 .230 .011 .238 .202 .417 .632
Part VI Q8a .293 .515 .017 .530 -.310 .128 -.044 .009
Part VI Q8b .241 .690 .227 .210 -.253 -.016 -.088 -.051
Part VI Q9 -.003 .462 .495 -.421 .044 .006 .086 .123
Part VI Q11 .474 .076 -.036 .025 -.148 .229 .115 .271
Part VI Q12a .678 -.023 -.078 -.081 -.168 -.041 .131 .190
Part VI Q12b .574 .372 -.323 -.050 .436 -.293 .090 -.074
Part VI Q12c .683 .325 -.341 -.039 .456 -.241 .040 -.066
Part VI Q13 .781 -.035 -.139 -.092 -.059 -.081 .026 .090
Part VI Q14 .738 -.129 -.172 -.085 -.187 .046 .000 .090
Part VI Q15a .766 -.738 -.087 -.054 .001 .276 -.237 .031
Part VI Q15b .638 -.217 -.113 -.085 .017 .334 -.284 .110
Part VI Q18 .237 -.007 .013 -.279 -.237 .182 .399 -.361
Part VI Q20 .139 .047 .168 -.243 -.342 -.523 .297 .224
Part XII Q1 .506 -.301 .338 .129 .074 -.200 .062 -.189
Part XII Q2a .558 -.104 .560 -.027 .056 -.141 -.171 -.138
Part XII Q2b .628 -.339 .384 .153 .031 -.186 -.046 -.160
Part XII Q2c .429 .124 .070 .241 .011 .197 .053 .091
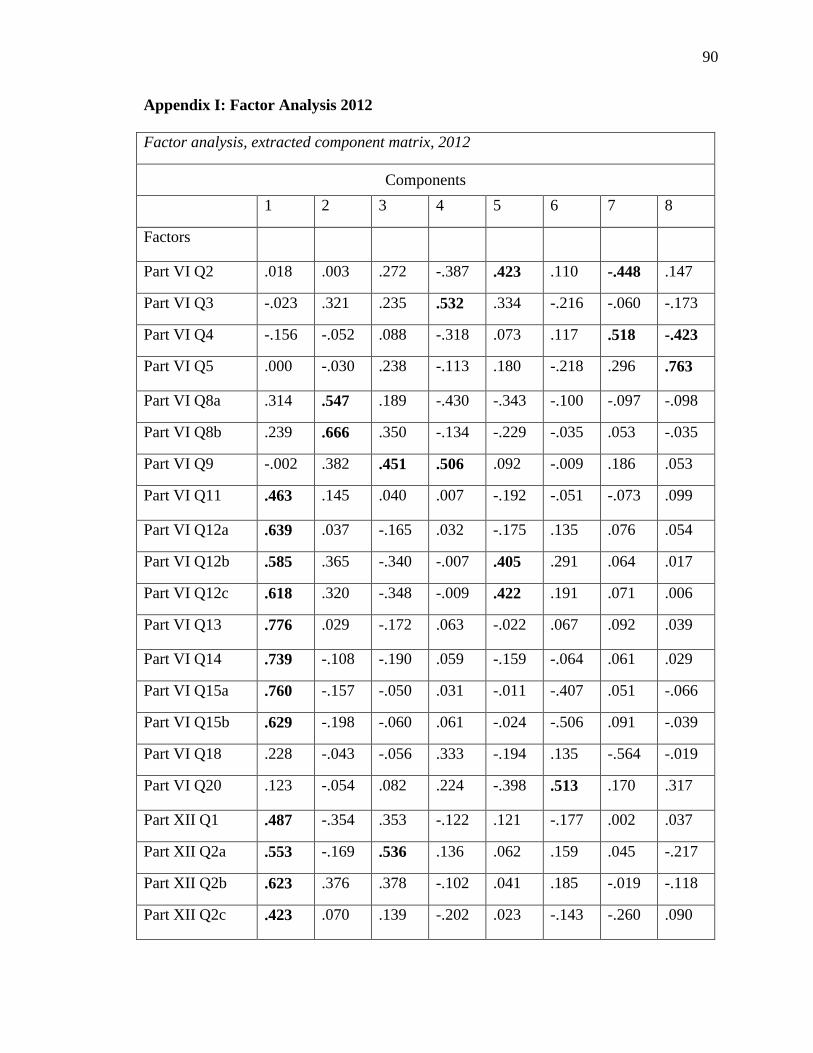
90
Appendix I: Factor Analysis 2012
Factor analysis, extracted component matrix, 2012
Components
1 2 3 4 5 6 7 8
Factors
Part VI Q2 .018 .003 .272 -.387 .423 .110 -.448 .147
Part VI Q3 -.023 .321 .235 .532 .334 -.216 -.060 -.173
Part VI Q4 -.156 -.052 .088 -.318 .073 .117 .518 -.423
Part VI Q5 .000 -.030 .238 -.113 .180 -.218 .296 .763
Part VI Q8a .314 .547 .189 -.430 -.343 -.100 -.097 -.098
Part VI Q8b .239 .666 .350 -.134 -.229 -.035 .053 -.035
Part VI Q9 -.002 .382 .451 .506 .092 -.009 .186 .053
Part VI Q11 .463 .145 .040 .007 -.192 -.051 -.073 .099
Part VI Q12a .639 .037 -.165 .032 -.175 .135 .076 .054
Part VI Q12b .585 .365 -.340 -.007 .405 .291 .064 .017
Part VI Q12c .618 .320 -.348 -.009 .422 .191 .071 .006
Part VI Q13 .776 .029 -.172 .063 -.022 .067 .092 .039
Part VI Q14 .739 -.108 -.190 .059 -.159 -.064 .061 .029
Part VI Q15a .760 -.157 -.050 .031 -.011 -.407 .051 -.066
Part VI Q15b .629 -.198 -.060 .061 -.024 -.506 .091 -.039
Part VI Q18 .228 -.043 -.056 .333 -.194 .135 -.564 -.019
Part VI Q20 .123 -.054 .082 .224 -.398 .513 .170 .317
Part XII Q1 .487 -.354 .353 -.122 .121 -.177 .002 .037
Part XII Q2a .553 -.169 .536 .136 .062 .159 .045 -.217
Part XII Q2b .623 .376 .378 -.102 .041 .185 -.019 -.118
Part XII Q2c .423 .070 .139 -.202 .023 -.143 -.260 .090

91
References
Anheier, H. K. (2005). Nonprofit Organizations: Theory, Management, Policy. London:
Routledge.
Bakale, A. (2009). Revised form 990: The evolution of governance and the nonprofit
world. The Tax Adviser, 40(8), 507-510.
Behn, B. K., DeVries, D., & Lin, J. (2007). Voluntary disclosure in nonprofit
organizations: An exploratory study. Social Science Research Network,
http://papers.ssrn.com/sol3/papers.cfm?abstract_id=727363.
Benjamin, L. M. (2010). Mediating accountability: How nonprofit funding intermediaries
use performance measurement and why it matters for governance. Public
Performance & Management Review, 33(4), 594- 618.
Boardsource. (2010). The Handbook of Nonprofit Governance. Jossey- Bass.
BoardSource. (2012). Nonprofit Governance Index 2012. Washington, DC: BoardSource.
Brothers, J., & Sherman, A. (2011). Building Nonprofit Capacity: A guide to managing
change through organizational lifecycles. San Francisco: Jossey- Bass.
Brown, W. A., & Gou, C. (2010). Exploring the association between board and
organizational performance in nonprofit organizations. Nonprofit and
Management Leadership, 536-546.
Brown, W. A., & Guo, C. (2010). Exploring the key roles for nonprofit boards. Nonprofit
and Voluntary Sector Quarterly, 39(3), 536-546.
Burke, W. W., & Litwin, G. H. (1992). A causal model of organizational performance.
Journal of Management, 18(3), 523- 545.
Burke, W. W., & Litwin, G. H. (2009). A causal model of organizational performance
and change. In Organizational change: A comprehensive reader (pp. 273-299).
California's Nonprofit Integrity Act. (2004). State Senate Bill, 1262.
Caplan, R. (2009). IRS releases redesigned for 990. The Tax Adviser, 40(4), 254-255.
Cornforth, C. (2003). The Governance of Public and Non-Profit Organizations: What Do
Boards Do? London: Routledge.

92
Cornforth, C. (2004). Governance & participation development toolkit. Manchester, UK:
Co-operatives UK.
Cornforth, C. (2004). The governance of co-operatives and mutual associateions: A
paradox perspective. Annals of Public and Co-operative Economics, 75(1), 11-32.
Cornforth, C. (2011). Nonprofit governance research: Limitations of the focus on boards
and suggestions for new directions. Nonprofit and Voluntary Sector Quarterly, 1-
20.
Cornforth, C. (2012). Challenges and future directions for nonprofit governance research.
Nonprofit and Voluntary Sector Quarterly, 41(6), 1117-1136.
Cornforth, C., & Brown, W. A. (2014). Nonprofit Governance: Innovative Perspectives
and Approaches. New York: Routledge.
Cornforth, C., & Spear, R. (2010). The governance of hybrid organisations. In D. Billis,
Hybrid Organizations in the Third Sector: Challenges of Practice, Policy and
Theory. Basingstoke, UK: Palgrave.
DiMaggio, P. J., & Powell, W. W. (1983). The iron cage revisited: Institutional
isomorphism and collective rationality in organizational fields. American
Sociological Review, pp. 147-160.
DiMaggio, P. J., & Powell, W. W. (1991). The new institionalism in organizational
analysis. Chicago: University of Chicago Press.
Galazkiewicz, J., & Bielefeld, W. (1998). Nonprofit Organizations in an Age of
Uncertainty: A study of organizational change. Aldine Transaction.
Gill, M. (2002, June). Building effective approaches to governance. Nonprofit Quarterly.
Gill, M., Flynn, R. J., & Reissing, E. (2005). The governance self-assessment checklist:
An insturment for assessing board effectiveness. Nonprofit Management &
Leadership, 271-294.
Grobman, G. M. (2011). An Introduction to the Nonprofit Sector. Harrisburg: White Hat
Communications.
Guidestar. (2009). Understanding the IRS For 990. Guidestar. Retrieved May 2014, from
www2.guidestar.org/rxa/news/articles/2001-older/understanding-the-irs-form-
990.aspx
Guidestar. (2013). Guidestar. Retrieved June 2013, from
http://www.guidestar.org/Home.aspx

93
Guo, C., & Acar, M. (2005). Understanding collaboration among nonprpfit organizations:
Combining resource dependency, institutional, and network perspectives.
Nonprofit and Voluntary Quaterly, 34, 340-361.
Halloran, P., & Higgins, G. (2008). The new form 990. The Bottom Line, 23(7), 22-24.
Hannan, M. T., & Freeman, J. (1977). The population ecology of organizations.
American Journal of Sociology, 82, 929-264.
Hannan, M. T., & Freeman, J. (1984). Structural inertia and organizational change.
American Sociology Review, 49, 149-164.
Harris, P. R. (2013). Developing High Performance Leaders: A behavioral science guide
for the knowledge of work culture. New York: Routledge.
Hillard, M. (2008). The board chair- executive director relationship: Dynamics that create
value for the nonprofit organization. Journal of Nonprofit Management, 8(2), 1-
10.
Hilman, A. J., & Dalziel, T. (2003). Board of directors and firm performance: Integrating
agency and resource dependence perspecitives. Academy of Management Review,
28, 383-396.
Independent Sector. (2009). Accountability. Independent Sector. Retrieved May 2014,
from www.independentsector.org/accountability
Independent Sector. (2010). IRS Form 990. Independent Sector. Retrieved May 2014,
from www.independentsector.org/form_990
Internal Revenue Service (IRS). (2013). Summary of Form 990 Redesign Process.
Retrieved April 2014, from http://www.irs.gov/pub/irs-
tege/summary_form_990_redesign_process.pdf
Internal Revenue Service. (2008-2013). Return of Organization Exempt from Income
Tax. Retrieved 2014-2015, from Internal Revenue Service: www.irs.gov/charities
Jackson, P. M. (2007). Nonprofit strategic planning: Leveraging Sarbanes-Oxley best
practices. John Wiley & Sons.
Jacobs, F. A., & Marudas, N. P. (2009). The combined effect of donation price and
administrative ineffiency on donations to US nonprofit organizations. Financial
Accountability & Management, 25(1), 33-53.
Jensen, M. C. (1993). The modern industrial revolution, exit, and the failure of internal
conrol systems. Journal of Finance, 48(3), 831-880.

94
Kearns, K. P. (1996). Managing for acountability. San Francisco: Jossey-Bass.
Kooiman, J. (1999). Socio-political governance: Overview, reflections, and design.
Public Management, 1(1), 67-92.
Larcker, D., & Rusticus, T. (2006). On the use of instrumental variables in accounting
research. Working Paper: Stanford University.
Larcker, D., Richardson, S. A., & Tuna, I. (2007). Corporate governance, accounting
outcomes, and organizational performance. The Accounting Review, 4(84), 963-
1008.
Ostrower, F. (2006). Urban Institute. Retrieved from Nonprofit governance and the
Sarbanes-Oxley Act: http://www.urban.org/publications/311363.html
Ostrower, F., & Stone, M. M. (2006). Boards of nonprofit organizations: Research trends,
findings and prospects for future research. In W. Powell, & R. Steinberg, The
Nonprofit Sector: A Research Handbook. New Haven, CT: Yale University Press.
Panel, I. (2012). Protecting Independence: The Voluntary Sector in 2012.
www.independencepanel.org.uk.
Poole, M. S., & Van de Ven, A. H. (2004). Handbook of Organizational Change and
Innovation. Oxford University Press.
Powell, W. W., & DiMaggio, P. J. (2012). The new institutionalism in organizational
analysis. University of Chicago Press.
Powell, W. W., & Steinberg, R. (2006). The Nonprofit Sector. New Haven: Yale
University Press.
Provan, K. G., & Milward, H. B. (1995). A preliminary theory of interorganizational
network effectiveness: A comparative study of four community mental health
systems. Administrative Science Quarterly, 40, 1-33.
Provan, K. G., & Milward, H. B. (2001). Do networks really work? A framework for
evaluating public-sector organizational networks. Public Administration Review,
61(4), 414-423.
Provan, K. G., Milward, B., & Isett, K. R. (2002). Collaboration and integration of
cummunity-based health and human services in a nonprofit managed care system.
Health Care Management Review, 27(1), 21-32.

95
Provan, K. G., Milward, H. B., & Isett, K. R. (2002). Collaboration and integration of
community-based health and human services in nonprofit managed care system.
Health Care Management Review, 27(1), 21-32.
Puyvelde, S. V., Caers, R., Du Bois, C., & Jegers, M. (2012). The governance of
nonprofit organizations: Integrating agency theory with stakeholder and
stewardship theory. Nonprofit and Voluntary Sector Quarterly, 41(3), 431-451.
Renz, D. (2006). Reframing governance. (Winter, Ed.) The Nonprofit Quarterly, 6-11.
Salancik, G. R., & Pfeffer, J. (1978). Who gets powers- and how they hold on to it: A
strategic- contigency model of power. Organizational Dynamics, 5(3), 3-21.
Sarbanes-Oxley Act of 2002. (2002). 107th Congress. H. R. 3763.
Singh, J. V., & Lumsden, C. J. (1990). Theory and research in organizational ecology.
Annual Reviews, 16, 161-195.
Smith, D. H. (1991). Four sectors or five? Retaining the member benefit sector. Nonprofit
and Voluntary Sector Quarterly, 20(2), 137-150.
Smith, D. H. (1994). Determinants of voluntary association participation and
volunteering: A literature review. Nonprofit and Voluntary Sector Quarterly,
23(2), 243-264.
Smith, D. H., Stebbins, R. A., & Dover, M. A. (2006). A dictionary of nonprofit terms
and concepts. Indiana University Press.
Smoker, K., & Mammano, K. (2009). The revision of federal form 990: A move toward
SOX-like reform in the nonprofit sector. The CPA Journal, 79(7), 52-55.
Steinberg, R. (1986). The revealed objective functions of nonprofit firms. RAND Journal
of Economics, 17(4), 508-526.
Stinchcombe, A. L. (1965). Organizations and social structure. In J. G. March, Handbook
of Organizations (pp. 153-193). Chicago, IL: Rand McNally.
Sumariwalla, R. D. (1986). Toward a National Taxonomy of Exempt Entities.
Independent Sector.
The Urban Institute. (2013). National Center for Charitable Statistics. Retrieved August
2013, from NCCS: http://nccs.urban.org/index.cfm
The Urban Institute. (2013). National Center for Charitable Statistics. Retrieved June
2014, from National Taxonomy for Exempt Entities:
http://nccs.urban.org/classification/NTEE.cfm

96
The Urban Institute. (2012). Retrieved from The Urban Institute, May 2013:
www.urban.org/nonprofits
Tucker, L. R., & MacCallum, R. C. (1997). Exploratory Factor Analysis: Unpublished
Manuscript. Unpublished. Retrieved from
http://www.unc.edu/~rcm/book/factornew.htm
Wellens, L., & Jegers, M. (2011). Beneficiaries' participation in nonprofit organizations:
A theory- based approach. Public Money & Management, 31(3), 175-212.
Whistleblower. (2011). Merrian-Webster.com. Retrieved December 2014, from Merriam-
Webster: http://www.merriam-webster.com/dictionary/whistle-blower
Yetman, M. H., & Yetman, R. J. (2013). The effects of governance on the accuracy of
charitable expenses reported by nonprofit organizations. Contemporary
Accounting Research, 29(3), 738-767.