nonrevenue water assessment report · nonrevenue water ass. essment report. ... p13 quanxin road...
TRANSCRIPT

Guangdong Chaonan Water Resources Development and Protection Demonstration Project (RRP PRC 46079)
NONREVENUE WATER ASSESSMENT REPORT
Project Number: 46079 January 2014
People’s Republic of China: Guangdong Chaonan Water Resources Development and Protection Demonstration Project

CONTENTS 1 SYNOPSIS ................................................................................................................................................... 1
1.1 GEOGRAPHIC AND HYDROLOGICAL BACKGROUND ................................................................................. 1
1.2 WATER SUPPLY SYSTEM’S STATUS .......................................................................................................... 1
1.4 APPROACH AND METHODOLOGY ............................................................................................................ 2
2 FIELD TEST AND DATA ANALYSIS ......................................................................................................... 4
2.1 ANALYSIS OF PRESSURE TEST RESULTS ................................................................................................. 4
2.2 ANALYSIS OF FLOW TEST RESULTS ................................................................................................................ 5
2.2.1 Xinlian Village ..................................................................................................................................... 5
2.2.2 Zuo Xinkou Residential Quarter ...................................................................................................... 7
2.2.3 Minsheng Hospital ............................................................................................................................. 8
2.2.4 The South Sea Hotel ......................................................................................................................... 9
2.2.5 Huagui Garment Factory ................................................................................................................ 10
2.2.6 Dongming Cosmetics Factory ........................................................................................................ 11
2.2.7 Xinzhong Village .............................................................................................................................. 11
2.2.8 Xigou Village ..................................................................................................................................... 13
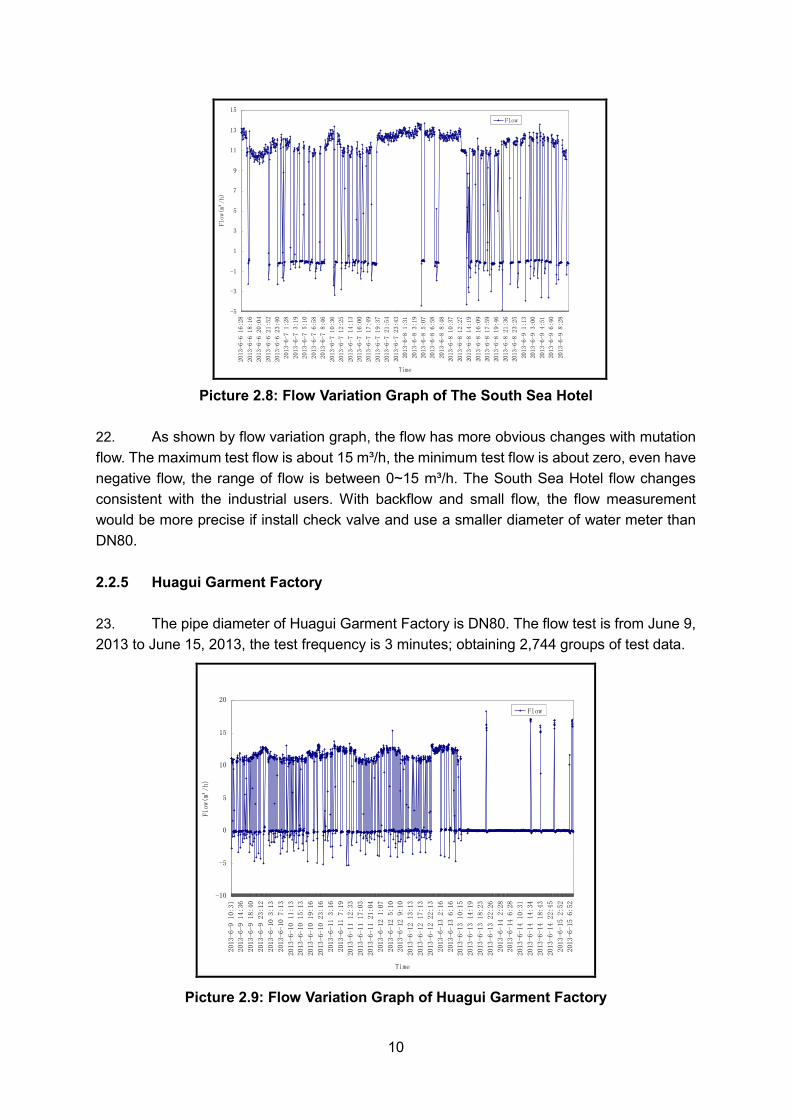
2.3 ANALYSIS OF APPARENT LOSSES BY METERING .......................................................................................... 14
2.3.1 The Analysis of WS200 Performance ........................................................................................... 14
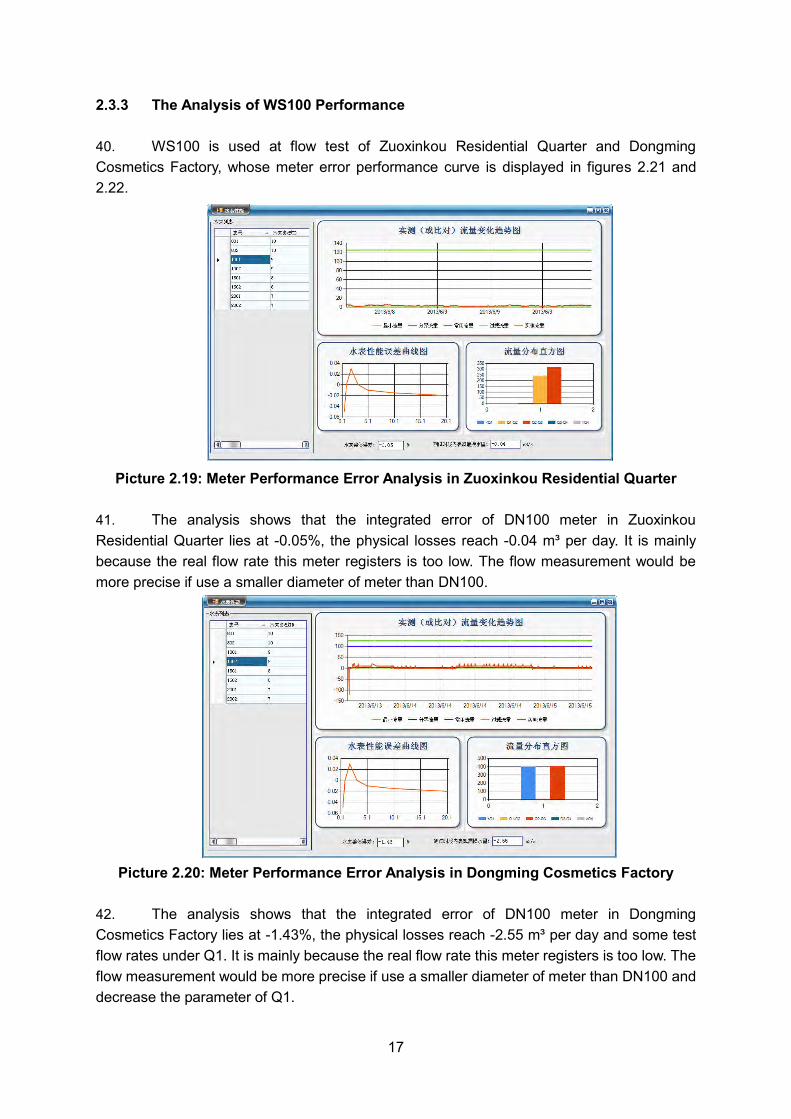
2.3.2 The Analysis of WS150 Performance ........................................................................................... 15
2.3.3 The Analysis of WS100 Performance ........................................................................................... 17
2.3.4 The Analysis of WS80 Performance ............................................................................................. 18
2.4 SUMMARY ............................................................................................................................................ 19
3 ESTABLISHMENT AND CHECK OF WATER BALANCE ................................................................... 19
3.1 WATER BALANCE ANALYSIS THEORY .................................................................................................... 19
3.1.1 Introduction to water balance ......................................................................................................... 19
3.1.2 Steps for establishing water balance ............................................................................................ 20
3.2 WATER BALANCE ANALYSIS OF CHAONAN’S WATER SUPPLY SYSTEM ........................................................... 21
3.2.1 Setting a research period ............................................................................................................... 22
3.2.2 Establishing water balance in hierarchical order ......................................................................... 23
3.2.3 Checking water balance in anti-hierarchical order ...................................................................... 42
4 ASSESSMENT OF CURRENT INFRASTRUCTURE LEAKAGE SITUATION AND ANALYSIS OF
LEAKAGE REDUCTION STRATEGY ............................................................................................................. 46
4.1 TARGETS OF PERFORMANCE INDICATOR SYSTEM ......................................................................................... 46
4.2 RESULTS OF LEAKAGE PERFORMANCE ASSESSMENT .................................................................................... 46
4.2.1 Calculation results of 2012 water balance ................................................................................... 46
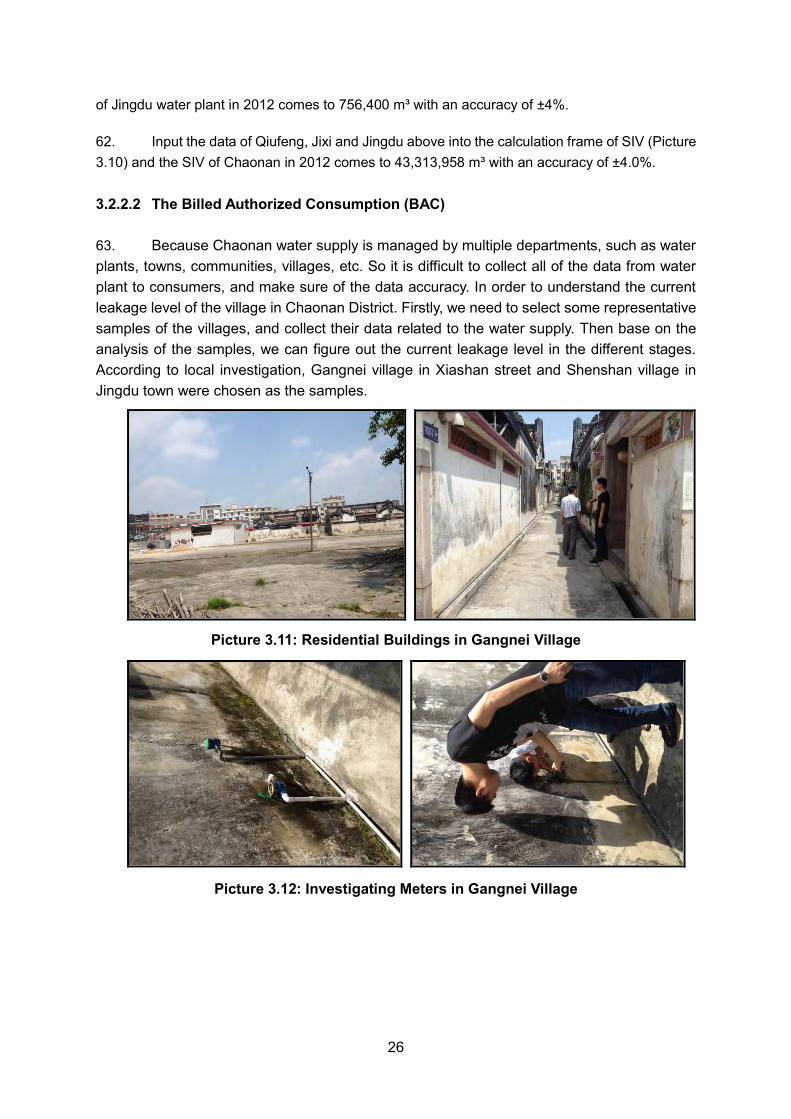
4.2.2 Calculation results of leakage performance indicators .............................................................. 47
4.2.3 Non-Revenue Water (NRW) .......................................................................................................... 50
4.2.4 Infrastructure Leakage Index (ILI) ................................................................................................. 51
4.2.5 Apparent Loss Index (ALI) .............................................................................................................. 52
4.3 ESTABLISHMENT OF CHAONAN’S PERFORMANCE INDICATOR SYSTEM ......................................................... 53
4.4 FURTHER LEAKAGE REDUCTION MEASURES RECOMMENDED ....................................................................... 55

4.5 LEAKAGE MANAGEMENT PROGRAM COST-EFFECTIVENESS .......................................................................... 59
5 DMA ESTABLISHMENT FOR DESIGNING PURPOSE ........................................................................... 61
5.1 INTRODUCTION OF DMA ............................................................................................................................. 61
5.2 DMA ESTABLISHMENT PROCESS .................................................................................................................. 61
5.3 DMA FOR DESIGNING PURPOSE ................................................................................................................... 61
5.4 METER SELECTION ....................................................................................................................................... 61
5.5 DMA DESIGN FOR CHAONAN DISTRICT OF SHANTOU CITY .......................................................................... 62
6 CONCLUSION AND SUGGESTION ........................................................................................................... 64
6.1 CONCLUSION ............................................................................................................................................... 64
6.2 SUGGESTION ................................................................................................................................................ 64
6.2.1 Capacity building (inclusive of institution enhancement) ........................................................... 64
6.2.2 DMA scheme designing and planning .......................................................................................... 65
6.3 ANTICIPATED ACCOMPLISHMENTS OF THE LEAKAGE REDUCTION PROJECT IN CHAONAN ............................. 66

1
1 SYNOPSIS 1.1 Geographic and Hydrological Background
1. Chaonan is one of the districts of Shantou City with the east longitude 23°15' and north latitude 116°24'. Ideally situated in the core of Chaoshan Plain areas with beautiful scenes in the southeast part of Guangdong Province, it is bordered by the South Sea in the east, Puning City in the west, Huilai County in the south, and Chaoyang District in the north, neighboring the No.324 Road. The Lianjiang River flows through the city. The distance of the coast line is 14.7 kilometers (km). It covers 596.42 square kilometers (km2) areas in the downtown, and possessing 11 towns and 232 villages with population of 1,190,000.
2. Chaonan has grown into a booming development in the past few decades. Lianjiang River provides rich and generous water resource. Jinxi, Longxi, and Qiufeng reservoirs are located in Chaonan; and yearly precipitation reach 1,700 millimeters (mm), plentiful than national average lever. Textile, chemical, and electron and stationery industry are playing important roles in local economic development. However, because of water pollution issues of Lianjiang and other streams, Chaonan are facing serious water shortage problems, which cannot meet domestic and industry water demand in the future. 1.2 Water Supply System’s Status 3. There are 4 main water treatment plants (WTPs) in Chaonan area. One is a biggest water plant named Qiufeng WTP with capacity of 70,000 cubic meters (m³) per day, others are Chengtian, Jingdu, and Jinxi WTPs, with output volume 40,000 m³ per day, 10,000 m³ per day, and 10,000 m³ per day, respectively. They all take raw water from reservoirs. Meanwhile, because of no secondary water supply pump station taking active effects, pipe average pressure (0.1 MPa) is lower than any other cities of the People’s Republic of China (PRC). The daily peak demand has seen rapidly growth during the several years and reached 130,000 m³ or so.
Picture 1.3: Layout of Water Systems in Chaonan

2
4. Currently supporting population of over 0.2 million people, Qiufeng’s water supply network has bloomed rapidly by the end of 2012. Chaonan water supply corporation distributes Qiufeng‘s safe water directly to its customers in Liangying and Xiashan towns mainly, which covers 1/4 areas of Chaonan. However, other water systems, such as Chengtian, Jingdu, Jinxi, and Longtian, provide water services to their small-scale customers with ageing pipelines.
Picture 1.4: Sedimentation Tank of Jinxi Water Treatment Plant in Chaonan
5. Different WTPs have their own water supplying regions. There are no links between two neighboring regions. Branch modes (not loop mode) of water distribution layout are common in this area. Thus, safety and reliability of water supplying are important according to reorganizing the urban and rural current discrete water systems. Same water tariff collection will be provided to all of Chaonan administration areas and equal water service will realize in the future. 6. The district current water supply systems were built during 1980s to serve both urban (small towns) and rural villages using low technical standards due to funding constraints. The Chaonan Water Supply Company, as the implementing and operating agency of the overall water supply system to be established under the project, controls only part of distribution pipelines resulting in inadequate maintenance of the networks. In addition, it currently supplies water through towns and/or villages to the end users without charging tariff directly from the end users. The arrangement results in different tariff collection rates. Due to the ageing pipelines and lack of proper maintenance, low technical standards, and indirect control to majority of pipeline networks and tariff collection by the company, nonrevenue water (NRW) becomes a major concern which the project design has to further look into.
1.4 Approach and Methodology 7. Workflow of consultation for NRW consultant is shown as Picture1.5.

3
Picture 1.5: Workflow of Consultation for NRW Consultant

4
2 FIELD TEST AND DATA ANALYSIS 2.1 Analysis of Pressure Test Results 8. The water supply pipe network of Chaonan District like strip distribution and trunk pipe is east-west. Waterworks located in the west and supply water to the east by gravity. To overall the supply pressure of Chaonan District and on the basis of the status of Chaonan water supply network and geographical trend to choose 35 measuring points.
Picture 2.1: Scatter Diagram of Pressure Measuring Points
9. To avoid abnormal effect of excessively high or low pressure data on the average, the maximum and minimum among the test data are eliminated to determine the average pressure at 0.101 MPa which is 10.1 meters (m). 10. Chaonan has no secondary booster pump station and the distribution of water users is unbalance, so the average pressure of pipe network is significantly lower and unable to meet the water needs.
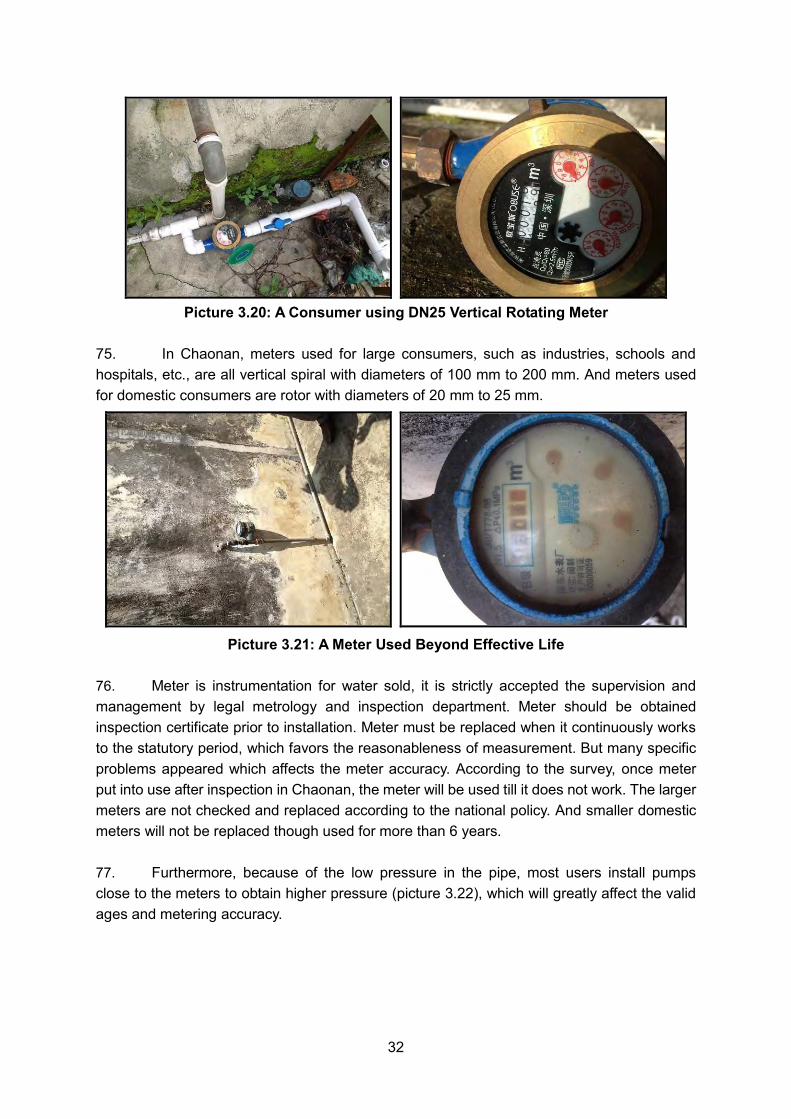
Table 2.1: Statistics of Pressure Test in Chaonan
Location Time Pressure (MPa)
P1 Aifulan Co. Ltd. on Guangshan Road 2013/6/5 10:49 0.008 P2 Yajia Co. Ltd. on Changhong Road 2013/6/5 11:07 0.028 P3 Market on Golden Road 2013/6/5 11:15 0.038 P4 Cross of Xiahua Road and Nanli Road 2013/6/5 11:25 0.017 P5 50 m north of church on Guangxiang Road 2013/6/5 11:40 0.014 P6 Cross of Golden Road and Hongyu Road 2013/6/5 11:55 0.075

5
Location Time Pressure (MPa)
P7 Ximeizhu Village 2013/6/5 15:15 0.161 P8 200 m north of Ximeizhu Village 2013/6/5 15:20 0.160 P9 Jianzupian in Ximeizhu Village 2013/6/5 15:20 0.150 P10 Lidou Village 2013/6/5 15:35 0.154 P11 Shipai Road Xixi Village 2013/6/5 15:45 0.157 P12 Jiaoyang Village 2013/6/5 16:00 0.147 P13 Quanxin Road No. 92 Dabushang Village 2013/6/5 16:20 0.239 P14 Vegetable market in Dabushang Village 2013/6/5 16:30 0.221 P15 Xiangang Village 2013/6/5 16:50 0.000 P16 Xinzhai in Xiangang Village 2013/6/5 16:58 0.000 P17 Cross of Golden Road and Meibiao Road 2013/6/6 10:05 0.061 P18 Liaocuo Bridge on Golden Road 2013/6/6 10:07 0.078 P19 Jinyuan Market on Guangxiang Road 2013/6/6 10:33 0.079 P20 Jingrun Glass Factory 2013/6/6 10:50 0.012 P21 Jinuo Garment Factory 2013/6/6 11:00 0.008 P22 Rongfeng edifice on Dongsan Road 2013/6/6 11:15 0.080 P23 Jiashenghaoting on Dongsan Road 2013/6/6 11:27 0.076 P24 Guangxin Weaving and dyeing Co. Ltd. 2013/6/6 14:40 0.125 P25 Zuobanglu Garment Factory in Xincuo Village 2013/6/6 14:45 0.114 P26 Park of Qiangxin Village 2013/6/6 14:55 0.116 P27 South of Qiangxin Village 2013/6/6 14:58 0.096 P28 Hepu Village 2013/6/6 15:08 0.090 P29 Liangying District 2013/6/6 15:15 0.106 P30 Dejie Electronics Co. Ltd. 2013/6/6 15:23 0.066 P31 Power Supply on Huanshi Road Xilong Town 2013/6/6 15:26 0.081 P32 Xianchengzhen 2013/6/6 11:00 0.145 P33 Chendianzhen 2013/6/6 11:00 0.171 P34 Simapuzhen 2013/6/6 11:00 0.289 P35 Guiyuzhen 2013/6/6 11:00 0.171
2.2 Analysis of Flow Test Results 2.2.1 Xinlian Village 11. The pipe diameter of Xinlian Village is DN200 and 3,300 users. The flow test is from June 5, 2013 to June 9, 2013, the test frequency is 3 minutes; finally obtaining 1,526 groups of test data.

6
0.00
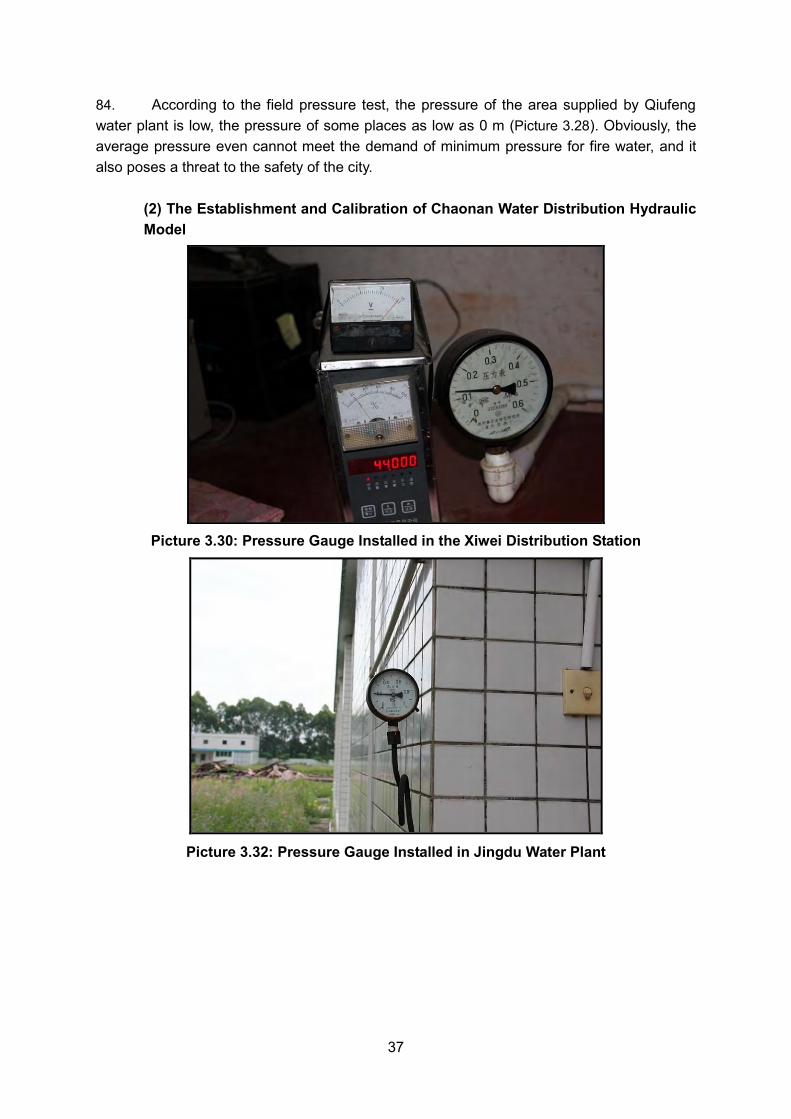
20.00
40.00
60.00
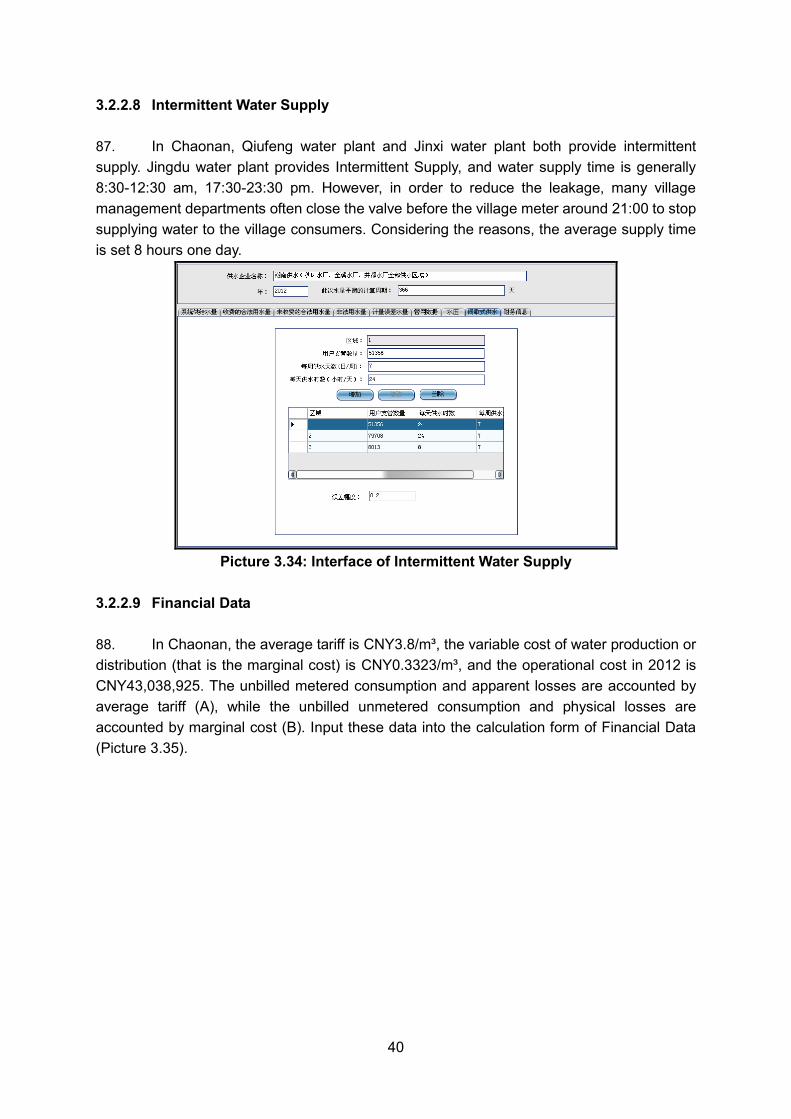
80.00
100.00
120.00
140.00
2013
-6-5
18:34
2013
-6-5
20:52
2013
-6-5
23:10
201
3-6-
6 1:34
201
3-6-
6 3:52
201
3-6-
6 6:10
201
3-6-
6 8:34
2013
-6-6
10:52
2013
-6-6
13:10
2013
-6-6
15:31
2013
-6-6
17:49
2013
-6-6
20:10
2013
-6-6
22:27
201
3-6-
7 0:46
201
3-6-
7 3:03
201
3-6-
7 5:22
201
3-6-
7 7:40
2013
-6-7
10:00
2013
-6-7
12:49
2013
-6-7
15:10
2013
-6-7
17:33
2013
-6-7
19:52
2013
-6-7
22:10
201
3-6-
8 0:28
201
3-6-
8 2:49
201
3-6-
8 5:07
201
3-6-
8 7:25
201
3-6-
8 9:45
2013
-6-8
12:04
2013
-6-8
14:22
2013
-6-8
16:45
2013
-6-8
19:04
2013
-6-8
21:22
2013
-6-8
23:40
Time
Flow
(m³/h
)
Flow
Picture 2.2: Flow Variation Graph of Xinlian Village
12. The minimum test flow is about 36 m³/hour (h) at 1:00 in Xinlian Village. According to the international standard for night consumption of 2.5 liters per hour per service connection, the real night consumption is 8.25 m³/h with over 3,300 service connections in Xinlian Village. The real water use differs from estimate water use by 27.75 m³/h, so the burst leakage of Xinlian Village is about 27.75 m³/h.
0.000
0.050
0.100
0.150
0.200
0.250
2013
-6-5
18:34
2013
-6-5
20:52
2013
-6-5
23:10
201
3-6-
6 1:34
201
3-6-
6 3:52
201
3-6-
6 6:10
201
3-6-
6 8:34
2013
-6-6
10:52
2013
-6-6
13:10
2013
-6-6
15:31
2013
-6-6
17:49
2013
-6-6
20:10
2013
-6-6
22:27
201
3-6-
7 0:46
201
3-6-
7 3:03
201
3-6-
7 5:22
201
3-6-
7 7:40
2013
-6-7
10:00
2013
-6-7
12:49
2013
-6-7
15:10
2013
-6-7
17:33
2013
-6-7
19:52
2013
-6-7
22:10
201
3-6-
8 0:28
201
3-6-
8 2:49
201
3-6-
8 5:07
201
3-6-
8 7:25
201
3-6-
8 9:45
2013
-6-8
12:04
2013
-6-8
14:22
2013
-6-8
16:45
2013
-6-8
19:04
2013
-6-8
21:22
2013
-6-8
23:40
Time
Pres
sure
(MPa
)
Pressure
Picture 2.3: Pressure Variation Graph of Xinlian Village
13. The pressure test results show that average pressure is 0.132 MPa and the maximum is 0.218 MPa at 4:00 and minimum is 0.08 MPa at 8:00. It can be inferred that in Xinlian Village pressure is relatively low and fluctuates wildly in one day.

7
0.00
20.00
40.00
60.00
80.00
100.00
120.00
140.00
2013-6-5 18:34
2013-6-5 20:55
2013-6-5 23:16
2013-6-6 1:43
2013-6-6 4:04
2013-6-6 6:25
2013-6-6 8:52
2013-6-6 11:13
2013-6-6 13:34
2013-6-6 15:58
2013-6-6 18:19
2013-6-6 20:43
2013-6-6 23:04
2013-6-7 1:24
2013-6-7 3:45
2013-6-7 6:06
2013-6-7 8:28
2013-6-7 11:21
2013-6-7 13:45
2013-6-7 16:10
2013-6-7 18:34
2013-6-7 20:55
2013-6-7 23:16
2013-6-8 1:39
2013-6-8 4:00
2013-6-8 6:22
2013-6-8 8:43
2013-6-8 11:06
2013-6-8 13:28
2013-6-8 15:51
2013-6-8 18:16
2013-6-8 20:37
2013-6-8 22:58
0.000
0.050
0.100
0.150
0.200
0.250
Time
Flow
(m³/h
)
Pre
ssur
e(M
Pa)
FlowPressure
Picture 2.4: Pressure and Flow Comparison Graph of Xinlian Village
14. As shown by comparison of test pressure and flow, pressure peaks when flow drops at night, whereas pressure decreases when flow peaks during daytime, which reflects that the operation control does not conform to domestic consumption habit and presents characteristics of typical gravity flow water supply. It is wise to consider improving the operation control mode from production pressure orientation to customer demand orientation which would do well to the integral network pressure balance. 2.2.2 Zuo Xinkou Residential Quarter 15. The pipe diameter of Zuo Xinkou Residential Quarter is DN100 and 300 users. The flow test is from June 6, 2013 to June 9, 2013, the test frequency is 3 minutes; finally obtain 1,599 groups of test data.

8
0
5
10
15
20
25
30
35
40
45
50
2013
-6-6
9:04
2013
-6-6
11:22
2013
-6-6
13:40
2013
-6-6
15:58
2013
-6-6
18:16
2013
-6-6
20:34
2013
-6-6
22:53
2013
-6-7
1:10
2013
-6-7
3:28
2013
-6-7
5:46
2013
-6-7
8:04
2013
-6-7
10:22
2013
-6-7
12:40
2013
-6-7
14:58
2013
-6-7
17:16
2013
-6-7
19:34
2013
-6-7
22:24
2013
-6-8
0:43
2013
-6-8
3:00
2013
-6-8
5:19
2013
-6-8
7:37
2013
-6-8
9:55
2013
-6-8
12:13
2013
-6-8
14:31
2013
-6-8
16:49
2013
-6-8
19:10
2013
-6-8
21:28
2013
-6-8
23:46
2013
-6-9
2:04
2013
-6-9
4:22
2013
-6-9
6:40
2013
-6-9
8:58
2013
-6-9
11:16
2013
-6-9
13:34
2013
-6-9
15:52
Time
Flo
w(m³
/h)
Flow
Picture 2.5: Flow Variation Graph of Zuo Xinkou Residential Quarter
16. As shown by flow variation graph, the minimum test flow is about 0.58 m³/h, the maximum test flow is about 13 m³/h, the range of flow is between 0~15 m³/h. It can be inferred that in Zuo Xinkou Residential Quarter flow is relatively low and the diameter of Water meter is large. It is wise to consider decreasing the diameter of water meter. 2.2.3 Minsheng Hospital 17. The pipe diameter of Minsheng Hospital is DN150. The flow test is from June 6, 2013 to June 9, 2013, the test frequency is 3 minutes; finally obtaining 1,385 groups of test data.
-20
0
20
40
60
80
100
120
2013
-6-6
16:29
2013
-6-6
18:31
2013
-6-6
21:03
2013
-6-6
23:04
201
3-6-
7 1:04
201
3-6-
7 3:04
201
3-6-
7 5:04
201
3-6-
7 7:04
201
3-6-
7 9:04
2013
-6-7
11:34
2013
-6-7
13:34
2013
-6-7
15:34
2013
-6-7
17:34
2013
-6-7
19:34
2013
-6-7
21:39
2013
-6-7
23:43
201
3-6-
8 1:43
201
3-6-
8 3:43
201
3-6-
8 5:45
201
3-6-
8 7:46
201
3-6-
8 9:46
2013
-6-8
11:46
2013
-6-8
13:46
2013
-6-8
15:46
2013
-6-8
17:48
2013
-6-8
19:49
2013
-6-8
21:49
2013
-6-8
23:52
201
3-6-
9 1:52
201
3-6-
9 3:52
201
3-6-
9 5:52
201
3-6-
9 7:52
201
3-6-
9 9:52
2013
-6-9
11:52
2013
-6-9
13:52
Time
Flow
(m³/
h)
Flow
Picture 2.6: Flow Variation Graph of Minsheng Hospital
18. As shown by flow variation graph, the flow has more obvious changes with mutation flow. The maximum test flow is about 90 m³/h, the minimum test flow is about zero, even have negative flow, the range of flow is between 0~90 m³/h.

9
0.02
0.04
0.06
0.08
0.1
0.12
0.14
2013
-6-6
16:29
2013
-6-6
18:31
2013
-6-6
21:03
2013
-6-6
23:04
201
3-6-
7 1:04
201
3-6-
7 3:04
201
3-6-
7 5:04
201
3-6-
7 7:04
201
3-6-
7 9:04
2013
-6-7
11:34
2013
-6-7
13:34
2013
-6-7
15:34
2013
-6-7
17:34
2013
-6-7
19:34
2013
-6-7
21:39
2013
-6-7
23:43
201
3-6-
8 1:43
201
3-6-
8 3:43
201
3-6-
8 5:45
201
3-6-
8 7:46
201
3-6-
8 9:46
2013
-6-8
11:46
2013
-6-8
13:46
2013
-6-8
15:46
2013
-6-8
17:48
2013
-6-8
19:49
2013
-6-8
21:49
2013
-6-8
23:52
201
3-6-
9 1:52
201
3-6-
9 3:52
201
3-6-
9 5:52
201
3-6-
9 7:52
201
3-6-
9 9:52
2013
-6-9
11:52
2013
-6-9
13:52
Time
Pre
ssur
e(MPa)
Pressure
Picture 2.7: Pressure Variation Graph of Minsheng Hospital
19. The pressure test results show that average pressure is 0.082 MPa and the maximum is 0.132 MPa at 17:00 and minimum is 0.055MPa at 10:00. It can be inferred that in Minsheng Hospital pressure is relatively low and fluctuates wildly in one day.
-20
0
20
40
60
80
100
120
2013-6-6 16:29
2013-6-6 18:31
2013-6-6 21:03
2013-6-6 23:04
2013-6-7 1:04
2013-6-7 3:04
2013-6-7 5:04
2013-6-7 7:04
2013-6-7 9:04
2013-6-7 11:34
2013-6-7 13:34
2013-6-7 15:34
2013-6-7 17:34
2013-6-7 19:34
2013-6-7 21:39
2013-6-7 23:43
2013-6-8 1:43
2013-6-8 3:43
2013-6-8 5:45
2013-6-8 7:46
2013-6-8 9:46
2013-6-8 11:46
2013-6-8 13:46
2013-6-8 15:46
2013-6-8 17:48
2013-6-8 19:49
2013-6-8 21:49
2013-6-8 23:52
2013-6-9 1:52
2013-6-9 3:52
2013-6-9 5:52
2013-6-9 7:52
2013-6-9 9:52
2013-6-9 11:52
2013-6-9 13:52
0
0.02
0.04
0.06
0.08
0.1
0.12
0.14
Time
Flow
(m³/h
)
Pre
ssur
e(M
Pa)
FlowPressure
Picture 2.7: Pressure and Flow Comparison Graph of Minsheng Hospital
20. As shown by comparison of test pressure and flow, pressure peaks when flow smooth changes, whereas pressure decreases when flow peak. According to the survey, the flow peak is caused by pumping station in Minsheng Hospital. The flow is so low, which cannot meet the demand, that the pump start to work, so the flow rising rapidly. 2.2.4 The South Sea Hotel 21. The pipe diameter of The South Sea Hotel is DN80. The flow test is from June 6, 2013 to June 9, 2013, the test frequency is 3 minutes; obtaining 1,292 groups of test data.
10
-5
-3
-1
1
3
5
7
9
11
13
15
2013
-6-6
16:28
2013
-6-6
18:16
2013
-6-6
20:04
2013
-6-6
21:52
2013
-6-6
23:40
201
3-6-7
1:28
201
3-6-7
3:19
201
3-6-7
5:10
201
3-6-7
6:58
201
3-6-7
8:46
2013
-6-7
10:36
2013
-6-7
12:25
2013
-6-7
14:13
2013
-6-7
16:00
2013
-6-7
17:49
2013
-6-7
19:37
2013
-6-7
21:54
2013
-6-7
23:43
2013
-6-8
1:31
2013
-6-8
3:19
2013
-6-8
5:07
2013
-6-8
6:58
2013
-6-8
8:48
2013
-6-8
10:37
2013
-6-8
12:27
2013
-6-8
14:19
2013
-6-8
16:09
2013
-6-8
17:59
2013
-6-8
19:46
2013
-6-8
21:36
2013
-6-8
23:25
2013
-6-9
1:13
2013
-6-9
3:00
2013
-6-9
4:51
2013
-6-9
6:40
2013
-6-9
8:28
Time
Flo
w(m³
/h)
Flow
Picture 2.8: Flow Variation Graph of The South Sea Hotel
22. As shown by flow variation graph, the flow has more obvious changes with mutation flow. The maximum test flow is about 15 m³/h, the minimum test flow is about zero, even have negative flow, the range of flow is between 0~15 m³/h. The South Sea Hotel flow changes consistent with the industrial users. With backflow and small flow, the flow measurement would be more precise if install check valve and use a smaller diameter of water meter than DN80. 2.2.5 Huagui Garment Factory 23. The pipe diameter of Huagui Garment Factory is DN80. The flow test is from June 9, 2013 to June 15, 2013, the test frequency is 3 minutes; obtaining 2,744 groups of test data.
-10
-5
0
5
10
15
20
201
3-6-
9 10:3
1
201
3-6-
9 14:3
6
201
3-6-
9 18:4
0
201
3-6-
9 23:1
2
201
3-6-
10 3:1
3
201
3-6-
10 7:1
3
2013
-6-1
0 11:1
3
2013
-6-1
0 15:1
3
2013
-6-1
0 19:1
6
2013
-6-1
0 23:1
6
201
3-6-
11 3:1
6
201
3-6-
11 7:1
9
2013
-6-1
1 12:3
3
2013
-6-1
1 17:0
3
2013
-6-1
1 21:0
4
201
3-6-
12 1:0
7
201
3-6-
12 5:1
0
201
3-6-
12 9:1
0
2013
-6-1
2 13:1
3
2013
-6-1
2 17:1
3
2013
-6-1
2 22:1
3
201
3-6-
13 2:1
6
201
3-6-
13 6:1
6
2013
-6-1
3 10:1
5
2013
-6-1
3 14:1
9
2013
-6-1
3 18:2
3
2013
-6-1
3 22:2
6
201
3-6-
14 2:2
8
201
3-6-
14 6:2
8
2013
-6-1
4 10:3
1
2013
-6-1
4 14:3
4
2013
-6-1
4 18:4
3
2013
-6-1
4 22:4
5
201
3-6-
15 2:5
2
201
3-6-
15 6:5
2
Time
Flow
(m³/
h)
Flow
Picture 2.9: Flow Variation Graph of Huagui Garment Factory

11
24. As shown by flow variation graph, the flow has more obvious changes with mutation flow. The maximum test flow is about 20 m³/h, the minimum test flow is about zero, even have negative flow, the range of flow is between 0~20 m³/h. Huagui Garment Factory flow changes consistent with the industrial users. With backflow and small flow, the flow measurement would be more precise if install check valve and use a smaller diameter of water meter than DN80. 2.2.6 Dongming Cosmetics Factory 25. The pipe diameter of Dongming Cosmetics Factory is DN100. The flow test is from June 13, 2013 to June 15, 2013, the test frequency is 3 minutes; finally obtaining 812 groups of test data.
-10
-5
0
5
10
15
20
25
2013-6-13 14:10
2013-6-13 15:25
2013-6-13 16:40
2013-6-13 17:55
2013-6-13 19:43
2013-6-13 20:57
2013-6-13 22:16
2013-6-13 23:31
2013-6-14 0:46
2013-6-14 2:00
2013-6-14 3:16
2013-6-14 4:31
2013-6-14 5:46
2013-6-14 7:00
2013-6-14 8:16
2013-6-14 10:03
2013-6-14 11:22
2013-6-14 12:37
2013-6-14 13:52
2013-6-14 15:07
2013-6-14 16:22
2013-6-14 17:37
2013-6-14 18:52
2013-6-14 20:07
2013-6-14 21:24
2013-6-14 22:42
2013-6-14 23:57
2013-6-15 1:13
2013-6-15 2:28
2013-6-15 3:43
2013-6-15 4:58
2013-6-15 6:13
2013-6-15 7:28
Time
Flow(m
³/h)
Flow
Picture 2.10: Flow Variation Graph of Dongming Cosmetics Factory
26. As shown by flow variation graph, the flow has more obvious changes with mutation flow. The maximum test flow is about 25 m³/h, the minimum test flow is about zero, even have negative flow, the range of flow is between 0~25 m³/h. Dongming Cosmetics Factory flow changes consistent with the industrial users. With backflow and small flow, the flow measurement would be more precise if install check valve and use a smaller diameter of water meter than DN100. 2.2.7 Xinzhong Village 27. The pipe diameter of Xinzhong Village is DN200 and 2,300 users. The flow test is from June 9, 2013 to June 15, 2013, the test frequency is 3 minutes; finally obtaining 2,656 groups of test data.

12
0
10
20
30
40
50
60
70
80
90
2013-
6-9
14:3
1
2013-
6-9
18:3
3
2013-
6-9
22:3
7
2013-
6-10
2:4
0
2013-
6-10
7:1
0
2013-6
-10
11:1
0
2013-6
-10
15:1
0
2013-6
-10
19:1
3
2013-6
-10
23:1
3
2013-
6-11
3:1
3
2013-
6-11
7:1
3
2013-6
-11
11:1
3
2013-6
-11
15:1
3
2013-6
-11
19:1
3
2013-6
-11
23:1
2
2013-
6-12
3:4
3
2013-
6-12
7:4
3
2013-6
-12
12:1
5
2013-6
-12
17:1
8
2013-6
-12
21:5
7
2013-
6-13
1:5
8
2013-
6-13
5:5
8
2013-
6-13
9:5
8
2013-6
-13
14:0
0
2013-6
-13
18:0
4
2013-6
-13
22:3
4
2013-
6-14
2:3
4
2013-
6-14
6:3
4
2013-6
-14
10:3
4
2013-6
-14
14:4
3
2013-6
-14
18:4
4
2013-6
-14
23:1
5
2013-
6-15
3:1
6
2013-
6-15
7:1
6
Time
Flow(m
³/h)
Flow
Picture 2.11: Flow Variation Graph of Xinzhong Village
28. The minimum test flow is about 16 m³/h at 0:00 in Xinzhong Village. According to the international standard for night consumption of 2.5 liters per hour per service connection, the real night consumption is 5.75 m³/h with over 2300 service connections in Xinzhong Village. The real water use differs from estimate water use by 10.25 m³/h, so the burst leakage of Xinzhong Village is about 10.25 m³/h.
0.02
0.04
0.06
0.08
0.1
0.12
0.14
2013
-6-9
14:3
1
2013
-6-9
18:3
3
2013
-6-9
22:3
7
2013
-6-1
0 2:4
0
2013
-6-1
0 7:1
0
201
3-6-
10 11:1
0
201
3-6-
10 15:1
0
201
3-6-
10 19:1
3
201
3-6-
10 23:1
3
2013
-6-1
1 3:1
3
2013
-6-1
1 7:1
3
201
3-6-
11 11:1
3
201
3-6-
11 15:1
3
201
3-6-
11 19:1
3
201
3-6-
11 23:1
2
2013
-6-1
2 3:4
3
2013
-6-1
2 7:4
3
201
3-6-
12 12:1
5
201
3-6-
12 17:1
8
201
3-6-
12 21:5
7
2013
-6-1
3 1:5
8
2013
-6-1
3 5:5
8
2013
-6-1
3 9:5
8
201
3-6-
13 14:0
0
201
3-6-
13 18:0
4
201
3-6-
13 22:3
4
2013
-6-1
4 2:3
4
2013
-6-1
4 6:3
4
201
3-6-
14 10:3
4
201
3-6-
14 14:4
3
201
3-6-
14 18:4
4
201
3-6-
14 23:1
5
2013
-6-1
5 3:1
6
2013
-6-1
5 7:1
6
Time
Press
ure(MP
a)
Pressure
Picture 2.12: Pressure Variation Graph of Xinzhong Village
29. The pressure test results show that average pressure is 0.094 MPa and the maximum is 0.129 MPa at 5:00 and minimum is 0.051 MPa at 20:00. It can be inferred that in Xinzhong Village pressure is relatively low and fluctuates wildly in one day.

13
0
20
40
60
80
100
120
2013-6-9 14:31
2013-6-9 18:00
2013-6-9 21:37
2013-6-10 1:10
2013-6-10 4:40
2013-6-10 8:40
2013-6-10 12:10
2013-6-10 15:42
2013-6-10 19:13
2013-6-10 22:43
2013-6-11 2:13
2013-6-11 5:43
2013-6-11 9:13
2013-6-11 12:43
2013-6-11 16:13
2013-6-11 19:43
2013-6-11 23:12
2013-6-12 3:13
2013-6-12 6:43
2013-6-12 10:13
2013-6-12 14:46
2013-6-12 18:51
2013-6-12 22:58
2013-6-13 2:28
2013-6-13 5:58
2013-6-13 9:28
2013-6-13 13:00
2013-6-13 16:34
2013-6-13 20:34
2013-6-14 0:04
2013-6-14 3:34
2013-6-14 7:04
2013-6-14 10:34
2013-6-14 14:11
2013-6-14 17:43
2013-6-14 21:45
2013-6-15 1:16
2013-6-15 4:46
0
0.02
0.04
0.06
0.08
0.1
0.12
0.14
Time
Flow
(m³/h
)
Pre
ssur
e(M
Pa)
FlowPressure
Picture 2.13: Pressure and Flow Comparison Graph of Xinzhong Village
30. As shown by comparison of test pressure and flow, pressure peaks when flow drops at night, whereas pressure decreases when flow peaks during daytime, which reflects that the operation control does not conform to domestic consumption habit and presents characteristics of typical gravity flow water supply. It’s wise to consider improving the operation control mode from production pressure orientation to customer demand orientation which would do well to the integral network pressure balance. 2.2.8 Xigou Village 31. The pipe diameter of Xigou Village is DN80 and 500 users. The flow test is from June 13, 2013 17:40 to June 15, 2013 20:00, the test frequency is 3 minutes; finally obtaining 48 groups of test data.

14
-10
0
10
20
30
40
50
2013-
6-13 17:4
0
2013-
6-13 17:4
6
2013-
6-13 17:5
2
2013-
6-13 17:5
8
2013-
6-13 18:0
4
2013-
6-13 18:1
0
2013-
6-13 18:1
6
2013-
6-13 18:2
2
2013-
6-13 18:2
8
2013-
6-13 18:3
4
2013-
6-13 18:4
0
2013-
6-13 18:4
6
2013-
6-13 18:5
2
2013-
6-13 18:5
8
2013-
6-13 19:0
4
2013-
6-13 19:1
0
2013-
6-13 19:1
6
2013-
6-13 19:2
2
2013-
6-13 19:2
8
2013-
6-13 19:3
4
2013-
6-13 19:4
0
2013-
6-13 19:4
6
2013-
6-13 19:5
2
2013-
6-13 19:5
8
Time
Flow(
m³/h)
Flow
Picture 2.14: Flow Variation Graph of Xigou Village 32. The minimum test flow is about 10 m³/h at 1:00 in Xigou Village. According to the international standard for night consumption of 2.5 liters per hour per service connection, the real night consumption is 1.25 m³/h with over 500 service connections in Xigou Village. The real water use differs from estimate water use by 8.75 m³/h, so the background leakage of Xigou Village is about 8.75 m³/h. 2.3 Analysis of Apparent Losses by Metering 33. Both meters the field test chooses are WS vertical spiral wing water meter by Ningbo water meter factory whose performance parameters are displayed in Diagram 2.2.
Table 2.2: WS Vertical Spiral Wing Water Meter’s Performance Parameter
Diameter Q1 Q2 Q3 Q4
WS200 2.00 12.60 400 500
WS150 1.25 7.88 250 312
WS100 0.50 3.15 100 125
WS80 0.32 2.00 63 79
2.3.1 The Analysis of WS200 Performance 34. WS200 is used at flow test of Xinlian and Xinzhong villages, whose meter error performance curve is displayed in figures 2.11 and 2.12.

15
Picture 2.15: Meter Performance Error Analysis in Xinlian Village
35. The analysis shows that the integrated error of DN200 meter in Xinlian Village lies at -1.96% and the physical losses reach -90.59 m³ per day. It is mainly because the real flow rate this meter registers is too low and the error is too large. The flow measurement would be more precise if use a smaller diameter of water meter than DN200 and calibrate this meter.
Picture 2.16: Meter Performance Error Analysis in Xinzhong Village
36. The analysis shows that the integrated error of DN200 meter in Xinzhong Village lies at -1.96% and the physical losses reach -20.14 m³ per day. It’s mainly because the real flow rate this meter registers is too low and the error is too large. The flow measurement would be more precise if use a smaller diameter of water meter than DN200 and review this meter. 2.3.2 The Analysis of WS150 Performance 37. WS150 is used at flow test of Minsheng Hospital and Xigou Village, whose meter error performance curve is displayed in figures 2.18 and 2.19.

16
Picture 2.17: Meter Performance Error Analysis in Minsheng Hospital
38. The analysis shows that the integrated error of DN150 meter in Minsheng Hospital lies at -1.72%, the physical losses reach -35.26 m³ per day and some test flow rates under Q1. It is mainly because the real flow rate this meter registers is too low and large fluctuation. The flow measurement would be more precise if use a smaller diameter of compound meter than DN150.
Picture 2.18: Meter Performance Error Analysis in Xigou Village
39. The analysis shows that the integrated error of DN150 meter in Xigou Village lies at -0.91%, the physical losses reach -0.25 m³ per day and some test flow rates under Q1. It is mainly because the real flow rate this meter registers is too low. The flow measurement would be more precise if use a smaller diameter of compound meter than DN150 and decrease the parameter of Q1.
17
2.3.3 The Analysis of WS100 Performance 40. WS100 is used at flow test of Zuoxinkou Residential Quarter and Dongming Cosmetics Factory, whose meter error performance curve is displayed in figures 2.21 and 2.22.
Picture 2.19: Meter Performance Error Analysis in Zuoxinkou Residential Quarter
41. The analysis shows that the integrated error of DN100 meter in Zuoxinkou Residential Quarter lies at -0.05%, the physical losses reach -0.04 m³ per day. It is mainly because the real flow rate this meter registers is too low. The flow measurement would be more precise if use a smaller diameter of meter than DN100.
Picture 2.20: Meter Performance Error Analysis in Dongming Cosmetics Factory
42. The analysis shows that the integrated error of DN100 meter in Dongming Cosmetics Factory lies at -1.43%, the physical losses reach -2.55 m³ per day and some test flow rates under Q1. It is mainly because the real flow rate this meter registers is too low. The flow measurement would be more precise if use a smaller diameter of meter than DN100 and decrease the parameter of Q1.

18
2.3.4 The Analysis of WS80 Performance 43. WS80 is used at flow test of The South Sea Hotel and Huagui Garment Factory, whose meter error performance curve is displayed in figures 2.27 and 2.28.
Picture 2.21: Meter Performance Error Analysis in The South Sea Hotel 44. The analysis shows that the integrated error of DN80 meter in The South Sea Hotel lies at -1.29%, the physical losses reach -5.54 m³ per day and some test flow rates under Q1. It is mainly because the real flow rate this meter registers is too low. The flow measurement would be more precise if use a smaller diameter of meter than DN80 and decrease the parameter of Q1.
Picture 2.22: Meter Performance Error Analysis in Huagui Garment Factory 45. The analysis shows that the integrated error of DN80 meter in Huagui Garment Factory lies at -1.26%, the physical losses reach -6.23 m³ per day and some test flow rates under Q1. It is mainly because the real flow rate this meter registers is too low. The flow

19
measurement would be more precise if use a smaller diameter of meter than DN80 and decrease the parameter of Q1. 2.4 Summary 46. On the whole, the pressure of Chaonan District is too low and cannot meet demand. All tested customer meters only use one type meter--the vertical spiral wing water meter, the test flow rates is too low and the diameter is too large for the real demand, the performance of several customer’s demand is large fluctuation, and even under Q1. Based on analyses of the test pressure, the test flow and meter performance, water utility is advised to improve the mechanism management from the following aspects:
Increase the pump station to improve the pressure of pipe network; Horizontal turbine meters are appropriate for customers with large and
evenly-distributed flow; Choose reasonable diameter of water meter, avoid big diameter with small flow
phenomenon; Compound water meters are appropriate for customers with wild fluctuation; Check valve is appropriate for customers with backflow; and Meters must be calibrated and renewed at a regular basis.
3 ESTABLISHMENT AND CHECK OF WATER BALANCE 3.1 Water Balance Analysis Theory 3.1.1 Introduction to Water Balance 47. Water balance is a method of quantifying and analyzing the System Input Volume and System Output Volume. The fundament of water balance analysis theory is that for a water supply system, the overall water volume calculation should be balanced through measurement or definition of the volume of produced, input, output, and lost water. Theoretically, each of the water balance components can be quantified in a fixed period, and water balance analysis of the water supply system can be complemented by investigating the input and output and collecting relative data. Therefore, introduction of water balance can help quantify the components and the lost water more precisely. 48. To most water utilities, the level of NRW is a key performance indicator of efficiency. However, most utilities tend to underestimate NRW because of institutional and political pressures, as well as a lack of knowledge to properly determine the NRW level. Reports of low levels of NRW are eagerly accepted by senior managers. However, reported low levels of NRW, whether due to deliberate misinformation or, more likely, a lack of accurate information, will not help the water utility to reduce its costs or increase revenue. Instead, it will mask the real problems affecting the water utility’s operating efficiency. Only by quantifying NRW and its components, calculating appropriate performance indicators, and turning volumes of lost water into monetary values, can the NRW situation be properly understood and the required

20
actions taken. 49. Water balance helps utility managers to understand the magnitude, sources, and cost of NRW. The International Water Association (IWA) has developed a standard international water balance structure and terminology (Table 3.1).
Table3.1: Water Balance Showing NRW Components
System Input
Volume
Authorized Consumption
Billed Authorized Consumption
Billed Metered Consumption Revenue
Water Billed Unmetered Consumption
Unbilled Authorized
Consumption
Unbilled Metered Consumption
Non-Revenue Water
Unbilled Unmetered Consumption
Water Losses
Commercial Losses
Unauthorized Consumption
Customer Meter Inaccuracies and Data Handling
Erros
Physical Losses
Leakage on Transmission and Distribution Mains
Leakage and Overflows from the Utilities Storage Tanks
Leakage on Service Connections up to the Customer
Meter
50. NRW is equal to the total amount of water flowing into the water supply network from a water treatment plant (the ‘System Input Volume’) minus the total amount of water that industrial and domestic consumers are authorized to use (the ‘Authorized Consumption’).
NRW = System Input Volume - Billed Authorized Consumption This equation assumes that: • System input volume has been corrected for any known errors • The billed metered consumption period for customer billing records are consistent with the System Input Volume period.
51. Utility managers should use the water balance to calculate each component and determine where water losses are occurring, as described in the next sections. They will then prioritize and implement the required policy changes and operational practices. 3.1.2 Steps for Establishing Water Balance 52. Water balance is conducted by calculating or estimating the input, output, consumption and losses of the water supply system. The significance lies in being capable of clearly describing and quantifying every system component and hence making the water losses more easily understood. Initially the volume of each water balance component need be calculated, the key part of which is to decompose NRW into Unbilled authorized consumption, Apparent losses and Physical losses.

21
Generally, steps to calculate water balance components are as follows: Step 1. Determine system input volume; Step 2. Determine billed metered consumption and billed unmetered consumption which
sum up to revenue water; Step 3. Determine NRW by subtracting revenue water from system input volume; Step 4. Determine unbilled metered consumption and unbilled unmetered consumption
which sum up to unbilled authorized consumption; Step 5. Determine authorized consumption by adding revenue water to unbilled
authorized consumption; Step 6. Determine water losses by subtracting authorized consumption from system
input volume; Step 7. Estimate unauthorized consumption and customer metering inaccuracies
properly which sum up to apparent losses; Step 8. Determine physical losses by subtracting apparent losses from water losses; and Step 9. Estimate real loss components in feasible methods which include night flow
analysis, burst frequency/leakage flow rate/leakage duration, modeling and etc. Add components of physical losses and cross-check with the physical losses as derived from Step 8. 3.2 Water Balance Analysis of Chaonan’s Water Supply System 53. The current situation of the water supply in Chaonan District is more complex. There are multiple management from water plants to customers, such as water plant management, town management, community management and village management and so on. The water network system in Chaonan not only includes urban water supply, but also includes rural water supply. The water pipes are managed by multiple departments of mutual non-interference. 54. In addition, the water tariffs are different from raw water to customers. For example, the water plants sales the water to towns at the price of CNY0.94/m³, then the towns sales the water to communities or villages at the price of CNY1.6/m³, however some towns sales the water to companies, hospitals and schools etc, at the price of CNY2.3/m³. Finally, the water sold to customers at the price of CNY3.0/m³ to CNY4.5/m³.
55. Water supply management in Chaonan District is complicated, and the water supply system from water plant to customers is divided into many separate parts, the management rights belong to different departments, such as water plants, town water supply companies, communities, villages and so on. Based on the current situation, the range of the investigation determined from water plants to customers, including communities, villages, companies, hospitals and schools, etc. After a comparative analysis, the whole supply area of Qiufeng water plant, Jinxi water plant and Jingdu water plant was selected as the main data collection area.

22
Table 3.2: The Customers Supplied by Qiufeng Water Plant
Town/Street Community/Village Area
(km²) Population (person)
Lugang town 15 Communities or Villages, including 4 Communities, 11 Villages.
50.400 138,100
Liangying town 30 Communities or Villages, including 13 Communities, 17 Villages.
72.400 196,261
Xiashan street 36 Communities or Villages, including 12 Communities, 24 Villages.
46.403 203,862
Chengtian town 1Village, Shangyan village. 0.990 4,342 Heping town water exported to the Heping town located in Chaoyang district. Tongyu town water exported to the Heping town located in Chaoyang district.
Table 3.3: The Customers Supplied by Jinxi Water Plant
Town/Street Community/Village Area
(km²) Population (person)
Chendian town 25 Communities or Villages, including 10 Communities, 15 Villages.
28.300 101,955
Si Mapu town 19 Communities or Villages, including 6 Communities, 13 Villages.
28.900 115,100
Xiancheng town 12 Communities or Villages, including 3 Communities, 9 Villages.
55.044 95,523
Guiyu town water exported to the Guiyu town located in Chaoyang district.
Table 3.4: The Customers Supplied by Jingdu Water Plant
Town/Street Community/Village Area
(km2)
Population (person)
Jingdu town 14 Communities or Villages, including 4 Communities, 10 Villages.
43.500 87,390
56. According to the data, the three water balance tables from water plants to customers were built respectively. And then the water balance of the Chaonan district was built on the data analysis result of the three water plants, finally, make an effective evaluation on the leakage situation of Chaonan District. (The following Chaonan water mentioned refers to the whole area supplied by Qiufeng water plant, Jinxi water plant, and Jingdu water plant.) 3.2.1 Setting a Research Period 57. Given water balance’s essential relation to time, water utility should choose a period for analyzing and evaluating the total system consumption. According to Chaonan water utilities’ statistics , utilities can define the whole year of 2012 as the water balance research period and use relative volume data from Jan 1, 2012 to Nov 31, 2012, so as to reduce the influence of the time lag between water consumption and meter reading. Besides, this period also involves the seasonal element.

23
3.2.2 Establishing Water Balance in Hierarchical Order 58. The water balance recommended by IWA helps Chaonan water utilities to conduct water balance analysis research into the urban water system, to analyze, calculate, and estimate each water balance component and finally to establish the water balance. 3.2.2.1 The System Input Volume (SIV)
(1) Qiufeng Water Plant
Picture 3.2: Three Water Distribution Stations of Qiufeng Water Plant
Table 3.5: Water Sales Record of the Distribution Stations of Qiufeng Plant
Town
Water Consumption
(m³) Equipment/
Method Diameter
(mm)
Water Distribution
Station
1 Heping town 3,029,677 Electromagnetic Flow Meters 600 Xiwei
2 Tongyu town 2,774,434 Mechanical Meters 400 Qigou
3 East of Liangying town 3,260,403 Electromagnetic Flow Meters 400 Longling
4 West of Liangying town 2,065,899 Mechanical Meters 400 Longling
5 Liangying town 1,501,540 Mechanical Meters 300 Qigou
6 Lugang town 1,848,014 Mechanical Meters 400 Xiwei
7 Xinlian, Lugang town 469,616 Mechanical Meters 200 Xiwei
8 Xinzhong, Lugang town 283,094 Mechanical Meters 200 Xiwei
9 Xinmin, Lugang town 308,805 Mechanical Meters 150 Xiwei
10 Shangyan village, Chengtian town 167,397 Mechanical Meters 150 Xiwei
11 Xiashan street 10,298,734 Electromagnetic Flow Meters 800 Qigou

24
Town
Water Consumption
(m³) Equipment/
Method Diameter
(mm)
Water Distribution
Station
12 Gucuo community 329,464 Mechanical Meters 150 Longling
59. There is no equipment installed to record how much water flows from Qiufeng water plant. The water is supplied to Longling, Qigou, and Xiwei water distribution stations through the pipes with the diameter of 1,200 mm and 800 mm. Then, the water supplied to Xiashan Street, Liangying town, Lugang town, Chengtian town, Heping town, Tongyu town, and Gucuo community. Based on the parameters of the pipes between Qiufeng water plant and three water distribution stations, such as pipe material, pipe length, and pipe ages, etc., the leakage rate between water plant and water distribution stations is estimated about 5%. According to the water records of the distribution stations, the SIV of Qiufeng water plant in 2012 comes to 27,653,931 m³ with an accuracy of ±4%.
(2) Jinxi Water Plant
Picture 3.3: Jinxi Water Plant in Chaonan District
Table 3.6: Water Sales Record of the Distribution Stations of Jinxi Plant
Town
Water Consumption (m³)
1 Chendian town 6,735,349 2 Si Mapu town 3,964,850 3 Guyu towm 2,300,010 4 Xiancheng town 978,835 5 Other scattered consumers 214,886

25
Picture 3.4: Ultrasonic Flow Meter in the Jinxi Water Plant
60. Jinxi water plant installed an ultrasonic flowmeter. However, the instantaneous flow can be seen by the monitoring screen, but no cumulative flow value. Monitoring the instantaneous flow primarily monitoring changes in flow, if the flow is mutated, generally there is pipe burst occurring at a certain position, which can provide data to detect and repair the leakage timely, thereby reduce the amount of water leakage. Based on the parameters of the pipes between Jinxi water plant and its water distribution stations, such as pipe material, pipe length and pipe ages, etc., the leakage rate between water plant and water distribution stations is estimated about 3% to 5%. According to the water records of the town water supply companies, the SIV of Jinxi water plant in 2012 comes to 14,903,627 m³ with an accuracy of ±4%.
(3) Jingdu Water Plant
Picture 3.5: Pumping Station in Jingdu Water Plant
61. There is no flowmeter installed on the pipeline for water outflow from Jingdu water plant, but mechanical flowmeter installed on the raw water pipeline to record how much water flows to the plant. Through survey data, we find that about 300 m³ water is used by the water plant every month. So according to the water records of the Communities and villages in Jingdu town, the SIV
26
of Jingdu water plant in 2012 comes to 756,400 m³ with an accuracy of ±4%. 62. Input the data of Qiufeng, Jixi and Jingdu above into the calculation frame of SIV (Picture 3.10) and the SIV of Chaonan in 2012 comes to 43,313,958 m³ with an accuracy of ±4.0%.
3.2.2.2 The Billed Authorized Consumption (BAC) 63. Because Chaonan water supply is managed by multiple departments, such as water plants, towns, communities, villages, etc. So it is difficult to collect all of the data from water plant to consumers, and make sure of the data accuracy. In order to understand the current leakage level of the village in Chaonan District. Firstly, we need to select some representative samples of the villages, and collect their data related to the water supply. Then base on the analysis of the samples, we can figure out the current leakage level in the different stages. According to local investigation, Gangnei village in Xiashan street and Shenshan village in Jingdu town were chosen as the samples.
Picture 3.11: Residential Buildings in Gangnei Village
Picture 3.12: Investigating Meters in Gangnei Village

27
Picture 3.13: Water Record in Gangnei Village
64. Gangnei Village is located in the Xiashan street. Now, about 110 households, a total of 600 people around. Among them, there are 89 households supplied by Chaonan water supply corporation,and the diameters of the meters are 25 mm. By the water record in this village, we find that the consumption of 72 households is 4,572 m³, except 17 households with the total water consumption of 0 m³. The average water consumption is 5.3 m³ each household each month. Comparing to the water record 8,640 m³of the village meter, which record the total water supplied to the village from Qiufeng water plant. The data shows that the leakage rate in GangNei village reached 47.08%.
Picture 3.14: Residential Buildings in ShenShan Village
65. Through the discussion with the manager of the ShenShan water supply department, as well as the analysis the water records of this village in 2012, we find that the leakage in this village is very serious. Maybe ShenShan village is close to the sea, but the iron pipes selected as water supply pipes early, so severe corrosion is occurring every day. The data shows that the leakage rate in ShenShan village reached 50% or more.

28
Table 3.7: Water Sales Record of Chaonan District in 2012
Water Plant Meter Name
(Town/Community/Village)
Water Record of the Meter
in the Community or Village (m³)
Water Consumption of Companies, Hospitals, and
Schools, etc. (water directly supplied
to the user) (m³)
QiuFeng water plant
Lugang town 2,130,350.0 ——
LiangYing town 3,758,750.0 1,097,550
Xiashan street 4,667,152.0 1,524,450
ChengTian town(ShangYan village) 167,397.0 ——
GuCuo community/ 329,464.0 ——
JinXi water plant
Xiancheng town 813,724.0 9,610
ChenDian town 3,639,000.0 ——
Si Mapu town 3,836,300.0 ——
Others scattered consumers —— 214,886
JingDu water plant JingDu town 474,310.9 90,381
66. Water consumers in the town can be divided by two categories, one is communities or villages,the other is the users supplied directly by town water supply departments, such as companies, hospitals and schools, etc. According to results of the previous survey, the water consumption of residential users is equal to the Water record of the meter in the community or village multiplied by the adjustment coefficient k,k values range from 0.5 to 0.6. 67. Furthermore, Heping town, Tongyu town, and Guyu town are located in Chaoyang District. So the exported water is 8,104,121 m³. By calculation,Billed Metered Consumption is 22,440,435.60 m³, Billed Unmetered Consumption is 0 m³. Input these water sales into the calculation frame of Billed Authorized Consumption (Picture 3.16), Billed Authorized Consumption in 2012 is 22,440,435.60 m³.

29
Picture 3.16: Interface of the Billed Authorized Consumption
3.2.2.3 The Unbilled Authorized Consumption (UAC) 68. The Unbilled Authorized Consumption compromises Unbilled Metered Consumption and Unbilled Unmetered Consumption. For Chaonan’s water supply system, there is no record of the Unbilled Unmetered Consumption, such as fire fighting, flushing of mains and sewers, street cleaning, frost protection, etc. Unbilled Metered Consumption typically includes the water used by the water supply corporations. Unbilled Unmetered Consumption mainly consists of flushing and impounding new mains for Chaonan water supply system. 69. The Unbilled Authorized Consumption in 2012 is about 10,000 m³ with an accuracy of ±20%. Input these data into the calculation frame (Picture 3.17).

30
Picture 3.17: Interface of the Unbilled Authorized Consumption
3.2.2.4 The Unauthorized Consumption (UC) 70. Unauthorized consumption occurs to some extent in virtually every drinking water utility. It often occurs through the deliberate actions of customers or other persons who take water from the system without paying for it. 71. Unauthorized consumption is part of the commercial losses. Unauthorized consumption increasing causes NRW increasing, which causes direct economic losses to the water supply utilities. However, it’s difficult to evaluate the unauthorized consumption, because not all of the unauthorized consumption will be found. Also there is no department to combat illegal water use, and no record of unauthorized consumption can be found in Chaonan District. Therefore, the value can only be estimated based on the experience of practitioners, such as unauthorized consumption in the total proportion of revenue water. 72. More or less unauthorized consumption can be found in the water supply systems all around the world. However, it should not exceed 1% of the SIV in a well-managed system, and it is estimated that 0.36% in England and Wales. Based on experience of sectional leak detection experiments in PRC, almost two illegal connections exist in each supply district. In view of this, unauthorized consumption is estimated as 3.5%-5% of the SIV in Chaonan District, and then the illegal connections come to 573. There are 360 illegal connections in the supply area of Qiufeng water plant, 200 illegal connections in the supply area of Jinxi water plant, and 13 illegal connections in the supply area of Jingdu water plant. 73. According to the census data of Chaonan in 2003, there are 22,516 households with 133,073 people in Lugang town, 30,454 households with 168,471 people in Liangying town, 18,504 households with 101,955 people in Chendian town, 20,105 households with 115,542

31
people in Si Mapu town, 16,714 households with 95,489 people in Xiancheng town, and 15,401 households with 87,390 people in Jingdu town. To 2012, the average population growth rate in Chaonan calculated in accordance with 20‰. According to the results, per capita daily consumption is 130 liters per person per day, and the average size is 5.7 persons per household. Input these data into the calculation frame of the Unauthorized Consumption (Picture 3.18).
Picture 3.18: Interface of the Unauthorized Consumption
3.2.2.5 Customer Meter Inaccuracies 74. The reasons causing the customer meter inaccuracies are more complex, not only including meter measurement errors, but also including meter reading errors, data transmission errors and processing errors generated in the process of water account management.
Picture 3.19: A Hospital using DN100 Vertical Spiral Meter
32
Picture 3.20: A Consumer using DN25 Vertical Rotating Meter
75. In Chaonan, meters used for large consumers, such as industries, schools and hospitals, etc., are all vertical spiral with diameters of 100 mm to 200 mm. And meters used for domestic consumers are rotor with diameters of 20 mm to 25 mm.
Picture 3.21: A Meter Used Beyond Effective Life
76. Meter is instrumentation for water sold, it is strictly accepted the supervision and management by legal metrology and inspection department. Meter should be obtained inspection certificate prior to installation. Meter must be replaced when it continuously works to the statutory period, which favors the reasonableness of measurement. But many specific problems appeared which affects the meter accuracy. According to the survey, once meter put into use after inspection in Chaonan, the meter will be used till it does not work. The larger meters are not checked and replaced according to the national policy. And smaller domestic meters will not be replaced though used for more than 6 years. 77. Furthermore, because of the low pressure in the pipe, most users install pumps close to the meters to obtain higher pressure (picture 3.22), which will greatly affect the valid ages and metering accuracy.

33
Table3.8: Main Technical Parameters of WS40-20 Vertical Rotating Meter
Type
Diame-ter
(mm)
Com- mon Flow
(Q3)
Over- load Flow
(Q4) Q3/Q
1
Q2/Q
1
Bound-ary
Flow
(Q2)
Mini- mum Flow
(Q1)
Low Flow
(QL)
Minimum Reading
(Min)
Maximum Reading
(Max)
(m³/h) (m³/h) m³
WS-40 40 25 31 100 1.6 0.40 0.25 0.18 0.0001 99,999
WS-50 50 40 50 160 6.3 1.58 0.25
0.18
0.0005
(dry
0.0010)
999,999
200 1.6 0.32 0.20
WS-80 80 63 79
160 1.6 0.63
0.39
0.30 6.3 2.48
200 1.6 0.50
0.32 6.3 2.00
WS-100 100 100 125
160 1.6 1.00
0.63
0.40 6.3 3.94
200 1.6 0.80
0.50 6.3 3.15
WS-150 150 250 312 200 1.6 2.00
1.25 0.80 0.0050
9,999,999
6.3 7.88
WS-200 200 400 500 200
1.6 3.20
2.00 1.20
0.0050
(dry
0.0100) 6.3 12.60
Maximum permissible error: a)The maximum permissible error is ± 5% in the lower zone, which is from minimum flow (Q1) to boundary flow (Q2), but Q2 is not included; b)The maximum permissible error is ± 2% in the higher zone, which is from boundary flow (Q2) to overload flow (Q4). 78. AWWARF’ research pointed out that the measurement error will reach 3% when the diameter is smaller,less than 76 mm, 3 inches. According to statistics, meter error contributes 13.8% to NRW rate in Hong Kong, 10.9% in Colombo (Sri Lanka), and 15.4% in Surabaya (Indonesia). The NRW rate is 21.0% to 29.0%, so the meter error is about 3.2% to 4% by calculation. 79. In Chaonan, large proportion of users is rural residents. According to the survey, there is a very serious "drip" phenomenon in every household in the rural areas. In the face of the meters used long-term, without checked or replaced, generally the meters do not work when water dripping, which resulting in a lot of commercial losses. Based on meter types and statistics results of the field flow test, the average meter error in Chaonan is estimated to be 10%, and the meter reading error is estimated to be 6.81%. Input these data into the calculation frame of the Customer Meter Inaccuracies (Picture 3.23).

34
Picture 3.23: Interface of the Customer Meter Inaccuracies
3.2.2.6 The Water Supply Network
80. The statistical data in Chaonan shows that there are 32,694 households in Xiashan town, 17,218 households in Lugang town, and 26,209 households in Liangying town supplied by Qiufeng water plant. And 7,218 households in Xiancheng town, 20,257 households in Chendian town, and 22,486 households in Si Mapu town supplied by Jinxi water plant. Besides, there are 1,100 to 1,400 households estimated in Shangyan village, Chentian town, through the analysis of total consumption and average consumption per person per day. The same method can know that there are more than 1,800 households in Gucuo community. Furthermore, the average consumption per large household per month is about 15 m³ in the area supplied by Jinxi watet plant, so the scattered customers are about 1,194 households.
Picture 3.24: Users Living in the 1-storey Bungalows with Courtyards

35
Picture 3.25: Users Living in the 3- to 5-storey Buildings with Courtyards
81. In Chaonan, most residents have their buildings and courtyards, generally one meter installed in one household, and one household equals to one service connection. Altogether, service connections in Chaonan water supply network come to 138,504. 82. According to the diagram of water supply pipe network in Chaonan, and the data provided by town water utilities, Chaonan owns water mains of 366 km, the service connections between property’s boundary and customer meters average out at 5 m with accuracy of ± 10%, service connections of all customers are calculated to be 138,504 and illegal connections are estimated to be 573. Input these data into the calculation frame of the Water Supply Network.
Picture 3.26: Interface of the Water Supply Network

36
3.2.2.7 Water Pressure (1) Field Pressure Test and Site Survey
Picture 3.27: Very Small Flow in the First Floor
Picture 3.28: Pumps Installed After Meters by Users
83. In Chaonan, there is no pressurized equipment in the main water pipelines, and users generally install pump after the water meter to improve the pressure. The mains pressure is measured by gauges connected to the ground hydrants.
Picture 3.29: The Pressure of a Fire Hydrant is Zero.
37
84. According to the field pressure test, the pressure of the area supplied by Qiufeng water plant is low, the pressure of some places as low as 0 m (Picture 3.28). Obviously, the average pressure even cannot meet the demand of minimum pressure for fire water, and it also poses a threat to the safety of the city.
(2) The Establishment and Calibration of Chaonan Water Distribution Hydraulic
Model
Picture 3.30: Pressure Gauge Installed in the Xiwei Distribution Station
Picture 3.32: Pressure Gauge Installed in Jingdu Water Plant

38
Picture 3.33: Pressure of the Distribution Stations on June 4, 2013
85. Based on the layout of water systems in Chaonan, water distribution hydraulic models are established through the completion of manual topology drawing, the parameters of pipes and junctions added, such as diameter, elevation, Hazen-Williams C, demand, etc. The calibration of the models is based on the results of field flow and pressure test. By the way of zoned-calibration, as well as using coarse-adjustment and fine-adjustment, the model reaches a high accuracy. The absolute error of pressure tested is about 2.3 m, and the relative error of flow within 10%. The accuracy can meet the requirement of operation analysis.
Picture 3.33: Water Distribution Hydraulic Model of Jinxi Water Plant

39
Picture 3.33: Water Distribution Hydraulic Model of Qiufeng Water Plant
Picture 3.33: Water Distribution Hydraulic Model of Jingdu Water Plant
86. The average pressure of the area supplied by Qiufeng water plant calculated is 10 meters, average pressure of the area supplied by Jinxi water plant and Jingdu water plant is 18 meters (Picture 3.33). It should be noted that the average pressure of Jingdu calculated is about 21metres. However, considering the integrity of the basic data provided by Jingdu, and its intermittent Supply features, the average pressure is reduced a little. After calculation, this adjustment has little effect on the performance evaluation.
Picture 3.33: Interface of the Pressure
40
3.2.2.8 Intermittent Water Supply 87. In Chaonan, Qiufeng water plant and Jinxi water plant both provide intermittent supply. Jingdu water plant provides Intermittent Supply, and water supply time is generally 8:30-12:30 am, 17:30-23:30 pm. However, in order to reduce the leakage, many village management departments often close the valve before the village meter around 21:00 to stop supplying water to the village consumers. Considering the reasons, the average supply time is set 8 hours one day.
Picture 3.34: Interface of Intermittent Water Supply
3.2.2.9 Financial Data 88. In Chaonan, the average tariff is CNY3.8/m³, the variable cost of water production or distribution (that is the marginal cost) is CNY0.3323/m³, and the operational cost in 2012 is CNY43,038,925. The unbilled metered consumption and apparent losses are accounted by average tariff (A), while the unbilled unmetered consumption and physical losses are accounted by marginal cost (B). Input these data into the calculation form of Financial Data (Picture 3.35).

41
Picture 3.35: Interface of Financial Data
3.2.2.10 Established Water Balance
Picture 3.36: Established Water Balance
89. It can be obtained from Chaonan’s water balance of 2012 established in hierarchical order (shown in Picture3.36):
The NRW is 20,873,522.41 m³, 48.191% of the System Input Volume; The apparent losses are 3,388,193.61 m³, 7.822% of the System Input Volume; The unauthorized consumption is 155,401.04 m³, 0.359%of the System Input
Volume;

42
The customer meter inaccuracies is 3,232,792.57 m³, 7.464% of the System Input Volume;and
The physical losses are 17,475,328.80 m³, 40.346% of the System Input Volume. 3.2.3 Checking Water Balance in Anti-Hierarchical Order 90. To analyze the physical losses accurately, it’s necessary to check the water balance in anti-hierarchical order. Based on Chaonan’s circumstances, conduct physical loss component analysis to calculate and check. 3.2.3.1 Reported Bursts
Picture 3.37: Mains of Jinxi Water Plant
Picture 3.38: Leakage Just Repaired in Jingdu Water Plant
91. According to the statistics for leaks in Xianshan street, Lugang town, Liangying town, Xiancheng town, Si Mapu town, the leakages mainly occurred in the pipes from water distribution stations to community/village meters. The leakage records provided by the town water supply utilities show that:

43
(1) There are 61 leakages found in Xiashan town, average one leakage found every 6 days, mainly cast iron pipes and cement pipes. Among that, 4 leakages of DN400, 2 leakages of DN300, 19 leakages of DN200 to DN250, 21 leakages of DN150, 15 leakages of DN100.
(2) There are 61 leakages found in Liangying town, average one leakage found every 26 days, mainly cast iron pipes and PVC pipes. Among that, 5 leakages of DN400, 4 leakages of DN300 to DN350, 1 leakage of DN200, 4 leakages of DN150.
(3) There are 7 leakages found in Liangying town, average one leakage found every 52 days, mainly cast iron pipes. Among that, 5 leakages of DN200 to DN250, 1 leakage of DN150, 1 leakage of DN100.
(4) There are 51 leakages found in Xiancheng town, average one leakage found every 7 days, mainly Galvanized pipes and plastic pipes. Among that, 10 leakages of DN100, 3 leakages of DN60, 13 leakages of DN50, 25 leakages of DN25.
(5) There are 16 leakages found in Si Mapu town, average one leakage found every 22 days, mainly cast iron pipes. Among that, 3 leakages of DN400, 1 leakage of DN300, 12 leakages of DN150. 92. Furthermore, 5 leakages occurred in Shangyan village, Chengtian town, and 2 leakages were found in the mains of Jinxi water plant. It is estimated that more than 10 leakages occurred from Jingdu water plant to the village meters by the management staff. 93. Based on the leakage record in Chaonan, for each community or village, there are about 10 leakages estimated in the pipelines from the community/village meter to the customers. Therefore, the reported bursts in Chaonan calculated are 970, 17.5% of which appeared on the mains, and 82.5% appeared on the Service connections, such as branch pipes in the villages. 94. Then, estimate the leak duration on the basis of pipe diameter. For mains of 15 mm and 50 mm, the leak duration is taken as 6 months once leaks are found; for mains of 75 mm and 250 mm, it is taken as 1 month; for mains of more than 300 mm, it is taken as 2 hours. Considering the rural water supply, geological conditions, and without leak detection before, the leak duration was set a little longer.
Table 3.9: Calculation Forum of Reported Busts
Location of Leaks Losses of Reported Bursts
[l/hour/m pressure]
Mains 240
Service connections 32
95. Water losses from reported bursts that is L1 in Chaonan in 2012 are estimated at about 5,383,766.02 m³.

44
3.2.3.2 Unreported Bursts 96. In the early nineteen nineties, when “City water supply industry technology progress and development plan in 2000” was drafted, research staff had made an investigation about leakage detecting in 31 cities in the PRC. Then, the statistical analysis of leak detection was that the average water leakage points were 9.2 when 1,000,000 m³ water was supplied, the average water leakage points were 0.84 each 1 km pipeline. Generally, Smaller pipes whose diameter between 15 mm and 50 mm accounted for 66.65%, diameter between 75 mm and 300 mm accounted for 25.24%, diameter more than 400 mm accounted for 8.311%. 97. The research data shows most unreported bursts appear on the service connections. There is no leak detection on the water pipes in Chaonan before. And the pipe network information is incomplete. Considering the current situation, such as urban and rural included, and the lower pressure, etc. Therefore, the unreported bursts in Chaonan calculated are 1680, 26.8% of which appeared on the mains, and 73.2% appeared on the service connections.
Table 3.10: Calculation Forum of Unreported Losses
Location of Leaks
Losses of Unreported Bursts
[l/hour/m pressure]
Mains 120
Service connections 32
98. There is no leak detection action before in Chaonan, So assuming average leak duration is a year. Based on the forum above (Diagram 3.8), water losses from unreported bursts that is L2 can be estimated at 11,508,867.07 m³. 3.2.3.3 Background Leakage 99. Chaonan’s background losses in 2012 that is L3 are estimated at 578,891.60 m³. Add the estimated reported bursts, unreported bursts and background leakage, and calculate the Physical Losses that is L to be:
Physical Losses (L) =L1+L2+L3=17,471,524.69 m³
Table 3.11: Calculation Forum of Background Losses
Location of Burst Liters Unit of Measure
Mains 9.6 Liters per km of mains per day per meter of pressure
Service Connection – main to property boundary 0.6 Liters per service connection per day
per meter of pressure Service Connection – property boundary to customer meter
16.0 Liters per km of service connection per day per meter of pressure

45
100. In contrast, the physical losses calculated in anti-hierarchical order are 17,475,328.80 m³/a fewer than 3,804.11 m³/a, which is obtained through water balance calculation in hierarchical order. Reasons for the difference might be, on one hand, during water balance establishment in hierarchical order, apparent losses including unauthorized consumption and customer meter inaccuracies are underestimated, and some apparent loss components of poor accuracy are put into physical losses; and on the other hand, during water balance check in anti-hierarchical order, losses from reported bursts are underestimated due to lack of basic network data and especially absence of sufficient leak records. 101. The difference between the checked physical losses in anti-hierarchical order and calculated losses in hierarchical order is about 0.0218% that equals 10.39 m³ per day which accounts for 0.009% of the average daily SIV of 118,344.15 m³. In conclusion, the water balance data are precise enough to be used to evaluate Chaonan network’s leakage situation and reflect the water balance and leakage level. Slightly adjust physical loss components, and ultimately get the checked and verified water balance in Table 3.12.
Table 3.12: Water Balance of Chaonan Water Supply System
in 2012 After Check and Verification Unit: m³
System Input Volume 43,313,958.00
Authorized Consumption 22,450,435.60
Billed Authorized Consumption 22,440,435.60
Billed Metered Consumption 22,440,435.60 Revenue Water
22,440,435.60 Billed Unmetered Consumption 0.00
Unbilled Authorized Consumption 10,000.00
Unbilled Metered Consumption 4,000.00
Non-Revenue Water 20,873,522.41
Unbilled Unmetered Consumption 6,000.00
Water Losses 20,863,522.41
Commercial Losses 3,388,193.61
Unauthorized Consumption 155,401.04 Customer Meter Inaccuracies and Data Handling Errors 3,232,792.57
Physical Losses 17,475,328.80
Reported Bursts 5385172.703 Unreported Bursts 11511181.657 Background Leakage 578974.441

46
4 ASSESSMENT OF CURRENT INFRASTRUCTURE LEAKAGE SITUATION
AND ANALYSIS OF LEAKAGE REDUCTION STRATEGY
4.1 Targets of Performance Indicator System 102. Based on the water balance calculation, use the water supply service performance indicator system provided by IWA and conduct item-by-item analysis of the distribution network loss components, so as to help the utility implement leakage control management, prioritize investments, set targets of performance assessment and the like. Eventually, take Chaonan’s development characteristics into account, establish a performance assessment indicator system in accordance with its development condition which for the water utility is a management tool based on performance indicators. 4.2 Results of Leakage Performance Assessment 4.2.1 Calculation Results of 2012 Water Balance
103. Table 4.1 shows the percents of 2012 water balance components in the System Input Volume.
Table 4.1: Percents of 2012 Water Balance Components in SIV
System Input Volume 43,313,958.00
Authorized Consumption 51.832%
Billed Authorized Consumption 51.809%
Billed Metered Consumption 51.809% Revenue Water
51.809% Billed Unmetered Consumption 0.00
Unbilled Authorized Consumption 0.023%
Unbilled Metered Consumption 0.009%
Non-Revenue Water 48.191%
Unbilled Unmetered Consumption 0.014%
Water Losses 48.168%
Commercial Losses 7.822%
Unauthorized Consumption 0.359% Customer Meter Inaccuracies and Data Handling Errors 7.464%
Physical Losses 40.346%
Reported Bursts 12.433% Unreported Bursts 26.576% Background Leakage 1.337%
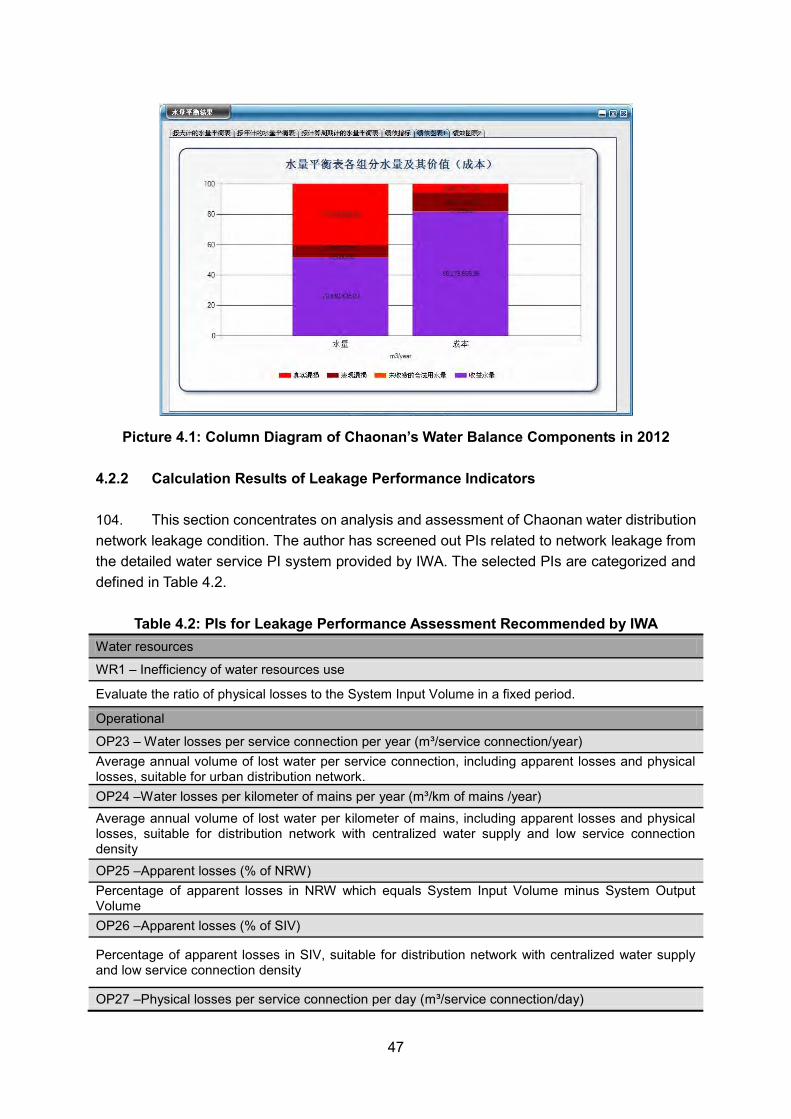
47
Picture 4.1: Column Diagram of Chaonan’s Water Balance Components in 2012
4.2.2 Calculation Results of Leakage Performance Indicators 104. This section concentrates on analysis and assessment of Chaonan water distribution network leakage condition. The author has screened out PIs related to network leakage from the detailed water service PI system provided by IWA. The selected PIs are categorized and defined in Table 4.2.
Table 4.2: PIs for Leakage Performance Assessment Recommended by IWA
Water resources
WR1 – Inefficiency of water resources use
Evaluate the ratio of physical losses to the System Input Volume in a fixed period.
Operational
OP23 – Water losses per service connection per year (m³/service connection/year) Average annual volume of lost water per service connection, including apparent losses and physical losses, suitable for urban distribution network. OP24 –Water losses per kilometer of mains per year (m³/km of mains /year) Average annual volume of lost water per kilometer of mains, including apparent losses and physical losses, suitable for distribution network with centralized water supply and low service connection density OP25 –Apparent losses (% of NRW) Percentage of apparent losses in NRW which equals System Input Volume minus System Output Volume OP26 –Apparent losses (% of SIV)
Percentage of apparent losses in SIV, suitable for distribution network with centralized water supply and low service connection density
OP27 –Physical losses per service connection per day (m³/service connection/day)

48
Suitable for intermittent water supply
OP28 –Physical losses per kilometer of mains per day (m³/km of main /day)
Suitable for distribution network with centralized water supply and low service connection density
OP29 – Infrastructure leakage Index (ILI)
Ratio of current annual physical losses to unavoidable annual real losses
Economic and financial
Fi46 – Volume of NRW (% of SIV)
NRW described by volume
Fi47 – Cost of NRW (% of the operating cost)
NRW described by cost
Table 4.3: Chaonan’s Water Supply Network Loss Performance Indicators PI Value Note of PI
1 WR1:Inefficiency of water resources use (%) 40.346
Estimated volume of physical losses (m³) / System Input Volume in the evaluation period (m³)
2 OP23:Water losses per service connection per year (m³ / service connection /year)
149.604 [Total volume of lost water (m³) × 365 / evaluation period (d) ] / number of service connections
3 OP24:Water losses per kilometer of mains per year (m³/km of mains/year)
56,848.410 [Total volume of lost water (m³) × 365 / evaluation period (d) ] / length of mains (m³)
4 OP25:Apparent losses (% of NRW) 9.623
Apparent loss value (m³) / [SIV (m³) –Raw water output volume (m³) –Product water output volume(m³)]
5 OP26:Apparent losses (% of SIV) 7.822 Apparent loss value (m³) / System Input
Volume (m³)
6 OP27:Physical losses per service connection per day (m³/service connection /day)
357.030 Physical loss value (m³) ×1000 / [number of service connections× pressure time (h) / 24 ]
7 OP28:Physical losses per kilometer of mains per day (m³/ km of mains /day)
226.110 Physical loss value (m³) ×1000 / [length of mains (km) × pressure time (h) / 24 ]
8 OP29:Infrastructure leakage Index (ILI) 27.340
Physical loss value per service connection (m³) / [18× length of mains (km) / number of service connections + 0.8 +0.025+average length of service connection (m)] / [average operating pressure (kPa) / 10]
9 Fi46: Volume of NRW (% of SIV) 48.191 Volume of NRW (m³)/ System Input Volume
(m³)
10 Fi47:Cost of NRW (% of the operating cost) 2.416
{[Authorized consumption value (m³) + apparent loss value (m³)] × average tariff for direct consumption + physical loss value (m³) × attributed unit cost of physical losses (CNY/m³)} / operating cost (CNY/m³)

49
Table 4.4: Accuracy Rating of PI Variables in 2012 PI Variable Accuracy
Rating Validity Rating
System Input Volume 1 Water record of HePing town 0.15%-5% ☆☆☆ 2 Water record of TongYu town 0.5%-1% ☆☆
3 Water record of LiangYing town 0.15%-5% ☆☆☆
4 Water record of Lugang town 0.5%-1% ☆☆
Water record of ShangYan village 0.5%-1% ☆☆ Water record of Xiashan street 0.15%-5% ☆☆☆ Water record of GuCuo community 0.5%-1% ☆☆ Water record of ChenDian town 0.5%-1% ☆☆ Water record of Si Mapu town 0.5%-1% ☆☆ Water record of GuiYu town 0.5%-1% ☆☆ Water record of Xiancheng town 0.5%-1% ☆☆ Water record of the scattered consumers 0.5%-1% ☆☆ Water record of water flowing into Jingdu plant 0.5%-1% ☆☆ Billed Authorized Consumption 5 Billed Authorized Consumption 1%-5% ☆☆ Unbilled Authorized Consumption
6 Water release when maintenance and repair pipes 10%-20% ☆
7 Water storage of newly installed mains 10%-20% ☆
8 Storing or spilling water in secondary water supply systems 10%-20% ☆
Unauthorized Consumption
11 Illegal connections limited to domestic customers 1%-5% ☆☆
12 Household size 1%-5% ☆☆☆
13 Average consumption (Liters per person per day) 1%-5% ☆☆☆
Others
14 Customer meter inaccuracies and data handling errors 1%-5% ☆☆
15 Length of mains 1%-5% ☆☆☆ 16 Number of service connections 1%-5% ☆☆☆ 17 Length of service connections 5%-10% ☆☆ 18 Number of illegal connections 5%-10% ☆☆ 19 Average system pressure 1%-5% ☆☆☆ 20 Average tariff 1%-5% ☆☆☆ 21 Marginal cost 1%-5% ☆☆☆
22 Annual operating cost 1%-5% ☆☆☆
23 Leak data of pipelines 5%-10% ☆☆

50
4.2.3 Nonrevenue Water (NRW) 105. In 2012, NRW of Chaonan water supply system is 20,873,522.41 m³, 48.191% of the System Input Volume and costs CNY18,699,381. It is composed of five components as follows:
(i) Unbilled Metered Consumption: 4,000.00 m³ (ii) Unbilled Unmetered Consumption: 6,000.00 m³
(iii) Unauthorized Consumption: 155,401.04 m³
(iv) Customer Meter Inaccuracies and Data Handling Errors: 3,232,792.57 m³ (v) Reported Bursts: 5,385,172.70 m³ (vi) Unreported Bursts: 11,511,181.66 m³ (vii) Background Leakage: 578,974.44 m³
Picture 4.2: Column Diagram of NRW Component Proportion
Picture 4.3: Pie Diagram of NRW Component Proportion

51
4.2.4 Infrastructure Leakage Index (ILI) 106. In Chaonan, the ILI is 27.34. And at the current average operating pressure of 13.42m, the physical loss value per service connection per day is 357.03 L/c/d. By comparison with the physical loss target matrix in Table 3.5, it’s concluded that Chaonan has qualified at Category D in developing countries with high network leakage level. Leakage management is imperative to reduce NRW. This situation indicates that horrendously inefficient use of resources, leakage reduction programs imperative and high priority.
Picture 4.4: ILI Value Calculated
Table 4.5: Comparison Matrix between ILI and Physical Losses (l/c/d)
Technical Performance Category ILI
Physical Losses [liters/connection/day] (when the system is pressured) at an average pressure of 10m 20m 30m 40m 50m
Developed Countries
A 1-2 <50 <75 <100 <125
B 2-4 50-100 75-150 100-200 125-250 C 4-8 100-200 150-300 200-400 250-500 D >8 >200 >300 >400 >500
Developing Countries
A 1-4 <50 <100 <150 <200 <250
B 4-8 50-100 100-200 150-300 200-400 250-500 C 8-16 100-200 200-400 300-600 400-800 500-1,000 D >16 >200 >400 >600 >800 >1,000
1) Category A: Good. Unless with extremely scarce water resources, further loss reduction may be uneconomic and careful analysis needed to identify cost-effective improvements.
2) Category B—Potential for marked improvements. Consider pressure management, better active leakage control, and better maintenance.
3) Category C—Poor. Tolerable only if water is plentiful and cheap, and even then intensify NRW reduction efforts.
4) Category D—Bad. The utility is using resources inefficiently and NRW reduction programs are imperative.
107. Based on the physical loss condition, water utility is recommended to perform physical loss control from four aspects as follows (Picture 4.5).

52
Picture 4.5: Four Strategies for Physical Losses Management
4.2.5 Apparent Loss Index (ALI) 108. In 2012, the apparent loss value is 3,388,193.61 m³, and ALI is calculated at 3.02.
Table 4.6: Apparent Loss Components
Components of Apparent Loss Volume
(m³) Expressed in % of
Apparent Loss
Unauthorized consumption 155,401.04 4.59%
Customer meter inaccuracies 3,232,792.57 95.41%
Picture 4.6: ALI Value Calculated

53
4.3 Establishment of Chaonan’s Performance Indicator system 109. Analysis of Chaonan’s leakage condition proves the physical losses and customer meter inaccuracies to be key components of NRW. Water utility is recommended to reinforce leakage management, intensify efforts in leak detection, perform timely replacement of infrastructure with frequent leaks. Based on the current condition investigation and relative data analysis, the program team has screened out 29 PIs in accordance with Chaonan’s current water supply condition from IWA’s Performance Indicators for Water Supply Services: IWA Manual of Best Practice, and established leakage control strategies involving PIs as tools. It’s expected to help further improve the leakage condition, reduce leakage and enhance revenue.

54
Chaonan’s PIs(29)
WR(1) Pe(3) Ph(3) Op(11) QS(3) Fi(8)
WR1: Inefficiency of water resources use (%)
Pe7: Technical service staff rate(%) Pe9: Operation and maintenance staff rate(%) Pe14: Meter management staff rate (%)
Ph4: Pump usage rate(%) Ph10: Flow meter density per 1,000 service connections Ph12: Customer meters per household
Op4: Leakage control rate(%/a) Op5: Active leak repair rate(%/a) Op7: Flow meter calibration (-/a) Op8: Flow meter renewal (-/a) Op16: Mains rehabilitation rate(%/a) Op24: Water losses per km of mains per year(m³/km/a) Op25: Apparent losses rate (% of NRW) Op29: ILI Op36: Customer meter reading rate Op39: Unbilled consumption rate(%) Op40: Detection rate(%)
QS3: Service coverage (%) QS10: Pressure stability rate (%) QS18: Water quality qualification rate(%)
Fi1: Revenue per m³ of water (yuan/ m³) Fi4: Cost per m³ of water (yuan/ m³) Fi5: Operating cost per m³ of water (yuan/ m³) Fi12: Comprehensive management cost per m³ of water (yuan/ m³) Fi28: Average tariff of direct supply (yuan/ m³) Fi29: Average tariff of exported water (yuan/ m³) Fi46: Volume of NRW(% of SIV) Fi47: NRW cost (% of operating cost)
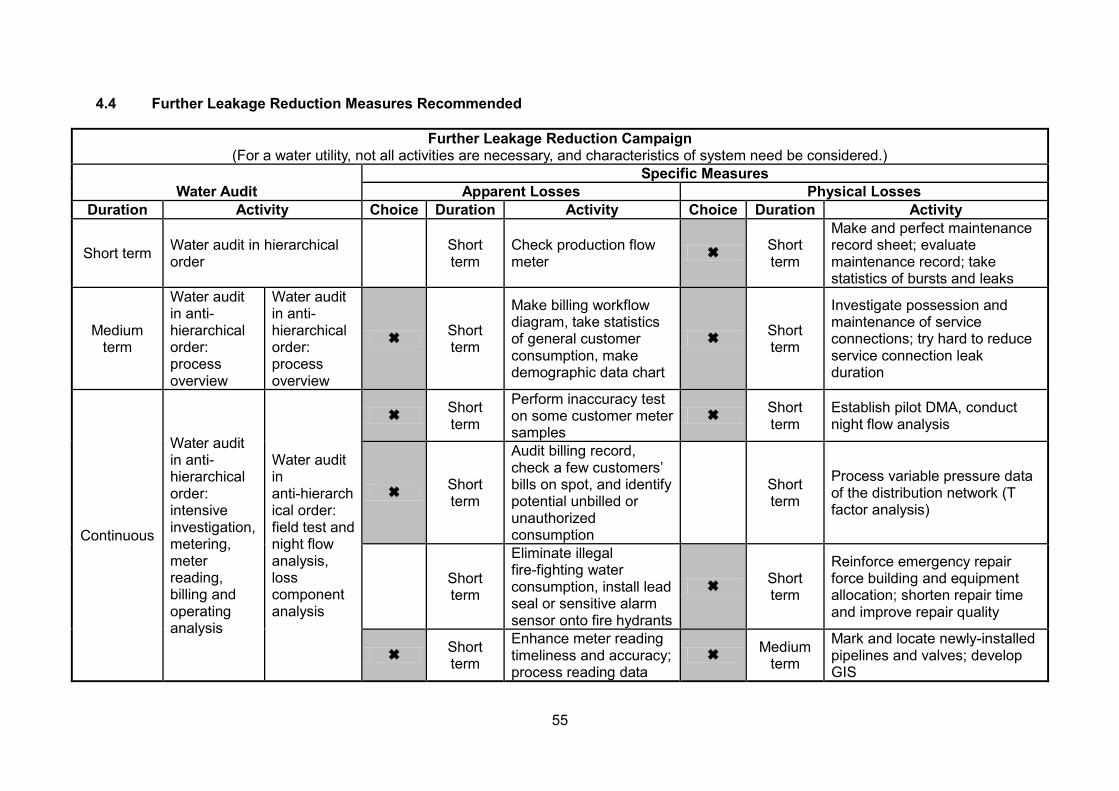
55
4.4 Further Leakage Reduction Measures Recommended
Further Leakage Reduction Campaign (For a water utility, not all activities are necessary, and characteristics of system need be considered.)
Water Audit Specific Measures
Apparent Losses Physical Losses Duration Activity Choice Duration Activity Choice Duration Activity
Short term Water audit in hierarchical order Short
term Check production flow meter Short
term
Make and perfect maintenance record sheet; evaluate maintenance record; take statistics of bursts and leaks
Medium term
Water audit in anti- hierarchical order: process overview
Water audit in anti- hierarchical order: process overview
Short term
Make billing workflow diagram, take statistics of general customer consumption, make demographic data chart
Short term
Investigate possession and maintenance of service connections; try hard to reduce service connection leak duration
Continuous
Water audit in anti- hierarchical order: intensive investigation, metering, meter reading, billing and operating analysis
Water audit in anti-hierarchical order: field test and night flow analysis, loss component analysis
Short term
Perform inaccuracy test on some customer meter samples
Short term
Establish pilot DMA, conduct night flow analysis
Short term
Audit billing record, check a few customers’ bills on spot, and identify potential unbilled or unauthorized consumption
Short term
Process variable pressure data of the distribution network (T factor analysis)
Short term
Eliminate illegal fire-fighting water consumption, install lead seal or sensitive alarm sensor onto fire hydrants
Short term
Reinforce emergency repair force building and equipment allocation; shorten repair time and improve repair quality
Short term
Enhance meter reading timeliness and accuracy; process reading data
Medium term
Mark and locate newly-installed pipelines and valves; develop GIS

56
synchronously
Medium term Locate meters by GPS Medium
term
Regularly conduct pressure and flow test and visit large customers; develop network hydraulic modeling
Medium term
Perfect pipeline patrolling regulation; intensify management of water consumption for construction, green plot sprinkling and etc.
Medium term
Perform pipe coating and lining rehabilitation, try non-excavation technique in installation
Medium term
Establish Customer Center, understand network condition in various ways, shorten leak awareness time
Medium term
Perform scientific operation control and reduce night production pressure; perform key valve remote control under mature circumstances
Medium term
Examine or implement strategy to stop unauthorized consumption; strike out illegal or regulation-breaching consumption and develop reporting and reward regulation; build water supervision team
Medium term
Build and strengthen leak detection team, or contract leak detection; conduct regular inspection of unreported leaks; shorten leak detection period
Medium term
Install, renew or replace production flow meters Medium
term
Install pressure relief valves at proper sites to manage zone pressure
Long term
Perform zone metering and zone performance assessment
Long term Upgrade SCADA system
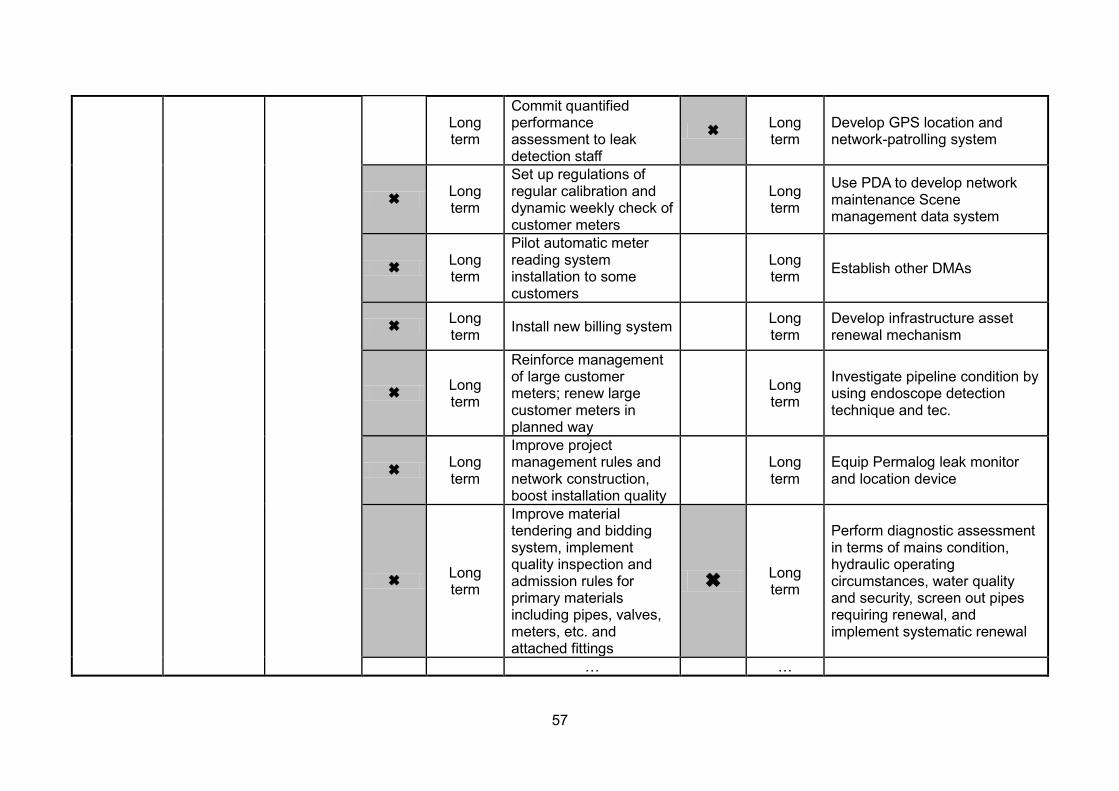
57
Long term
Commit quantified performance assessment to leak detection staff
Long term
Develop GPS location and network-patrolling system
Long term
Set up regulations of regular calibration and dynamic weekly check of customer meters
Long term
Use PDA to develop network maintenance Scene management data system
Long term
Pilot automatic meter reading system installation to some customers
Long term Establish other DMAs
Long term Install new billing system Long
term Develop infrastructure asset renewal mechanism
Long term
Reinforce management of large customer meters; renew large customer meters in planned way
Long term
Investigate pipeline condition by using endoscope detection technique and tec.
Long term
Improve project management rules and network construction, boost installation quality
Long term
Equip Permalog leak monitor and location device
Long term
Improve material tendering and bidding system, implement quality inspection and admission rules for primary materials including pipes, valves, meters, etc. and attached fittings
Long term
Perform diagnostic assessment in terms of mains condition, hydraulic operating circumstances, water quality and security, screen out pipes requiring renewal, and implement systematic renewal
… …
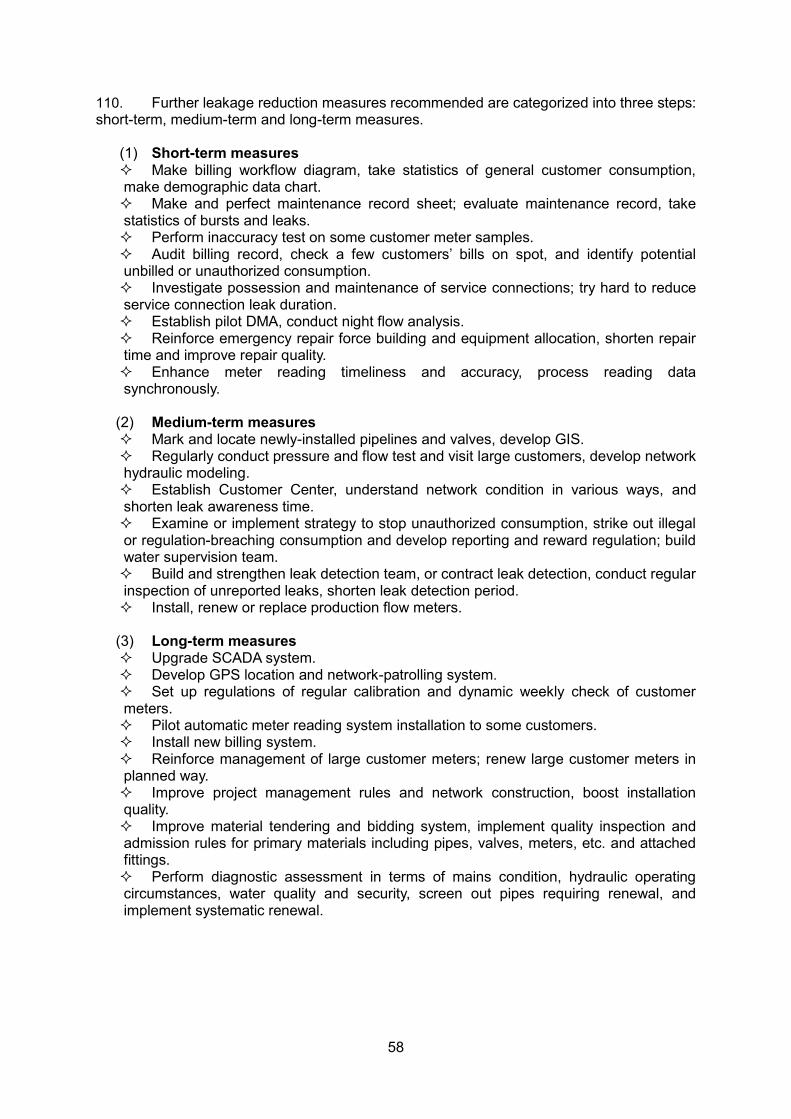
58
110. Further leakage reduction measures recommended are categorized into three steps: short-term, medium-term and long-term measures.
(1) Short-term measures Make billing workflow diagram, take statistics of general customer consumption, make demographic data chart. Make and perfect maintenance record sheet; evaluate maintenance record, take statistics of bursts and leaks. Perform inaccuracy test on some customer meter samples. Audit billing record, check a few customers’ bills on spot, and identify potential unbilled or unauthorized consumption. Investigate possession and maintenance of service connections; try hard to reduce service connection leak duration. Establish pilot DMA, conduct night flow analysis. Reinforce emergency repair force building and equipment allocation, shorten repair time and improve repair quality. Enhance meter reading timeliness and accuracy, process reading data synchronously.
(2) Medium-term measures Mark and locate newly-installed pipelines and valves, develop GIS. Regularly conduct pressure and flow test and visit large customers, develop network hydraulic modeling. Establish Customer Center, understand network condition in various ways, and shorten leak awareness time. Examine or implement strategy to stop unauthorized consumption, strike out illegal or regulation-breaching consumption and develop reporting and reward regulation; build water supervision team. Build and strengthen leak detection team, or contract leak detection, conduct regular inspection of unreported leaks, shorten leak detection period. Install, renew or replace production flow meters.
(3) Long-term measures Upgrade SCADA system. Develop GPS location and network-patrolling system. Set up regulations of regular calibration and dynamic weekly check of customer meters. Pilot automatic meter reading system installation to some customers. Install new billing system. Reinforce management of large customer meters; renew large customer meters in planned way. Improve project management rules and network construction, boost installation quality. Improve material tendering and bidding system, implement quality inspection and admission rules for primary materials including pipes, valves, meters, etc. and attached fittings. Perform diagnostic assessment in terms of mains condition, hydraulic operating circumstances, water quality and security, screen out pipes requiring renewal, and implement systematic renewal.
59
4.5 Leakage Management Program Cost-Effectiveness Step 1. Calculate the Hidden Losses (excess Losses)
111. Physical loss component analysis is used to determine the part of physical losses which is in “excess” of all other leakage components. The volume of Hidden (Excess) Losses represents the quantity of water lost by “hidden” leaks that are not being detected and repaired with the current leakage control policy. 112. Hidden losses equal to the Physical losses calculated in water balance minus the reported losses found by water utility.
Step 2. Calculate the Repairable Losses
113. Generally, most water leakages cannot be measured, and not all leakages can be detected and repaired. Experience shows that 25% to 75% of the Hidden Losses can be repaired. Considering the pressure is low in Chaonan water supply pipes, and background leakage can be reduced just through pressure management. So the background leakage in Chaonan is as unrepairable losses temporarily, till the pressure management program adopted later. 114. Therefore, the repairable losses equal to the unreported losses multiplied by the coefficient 50%, and the value is 5,755,590.82 m³.
Step 3. Calculate the value of Repairable losses
115. Saving water is saving money, if the losses prevented, can achieve two types of cost savings. One is the cost of water purchased; the other is the variable cost of operation and maintenance for the water storage, treatment and transportation. Both costs are vary with the amount of water entering the distribution system, but the fixed cost excluded. 116. Before the loss repaired, the average life of the loss is estimated of two years, which greatly depends on the conditions of the pipe and soil, and the scope of a leakage detection program. Thus, the total revenue will generate two years later. The total value of Repairable losses equal to the annual revenue earned from repairable losses multiplied by 2. 117. In some cases, additional revenue obtained from increasing cost of leakage detection and repair. For example, a more active detection program may delay the invest in new water source or water treatment plant, and resulting in financial savings by delaying costs. 118. Therefore, the value of repairable losses comes to CNY3,825,165.66.
Step 4. Calculate the Cost of Leakage Detection Program
119. The cost of leakage detection program doesn’t include the cost of leakage repair, because the leakages will be discovered and repaired constantly during water utility operating. And the leakages detected by the program will be repaired finally. 120. Here is a budget plan formulated by a leakage detection company.
a. Project Content 1. Pipeline leakage inspection of 400km pipes. 2. Detailed leakage investigation, such as pipes and valves detection by sounding sticks
and leak noise correlators, etc.

60
3. leakage location 4. Submit results report, including work summary and suggestions, etc. b. Project Staff and Instrument Configuration 1. Project staff Project Manager: 1 Engineer Project Technical Leader: 2 Leak detection technicians Project Team Leader: 3 Advanced Leak workers 2. Equipment
Table 4.7: Leakage Detection Equipment List
No. Equipment Type/
Specification Place of
Production Quantity
1 Underground pipeline detector 960 Japan 1
2 Leak detector HG-10AII Japan 5 3 Leak correlator LC-2500 Japan 1 4 Covers Detector Metal Detector Japan 1 5 Sounding stick 1.5m Japan 5 6 Exploration drilling rods 1200×22mm PRC 1 7 Electric Hammer D25501K Germany 1 8 Drill 800×22mm Joint venture 4
c. Scope of Work
121. According to the agreement, Professional workers will make a comprehensive leak detection on pipeline, with imported professional detection equipment.
d. Project Cost
122. A total of CNY240,000 for 400 km pipes. (CNY600 every 1 km pipe leak detection), and Details as follows:
8 inspection workers, 15days. Pipeline inspection and survey: CNY120,000. Accommodation allowance: CNY9,000. Equipment usage: CNY10,000. Round-trip: CNY24,000. Insurance: CNY4,000 Invoices taxes: CNY8,000. Management: CNY60,000, including the payment for the workers. Contingency: CNY5,000.
123. Therefore, the cost of leakage detection program is CNY240,000.
Step 5. Calculate the Benefit–Cost Ratio (B:C)
124. The Benefit: Cost Ratio (B: C) equal to the value of Repairable losses divide by the cost of leakage detection program.
value of repairable lossesBenefit : Cost Ratio(B:C) = cost of leakage detection
The Benefit: Cost Ratio (B: C) is 15.938. Obviously, the ratio much greater than 1.0, that means the value of Repairable losses much larger than the cost of leakage detection. So the program should be implemented.

61
5 DMA ESTABLISHMENT FOR DESIGNING PURPOSE 5.1 Introduction of DMA 125. The technique of leakage monitoring requires the installation of flow meters at strategic points throughout the distribution system, each meter recording flows into a discrete area, which has a defined and permanent boundary. Such an area is called a District Metered Area (DMA). 126. The design of a leakage monitoring system has two aims:
The distribution system divided into a number of DMAs, so that the flow into each district can be regularly monitored, enabling the presence of unreported bursts to be identified and leakage to be calculated with confidence.
Pressure managed in each or a group of DMAs, so that the networks is operated at the optimum level of pressure.
5.2 DMA Establishment Process
Step1-The design of a series of DMA is very subjective. The engineer typically uses a set of criteria to create a preliminary DMA design that must be tested either in the field or using a networks model.
Step 2-To divide a large open system into a series of DMA, it is essential to close valves to isolate a certain area and install flow meters. This process can affect the system’s pressure, both within that particular DMA as well as its surrounding areas.
Step 3-Utility managers will ensure that all pipes into and out of the DMA are either closed or metered by performing an isolation test named zero pressure test.
Step 4-For each DMA, utility managers should develop a detailed operational manual to assist future teams in managing the water supply.
Step 5-Once the DMA has been established, it becomes an operational tool for monitoring and managing both of major components of NRW, physical losses and commercial losses. 5.3 DMA for Designing Purpose 127. The planning stage is the process of dividing each sector into suitable sized DMAs. This is most common in large inter-connected networks. In small distribution systems, it is unlikely that this stage will be necessary.
The key to good DMA design is: Minimum variation in ground level across the DMA; Easily identified boundaries that are robust; Size appropriate to number of burst to be identified; Meters correctly sized and located; Involvement of all operational staff affected by network changes; Limit the number of closed boundary valves; Limit the number of flow meters; Optimize pressure to maintain customer standards of service and to reduce leakage.
5.4 Meter Selection 128. The flow meter should be capable of accurately measuring low flows whilst avoiding excessive head losses at peak flows. 129. Electro-magnetic full-bore meters are most suited to DMA application as they possess the required low flow accuracy without affecting significantly the head losses at peak flows. However, they tend to be expensive and in most cases require external power supply.
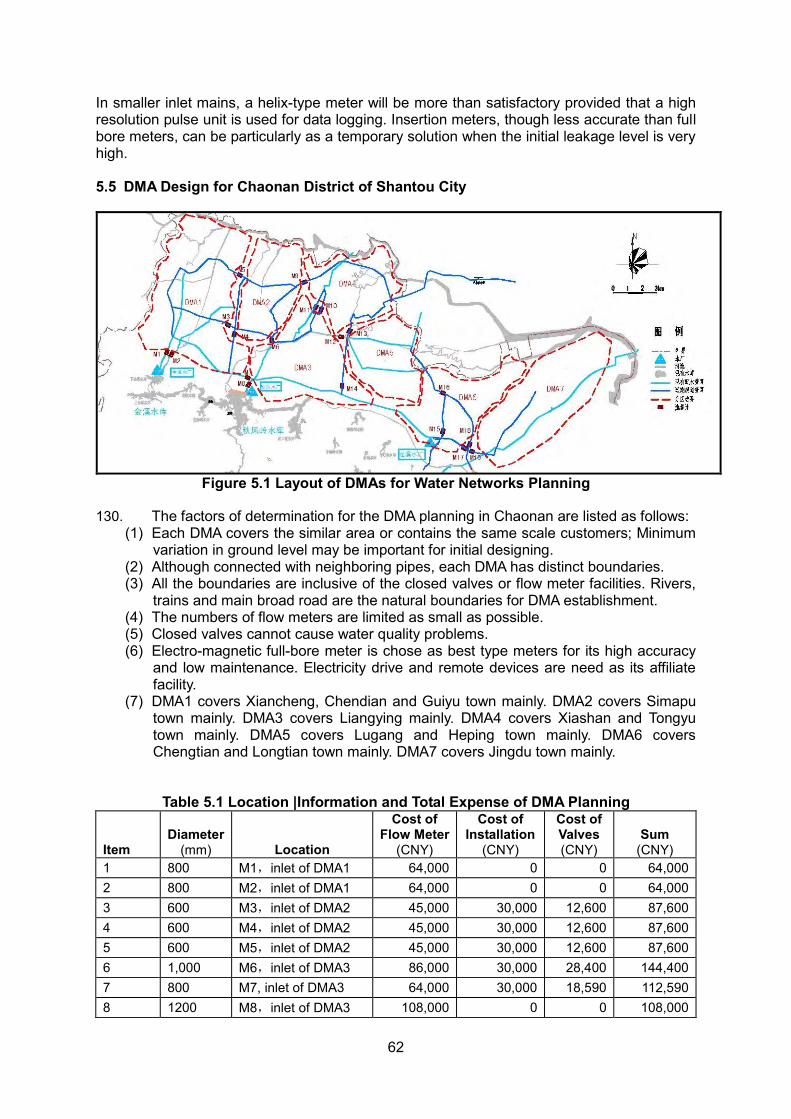
62
In smaller inlet mains, a helix-type meter will be more than satisfactory provided that a high resolution pulse unit is used for data logging. Insertion meters, though less accurate than full bore meters, can be particularly as a temporary solution when the initial leakage level is very high. 5.5 DMA Design for Chaonan District of Shantou City
Figure 5.1 Layout of DMAs for Water Networks Planning
130. The factors of determination for the DMA planning in Chaonan are listed as follows:
(1) Each DMA covers the similar area or contains the same scale customers; Minimum variation in ground level may be important for initial designing.
(2) Although connected with neighboring pipes, each DMA has distinct boundaries. (3) All the boundaries are inclusive of the closed valves or flow meter facilities. Rivers,
trains and main broad road are the natural boundaries for DMA establishment. (4) The numbers of flow meters are limited as small as possible. (5) Closed valves cannot cause water quality problems. (6) Electro-magnetic full-bore meter is chose as best type meters for its high accuracy
and low maintenance. Electricity drive and remote devices are need as its affiliate facility.
(7) DMA1 covers Xiancheng, Chendian and Guiyu town mainly. DMA2 covers Simapu town mainly. DMA3 covers Liangying mainly. DMA4 covers Xiashan and Tongyu town mainly. DMA5 covers Lugang and Heping town mainly. DMA6 covers Chengtian and Longtian town mainly. DMA7 covers Jingdu town mainly.
Table 5.1 Location |Information and Total Expense of DMA Planning
Item Diameter
(mm) Location
Cost of Flow Meter
(CNY)
Cost of Installation
(CNY)
Cost of Valves (CNY)
Sum (CNY)
1 800 M1,inlet of DMA1 64,000 0 0 64,000 2 800 M2,inlet of DMA1 64,000 0 0 64,000 3 600 M3,inlet of DMA2 45,000 30,000 12,600 87,600 4 600 M4,inlet of DMA2 45,000 30,000 12,600 87,600 5 600 M5,inlet of DMA2 45,000 30,000 12,600 87,600 6 1,000 M6,inlet of DMA3 86,000 30,000 28,400 144,400 7 800 M7, inlet of DMA3 64,000 30,000 18,590 112,590 8 1200 M8,inlet of DMA3 108,000 0 0 108,000

63
Item Diameter
(mm) Location
Cost of Flow Meter
(CNY)
Cost of Installation
(CNY)
Cost of Valves (CNY)
Sum (CNY)
9 800 M9,inlet of DMA4 64,000 30,000 18,590 112,590 10 600 M10,inlet of DMA4 45,000 30,000 12,600 87,600 11 600 M11,inlet of DMA4 45,000 30,000 12,600 87,600 12 600 M12,inlet of DMA5 45,000 30,000 12,600 87,600 13 800 M13,inlet of DMA5 64,000 30,000 18,590 112,590 14 800 M14,inlet of DMA5 64,000 30,000 18,590 112,590
15 600 M15,internal meter of DMA6 45,000 30,000 12,600 87,600
16 800 M16,inlet of DMA6 64,000 30,000 18,590 112,590 17 800 M17,inlet of DMA6 64,000 30,000 18,590 112,590 18 800 M18,inlet of DMA6 64,000 30,000 18,590 112,590 19 800 M19, inlet of DMA7 64,000 30,000 18,590 112,590
Total 1,149,000 480,000 265,320 1,894,320

64
6 CONCLUSION AND SUGGESTION 6.1 Conclusion 131. It can be concluded from field test data analysis, water balance establishment, leakage condition assessment and leakage management program cost-effectiveness in Chaonan district, including the whole supply area of Qiufeng water plant, Jinxi water plant and Jingdu water plant.
(1) Its NRW in 2012 is 20,873,522.41 m³, 48.191% of system input volume, and worth CNY18,699,381. After assessment of Chaonan’s water supply system leakage condition, it can be discovered that physical losses and poor meter management are the key factors of NRW. Meanwhile, NRW (%) results during different management stages calculated as follows:
From water plants to distribution stations, the NRW is 3% to 8%. From distribution stations to the bigger meters of communities/villages/companies, etc,
the NRW is 15% to 39%. From meters of communities/villages/companies, etc to the smaller meters mainly for
domestic users, the NRW is 30% to 50%. (2) Its apparent losses in 2012 are 3,388,193.61 m³, 7.822% of system input volume. And
ALI is calculated at 3.02. (3) Its physical losses in 2012 are 17,475,328.80 m³, 40.346% of system input volume.
Moreover, it can be known from estimation of physical losses components that reported bursts take up 30.816%, unreported losses 65.871% and background losses 3.313%.
(4) Chaonan’s ILI is 27.34, the average pressure is 0.1342 MPa, and the physical losses are 357.03 L/c·d. Compared with Target Matrix provided by World Bank Institute, Chaonan’s water supply network is Category D among developing countries, which means serious leakage level. Its horrendously inefficient use of resources, leakage reduction programs imperative and high priority.
(5) Based on current condition investigation and data analysis, leakage reduction consultant selected 29 performance indicators suitable for Chaonan’s current conditions from IWA Performance Indicator Handbook, and developed a series of leakage reduction strategies and measures involving PIs as tools.
(6) Through cost-effectiveness analysis of the leakage management program, the Benefit: Cost Ratio (B: C) is 15.938. That means the value of Repairable losses much larger than the cost of leakage detection. So the leakage management program should be implemented and given high priority. 6.2 Suggestion 6.2.1 Capacity Building (Inclusive of Institutional Enhancement)
(1) Water Leakage Detection Team Establishment
132. Enhancement specialized leak detection group skills. Leak detection is an active leakage control measure. At present, Chaonan has no leak detection group. Lack of sufficient staffs and professional leak detection expertise, the detection cannot be conducted when burst happened in Chaonan. It is advisable to establish leak detection group and equip more necessary leak detection devices. In the first place, conduct strict leak detection trainings that focus on field practice. External leak detection force can also be resorted to for training and drill when necessary. Mentoring program helps group members master leak detection technology. And these devices enable local leak detection, leakage reduction and performance boost. (With capacity building expense of CNY 50,000 and equipment purchase expense of CNY 716,100+28050=744150)

65
(2) Water Supplier Integrating and Tariff Collection Reform 133. It is advisable that all of the water systems in Chaonan should be merged to one central water utility for ease of improvement of water quality and management. Three-level water supplier scheme must be diminished with the local administration promotion as soon as possible. Hence, common water service standards, professional technical support and senior management philosophy could be induced to Chaonan. Moreover, water supplier to all end users is of importance to ADB water supply project. The charge tariff should be lower significantly by this way only. The burden of water usage can be alleviated. Therefore, residents in Chaonan will improve their living standard gradually once the water infrastructures have been built. 6.2.2 DMA Scheme Designing and Planning
Flow Meter Installation and DMAs Design for Planning Purpose (Cost of
CNY1,894,320) 134. Analyses of long-term monitoring data of DMAs help water utility to understand the flow variation against time. For example, when burst happens in a DMA, flow changes sharply and even the area pressure drops considerably. Based on the monitoring data, the utility managers can find out areas with abrupt variation of pressure and flow, and analyze the flow rates to locate leakages in short time. Especially in case of bursts, the monitoring data can facilitate utility managers to identify the location quickly for timely repair which would diminish volume of lost water and other losses. In conclusion, monitoring DMA is vital for network management because through the monitoring system, pressure and flow of the whole network can be explicitly reflected, bursts can be quickly located and it can provide data for network modeling. 135. Select 7 DMAs in Chaonan water supply planning network to conduct leakage monitoring and analysis which can be taken as the basis of leakage monitoring and reduction of the whole network. Install measuring equipments on DMAs’ boundaries to record pressure, flow and other data in different area networks. Thus water utility is able to monitor the whole network for long term, acquire the micrographic distribution of leakages and balance the network service pressure to reduce leakage. Establishing DMAs as a strategy of leakage management enables the water utility to evaluate the area leakage condition, to compare leakage of different areas, and to find out areas with high leakage for active leak detection. 136. It is best chance to design DMA scheme in FSR stage because more constructional advices and suggestions can be added to the preliminary plan. Afterwards, project measures, including meter/valve installation and chamber building, may be realized easily. So, the DMA structure can be divided clearly. It is help for managing and monitoring the night flow, alerting the burst incidents, and evaluating leakage status. 137. ADB water supply project in Chaonan demanded consultant to provide technological support or demonstration areas in terms of IWA philosophy of water loss reduction, and conduct comprehensive analysis to make sure network operates better and functions properly. The NRW consultant have designed DMA scheme for water distribution planning, inclusive of practical suggestion to the proprietor and design institute. The proprietor adopted the NRW consultant proposals and design institute reviewed the FSR again from system operational view. So ADB provide a better chance to optimize or revise the FSR. In this way, all of objectives of the Chaonan project can be fulfilled successfully.

66
6.3 Anticipated Accomplishments of the Leakage Reduction Project in Chaonan
(1) Make rational use of urban water resources with moderate or none consumption increase, and realize sustained development.
(2) During implementing ADB project, water utility should perform water balance calculation and leakage reduction PI assessment annually. The NRW at the end of the project will be decreased to 25%, compared with current NRW level 48.191%. This figure is estimated by data statistics from current repairable loss level (taking up 13.3%) adding apparent loss (taking up 7.8%). If repairable loss and apparent loss have been reduced significantly, loss level should be decreased by 21% or so. Thus optimistic assessment of loss control target is around 25%. Saved water will be up to 9,143,783 m3 annually and it can earn CNY 34,746,375 revenue from leakage control management (average tariff CNY 3.8/m3). Moreover, according to statistics data from 2011 Chinese urban water association, the average level of NRW was up to 20% around 650 cities and towns. In Chaonan district, for the sake of its large areas, direct charge tariff progressing, and lack of professional water management, aimed leakage reduced level 25% is reasonable.
(3) Be capable of implementation DMA planning scenario strictly and analyzing and comparing night flow data in DMAs to prioritize leak detection strategy in the future.
(4) Water supplying directly mode should be popularized step by step in order to realized equal water billing service in the rural areas. The popularity rate for water supply is expected to advanced sharply by the end of ADB project period.
(5) In contrast to current real loss level, Leak detection period of the urban water supply network, and time taken to attend bursts or leaks after the first notification be shorted significantly in the future. Aged water pipes should be replaced by new ductile pipes guided by annual maintenance plan.
(6) Undertake and realize other annual optimistic estimation of investments saved by implementation ADB water loss control project.

67
Expenses of capacity building, project construction and equipment purchase are listed in Table 5.1 in order of priority.
Table 5.1: Overall Expenses
Item Equipment Quantity
Equip- ment
Expense (CNY)
Construction Expense (CNY)
Others (CNY)
Subtotal (CNY) Note
1 Capacity building 50,000
3 days workshop of leak detection
50,000
2 Equipment purchase
Electronic leak detector
2 21,300 42,600
3 Pipe locator 2 52,500 105,000
4 Soundness correlator
2 275,250 550,500
5 Listening pod 6 3,000 18,000
6 Device for valve locating
1 7,200 7,200
7
Distance measure- ment devices
1 2,250 2,250
8 Pump 2 800 1,600
9 Electricity motor 2 2,200 4,400
10 Drilling machine 2 6,300 12,600
744,150
11
Project construction-DMA designing
Electro- magnetic meter
19 1,894,320
Using for DMA dividing and metering
Total 2,688,470