nonuniform interfacial tracer distributions and implications for microscale piv minami yoda g. w....
Post on 19-Dec-2015
227 views
TRANSCRIPT
NONUNIFORM INTERFACIAL TRACER DISTRIBUTIONS AND IMPLICATIONS FOR
MICROSCALE PIV
Minami YodaG. W. Woodruff School of Mechanical Engineering
IMA Workshop (11/09)
2
OUTLINE
Introduction / Motivation• Nano-PIV for interfacial velocimetry
• Multilayer nano-particle image velocimetry (MnPIV)
Poiseuille flows• Particle distributions
• Shear rate and slip length
Electrokinetically driven flows• Particle distributions
• Diffusion coefficients
Conclusions
IMA Workshop (11/09)
3
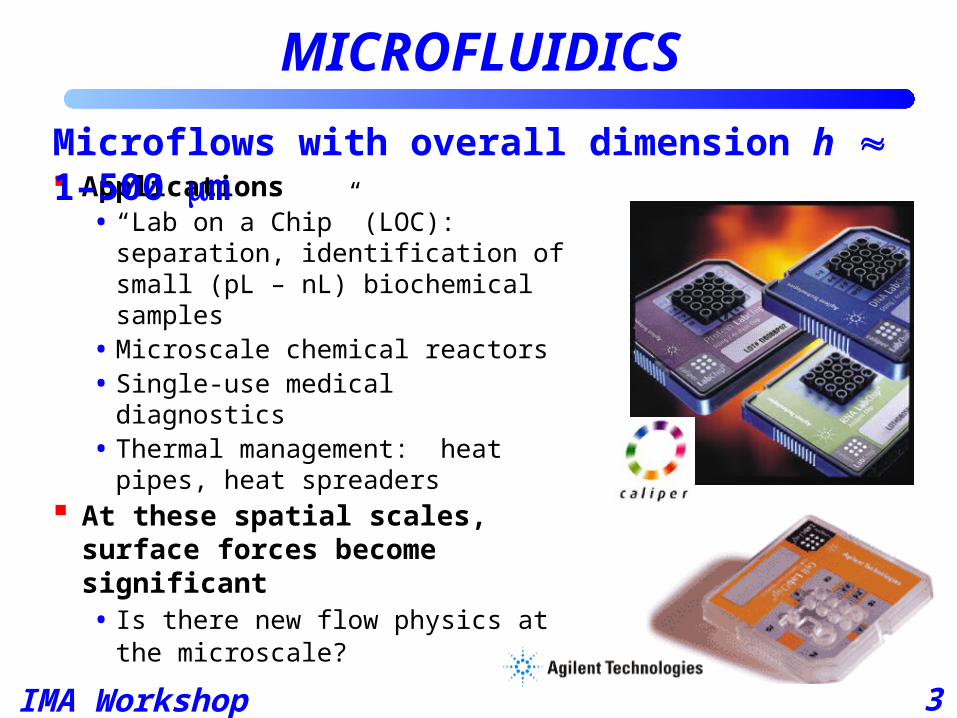
Applications• “Lab on a Chip” (LOC):
separation, identification of small (pL – nL) biochemical samples
• Microscale chemical reactors• Single-use medical diagnostics• Thermal management: heat pipes,
heat spreaders At these spatial scales, surface
forces become significant• Is there new flow physics at the
microscale?
MICROFLUIDICS
Microflows with overall dimension h 1–500 m
IMA Workshop (11/09)
4
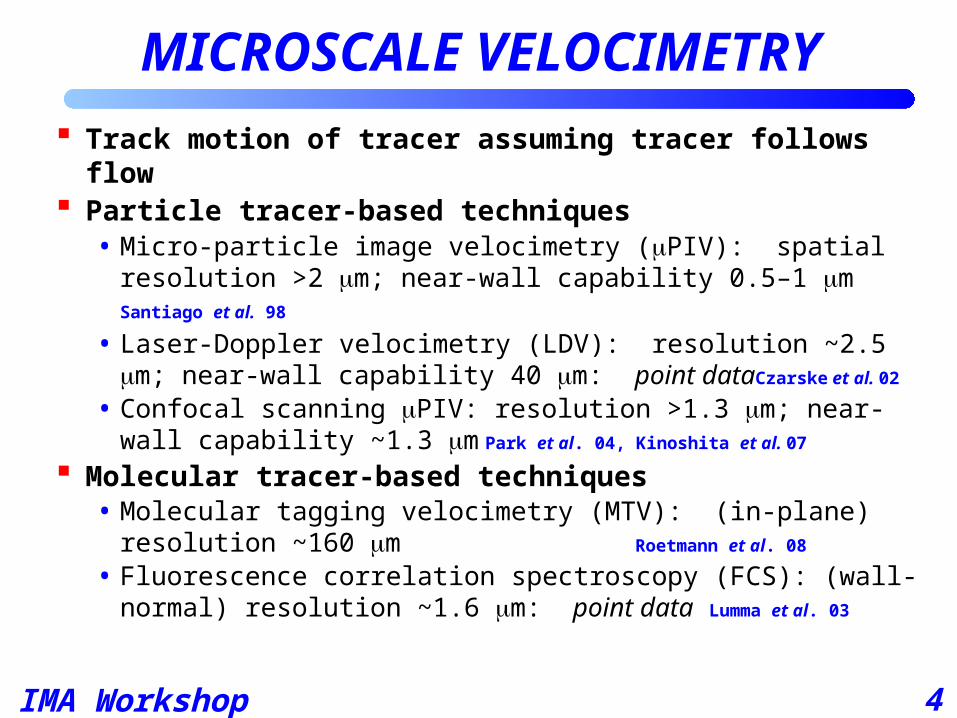
Track motion of tracer assuming tracer follows flow Particle tracer-based techniques
• Micro-particle image velocimetry (PIV): spatial resolution >2 m; near-wall capability 0.5–1 m Santiago et al. 98
• Laser-Doppler velocimetry (LDV): resolution ~2.5 m; near-wall capability 40 m: point data Czarske et al. 02
• Confocal scanning PIV: resolution >1.3 m; near-wall capability ~1.3 m Park et al. 04, Kinoshita et al. 07
Molecular tracer-based techniques• Molecular tagging velocimetry (MTV): (in-plane) resolution ~160
m Roetmann et al. 08
• Fluorescence correlation spectroscopy (FCS): (wall-normal) resolution ~1.6 m: point data Lumma et al. 03
MICROSCALE VELOCIMETRY
IMA Workshop (11/09)
5
INTERFACIAL TRANSPORT
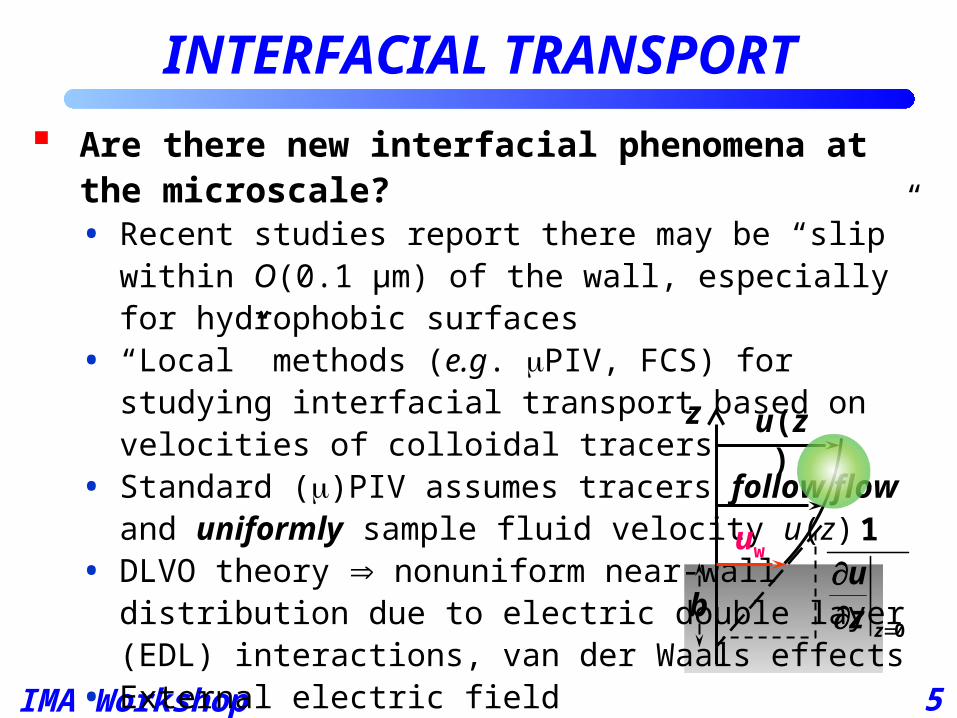
Are there new interfacial phenomena at the microscale?• Recent studies report there may be “slip” within O(0.1 µm) of
the wall, especially for hydrophobic surfaces• “Local” methods (e.g. PIV, FCS) for studying interfacial
transport based on velocities of colloidal tracers• Standard ()PIV assumes tracers follow flow and uniformly
sample fluid velocity u(z)• DLVO theory nonuniform near-wall
distribution due to electric double layer (EDL) interactions, van der Waals effects
• External electric field (electrokinetically driven flows) tracer electrophoresis, charge polarization
z u(z)
b
uw
0
1
z
uz
IMA Workshop (11/09)
6
INTERFACIAL PIV
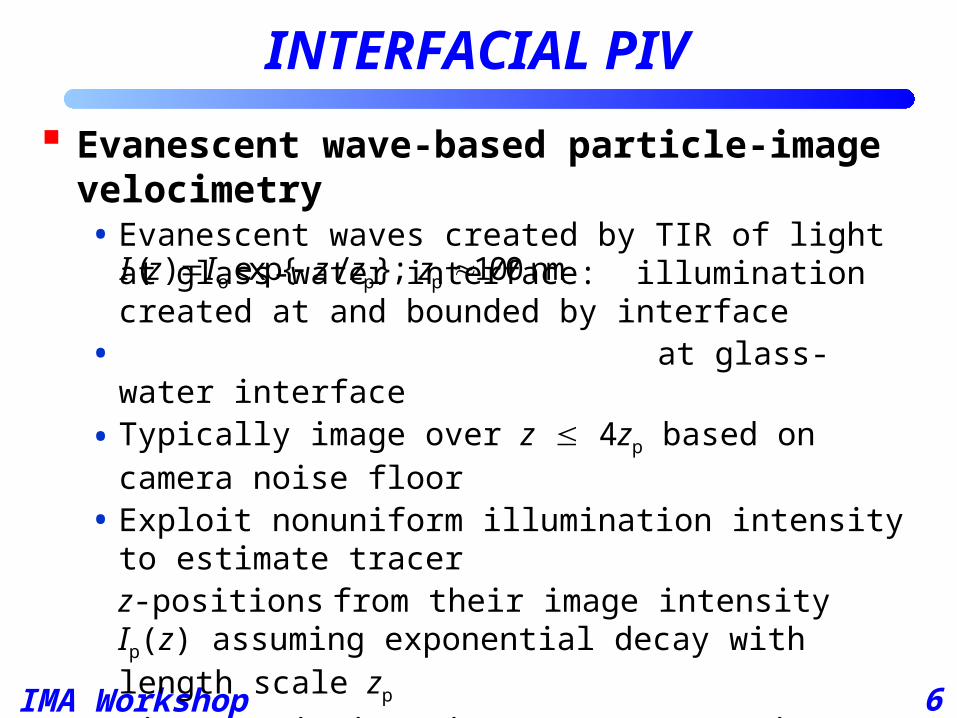
Evanescent wave-based particle-image velocimetry • Evanescent waves created by TIR of light at glass-water
interface: illumination created at and bounded by interface• at glass-water
interface
• Typically image over z 4zp based on camera noise floor
• Exploit nonuniform illumination intensity to estimate tracer z-positions from their image intensity Ip(z) assuming exponential decay with length scale zp
• Given variations in tracer properties (variations in Ip of 9% for tracers at same z), collect ensemble of z-positions for O(105) tracers near-wall tracer distribution
Near-wall velocimetry and Brownian diffusion studiesZettner & Yoda 03, Kihm et al. 04, Pouya et al. 05, Huang et al. 07, Lasne et al. 08
o p p( ) exp{ / }; 100 nmI z I z z z
IMA Workshop (11/09)
7
MULTILAYER NPIV
1 /
z
Ip
z
ub
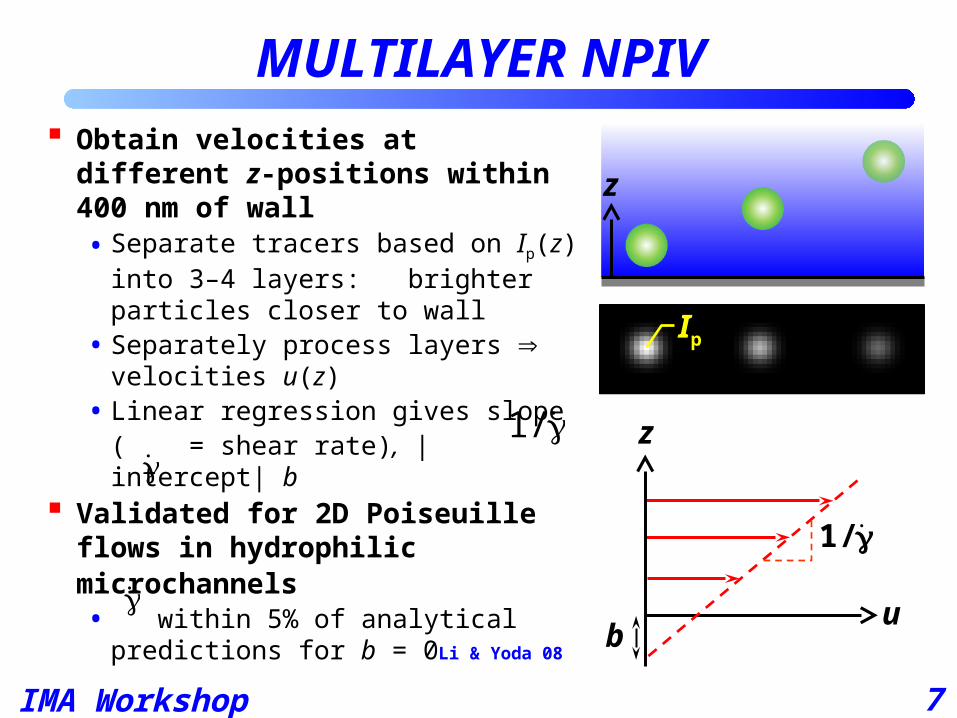
Obtain velocities at different z-positions within 400 nm of wall• Separate tracers based on Ip(z) into 3–
4 layers: brighter particles closer to wall
• Separately process layers velocities u(z)
• Linear regression gives slope ( = shear rate), |intercept| b
Validated for 2D Poiseuille flows in hydrophilic microchannels• within 5% of analytical predictions
for b = 0
Li & Yoda 08
1/
IMA Workshop (11/09)
8
t0
BIASES IN MNPIV
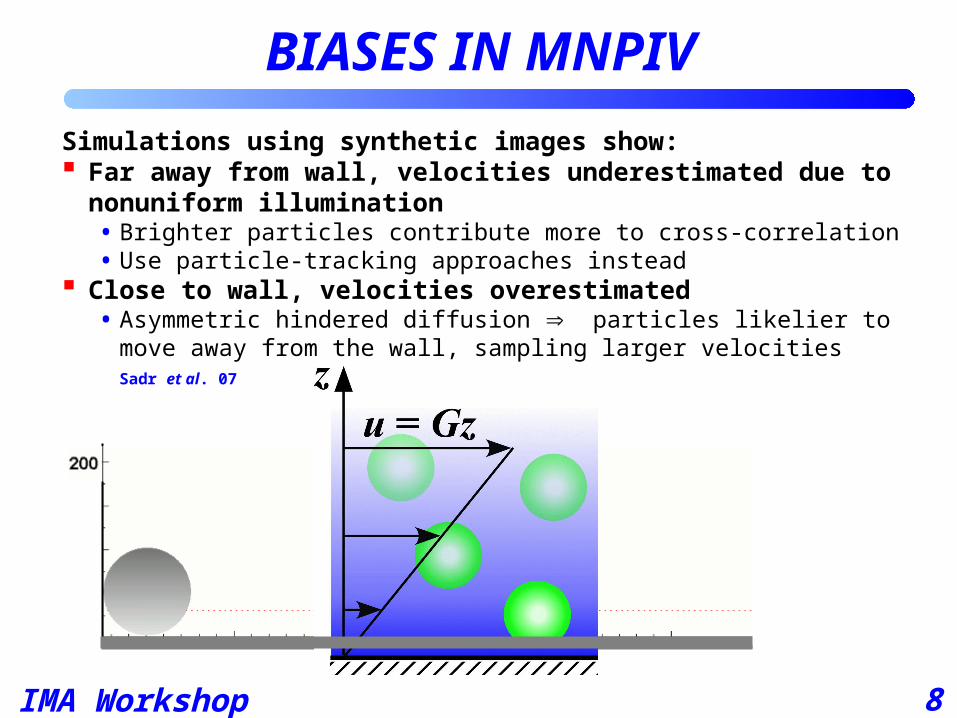
Simulations using synthetic images show: Far away from wall, velocities underestimated due to
nonuniform illumination• Brighter particles contribute more to cross-correlation• Use particle-tracking approaches instead
Close to wall, velocities overestimated • Asymmetric hindered diffusion particles likelier to move away from
the wall, sampling larger velocitiesSadr et al. 07
IMA Workshop (11/09)
9
OUTLINE
Introduction / Motivation• Nano-PIV for interfacial velocimetry
• Multilayer nano-particle image velocimetry (MnPIV)
Poiseuille flows• Particle distributions
• Shear rate and slip length
Electrokinetically driven flows• Particle distributions
• Diffusion coefficients
Conclusions
IMA Workshop (11/09)
10
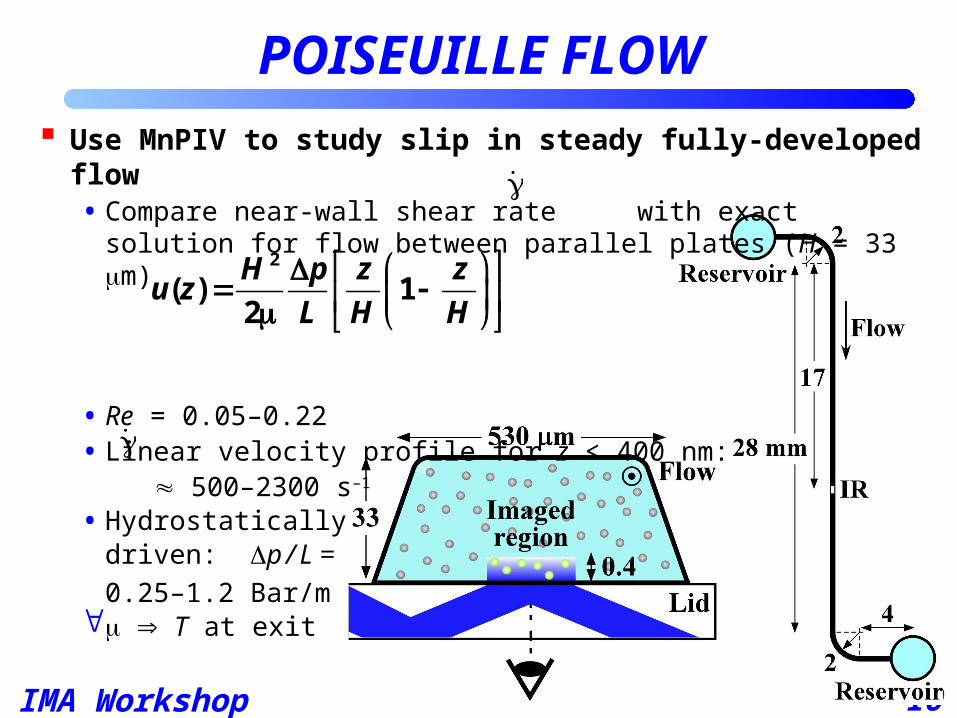
Use MnPIV to study slip in steady fully-developed flow• Compare near-wall shear rate with exact solution for flow
between parallel plates (H = 33 m)
• Re = 0.05–0.22 • Linear velocity profile for z < 400 nm:
500–2300 s–1
• Hydrostatically driven: p / L =
0.25–1.2 Bar/m T at exit
POISEUILLE FLOW
2
( ) 12
H p z zu z
L H H
IMA Workshop (11/09)
11
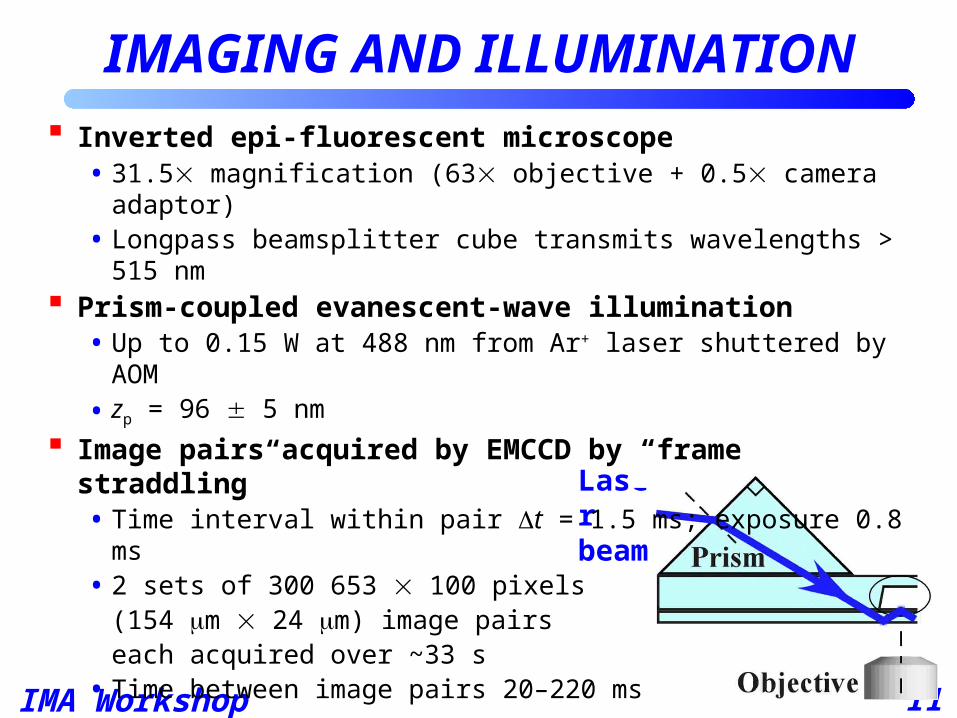
IMAGING AND ILLUMINATION
Laser beam
Inverted epi-fluorescent microscope • 31.5 magnification (63 objective + 0.5 camera adaptor) • Longpass beamsplitter cube transmits wavelengths > 515 nm
Prism-coupled evanescent-wave illumination• Up to 0.15 W at 488 nm from Ar+ laser shuttered by AOM
• zp = 96 5 nm
Image pairs acquired by EMCCD by “frame straddling”• Time interval within pair t = 1.5 ms; exposure 0.8 ms• 2 sets of 300 653 100 pixels
(154 m 24 m) image pairs each acquired over ~33 s
• Time between image pairs 20–220 ms
IMA Workshop (11/09)
12
EXPERIMENTAL DETAILS
Working fluids• Ammonium bicarbonate (NH4HCO3) and ammonium acetate
(CH3COONH4) solutions at molar salt concentrations C = 2 and 10 mM at pH7.6–7.8 and 6.2–6.6, respectively
• Tracers: radius a 50 nm fluorescent PS spheres (Invitrogen FluoSpheres) labeled with Bodipy FL; 20 ppm
• Working fluid degassed shortly before each experiment Microchannels
• 33 m 530 m fused-silica channels wet-etched on same wafer under identical conditions
• “Bare” walls naturally hydrophilic• Coated with ~2 nm thick OTS monolayer (chloroform
solution) hydrophobic surface with contact angle 100 4°
IMA Workshop (11/09)
13
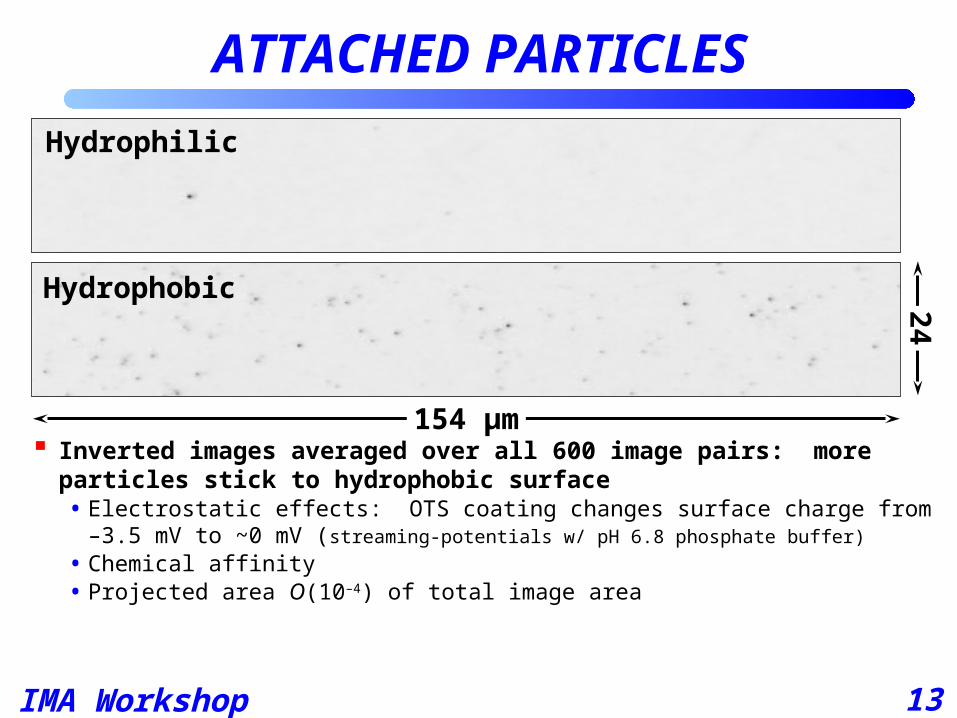
ATTACHED PARTICLES
Inverted images averaged over all 600 image pairs: more particles stick to hydrophobic surface• Electrostatic effects: OTS coating changes surface charge from –3.5 mV to ~0 mV
(streaming-potentials w/ pH 6.8 phosphate buffer)
• Chemical affinity• Projected area O(10–4) of total image area
Hydrophilic
Hydrophobic 24
154 µm
IMA Workshop (11/09)
14
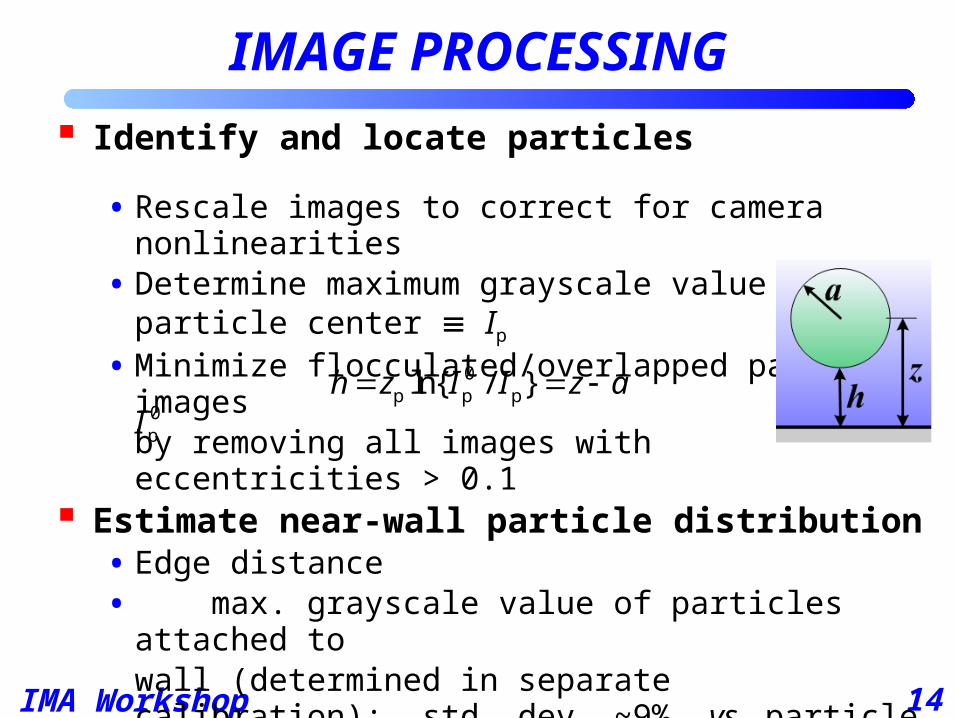
Identify and locate particles
• Rescale images to correct for camera nonlinearities
• Determine maximum grayscale value at particle center Ip• Minimize flocculated/overlapped particle images
by removing all images with eccentricities > 0.1 Estimate near-wall particle distribution
• Edge distance • max. grayscale value of particles attached to
wall (determined in separate calibration): std. dev. ~9%, vs. particle polydispersity 6%
• Uncertainty (95% conf. int.) in particle z-position 17–23 nm Displacements from particle tracking
Baek & Lee 96
• Subtract average “background” image for hydrophobic cases• Minimize underestimation due to nonuniform illumination
IMAGE PROCESSING
0p p pln{ / }h z I I z a
0pI
IMA Workshop (11/09)
15
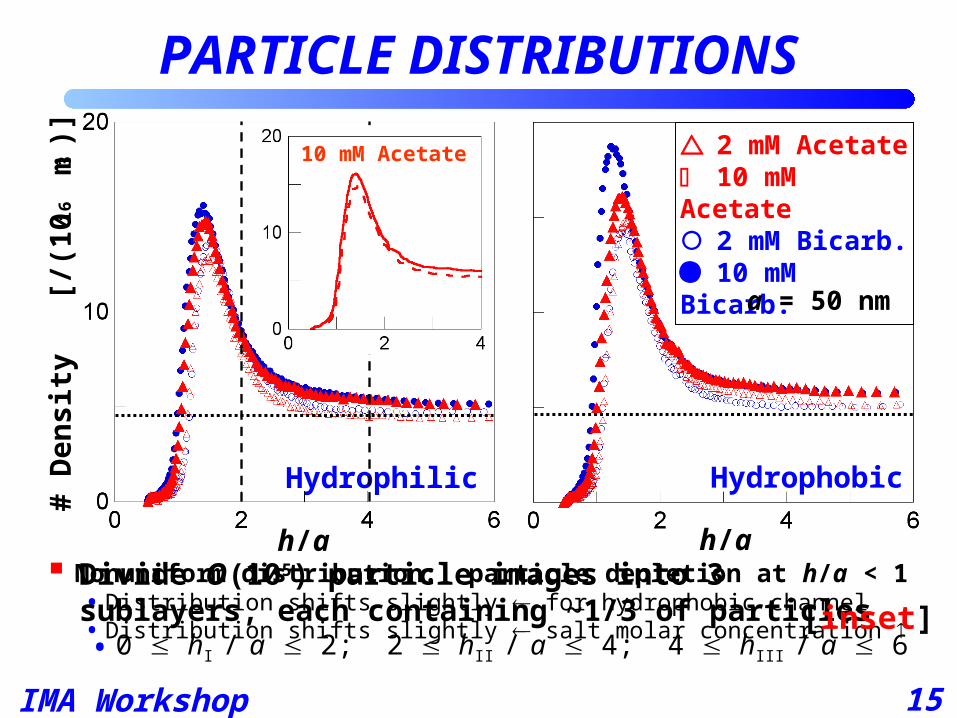
Nonuniform distribution: particle depletion at h/a < 1 • Distribution shifts slightly for hydrophobic channel • Distribution shifts slightly salt molar concentration
Divide O(105) particle images into 3 sublayers, each containing ~1/3 of particles• 0 hI / a 2; 2 hII / a 4; 4 hIII / a 6
Hydrophobic
2 mM Acetate 10 mM Acetate 2 mM Bicarb. 10 mM Bicarb.
PARTICLE DISTRIBUTIONS
h/a
a = 50 nm
# D
ensi
ty
[/(1
016
m3
)]
h/a
Hydrophilic
[inset]
10 mM Acetate
IMA Workshop (11/09)
16
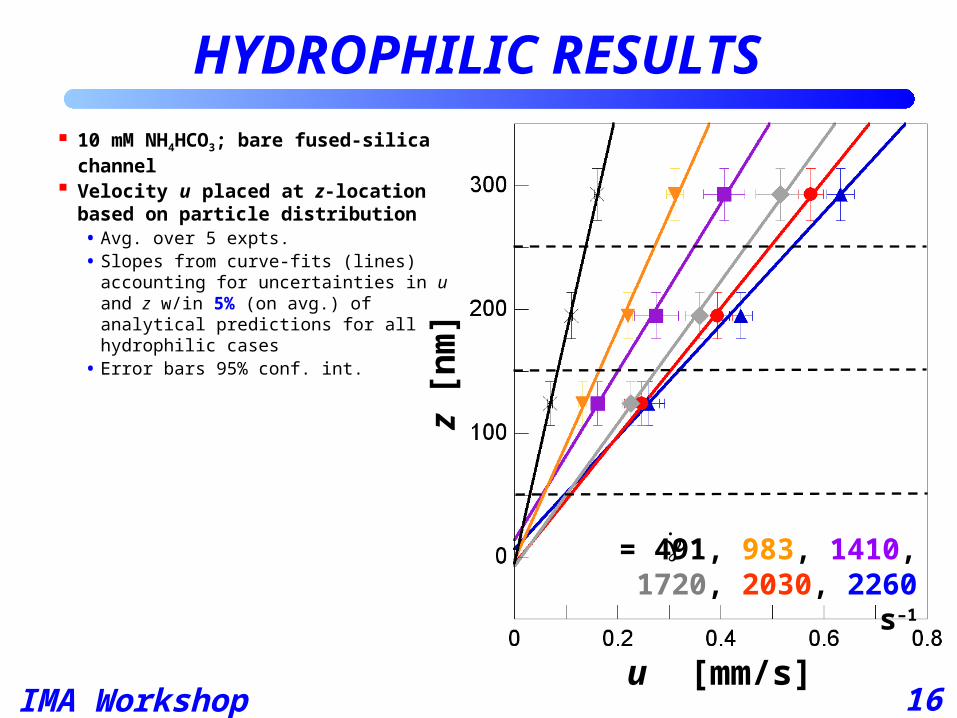
10 mM NH4HCO3; bare fused-silica channel
Velocity u placed at z-location based on particle distribution• Avg. over 5 expts.• Slopes from curve-fits (lines) accounting
for uncertainties in u and z w/in 5% (on avg.) of analytical predictions for all hydrophilic cases
• Error bars 95% conf. int.
HYDROPHILIC RESULTS
z [
nm
]
u [mm/s]
= 491, 983, 1410, 1720, 2030, 2260 s–1
IMA Workshop (11/09)
17
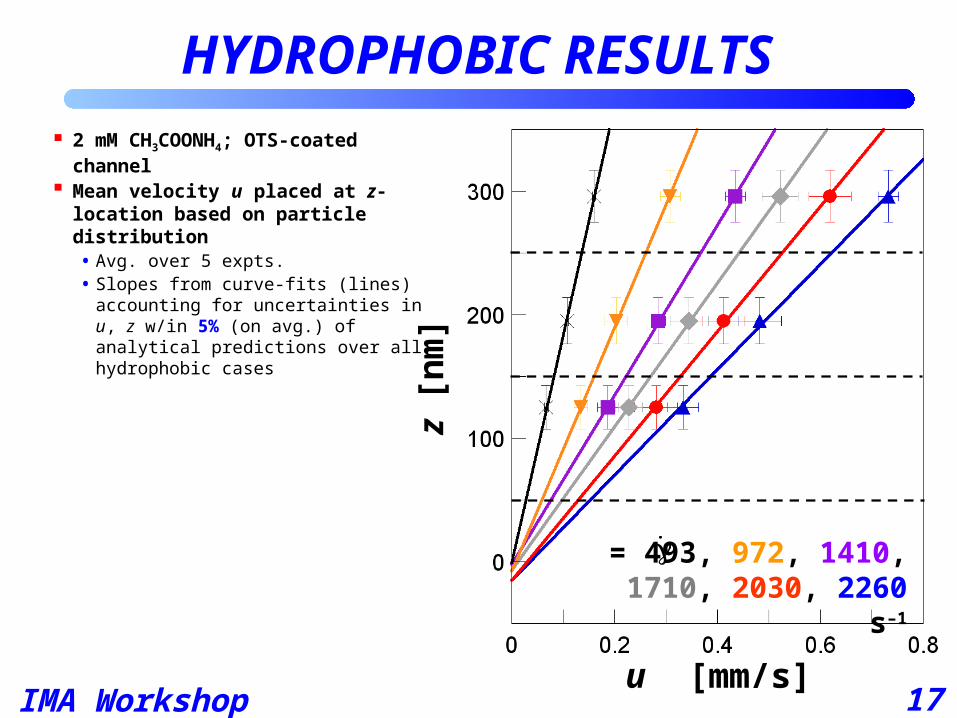
2 mM CH3COONH4; OTS-coated channel
Mean velocity u placed at z-location based on particle distribution• Avg. over 5 expts.• Slopes from curve-fits (lines)
accounting for uncertainties in u, z w/in 5% (on avg.) of analytical predictions over all hydrophobic cases
HYDROPHOBIC RESULTS
z [
nm
]
u [mm/s]
= 493, 972, 1410, 1710, 2030, 2260 s–1
IMA Workshop (11/09)
18
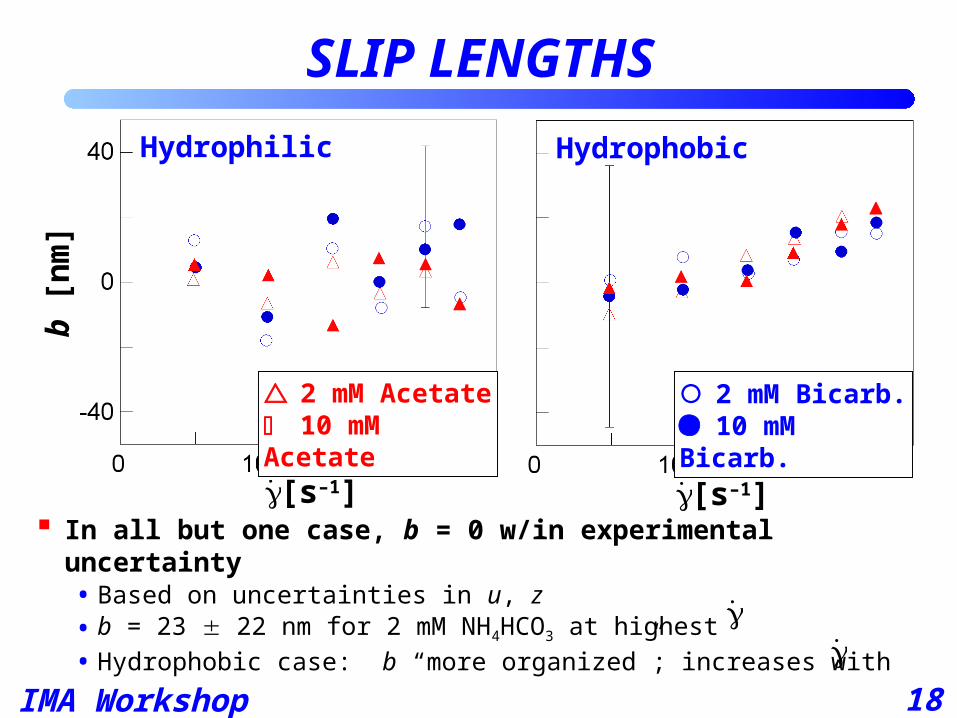
SLIP LENGTHSb
[n
m]
Hydrophilic Hydrophobic
[s–1]
2 mM Bicarb. 10 mM Bicarb.
2 mM Acetate 10 mM Acetate
[s–1] In all but one case, b = 0 w/in experimental uncertainty
• Based on uncertainties in u, z• b = 23 22 nm for 2 mM NH4HCO3 at highest
• Hydrophobic case: b “more organized”; increases with
IMA Workshop (11/09)
19
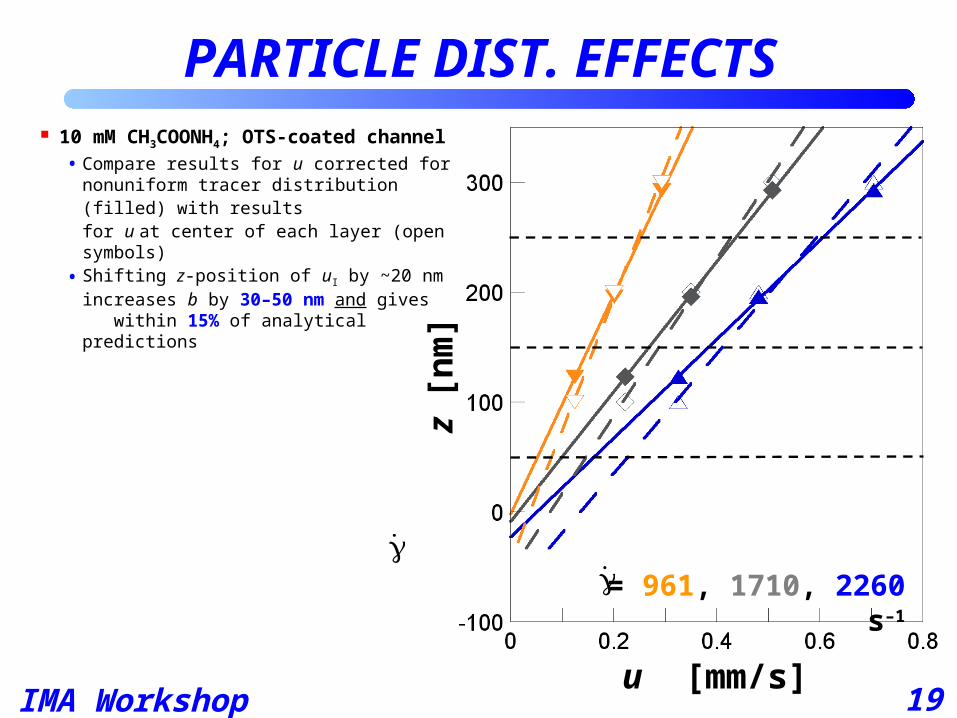
PARTICLE DIST. EFFECTS
z [
nm
]
u [mm/s]
10 mM CH3COONH4; OTS-coated channel• Compare results for u corrected for
nonuniform tracer distribution (filled) with results for u at center of each layer (open symbols)
• Shifting z-position of uI by ~20 nm increases b by 30–50 nm and gives within 15% of analytical predictions
= 961, 1710, 2260 s–1
IMA Workshop (11/09)
20
OUTLINE
Introduction / Motivation• Nano-PIV for interfacial velocimetry
• Multilayer nano-particle image velocimetry (MnPIV)
Poiseuille flows• Particle distributions
• Shear rate and slip length
Electrokinetically driven flows• Particle distributions
• Diffusion coefficients
Conclusions
IMA Workshop (11/09)
21
+ +
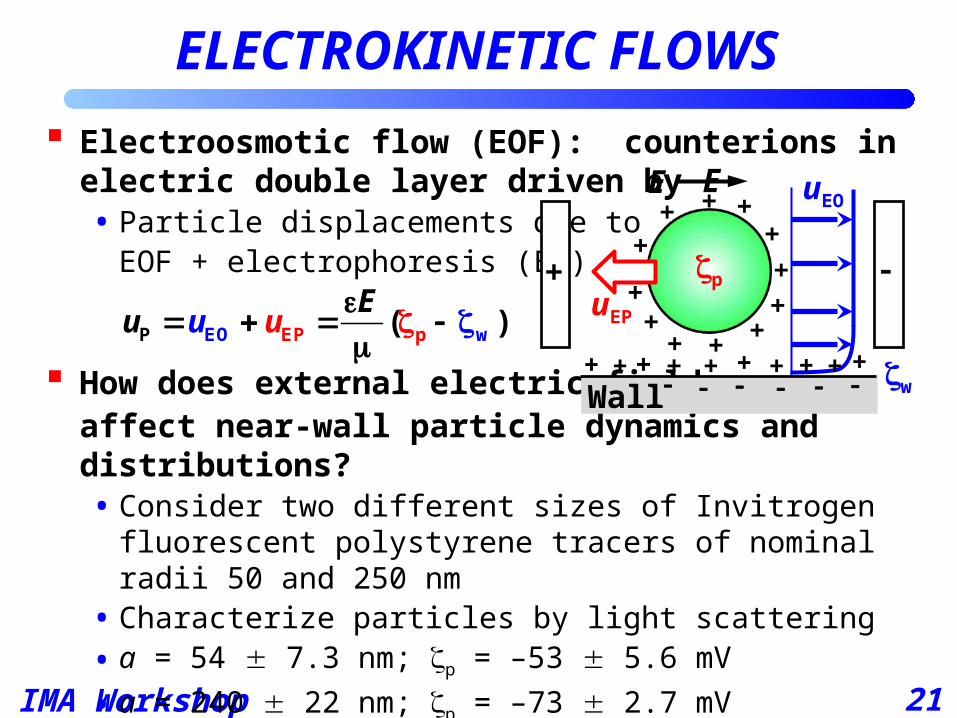
Electroosmotic flow (EOF): counterions in electric double layer driven by E• Particle displacements due to
EOF + electrophoresis (EP)
How does external electric field affect near-wall particle dynamics and distributions?• Consider two different sizes of Invitrogen fluorescent
polystyrene tracers of nominal radii 50 and 250 nm • Characterize particles by light scattering
• a = 54 7.3 nm; p = –53 5.6 mV
• a = 240 22 nm; p = –73 2.7 mV
+
++
++ ++
+ +
+
+
+
p
ELECTROKINETIC FLOWS
EP pP EO w( )uu uE
Wall
+
+
E
uEP
+ + + + +++ w
uEO
IMA Workshop (11/09)
22
Steady fully-developed flow: E = 11–67 V/cm• Fused-silica wet-etched channels (306 m 38 m)• Working fluid monovalent electrolyte solution: 1 mM
Na2B4O7 in Nanopure water (pH9.0, conductivity
165 mS/cm) thin EDL (Debye length D < 7 nm)• Tracers at same nominal number density of 1.3 1016 m–3
= 7 ppm (a = 54 nm) and 925 ppm (a = 240 nm) Optics and imaging
• Prism-coupled evanescent-wave illumination: zp 1934 nm
• Magnification 63 ; output power ~0.15 W from Ar+ laser shuttered by AOM
• Acquire 1500 image pairs over 60 s (t = 1.32.2 ms;exposure 0.5 ms) using new EMCCD camera
• 130 m 36.6 m (512 144 pixels) images
EXPERIMENTAL DETAILS
IMA Workshop (11/09)
23
IMAGE PROCESSING
Identify and locate particles
• After correcting for camera nonlinearities, locate particle centers by cross correlation (assuming Gaussian images)
• Remove overlapping particle images
• Calculate area intensity of particle image Ap
Determine near-wall particle distribution• Particle edge-wall distance:
= area intensity of particles at wall• Errors in h and z h+a are 417 nm and 1922 nm (larger
because of polydispersity), respectively Determine tracer displacements using particle tracking
0p p pln{ / }h z A A z a
0pA
IMA Workshop (11/09)
24
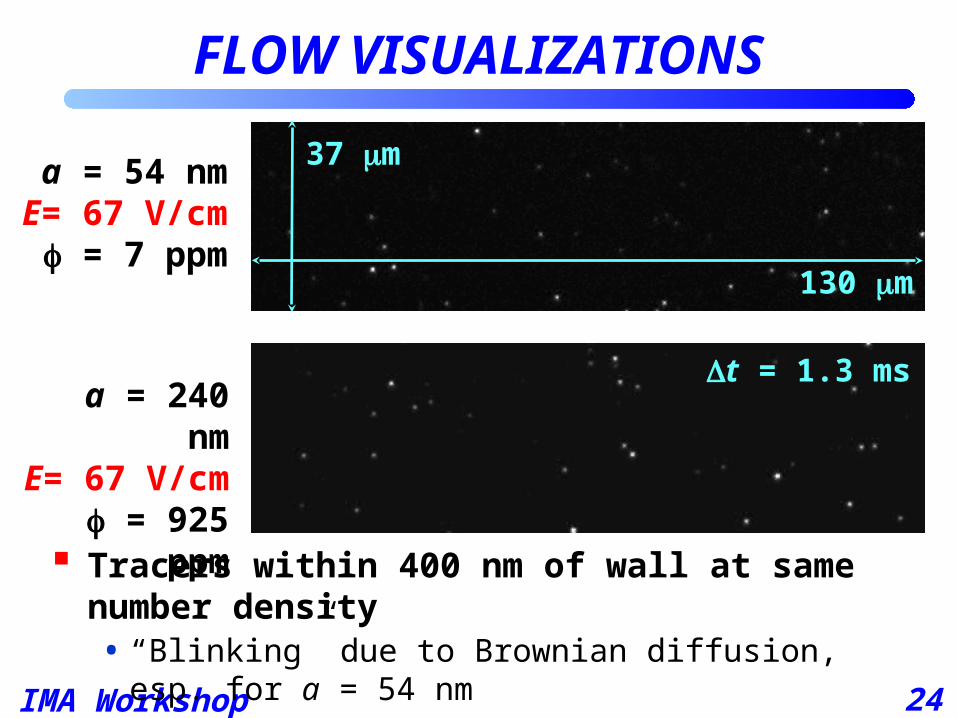
a = 240 nmE= 11 V/cm = 925 ppm
a = 54 nmE= 11 V/cm = 7 ppm
a = 54 nmE= 67 V/cm = 7 ppm
a = 240 nmE= 67 V/cm = 925 ppm
FLOW VISUALIZATIONS
t = 1.3 ms
130 m
37 m
Tracers within 400 nm of wall at same number density• “Blinking” due to Brownian diffusion, esp. for a = 54 nm• Fewer a = 240 nm particles near wall at higher E
IMA Workshop (11/09)
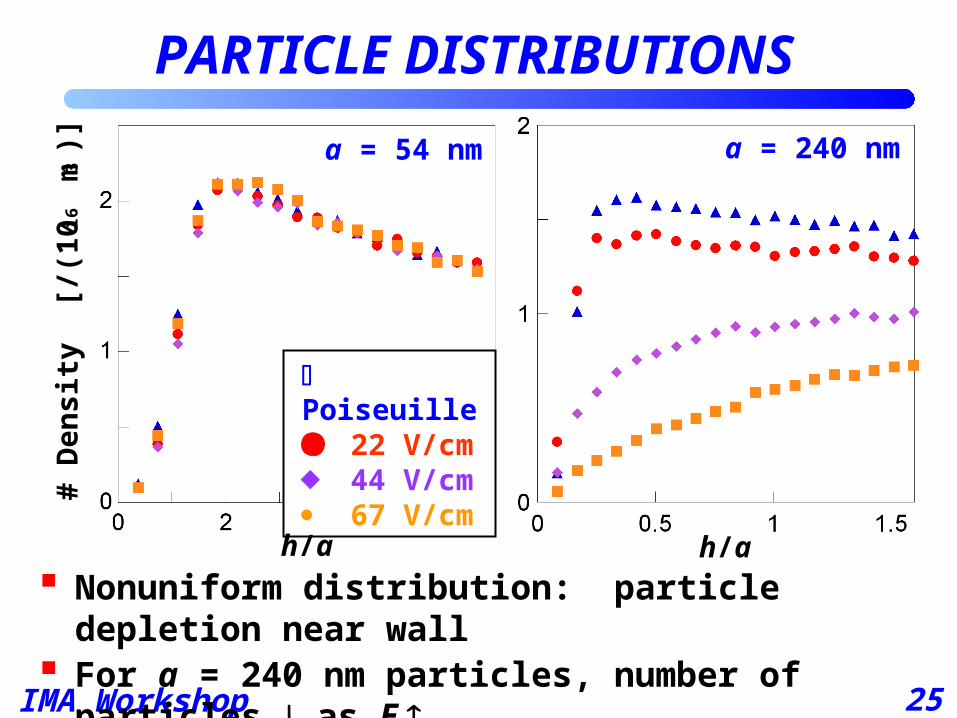
25
Nonuniform distribution: particle depletion near wall For a = 240 nm particles, number of particles as E
PARTICLE DISTRIBUTIONS
a = 54 nm a = 240 nm
Poiseuille 22 V/cm 44 V/cm 67 V/cm
h/a
# D
ensi
ty [
/(10
16 m
3)]
h/a

IMA Workshop (11/09)
26
DIFFUSION COEFFICIENTS
D /D
a = 54 nm a = 240 nm
Faxén
13 4 59 1 45 1
116 8 256 16
D
D
h/a
Tangential diffusion coefficient D from particle displacements
• Variance of Gaussian distribution
• z-position of D corrected for
nonuniform distribution
D for both a within 4% of Faxén relation
1z h
a a where
IMA Workshop (11/09)
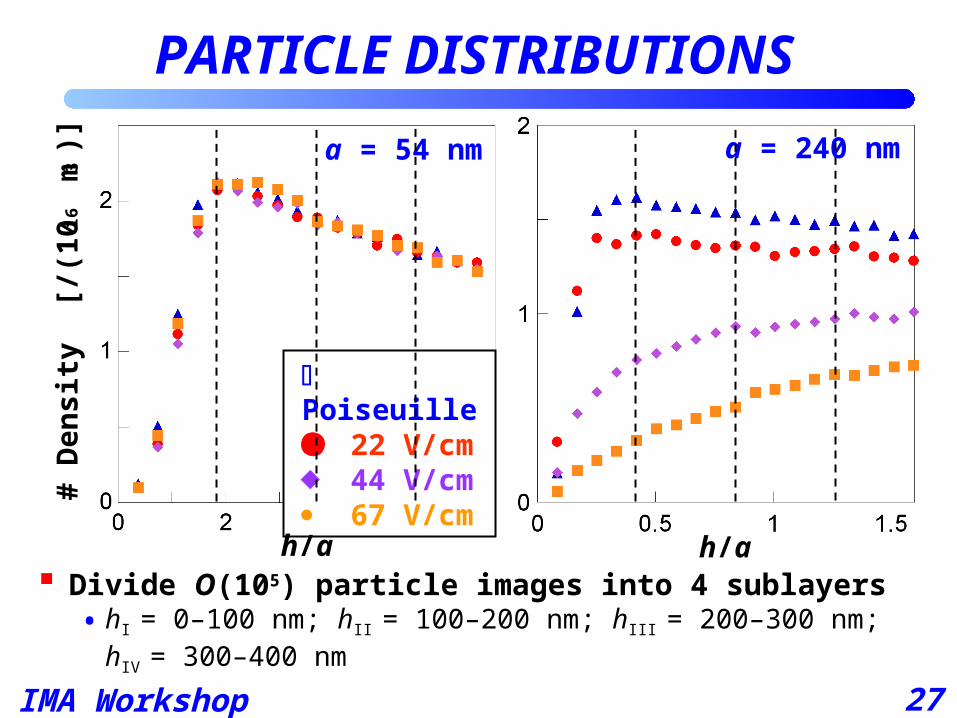
27
Divide O(105) particle images into 4 sublayers• hI = 0–100 nm; hII = 100–200 nm; hIII = 200–300 nm; hIV =
300–400 nm
PARTICLE DISTRIBUTIONS
a = 54 nm a = 240 nm
Poiseuille 22 V/cm 44 V/cm 67 V/cm
h/a
# D
ensi
ty [
/(10
16 m
3)]
h/a
IMA Workshop (11/09)
28
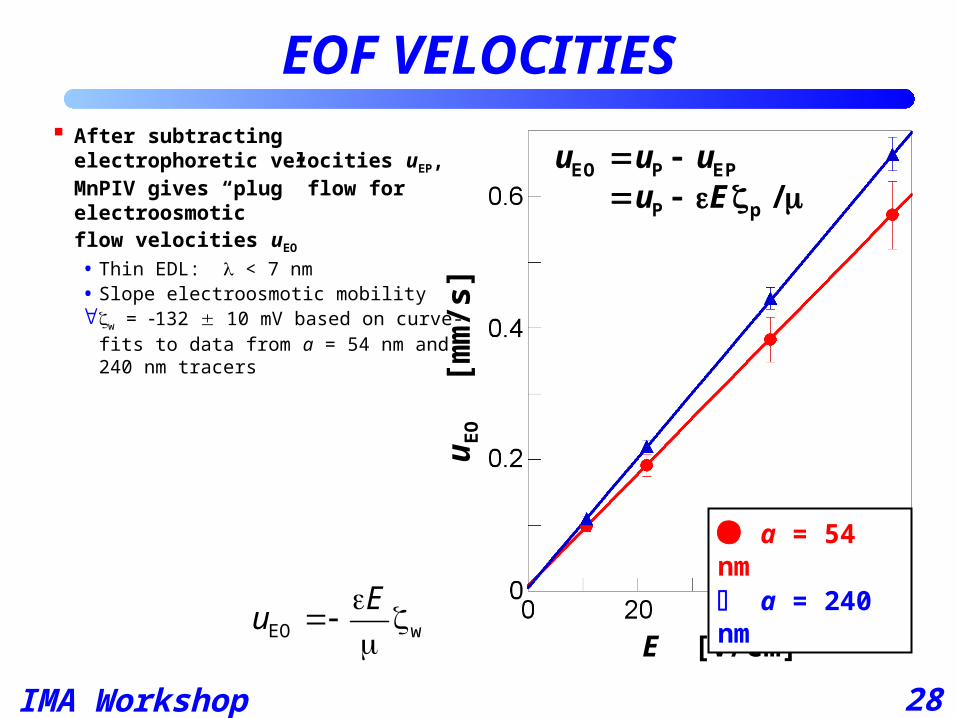
EOF VELOCITIES After subtracting electrophoretic
velocities uEP, MnPIV gives “plug” flow for electroosmotic flow velocities uEO
• Thin EDL: < 7 nm • Slope electroosmotic mobility w = 132 10 mV based on curve-fits
to data from a = 54 nm and 240 nm tracers
E [V/cm]
uE
O
[mm
/s]
EO P EP
P p /u u u
u E
a = 54 nm a = 240 nm
EO w
Eu
IMA Workshop (11/09)
29
CONCLUSIONS
Multilayer nPIV• Interfacial velocimetry technique for obtaining velocities at
different distances from, but within 400 nm of, the wall• Gives direct estimate of near-wall tracer distributions
Poiseuille flows• Shear rates within 5% of analytical predictions for 2D flow• Slip lengths for wetting and nonwetting channels zero within
measurement uncertainties • Hydrophobic channels have more particles attached to wall
and more “organized” slip length behavior Electrokinetically driven flows
• Diffusion coefficients within 4% of Faxén relation• Electroosmotic velocities in agreement with theory• a = 240 nm particles repelled from wall at higher E
IMA Workshop (11/09)
30
Colleagues• Yutaka Kazoe, Haifeng Li, Reza Sadr, Claudia Zettner: GT• A.T. Conlisk, S. Dhatta, S. V. Olesik, G. Philibert: OSU • J.M. Ramsey, J.P. Alarie, P. Mucha: UNC• M. Bevan: JHU
$ponsors• NSF• ONR• AFOSR• DARPA
ACKNOWLEDGEMENTS