nordax bank ab (publ)nrda bank ab (publ) nr rprt january-december 2018 parent company income...
TRANSCRIPT

NORDAX BANK AB (publ) INTERIM REPORT January-December 2018
Nordax Bank AB (publ)INTERIM REPORT JANUARY-DECEMBER 2018
page 1

NORDAX BANK AB (publ) INTERIM REPORT January-December 2018
About the Group, Nordax Bank AB (publ)
OVERVIEWpage 2
Nordax Bank AB (publ) (Corporate Identity Number 556647-7286), with its registered office in Stockholm at Box 23124, SE-104 35 Stockholm, Sweden, tele-phone number +46 8 508 808 00, www.nordaxgroup.com, hereinafter “Nordax”, is a wholly owned subsidi-ary of Nordax Group AB (publ) (Corporate Identity Number 556993-2485), with its registered office in Stockholm. The Nordax Group’s largest owner is NDX Intressenter AB, which is controlled by Nordic Capital and Sampo and as of 31 December controlled 100 per cent of the shares in the company. This is Nor-dax’s fifteenth financial year. The Nordax Bank Group consists of Nordax Bank AB (publ), Nordax Sverige AB, Nordax Nordic 4 AB (publ), Nordax Sverige 4 AB (publ), Nordax Nordic 2 AB.
Nordax was authorised on 27 January 2004 as a credit market company to carry on finance activities. On 5 December 2014, Nordax received approval to carry on banking activities by the Swedish Financial Supervisory Authority according to the Banking and Finance Business Act and changed its name to Nordax Bank AB (publ).
Through a centralised business model and organisa-tion based in Stockholm, Nordax conducts cross-bor-der lending in Sweden, Norway, Denmark, Finland and Germany in accordance with Directive 2013/36/EU of the European Parliament and of the Council of 26 June 2013 on access to the activity of credit institutions and the prudential supervision of credit institutions and investment firms.
Nordax’s main business consists of lending to private customers in the Nordic region and Germany. Lending consists of unsecured loans up to the equivalent of SEK 600,000, NOK 500,000, EUR 60,000 in Finland and EUR 40,000 in Germany. As of 2008, there is no new lending in Denmark. Since the second quarter of 2018, secured loans against residential property are also offered in Sweden.
Nordax started its lending business in Sweden in Feb-ruary 2004, in Norway in October 2005, in Denmark in October 2006, in Finland in August 2007 and Ger-many in April 2012.
Nordax accepts deposits on accounts from the public in Sweden, Norway, Finland and Germany. Deposits generate positive net interest income for the Group since lending is offered at a higher interest rate than deposits, at the same time that they facilitate the Group’s traditional funding mainly from financial insti-tutions.
Important events during the period
Personal loans New lending for personal loans developed strongly and amounted to SEK 5.8 billion during the year, an increase of 24% compared to 2017. Finland was the market that performed the strongest (+35% in local currency), followed by Sweden and Norway, while new lending decreased in Germany. During the year new lending increased the most in the loan broker channel,
which was a result of both improved customer pro-cesses and collaborations with more brokers. In the fourth quarter new lending amounted to SEK 1.5 bil-lion, an increase of 35% compared to the same quarter in 2017, with the strongest trend in Sweden.
Mortgage loans In early May Nordax began offering loans in the Swed-ish market. The main target group is customers with some form of non-traditional employment, i.e. the self-employed or temporary employees, including project, part-time or replacement workers. Thorough credit assessments and personal customer contacts have fa-cilitated more loan approvals for this customer group, who is often denied by the major banks despite stable finances. Interest in the offer has been high and since mid-September marketing has been increased, which led to a significant increase in the number of applica-tions in the period September to December.
Portfolio developmentTotal lending to the general public increased 12% com-pared to the beginning of the year to SEK 15.1 billion at year-end. Adjusted for FX effects and one-effects from the transition to IFRS 9, the increase was 11%. Lending increased in all markets with the strongest trend in Finland, where the corresponding increase was 24%.
Changes in Senior Management TeamIn the fourth quarter Patrick MacArthur took over as the new CFO. Patrick has been employed at Nordax since 2017 and was already a member of the Senior Management Team in his former role as Head of Busi-ness Development and Strategy.
During the quarter Andreas Frid was appointed as Head of Marketing and Communication. Andreas has been employed at Nordax since 2016 and was already a member of the Senior Management Team in his for-mer role as Head of IR and Communication.
Significant events after the end of the period
Acquisition of Svensk Hypotekspension In January 2019 Nordax finalized the acquisition of Svensk Hypotekspension AB, experts in so-called equity release mortgages. Through the Hypotekspen-sion® product, the Swedish pensioners with equity tied up in their homes are offered an opportunity to free up this capital without having to sell the home. Svensk Hypotekspension AB thereby became a wholly owned subsidiary of Nordax Bank.
Through the acquisition, Nordax strengthens its posi-tion as a challenger in the mortgage market. As with Nordax’s mortgage offer, which was launched in 2018, Svensk Hypotekspension meets an important and growing customer need, where an increasing number of creditworthy customers do not fit into the stand-ardized credit assessments of the major banks.
At year-end Svensk Hypotekspension’s total lending amounted to just over SEK 4 billion divided among nearly 6,000 customers (households).
NORDAX BANK AB (publ) INTERIM REPORT January-December 2018
Result January-December 2018
OVERVIEWpage 3
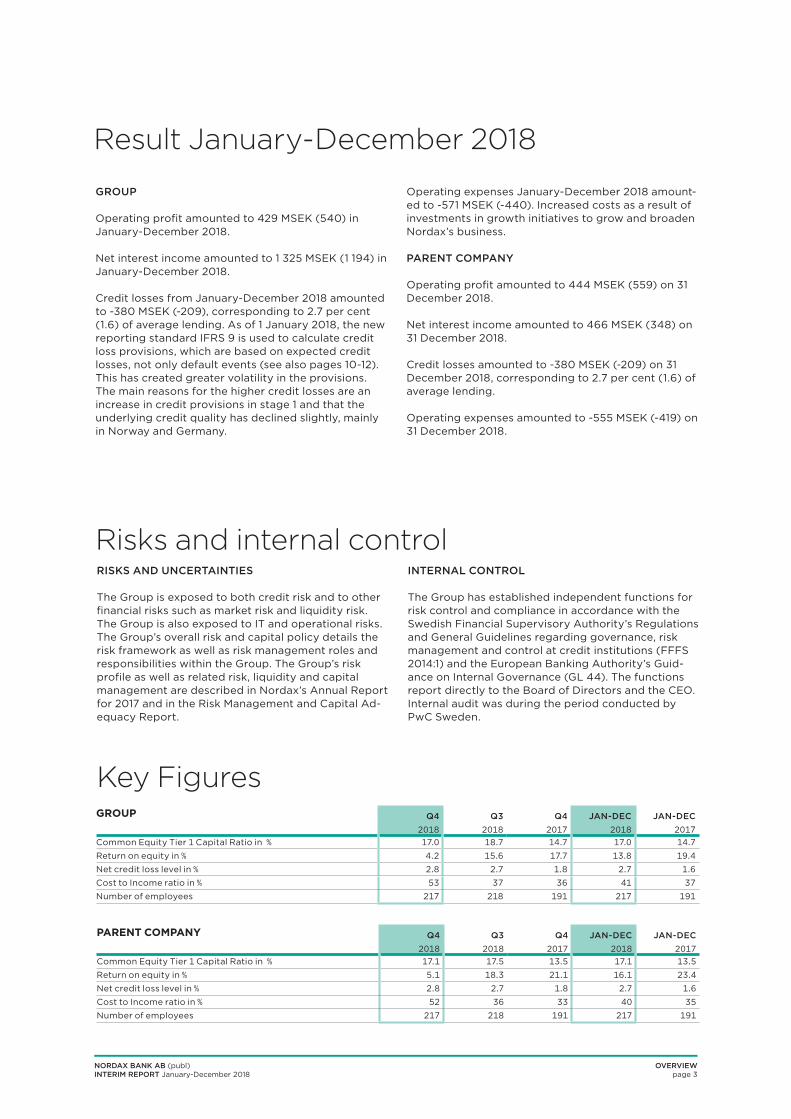
GROUP Operating profit amounted to 429 MSEK (540) in January-December 2018.
Net interest income amounted to 1 325 MSEK (1 194) in January-December 2018.
Credit losses from January-December 2018 amounted to -380 MSEK (-209), corresponding to 2.7 per cent (1.6) of average lending. As of 1 January 2018, the new reporting standard IFRS 9 is used to calculate credit loss provisions, which are based on expected credit losses, not only default events (see also pages 10-12). This has created greater volatility in the provisions. The main reasons for the higher credit losses are an increase in credit provisions in stage 1 and that the underlying credit quality has declined slightly, mainly in Norway and Germany.
Operating expenses January-December 2018 amount-ed to -571 MSEK (-440). Increased costs as a result of investments in growth initiatives to grow and broaden Nordax’s business.
PARENT COMPANY
Operating profit amounted to 444 MSEK (559) on 31 December 2018.
Net interest income amounted to 466 MSEK (348) on 31 December 2018.
Credit losses amounted to -380 MSEK (-209) on 31 December 2018, corresponding to 2.7 per cent (1.6) of average lending.
Operating expenses amounted to -555 MSEK (-419) on 31 December 2018.
Risks and internal control
Key Figures
RISKS AND UNCERTAINTIES
The Group is exposed to both credit risk and to other financial risks such as market risk and liquidity risk. The Group is also exposed to IT and operational risks. The Group’s overall risk and capital policy details the risk framework as well as risk management roles and responsibilities within the Group. The Group’s risk profile as well as related risk, liquidity and capital management are described in Nordax’s Annual Report for 2017 and in the Risk Management and Capital Ad-equacy Report.
INTERNAL CONTROL
The Group has established independent functions for risk control and compliance in accordance with the Swedish Financial Supervisory Authority’s Regulations and General Guidelines regarding governance, risk management and control at credit institutions (FFFS 2014:1) and the European Banking Authority’s Guid-ance on Internal Governance (GL 44). The functions report directly to the Board of Directors and the CEO. Internal audit was during the period conducted by PwC Sweden.
GROUP Q4 Q3 Q4 JAN-DEC JAN-DEC2018 2018 2017 2018 2017
Common Equity Tier 1 Capital Ratio in % 17.0 18.7 14.7 17.0 14.7
Return on equity in % 4.2 15.6 17.7 13.8 19.4
Net credit loss level in % 2.8 2.7 1.8 2.7 1.6
Cost to Income ratio in % 53 37 36 41 37
Number of employees 217 218 191 217 191
PARENT COMPANY Q4 Q3 Q4 JAN-DEC JAN-DEC2018 2018 2017 2018 2017
Common Equity Tier 1 Capital Ratio in % 17.1 17.5 13.5 17.1 13.5
Return on equity in % 5.1 18.3 21.1 16.1 23.4
Net credit loss level in % 2.8 2.7 1.8 2.7 1.6
Cost to Income ratio in % 52 36 33 40 35
Number of employees 217 218 191 217 191

NORDAX BANK AB (publ) INTERIM REPORT January-December 2018
Consolidated income statement
CONSOLIDATED INCOME STATEMENTpage 4
Total profit corresponds to profit for the period
Consolidated statement of comprehensive income
GROUP Q4 Q3 Q4 JAN-DEC JAN-DECAll amounts in MSEK Note 2018 2018 2017 2018 2017Operating incomeInterest income 7 414 407 370 1,595 1,455
Interest expense 7 -71 -72 -67 -270 -261
Total net interest income 343 335 303 1,325 1,194
Commission income 7 4 3 4 18 19
Net profit from financial transactions 7 -11 15 -10 37 -24
Total operating income 336 353 297 1,380 1,189
Operating expensesGeneral administrative expenses 7 -133 -91 -74 -411 -289
Depreciation, amortisation and impairment of property, plant and equipment and intangible assets 7 -5 -6 -6 -23 -24
Other operating expenses 7 -40 -33 -26 -137 -127
Total operating expenses -178 -130 -106 -571 -440
Profit before credit losses 158 223 191 809 749
Net credit losses 2, 7 -104 -102 -62 -380 -209
Operating profit 54 121 129 429 540
Tax on profit for the period -28 -26 -29 -103 -121
NET PROFIT FOR THE PERIOD/COMPREHENSIVE INCOME 26 95 100 326 419
Attributable to:The Parent Company's shareholders 26 95 100 326 419

NORDAX BANK AB (publ) INTERIM REPORT January-December 2018
Parent Company income statement
1 Operating income for the Parent Company refers to income from securitised loans.
PARENT COMPANY page 5
PARENT COMPANY Q4 Q3 Q4 JAN-DEC JAN-DECAll amounts in MSEK Note 2018 2018 2017 2018 2017Operating incomeInterest income 421 417 371 1,631 1,461
Interest expense -279 -299 -284 -1,165 -1,113
Total net interest income 142 118 87 466 348
Commision income 1 1 1 8 5
Net profit from financial transactions -14 -5 -10 36 -23
Other operating income 1 206 239 218 869 857
Total operating income 335 353 296 1,379 1,187
Operating expensesGeneral administrative expenses -132 -90 -72 -406 -280
Depreciation, amortisation and impairment of property, plant and equipment and intangible assets -3 -3 -3 -12 -12
Other operating expenses -40 -33 -24 -137 -127
Total operating expenses -175 -126 -99 -555 -419
Profit before credit losses 160 227 197 824 768
Net credit losses 2 -104 -102 -62 -380 -209
Operating profit 56 125 135 444 559
Tax on profit for the period -28 -27 -32 -106 -127
NET PROFIT FOR THE PERIOD/COMPREHENSIVE INCOME 28 98 103 338 432
Parent company statement of comprehen-sive incomeTotal profit corresponds to profit for the period
NORDAX BANK AB (publ) INTERIM REPORT January-December 2018
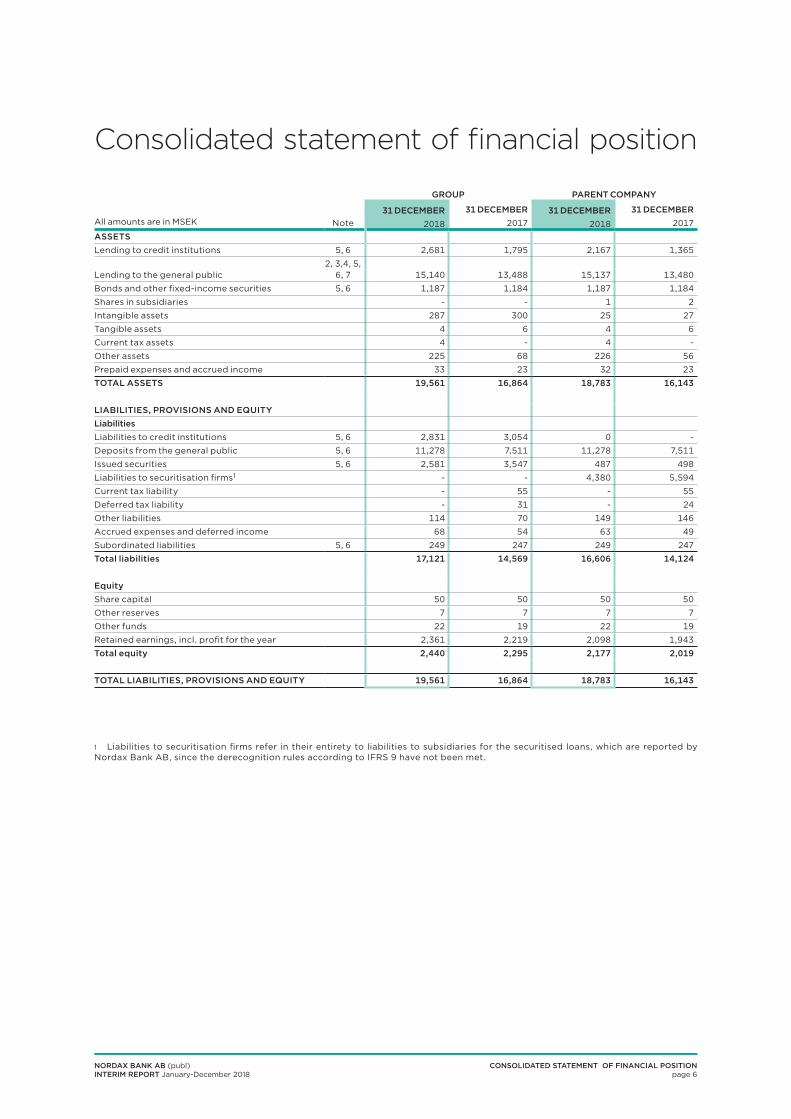
GROUP PARENT COMPANY
31 DECEMBER 31 DECEMBER 31 DECEMBER 31 DECEMBERAll amounts are in MSEK Note 2018 2017 2018 2017
ASSETSLending to credit institutions 5, 6 2,681 1,795 2,167 1,365
Lending to the general public2, 3,4, 5,
6, 7 15,140 13,488 15,137 13,480
Bonds and other fixed-income securities 5, 6 1,187 1,184 1,187 1,184
Shares in subsidiaries - - 1 2
Intangible assets 287 300 25 27
Tangible assets 4 6 4 6
Current tax assets 4 - 4 -
Other assets 225 68 226 56
Prepaid expenses and accrued income 33 23 32 23
TOTAL ASSETS 19,561 16,864 18,783 16,143
LIABILITIES, PROVISIONS AND EQUITYLiabilitiesLiabilities to credit institutions 5, 6 2,831 3,054 0 -
Deposits from the general public 5, 6 11,278 7,511 11,278 7,511
Issued securities 5, 6 2,581 3,547 487 498
Liabilities to securitisation firms1 - - 4,380 5,594
Current tax liability - 55 - 55
Deferred tax liability - 31 - 24
Other liabilities 114 70 149 146
Accrued expenses and deferred income 68 54 63 49
Subordinated liabilities 5, 6 249 247 249 247
Total liabilities 17,121 14,569 16,606 14,124
EquityShare capital 50 50 50 50
Other reserves 7 7 7 7
Other funds 22 19 22 19
Retained earnings, incl. profit for the year 2,361 2,219 2,098 1,943
Total equity 2,440 2,295 2,177 2,019
TOTAL LIABILITIES, PROVISIONS AND EQUITY 19,561 16,864 18,783 16,143
Consolidated statement of financial position
CONSOLIDATED STATEMENT OF FINANCIAL POSITIONpage 6
1 Liabilities to securitisation firms refer in their entirety to liabilities to subsidiaries for the securitised loans, which are reported by Nordax Bank AB, since the derecognition rules according to IFRS 9 have not been met.

NORDAX BANK AB (publ) INTERIM REPORT January-December 2018
GROUP JAN-DEC JAN-DECAll amounts are in MSEK 2018 2017
Operating activitiesOperating profit 1 429 540
Adjustment for non-cash items
Exchange rate effects 2 -46 24
Depreciation, amortisation and impairment of property, plant & equipment 23 24
Amortisation of financing costs 31 -
Unrealised changes in value of bonds and other fixed income securities 10 6
Unrealised credit losses incl. IFRS 9 adjustment 814 -
Income tax paid -141 -96
Group contribution - -43
Change in operating assets and liabilitiesDecrease/Increase in lending to the general public -1,788 -834
Decrease/Increase in other assets -168 -56
Decrease/Increase in deposits from the general public 3,123 370
Decrease/Increase in other liabilities 6 -26
Cash flow from operating activities 2,294 -91
Investing activitiesPurchase of equipment -8 -16
Investment in bonds and other interest bearing securities -3,342 -3,791
Sale/disposal of bonds and other fixed income securities 3,329 3,559
Cash flow from investing activities -21 -248
Financing activities
Increase in liability to credit institutions 232 -133
Issued bonds -569 2,107
Repayment of issued bonds -1,049 -1,369
Paid dividend - -121
Cash flow from financing activities -1,386 484
Cash flow for the period 887 -145
Cash and cash equivalents at beginning of year 1,795 1,650
Cash and cash equivalents at end of year 2,681 1,795
Statement of cash flows
STATEMENT OF CASH FLOWSpage 7
1 Whereof received interest MSEK 1,557 (1,398) and paid interest MSEK 207 (135)2 Unrealized changes in value were recognised in earlier periods as exchange rate effects and have now been reclassified as changes in operating assets and liabilities.
Cash and cash equivalents are defined as lending to credit institutions. Pledged cash and cash equivalents according to Note 8 are available to Nordax in connection with monthly settlement under financing arrangements and are thus defined as cash and cash equivalents because they are pledged for not more than 30 days and therefore are current.

NORDAX BANK AB (publ) INTERIM REPORT January-December 2018
Statement of changes in equity
STATEMENT OF CHANGES IN EQUITY GROUPpage 8
GROUP
All amounts are in MSEK Share capitalOther
Reserves Other FundsRetained earnings TOTAL
OPENING BALANCE 1 JANUARY 2017 50 7 5 1,969 2,031
Comprehensive income
Net profit/loss for the year 419 419
Total comprehensive income 419 419
Other reserves
Capitalization 16 -16 -
Depriciation -2 2 -
Total other reserves 14 -14 -
Transactions with shareholders
Dividends paid -121 -121
Capital contributions -43 -43
Tax effect on capital contribution 9 9
Total transactions with shareholders -155 -155
CLOSING BALANCE 31 DECEMBER 2017 50 7 19 2,219 2,295
OPENING BALANCE 1 JANUARY 2018 50 7 19 2,219 2,295
Comprehensive income
Net profit/loss for the year 326 326
Total comprehensive income 326 326
Other reserves
Capitalization 8 -8 -
Depreciation -5 5 -
Total other reserves 3 -3 -
Effect in equity attributable to transition to IFRS 9
Initial effect in Equity attributable to transition to IFRS 9 -177 -177
Tax effect in Equity attributable to transition to IFRS 9 39 39
Total effect in equity attributable to the transition to IFRS 9 -138 -138
Transactions with shareholders
Capital contributions -55 -55
Tax effect on capital contribution 12 12
Total transactions with shareholders -43 -43
CLOSING BALANCE 31 DECEMBER 2018 50 7 22 2,361 2,440

NORDAX BANK AB (publ) INTERIM REPORT January-December 2018
Statement of changes in equityPARENT COMPANY Restricted equity
Non-restricted equity
All amounts are in MSEK Share capitalOther
Reserves Other Funds
Retained
Earnings TOTAL
OPENING BALANCE 1 JANUARY 2017 50 7 5 1,610 1,672
Comprehensive income
Net profit/loss for the eyar 432 432
Net profit/loss attributable to previous periods 70 70
Total comprehensive income 502 502
Other reserves
Capitalization 16 -16 -
Depriciation -2 2 -
Total other reserves 14 -14 -
Transactions with shareholders
Dividends paid -121 -121
Capital contributions -43 -43
Tax effect on capital contribution 9 9
Total transactions with shareholders -155 -155
CLOSING BALANCE 31 DECEMBER 2017 50 7 19 1,943 2,019
OPENING BALANCE 1 JANUARY 2018 50 7 19 1,943 2,019
Comprehensive income
Net profit/loss for the eyar 338 338
Total comprehensive income 338 338
Other reserves
Capitalization 8 -8 -
Depreciation -5 5 -
Total other reserves 3 -3 -
Effect in equity attributable to transition to IFRS 9
Initial effect in Equity attributable to transition to IFRS 9 -177 -177
Tax effect in Equity attributable to transition to IFRS 9 39 39
Total effect in equity attributable to the transition to IFRS 9 -138 -138
Transactions with shareholdersCapital contributions -55 -55Tax effect on capital contribution 12 12Total transactions with shareholders -43 -43
CLOSING BALANCE 31 DECEMBER 2018 50 7 22 2,098 2,177
STATEMENT OF CHANGES IN EQUITY PARENT COMPANYpage 9
NORDAX BANK AB (publ) INTERIM REPORT January-December 2018
NOTESpage 10
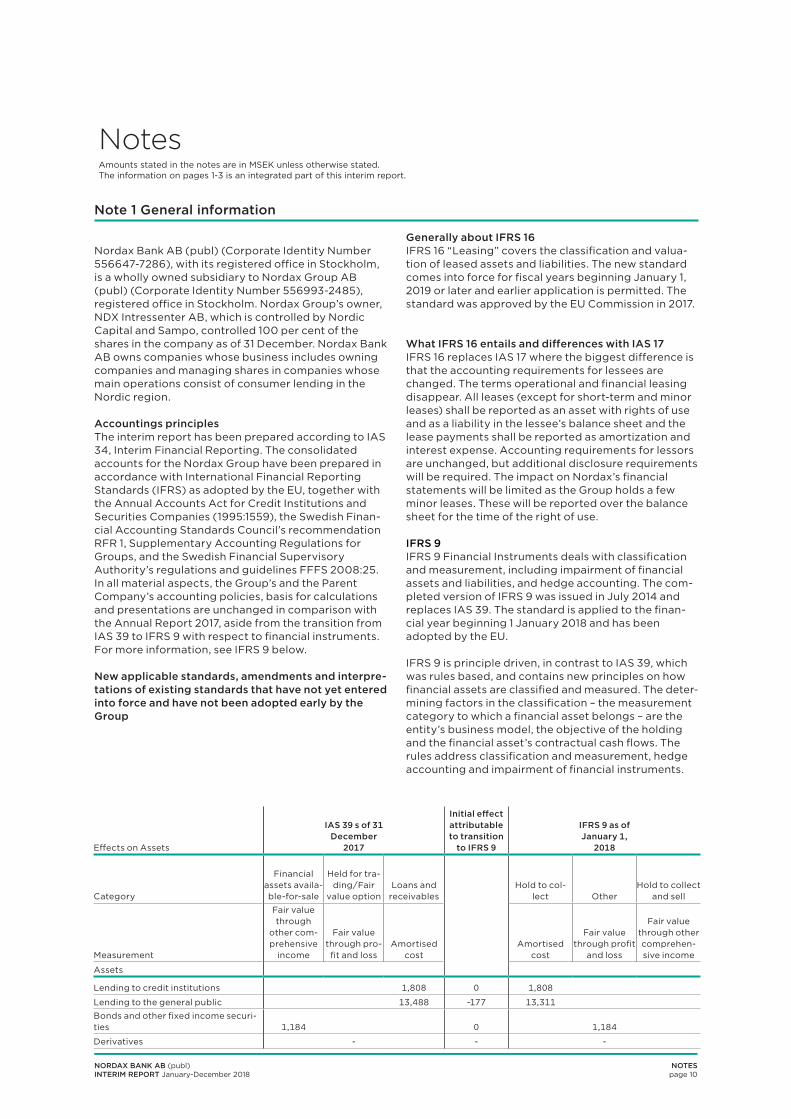
Note 1 General information
Nordax Bank AB (publ) (Corporate Identity Number 556647-7286), with its registered office in Stockholm, is a wholly owned subsidiary to Nordax Group AB (publ) (Corporate Identity Number 556993-2485), registered office in Stockholm. Nordax Group’s owner, NDX Intressenter AB, which is controlled by Nordic Capital and Sampo, controlled 100 per cent of the shares in the company as of 31 December. Nordax Bank AB owns companies whose business includes owning companies and managing shares in companies whose main operations consist of consumer lending in the Nordic region.
Accountings principlesThe interim report has been prepared according to IAS 34, Interim Financial Reporting. The consolidated accounts for the Nordax Group have been prepared in accordance with International Financial Reporting Standards (IFRS) as adopted by the EU, together with the Annual Accounts Act for Credit Institutions and Securities Companies (1995:1559), the Swedish Finan-cial Accounting Standards Council’s recommendation RFR 1, Supplementary Accounting Regulations for Groups, and the Swedish Financial Supervisory Authority’s regulations and guidelines FFFS 2008:25. In all material aspects, the Group’s and the Parent Company’s accounting policies, basis for calculations and presentations are unchanged in comparison with the Annual Report 2017, aside from the transition from IAS 39 to IFRS 9 with respect to financial instruments. For more information, see IFRS 9 below.
New applicable standards, amendments and interpre-tations of existing standards that have not yet entered into force and have not been adopted early by the Group
Generally about IFRS 16IFRS 16 “Leasing” covers the classification and valua-tion of leased assets and liabilities. The new standard comes into force for fiscal years beginning January 1, 2019 or later and earlier application is permitted. The standard was approved by the EU Commission in 2017.
What IFRS 16 entails and differences with IAS 17IFRS 16 replaces IAS 17 where the biggest difference is that the accounting requirements for lessees are changed. The terms operational and financial leasing disappear. All leases (except for short-term and minor leases) shall be reported as an asset with rights of use and as a liability in the lessee’s balance sheet and the lease payments shall be reported as amortization and interest expense. Accounting requirements for lessors are unchanged, but additional disclosure requirements will be required. The impact on Nordax’s financial statements will be limited as the Group holds a few minor leases. These will be reported over the balance sheet for the time of the right of use.
IFRS 9IFRS 9 Financial Instruments deals with classification and measurement, including impairment of financial assets and liabilities, and hedge accounting. The com-pleted version of IFRS 9 was issued in July 2014 and replaces IAS 39. The standard is applied to the finan-cial year beginning 1 January 2018 and has been adopted by the EU.
IFRS 9 is principle driven, in contrast to IAS 39, which was rules based, and contains new principles on how financial assets are classified and measured. The deter-mining factors in the classification – the measurement category to which a financial asset belongs – are the entity’s business model, the objective of the holding and the financial asset’s contractual cash flows. The rules address classification and measurement, hedge accounting and impairment of financial instruments.
NotesAmounts stated in the notes are in MSEK unless otherwise stated.The information on pages 1-3 is an integrated part of this interim report.
Effects on Assets
IAS 39 s of 31 December
2017
Initial effect attributable to transition
to IFRS 9
IFRS 9 as of January 1,
2018
Category
Financial assets availa-ble-for-sale
Held for tra-ding/Fair
value optionLoans and
receivablesHold to col-
lect OtherHold to collect
and sell
Measurement
Fair value through
other com-prehensive
income
Fair value through pro-fit and loss
Amortised cost
Amortised cost
Fair value through profit
and loss
Fair value through other comprehen-sive income
Assets
Lending to credit institutions 1,808 0 1,808
Lending to the general public 13,488 -177 13,311
Bonds and other fixed income securi-ties 1,184 0 1,184
Derivatives - - -
NORDAX BANK AB (publ) INTERIM REPORT January-December 2018
Classification and measurementIFRS 9 retains a mixed-measurement model but sim-plifies this model in certain respects. There are three measurement categories for financial assets: amor-tised cost, fair value through other comprehensive income and fair value through profit or loss. How an instrument is classified depends on the company’s business model and the instrument’s characteristics. There are three business models for debt instruments that are financial assets which determine the measure-ment category that applies. To recognise a financial asset at amortised cost requires not only that it is con-sistent with business model, but also that the asset’s contractual terms at any given time solely give rise to cash flows that are payments of principal and interest. Even if the financial asset meets the definition of busi ness model and the cash flows are solely payments of principal and interest, the company can, as with IAS 39, choose to apply recognition at fair value through profit and loss. Debt instruments that are financial assets and meet the definition of Solely Payment of Principal and Interest (SPPI) but whose business model does not lead to recognition at amortised cost are recognised at fair value through other comprehen-sive income or profit or loss depending on the business model. Investments in equity instruments are recog-nised at fair value through profit or loss, but there is also an option to initially measure the instrument at fair value through other comprehensive income.
Independent derivatives are recognised at fair value through profit or loss. The classification and measure-ment are not changed for financial liabilities except in cases where a liability is recognised at fair value through profit or loss based on the fair value alterna-tive. Changes in value attributable to changes in own credit risk are recognised in other comprehensive income.
Hedge accountingIFRS 9 changes the requirements to apply hedge accounting by replacing the 80–125 criteria with the requirement that there be an economic relationship between the hedging instrument and hedged item and that the hedge ratio be the same as that used in risk management. The hedging documentation also changes compared with IAS 39.
ImpairmentIFRS 9 introduces a new model to calculate credit loss provisions based on expected credit losses. Conse-quently, recognition of credit losses is based on expected rather than actual default events. Financial assets are divided into three stages based on the risk of default. Stage 1 comprises assets that have not seen a significant increase in credit risk, stage 2 comprises assets where there has been a significant increase in credit risk and stage 3 comprises assets in default. In stage 1 the provisions correspond to expected credit losses in the coming 12 months. In stages 2 and 3 the provisions correspond to expected credit losses through remaining maturity. An important aspect that affects the size of the provisions according to IFRS 9 is the decisive factor for transferring an asset from stage 1 to stage 2.
Nordax’s financial assets – classification and measurementThe majority of Nordax’s assets consists of lending to the public. Nordax has defined its business model for these assets as being that the assets are held to collect contractual cash flows (Hold to Collect) and that the contract terms for the financial assets give rise to cash flows that are solely payments of principal and interest on the outstanding principal (according to the so-called SPPI test). This means that Nordax will measure its assets on the asset side at amortised cost. Since Nordax had already measured its lending in this way, in accordance with IAS 39, the transition to IFRS 9 does not change the recognition of these assets.
Lending to credit institutions consists of Nordax’s holdings in the liquidity portfolio and are reported at amortised cost and therefore are not affected by the credit impairment model in IFRS 9. Bonds, other fixed income securities and derivatives are measured at fair value through profit and loss and are not affected by the transition to IFRS 9 as of 1 January 2018.
The table on the following page describes the effect on Nordax’s assets in connection with the transition to IFRS 9 per 1 January 2018.
Hedge accountingThe Group currently does not apply hedge accounting and, as a result, is not affected by the change in rules.
ImpairmentIFRS 9 also introduces a new model for calculating credit loss provisions based on expected credit losses and not solely on default events that have already occurred. The impairment rules in IFRS 9 are based on a three-stage model where recognition reflects changes in the credit risk.
Nordax’s model for impairment according to IFRS 9Nordax’s model for impairment according to IFRS 9 consists of two parts: a quantitative cash flow model that calculates expected credit loss and a qualitative model that adjusts the result from the quantitative model based on a projected macro scenario.
In the qualitative model, the assumption is that there are two forward-looking macro scenarios for the impairment model: a “normal” scenario based on mac-roeconomic conditions which indicate that the coun-tries relevant to Nordax are not in economic crisis and a “crisis scenario” that shows clear signs of an eco-nomic downturn for each country. The expected credit risk in the quantitative model is calculated based on the normal scenario and then adjusted monthly as needed for the estimated risk and the effect of the cri-sis.
In the quantitative model, a credit loss can arise from both write off (written off amount less expected recov-ery) and from the sale of overdue receivables (written off amount less sales proceeds).
NOTESpage 11

NORDAX BANK AB (publ) INTERIM REPORT January-December 2018
The quantitative model is also a three-stage model that distinguishes between three types of receivables: receivables with normal risk (stage 1), receivables whose credit risk is elevated (stage 2) and receivables in default (stage 3). Nordax’s definition of a default event is that the receivable is more than 90 days past due, forbearance and estates.
To determine whether a receivable has experienced a significant increase in credit risk, a method is used in which the receivable’s twelve-month probability of default (PD) is compared to a certain threshold that is a function of the original risk class, according to Nor-dax risk level, and the time since the loan was granted. (The receivable’s probability of default in 12 months is used as an approximation for the probability of default during the whole life of the receivable.) If the observed twelve-month PD for the receivable is below the threshold, the receivable is considered to have a nor-mal risk (belongs to stage 1) and the expected credit loss is measured on a twelve-month horizon. This is done by calculating expected write off during the twelve-month period and subsequently the expected recovery/sales proceeds. The expected recovery is calculated based on cumulative recovery curves stretching over 20 years (15 years in Finland due to legal constraints on the collection of the receivable), while the sales proceeds are based on an agreed price. The expected write-off and expected recovery are both discounted back to the time of the provision by applying the receivable’s current effective interest rate, with the provision consisting of the difference between them.
If, on the other hand, the receivable’s PD (significant risk increase) within the next twelve months exceeds the above-mentioned limit, the receivable is consid-ered to have an elevated risk (belongs to stage 2) and the expected credit loss is calculated for the receiva-ble’s expected life (provisions for all receivables that are between 30-89 days past due are by definition based on expected life [so-called backstop]). Expected life is determined by adjusting the receiva-ble’s remaining maturity downward by an expected utilisation factor. The receivable’s lifetime PD is subse-quently based on the receivable’s current risk class, its expected life and a cumulative lifetime PD curve. Based on this expected life and lifetime PD curve, the receivable’s expected credit loss can be estimated. This is done by calculating the expected write-off over the receivable’s expected life and subsequently its
expected recovery/sales proceeds. As for receivables with normal risk (stage 1), expected recovery is calcu-lated based on cumulative recovery curves stretching over 20 years (15 years in Finland due to time con-straints on the collection of the receivable), while the sales proceeds are based on an agreed price. Expected write-off and expected recovery are both discounted back to the time of the provision by the account’s cur-rent effective interest rate, with the provision compris-ing the difference between them.
The third class is receivables where a default event has occurred (stage 3). This includes receivables more than 90 days past due and impaired receivables. For Nordax, a receivable is impaired when it is more than 180 days due.
The remaining receivables are receivables where a default event has occurred but which have not yet been written off (receivables between 90 and 180 days past due). For receivables, the expected credit loss is calculated as the expected write-off and subsequently the expected recovery. Expected recovery is calcu-lated based on expected write off and cumulative recovery curves stretching over 20 years (15 years in Finland). Expected write-off and expected recovery are both discounted back to the time of the provision by the receivable’s current effective interest rate, with the provision comprising the difference between them.
Corporate governanceNordax has developed a governance framework tied to IFRS 9 that comprises a committee meeting chaired by the CFO and where all relevant functions are repre-sented. Moreover, a control framework has been devel-oped where controls for the material aspects of the IFRS 9 process are formalised. The purpose of these controls is to control and verify among other things inputs, outputs and that material prepared for commit-tee meetings has been produced in line with the dual-ity principle. Moreover, the risk control function has its own controls for two purposes: to control the controls in the first line, and to verify the results. The risk con-trol function also performs quarterly validations of the impairment model according to IFRS 9.
NOTESpage 12
Provision according to IAS 39 s of 31 December
2017
Provision according to IFRS 9 as of 1 January 2018
Distribution reserve Individual Group TOTAL Stage 1 Stage 2 Stage 3 TOTAL
Lending to general public 1,536 167 1,703 153 128 1,599 1,880

NORDAX BANK AB (publ) INTERIM REPORT January-December 2018
NOTESpage 13
Note 2 Credit risk
GROUP Q4 Q3 Q4 JAN-DEC JAN-DECAll amounts in MSEK 2018 2018 2017 2018 2017Credit losses, net - lending to the general publicStage 1 3 -17 - -52 -
Stage 2 4 -23 - -22 -
Stage 3 -111 -62 - -306 -
Total credit losses according to IFRS 9 -104 -102 - -380 -
Total credit losses according to IAS39 - -62 - -209
Total credit losses during the period -104 -102 -62 -380 -209
PARENT COMPANY Q4 Q3 Q4 JAN-DEC JAN-DECAll amounts in MSEK 2018 2018 2017 2018 2017Credit losses, net - lending to the general publicStage 1 3 -17 - -52 -
Stage 2 4 -23 - -22 -
Stage 3 -111 -62 - -306 -
Total credit losses according to IFRS 9 -104 -102 - -380 -
Total credit losses according to IAS39 - -62 - -209
Total credit losses during the period -104 -102 -62 -380 -209
As of 1 January 2018, the new reporting standard IFRS 9 is used to calculate credit loss provisions, which are based on credit losses, not only default events (see also pages 10-12). This has created greater volatility in the provisions. The main reasons for the higher credit losses are an increase in credit provisions in stage 1 due to IFRS 9 implementation and that the underlying credit quality has declined slightly, mainly in Norway and Germany.
Expected effects of transition to IFRS 9The transition to IFRS 9 gives rise to a one-off effect of increased provisions for expected credit losses amounting to 177 MSEK (equivalent to 1.3% of lending to the general public) and a corresponding reduction in equity before tax. The increase in credit losses is mainly because IFRS 9 also includes provisioning for current receivables. For capital adequacy reporting, Nordax has decided to use the transition rules for capi-tal adequacy, which allow a gradual phasing of this effect. In the calculation of the capital base in capital adequacy the decrease in equity is accrued over the period 2018-2022 as follows:
• 2018 95% reversal of the initial negative effect on equity• 2019 85% reversal of the initial negative effect on equity• 2020 70% reversal of the initial negative effect on equity• 2021 50% reversal of the initial negative effect on equity• 2022 25% reversal of the initial negative effect on equity

NORDAX BANK AB (publ) INTERIM REPORT January-December 2018
Note 3 Lending to the general public
GROUP Allocation of provision past due receivables31 December 20181 Sweden Norway Denmark Finland Germany TOTAL
Stage 1 4,847 4,241 30 3,236 981 13,336 -205 2%
Stage 2 268 299 1 257 41 866 -151 17%
Stage 3 931 1,203 327 541 162 3,164 -1,870 59%
Total 6,045 5,744 359 4,034 1,184 17,365 -2,225 13%
Reserve -625 -792 -303 -331 -174 -2,225
Total lending to the general public 5,422 4,951 56 3,702 1,009 15,140
GROUP Allocation of provision past due receivables31 December 20171 Sweden Norway Denmark Finland Germany TOTAL
Not yet past due 4,223 4,197 65 2,543 950 11,978
Past due 30-60 days 75 164 3 103 22 367 -36 10%
Past due 60-90 days 47 127 3 64 14 255 -68 27%
Past due 90 days or more 816 873 313 440 86 2,528 -1,536 61%
Total past due 938 1,164 319 607 122 3,150 -1,640 52%
Total 5,161 5,361 384 3,150 1,072 15,128Reserve2 -476 -555 -297 -233 -79 -1,640
Total lending to the general public 4,685 4,806 87 2,917 993 13,488
1 Forward-flow sales to Lindorff began in the third quarter of 2017, whereby Nordax sells a portion of new past due receivables (+90 days) at an agreed price. Sales in the third quarter amounted to 70 MSEK in Sweden and 128 MSEK in Finland. 2 The provision for receivables more than 180 days past due, according to IAS 39 as of 31 December 2017, is estimated individually and amounted to -1,536 MSEK. The collective provision is -104 MSEK. The difference between the provision recognised according to the above and credit losses as per the income statement is due to exchange rate effects, which are accounted for under Net profit from financial transactions.
NOTESpage 14

NORDAX BANK AB (publ) INTERIM REPORT January-December 2018
Capital adequacy information in this document refers to information whose disclosure is provided for in Chapter 6, Sections 3-4 of the Regulations and general recommendations (FFFS 2008:25) on the annual ac-counts of credit institutions and securities companies (investment firms) and to information in the General recommendations on capital adequacy and risk man-agement (FFFS 2014:12) of the Swedish Financial Su-pervisory Authority. Other information required under FFFS 2014:12 is provided on the website, www.nordaxgroup.com.
Information on the Group structureThe top company in the consolidated situation is Cidron Humber 1 S.à r.l. The following companies are in the consolidated situation when calculating capital requirements: Cidron Humber 1 S.à r.l., Cidron Humber 2 S.à r.l., NDX Intressenter Invest Holding AB, NDX Intressenter Invest AB, NDX Intressenter Invest II AB, NDX Intressenter AB, Nordax Group AB, Nordax Bank AB (publ), Nordax Sverige AB, Nordax Nordic 4 AB (publ), Nordax Sverige 4 AB (publ) och Nordax Nordic 2 AB.
Changes were made in the consolidated situation as of 31 March 2018 as NDX Intressenter AB acquired Nordax Group AB (publ). NDX Intressenter’s holding as of 31 December 2018 amounted to 100 percent of the shares.
Note 4 Capital adequacy analysis
PARENT COMPANY Allocation of provision past due receivables31 December 20181 Sweden Norway Denmark Finland Germany TOTAL
Stage 1 4,846 4,240 30 3,235 981 13,333 -205 2%
Stage 2 268 299 1 257 41 866 -151 17%
Stage 3 931 1,203 327 541 162 3,164 -1,870 59%
Total 6,045 5,742 359 4,033 1,183 17,362 -2,225 13%
Reserve -625 -792 -303 -331 -174 -2,225
Total lending to the general public 5,420 4,950 56 3,701 1,009 15,137
PARENT COMPANY Allocation of provision past due receivables31 December 2017 Sweden Norway Denmark Finland Germany TOTAL
Not yet past due 4,214 4,197 65 2,543 950 11,969
Past due 30-60 days 74 165 3 103 22 367 -36 10%
Past due 60-90 days 47 127 3 64 14 255 -68 27%
Past due 90 days or more 816 873 313 440 86 2,528 -1,536 61%
Total past due 937 1,165 319 607 122 3,150 -1,640 52%
Total 5,151 5,362 384 3,150 1,072 15,119Reserve2 -475 -555 -297 -233 -79 -1,639
Total lending to the general public 4,676 4,807 87 2,917 993 13,480
1 Forward-flow sales to Lindorff began in the third quarter of 2017, whereby Nordax sells a portion of new past due receivables (+90 days) at an agreed price. Sales in the third quarter amounted to 70 MSEK in Sweden and 128 MSEK in Finland. 2 The provision for receivables more than 180 days past due, according to IAS 39 as of 31 December 2017, is estimated individually and amounted to -1 536 MSEK. The collective provision is -104 MSEK. The difference between the provision recognised according to the above and credit losses as per the income statement is due to exchange rate effects, which are accounted for under Net profit from financial transactions.
For more information on IFRS 9 and the valuation of loans, see note 1 on page 10.
NOTESpage 15

NORDAX BANK AB (publ) INTERIM REPORT January-December 2018
NOTESpage 16
Consolidated situation Parent Company
All amounts in MSEK31 December
201831 December
201731 December
201831 December
2017
OWN FUNDSCommon Equity Tier 1 capital 6,229 2,135 2,308 1,781
Deduction from own funds -3,712 -306 -26 -106
Total Common Equity Tier 1 capital 2,518 1,829 2,282 1,675Tier 1 Capital, minority 81 - - -Sum Tier 1 Capital 2,599 1,829 2,282 1,675Tier 2 Capital4 216 247 249 247
Net own funds 2,814 2,076 2,531 1,922
Risk exposure amount for credit risk 13,320 10,828 12,362 10,741
Risk exposure amount for market risk 565 787 71 896
Risk exposure amount for operational risks 912 800 882 800
Total risk exposure amount (risk weighted assets) 14,797 12,415 13,315 12,437
Common Equity Tier 1 capital ratio 17.02% 14.72% 17.14% 13.46%
Tier 1 capital ratio 17.56% 14.72% 17.14% 13.46%
Total capital ratio 19.02% 16.72% 19.01% 15.45%
Total Common Equity Tier 1 capital requirement including buffer requirement 8.40% 8.41% 8.40% 8.41%
- of which, capital conservation buffer requirement 2.50% 2.50% 2.50% 2.50%
- of which, countercyclical capital buffers 1.40% 1.41% 1.40% 1.41%
Common Equity Tier 1 capital available for use as buffer1 11.02% 8.72% 11.14% 7.46%
Specification own funds
Common Equity Tier 1 capital:
Capital instruments and the related share premium accounts 4,324 847 78 76
-of wich share capital 43 111 50 50
- of wich other contributed capital 4,280 736 7 7
-of which other funds - - 22 19
Retained earnings 5 1,100 1,760 1,512
- Other transition adj. of common equity Tier 1 capital 5 131 - 131 -
-Minority interest 1,749 - - - Independently reviewed interim profits 20 409 338 432 Calculated dividend2 0 -221 0 -239
Common Equity Tier 1 capital before regulatory adj. 6,229 2,135 2,308 1,781Regulatory adjustments:
- Intangible assets -3,710 -294 -25 -27
- Own shares 0 -11 0 -79
-Prudent valuation -1 -1 -1 -1
Total regulatory adjustments to Common Equity Tier 1 -3,712 -306 -26 -106Common Equity Tier 1 2,518 1,829 2,282 1,675
Tier 1 capital -
Tier 1, minority 81 - - -
Tier 1 capital, total 2 599 - - -
Tier 2 capital:
Tier 2 capital instrument 216 247 249 247
Tier 2 capital 216 247 249 247Total capital 2,814 2,076 2,531 1,922
Specification of risk exposure amount3
Institutional exposures 563 364 435 276
Covered bonds 51 51 51 51
Household exposures 11,095 9,372 10,375 9,365
Exposures secured by mortgages on immovable property 80 - 80 -
Past due items 1,331 993 1,221 993
Other items 200 48 200 56
Total risk exposure amount for credit risk, Standardised Approach 13,320 10,828 12,362 10,741
Exchange rate risk 565 787 71 896
Total risk exposure amount for market risk 565 787 71 896
Operative risk according to alternative Standardized Method 912 800 882 800
Total risk exposure amount for operational risks 912 800 882 800
LEVERAGE RATIOExposure measure for calculating leverage ratio 16,906 16,278 18,873 16,033
Leverage ratio 15.37% 11.23% 12.09% 10.44%

NORDAX BANK AB (publ) INTERIM REPORT January-December 2018
Internal capital requirementAs of 31 December 2018, the internal capital assessed capital requirement amounted to 170 MSEK (160 as of 31 December 2017). The total capital requirement for the period amounts to 1,930 MSEK and are solely covered by CET 1. The internal capital requirement is estimated using Nordax’s internal models for economic capital.
Information on liquidity risk The Group defines liquidity risk as the risk of failing to fulfil payment obligations at maturity without a significant increase in the cost of obtaining means of payment. The Group uses asset-backed borrowing in which parts of the Group’s asset portfolios are pledged as collateral for the loans. The Group’s long-term strat-egy is to match lending assets with the maturities of liabilities. The strategy is aimed at achieving a diversi-fied funding platform comprising equity, subordinated debt, asset backed securities (“ABS”), bank warehouse funding facilities, deposits from the general public and senior unsecured bonds.The goal is to use funding sources which:• Provide a high degree of matching – of currencies and interest periods as well as maturities – between assets and liabilities.• Offer diversification in terms of markets, investors, instruments, maturities, currencies, counterparties and geography.• Carry a low liquidity risk and offer a strong possibility of refinancing at maturity, as evidenced by price stabil-ity, regularity of issuance and a broad investor base.• Provide access to relatively large volumes, to meet the funding requirements of a growing balance sheet.
The Group has an independent function for liquidity risk control. The function reports directly to the Board and CEO.
Liquidity risk is measured on a daily basis and re-ported to the Company’s management. Liquidity risk is reported at each board meeting. Cash flows that are expected to arise from the liquidation of all assets, li-abilities and off-balance sheet items are calculated. Key ratios from the balance sheet (such as the cash ratio, loan-to-deposit ratio, liquidity coverage ratio, net sta-ble funding ratio and deposit usage) are calculated and
monitored over time to illustrate the financial structure and the Group’s liquidity risk. Liquidity risk is measured monthly under various scenarios and events (such as less favourable advance rates and changed cash flows) and specified separately and collectively.
The contingency plan contains a clear division of re-sponsibilities and instructions on how the Group should respond in a liquidity crisis. The plan specifies appro-priate actions to manage the consequences of various types of crises and contains definitions of events that trigger and escalate the contingency plan. The contin-gency plan has been tested and updated.
As of 31 December Nordax had a liquidity coverage ra-tio (LCR, EBA’s definition) of 194 per cent (616). On the same date, the net stable funding ratio (NSFR) was 117 per cent (113), calculated in accordance with the Basel Committee’s definition, which may be modified when introduced by the EU. LCR and NSFR are calculated based on the previous consolidated situation.
Nordax had a liquidity reserve at 31 December 2018 of 3,509 MSEK (2,610). Of these investments, 66 per cent (55) was in Nordic banks, 15 per cent (19) in Swed-ish covered bonds and 19 per cent (26) in Swedish municipal paper. All investments had a credit rating ranging from AAA to A+ from Standard & Poor’s, with an average rating of AA (except 29 MSEK in exposure to Avanza Bank AB). The average maturity was 220 days (256). All bank holdings are highly liquid and all securities are repoable with central banks.
At 31 December 2018 Nordax’s funding sources com-prised 2,107 MSEK (3,074) through the asset-backed securities market (securitized), 487 MSEK (500) in senior unsecured bonds, 2,836 MSEK (3,130) in ware-house funding facilities provided by international banks and 11,260 MSEK (7,506) in deposits from the general public. The figures refer to the nominal amounts.
NOTESpage 17
1 Common Equity Tier 1 capital available for use as a buffer refers to Common Equity Tier 1 capital after deducting own funds used to meet the capital adequacy requirement according to Pillar 1. Expressed as a percentage of total risk exposure amount.2 Calculated dividend consists of estimated dividend for the period of 0 MSEK. The Swedish Financial Supervisory Authority (SFSA) has ap-proved Nordax’s application to include earnings in the capital base on the condition that the responsible auditor has reviewed the surplus, that the surplus has been calculated in accordance with applicable accounting rules, that predicted costs and dividends have been deducted in ac-cordance with Regulation (EU) No 575/2013 and that the calculation has been made in accordance with Regulation (EU) No 241/2014. 3 The capital requirement is 8% of the risk exposure amount pursuant to Regulation (EU) No 575/2013 (CRR).4 A reinterpretation has been made in the calculation of the capital base for the consolidated situation according to the consolidated rules for banking businesses. As a result, Nordax Bank’s subordinated loans of 249 MSEK can only be included in the consolidated situation’s capital base proportionate to the amount required to cover Nordax Bank’s capital requirements. Consequently, eligible Tier 2 capital amounts to 216 MSEK.5 Nordax has notified the SFSA that the bank, at the consolidated and parent company level, will apply the transition rules according to article 473a in 2017/2395/EU, paragraphs 2 and 4. Table according to “Final report on the guidelines on uniform disclosure of IFRS 9 transitional arangements”, EBA, 12 January 2018 is included in the information published according to del 8 in 575/2013/EU on the bank’s website www.nordaxgroup.com.

NORDAX BANK AB (publ) INTERIM REPORT January-December 2018
Note 5 Classification of financial assets and liabilities
GROUP
31 December 2018 Amortised cost
Fair value through profit and loss resul-
taträkningen
Fair value through com-
prehensive income Total
Assets Lending to credit institutions 2,681 - - 2,681
Lending to the general public 15,140 - - 15,140
Bonds and other fixed-income securities - 1,187 - 1,187
Total assets 17,821 1,187 - 19,008
LiabilitiesLiabilities to credit institutions 2,831 - - 2,831
Deposits from the general public 11,278 - - 11,278
Issued securities 2,581 - - 2,581
Derivatives - - - -
Subordinated liabilties 249 - - 249
Total liabilities 16,939 - - 16,939
GROUP
31 December 2017
Financial instruments measured at fair value through profit and loss
Loans and receivables
Other financial liabilities Total
Held for tra-ding
Designated at initial recogni-
tion
Assets
Lending to credit institutions - - 1,795 - 1,795
Lending to the general public - - 13,488 - 13,488
Bonds and other fixed-income securities - 1,184 - - 1,184
Derivatives 7 - - - 7
Total assets 7 1,184 15,283 - 16,474
LiabilitiesLiabilities to credit institutions - - - 3,054 3,054
Deposits from the general public - - - 7,511 7,511
Issued securities - - - 3,547 3,547
Subordinated liabilties - - - 247 247
Total liabilities - - - 14,359 14,359
The classification of financial assets and liabilities is presented as per the second quarter according to IFRS 9 and the figures for 31 December 2017 have been reported according to IAS 39.
NOTESpage 18

NORDAX BANK AB (publ) INTERIM REPORT January-December 2018
PARENT COMPANY
31 December 2017
Financial instruments measured at fair value through profit and loss
Loans and receivables
Other financial liabilities Total
Held for tra-ding
Designated at initial recogni-
tion
Assets
Lending to credit institutions - - 1,365 - 1,365
Lending to the general public - - 13,480 - 13,480
Bonds and other fixed-income securities - 1,184 - - 1,184
Derivatives 7 - - - 7
Total assets 7 1,184 14,845 - 16,036
SkulderDeposits from the general public - - - 7,511 7,511
Issued securities - - - 498 498
Subordinated liabilties - - - 247 247
Total liabilites - - - 8,256 8,256
The classification of financial assets and liabilities is presented as per the second quarter according to IFRS 9 and the figures for 31 December 2017 have been reported according to IAS 39.
NOTESpage 19
PARENT COMPANY
31 December 2018 Amortised cost
Fair value through profit and loss resul-
taträkningen
Fair value through com-
prehensive income Total
Assets Lending to credit institutions 2,167 - - 2,167
Lending to the general public 15,137 - - 15,137
Bonds and other fixed-income securities - 1,187 - 1,187
Total assets 17,304 1,187 - 18,491
LiabilitiesDeposits from the general public 11,278 - - 11,278
Issued securities 487 - - 487
Derivatives 249 - - 249
Subordinated liabilties 0 - - -
Total liabilites 12,014 - - 12,014

NORDAX BANK AB (publ) INTERIM REPORT January-December 2018
Note 6 Fair values of financial assets and liabilities
GROUP
31 December 2017Carrying amount Fair value Delta
AssetsLending to credit institutions1 1,795 1,795 -
Lending to the general public2,4 13,488 16,052 2,564
Bonds and other fixed-income securities 1,184 1,184 -
Derivatives 7 7 -
Total assets 16,474 19,038 2,564
LiabilitesLiabilities to credit institutions1 3,054 3,054 -
Deposits from the general public1 7,511 7,511 -
Issued securities3 3,547 3,554 7
Subordinated liabilties3 247 260 13
Total liabilities 14,359 14,380 21
1 Fair value is deemed to be the same as the carrying amount, as these are of a short-term nature. 2 The measurement includes significant non-observable inputs. 3 Fair value data for issued securities and debenture loans are based directly or indirectly on quoted prices4 Fair value data for lending to the general public is calculated after tax.
NOTESpage 20
GROUP
31 December 2018Carrying amount Fair value Delta
Assets Lending to credit institutions1 2,681 2,681 -
Lending to the general public2,4 15,140 19,669 4,529
Bonds and other fixed-income securities 1,187 1,187 -
Total assets 19,008 23,537 4,529
LiabilitesLiabilities to credit institutions1 2,831 2,831 -
Deposits from the general public2 11,278 11,278 -
Issued securities3 2,581 2,583 2
Subordinated liabilties3 249 254 5
Total liabilities 16,939 16,946 7
NORDAX BANK AB (publ) INTERIM REPORT January-December 2018
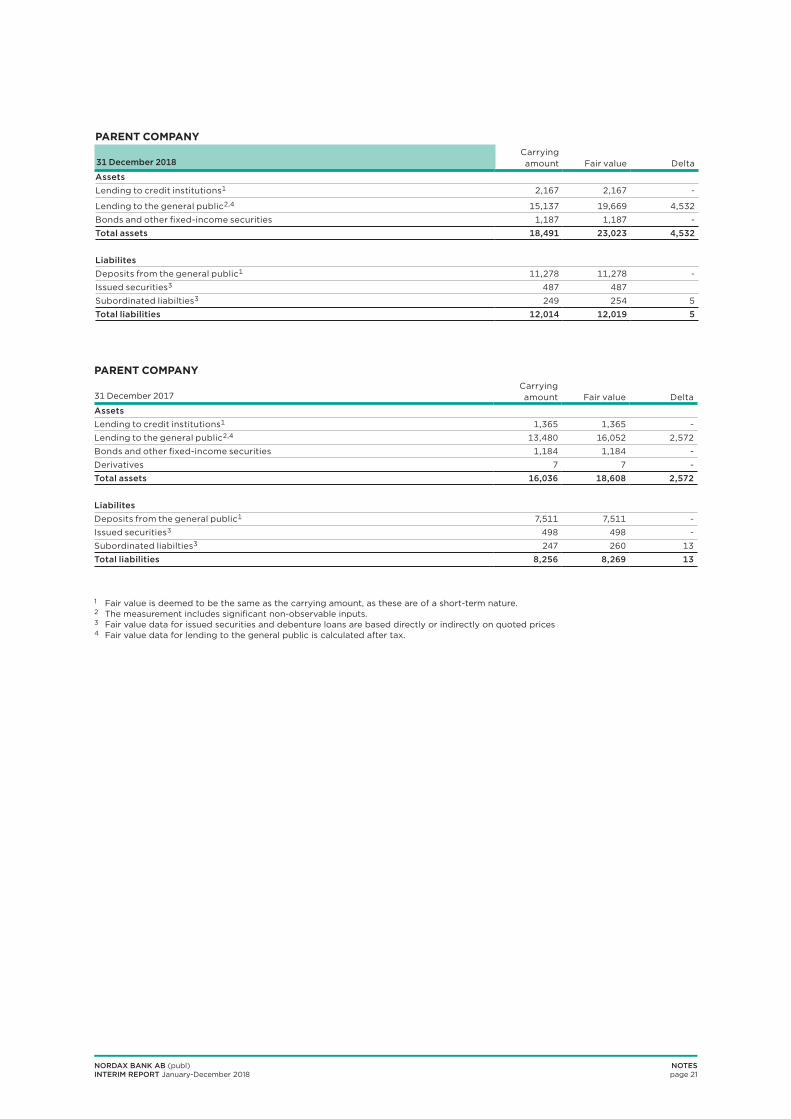
PARENT COMPANY
31 December 2018Carrying amount Fair value Delta
Assets Lending to credit institutions1 2,167 2,167 -
Lending to the general public2,4 15,137 19,669 4,532
Bonds and other fixed-income securities 1,187 1,187 -
Total assets 18,491 23,023 4,532
LiabilitesDeposits from the general public1 11,278 11,278 -
Issued securities3 487 487
Subordinated liabilties3 249 254 5
Total liabilities 12,014 12,019 5
PARENT COMPANY
31 December 2017Carrying amount Fair value Delta
Assets Lending to credit institutions1 1,365 1,365 -
Lending to the general public2,4 13,480 16,052 2,572
Bonds and other fixed-income securities 1,184 1,184 -
Derivatives 7 7 -
Total assets 16,036 18,608 2,572
LiabilitesDeposits from the general public1 7,511 7,511 -
Issued securities3 498 498 -
Subordinated liabilties3 247 260 13
Total liabilities 8,256 8,269 13
1 Fair value is deemed to be the same as the carrying amount, as these are of a short-term nature. 2 The measurement includes significant non-observable inputs. 3 Fair value data for issued securities and debenture loans are based directly or indirectly on quoted prices4 Fair value data for lending to the general public is calculated after tax.
NOTESpage 21

NORDAX BANK AB (publ) INTERIM REPORT January-December 2018
GROUP31 December 2018 Level 1 Level 2 Level 3 Total
AssetsBonds and other fixed-income securities 562 625 - 1,187
Total assets 562 625 - 1,187
Calculation of fair value
The fair values of financial instruments traded in an active market are based on quoted market prices at the balance sheet date. A market is regarded as active if quoted prices from an exchange, broker, industry group, pricing service or regulatory authority are eas-ily and regularly available, and these prices represent actual and regularly occurring arm’s length market transactions. The quoted market price used for the Group’s financial assets is the current bid price. These instruments fall into Level 1.
The fair values of financial instruments not traded in an active market are determined with the help of valuation techniques. Market data is used as far as possible when such data is available. If all significant inputs required for the fair value measurement of an instrument are observ-able, the instrument falls into Level 2.
In cases where one or several significant inputs are not based on observable market information, the instru-ment is classified as Level 3.
The table below shows financial instruments at fair value based on the classification in the fair value hierar-chy. The different levels are defined as follows: • Quoted prices (unadjusted) in active markets for iden-tical assets or liabilities (Level 1) • Inputs other than quoted market prices included in Level 1 that are observable for the asset or liability, either directly in the form of quoted prices or indirectly, i.e. derived from quoted prices (Level 2). • Inputs for the asset or liability which are not based on observable market data (non-observable inputs) (Level 3).
In 2018 there have not been any transfers between the levels.
GROUP31 December 2017 Level 1 Level 2 Level 3 Total
Assets Bonds and other fixed-income securities 509 676 - 1,184
Derivatives - 7 - 7
Total assets 509 682 - 1,191
NOTESpage 22
PARENT COMPANY31 December 2017 Level 1 Level 2 Level 3 Total
Assets Bonds and other fixed-income securities 509 676 - 1,184
Derivatives - 7 - 7
Total assets 509 682 - 1,191
PARENT COMPANY31 December 2018 Level 1 Level 2 Level 3 Total
AssetsBonds and other fixed-income securities 562 625 - 1,187
Total assets 562 625 - 1,187

NORDAX BANK AB (publ) INTERIM REPORT January-December 2018
Segment information is presented based on the chief operating decision-maker’s perspective, and the segments are identified based on the internal reporting to the CEO, who is identified as the chief operating decision-maker. Nordax has the following operating segments: Sweden, Norway, Finland, Denmark and Germany, which reflects
Nordax’s lending portfolio. Profit/loss that cannot be attributed to a single segment is allocated using a distribution matrix according to internal principles that management believes to provide a fair allocation to the segments.
Note 7 Operating segments
Q4 2018 Sweden Norway Denmark Finland Germany TOTAL Income statementInterest income1 129 151 1 107 26 414
Interest expenses -17 -36 0 -14 -4 -71
Total net interest income 112 115 1 93 22 343Commission income 2 2 0 0 0 4
Net profit from financial transactions -1 -19 0 -16 25 -11
Total operating income 113 98 1 77 47 336General administrative expenses -53 -42 -1 -27 -10 -133
Depreciation, amortisation and impairment of property, plant and equipment and intangible assets -1 -2 0 -1 -1 -5
Other operating expenses -19 -11 0 -8 -2 -40
Total operating expenses -73 -55 -1 -36 -13 -178
Profit before credit losses 40 43 0 41 34 158
Net credit losses -34 -39 1 -21 -11 -104
Operating profit 6 4 1 20 23 54
Balance sheetLending to the general public 5,422 4,951 56 3,702 1,009 15,140
NOTESpage 23
Q3 2018 Sweden Norway Denmark Finland Germany TOTAL Income statementInterest income1 122 152 1 104 28 407
Interest expenses -20 -32 -1 -15 -4 -72
Total net interest income 102 120 0 89 24 335Commission income 1 1 0 1 0 3
Net profit from financial transactions -1 14 1 -30 31 15
Total operating income 102 135 1 60 55 353General administrative expenses -37 -29 -1 -16 -8 -91
Depreciation, amortisation and impairment of property, plant and equipment and intangible assets -4 -1 0 -1 0 -6
Other operating expenses -13 -11 0 -7 -2 -33
Total operating expenses -54 -41 -1 -24 -10 -130
Profit before credit losses 48 94 0 36 45 223
Net credit losses -27 -33 1 -24 -19 -102
Operating profit 21 61 1 12 26 121
Balance sheetLending to the general public 4,965 5,265 66 3,596 1,062 14,954

NORDAX BANK AB (publ) INTERIM REPORT January-December 2018
Q4 2017 Sweden Norway Denmark Finland Germany TOTAL Income statementInterest income1 118 144 1 82 25 370
Interest expenses -17 -33 0 -13 -4 -67
Total net interest income 101 111 1 69 21 303Commission income 2 2 0 0 0 4
Net profit from financial transactions 0 -11 0 0 1 -10
Total operating income 103 102 1 69 22 297General administrative expenses -26 -29 0 -15 -5 -74
Depreciation, amortisation and impairment of property, plant and equipment and intangible assets -4 -2 0 0 0 -6
Other operating expenses -7 -8 0 -6 -5 -26
Total operating expenses -37 -39 0 -21 -10 -106
Profit before credit losses 66 63 1 48 12 191
Net credit losses -13 -42 -1 3 -9 -62
Operating profit 53 21 0 51 3 129
Balance sheetLending to the general public 4,685 4,806 87 2,917 993 13,488
NOTESpage 24
Q1-Q4 2018 Sweden Norway Denmark Finland Germany TOTAL Income statementInterest income1 487 598 4 397 109 1,595
Interest expenses -69 -131 -1 -53 -16 -270
Total net interest income 418 467 3 344 93 1,325Commission income 9 5 0 4 0 18
Net profit from financial transactions -2 17 1 33 -12 37
Total operating income 425 489 4 381 81 1,380General administrative expenses -154 -135 -3 -86 -33 -411
Depreciation, amortisation and impairment of property, plant and equipment and intangible assets -10 -7 0 -4 -2 -23
Other operating expenses -46 -42 0 -31 -18 -137
Total operating expenses -210 -184 -3 -121 -53 -571
Profit before credit losses 215 305 1 260 28 809
Net credit losses -95 -141 3 -76 -71 -380
Operating profit 120 164 4 184 -43 429
Balance sheetLending to the general public 5,422 4,951 56 3,702 1,009 15,140
Q1-Q4 2017 Sweden Norway Denmark Finland Germany TOTAL Income statementInterest income1 462 593 6 300 94 1,455
Interest expenses -63 -142 -1 -41 -14 -261
Total net interest income 399 451 5 259 80 1,194Commission income 9 7 0 3 0 19
Net profit from financial transactions 0 -25 0 -1 2 -24
Total operating income 408 433 5 261 82 1,189General administrative expenses -90 -114 -3 -58 -24 -289
Depreciation, amortisation and impairment of property, plant and equipment and intangible assets -13 -8 0 -2 -1 -24
Other operating expenses -32 -36 0 -31 -29 -127
Total operating expenses -135 -158 -3 -91 -54 -440
Profit before credit losses 273 275 2 170 28 749
Net credit losses -61 -106 0 -6 -36 -209
Operating profit 212 169 2 164 -8 540
Balance sheetLending to the general public 4,685 4,806 87 2,917 993 13,488
1 Interest income refers to revenues from external customers.2 Nordax open currency positions to protect capital adequacy relations from exchange rate fluctuations are replaced by derivatives. The ef-fect of currency movements on regulatory capital that had a corresponding effect on the net profit from financial transactions in the income statement will further on be close to 0.

NORDAX BANK AB (publ) INTERIM REPORT January-December 2018
GROUP PARENT COMPANY
31 DECEMBER 31 DECEMBER 31 DECEMBER 31 DECEMBERAll amounts are in MSEK 2018 2017 2018 2017
Pledged assets for own liabilitiesLending to the general public 7,361 9,130 - -
Lending to credit institutions 515 427 - -
Total 7,876 9,558 - -
Note 8 Pledged assets
The Group did not have any transactions with related parties during the period.
Note 9 Transactions with related parties
Note 10 Important events after the balance sheet date
NOTESpage 25
Pledged assets relate to subsidiary securitisation. The Group has no contingent liabilities or commitments.
In January 2019 Nordax finalized the acquisition of Svensk Hypotekspension AB, experts in so-called equity release mortgages. Through the Hypotekspen-sion® product, the Swedish pensioners with equity tied up in their homes are offered an opportunity to free up this capital without having to sell the home. Svensk Hypotekspension AB thereby became a wholly owned subsidiary of Nordax Bank.
Through the acquisition, Nordax strengthens its posi-tion as a challenger in the mortgage market. As with Nordax’s mortgage offer, which was launched in 2018,
Svensk Hypotekspension meets an important and growing customer need, where an increasing number of creditworthy customers do not fit into the stand-ardized credit assessments of the major banks.
At year-end Svensk Hypotekspension’s total lending amounted to just over SEK 4 billion divided among nearly 6,000 customers (households).

NORDAX BANK AB (publ) INTERIM REPORT January-December 2018
PARENT COMPANYpage 26
Note 11 Changes in reporting in the Parent Company
Changes in reporting for the Parent Company, Nordax Bank AB, stem from discussions on an accounting adjustment according to article 17 of IAS 39. As a result, the Parent Company Nordax Bank AB has now assumed the credit risk from the subsidiaries. The change affects loans where the risk has not been assumed in its entirety after the sale of the loans to the subsidiaries in connection with securitisation. Thus, the loans are still reported in the Parent Company. The adjustment has no impact on capital adequacy or reporting for the Group in Nordax Bank
AB and solely refers to the Parent Company, Nordax Bank AB. Nordax considers the change a correction of an error in accordance with IAS 8 and not a change in accounting policies in previously published quarterly reports and annual reports. The change means that lending to the public increases in the Parent Company and that all items attributable to the securitization are also reported in the Parent Company, as specified below. The change was implemented on 1 October 2017.
Before adjustments Adjustments
After adjust-ments
Q4 Q4All amounts are in MSEK 2017 2017Income statementInterest income 133 238 371
Interest expenses -46 -238 -284
Total net interest income 87 0 87
Commission income 1 0 1
Net profit from financial transactions -9 -1 -10
Other operating income 167 51 218
Total operating income 245 51 296
Operating expenses
General administrative expenses -73 1 -72
Depreciation, amortisation and impairment of property, plant and equipment and intangible assets -3 0 -3
Other operating expenses -23 -1 -24
Total operating expenses -99 0 -99
Profit before credit losses 146 51 197
Net credit losses -11 -51 -62
Operating profit 135 0 135
Tax on profit for the period -32 0 -32
Net profit for the period 103 0 103
Before adjustments Adjustments
After adjust-ments
Jan-Dec Jan-DecAll amounts are in MSEK 2017 2017Income statementInterest income 741 720 1,461
Interest expenses -393 -720 -1,113
Total net interest income 348 0 348
Commission income 5 0 5
Net profit from financial transactions -23 0 -23
Other operating income 700 157 857
Total operating income 1,030 157 1,187
Operating expenses
General administrative expenses -280 0 -280
Depreciation, amortisation and impairment of property, plant and equipment and intangible assets -12 0 -12
Other operating expenses -126 -1 -127
Total operating expenses -418 -1 -419
Profit before credit losses 612 156 768
Net credit losses -53 -156 -209
Operating profit 559 0 559
Tax on profit for the period -127 0 -127
Net profit for the period 432 0 432

NORDAX BANK AB (publ) INTERIM REPORT January-December 2018
PARENT COMPANY page 27
Before adjustments Adjustment
After adjust-ments
31 Decem-ber
31 Decem-ber
All amounts are in MSEK 2017 2017ASSETSLending to credit institutions 1,365 - 1,365
Lending to the general public 4,292 9,188 13,480
Bonds and other fixed-income securities 1,184 - 1,184
Shares in subsidiaries 115 -113 2
Tangible assets 6 - 6
Intangible assets 27 - 27
Other assets 4,168 -4,112 56
Prepaid expenses and accrued income 23 - 23
TOTAL ASSETS 11,180 4,963 16,143
LIABILITIES, PROVISIONS AND EQUITYLiabilitiesLiabilities to credit institutions - - -
Deposits from the general public 7,511 - 7,511
Issued securities 498 - 498
Liabilities to securitisation firms 631 4,963 5,594
Current tax liability 55 - 55
Deferred tax liability 24 - 24
Other liabilities 146 - 146
Accrued expenses and deferred income 49 - 49
Subordinated liabilities 247 - 247
Total liabilities 9,161 4,963 14,124
EquityShare capital 50 - 50
Other reserves 7 - 7
Other funds 19 - 19
Retained earnings, incl. profit for the year 1,943 - 1,943
Total equity 2,019 - 2,019
TOTAL LIABILITIES, PROVISIONS AND EQUITY 11,180 4,963 16,143
Financial CalendarWeek 15 - Annual Report for Nordax Bank AB will be published.

NORDAX BANK AB (publ) INTERIM REPORT January-December 2018
DEFINITIONSpage 28
Definitions
Adjusted operating income1
Total operating income excluding foreign exchange gains/losses.
Adjusted cost to income ratio (C/I ratio) 1Adjusted operating expenses excluding marketing costs as a percentage of adjusted operating income. The adjusted cost to income ratio is presented on a 12-month rolling basis.
Adjusted operating expenses1
Total operating expenses excluding amortization of acquired intangible assets and non-recurring items
Adjusted operating profit 1Operating profit excluding amortization of acquired intangible assets, foreign exchange gains/losses and non-recurring items.
Adjusted profit1
Profit excluding amortization of acquired intangible assets, foreign exchange gains/losses and non-recur-ring items as well as the tax effect thereof.
Adjusted return on average net loans1
Adjusted operating profit as a percentage of average loan portfolio. Return on average net loans is presented on a 12-month rolling basis
Adjusted return on tangible equity1
Adjusted net profit in relation to average tangible equity on a 12-month rolling basis
Average loan portfolioThe average of lending to the general public at the beginning of the period and the end of the period.
C/I ratioOperating expenses as a percentage of operating income
Common Equity Tier 1 capital 2Shareholders’ equity excluding proposed dividend, deferred tax assets, intangible assets and certain other regulatory adjustments defined in Regulation (EU) No 575/2013 (CRR).
Common Equity Tier 1 capital ratio2
Common Equity Tier 1 capital as a percentage of risk exposure amount.
Credit loss levelNet credit losses as a percentage of average lending to the public.
Earnings per shareNet profit attributable to the shareholders in relation to the average number of shares.
Leverage ratio2
Tier 1 capital as a percentage of total assets including off-balance-sheet items with conversion factors defined in Regulation (EU) No 575/2013 (CRR).
Liquidity Coverage Ratio (LCR)2
High-quality liquid assets in relation to estimated net cash outflows over the next 30 calendar days, as defined by Swedish regulations (SFSA code FFFS 2012:6).
Liquidity reserveA separate reserve of high-quality liquid assets that can be used to secure the company’s short-term ability to pay for losses or in the event of reduced access to commonly available funding sources.
Net interest marginTotal net interest income as a percentage of the aver-age loan portfolio.
Own funds2
The sum of Tier 1 and Tier 2 capital.
Return on equityNet profit attributable to the shareholders in relation to average shareholders’ equity
Risk exposure amount2
Total assets and off balance sheet items, weighted in accordance with capital adequacy regulation for credit and market risks. Operational risks are measured and added as risk exposure amount.
Tangible equityShareholders’ equity less intangible assets.
Tier 1 capital ratio2
Tier 1 capital as a percentage of the risk exposure amount.
Tier 1 capital2
Common Equity Tier 1 capital plus qualifying forms of subordinated loans.
Tier 2 capital2
Mainly subordinated loans that do not qualify as Tier 1 capital.
Total capital ratio2 Total own funds as a percentage of the risk exposure amount
The Group considers the key figures to be relevant to users of the financial report as a complement in assessing the financial performance of the Group.
1 The adjusted numbers are presented to show the underlying performance of the business2 These are reported with respect SFSA´s regulations and general recommendations see note 4, capital adequacy analysis.
NORDAX BANK AB (publ) INTERIM REPORT January-December 2018
The Board of Directors declares that the interim report for January-December 2018 provides a fair overview of the Parent Company’s and the Group’s operations, financial position and results and
describes material risks and uncertainties facing the Parent Company and the Group
Stockholm February 21 2019
Board of Directors’ affirmation
Hans-Ole Jochumsen
Chairman
Christopher Ekdahl
Non-Executive Director
Christian Frick
Non-Executive Director
Heikki Kapanen
Non-Executive Director
Henrik Källén
Non-Executive Director
Ville Talasmäki
Non-Executive Director
CEO’s affirmationpage 29