norms for the design of irrigation systems norms 12 march 2014.pdf · norms for the design of...
TRANSCRIPT

NORMS FOR THE DESIGN OF IRRIGATION SYSTEMS
DATE OF LAST REVIEW: 11 March 2014

2
TableofContentsBackground ............................................................................................................................................. 5
1. System Planning .................................................................................................................................. 6
1.1 Suitability of irrigation systems ..................................................................................................... 6
1.2 Allowable depletion levels of soil water ....................................................................................... 9
1.3 Percentage wetted area ................................................................................................................ 9
1.4 System Efficiency ........................................................................................................................ 10
1.5 Irrigation hours per week............................................................................................................ 11
1.6 Surveying and mapping ............................................................................................................... 11
1.6.1 Recommended contour intervals and scales of maps ............................................................. 11
1.6.2 Use of GPS Systems .................................................................................................................. 11
2. Irrigation systems .............................................................................................................................. 13
2.1 Micro sprinkler irrigation ............................................................................................................ 13
2.1.1 Minimum gross application rate .............................................................................................. 13
2.1.2 Distribution Uniformity ............................................................................................................ 13
2.1.3 Flow velocity in laterals ............................................................................................................ 13
2.2 Drip Irrigation .............................................................................................................................. 13
2.2.1 Distribution Uniformity ............................................................................................................ 13
2.2.2 Flow velocity in laterals required for effective flushing .......................................................... 14
2.2.3 Flushing of laterals ................................................................................................................... 14
2.2.4 Flow velocity in manifolds ........................................................................................................ 14
2.2.5 Specific management systems ................................................................................................. 14
2.3 Sprinkler Irrigation ...................................................................................................................... 15
2.3.1 Sprinkler selection .................................................................................................................... 15
2.3.2 Sprinkler spacing ...................................................................................................................... 15
2.3.3 Minimum gross application rate .............................................................................................. 15
2.3.4 Maximum pressure variation ................................................................................................... 15
2.4 Centre Pivot ................................................................................................................................ 16
2.4.1 Maximum irrigation time vs. soil infiltration rate .................................................................... 16
2.4.2 Christiansen uniformity coefficient (CU) ................................................................................. 16
2.4.3 Friction through centre pivot .................................................................................................. 16
2.4.4 Effective radius of end gun ..................................................................................................... 16
2.5 Travelling irrigators ..................................................................................................................... 16

3
2.5.1 Pressure variation over the length of the travelling path ........................................................ 16
2.5.2 Speed variation ........................................................................................................................ 16
2.5.3 Site ........................................................................................................................................... 16
2.5.4 Flow rate .................................................................................................................................. 16
2.5.5 Sprinkler choice ........................................................................................................................ 16
2.5.6 Strip width ................................................................................................................................ 17
2.6 Flood irrigation ............................................................................................................................ 17
2.6.1 Slope of beds ............................................................................................................................ 17
2.6.2 Allowable flow depth in beds .................................................................................................. 17
2.6.3 Allowable soil infiltration rate per bed .................................................................................... 17
3. Water supply systems ....................................................................................................................... 17
3.1 Pipe friction in main‐ and sub main lines .................................................................................... 17
3.2 Valves .......................................................................................................................................... 18
3.3 Filters ........................................................................................................................................... 18
3.3.1 Disc and mesh filters ................................................................................................................ 18
3.3.2 Sand Filters ............................................................................................................................... 18
3.4 Design pump capacity (safety factor for wear and tear) ............................................................ 19
3.5 Allowable velocity in the suction pipe ........................................................................................ 20
3.6 Pump efficiency ........................................................................................................................... 20
3.7 Maximum motor power output .................................................................................................. 20
3.8 Motor efficiency .......................................................................................................................... 20
3.9 Variable speed drives (VSDs) ...................................................................................................... 21
3.9.1 General ..................................................................................................................................... 21
3.9.2 Totally Enclosed Fan Cooled Motors (TEFC) Motors ................................................................ 21
3.9.3 Submersible motors ................................................................................................................. 21
3.9.4 Electrical supply and connection ............................................................................................. 22
4. Greenhouses and Tunnels ................................................................................................................. 23
4.1 Crop water requirement (mm/day) ............................................................................................ 23
4.2 Overhead irrigation ..................................................................................................................... 23
4.3 Drip Irrigation .............................................................................................................................. 23
4.4 Pipelines, Pumps and Accessories .............................................................................................. 23
4.5 Installation of drainage pipes ...................................................................................................... 24
4.6 Allowable ground slopes in greenhouses ................................................................................... 24

4
DISCLAIMER:
Although the norms have been compiled with great care, SABI, its employees or representatives
shall not under any circumstances be held responsible for any loss or damage to any person, object
or organisation as a result of the application of these norms.
5
BackgroundA norm is defined as a widely accepted or required standard against which performance or
achievement can be assessed.
The SABI design norms serve to guide the designer in calculations and decision‐making in the
planning and design of agricultural irrigation systems. The norms are presented under the following
four main headings:
System planning
Irrigation systems
Water supply systems
Greenhouses and tunnels
The design of irrigation systems requires a balanced approach that results in both technically,
financially and ethically acceptable solutions for the customer. Diverging from the norms is
acceptable if it can be well motivated from both a technical and an ethical perspective by the
designer.

6
1.SystemPlanning
1.1SuitabilityofirrigationsystemsWhen selecting the type of irrigation system to be used in a specific situation, there are a number of
factors that have to be taken into consideration. Although it is not possible to set fixed norms for the
selection of irrigation systems, it is recommended that information regarding the following five
aspects of the situation that the system is being designed for, should be collected and assessed:
• Crop: information should be collected on the cultivar, planting and harvesting date / growing
season, row direction and spacing of plants, crop heights, tilling practices, climatic water
requirements and any climate control requirements.
• Soil: an investigation of soil and analysis and interpretation of the data by a soil scientist is
recommended. Factors such as texture, structure, infiltration rate, water holding capacity, soil depth
and permeability should be taken into consideration, as well as crop specific requirements such as
wetted leaves, dry leaves and stems, root development
• Water: both aspects of quantity and quality should be investigated. A hydrological study and
confirmation from the water management authority are recommended to ensure adequate water is
lawfully available. The water quality should be suitable for both the crop and soil of the specific
situation, and may also require special treatment if a detrimental effect on the irrigation equipment
is expected.
• Climate: the closest weather station should be identified in order to access long‐term
historical weather data such as evaporation, rainfall, temperature, humidity and wind, as these will
have an influence on the water requirements and system orientation.
• Site: the size, shape and slope of the site available should be taken into consideration when
selecting the irrigation system.
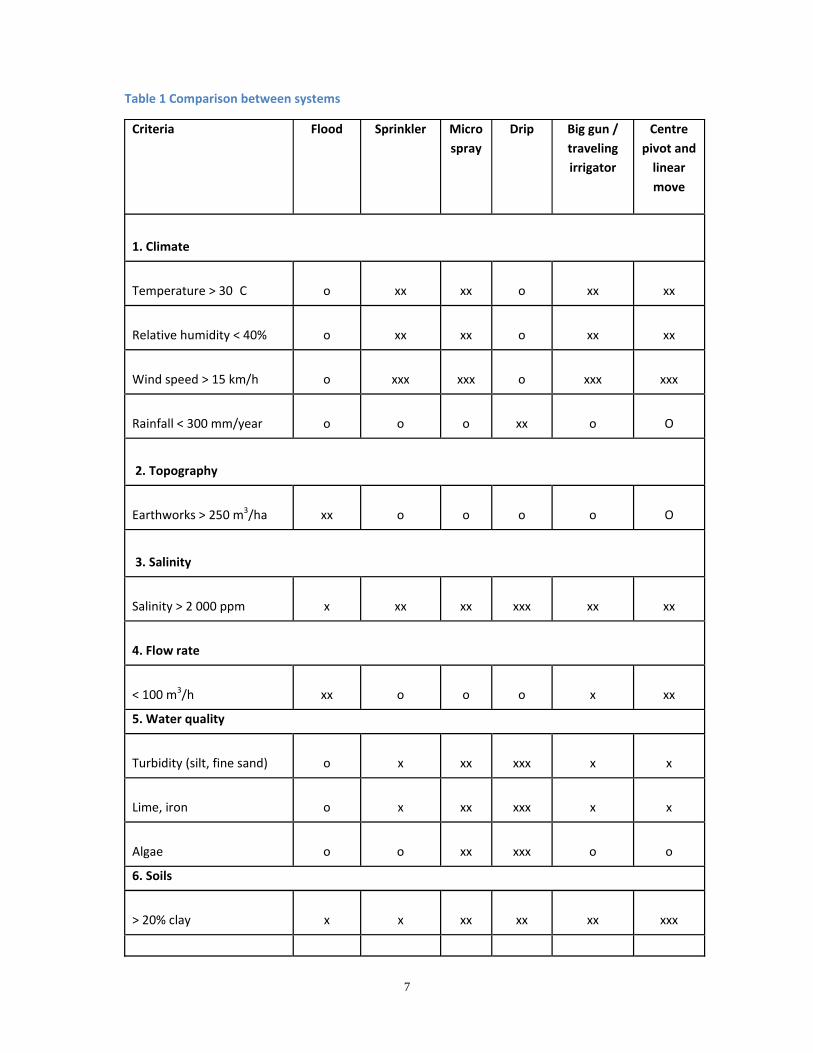
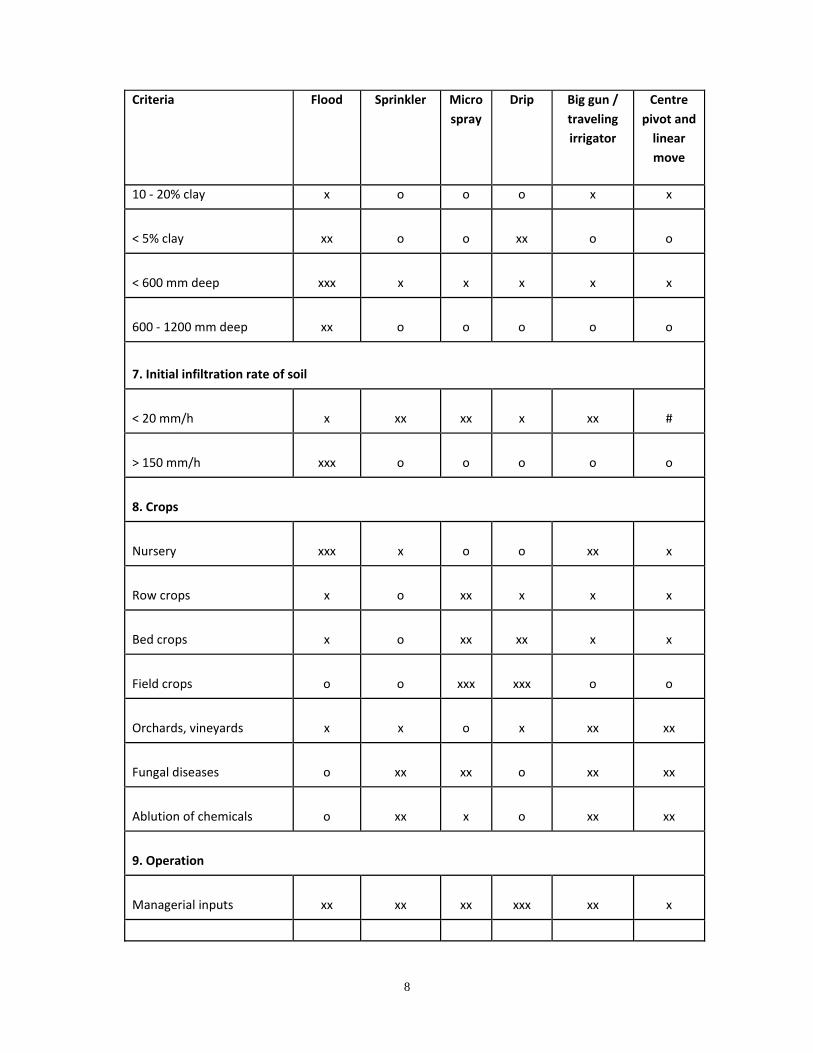
Table 1 has been compiled by the ARC‐IAE to assist designers with the selection of the most
appropriate type of irrigation system (Burger et al, 2003).
The following symbols are used in the table to indicate the degree of limitation or obstacles that
might occur:
o No limitation
x Little limitation
xx Moderate limitation
xxx Severe
# Requires further thorough investigation by an expert.
7
Table 1 Comparison between systems
Criteria Flood Sprinkler Micro
spray
Drip Big gun /
traveling
irrigator
Centre
pivot and
linear
move
1. Climate
Temperature > 30�C
o xx xx o xx
xx
Relative humidity < 40%
o xx xx o xx
xx
Wind speed > 15 km/h
o xxx xxx o xxx
xxx
Rainfall < 300 mm/year
o o o xx o
O
2. Topography
Earthworks > 250 m3/ha
xx o o o o
O
3. Salinity
Salinity > 2 000 ppm
x xx xx xxx xx
xx
4. Flow rate
< 100 m3/h
xx o o o x
xx
5. Water quality
Turbidity (silt, fine sand)
o x xx xxx x
x
Lime, iron
o x xx xxx x
x
Algae
o o xx xxx o
o
6. Soils
> 20% clay
x x xx xx xx
xxx
8
Criteria Flood Sprinkler Micro
spray
Drip Big gun /
traveling
irrigator
Centre
pivot and
linear
move
10 ‐ 20% clay x o o o x x
< 5% clay
xx o o xx o
o
< 600 mm deep
xxx x x x x
x
600 ‐ 1200 mm deep
xx o o o o
o
7. Initial infiltration rate of soil
< 20 mm/h
x xx xx x xx
#
> 150 mm/h
xxx o o o o
o
8. Crops
Nursery
xxx x o o xx
x
Row crops
x o xx x x
x
Bed crops
x o xx xx x
x
Field crops
o o xxx xxx o
o
Orchards, vineyards
x x o x xx
xx
Fungal diseases
o xx xx o xx
xx
Ablution of chemicals
o xx x o xx
xx
9. Operation
Managerial inputs
xx xx xx xxx xx
x

9
Criteria Flood Sprinkler Micro
spray
Drip Big gun /
traveling
irrigator
Centre
pivot and
linear
move
Labour xx xx o o x o
Energy requirements
o xx xx xx xxx
xx
Water use
xxx xx xx x xx
xx
Application of chemicals
# xx x x xx
xxx
1.2AllowabledepletionlevelsofsoilwaterThe following allowable depletion values are recommended to be used during the planning process
to determine the size of the soil water reservoir and irrigation cycle length. These values are aimed
at maintaining the maximum evapotranspiration rates of crops which were grouped according to
water stress sensitivity (Annandale & Steyn, 2008).
Table 2 Allowable depletion values as a percentage of the available water in the active root zone
Crop group
Allowable depletion (% of available water) to maintain the following ET rates (mm/day)
2 mm 3mm 4 mm 5 mm 6 mm 7 mm 8 mm 9 mm 10 mm
1 50 43 35 30 25 23 20 20 18
2 68 58 48 40 35 33 28 25 23
3 80 70 60 50 45 43 38 35 30
4 88 80 70 60 55 50 45 43 40
Crop group 1: Onions, peppers, potatoes
Crop group 2: Bananas, cabbage, peas, tomatoes
Crop group 3: Lucern, beans, citrus, groundnuts, pineapples, sunflowers, watermelons, wheat
Crop group 4: Cotton, sorghum, olives, grapes, maize, soybeans, sugar beet, tobacco
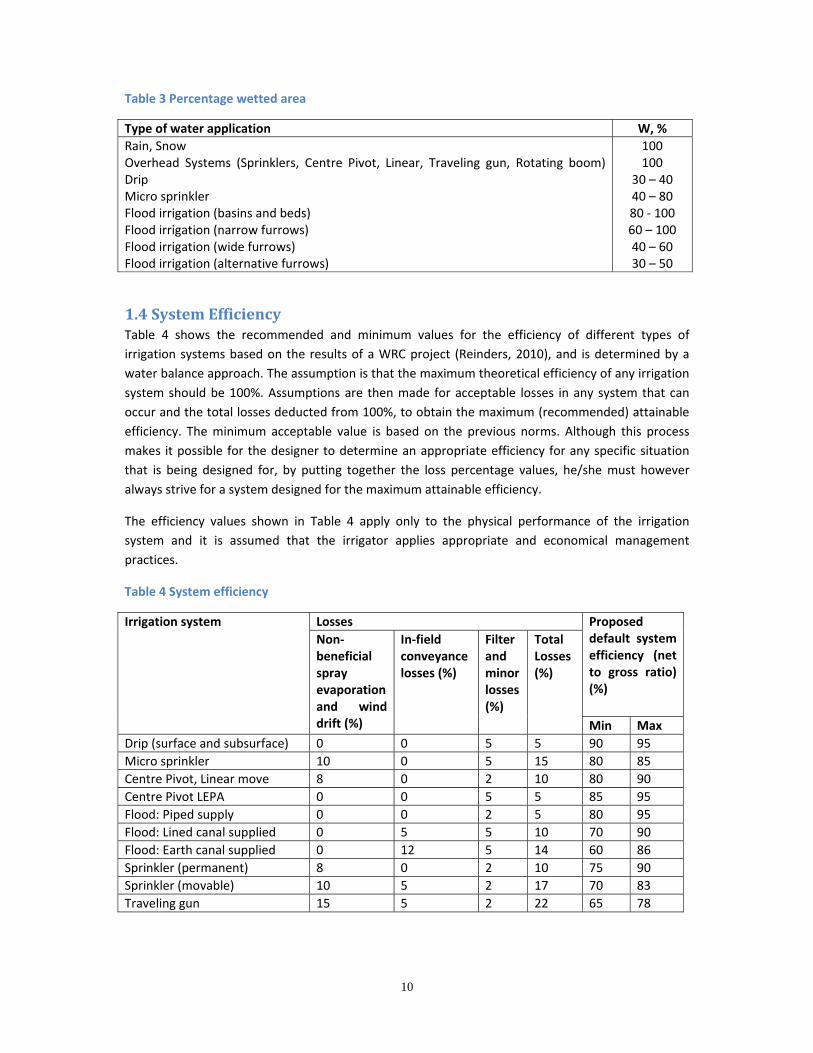
1.3PercentagewettedareaThe values for the percentage of area that an irrigation system wets (W), that can be used during the
planning process are displayed in Table 3. The values are based on data from FAO Publication nr 56
(Allen et al, 1998). In the case of drip irrigation, the lateral movement of water in the soil can be
assessed with an on‐site trial, and in the case of micro sprinklers, the wetted diameter of the specific
sprinkler can be obtained from a manufacturer’s catalogue to get a more accurate value.
10
Table 3 Percentage wetted area
Type of water application W, %
Rain, Snow Overhead Systems (Sprinklers, Centre Pivot, Linear, Traveling gun, Rotating boom) Drip Micro sprinkler Flood irrigation (basins and beds) Flood irrigation (narrow furrows) Flood irrigation (wide furrows) Flood irrigation (alternative furrows)
100100
30 – 40 40 – 80 80 ‐ 100 60 – 100 40 – 60 30 – 50
1.4SystemEfficiencyTable 4 shows the recommended and minimum values for the efficiency of different types of
irrigation systems based on the results of a WRC project (Reinders, 2010), and is determined by a
water balance approach. The assumption is that the maximum theoretical efficiency of any irrigation
system should be 100%. Assumptions are then made for acceptable losses in any system that can
occur and the total losses deducted from 100%, to obtain the maximum (recommended) attainable
efficiency. The minimum acceptable value is based on the previous norms. Although this process
makes it possible for the designer to determine an appropriate efficiency for any specific situation
that is being designed for, by putting together the loss percentage values, he/she must however
always strive for a system designed for the maximum attainable efficiency.
The efficiency values shown in Table 4 apply only to the physical performance of the irrigation
system and it is assumed that the irrigator applies appropriate and economical management
practices.
Table 4 System efficiency
Irrigation system Losses Proposed default system efficiency (net to gross ratio) (%)
Non‐beneficial spray evaporation and wind drift (%)
In‐field conveyance losses (%)
Filter and minor losses (%)
Total Losses (%)
Min Max
Drip (surface and subsurface) 0 0 5 5 90 95
Micro sprinkler 10 0 5 15 80 85
Centre Pivot, Linear move 8 0 2 10 80 90
Centre Pivot LEPA 0 0 5 5 85 95
Flood: Piped supply 0 0 2 5 80 95
Flood: Lined canal supplied 0 5 5 10 70 90
Flood: Earth canal supplied 0 12 5 14 60 86
Sprinkler (permanent) 8 0 2 10 75 90
Sprinkler (movable) 10 5 2 17 70 83
Traveling gun 15 5 2 22 65 78

11
1.5IrrigationhoursperweekThese values are used to determine the required system discharge. The norms recommended by
DWAF (1985) are accepted:
Micro and permanent sprinkler systems 144 hours Centre pivots systems 144 hours Moveable sprinkler and other movable systems 110 hours Flood irrigation systems 60 hours
It is also highly recommended that the ESKOM tariff structure applicable to the irrigation system is
taken into account when determining the number of hours available for irrigation per week.
1.6SurveyingandmappingThe map that will be used for the detailed design of the system should be drawn at an appropriate
scale and contour interval, and it should be based on accurate data so that the irrigation system is
designed correctly and all the design details can be legibly displayed.
1.6.1RecommendedcontourintervalsandscalesofmapsThe following scale and contour interval combinations are generally used:
Table 5 Recommended scales and contour intervals
Irrigation systems Contour interval Smallest scale
Micro irrigation (narrow row spacing: 3 m ) 0,5 m 1: 500
Micro irrigation (wide row spacing: > 3 m ) 1,0 m 1: 1 000
Sprinkler irrigation 1‐2 m 1: 2 000
Centre pivots 2‐5 m 1 : 5 000
Flood irrigation 0,5 m 1 : 1 000
1.6.2UseofGPSSystemsGlobal Positioning Systems (GPS) surveying is an evolving technology. As GPS hardware and
processing software are improved, new specifications will be developed and existing specifications
will be changed.
GPS receivers can be divided into the following three categories:
a) Recreational Grade GPS / GNSS
Recreational grade GPS receivers are the least expensive and the simplest to use of the three types.
These units have less functionality and are intended for recreational navigation uses. These units can
be expected to produce locations with accuracy of approximately 15‐30 meters. This grade of GPS is
not advisable for data collection for irrigation design purposes.
b) Mapping/Resource Grade GPS / GNSS

12
Mapping or Resource Grade GPS collect positions with accuracies between 0.5 and 5 meters with
differential corrections. These units have expanded functionality as well and can also record features
as points, lines and polygons. These units also allow for loadable feature libraries designed to
efficiently collect attribute information describing the feature.
c) Survey Grade GPS / GNSS
Survey grade GPS tools are intended for tasks requiring a very high degree of accuracy ‐ positions
determined by these receivers can be accurate to within less than a few centimeters. These systems
produce data of the highest horizontal and vertical positional accuracy. They are relatively expensive
and complex, requiring specialized training and dedicated staff to oversee its use.
The level of accuracy depends on the type of equipment you are using. In most cases for irrigation,
the mapping (resource) grade receivers are adequate as some mapping grade receivers are even
capable of sub‐meter accuracy and better, especially when differential correction is applied, real‐
time or as post‐processing.
The following guidelines for the selection of GPS equipment are proposed:
Table 6 Recommended GPS specifications
Minimum number of channels 12
Update rate 1 Hz
Correction Differential correction preferred
Accuracy At a 95% confidence index:
Moving systems: < 2.5 m
Sprinkler systems: < 1 m
Micro and flood irrigation systems: < 0.5 m
Antenna External
Operating temperature ‐20° C to + 60° C
Battery life Minimum 5 hours (8 hours preferred)
Protection
Enclosure: IP65 (dust proof and 1m water quick submersion)
Humidity: 100% sealed
Drop proof: Shock proof against 1m drop
The following user settings are recommended:
Minimum number of satellites 5
PDOP < 6
Satellite filter angle 15°
Signal to noise ratio (SNR) 6

13
2.Irrigationsystems
2.1Microsprinklerirrigation
2.1.1MinimumgrossapplicationrateThe application rate should be equal to or greater than 3 mm/h on the wetted area (Lategan, 1995).
Distribution tests can be done with the selected micro sprinkler on soils with poor water distribution
ability, to ensure that dry patches will not occur in the wetting area of the sprayer.
2.1.2DistributionUniformitya) Emitter uniformity approach
The following minimum emitter uniformity (EU) values are proposed:
Level terrain where slope < 2%: EU = 95%
Undulating terrain or slopes > 2%: EU = 90%
b) Conservative approach
The percentage emitter discharge variation should not exceed 10% of the design emitter discharge.
In the case of emitters with a discharge exponent of 0.5, this will result in a maximum allowable
pressure variation of 20% of the design pressure.
2.1.3FlowvelocityinlateralsA minimum flow velocity of 0,4 m/s at the lateral end point is required. (T‐Tape, 1998)
2.2DripIrrigation
2.2.1DistributionUniformitya) Emitter uniformity approach
The following emitter uniformity (EU) values are recommended for pressure sensitive drip emitters:
Table 7 Recommended EU Values of pressure sensitive drip irrigation systems
Emitter Type Number of emitters per
plant
Topography or slope EU (%)
Min Recommended
Point application ≥3 2% 90 95
Point application <3 2% 85 90
Point application ≥3 Undulating terrain or slope >2% 85 90
Point application <3 Undulating terrain or slope >2% 80 90
Line source All 2% 80 90
Line source All Undulating terrain or slope >2% 80 85

14
If the EU value of 90% cannot be obtained with pressure sensitive emitters, it is strongly
recommended that pressure compensating emitters should be used.
b) Conservative approach
The percentage emitter discharge variation should not exceed 10% of the design emitter discharge.
In the case of pressure sensitive emitters with a discharge exponent of 0.5, this will result in a
maximum allowable pressure variation of 20% of the design pressure.
c) Pressure compensating emitters
It is recommended that maximum allowable pressure variation (in m) will be within the following
safety limits:
Minimum design pressure = the minimum working pressure at which compensation takes
place as per the manufacturer + 3m
Maximum design pressure = the maximum working pressure at which compensation takes
place as per the manufacturer – 5m.
Should the safety limits provided here result in a very narrow pressure band (for example in the case
of thin‐walled drip laterals with a relatively low maximum working pressure), the limits can be
reduced after consulting with the manufacturer of the drippers.
2.2.2FlowvelocityinlateralsrequiredforeffectiveflushingThe following minimum flow velocity at the lateral end point is required (Netafim, 2013):
Good quality water: 0.4 m/s
Average quality water: 0.5 m/s
Poor quality water: 0.6 m/s
2.2.3FlushingoflateralsIf flushing manifolds are used, the pipe diameter of the laterals must be chosen correctly so that the
friction losses do not exceed 0.5m over the length of the manifold (Netafim, 2008).
2.2.4FlowvelocityinmanifoldsThe maximum allowable flow velocity in any section of the manifold should be 2 m/s (Keller &
Bliesner, 1990).
2.2.5SpecificmanagementsystemsThere are several variations of the use of drip irrigation for which specialist knowledge and
additional information can be obtained, for example:
Underground drip irrigation. The publication on “Engineering aspects of sub‐surface drip
irrigation systems” (Koegelenberg, F. 2005. ARC‐ Institute for Agricultural Engineers) can be
consulted.
Open Hydroponics Systems and pulse irrigation. This system requires additional flow due to
short irrigation times, and steps must be taken to keep water from draining from the system
15
between irrigation start‐ups. The Irrigation Design Manual of the ARC can be consulted for
any queries.
2.3SprinklerIrrigation
2.3.1SprinklerselectionThe operating pressure, sprinkler application, wetted diameter and spacing of the sprinklers all
influence the performance of the specific sprinkler and nozzle combination. The Christiansen’s
uniformity coefficient (CU) is used to determine the water application in a laboratory. The sprinkler
with the best CU value must be selected. The following norms for the selection of sprinklers based
on the laboratory‐tested CU values are recommended: (Keller, 1990):
CU 85% for vegetable crops 75% CU 85% for deep rooted crops e.g. lucern CU 70% for tree crops
When applying chemicals through the system, the CU should be 80%.
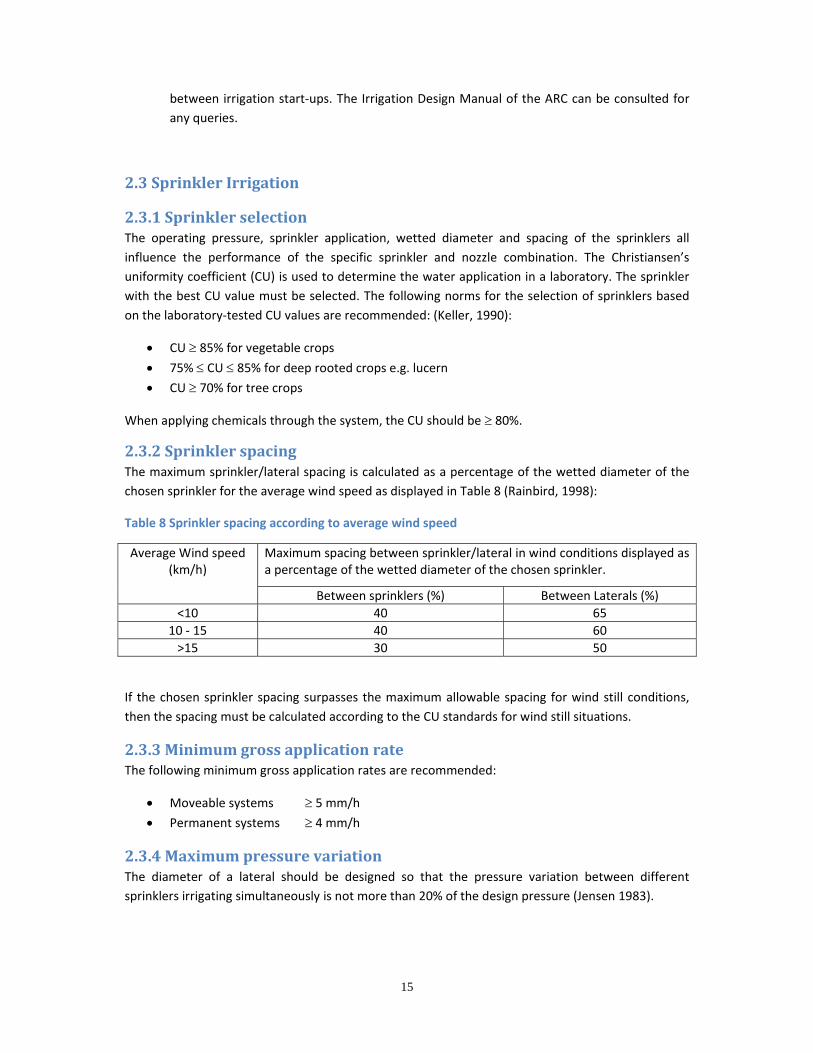
2.3.2SprinklerspacingThe maximum sprinkler/lateral spacing is calculated as a percentage of the wetted diameter of the
chosen sprinkler for the average wind speed as displayed in Table 8 (Rainbird, 1998):
Table 8 Sprinkler spacing according to average wind speed
Average Wind speed (km/h)
Maximum spacing between sprinkler/lateral in wind conditions displayed as a percentage of the wetted diameter of the chosen sprinkler.
Between sprinklers (%) Between Laterals (%)
<10 40 65
10 ‐ 15 40 60
>15 30 50
If the chosen sprinkler spacing surpasses the maximum allowable spacing for wind still conditions,
then the spacing must be calculated according to the CU standards for wind still situations.
2.3.3MinimumgrossapplicationrateThe following minimum gross application rates are recommended:
Moveable systems 5 mm/h
Permanent systems 4 mm/h
2.3.4MaximumpressurevariationThe diameter of a lateral should be designed so that the pressure variation between different
sprinklers irrigating simultaneously is not more than 20% of the design pressure (Jensen 1983).

16
2.4CentrePivot
2.4.1Maximumirrigationtimevs.soilinfiltrationrateThe design of a centre pivot should ensure that the application rate does not exceed the soil’s
infiltration rate, especially at the end of the machine.
2.4.2Christiansenuniformitycoefficient(CU)It is recommended that the CU as calculated by the supplier for the selected nozzle package should
be 95%. In the field a 85% CU value can be expected.
2.4.3Frictionthroughcentrepivot 3,6% (m/100m) of the total centre pivot length.
2.4.4Effectiveradiusofendgun50% of the wetted radius of the end gun.
2.5Travellingirrigators
2.5.1PressurevariationoverthelengthofthetravellingpathThe moving direction must be such that the pressure difference between the upper and lower ends
of a strip does not exceed 20% of the working pressure.
2.5.2SpeedvariationThe maximum speed variation allowed between the fastest and slowest speed is 10%.
2.5.3SiteIt is recommended that cross slopes over the strips be limited to less than 5% during system lay‐out.
A pressure regulator is recommended for travelling irrigators on steep slopes to ensure a constant
flow rate.
2.5.4FlowrateThe design flow rate must be increased by ± 2.5 m3/h to allow for driving water when a hydraulically
driven travelling irrigator is used. Confirmation of this value must be insured by the specific supplier.
2.5.5SprinklerchoiceThe type of sprinkler and pressure may be selected from the manufacturer's catalogue. Big gun
sprinklers with a high jet angle (> 23 degrees) are only recommended for low wind areas. The
following minimum working pressures are recommended to limit droplet size:
300 kPa for 12 mm nozzles
400 kPa for 14 mm and 16 mm nozzles
500 kPa for 18 mm and 20 mm nozzles
17
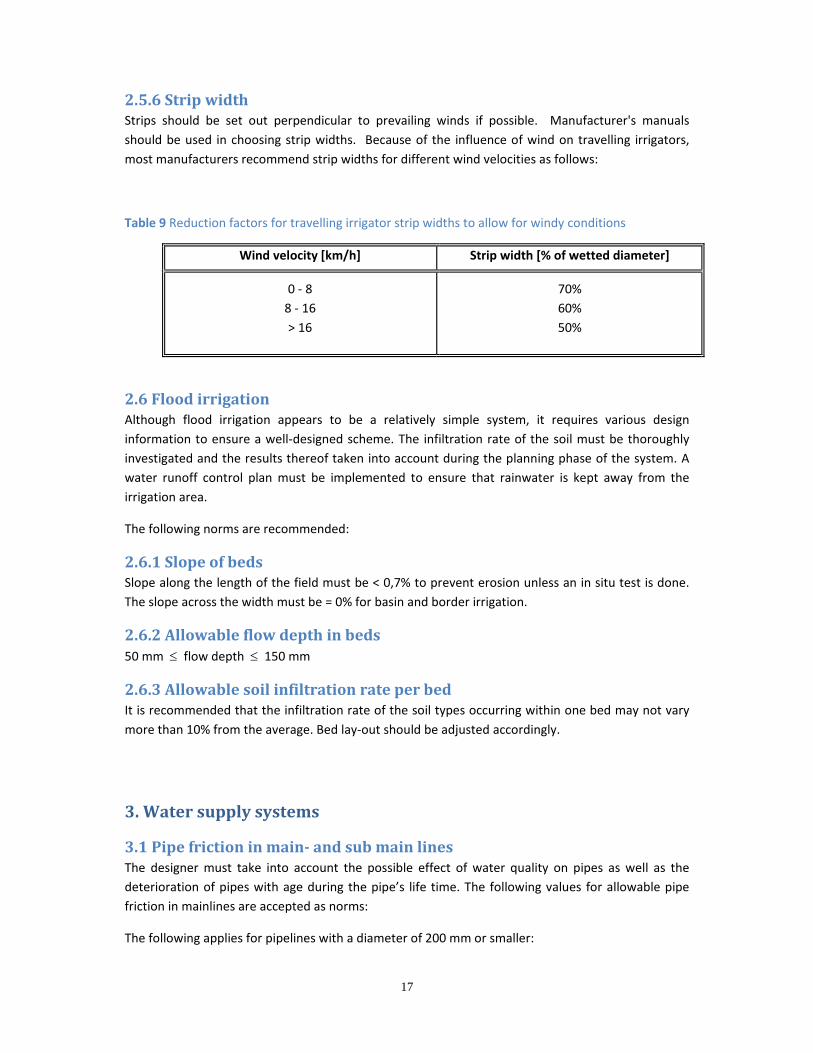
2.5.6StripwidthStrips should be set out perpendicular to prevailing winds if possible. Manufacturer's manuals
should be used in choosing strip widths. Because of the influence of wind on travelling irrigators,
most manufacturers recommend strip widths for different wind velocities as follows:
Table 9 Reduction factors for travelling irrigator strip widths to allow for windy conditions
Wind velocity [km/h] Strip width [% of wetted diameter]
0 ‐ 8
8 ‐ 16
> 16
70%
60%
50%
2.6FloodirrigationAlthough flood irrigation appears to be a relatively simple system, it requires various design
information to ensure a well‐designed scheme. The infiltration rate of the soil must be thoroughly
investigated and the results thereof taken into account during the planning phase of the system. A
water runoff control plan must be implemented to ensure that rainwater is kept away from the
irrigation area.
The following norms are recommended:
2.6.1SlopeofbedsSlope along the length of the field must be < 0,7% to prevent erosion unless an in situ test is done.
The slope across the width must be = 0% for basin and border irrigation.
2.6.2Allowableflowdepthinbeds50 mm flow depth 150 mm
2.6.3AllowablesoilinfiltrationrateperbedIt is recommended that the infiltration rate of the soil types occurring within one bed may not vary
more than 10% from the average. Bed lay‐out should be adjusted accordingly.
3.Watersupplysystems
3.1Pipefrictioninmain‐andsubmainlinesThe designer must take into account the possible effect of water quality on pipes as well as the
deterioration of pipes with age during the pipe’s life time. The following values for allowable pipe
friction in mainlines are accepted as norms:
The following applies for pipelines with a diameter of 200 mm or smaller:
18
Rising pipeline: Maximum friction loss = 1.5% (m/100m pipe length)
Gravity pipeline: Maximum allowable flow velocity of 3.0 m/s
If the above figures are exceeded, then the designer must show that the chosen pipe diameter’s
total cost (capital and annual running cost) have been optimized and is the best of the available
options.
For pipes with larger diameters, a full life cycle cost analysis (capital and annual running cost) is
recommended to find the most economical pipe sizes.
For all pipes, and especially in the case of diameters larger than 200 mm, the effect of water
hammer is critical and must be investigated and optimized. An adequate number of air valves must
be included in the design.
3.2ValvesThe size of the valves at the inlet of the irrigation system must be chosen according to the
manufacturer's recommendations for the specific application. In the absence of any
recommendations, the valve must be chosen so that the pressure loss through the valve under
normal operating conditions is less than 20 kPa.
3.3FiltersThe specification of filters is subject to any requirements stated by the manufacturer, for example
the minimum pressure or flow rate required for the backwash of filters.
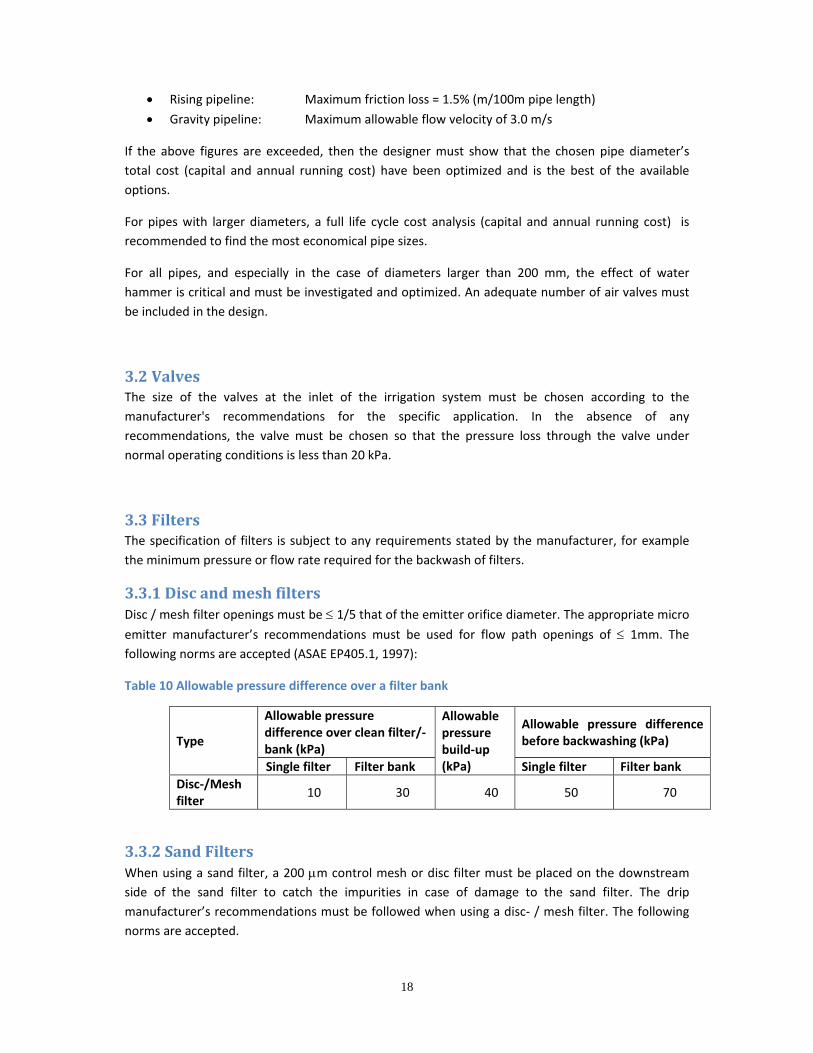
3.3.1DiscandmeshfiltersDisc / mesh filter openings must be 1/5 that of the emitter orifice diameter. The appropriate micro
emitter manufacturer’s recommendations must be used for flow path openings of 1mm. The
following norms are accepted (ASAE EP405.1, 1997):
Table 10 Allowable pressure difference over a filter bank
Type
Allowable pressure difference over clean filter/‐bank (kPa)
Allowable pressure build‐up (kPa)
Allowable pressure difference before backwashing (kPa)
Single filter Filter bank Single filter Filter bank
Disc‐/Mesh filter
10 30 40 50 70
3.3.2SandFiltersWhen using a sand filter, a 200 m control mesh or disc filter must be placed on the downstream
side of the sand filter to catch the impurities in case of damage to the sand filter. The drip
manufacturer’s recommendations must be followed when using a disc‐ / mesh filter. The following
norms are accepted.

19
a) Flow rate
The maximum allowable flow rate through a clean sand filter: Flow rate 50 m3/h per m2 of sand
surface area with an allowable pressure difference over the clean sand filter of 10 kPa. A minimum
of 50 % of the maximum filtration rate (50 m3/h per m2 sand surface area) is required to backwash
the filters (Burt & Styles, 1994). The maximum backwash rate must not exceed 1,2 times the
filtration rate.
b) Pressure difference
The allowable pressure difference over a sand filter with disc‐/ mesh filters: Allowable pressure
difference over a clean filter bank (including sand and disc filter) 40 kPa and over the filter bank before backwashing should be 60 kPa. When using a disc‐/ mesh filter, the allowable pressure
difference norms as described in section 3.3.1 must be complied with.
Table 11 Allowable pressure differences over sand filters
Type
Allowable pressure difference over clean filter/‐bank (kPa)
Allowable
pressure build‐up
(kPa)
Allowable pressure difference before backwashing (kPa)
Filter Filter bank Filter Filter bank
Sand filter 10 40 20 30 60
c) Outlet pressure during backwash
Minimum pressure during backwash of a sand filter: ≥200 kPa (Smith, 2010)
d) Sand specifications used in sand filters
Silica sand with a particle size that varies from 0.6 to 1.4mm, with an acceptable sand grading, is
recommended for sand filters. The recommended particle size grading must be 80 micron. A
filtration performance of ≥90% must be achieved under laboratory conditions.
3.4Designpumpcapacity(safetyfactorforwearandtear)These values are added to the calculated system capacity and are used to determine the duty point
(pressure and flow) when selecting a pump. The present norms are accepted:
Discharge 10%
Pressure head 5%
If fertilizers are pumped through the irrigation system then an additional 20% flow capacity can be
designed for in the system.
20
3.5AllowablevelocityinthesuctionpipeThe standard for the maximum velocity in a suction pipe is 1.5 m/s, but the ideal velocity is between
0.75 m/s and 1 m/s. Turbulence will take place if the velocity is too high, which will ultimately cause
cavitation in the system.
3.6PumpefficiencyAlthough a fixed minimum value for efficiency of a pump cannot be given, the designer must always
strive to choose the most efficient pump for the system.
It is recommended that a pump is selected for which the manufacturer can supply a test certificate,
tested according to ISO 1940‐1 Class 1 by the manufacturer.
It is furthermore recommended that the pump specified by the designer should meet the
requirements of ISO 9906 Class A, which means that it should perform in practice within ±5% of the
published pump curve (applicable to both centrifugal end‐suction and borehole pumps).
3.7MaximummotorpoweroutputThe correct selection of an electric motor will ensure that the motor is never overloaded. It is
therefore necessary to either select a motor with a power rating that is large enough for the selected
pump and impeller, or to make provision against overload by means of protection devices. Table 9
indicates norms for minimum power rating of an electric motor for specific output power if the
motor is selected according to the normal duty point (output power required).
Table 12 Minimum power rating of electric motors for certain output powers
Output Power [kW] ≤ 7,5 kW >7.5 kW
Minimum power rating of motor
Power requirement of the pump at the highest design duty point + 20% OR Maximum input power requirement of the pump as per the pump curve (overload point)
Power requirement of the pump at the highest design duty point. Overload protection essential
The reduction in the power rating of the motor, as set out in Table 17.4 and 17.5 of the Irrigation
Design Manual of the ARC‐IAE (2003 edition), must also be applied where necessary.
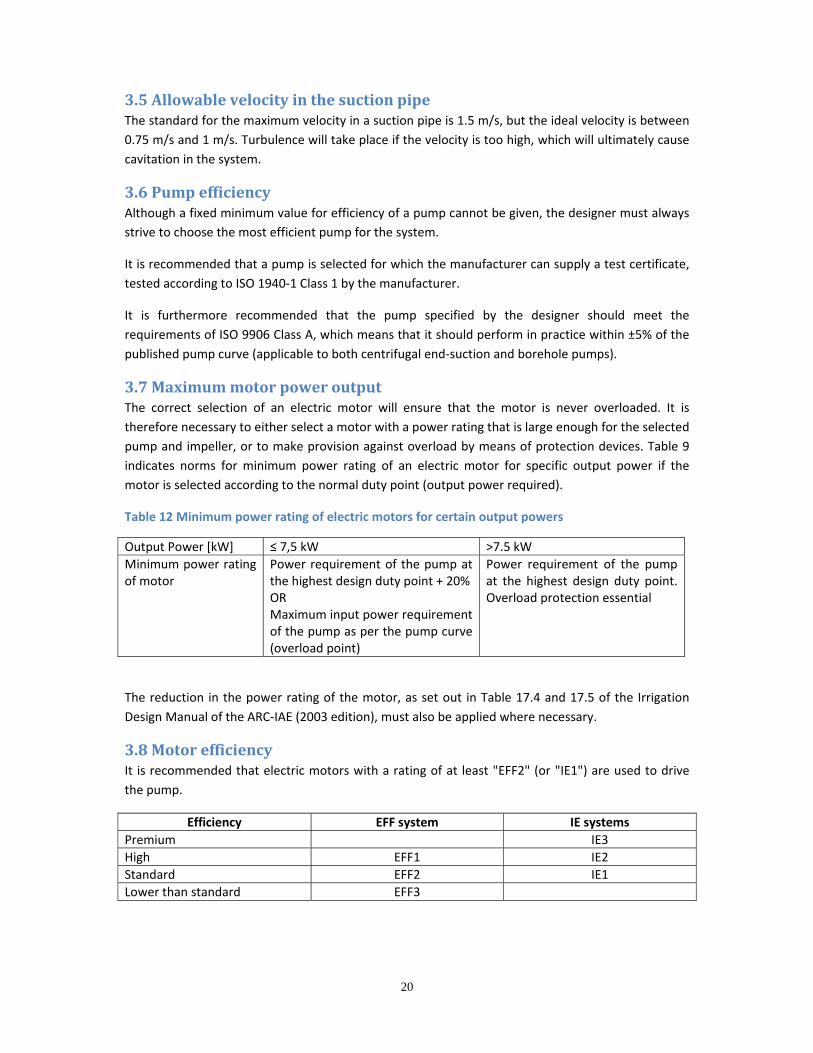
3.8MotorefficiencyIt is recommended that electric motors with a rating of at least "EFF2" (or "IE1") are used to drive
the pump.
Efficiency EFF system IE systems
Premium IE3
High EFF1 IE2
Standard EFF2 IE1
Lower than standard EFF3

21
3.9Variablespeeddrives(VSDs)The VSD’s main function is the ability to vary the speed of the motor it is connected to. In the case of
a centrifugal pump it is therefore possible with the VSD to use the same pump and impeller
combination to supply water at various flow rates and pressure heads (duty points) without
changing the impeller of the pump.
3.9.1General The basic principles of correct pump and motor design and selection apply at all times.
The integration of the VSD with the control system and automation of the irrigation system should be investigated in order to find the most appropriate and cost effective solution.
Alternative options should be considered first, such as cutting the impeller to the correct size and using soft starters, especially in the case of single duty point applications, as they can offer more cost effective solutions than the installation of a VSD.
The motor should be capable of delivering the required power of the pump at all the different duty points but should not be oversized.
If no other information is available, it is recommended that the supply frequency to the motor should not be less than 25 Hz and not be more than 60 Hz.
At very low frequencies, it may be necessary to install an auxiliary fan to the motor to ensure adequate cooling takes place.
The motor with which the VSD is to be used, should be rated VSD compatible according to the manufacturer.
The enclosure of the VSD to be used should have a suitable IP rating for the environment in which it is to be used (dust, moisture, etc.)
When more than one VSD is used in parallel, or if more than one pump is used per VSD, the designer should make sure that the pumps will operate in all cases without influencing one another negatively from a hydraulic perspective.
The integration of the VSD with the rest of the electrical system at the pump station must be assessed and if the situation requires it, the necessary electrical filters should be installed to protect all components of the system.
Before a VSD is supplied, the designer should ensure that support or maintenance services for the VSD are readily available in the area.
3.9.2TotallyEnclosedFanCooledMotors(TEFC)Motors Where running speeds are expected to exceed the normal 50Hz frequency levels, contact
the pump and motor manufacturers to find out if the proposed maximum running frequency of the motor is acceptable. Generally ≤ 60 Hz is accepted as the maximum but the manufacturer should confirm this.
The motor maximum kW (power rating) must not be exceeded when pumping at any given time but in particular when running at higher than normal speed (> 50 Hz).
It is generally advisable not to run the motor at a lower frequency than 25Hz for prolonged periods of time. If this is required, it is suggested that the motor manufacturer should be contacted to establish if the minimum running frequency of the motor can be decrease to below 25 Hz.
3.9.3Submersiblemotors See first two points under TEFC.
The minimum running frequency of a submersible motor will be determined by the minimum flow velocity across the motor, as stipulated by the motor manufacturer, as the flow also contributes to cooling of the motor.
22
The necessary precautions need to be taken to prevent prolonged periods of no flow through the pump as it may lead to the damage of the motor.
The maximum number of starts per day of the motor is as stated by the motor manufacturer.
The maximum current demand of a submersible motor is usually greater than the current demand of a TEFC motor of similar power rating. The VSD must be able to meet both the current and the power requirements of the motor.
3.9.4Electricalsupplyandconnection The maximum allowable cable length between the motor and the VSD as recommended by
the VSD manufacturer should be adhered to. This is of particular importance in the case of submersible motors. In general, it is recommended that all situations where the distance between the VSD and the motor is greater than 15 m, is investigated from a cable sizing perspective.
The earthing of the VSD and motor must be in accordance to the requirements of the VSD manufacturer.
If a VSD is used in conjunction with a generator, approval should be sought from both devices’ manufacturers that the generator and the VSD can be used together.

23
4.GreenhousesandTunnelsWhen an irrigation system is designed for greenhouses, it requires the precise application of water
as a high value crop is irrigated in a relatively small volume of growing media. The media must be
well drained and pulse irrigation should be possible. Each irrigation block must be provided with its
own mainline. The system must be equipped with anti‐drainage valves to ensure that the water
does not drain out of the system when it is switched off. Because of this it is recommended that the
pump house and valves are placed at the lowest point of the greenhouse. Provision should however
be made for the system to be flushed. The following norms are recommended:
4.1Cropwaterrequirement(mm/day)If a crop is grown in a soilless medium, there must be drainage due to leaching, for example if 33% of
drainage water is required, then the application rate must be 50% more to the crops.
Maximum daily demand (soilless medium in greenhouses):
Design for 6 ℓ/m²/day for plant consumption plus 3 ℓ/m²/day (33% leaching) = 9 ℓ/m²/day. If
more leaching is required, then the demand will increase.
Maximum hourly demand (soilless medium in greenhouses):
Design for 0.8 ℓ/m²/h for plant consumption plus 0.4 ℓ/m²/h (33% leaching) = 1.2 ℓ/m²/h. If
more leaching is required, then the demand will increase.
In the case of tunnels, the maximum daily demand can be increased to 10 mm/day (excluding any leaching requirements).
4.2OverheadirrigationChristiansen uniformity coefficient (CU): 95%
Gross application rate (GAR): 12mm/h ≤ GAR ≤18mm/h
4.3DripIrrigation Drip Spacing:
≤ 0.3m (Soilless medium)
≤ 0.4m (Soil medium)
Flush Velocity of laterals:
≥0.5 m/s is required at the end point of the lateral.
Mainline velocity:
≤3.5 m/s (pipe diameter > 50mm)
≤3 m/s (pipe diameter ≤ 50mm)
4.4Pipelines,PumpsandAccessories Friction losses through mainline:
≤ 1.5% (Maximum friction loss of longest section of the mainline)
≤ 2.2m/s (Maximum flow velocity in the rest of the mainlines)
Mainlines must be of such size that friction loss plus the static height combination for every mainline
must be approximately the same.
24
Velocity through filtration manifold: ≤3.2m/s
Velocity through pump house mainline: ≤3 m/s
All mainline equipment and accessories (water meters, control valves and reflux valves) should be
the same size as the mainlines.
Allowable velocity through suction pipe: ≤1 m/s (when whole system is in use)
4.5InstallationofdrainagepipesThe drain should be placed perpendicular to the direction dripper lines with a maximum drain
interval according to the slope
1% slope, draining pipe interval ≤ 20 m.
1.5% slope, draining pipe interval ≤ 25 m.
2% slope, draining pipe interval ≤ 30 m.
NOTE: The slope of the drainage pipe should not exceed the slope of the site area.
4.6Allowablegroundslopesingreenhouses Parallel gutters (dripper pipe direction):
Soilless medium: 1% <slope <2% Soil medium: 0.5% <slope <2%
Perpendicular to gutters: Soil less medium: 0.25 % < slope < 2 %. Soil medium: 0.5 % <slope < 2 %.
NOTE: Confirm with Greenhouse Manufacturers.

25
References
1. Allen, R.G., Pereira, L.S., Raes, D. and Smith, M. 1998. Crop evapotranspiration: Guidelines for computing crop water requirements. Irrigation and Drainage Paper nr 56. Food and Agricultural Organisation of the United Nations (FAO), Rome, Italy
2. Annandale, J.G. & Steyn, J.M., 2008. Irrigation scheduling strategies – when to turn on the pump. Department of Plant Production and Soil Science, University of Pretoria.
3. ASAE Standards. 1997. Design and installation of micro‐irrigation systems. ASAE EP405.1.
4. Austen, J. 2013. Personal communication. Netafim, South Africa.
5. Burger, J.H., P.J. Heyns, E. Hoffman, E.P.J. Kleynhans, F.H. Koegelenberg, M.T. Lategan, D.J. Mulder, H.S. Smal, C.M. Stimie, W.J. Uys, F.P.J. van der Merwe, I. van der Stoep & P.D. Viljoen. 2003. Irrigation Design Manual. ARC – Institute for Agricultural Engineering, Pretoria.
6. Chalmers, A. 2010. Personal communication. Irrigator Products. RSA.
7. De Leeuw Den Bouter, W. 2013. Personal communication. Farm Secure AgriScience, Somerset west.
8. De Witt, P. 2013. Personal communication. Limpopo Department of Agriculture, Polokwane.
9. Du Plessis, E. 2013. Personal communication. Grundfos, South Africa.
10. Du Toit, A. 2013. Personal communication. Netafim, South Africa.
11. Horn, L. 2010. Personal communication. Netafim. South Africa.
12. Jensen, M. E. 1983. Design and operation of farm irrigation systems. American Society of Agricultural Engineers. USA.
13. Keller, J. & Bleisner R.D. 1990. Sprinkler and trickle irrigation. USA.
14. Lategan, M. T. 1995. Personal communication. Department of Agriculture, Western Cape.
15. Netafim South Africa. 2010. Greenhouse Drip Irrigation Design Guide (version 2.00).
16. Olsen, G. 2013. Personal communication. Rhino Plastics, South Africa.
17. Rainbird. 1998. Agricultural Irrigation equipment guide. California. USA.
18. Reinders, FB 2010. Water use efficiency from dam wall release to root zone application. Water Research Commission, Report no TT 466/10, South Africa
19. Smit, W. 2008. Personal communication. Netafim, South Africa.
20. T‐Tape. Irrigation Training Seminar. Australia.
21. Vander Merwe, RJ. 2013. Personal communication. ARC‐IAE, Pretoria.

26
22. Van Niekerk, A. S, Koegelenberg F. H. en Reinders F. B. 2006. Guidelines for the selection, design, and use of various micro‐irrigation filters with regards to filtering and backwashing efficiency. WRC Report No. K5/1356/4. Water Research Commission. Pretoria. RSA.