north american neuro-ophthalmology society 36th annual meeting · 2010 annual meeting syllabus |...
TRANSCRIPT

2010 Annual Meeting Syllabus | 325
North American Neuro-Ophthalmology Society
36th Annual MeetingMarch 6-11, 2010 • JW Starr Pass Marriott Resort & Spa, Tucson, AZ
Educational Program Schedule
THURSDAY, MARCH 11 LOCATION
6:30 a.m. – 12:30 p.m. Registration Arizona Ballroom Foyer
6:30 a.m. – 7:30 a.m. Continental Breakfast Arizona Salon
8:30 a.m. – 10:30 a.m. Spouse/Guest Hospitality Suite Signature Grill
7:30 a.m. - 9:30 a.m. OCT IN NEURO-OPHTHALMOLOGY PRACTICE [2 CME] Arizona Salons 1-6
Moderators: Laura J. Balcer, MD, MSCE and Fiona Costello, MD
This half-morning symposium will review the current knowledge concerning the use of
optical coherence tomography (OCT) in patients with neuro-ophthalmologic disorders.
The session will discuss the history of OCT and the evolution of the underlying technology.
The currently available and future equipment will be discussed and evaluated. The
evidence regarding the use of OCT in the diagnosis and follow/up of optic neuritis,
chiasmal lesions, multiple sclerosis and other neurologic diseases will be reviewed.
A perspective on the clinical utilization of OCT drawing on experience from its place in
glaucoma management will be presented. The potential of OCT for monitoring possible
neuro-protective treatment of optic nerve and macular disease will be reviewed.
At the conclusion of the symposium, the attendees should be able to: 1) Describe the
principle of OCT and the forms of equipment available to perform the test; 2) Discuss the
currently available evidence about the use of OCT in evaluating optic neuritis, MS, chiasmal
lesions, and other neuro-ophthalmologic disorders; 3) Explain the lessons available from
the use of OCT in management of glaucoma; and 4) Discuss the potential use of OCT in
monitoring the effects of therapy of anterior visual pathway disease, including
neuroprotective agents.PAGES
7:30 a.m. – 7:50 a.m. OCT Technologies: Past, Present, and What’s New? - Joel Schuman, MD 327
7:50 a.m. – 8:10 a.m. OCT in Neurologic Disease - Eric Eggenberger, DO, MSEpi 335
8:10 a.m. – 8:30 a.m. Lessons from Glaucoma: Use of OCT in the Clinic and Trials - Joel Schuman, MD 343
8:30 a.m. – 8:50 a.m. Linking Axons and Neurons: Unveiling Mysteries of the Macula and 369
Modeling Neuroprotection - Randy Kardon, MD, PhD
8:50 a.m. – 9:05 a.m. Platform Presentation: Ganglion Cell Layer Volume by Spectralis Optical Coherence 375
Tomography (OCT) in Multiple Sclerosis - Emma Davies, MD
9:05 a.m. – 9:20 a.m. Evidence Meets Practice: Take-Home Points on OCT - Thomas Hedges, III, MD 377
9:20 a.m. – 9:30 a.m. Questions and Discussion
9:30 a.m. – 10:00 a.m. Coffee Break

326 | North American Neuro-Ophthalmology Society
LOCATION
10:00 a.m. – 12:00 p.m. THYROID EYE DISEASE UPDATE [2 CME] Arizona Salons 1-6
Moderators: Steven Feldon, MD and Madhu Agarwal, MD
This course will review the latest concepts in the evaluation and treatment of the often
vexing disease process of thyroid orbitopathy. The immunology of the condition as well as
potential new treatments and their indications will be discussed. Speakers will further
discuss newer modalities for assessing disease progression, evaluating strabismus, and
surgical and pharmacologic treatment options. A panel discussion will consider these
topics, as well as the potential for clinical trial in this area.
At the conclusion of the symposium, the attendees should be able to: 1) Understand the
latest diagnostic and assessment tools for thyroid eye disease; and 2) Discuss both
medical and surgical treatment options.PAGES
10:00 a.m. – 10:30 a.m. Immunology of Thyroid Eye Disease: New Treatments on the Horizon? - 383
Raymond Douglas, MD, PhD
10:30 a.m. – 10:50 a.m. Objective Markers for Thyroid Eye Disease (TED) Activity, Severity 387
and Progression - Kim Cockerham, MD, FACS
10:50 a.m. – 11:20 am. Surgical Techniques for Anatomic Restoration - Raymond Douglas, MD, PhD 391
11:20 a.m. – 11:40 a.m. Ocular Motility in Thyroid Eye Disease –Evaluation and Surgery - 395
Steven Feldon, MD
11:40 a.m. – 12:00 p.m. Panel Discussion: Impediments to Formulating a Meaningful Clinical Trial
12:00 p.m. Meeting adjourns
2010 Annual Meeting Syllabus | 327
LEARNING OBJECTIVES• The attendee will be able to describe the basic
principles of optical coherence tomography.
• The attendee will be able to explain how OCT can be
used in the detection of ocular diseases.
• The attendee will be know the utility and potential
utility of OCT in the assessment of longitudinal change
in diseases of the eye.
CME QUESTIONS AND ANSWERS1. What is the basic physical principle underlying optical
coherence tomography (OCT)?
2. How can OCT be used to detect eye disease, and is
there any evidence that it can do so?
3. How can OCT be used to assess change over time in
eye disease?
KEY WORDS• Optical Coherence Tomography (OCT)
• Optic Nerve Head (ONH)
• Retinal Nerve Fiber Layer (RNFL)
• Macula
• Ganglion Cell Complex (GCC)
Supported in part by National Institutes of Health
contracts R01-EY13178-10, R01-EY11289-24, and
P30-EY08098-21 (Bethesda, MD), The Eye and Ear
Foundation (Pittsburgh, PA), and unrestricted grants from
Research to Prevent Blindness, Inc. (New York, NY).
Corresponding Author: Joel S. Schuman, MD, UPMC
Eye Center, Eye and Ear Institute, Department of
Ophthalmology, University of Pittsburgh School of
Medicine, 203 Lothrop Street, Suite 816, Pittsburgh, PA
15213; [email protected].
Conflict of Interest Statement: Dr. Schuman receives
royalties for intellectual property licensed by
Massachusetts Institute of Technology to Carl Zeiss
Meditec. Dr. Wollstein received research funding from
Carl Zeiss Meditec and Optovue. Dr. Schuman received
honoraria from Carl Zeiss Meditec, Heidelberg Engineering
and Optovue. Ms. Gabriele reports no conflicts.
INTRODUCTIONThe development of optical coherence tomography (OCT)
began with a team comprised of clinician-scientists and
a physicist at Massachusetts Eye and Ear Infirmary (MEEI),
Harvard University and engineers at the Massachusetts
Institute of Technology (MIT). Remarkably, one member
of this group was a graduate student, one a postdoctoral
fellow, and another was a predoctoral fellow. OCT actually
began as optical coherence domain ranging (OCDR),
essentially a single A-scan in what we now know as OCT.
OCDR was being developed by James Fujimoto and
Carmen Puliafito for corneal ranging. Joel Schuman was
a fellow in Puliafito’s laser laboratory at MEEI and David
Huang an MD, PhD student in the Harvard-MIT Health
Sciences Technology (HST) program, working in Fujimoto’s
laboratory at MIT. Eric Swanson was an engineer at MIT-
Lincoln Laboratories, Charles Lin a physicist in Puliafito’s
lab and William Stinson a preresidency fellow working in
Puliafito’s lab as well. These seven people were the key
persons involved in the development of this technology.
Joel Schuman, while working on other projects in the laser
laboratory, became aware of the OCDR corneal ranging
target. It occurred to Schuman that the near infrared
wavelength of OCDR would be able to safely measure
retinal thickness, and would perhaps be useful for
measuring retinal layers. After discussing this idea with
Puliafito, Schuman pursued the concept together with
Fujimoto and Huang. Schuman, Huang, Lin and Stinson
did the very first retinal ranging experiments in James
Fujimoto’s laboratory at MIT.
David Huang, while an MD-PhD student, had the insight
that an OCDR A-scan was similar to an ultrasound A-scan,
and that creating a tomographic cross-sectional image
similar to an ultrasound B-scan would be possible. The
technology was refined to create tomography, and was
renamed Optical Coherence Tomography (OCT). In 1991
the first scientific paper regarding OCT was published,
describing the use of an optical detection technique called
low coherence interferometry to acquire cross-sectional
images of the peripapillary region of the human retina ex
vivo.1 Low coherence tomography refers to the detection
of light that has been split, reflected off of an object of
interest and a reference mirror and recombined. This
recombination produces an interference pattern with an
amplitude proportional to the reflectivity of the
corresponding location (same optical path length) within
tissue of interest. Individual axial scans, or A-scans, are
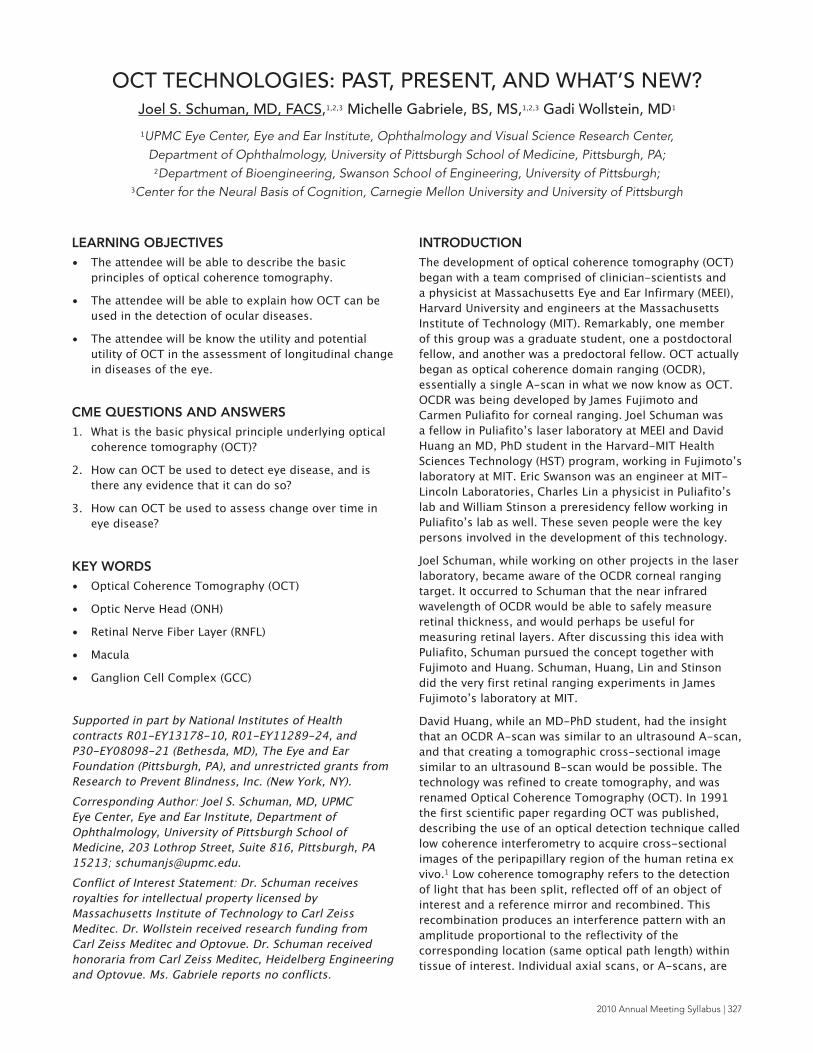
OCT TECHNOLOGIES: PAST, PRESENT, AND WHAT’S NEW? Joel S. Schuman, MD, FACS,1,2,3 Michelle Gabriele, BS, MS,1,2,3 Gadi Wollstein, MD1
1UPMC Eye Center, Eye and Ear Institute, Ophthalmology and Visual Science Research Center, Department of Ophthalmology, University of Pittsburgh School of Medicine, Pittsburgh, PA;
2Department of Bioengineering, Swanson School of Engineering, University of Pittsburgh; 3Center for the Neural Basis of Cognition, Carnegie Mellon University and University of Pittsburgh

328 | North American Neuro-Ophthalmology Society
acquired at a given location in tissue and correspond to a
reflectivity profile in depth. Multiple neighboring A-scans
can be acquired to build up a B-scan that represents an
optical cross-section of the tissue.
OCT was described in vivo in 19932 and quickly used in
human subjects as a research tool to investigate retinal
and glaucomatous abnormalities.3-6 During this time the
technology was transferred to industry. The OCT patent
was granted in 1994 to Fujimoto, Huang, Lin, Puliafito,
Schuman and Swanson, and was licensed by what is now
Carl Zeiss Meditec, Inc. (Dublin, CA), allowing the creation
of a device that could be broadly used for patient care.
The first commercial system became available in 1996
and was a time-domain OCT system (TD-OCT). This
means A-scans are acquired by moving the
interferometer’s reference mirror, which changes the
reference path length and enables the detection
reflectivity from different depths in a given structure.
Hence, in TD-OCT imaging, the time of flight of the light
reflected from the retinal structures determines the OCT
measurements. The commercial time-domain OCT system
has an axial resolution of approximately 10μm.
The first commercial two iterations of OCT were not
particularly successful, in part because of the novelty of
the technology, but also because systems were big, slow
and difficult to use. This changed in 2002 with the
introduction of Stratus OCT. The Stratus system acquired
400 A-scans per second, compared with 100 per second
in prior versions. Stratus OCT also had a normative
database, making clinical use considerably more practical,
and the system was now ergonomically designed. Finally,
a billing code for scanning computerized ocular diagnostic
imaging was introduced around the time that Stratus came
to market. All of these factors contributed to the rapid
adoption of the technology; by 2008 10,000 OCT devices
were in worldwide clinical use.
OCT underwent further evolution with the clinical
availability in 2006 of spectral-domain OCT (SD-OCT).7-11
SD-OCT introduced in 2006 was 40-60 times faster than
TD-OCT, allowing the collection of large amounts of
clinical data, permitting increased scan densities and three
dimensional imaging. SD-OCT refers to the measurement
of tissue thickness using not time of flight but reflected
wavelengths (frequencies). Using SDOCT, an entire A-scan
can be collected simultaneously, and the optical
frequencies analyzed using fast Fourier transformation
and mathematical algorithms to create a tomographic
image and determine depth information, converting from
the frequency domain to the time domain. Because optical
frequencies from different depths are detected at once
and used to determine the spatial locations of reflections
in the A-scans, a moving reference mirror is not required:
conversion from the frequency domain to the time domain
occurs after acquisition. This means SD-OCT systems can
acquire A-scans much faster than time-domain systems.
SD-OCT systems have recently been commercialized by
several companies, and most of these systems have an
axial resolution of approximately 3.5 - 6μm and
acquisition speeds of 24,000 - 55,000 A-scans per
second. Axial resolution improvements in these systems
can be attributed to broader bandwidth light sources.
HEALTHY EYESThis section provides representative ocular OCT images,
both time-domain and spectral domain, from healthy
subjects. Figure 1a shows a representative SD-OCT image
through the macular region of a healthy subject, while the
Figure 1b shows a representative TDOCT image from the
same subject. Note that the time-domain image contains
128 Ascans and the SD-OCT image contains 1000 A-
scans; however, the TD-OCT image required 0.32 seconds
to acquire, while the SD-OCT image, with eight times
more Ascans, took 0.04 seco
Figure 2 shows spectral domain (left panel) and time-
domain (right panel) OCT retinal nerve fiber layer (RNFL)
assessments. With time-domain devices, a 3.4-mm
circular scan centered on the optic nerve head (ONH) is
used to assess peripapillary RNFL thickness. Typically,
three OCT scans (with 256 A-scans per scan) are acquired
in succession, the RNFL is segmented, and thickness
measurements along the scan are compared to a
normative database. Using spectral-domain three-
dimensional tissue volumes from around the optic nerve,
one can reconstruct the RNFL peripapillary scan by
resampling the tissue volume along a 3.4 mm circle
centered on the ONH. An extracted RNFL scan can be seen
in Figure 2, bottom left. Above it, an RNFL thickness
overlay on a normative database is shown along with
clock-hour and quadrant RNFL thickness measurements.
One peripapillary TD-OCT scan, with RNFL segmentation
(white line), is shown in Figure 2, bottom right. Above it
lie the normative database with an overlay of RNFL
thickness and clock-hour and quadrant RNFL thickness
measurements.
FIGURE 1: (a) Vertical SD-OCT cross-section through the maculaof the same subject. The white box with vertical line indicatesthe orientation of SD-OCT image. (b) Vertical TDOCTcross-section through the macula.
a b

2010 Annual Meeting Syllabus | 329
In SD-OCT , after multiple B-scans are acquired in raster
fashion and a three-dimensional volume of tissue is
acquired, en-face (OCT fundus) images can be generated
by summing intensity values along the z-direction (in
depth). An example SD-OCT fundus image through the
macular region of a healthy subject is seen in Figure 3.
When three-dimensional tissue volumes have been
acquired around the optic nerve head region using
SD-OCT , RNFL thickness maps can be created by
segmenting the RNFL in each frame of the volume,
excluding the optic nerve head region. This provides easy
visualization of areas of thinning around the optic nerve.
Example RNFL thickness maps from a healthy subject can
be seen in Figure 4.
In addition to posterior segment imaging, images of the
cornea and anterior chamber can be acquired with OCT.
Figure 5 shows a horizontal TD-OCT image through the
cornea of a healthy subject. Figure 6 shows an anterior
chamber TD-OCT image from the same subject.
FIGURE 2: (Left) SD-OCT RNFL thickness clock-hour andquadrant measurements (top), comparison to normativedatabase (middle), and resampled 3.4-mm RNFL B-scan(bottom). (Right) TD-OCT RNFL thickness measurements (top),comparison to normative database (middle) and 3.4-mm RNFLperipapillary scan (bottom). Both images were acquired fromthe same subject, same day.
FIGURE 3: SD-OCT fundus image of the macular region of theleft eye of a healthy subject, created by taking the sum of thereflections along the direction of each individual A-scans in the200 x 200 A-scan volume. This creates a picture-like image dueto the total reflection at each scan location being viewed in theen-face composite, much the same as in a photograph.
FIGURE 4: RNFL thickness map of the left eye of a healthysubject created from a 200 x 200 A-scan scanning (6 x 6 mm)of the optic nerve head region. Thicker areas are red andthinner areas are blue. The uniform blue area towards thecenter of each map indicates the optic nerve head region,where no thickness measurements are made.
FIGURE 5: TD-OCT image through the cornea of ahealthy subject.
FIGURE 6: TD-OCT image through the anteriorchamber of a healthy subject.

330 | North American Neuro-Ophthalmology Society
GLAUCOMAA 58-year-old woman with a history of primary open
angle glaucoma presented with an IOP of 30 in the right
eye (VA 20/20). Visual field testing showed a superior
arcuate defect, with a glaucoma hemifield test outside
normal limits, mean deviation of -1.25 dB, and pattern
standard deviation of 4.37 dB (Figure 7). Widespread
inferior nerve fiber layer thinning can be seen in the
SD-OCT RNFL thickness map (Figure 8). Figure 9, top,
shows clock hour and quadrant thicknesses from SD-OCT
(left panel) and TD-OCT (right panel). A comparison to a
normative database is shown below the segment
measurements. Both spectral- and time-domain
measurements show inferior thinning of the RNFL, as
indicated by red quadrant and clock hour segments.
Looking at individual spectral- domain and time domain
OCT cross sections (bottom left and bottom right,
respectively), thinning of the RNFL can be seen (arrows).
Note that the white line outlining the RNFL in the time-
domain image indicates segmentation of the RNFL; this
line is not present in the spectral-domain image. In
addition, the spectral-domain image has not been
flattened using image filtering techniques while the
time-domain image has.
AGE-RELATED MACULAR DEGENERATIONFigure 10 shows a fundus photograph and slow macular
(512 A-scans) TD-OCT scan from an 84-year-old female
with exudative age-related macular degeneration; she had
with 20/40 vision in the right eye. Drusen and RPE
changes were noted upon clinical examination. The
fundus photograph (Figure 10a) shows numerous drusen
in the macular region. Similarly, irregularities in the RPE
can be seen in the horizontal OCT crosssection though the
macular region (Figure 10b, arrows).
FIGURE 7: Visual field test showing a superior arcuatedefect from a patient with primary open angle glaucoma.
FIGURE 8: RNFL thickness map of patient with primary openangle glaucoma showing inferior thinning of the RNFL (mapcreated from 200 x 200 A-scans, 6x6 mm region around theoptic nerve head). The uniform blue region towards thecenter of the image represents the optic nerve head whileblack region is the result of RNFL detection algorithm failure.
FIGURE 9: (Left) SD-OCT RNFL thickness clock-hourand quadrant measurements (top), comparison tonormative database (middle), and resampled 3.4-mmRNFL B-scan (bottom) in patient with primary openangle glaucoma and inferior RNFL loss. (Right) TD-OCTRNFL thickness measurements (top), comparison tonormative database (middle) and 3.4-mm RNFLperipapillary scan (bottom). Both images wereacquired from the same subject, same day.
FIGURE 10: (a) Fundus photograph of age-related macular degeneration patient withdrusen (b) Horizontal TD-OCT scan (512 A-scans).Arrows indicate areas that are likely drusen.
a b
a
b

2010 Annual Meeting Syllabus | 331
MACULAR HOLEA 72-year-old male presented with a distorted vision in
the right eye (VA 20/200) and 20/50 vision in the left eye.
Both spectral-domain and TD-OCT images showed a large
macular hole in the right eye with posterior hyaloid
partially attached to edge of the hole (Figure 11, spectral-
domain horizontal and vertical cross-sections on left and
timedomain horizontal and vertical cross-sections on
right). Small cystoid changes with a vitreous traction were
seen in the left eye along with posterior hyaloid traction in
the foveal center (Figure 12). Three-dimensional
reconstructions of the thickness maps of the macular
region are also shown (Figure 11 and 12, top) and were
created by segmenting three-dimensional data volumes
(200 x 200 A-scans in a 6 x 6 mm region of the retina)
from the ILM to the RPE. The blues lines on each thickness
map correspond to the location of the horizontal spectral-
domain cross-sections (1000 A-scans each), while the
purple lines correspond to the location of vertical cross-
sections (1000 A-scans).
BRANCH RETINAL VEIN OCCLUSIONFigure 13a shows a late-phase angiograph from an
82-year-old male with branch retinal vein occlusion in the
right eye. He presented with a visual acuity of 20/400 and
clinical examination showed hemorrhage and macular
edema in the right eye. A slow macular (512 A-scans)
horizontal TD-OCT image showed clinically significant
macular edema (Figure 13b).
MACULAR PUCKERA 60-year-old woman with 20/70 vision in the left eye
showed a pronounced epiretinal membrane with posterior
vitreous detachment. A three-dimensional reconstruction
of the macular thickness map illustrates the extent of
macular puckering (Figure 14a). The epiretinal membrane
can be seen in individual horizontal spectral-domain
(Figure 14b) and time-domain (Figure 14c) OCT images
(arrows).
FIGURE 11: Right eye (Top) Three-dimensional reconstruction ofmacular region showing foveal thickening (red) that correspondsto the location of a macular hole and corresponding edema(Middle and Bottom, left) Horizontal and vertical SD-OCT (1000A-scans) cross-sections through the macular hole (Middle andBottom, right) Horizontal and vertical TD-OCT (512 A-scans)cross-sections through the macular hole.
FIGURE 12: Left eye. (Top) Three-dimensional reconstruction of macular region showing slight foveal thickening (green) thatcorresponds to the location of small cystoids changes(Middle and Bottom, left) Horizontal and vertical SD-OCT (1000 A-scans) crosssections through the macular (Middle andBottom, right) Horizontal and vertical TDOCT (512 A-scans)cross-sections through the macula.
FIGURE 13: (a) Late-phase angiograph showing branch retinalvein occlusion (b) Horizontal TD-OCT image (512 A-scans)through the macular region showing edematous changes.
FIGURE 14: (a) Three-dimensional reconstruction of macularregion showing macular puckering (b) Horizontal SD-OCT (1000A-scans) and (c) time-domain (512 A-scans) OCT images throughthe macula, with arrows indicating epiretinal membrane.
a
b
a
b
c
332 | North American Neuro-Ophthalmology Society
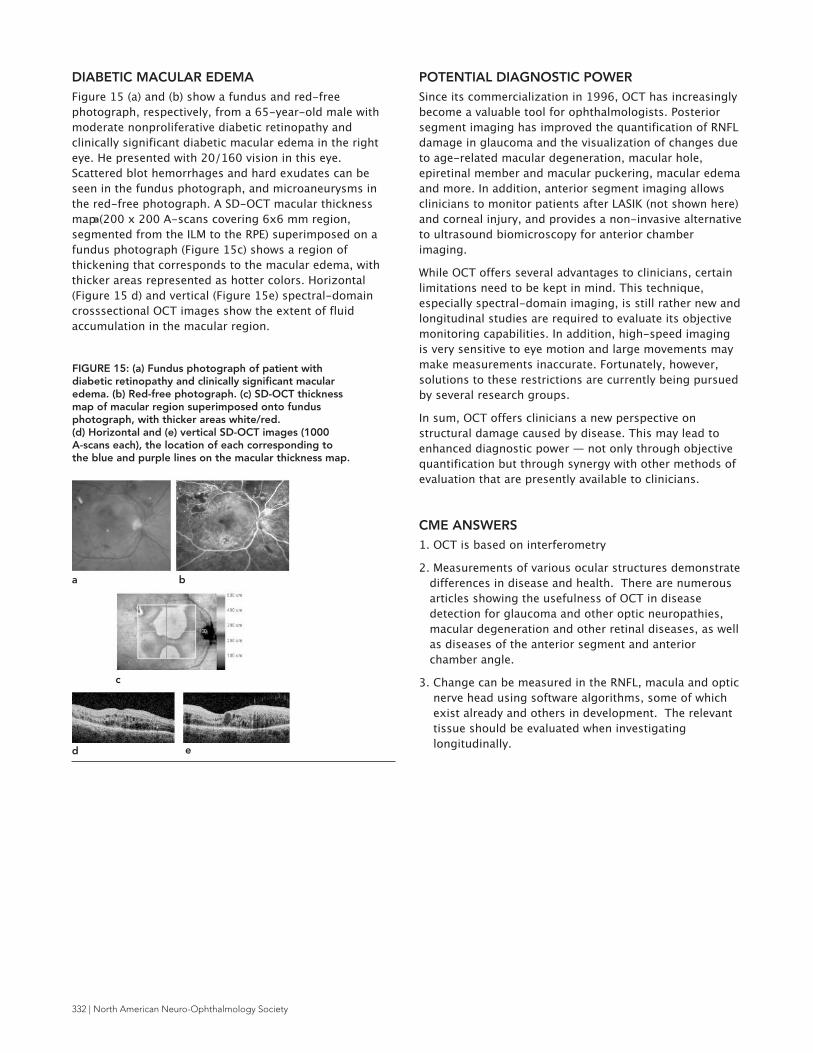
DIABETIC MACULAR EDEMAFigure 15 (a) and (b) show a fundus and red-free
photograph, respectively, from a 65-year-old male with
moderate nonproliferative diabetic retinopathy and
clinically significant diabetic macular edema in the right
eye. He presented with 20/160 vision in this eye.
Scattered blot hemorrhages and hard exudates can be
seen in the fundus photograph, and microaneurysms in
the red-free photograph. A SD-OCT macular thickness
map (200 x 200 A-scans covering 6x6 mm region,
segmented from the ILM to the RPE) superimposed on a
fundus photograph (Figure 15c) shows a region of
thickening that corresponds to the macular edema, with
thicker areas represented as hotter colors. Horizontal
(Figure 15 d) and vertical (Figure 15e) spectral-domain
crosssectional OCT images show the extent of fluid
accumulation in the macular region.
POTENTIAL DIAGNOSTIC POWERSince its commercialization in 1996, OCT has increasingly
become a valuable tool for ophthalmologists. Posterior
segment imaging has improved the quantification of RNFL
damage in glaucoma and the visualization of changes due
to age-related macular degeneration, macular hole,
epiretinal member and macular puckering, macular edema
and more. In addition, anterior segment imaging allows
clinicians to monitor patients after LASIK (not shown here)
and corneal injury, and provides a non-invasive alternative
to ultrasound biomicroscopy for anterior chamber
imaging.
While OCT offers several advantages to clinicians, certain
limitations need to be kept in mind. This technique,
especially spectral-domain imaging, is still rather new and
longitudinal studies are required to evaluate its objective
monitoring capabilities. In addition, high-speed imaging
is very sensitive to eye motion and large movements may
make measurements inaccurate. Fortunately, however,
solutions to these restrictions are currently being pursued
by several research groups.
In sum, OCT offers clinicians a new perspective on
structural damage caused by disease. This may lead to
enhanced diagnostic power — not only through objective
quantification but through synergy with other methods of
evaluation that are presently available to clinicians.
CME ANSWERS1. OCT is based on interferometry
2. Measurements of various ocular structures demonstrate
differences in disease and health. There are numerous
articles showing the usefulness of OCT in disease
detection for glaucoma and other optic neuropathies,
macular degeneration and other retinal diseases, as well
as diseases of the anterior segment and anterior
chamber angle.
3. Change can be measured in the RNFL, macula and optic
nerve head using software algorithms, some of which
exist already and others in development. The relevant
tissue should be evaluated when investigating
longitudinally.
FIGURE 15: (a) Fundus photograph of patient withdiabetic retinopathy and clinically significant macularedema. (b) Red-free photograph. (c) SD-OCT thicknessmap of macular region superimposed onto fundusphotograph, with thicker areas white/red. (d) Horizontal and (e) vertical SD-OCT images (1000 A-scans each), the location of each corresponding tothe blue and purple lines on the macular thickness map.
a
a b
c
d e

2010 Annual Meeting Syllabus | 333
REFERENCES1. Huang D, Swanson EA et al. Optical coherence tomography.
Science. 1991; 254(5035): 1178-81.
2. Fercher AF et al. In vivo optical coherence tomography. Am J
Ophthalmol. 1993;116(1):113-4.
3. Schuman JS, Hee MR, Arya AV, Pedut-Kloizman T, Puliafito CA,
Fujimoto JG, Swanson EA.Optical coherence tomography: a
new tool for glaucoma diagnosis. Curr Opin Ophthalmol.
1995;6(2):89-95.
4. Puliafito CA, Hee MR, Lin CP, Reichel E, Schuman JS, Duker JS,
Izatt JA, Swanson EA, Fujimoto JG. Imaging of macular
diseases with optical coherence tomography. Ophthalmology.
1995;102(2):217-29.
5. Hee MR, Puliafito CA, Wong C, Duker JS, Reichel E, Schuman
JS, Swanson EA, Fujimoto JG. Optical coherence tomography
of macular holes. Ophthalmology. 1995 May;102(5):748-56.
6. Hee MR, Puliafito CA, Duker JS, Reichel E, Coker JG, Wilkins JR,
Schuman JS, Swanson EA, Fujimoto JG. Topography of diabetic
macular edema with optical coherence tomography.
Ophthalmology. 1998;105(2):360-70.
7. Leitgeb R, Wojtkowski M, Kowalczyk A, Hitzenberger CK,
Sticker M, Fercher AF. Spectral measurement of absorption by
spectroscopic frequency-domain optical coherence
tomography. Opt Lett. 2000;25(11):820-2.
8. de Boer JF, Cense B, Park BH, Pierce MC, Tearney GJ, Bouma
BE. Improved signalto-noise ratio in spectral-domain
compared with time-domain optical coherence tomography.
Opt Lett. 2000;28(21):2067-9.
9. Nassif N, Cense B, Park BH, Yun SH, Chen TC, Bouma BE,
Tearney GJ, de Boer JF. In vivo human retinal imaging by
ultrahigh-speed spectral domain optical coherence
tomography. Opt Lett. 2004;29(5):480-2.
10. Wojtkowski M, Bajraszewski T, Gorczyńska I, Targowski P,
Kowalczyk A, Wasilewski W, Radzewicz C. Ophthalmic imaging
by spectral optical coherence tomography. Am J Ophthalmol.
2004 ;138(3):412-9.
11. Wojtkowski M, Srinivasan V, Fujimoto JG, Ko T, Schuman JS,
Kowalczyk A, Duker JS. Three-dimensional retinal imaging
with high-speed ultrahigh-resolution optical coherence
tomography. Ophthalmology. 2005;112(10):1734-46.

334 | North American Neuro-Ophthalmology Society

2010 Annual Meeting Syllabus | 335
LEARNING OBJECTIVESThe attendee will be able to:
1. Understand OCT as it applies to optic neuropathy-
related neurologic diseases such as MS.
2. Understand OCT applications to CNS diseases
associated with disc edema.
3. Understand relationships between OCT measures
and other CNS measures including clinical optic nerve
function.
CME QUESTIONS1. OCT works by:
a. light reflectivity
b. echo location
c. birefringence of the retinal axons
d. xray imaging
e. magnetic imaging
2. OCT has demonstrated retinal nerve fiber loss in
which of the following conditions:
a. optic neuritis
b. MS
c. Alzheimer’s disease
d. NAION
e. All of the above
3. OCT is an emerging non-invasive technology that at
present is a useful tool in the GROUP analysis of
neuro-ophthalmic conditions, rather than the basis
for INDIVIDUAL clinical decisions. True or False
KEY WORDS1. OCT
2. Optic Neuritis
3. Multiple Sclerosis
4. Papilledema
INTRODUCTIONOptical coherence tomography (OCT) has evolved
dramatically since the first reports of this technology
in 1991, and has become an integral part of the
ophthalmology evaluation. In addition to providing an
indispensible service for the retina physician, the ability to
quantify the retinal nerve fiber layer has begun to change
neuro-ophthalmic practice. In this regard, OCT has the
potential to change qualitative, subjective descriptive
reporting into reproducible quantitative science.
Quantification of the RNFL has several clinical
applications, including numerous diseases of the optic
nerve, both in documentation of edema and quantification
of optic atrophy; OCT has also become a viable study
outcome in treatment trials. This review will focus on
current OCT applications as they apply to neuro-
ophthalmic clinical practice.
RETINAL IMAGING METHODOLOGIESIn addition to OCT, commercially available retinal imaging
devises also include Heidelberg Retinal Tomography
(HRT), and scanning laser polarimetry (GDx). Each of these
instruments has inherent advantages and disadvantages,
and results obtained from 1 instrument do not translate
into results from another imaging technique. The
Heidelberg Retina Tomograph (HRT) is a confocal laser
scanning system to acquisition three dimensional retinal
images. GDx relies on birefringence of the retinal ganglion
cell axon microtubules and filaments. Monteiro and Moura
compared GDx with variable corneal compensation (VCC)
against TD-OCT in patients with band atrophy (BA) from
chiasmal compression, and reported GDx appeared to
underestimated the temporal quadrant by an average of
22µm; conversely, Zaveri et al found OCT and GDx-VCC
equally able to measure RNFL thickness in MS patients
experiencing acute optic neuritis; by virtues of assessing
retinal ganglion cell axon microtubule density, GDx
changes appeared earlier than OCT-demonstrable RNFL
thinning. The remainder of this review will focus on OCT
as the most common methodology employed in neuro-
ophthalmic practice.
OCT METHODOLOGYTime-domain OCT (TD-OCT), the 3rd generation
instrument, is able to record a series of 512 x 1024
A-scan images within 2 seconds with approximately 10µm
resolution. Several studies have demonstrated TD-OCT’s
reproducibility in assessing the RNFL thickness in normal
eyes, glaucoma, and various non-glaucomatous optic
OCT IN NEUROLOGIC DISEASE
Fiona Costello, M.D.; Adnan Subie, D.O.; Eric Eggenberger, D.O., MSEpiMichigan State University
East Lansing MI

336 | North American Neuro-Ophthalmology Society
neuropathies. The next generation of OCT, Spectral-
domain OCT (SD-OCT), has significantly improved the
speed of image acquisition; the SD-OCT captures
approximately 27,000 scans per second with a resolution
of 5µm, and has the ability to form a 3-dimentional map
of the retina and optic nerve, allowing more accurate
distinctions between retinal layers. In addition, SD-OCT
automatically centers the scan on the optic disc with the
use of optic nerve landmarks to decrease scan — rescan
variability. Although measurements with the TD-OCT and
SD-OCT instruments correlate well, the RNFL and retinal
thickness results are not interchangeable.
OCT VS Histology
Blumenthal et al compared OCT-derived RNFL
measurements to histology-derived measurements
(exenterated orbit secondary to an infiltrative squamous
cell carcinoma), and reported OCT outcomes mirrored the
histology, but actual measurements differed by 10-40µm.
This discrepancy likely reflects identification of the RNFL
layers via staining techniques versus optical reflectance.
FACTORS INFLUENCING SCAN ACCURACYSeveral factors influence the quality of OCT images.
The 3.4 mm laser reticule must be centered on the optic
nerve; decentered scans preferentially affect quadrant
thicknesses, especially the vertical quadrants, while total
RNFL remains relatively stable. Surprisingly, use of the
OCT scan tracking coordinates only provided a statistically
significant effect on the temporal quadrant. Signal
strength also positively correlates with the observed RNFL
thickness; many studies require signal strength of 7. Pupil
size is not generally a significant factor as long as size is
≥ 3mm. Lens opacities are inversely correlated with the
measurement of RNFL thickness (effect size <12%);
similarly, contact lenses use is associated with decrease in
signal strength (7.8 to 7.1; P=0.011) and the measured
average RNFL thickness (average RNFL 105.3 to 102.8µm;
P=0.001).
OCT IN CNS DISEASE/OPTIC NEUROPATHIESAnterior Ischemic Optic Neuropathy (AION)
AION is a disease characterized by disc edema at onset
with subsequent optic atrophy. Contreras and colleagues
used OCT to study 27 patients with NAION at baseline,
6-weeks; and 3, 6, and 12 months after onset. The initial
mean RNFL of 201µm represented a 96.4% increase
relative to the fellow eye. Percentages of RNFL loss 3, 6,
and 12 months after onset were 38.9%, 42.3%, and 43.9%,
respectively. Regression analysis revealed a 2-dB decrease
in visual field function for every 1-µm of mean RNFL
thickness loss, and a 1-line drop in Snellen visual acuity
for every 1.6µm deficit.
Bellusci et al documented RNFL edema followed by
thinning in the superior optic nerve among acute NAION
patients with inferior altitudinal defects; conversely,
patient with diffuse visual field (VF) loss had extensive
RNFL thinning. Temporal quadrant RNFL thinning
(papillomacular fibers) correlated with central field
defects. Chan et al used OCT to investigate the optic disc
in 22 NAION patients; smaller cups and C:D ratios were
more common in NAION eyes compared to control eyes;
additionally, a smaller cup was present in the non-
affected fellow eye of NAION patients (C:D 0.103)
compared to the affected NAION eye (C:D 0.135; P=0.04),
suggesting a small degree of cup enlargement after
NAION.
These studies indicate that OCT-measured RNFL values
correlate with the topographical representation of visual
field defects in eyes with NAION. Further, reduced RNFL
values can help predict recovered visual function in NAION
patients.
Optic Neuritis (ON) & Multiple Sclerosis (MS)
Several investigators have demonstrated RNFL loss in
MS patients even without a history of optic neuritis, while
superimposed optic neuritis produces additional RNFL
decline. There is a clinical-OCT paradox concerning optic
neuritis, similar to the MRI-clinical paradox within MS.
MRI T2 lesion load does not correlate with overall
neurologic function, with MS patients often exhibiting MRI
lesions out of proportion to their clinical condition
(especially as assessed by the EDSS). Similarly, OCT RNFL
loss appears out of proportion to the clinical visual
assessments. Although the majority of patients lose RNFL
following an episode of optic neuritis, most recover
“normal” visual function (despite the patients’ perception
that the ‘recovered’ eye is not normal). Costello et all
documented an OCT injury threshold of 75µm before a
linear decline in visual field was apparent. Several studies
have investigated RNFL quadrant data after optic neuritis,
and there appears to be a predilection for the infero-
temporal quadrants.
Costello et al investigated OCT findings in CIS optic
neuritis. There was no significant difference in RNFL
thickness between CIS progressing to MS versus CIS
without MS at 2 years follow up; however, progressive
RNFL thinning was more apparent in CIS patients
progressing to MS.
OCT has been used to investigate MS subtypes; RNFL
loss is generally greater in progressive MS than RRMS
(somewhat duration of disease dependent).
Neuromyelitis Optica (NMO)
In most reports, NMO is associated with greater RNFL loss
than optic neuritis or MS. De Seze et al reported RNFL
thickness of 29 NMO patients had significantly reduced
RNFL values (77.9 µm ) compared to controls. OCT is not
specific enough to distinguish NMO form ON/MS, but
NMO should be considered in ON patients with poor
recovery, or dramatic RNFL thinning <50µm.

2010 Annual Meeting Syllabus | 337
Papilledema/Pseudotumor Cerebri (PTC)/Idiopathic
Intracranial Hypertension (IIH)
Patients with idiopathic intracranial hypertension (IIH)
typically present with headache, pulsatile tinnitus,
transient visual obscurations, and papilledema usually
with relatively preserved visual acuity.
Intuitively, we expect elevated RNFL values at presentation
when optic disc edema is maximal, and decreasing RNFL
elevation with effective treatment.
Rebolleda and Munoz-Negrete studied 22 PTC patients,
and noted the initial increase in RNFL correlated well with
visual field mean deviation (MD) (P=0.002) and pattern
standard deviation (PSD; P=0.013). At 1 year follow-up,
perimetry demonstrated a 0.6dB MD decline with a 10µm
RNFL decrease. It should be noted that OCT alone is
unable to distinguish resolving edema from emerging
optic atrophy, and therefore OCT needs to be
incorporated into the remainder of the clinical exam.
Additional information on OCT in IIH will emerge from the
OCT substudy of the Idiopathic Intracranial Hypertension
Treatment Trial (IIHTT).
Optic Nerve Head Drusen
Johnson et al applied the TD-OCT “fast optic disc”
protocol to differentiate disc drusen from disc edema.
Drusen appeared more “lumpy-bumpy” with RNFL thinner
than 86µm nasally in contrast to the smooth and elevated
contour of true disc edema.
Compressive Optic Neuropathy (CON)
Danesh-Meyer et al investigated OCT’s ability to predict
visual recovery from CON. Thirty five patients with various
etiologies of CON were evaluated with OCT and visual
fields pre- and post-surgical decompression. The patients
were divided into 2 groups: “normal” RNFL and “thin” RNFL
(defined as pre-op RNFL <97.5% of normal values).
Patients with reduced VA and VF but normal RNFL
thickness had significant improvement of VA (mean of
20/40 to 20/25; P=0.028) post-decompression than
those with “thin” RNFL (20/80 to 20/60; P=0.177).
Although the mean improvement in the “thin” RNFL group
of 2 lines was statistically insignificant, this degree of
improvement may well be clinically significant. The
analysis found an increased likelihood of post-op
improvement with a thicker pre-op RNFL until
approximately 85µm, after which there was no additional
benefit was observed; this likely reflects the fact that
patients with RNFL of 85µm have relatively preserved
visual function. While pre-op measurements of RNFL do
not necessarily change our management of patients with
CON, such studies enhance our ability to predict visual
outcome post decompression in CON.
Hereditary Optic Neuropathies/Leber Hereditary
Optic Neuropathy (LHON)
Leber hereditary optic neuropathy (LHON) is a
mitochondrially inherited degeneration of retinal ganglion
cells and their axons that leads to an acute or subacute
loss of central vision. Affected patients are predominantly
males, mutations in the mitochondrial genome from their
mother. LHON is usually due to one of three pathogenic
mitochondrial DNA (mtDNA) point mutations: at
nucleotide positions 11778 G to A, 3460 G to A and
14484 T to C, respectively, in the ND4, ND1 and ND6
subunit genes of complex I of the oxidative
phosphorylation chain in mitochondria. Clinically, patients
may develop often acute onset visual loss in one eye,
followed by fellow eye involvement months to weeks later.
Vision loss typically occurs in young adulthood. In the
acute stage, the affected eye demonstrates telangectatic
and tortuous peripapillary vessels; and with time, optic
atrophy ensues.
Seo et al. studied RNFL in LHON patients with the 11778
and 14484 mutations. Patients were divided into early
(≤6 months) and late (>6 months) categories. In the late
stage, the RNFL thickness was greater in the 14484 group
(average RNFL 81µm) compared to the 11778 (average
RNFL 65.6µm; P=0.02), thus supporting severe atrophy
in the late 11778 group. Comparisons between the 2
mutations in the early stage may be misleading, since
there can be considerable variability within this time frame
as thinning occurs. Overall, these OCT findings are in
agreement with the clinical impression that the 11778
mutation is associated with worse visual outcome than the
14484 mutation.
Savini et al used OCT to study RNFL thickness in
unaffected carriers with LHON mutations. Sixty-six
unaffected carriers (44 females and 22 males) were
analyzed and compared with an age-matched control
group of 70 patients (40 females and 30 males). As
compared to the control group, unaffected male carriers
showed thicker RNFL measurements in the temporal and
inferior RNFL quadrants and in the 360 degrees average
measurements. These differences reached statistical
significance in subjects carrying the 11778 mutation,
whereas only a trend was detected in those with the 3460
mutation. Unaffected female carriers had an increased
thickness in the temporal quadrant when compared with
the control group (P = 0.003). The increase in temporal
sectors was statistically significant in females with the
11778 mutation, whereas a trend was detected in those
with the 3460 mutation. A thickening of the temporal
fibers was detected in all subgroups of unaffected
carriers.
Migraine
Martinez et al used OCT to study 70 patients with
migraine, and noted a significant RNFL reduction in the
temporal quadrants of migraineurs compared to healthy
controls; additionally, the RNFL in migraine with aura
(average RNFL 96.5µm) was significantly less than
migraine without aura (average RNFL of 102.9µm;
P=0.0189). Significantly thinner RNFL was found in
patients with migraine ≥15 years. These investigators
found a correlation between RNFL thickness and migraine
disability assessment (MIDAS) scores.

338 | North American Neuro-Ophthalmology Society
Neurodegenerative disease/Alzheimer Disease
There is both histologic and retinal imaging evidence of
retinal ganglionic cell (RGC) in patients with Alzheimer
disease (AD). Danesh-Meyer et al used HRT scanning laser
ophthalmoscopy (SLO) to investigate 40 patients with AD
compared to age- and sex-matched controls, and found
that clinical and SLO vertical cup-to-disc ratio was
significantly different between the groups (AD 0.4,
control 0.27-0.31); additionally, these authors reported
decreased rim volume, RNFL thickness and rim area
in AD compared to controls.
CONCLUSIONOCT has enhanced our assessment, management, and
understanding of neuro-ophthalmic diseases, and has
potential to further our understanding of other CNS-based
diseases. OCT has the advantages of reproducibility,
ease of use, non-invasive nature and relatively low cost,
makes it an asset to several clinical situations. With its
advancement into spectral domain, OCT has wide use in
evaluating the optic nerve and the visual system.
CME ANSWERS1. A
2. E
3. True
REFERENCES1. Albrecht P, Frohlich R, Hartung HP, Kieseier BC, Methner A.
Optical coherence tomography measures axonal loss in
multiple sclerosis independently of optic neuritis. J Neurol
2007;254:1595-1596.
2. Balcer LJ, Galetta SL, Calabresi PA, et al. Natalizumab reduces
visual loss in patients with relapsing multiple sclerosis.
Neurology 2007;68:1299-1304.
3. Balcer LJ, Markowitz CE. Optical coherence tomography to
monitor neuronal integrity in multiple sclerosis. In: Rudick
RA, Cohen JA, editors. Multiple Sclerosis Therapeutics, 3rd
ed. Oxon, UK: Informa Healthcare, 2007:251-265.
4. Beck RW, Cleary PA, Anderson MM et al. A Randomized
Controlled Trial of Corticosteroids in the Treatment of Acute
Optic Neuritis. N Engl J Med 1992; 326:581-8.
5. Beck RW, Cleary PA, et al. The 5-year risk of MS after optic
neuritis Experience of the Optic Neuritis Treatment Trial
Optic Neuritis Study Group Neurology 1997; 49:1404-1413.
6. et al. Retinal nerve fiber layer thickness in nonarteritic
anterior ischemic optic neuropathy: OCT characterization of
the acute and resolving phases. : 2008;246(5):641-7.
7. OCT and PVEP examination in eyes with visible idiopathic
optic disc drusen. 2006;223(12):993-6.
8. Blumenthal EZ, Parikh RS, Pe’er J, et al. Retinal nerve fibre
layer imaging compared with histological measurements in a
human eye. Eye. 2009;23(1):171-5.
9. Blumenthal EZ, Williams JM, Weinreb RN, et al. Reproducibility
of nerve fiber layer thickness measurements by use of optical
coherence tomography. Ophthalmology. 2000;107:2278-82.
10. Budenz D, Chang R, Huang X, et al. Reproducibility of nerve
fiber thickness measurements using stratus OCT in normal
and glaucomatous eyes. Invest Ophthalmol Vis Sci.
2005;46:2440-3.
11. Bulens C, Meerwaldt JD, Van der Wildt GJ, Van Deursen JB.
Effect of levodopa treatment on contrast sensitivity in
Parkinson’s disease. Ann Neurol 1987;22:365-369.
12. Carpineto P, Ciancaglini M, Zuppardi E, et al. Reliability of
nerve fiber layer thickness measurements using optical
coherence tomography in normal and glaucomatous eyes.
Ophthalmology. 2003;110:190-5.
13. Cettomai D, Pulicken M, Gordon-Lipkin E, et al.
Reproducibility of optical coherence tomography in multiple
sclerosis. Arch Neurol. 2008;65:1218-22.
14. Cettomai D, Pulicken M, Gordon-Lipkin E, Salter A, Frohman
T, Conger A, Zhang X, Cutter G, Balcer L, Frohman E,
Calabresi P. Cross center and inter-rater reproducibility of
optical coherence tomography in multiple sclerosis. Arch
Neurol 2008;65:1218-1222.
15. Decreased retinal nerve fibre layer thickness detected by
optical coherence tomography in patients with ethambutol-
induced optic neuropathy. : 2007; 91(7):895-7.
16. Chan CK, Cheng AC, Leung CK, et al. Quantitative
assessment of optic nerve head morphology and retinal
nerve fibre layer in non-arteritic anterior ischaemic optic
neuropathy with optical coherence tomography and confocal
scanning laser ophthalmoscopy. Br J Ophthalmol.
2009;93(6):731-5.
17. Chen J, Lee L. Clinical applications and new developments of
optical coherence tomography: an evidence-based review.
Clin Exp Optom. 2007;90(5):317-35.
18. Chen TC, Cense B, Miller JW, et al. Histologic correlation of in
vivo optical coherence tomography images of the human
retina. Am J Ophthalmol 2006;141(6):1165-1168.
19. Cheung CY, Leung CK, Lin D, et al. Relationship between
retinal nerve fiber layer measurement and signal strength in
optical coherence tomography. Ophthalmology.
2008;115(8):1347-51.
20. Cheung CY, Yiu CK, Weinreb RN, et al. Effects of scan circle
displacement in optical coherence tomography retinal nerve
fibre layer thickness measurement: a RNFL modelling study.
Eye. 2008;23(6):1436-41.
21. et al. Fourier-domain optical coherence tomography and
adaptive optics reveal nerve fiber layer loss and
photoreceptor changes in a patient with optic nerve drusen.
2008 Jun;28(2):120-5.
22. Choi SS, Zawadzki RJ, Keltner JL, Werner JS. Changes in
cellular structures revealed by ultra-high resolution retinal
imaging in optic neuropathies. Invest Ophthalmol Vis Sci
2008;49:2103-2119.
23. Cleary PA, Beck RW, Bourque LB, Backlund JC, et al. Visual
Symptoms After Optic Neuritis Results from the Optic
Neuritis Treatment Trial. J Neuroophthalmol 1997; 17: 18-28.
24. Cohen MJ, Kaliner E, Frenkel S, Kogan M, Miron H, Blumenthal
EZ. Morphometric analysis of human peripapillary retinal
nerve fiber layer thickness. Invest Ophthalmol Vis Sci
2008;49:941-944.

2010 Annual Meeting Syllabus | 339
25. Follow-up of nonarteritic anterior ischemic optic neuropathy
with optical coherence tomography. 2007;114 (12):2338-44.
26. Contreras I, Rebolleda G, Noval S, Muñoz-Negrete. Optic disc
evaluation by optical coherence tomography in nonarteritic
anterior ischemic optic neuropathy. Invest Ophthalmol Vis Sci
2007;48(9):4087-4092.
27. Cormack FK, Tovee M, Ballard C. Contrast sensitivity and
visual acuity in patients with Alzheimer’s disease. In J Geriatr
Psychiatry 2000;15:614-620.
28. Costello F, Coupland S, Hodge W, et al. Quantifying axonal
loss after optic neuritis with optical coherence tomography.
Ann Neurol. 2006;59(6):963-9.
29. Costello F, Coupland S, Hodge W, Lorello GR, Koroluk J, Pan
YI, Freedman MS, Zackon DH, Kardon RH. Prognostic
consequences of axon loss after optic neuritis: a prospective
study using optical coherence tomography (OCT). Ann Neurol
2006;59:963-969.
30. Costello F, Hodge W, Pan YI, et al. Tracking retinal nerve
fiber layer loss after optic neuritis: a prospective study
using optical coherence tomography. Mult Scler 2008;14(7):
893-905.
31. Costello F, Hodge W, Pan YI, et al. Differences in retinal nerve
fiber layer atrophy between multiple sclerosis subtypes.
J Neurol Sci. 2009;281(1-2):74-9.
32. Costello F, Hodge W, Pan YI, et al. Retinal nerve fiber layer
and future risk of multiple sclerosis. Can J Neurol Sci.
2008;35(4):482-7.
33. et al. Relationship between retinal nerve fiber layer and
visual field sensitivity as measured by optical coherence
tomography in chiasmal compression. I 2006 Nov;47(11):
4827-35.
34. Danesh-Meyer HV, Papchenko T, Savino PJ, et al. In vivo
retinal nerve fiber layer thickness measured by optical
coherence tomography predicts visual recovery after surgery
for parachiasmal tumors. Invest Ophthalmol Vis Sci.
2008;49(5):1879-85.
35. Danis RP, Fisher MR, Lambert E, Goulding A, Wu D, Lee LY.
Results and repeatability of retinal thickness measurements
from certification submissions. Arch Ophthalmol
2008;126:45-50.
36. Davis MD, Bressler SB, Aiello LP, Bressler NM, Browning DJ,
Flaxel CJ, Fong DS, Foster WJ, Glassman AR, Hartnett MER,
Kollman C, Li HK, Qin H, Scott IU, and the Diabetic
Retinopathy Clinical Research Network Study Group.
Comparison of time-domain OCT and fundus photographic
assessments of retinal thickening in eyes with diabetic
macular edema. Invest Ophthalmol Vis Sci 2008;49:
1745-1752.
37. de Seze J, Blanc F, Jeanjean L, et al. Optical coherence
tomography in neuromyelitis optica. Arch Neurol.
2008;65(7):920-3.
38. DeLeon-Ortega J, Carroll KE, Arthur SN, Girkin CA.
Correlations Between Retinal Nerve Fiber Layer and Visual
Field in Eyes with Non-Arteritic Anterior Ischemic Optic
Neuropathy. Am J Ophthalmol 2007;143(2): 288–294.
39. Della Mea G, Bacchetti S, Zappieri M, et al. Nerve fiber layer
analysis with GDx with a variable corneal compensator in
patients with multiple sclerosis. Ophthalmologica.
2007;221(3):186-189.
40. Diabetic Retinopathy Clinical Research Network, Krzystolik
MG, Strauber SF, et al. Reproducibility of macular thickness
and volume using Zeiss optical coherence tomography in
patients with diabetic macular edema. Ophthalmology.
2007;114:1520-5.
41. Diabetic Retinopathy Clinical Research Network, Krzystolik
MG, Strauber SF, et al. Reproducibility of macular thickness
and volume using Zeiss optical coherence tomography in
patients with diabetic macular edema. Ophthalmology.
2007;114:1520-5.
42. et al. Optic disc size is associated with development and
prognosis of Leber’s hereditary optic neuropathy. i 2008 Dec
20. [Epub ahead of print]
43. Drexler W, Fujimoto JG. State-of-the-art. retinal optical
coherence tomography. Prog Retin EyeRes 2008;27:45-88.
44. Dutta R, Trapp BD. Pathogenesis of axonal and neuronal
damage in multiple sclerosis. Neurology 2007;68(Suppl
3):S22-S31.
45. Elbol P, Work K. Retinal nerve fiber layer in multiple sclerosis.
Acta Ophthal.1990; 68:481-48.
46. Evangelou N, Konz D, Esiri MM, Smith S, Palace J, Matthews
PM. Size-selective neuronal changes in the anterior optic
pathways suggest a differential susceptibility to injury in
multiple sclerosis. Brain 2001;124:1813-1820.
47. Fisher JB, Jacobs DA, Markowitz CE, et al. Relation of visual
function to retinal nerve fiber layer thickness in multiple
sclerosis. Ophthalmology. 2006;113:324-32.
48. Fisher JB, Jacobs DA, Markowitz CE, Galetta SL, Volpe NJ, Ligia
Nano-Schiavi M, et al. Relation of visual function to retinal
nerve fiber layer thickness in multiple sclerosis.
Ophthalmology 2006;113:324-325.
49. Measurement of the scleral canal using optical coherence
tomography in patients with optic nerve drusen. 2005;
139(4):664-9.
50. Fortune B, Wang L, Cull G, Cioffi GA. Intravitreal colchicine
causes decreased RNFL birefringence without altering RNFL
thickness. Invest Ophthalmol Vis Sci 2008;49:255-261.
51. Frisen L, Hoyt WF. Insidious atrophy of retinal nerve fibers in
multiple sclerosis. Funduscopic identification in patients with
and without complaints. Arch Ophthalmol 1974;92:91-97.
52. Frohman E, Costello F, Zivadinov R, Stuve O, Conger A,
Winslow H, et al. Optical coherence tomography in multiple
sclerosis. Lancet Neurol 2006;5:853-863.
53. Frohman EM, Costello F, Stuve O, Calabresi P, Miller DH,
Hickman SJ, et al. Modeling axonal degeneration within the
anterior visual system. Arch Neurol 2008;65(1):26-35.
54. Frohman EM, Fujimoto JG, Frohman TC, et al. Optical
coherence tomography: a window into the mechanisms of
multiple sclerosis. Nat Clin Pract Neurol. 2008;4(12):664-75.
55. Frohman EM, Raine C, Racke MK. Multiple sclerosis:
the plaque and its pathogenesis. N Engl J Med 2006;354:
942-955.
56. Methanol-induced retinal toxicity patient examined by
optical coherence tomography. 2006;50(3):239-41.
57. Fujimoto JG, Hee MR, Huang D, Schuman JS, Pulifiato CA,
Swanson E. Principles of optical coherence tomography. In:
Schuman JS, Pulifiato CA, Fujimoto JG. Ocular coherence
tomography of ocular disease. Second edition. Thorofare:
Slack Inc., 2004.

340 | North American Neuro-Ophthalmology Society
58. Gordon-Lipkin E, Chodkowski B, Reich DS, et al. Retinal nerve
fiber layer is associated with brain atrophy in multiple
sclerosis. Neurology 2007;69(16):1603-1609.
59. Grazioli E, Zivadinov R, Weinstock-Guttman B, Lincoff N,
Baier M, Wong JR, Hussein S, Cox JL, Hojnacki D, Ramanathan
M. Retinal nerve fiber layer thickness is associated with brain
MRI outcomes in multiple sclerosis. J Neurol Sci
2008;268:12-17.
60. Hedges TR 3rd, Quireza ML. Multifocal visual evoked
potential, multifocal electroretinography, and optical
coherence tomography in the diagnosis of subclinical loss of
vision. Ophthalmol Clin North Am. 2004;17(1):89-105.
61. et al. Subretinal fluid from anterior ischemic optic
neuropathy demonstrated by optical coherence tomography.
2008;126(6):812-5.
62. Henderson AP, Trip SA, Schlottmann PG, et al. An
investigation of the retinal nerve fibre layer in progressive
multiple sclerosis using optical coherence tomography. Brain.
2008;131(Pt 1):277-87.
63. Henderson APD, Trip SA, Schlottmann PG, Altmann DR,
Garway-Heath DF, Plant GT, Miller DH. An investigation of
the retinal nerve fibre layer in progressive multiple sclerosis
using optical coherence tomography. Brain 2008;131(1):
277-287.
64. Hickman SJ, Dalton CM, Miller DH, Plant GT. Management of
acute optic neuritis. Lancet 2002; 360: 1953-1962.
65. et al. Retinal nerve fiber structure versus visual field function
in patients with ischemic optic neuropathy. A test of a linear
model. 2008;115(5):904-10.
66. Huang D, Swanson EA, Lin CP, et al. Optical coherence
tomography. Science. 1991;22,254(5035):1178-81.
67. Huang X., Knighton RW. Microtubules contribute to the
birefringence of the retinal nerve fiber layer. Invest
Ophthalmol Vis Sci 2005;46(12):4588-4593.
68. et al. Predicting visual outcome after treatment of pituitary
adenomas with optical coherence tomography. 2009
Jan;147(1):64-70.
69. Jaffe GJ, Caprioli J. Optical coherence tomography to detect
and manage retinal disease and glaucoma. Am J Ophthalmol
2004;137:156-69.
70. Johnson LN, Diehl ML, Hamm CW, et al. Arch Ophthalmol.
2009;127(1):45-9.
71. Kakinoki M, Sawada O, Sawada T, et al. Comparison of
macular thickness between Cirrus HD-OCT and Stratus
OCT. Ophthalmic Surg Lasers Imaging. 2009;40(2):135-40.
72. Kallenbach K, Frederiksen J. Optical coherence tomography in
optic neuritis and multiple sclerosis: a review. Eur J. Neurol
2007;14:841-849.
73. Kanamori A, Escano MF, Eno A, et al. Evaluation of the effect
of aging on retinal nerve fiber layer thickness measured by
optical coherence tomography. Ophthalmologica
2003;217:273-278.
74. Kanamori A, Nakamura M, Matsui N, et al. Optical coherence
tomography detects characteristic retinal nerve fiber layer
thickness corresponding to band atrophy of the optic discs.
Ophthalmology. 2004;111(12):2278-2283.
75. Optical coherence tomography of the retinal nerve fibre
layer in mild papilloedema and pseudopapilloedema.
2005;89(3):294-8.
76. Visual field defects and retinal nerve fiber layer defects in
eyes with buried optic nerve drusen 2006;141(2):248-253.
77. Kiernan DF, Hariprasad SM, Chin EK, et al. Prospective
comparison of cirrus and stratus optical coherence
tomography for quantifying retinal thickness. Am J
Ophthalmol. 2009;147(2):267-275.
78. Stratus OCT in dominant optic atrophy: features
differentiating it from glaucoma. 2007;16 (8):655-8.
79. Klistorner A, Arvind H, Nguyen T, et al. Multifocal VEP and
OCT in optic neuritis: a topographical study of the structure-
function relationship. 2009;118(2):129-37.
80. et al. Axonal loss and myelin in early ON loss in postacute
optic neuritis. 2008 Sep; 64(3):325-31.
81. Kupersmith MJ, Gal RL, Beck RW, et al. Visual function at
baseline and a 1 month in acute optic neuritis: predictors
of visual outcome. Neurology 2007;69:508-514.
82. Retinal nerve fiber layer loss documented by Stratus OCT
in patients with pituitary adenoma: case report. 2006;
69(2):251-4.
83. Lynch DR, Farmer JM, Rochestie D, Balcer LJ. Contrast letter
acuity as a measure of visual dysfunction in patients with
Friedreich ataxia. J Neuro-Ophthalmol 2002;22:270-274.
84. Lynch DR, Farmer JM, Wilson RL, Balcer LJ. Performance
measures in Friedreich ataxia: potential utility as clinical
outcome tools. Mov Disord 2005;20:777-782.
85. MacFadyen DJ, Drance SM, Douglas GR, Airaksined PJ, et al.
The retinal nerve fiber layer, neuroretinal rim area, and visual
evoked potentials in MS. Neurology 1988; 38:1353-1358
Kerrrison JB, Flynn T, Green R. Retinal Pathologic Changes in
Multiple Sclerosis. Retina 1994; 14:445-451.
86. Martinez A, Proupim N, Sanchez M. Retinal nerve fibre layer
thickness measurements using optical coherence
tomography in migraine patients. Br J Ophthalmol.
2008;92(8):1069-75.
87. Medeiros FA, Moura FC, Vessani RM, Susanna R. Axonal loss
after traumatic optic neuropathy documented by optical
coherence tomography. Am J Ophthalmol 2003;135:
406-408.
88. Menke MN, Feke GT, Trempe CL. OCT measurements in
patients with optic disc edema. Invest Ophthalmol Vis Sci
2005;46:3807-3811.
89. Merle H, Olindo S, Donnio A, et al. Retinal peripapillary nerve
fiber layer thickness in neuromyelitis optica. Invest
Ophthalmol Vis Sci. 2008;49(10):4412-7.
90. et al. Retinal peripapillary nerve fiber layer thickness in
neuromyelitis optica. 2008;49(10):4412-7.
91. Miller D, Barkhof F, Montalban X, Thompson A, et al.
Clinically isolated syndromes suggestive of multiple
sclerosis, part I: natural history, pathogenesis, diagnosis,
and prognosis. Lancet Neurol 2005; 4: 281-288.
92. Monteiro ML, Leal BC, Rosa AA, Bronstein MD. Optical
coherence tomography analysis of axonal loss in band
atrophy of the optic nerve. Br J Ophthalmol 2004;88:
896-899.
93. Monteiro ML, Medeiros FA, Ostroscki MR. Quantitative
analysis of axonal loss in band atrophy of the optic nerve
using scanning laser polarimetry. Br J Ophthalmol. 2003;
87(1):32-37.
2010 Annual Meeting Syllabus | 341
94. Monteiro ML, Moura FC, Medeiros FA. Diagnostic ability of
optical coherence tomography with a normative database to
detect band atrophy of the optic nerve. Am J Ophthalmology
2007;143:896-899.
95. Monteiro ML, Moura FC. Comparison of the GDx VCC
scanning laser polarimeter and the stratus optical coherence
tomograph in the detection of band atrophy of the optic
nerve. Eye. 2008;22(5):641-8.
96. Morgan JE, Waldock A, Jeffery G, Cowey A. Retinal nerve fibre
layer polarimetry: histological and clinical comparison.
Br J Ophthalmol. 1998;82(6):684-690.
97. Moura FC, Medeiros FA, Monteiro ML. Evaluation of macular
thickness measurements for detection of band atrophy of
the optic nerve using optical coherence tomography.
Ophthalmology 2007;114:175-181.
98. Mumcuoglu T, Wollstein G, Wojtkowski M, Kagemann L,
Ishikawa H, Gabriele ML, Srinivasan V, Fujimoto JG, Duker JS,
Schuman JS. Improved visualization of glaucomatous retinal
damage using high-speed ultrahigh-resolution optical
coherence tomography. Ophthalmology 2008;115:782-789.
99. Nagai-Kusuhara A, Nakamura M, Kanamori A, et al.
Evaluation of optic nerve head configuration in various types
of optic neuropathy with Heidelberg Retina Tomograph.
Eye. 2008;22(9):1154-60.
100. Nagai-Kusuhara A, Nakamura M, Tatsumi Y, et al.
Disagreement between Heidelberg Retina Tomograph and
optical coherence tomography in assessing optic nerve head
configuration of eyes with band atrophy and normal eyes.
Br J Ophthalmol. 2008;92(10):1382-6.
101. Disagreement between Heidelberg Retina Tomograph and
optical coherence tomography in assessing optic nerve head
configuration of eyes with band atrophy and normal eyes.
2008 Oct; 92(10):1382-6.
102. Naismith RT, Tutlam NT, Xu J, et al. Optical coherence
tomography differs in neuromyelitis optica compared with
multiple sclerosis. Neurology. 2009;72(12):1077-82.
103. Newman NJ. Driving with Parkinson’s disease: more than
meets the eye [editorial]. Ann Neurol 2006;60:387-388.
104. Noval S, Contreras I, Rebolleda G, Munoz-Negrete FJ. Optical
coherence tomography versus automated perimetry for
follow-up of optic neuritis. Acta Ophthalmol Scand 2006;
84: 790–794.
105. Optic Neuritis Study Group. High and Low Risk Profiles for
the Development of Mutiple Sclerosis Within 10 Years After
Optic Neuritis. Arch Ophthalmol. 2003; 121: 944-949.
106. Osborne B, Jacobs D, Markowitz C, Galetta S, Volpe N, Nano-
Schiavi L, Winslow H, Fisher JB, Baier M, Frohman T, Calabresi
P, Maguire MG, Cutter GR, Balcer LJ, Frohman EM. Relation of
macular volume to retinal nerve fiber layer thickness and
visual function in multiple sclerosis. Neurology 2006;66
(Suppl 2):A14.
107. Paquet C, Boissonnot M, Roger F, Dighiero P, Gil R, Hugon J.
Abnormal retinal thickness in patients with mild cognitive
impairment and Alzheimer’s disease. Neurosci Lett
2007;420:97-99.
108. Parikh RS, Parikh SR, Sekhar GC, Prabakaran S, Ganesh Babu
J, Thomas R. Normal age-related decay of retinal nerve fiber
layer thickness. Ophthalmology 2007;114:921-926.
109. Parisi V, Manni G, Spadaro M, et al. Correlation between
morphological and functional retinal impairment in multiple
sclerosis patients. Invest Ophthalmol Vis Sci 1999;40:
2520-7.
110. Patel PJ, Chen FK, Ikeji F, et al. Repeatability of stratus optical
coherence tomography measures in neovascular age-related
macular degeneration. Invest Ophthalmol Vis Sci.
2008;49:1084-8.
111. Paunescu LA, Schumann JS, Price LL, Stark PC, Beaton S,
Ishikawa, et al. Reproducibility of nerve fiber layer thickness,
macular thickness, and optic nerve head measurements
using StratusOCT. Invest Ophthalmol Vis Sci 2004;45:
1716-1724.
112. Pro MJ, Pons ME, Liebmann JM, et al. Imaging of the optic
disc and retinal nerve fiber layer in acute optic neuritis. J
Neurol Sci 2006;250(1-2):114-119.
113. Pulicken M, Gordon-Lipkin E, Balcer LJ, et al. Optical
coherence tomography and disease subtype in multiple
sclerosis. Neurology. 2007;69:2085-92.
114. Pulicken M, Gordon-Lipkin E, Balcer LJ, Frohman E, Cutter G,
Calabresi PA. Optical coherence tomography and disease
subtype in multiple sclerosis. Neurology 2007;69(22):
2085-2092.
115. Rebolleda G, Munoz-Negrete FJ. Follow-up of Mild
Papilledema in Idiopathic Intracranial Hypertension with
Optical Coherence Tomography. Invest Ophthalmol Vis Sci.
2008 Nov 14. [Epub ahead of print]
116. Sakata LM, Deleon-Ortega J, Sakata V, Girkin CA. Optical
coherence tomography of the retina and optic nerve - a
review. Clin Experiment Ophthalmol. 2009;37(1):90-9.
117. et al. Utility of optic coherence tomography (OCT) in the
follow-up of idiopathic intracranial hypertension in childhood
2006; 7:383-9.
118. et al. Retinal nerve fiber layer evaluation by optical coherence
tomography in unaffected carriers with Leber‘s hereditary
optic neuropathy mutations. 2005;112(1):127-31.
119. et al. Detection and quantification of retinal nerve fiber layer
thickness in optic disc edema using stratus OCT.
2006;124(8):1111-7.
120. Savini G, Zanini M, Barboni P. Influence of pupil size and
cataract on retinal nerve fiber layer thickness measurements
by Stratus OCT. J Glaucoma. 2006;15(4):336-40.
121. Schrems WA, Mardin CY, Horn FK, et al. Comparison of
Scanning Laser Polarimetry and Optical Coherence
Tomography in Quantitative Retinal Nerve Fiber Assessment.
J Glaucoma. 2009 Apr 15. [Epub ahead of print]
122. Schuman JS, Pedut-Koizman T, Pakter H, et al. Optical
coherence tomography and histologic measurements of
nerve fiber layer thickness in normal and glaucomatous
monkey eyes. Invest Ophthalmol Vis Sci 2007;48(8):
3645-3654.
123. Seo JH, Hwang JM, Park SS. Comparison of retinal nerve fibre
layers between 11778 and 14484 mutations in Leber’s
hereditary optic neuropathy. Eye. 2009 Feb 27. [Epub ahead
of print]
124. Sepulcre J, Fernandez MM, Salinas – Alaman A, et al.
Diagnostic accuracy of retinal abnormalities in predicting
disease activity in MS. Neurology 2007; 68: 1488–1494.

342 | North American Neuro-Ophthalmology Society
125. Sergott RC, Frohman E, Glanzman R, Al-Sabbagh A ; On
behalf of the OCT in MS Expert Panel. The role of optical
coherence tomography in multiple sclerosis: expert panel
consensus. J Neurol Sci 2007;263(1-2):3-14.
126. Sergott RC, Piette S, Etter J, Savino PJ, Affel L. In vivo
neuroprotection with high-dose, high-frequency interferon
therapy: a serial optical coherence tomography study in
multiple sclerosis and optic neuritis. Abstract presented at
the 21st Congress of the European Committee for Treatment
and Research in Multiple Sclerosis, 2005.
127. Sergott, RC. Optical coherence tomography: measuring in-
vivo axonal survival and neuroprotection in multiple sclerosis
and optic neuritis. Curr Opin Ophthalmol 2005;16:346-350.
128. Soderstrom M, Ya-Ping J, Hillert J, Link H. Optic Neuritis
Prognosis for multiple sclerosis from MRI, CSF, and HLA
findings. Neurology 1998; 50:708-714.
129. Soderstrom M. Optic neuritis and multiple sclerosis.
Acta Ophthalmol Scand 2001: 79; 223-227.
130. Subei AM, Antonio-Santos AA, Morehouse J, et al.
Reproducibility of Optical Coherence Tomography in Non-
glaucomatous Optic Nerve Pathologies. Poster presented
at NANOS, 2009.
131. Trapp BD, Peterson J, Ransohoff RM, Rudick R, Mörk S, Bo L.
Axonal transection in the lesions of multiple sclerosis. N Engl
J Med 1998;338:278-285.
132. Trip SA, Schlottmann PG, Jones SJ et al. Optic nerve
magnetization transfer imaging and measures of axonal loss
and demyelination in optic neuritis. Mult Scler 2007;13:
875-9.
133. Trip SA, Schlottmann PG, Jones SJ, et al. Optic nerve atrophy
and retinal nerve fiber layer thinning following optic neuritis:
evidence that axonal loss is a substrate of MRI-detected
atrophy. Neuroimage 2006; 31: 286 – 293.
134. Trip SA, Schlottmann PG, Jones SJ, et al. Retinal nerve fiber
layer axonal loss and visual dysfunction in optic neuritis.
Ann Neurol 2005;58:383-391.
135. Tzamalis A, Kynigopoulos M, Schlote T, Haefliger I. Improved
reproducibility of retinal nerve fiber layer thickness
measurements with the repeat-scan protocol using the
Stratus OCT in normal and glaucomatous eyes. Graefes Arch
Clin Exp Ophthalmol. 2009;247:245-52.
136. Uc EY, Rizzo M, Anderson SW, et al. Impaired visual search in
drivers in Parkinson’s disease. Ann Neurol 2006;60:387-388.
137. van Velthoven ME, Faber DJ, Verbraak FD, et al. Recent
developments in optical coherence tomography for imaging
the retina. Prog Retin Eye Res. 2007;26(1):57-77. Epub 2006
Dec 8.
138. Reversible dysfunction of retinal ganglion cells in non-
secreting pituitary tumors. 2008 Aug 1 [Epub ahead of print]
139. Vizzeri G, Bowd C, Medeiros FA, et al. Effect of improper
scan alignment on retinal nerve fiber layer thickness
measurements using Stratus optical coherence tomograph.
J Glaucoma. 2008;17(5):341-9.
140. Vizzeri G, Bowd C, Medeiros FA, et al. Scan tracking
coordinates for improved centering of Stratus OCT scan
pattern. J Glaucoma. 2009;18(1):81-7.
141. Vizzeri G, Bowd C, Medeiros FA, et al. Scan tracking
coordinates for improved centering of Stratus OCT scan
pattern. J Glaucoma. 2009;18(1):81-7.
142. Vizzeri G, Weinreb RN, Gonzalez-Garcia AO, et al. Agreement
between Spectral-Domain and Time-Domain OCT for
measuring RNFL thickness. Br J Ophthalmol. 2009;93(6):
775-81.
143. Wu GF, Schwartz ED, Lei T, et al. Relation of vision to global
and regional brain MRI in multiple sclerosis. Neurology
2007;69:2128-2135.
144. Youm DJ, Kim JM, Park KH, Choi CY. Curr Eye Res.
2009;34(1):78-83.
145. Youm DJ, Kim JM, Park KH, Choi CY. Curr Eye Res.
2009;34(1):78-83.
146. Zaveri MS, Conger A, Salter A, et al. Retinal imaging by laser
polarimetry corroborates optical coherence tomography
evidence of axonal degeneration in multiple sclerosis. Arch
Neurol 2008;65(7):924-928.
147. Zaveri MS, Conger A, Salter A, et al. Retinal imaging by laser
polarimetry and optical coherence tomography evidence of
axonal degeneration in multiple sclerosis. Arch Neurol.
2008;65(7):924-8.
148. Optical coherence tomography can measure axonal loss in
patients with ethambutol-induced optic neuropathy.
2005;243(5):410-6.

2010 Annual Meeting Syllabus | 343
LEARNING OBJECTIVES1. The participant will be able to describe the two types
of optical coherence tomography devices.
2. The participant will be able to explain the advantages
of Spectral-Domain Optical Coherence Tomography in
comparison to Time-Domain Optical Coherence
Tomography.
3. The participant will be able to describe five different
scenarios where OCT would be clinically useful in
glaucoma diagnosis and management.
CME QUESTIONS1. What are the most clinically relevant parameters
collected from an OCT scan for glaucoma?
2. Name the three main scans from time domain OCT.
3. Name 4 advantages of Spectral-Domain Optical
Coherence Tomography in comparison to Time-
Domain Optical Coherence Tomography
KEY WORDS• Optical Coherence Tomography (OCT)
• Time-Domain Optical Coherence Tomography
(TD-OCT)
• Spectral-Domain Optical Coherence Tomography
(SD-OCT)
• Retinal Nerve Fiber Layer (RNFL)
• Circumpapillary Scan
• Ganglion Cell Complex (GCC)
• Glaucoma Progression Analysis (GPA)
• Visual Field Index (VFI)
• Pre-perimetric
• Central Island
ABSTRACTGlaucoma is the second leading cause of blindness
worldwide. It is characterized by the accelerated death of
retinal ganglion cells and presents as progressive
functional damage to the visual field. There is no formal
screening method for glaucoma. Disease detection is
solely dependent on the clinical capabilities of the eye
care provider. The first-line diagnostic tools for
identifying glaucoma are clinical examination with direct
or indirect ophthalmoscopy and/or stereoscopic optic
nerve head photographs. Unfortunately, these tools are
prone to high intra- and inter-observer variability.
Recently, a number of imaging devices have been
introduced with the goal of early detection and
quantification of structural glaucomatous changes in the
retinal nerve fiber layer and optic nerve head. One of the
commercially available glaucoma imaging devices is
optical coherence tomography (OCT). OCT generates
cross-sectional and three-dimensional images of retinal
structures. Its application in glaucoma diagnostics and
monitoring will be discussed in this chapter.
INTRODUCTION Glaucoma is the second leading cause of blindness
worldwide. It is characterized by the accelerated death
of retinal ganglion cells and presents as progressive
functional damage to the visual field. The World Health
Organization (WHO) has projected this disease to affect
60.5 million individuals by the year 2010, leaving 8.4
million blind. With the world’s aging population, the
burden of disease is predicted to grow exponentially,
affecting 80 million people by 20201.
With this understanding, the WHO has made it a priority
eye disease to address with their program Vision 2020,
which aims to prevent avoidable blindness. One of their
specific objectives is to develop adequate training
methods in the diagnosis of glaucoma, as early
intervention has been shown to slow disease progression
and preserve functional sight2. The NIH National Eye
Institute has also set improved glaucoma diagnostic
measures as a part of their National Plan for Eye and
Vision Research.
Unfortunately, early detection of glaucoma remains a
challenge. No symptoms appear until there is advanced
retinal ganglion cell death and visual field loss. Estimates
of undiagnosed glaucoma range from 40 to 90%, with
higher percentages found in underdeveloped nations4.5.
There is no formal screening method for glaucoma.
Disease detection is solely dependent on the clinical
capabilities of the eye care provider. The first-line
diagnostic tools for identifying structural changes in
glaucoma are clinical examination with direct or indirect
ophthamoscopy and/or stereoscopic ONH photographs.
These tools are mostly qualitative thus prone to high
intra- and inter-observer variability7-9. The functional
LESSONS FROM GLAUCOMA: USE OF OCT IN THE CLINIC AND TRIALS
Joel S. Schuman, MD, FACS, Allison K. Ungar, Gadi Wollstein Department of Ophthalmology, UPMC Eye Center, Eye and Ear Institute,
Ophthalmology and Visual Science Research Center, University of Pittsburgh School of Medicine, Pittsburgh, PA
344 | North American Neuro-Ophthalmology Society
damage caused by glaucoma which causes characteristic
patterns of VF loss is often quantified through the use of
standard automated perimetry (SAP). SAP is a threshold
test that determines the eye’s sensitivity to light
throughout the central visual field (VF). This commonly
used clinical test has a high test-retest variability, and
multiple VF tests are required to confirm damage10,11.
Also, significant structural loss may occur before changes
are detected by VF12.
A number of ocular imaging devices have been introduced
which provide reproducible quantification of the retinal
nerve fiber layer (RNFL) and ONH. The commercially
available glaucoma imaging devices (GIDs) include: optical
coherence tomography (OCT), confocal scanning laser
ophthalmoscopy (CSLO) and scanning laser polarimetry
(SLP).
Using the best parameters of each GID has been shown to
have specificity and sensitivity similar to that of glaucoma
experts in detecting glaucomatous ONH abnormalities40,41.
Studies directly comparing these three technologies
have not found significant differences in their diagnostic
ability42-46. In 2007, the American Academy of
Ophthalmology suggested that information from imaging
printouts is best used in conjunction with other clinical
parameters47.
BASICS OF OCTOCT generates cross-sectional and three-dimensional
(3D) images of retinal structures by detecting coherent
(non-scattered) light echoes with an interferometer. The
most important glaucoma application of the device is the
measurement of RNFL thickness. Thinning of the RNFL
has been well correlated with the fundamental
pathophysiology of glaucoma namely the destruction
of the ganglion cell layer of the retina20.
The commercial time-domain OCT (TD-OCT) system
(StratusOCT, Carl Zeiss Meditec, Dublin, CA (CZMI)), has
an axial resolution of 8-10µm and obtains scans at a rate
of 400 axial scans/second. A newer model of OCT,
Spectral Domain OCT (SD-OCT), is able to detect all of the
light echoes simultaneously rather than sequentially, as in
time domain detection. This enables a dramatic increase
in resolution and scanning speed, most offering a 5-7µm
axial resolution and 25,000 scans per second. The
increase in resolution is advantageous in following small
changes in progression.
OCT provides reproducible quantification of the RNFL
thickness13-15. a measurement that correlates with the
fundamental pathophysiology of glaucoma, namely the
destruction of the ganglion cell layer of the retina. OCT
provides good glaucoma discrimatory power with an area
under the receiver operating curve of 0.79 to 0.97,
depending on the referenced sector21-25.
COMMERCIAL TYPES OF OCTTD-OCT
• Stratus (CZMI)
SD-OCT
• Cirrus (CZMI)
• Spectralis (Heidelberg Engineering, Heidelberg,
Germany)
• RTView (Optovue, Fairmont, CA)
• TopCon (Topcon Medical Systems, Inc, Paramus, NJ)
• Bioptogen (Research Triangle Park, Durham, NC)
FEATURED HIGHLIGHTS OF OCT DEVICESWhen deciding on an device to use in the clinic or in
research, consider that different instruments have
different special features which make them unique.
Various imaging devices emphasize:
• Tracking to control for eye motion.
• 3-Dimensional reconstruction.
• Advanced visualization with cube data
• Averaging scan data to make for a visually appealing
image.
• Fundus image either red-free or CSLO, which
provides information about orientation.
• Quantification of various parameters.
• Comparison to a normative database to use clinically.
• A variety of scan patterns allowing for multiple means
of visualizing any pathology.
• Automatic registration within a cube of data allowing
for more accurate change analyses.
OCT SCAN PATTERNSTD-OCT
• Peripapillary Circle Scan
– This is relevant in glaucoma as it is a robust
indicator of the nerve fiber layer thickness.
• ONH
– Provides cup and disc parameters.
• Macula
– This is an alternative to the circle scan which
provides a statistically significant correlation with
glaucoma.
– Note: Correlation r=.52 between overall mean
macular thickness and peripapillary RNFL
thickness

2010 Annual Meeting Syllabus | 345
In a longitudinal study published in 2005 by Wollstein,
et al., OCT sensitivity using RNFL thickness was higher
than that of SAP. [Reference]
SD-OCT
• 3-Dimensional Cube (multiple B-scans compiled)
– Post-processing allows a misaligned scan to be
fixed, removing a limitation of TD-OCT.
– Increased reproducibility in comparison with
TD-OCT [Reference: Kim JS, Br J Ophthalmol 2009]
– Faster speed in comparison with TD-OCT reduces
the number of motion artifacts
CASE 1: NORMAL EYE This was a 45 year old Caucasian man with
hypothyroidism and no ocular disease. Best corrected
visual acuity in the left eye is 20/16 wearing a prescription
of -2.00+1.50x174, intraocular pressure (IOP) was
12 millimeters of mercury (mmHg), and pachymetry
showed a central corneal thickness (CCT) of 586. The
anterior chamber was normal, and the dilated fundus
exam revealed a normal appearing ONH with no other
abnormalities (Fig. 1). Humphrey visual fields (HVF) were
full (Fig. 2) and showed no progression over the span of
5 years (Fig. 3).
Imaging with OCT, both TD (Fig. 4-9) and SD (Fig. 10-15)
revealed structures with parameters within the normal
distribution. Confocal scanning laser ophthalmoscopy
(CSLO) and scanning laser polimetry (SLP) confirmed
normal ONH parameters (Fig. 17 and 18, respectively).
FIGURE 1: Normal color photo (left) and red-free photo (right)of a normal optic nerve head. The white arrow points to thenormal coloration of the nerve fiber bundles in a red-free photo.
FIGURE 2: HVF – Normal gray scale (left) and pattern deviation (right).
FIGURE 3: HVF – VFI graph over 5 years showing noprogression.
FIGURE 4: Stratus OCT - Circumpaillary B scan with excellentsignal strength showing a normal retinal nerve fiber layerthickest in the superior and inferior regions.
FIGURE 5: Stratus OCT Infrared Photo — Circumpaillary scanproperly placed around the ONH (left) and off-centered,displaced nasally (right).

346 | North American Neuro-Ophthalmology Society
FIGURE 6: Stratus OCT circumpaillary thickness profiles forproperly placed (A, B) and nasally displaced (C, D) scanscompared with normal distribution percentiles. Note that the“double hump” pattern in C and D is spread apart. This changesthe thickness, although remaining in the normal distribution.
FIGURE 7: Well-centered Stratus OCT macula raster scan. (A) Infrared fundus image. (B) Normal vertical retinal B scan.Note the paucity of reflectance centrally at the foveal dip. (C) Thickness chart — overall retinal thickness compared to anormative database. (D) Retinal volume map quantitative colormap (top) and sectoral comparison to a normative database(below). Note that the blue foveal thinning is placed centrally.
a
b
c
d
a
b
c
d

2010 Annual Meeting Syllabus | 347
FIGURE 8: Nasally displaced Stratus OCT macula raster scan.(A) Vertical macular B scan. Note that the foveal dip hasincreased reflectance in comparison with the well-centeredscan shown in Figure 7B. (B) Thickness chart with the scandisplaced nasally. (C) Retinal volume map quantitative colormap (top) and sectoral comparison to a normative database(below). Note that the blue foveal thinning is displaced. In thiscase, the quantitative assessment of the macula overall has notbeen compromised, however, the foveal thickness issignificantly different (in comparison with Figure 7D).
FIGURE 9: Normal ONH Scan from Stratus TD-OCT. (A) InfraredONH image. (B) ONH parameter outlining a small cup-to-discratio (C/D). (C) ONH Analysis Results (D) Manually placed edgesof retinal pigment epithelium (red-circles) allow for a computergenerated disc (blue shaded area). (E) Vertical ONH B scanwithout any graphics shows a thick RNFL at the ONH.
a
b
c
a b
c
d
e

348 | North American Neuro-Ophthalmology Society
FIGURE 10: Normal Optic Disc Cube 200x200 from Cirrus SD-OCT showing no progression. (A) RNFL Thickness Map. (B) En-face fundus image showing the location of theperipapillary circle scan location. (C) RNFL Tomogram extractedfrom the cube. (D) RNFL thickness profile compared to anormative database at the Temporal-Superior-Nasal-Inferior-Temporal (TSNIT) locations. (E) RNFL Thickness — Average,Quadrants, and Clock Hours. (F) Optic disc cube maps over 2 years showing no progression. These scan locations areautomatically registered within the cube with the intent to have a consistent circle scan location in following progression.(G) Progression graph of average, superior, and inferiormeasurements. (H) Progression graph of RNFL thickness profile.
FIGURE 11: Normal Optic Disc Cube 200x200 from Cirrus SD-OCT, advanced visualization function. (A) CSLO fundusimage showing the vertical (Purple line) and horizontal (blue line) scans available for viewing in the cube. (B) Vertical BScan through the ONH. (C) Hortizontal B Scan through ONH.
aa bb
c
d
e
f
g
h
a b
c
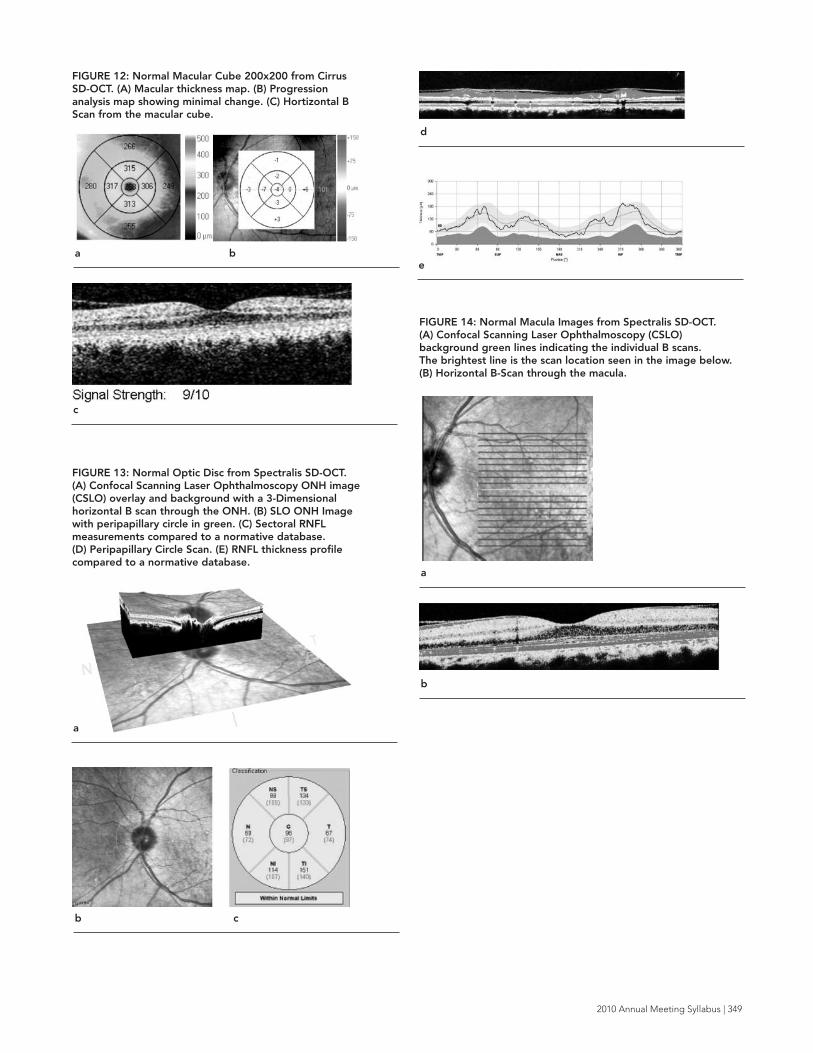
2010 Annual Meeting Syllabus | 349
FIGURE 12: Normal Macular Cube 200x200 from CirrusSD-OCT. (A) Macular thickness map. (B) Progressionanalysis map showing minimal change. (C) Hortizontal BScan from the macular cube.
FIGURE 13: Normal Optic Disc from Spectralis SD-OCT. (A) Confocal Scanning Laser Ophthalmoscopy ONH image(CSLO) overlay and background with a 3-Dimensionalhorizontal B scan through the ONH. (B) SLO ONH Imagewith peripapillary circle in green. (C) Sectoral RNFLmeasurements compared to a normative database. (D) Peripapillary Circle Scan. (E) RNFL thickness profilecompared to a normative database.
FIGURE 14: Normal Macula Images from Spectralis SD-OCT. (A) Confocal Scanning Laser Ophthalmoscopy (CSLO)background green lines indicating the individual B scans. The brightest line is the scan location seen in the image below.(B) Horizontal B-Scan through the macula.
a b
c
a
b c
d
e
a
b

350 | North American Neuro-Ophthalmology Society
FIGURE 15: Normal Images from TopCon SD-OCT.(A) Peripapillary circle scan. (B) Vertical scan through ONH. (C) Macular scan.
FIGURE 16: Normal Images from RTView SD-OCT. (A) En-faceONH Image. (B) 3-Dimensional horizontal ONH scan cube datawith CLSO overlay. Green line in (A) indicating location of scan.(C) ONH scan. (D) Peripapillary cirlcle scan. (E) Thickness map ofONH compared to a normative database. (F) RNFL profilecompared to a normative database. (G) Horizontal cross-linescan of macula. (H) Vertical cross-line scan of macula. (I) GanglionCell Complex (GCC) Scan of the macula with thickness map (left)and significance map (right).
b
c
a
b
c
d
e
f
g
a

2010 Annual Meeting Syllabus | 351
TAKE HOME POINTS1. Use OCT scans with a high quality signal strength.
2. Use OCT scans with good alignment around the
ONH and on the macula.
3. It is beneficial to analyze data using the normative
database.
CASE 2: GLAUCOMA — THE FOCAL DEFECT WITH EXCELLENT CORRESPONDENCE BETWEENSTRUCTURE AND FUNCTIONThis was the left eye of a 57 year old female with normal
tension glaucoma treated with Lumigan, Cosopt, and
Alphagan. Best corrected visual acuity was 20/30 wearing
a prescription of +0.75+0.50x90 and the IOP was 11 mm.
The anterior segment examination was normal with wide
open angles. The dilated fundus exam revealed an ONH
with C/D = 0.85x0.6 with no other abnormalities
(Fig. 19 A).
Red-free photography reveals a RNFL wedge defect at
4:00 (Figure 19B black arrows). Humphrey visual fields
(HVF) showed a superior nasal step and superior
paracentral scotoma (Figure 20).
FIGURE 17: Normal Images from Scanning Laser Polarimetrywith the highest quality (10/10). (A)Nerve fiber layer thicknessmap of the ONH. (B) Deviation map compared to a normativedatabase.
FIGURE 18: Normal Images from CSLO. (A) MoorfieldsRegression Analysis within normal limits within each sector. (B) Topographic Change Analysis over 8 years showing normalvariation around blood vessels on a CSLO background. (C) RNFL Profile compared to a normative database.
h
i
a b
a b
c

352 | North American Neuro-Ophthalmology Society
Imaging with OCT, both TD (Fig. 21-23) and SD (Fig. 24)
confirm this defect. Confocal scanning laser
ophthalmoscopy (CSLO) and Scaning Laser Polarimetry
also confirms this defect (Fig. 25 A and B, respectively).
FIGURE 19: Color disc photo (left) and Red-Free photo (right)with discoloration indicating an area of defect (between blackarrow), better seen in the red-free photo.
FIGURE 20: HVF showing visual fields with a superior nasal stepand superior paracentral scotoma. Grey scale (left) and patterndeviation (right). Glaucoma Hemifield Test (GHT) is outside ofnormal limits, visual field index (VFI)= 80%, mean deviation(MD)=-4.66 dB with p<0.5%, pattern standard deviation(PSD)=8.63dB with p<0.5%.
FIGURE 21: Images from Stratus TD-OCT Peripapillary CircleScan. (A) B Scan showing focal RNFL inferiotemporal thinning(white arrow). (B) RNFL thickness profile comparison to anormative database confirming the inferiotemporal defect seenin (A). (C) Clock-hours (left) and quadrants (right) comparison toa normative database, again confirming the finding in (A).
FIGURE 22: Stratus OCT macula raster scan. (A) Macular B scanat 330 degrees. Note the thin RNFL indicated by the whitearrow. (B) Thickness chart – overall retinal thickness comparedto a normative database. (C) Retinal volume map quantitativecolor map (left) and sectoral comparison to a normativedatabase (right).
a b
a b
a
b
c
a
b
c

2010 Annual Meeting Syllabus | 353
FIGURE 23: Stratus OCT Images (A) Optic Nerve Head Map. Black arrow indicating where the neuroretinal rim isthinnest, 4:00. (B) Radial B Scan through ONH 4:00 withmanually placed edges of retinal pigment epithelium (red-circles) allow for a computer generated disc (blue shaded area). (E) Identical B scan as (B) without any graphics.
FIGURE 24: Images from RTView SD-OCT (A) “NHM4” ONHScan showing a neuroretinal rim thinnest inferiorly. (B) ONHScan with RNFL sector measurements along the 3.45mmdiameter peripapillary circle. (C) RNFL Thickness Profile alongthe 3.45 mm circle. (D) Vertical Crossline through the maculashowing decreased reflectance of the inferior RNFL.
a
b
c
a
b
c
d
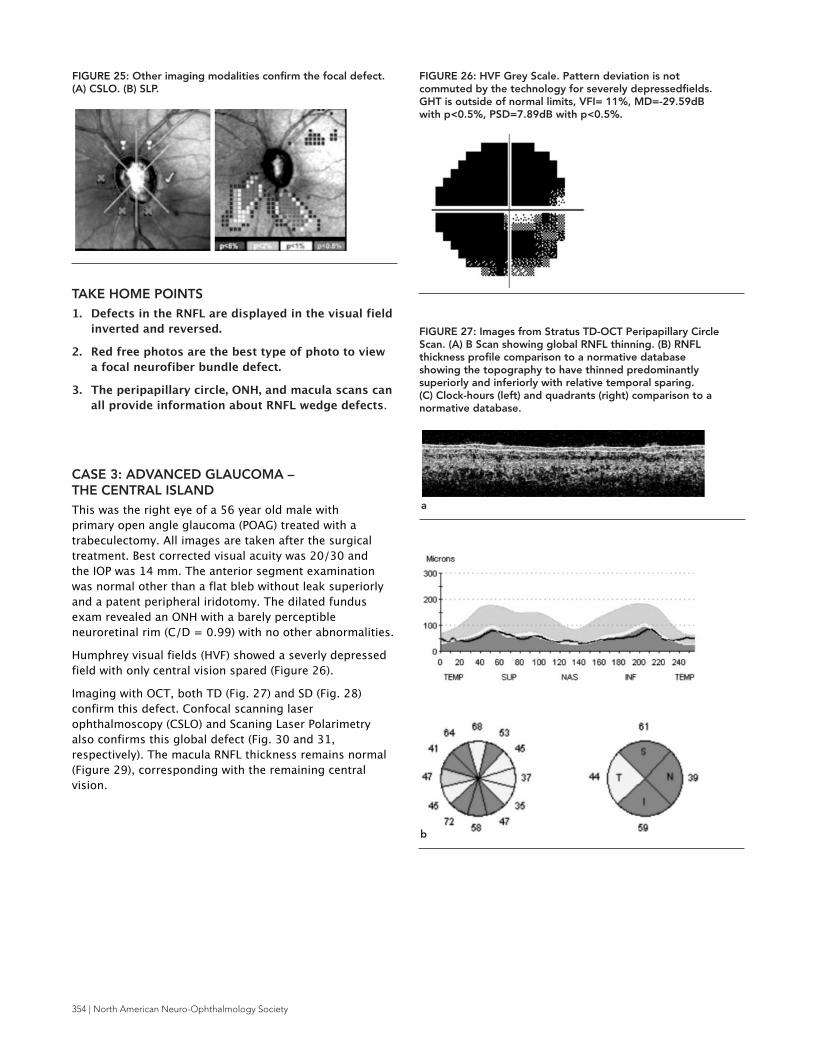
354 | North American Neuro-Ophthalmology Society
TAKE HOME POINTS1. Defects in the RNFL are displayed in the visual field
inverted and reversed.
2. Red free photos are the best type of photo to view
a focal neurofiber bundle defect.
3. The peripapillary circle, ONH, and macula scans can
all provide information about RNFL wedge defects.
CASE 3: ADVANCED GLAUCOMA – THE CENTRAL ISLANDThis was the right eye of a 56 year old male with
primary open angle glaucoma (POAG) treated with a
trabeculectomy. All images are taken after the surgical
treatment. Best corrected visual acuity was 20/30 and
the IOP was 14 mm. The anterior segment examination
was normal other than a flat bleb without leak superiorly
and a patent peripheral iridotomy. The dilated fundus
exam revealed an ONH with a barely perceptible
neuroretinal rim (C/D = 0.99) with no other abnormalities.
Humphrey visual fields (HVF) showed a severly depressed
field with only central vision spared (Figure 26).
Imaging with OCT, both TD (Fig. 27) and SD (Fig. 28)
confirm this defect. Confocal scanning laser
ophthalmoscopy (CSLO) and Scaning Laser Polarimetry
also confirms this global defect (Fig. 30 and 31,
respectively). The macula RNFL thickness remains normal
(Figure 29), corresponding with the remaining central
vision.
FIGURE 25: Other imaging modalities confirm the focal defect.(A) CSLO. (B) SLP.
FIGURE 26: HVF Grey Scale. Pattern deviation is notcommuted by the technology for severely depressedfields.GHT is outside of normal limits, VFI= 11%, MD=-29.59dBwith p<0.5%, PSD=7.89dB with p<0.5%.
FIGURE 27: Images from Stratus TD-OCT Peripapillary CircleScan. (A) B Scan showing global RNFL thinning. (B) RNFLthickness profile comparison to a normative databaseshowing the topography to have thinned predominantlysuperiorly and inferiorly with relative temporal sparing. (C) Clock-hours (left) and quadrants (right) comparison to anormative database.
a
b

2010 Annual Meeting Syllabus | 355
FIGURE 28: (A) Optic Disc Cube 200x200 from Cirrus SD-OCT. (A) RNFL Thickness Map displays global thinning (top). En-face fundus image showing thinning most prominentsuperiorly and interiorly (bottom). (B) RNFL Thickness –Average (top), Quadrants (middle), and Clock Hours(bottom). (C) RNFL Tomogram extracted from the cube. (D) RNFL thickness profile compared to a normativedatabase at the TSNIT locations.
FIGURE 29: Macular Cube 200x200 from Cirrus SD-OCT. (A) Macular thickness map displaying that the macular hasbeen spared from the otherwise global RNFL damage. (B) Horizontal (top) and vertical (bottom)B scans from themacular cube. (C) 3D segmentation of the macula showingthe green circular island of retinal thickness at the maculasurrounded by sea of thin (blue) retina.
FIGURE 30: CLSO Moorfields Regression Analysis outsidenormal limits for each sector.
a b
c
d
a
b c

356 | North American Neuro-Ophthalmology Society
TAKE HOME POINTS1. The RNFL thickness “bottoms out” at 40 microns
in severe damage.
2. Although the TD- and SD-OCT are not
quantitatively identical, they can both provide
into a RNFL defect location and severity.
CASE 4: GLAUCOMA — GLOBAL PROGRESSION This was the left eye of a 52 year old female with juvenile
glaucoma secondary to juvenile rheumatory arthritis. She
was treated with a trabeculectomy in 2004. She also has
ocular rosacea and is psuedophakic. All images are taken
after the surgical treatments. From 2005 to 2009 she
progressed globally both structurally by OCT and
functionally by HVF.
From 2005-2009, the patient’s exam remained stable.
Best corrected visual acuity was 20/30 and the IOP was
12 mm Hg, and remained stable without drops. External
exam was notable for telangiectasis on the lids. The
anterior segment examination was normal other than a
flat bleb without leak superior and a patent peripheral
iridotomy. The posterior chamber intraocular lense was
in place. The dilated fundus exam revealed a pale ONH
with a thin neuroretinal rim (C/D = 0.9) with no other
abnormalities.
Red-free photography clearly shows a loss of the
neurofiber layer from 2005 to 2009. In 2005, clear
neurofiber bundles are visualized following the vascular
arches (Figure 32 B). In 2009, these striations have
disappeared and the shadows of choroidal vessels
are clear (Figure 32D).
In 2005 and 2009, HVF showed significantly depressed
fields with both superior and inferior arcuate scotomas
and superior and inferior nasal steps. (Figure 33).
Glaucoma progression analysis showed a significant VF
deterioration in the superior and inferior nasal step areas.
(Figure 34A). The VFI analysis shows non-significant
progression (Figure 34B).
Imaging with TD-OCT (Figure 35) shows a significant
progression globally from 2005 to 2009 (Figure 36).
The RNFL thins much more than the HVF would suggest.
The macula RNFL thickness remains normal (Figure 37),
corresponding with the remaining central vision.
\
FIGURE 31: SLP image nerve fiber layer thickness map of theONH showing a globally thin RNFL (blue).
FIGURE 32: Color and Red-free photography. In 2005, clearneurofiber bundles are visualized following the vasculararches (B, between white arrows). In 2009, these striationshave disappeared and the shadows of choroidal vessels areclear (D, between white arrows).
a b
c d

2010 Annual Meeting Syllabus | 357
FIGURE 34: Glaucoma progression analysis (A) showed asignificant VF deterioration in the superior and inferior nasalstep areas. The VFI progression analysis shows non-significantprogression (B).
FIGURE 33: HVF grey scale (left) and pattern deviation (right)from 2005 (A and B) and 2009 (C and D) showing visual fieldswith a superior and inferior nasal step as well as a superiorand inferior arcuate. In 2005, GHT is outside of normal limits,VFI= 77%, MD=-9.82 dB with p<0.5%, PSD=7.28dB withp<0.5%. In 2009, GHT is outside of normal limits, VFI=73%,MD=-11.53 dB with p<0.5%, PSD=8.13dB with p<0.5%.
FIGURE 35: Stratus OCT TD-OCT Images in in 2005 (A, C,and E) and 2009 (B, D, and F). Images (A) and (B) show thecircumpaillary B scan in 2005 and 2009, respectively.Comparing (A) and (B) one can see the RNFL thinningglobally. Images (C) and (D) show the RNFL thickness profilecomparison to a normative database in 2005 and 2009,respectively. Images (E) and (F) show clock-hours (left) andquadrants (right) in comparison to a normative database in2005 and 2009, respectively.
a 2005
a
b
a 2005
b 2009
b 2009
c 2009
d 2009
e 2005

358 | North American Neuro-Ophthalmology Society
TAKE HOME POINTS1. OCT is a tool that is able to quantify progression,
even when a clinical fundus exam remains stable.
CASE 5: GLAUCOMA — “PREPERIMETRIC”This was the right eye of a 70 year old female with a
history of ocular hypertension since 1994, referred to the
glaucoma service in 2004 after a structural defect was
seen on imaging. No visual field defects appeared until
2006. She was treated in 2008 and 2009 with Selective
Laser Trabeculoplasty.
Best corrected visual acuity was 20/20 and the IOP was
recorded as 24 mm Hg in 2004 and 13 mm Hg in 2009.
The anterior segment examination was normal with open
angles. The dilated fundus exam revealed an ONH with
C/D = 0.9x0.8 in 2004 and 0.9x0.9 in 2009 with no other
abnormalities (Figure 38 A and B, respectively).
Humphrey visual fields (HVF) in 2004 show a normal field
and in 2009 shows a superior nasal and a superior arcuate
scotoma. (Figure 39 A and B, respectively).
Imaging with TD-OCT (Figure 41) displays a progressing
inferior RNFL defect from 2004-2009. The RNFL changes
are significant and progressive (Figure 42). Confocal
scanning laser ophthalmoscopy (CSLO) confirmed thie
defect in 2004 (Fig. 45).
Imaging of the macula with OCT, both TD (Fig. 43) and SD
(Fig. 44) also show an inferior defect. Figure 44 displays
the progressive changes from 2006-2009.
FIGURE 36: Stratus TD-OCT Progression Analysis. (A) RNFLProfiles color coded by date (top) and graph of averageRNFL thickness (bottom) showing a significant rate ofchange. (B) Dates of scans color coded along with signalstrengths and quantitative measurements of each scan.
FIGURE 37: Vertical Macular B Scan (A) and Retinal ThicknessMap (B). The macula in this scenario has been preserveddespite the global damage.
a
b
f 2009
a
b

2010 Annual Meeting Syllabus | 359
FIGURE 38: Color ONH Photographs in 2004 (A) and 2009(B). Note the baring of the lamina cribrosa inferiorly fromand the superior neuroretinal thinning 2004 to 2009.
FIGURE 39: HVF from 2004 and 2009. HVF grey scale (left)and pattern deviation (right) from 2004 (A) and 2009 (B). In 2004, GHT is outside of normal limits, VFI= 100%,MD=+0.46 dB and PSD=1.78dB. In 2009, GHT is outside of normal limits, VFI=94%, MD=-2.73 dB with p<2%, andPSD=3.82dB with p<0.5%.
FIGURE 40: Glaucoma progression analysis from 2004-2009(A) showed a significant VF deterioration in the superiornasal step area. The VFI progression analysis from 2004-2009 shows non-significant progression (B).
FIGURE 41: Stratus OCT TD-OCT Images in in 2004 (A, C,and E) and 2009 (B, D, and F). Images (A) and (B) show thecircumpaillary B scan in 2004 and 2009, respectively.Comparing (A) and (B) one can see the RNFL thinninginferiorly and inferiotemporally (between white arrows).Images (C) and (D) show the RNFL thickness profilecomparison to a normative database in 2004 and 2009,respectively. Images (E) and (F) show clock-hours (left) andquadrants (right) in comparison to a normative database in2004 and 2009, respectively.
a 2004 b 2009
a 2004
b 2009
a
b
a 2004

360 | North American Neuro-Ophthalmology Society
FIGURE 42: Stratus TD-OCT Progression Analysis. (A) RNFLProfiles color coded by date (top) and graph of averageRNFL thickness (bottom) showing a significant rate ofchange. In between the black arrows, the graph highlightsthe inferior area that thins progressively from the first visit(black line) to the last visit (red line). (B) Dates of scans colorcoded along with signal strengths and quantitativemeasurements of each scan.
FIGURE 43: Macular Scan from Stratus TD-OCT. (A) Verticalmacular B Scan. (B) Retinal Thickness Chart. (C) RetinalThickness Map. The macula in this case shows some inferiorthinning.
a
b
a
b
b 2009
c 2004
d 2009
e
f

2010 Annual Meeting Syllabus | 361
TAKE HOME POINTS1. OCT is capable of detecting damage to the RNFL
before functional change occurs.
2. OCT is a tool that is able to quantify progression,
even when a clinical fundus exam remains stable.
3. Some progression analyses are very useful in
visualizing damage, especially for explaining to
patients.
CASE 6: GLAUCOMA — FLUCTUATING FUNCTIONBEFORE STRUCTUREThis was the left eye of a 75 year old male with a history
of ocular hypertension vs. POAG since 2000 treated with
Brimonidine-Timolol drops. A small focal superionasal
scotoma appeared from 2002- 2005, disappeared from
2006-2008, and reappeared in 2009 with no overall
progression (Figure 46). Until 2006 when the OCT
showed a clock-hour defect at 5:00, this spot was
considered a patient–dependent error or lid line mark.
In retrospect, this mark was indicative of impending
corresponding structural changes.
Best corrected visual acuity was 20/25 and the IOP was
recorded as 22 mm Hg in 2005 and 28 mm Hg in 2009.
The anterior segment examination was normal with open
angles. The dilated fundus exam revealed an ONH with
C/D = 0.8 in 2005 and 0.9 thinnest inferiorly in 2009 with
no other abnormalities. In 2006, a disc hemorrhage could
be seen at 5:00 (Figure 45).
Imaging with OCT, both TD (Fig. 48) and SD (Fig. 49)
display a progressive 5:00 defect (Figures 47 and 49).
FIGURE 44: RTView SD-OCT Ganglion Cell Complex (GCC)Progression Scans of the macula. (A) Deviation mapsshowing thinning inferiorly in comparison with a normativedatabase. (B) Significance maps in comparison with anormative database. (C) Graphic change of average (red),superior (blue), and inferior (green) GCC thickness.
FIGURE 45: Other imaging modalities confirming the pre-perimetric inferior defect in 2004 (A) CSLO. (B) SLP.
FIGURE 45: Color ONH Photographs in 2006. The blackarrow points to a disc hemorrhage, which often indicatesprogression at that location.
c
a 2006 2007 2008 2009
b 2006 2007 2008 2009
c
a b

362 | North American Neuro-Ophthalmology Society
FIGURE 46: HVF from 2002-2009. (A) HVF grey scale (top)and pattern deviation (bottom) shows a fluctuating focalsuperior scotoma. (B) VFI progression shows no progression.
FIGURE 47: Stratus TD-OCT Progression Analysis. (A) RNFLProfiles color coded by date (top) and graph of averageRNFL thickness (bottom) showing a significant rate ofchange. The black arrow indicates the inferior area that thinsprogressively from the first visits (black/purple line) to thelast visit (dark blue line). (B) Dates of scans color codedalong with signal strengths and quantitative measurementsof each scan.
FIGURE 48: Stratus OCT TD-OCT Images in 2004 (A, C, and E) and 2008 (B, D, and F). Images (A) and (B) show thecircumpaillary B scan in 2004 and 2009, respectively.Comparing (A) and (B) one can see the RNFL thinninginferiorly and inferiotemporally (between white arrows).Images (C) and (D) show the RNFL thickness profilecomparison to a normative database in 2004 and 2009,respectively. Images (E) and (F) show clock-hours (left) andquadrants (right) in comparison to a normative database in2004 and 2009, respectively.
b
a
b
2002 2004 2005
a 2007 2008 2009
a 2005
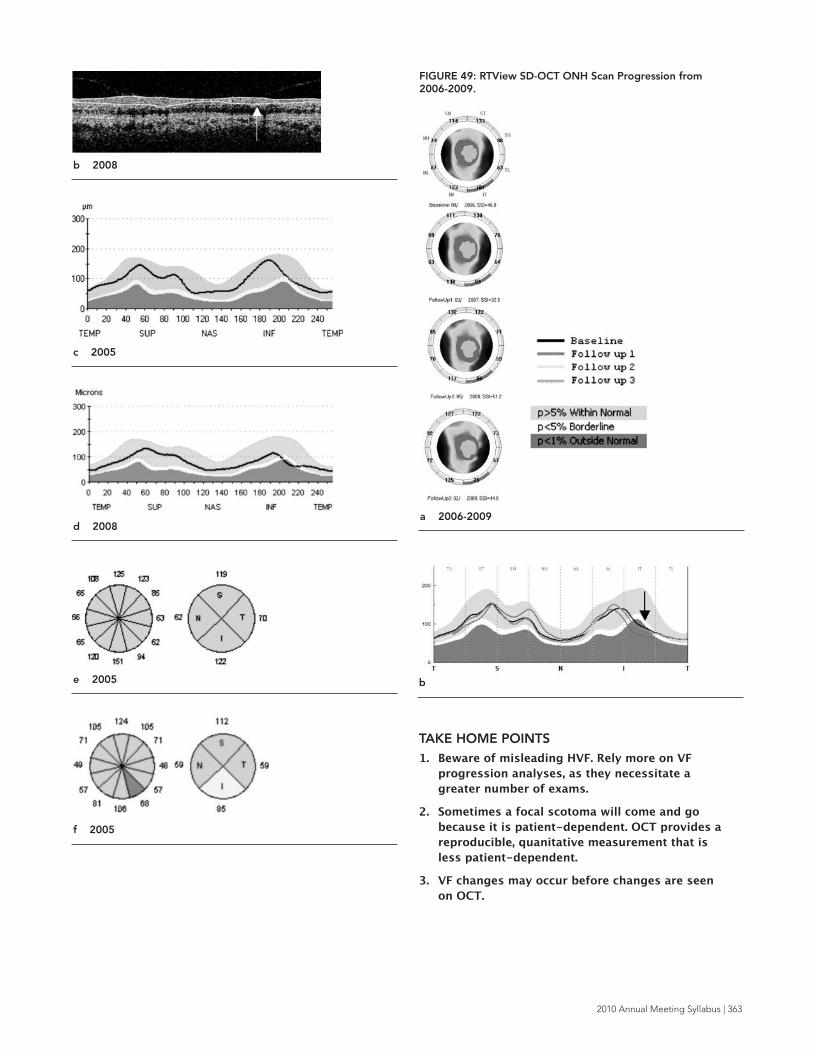
2010 Annual Meeting Syllabus | 363
TAKE HOME POINTS1. Beware of misleading HVF. Rely more on VF
progression analyses, as they necessitate a
greater number of exams.
2. Sometimes a focal scotoma will come and go
because it is patient-dependent. OCT provides a
reproducible, quanitative measurement that is
less patient-dependent.
3. VF changes may occur before changes are seen
on OCT.
FIGURE 49: RTView SD-OCT ONH Scan Progression from2006-2009.
b
b 2008
c 2005
d 2008
e 2005
f 2005
a 2006-2009

364 | North American Neuro-Ophthalmology Society
CASE 7: GLAUCOMA — STABLE HEMIFIELDSTRUCTURAL DAMAGE WITH BOTH STABLE AND FLUCTUATING FUNCTIONAL CHANGESThis was the right eye of a 65 year old female with a
history of POAG treated with trabeculectomy in 2006. All
images are taken after the surgical treatment, 2007-2009.
Best corrected visual acuity was 20/20 and the IOP was
6 mm Hg, and remained stable without drops. The
anterior segment examination was normal other than a
superior avascular bleb without leak and a patent
peripheral iridotomy at 1:00. The dilated fundus exam
revealed a, the increased cupping from 2007-2009
C/D = 0.8 to 0.9 with no other abnormalities.
From January 2007- February 2009, HVF displayed a
dense inferior nasal step and arcuate scotoma. It also
seemed that the patient’s glaucoma had progressed
functionally to include both a superior nasal step and
arcuate scotoma. However, when the patient returned in
September 2009, the superior defects nearly disappeared.
Imaging with OCT, both TD (Fig. 52) displayed a stable
RNFL thickness through this time period (Figures 53).
Other SD-OCT technologies showed similar B scan
profiles (Figures 54-57).
FIGURE 50: Color ONH Photographs in 2009.
FIGURE 51: HVF from 2007-2009. (A) HVF grey scale (top)and pattern deviation (bottom) shows a fluctuating superiornasal step and arcuate scotoma. (B) VFI progression showsno progression.
FIGURE 52: Stratus OCT TD-OCT Images in 2009 andprogression analysis. Image (A) shows the circumpaillary B Scan. Image (B) shows the RNFL thickness profile incomparison to a normative database. Image C shows clock-hours (left) and quadrants (right) in comparison to anormative database. (A)-(C) all correspond with HVF withmore superior RNFL structural damage leading to a denseinferior defect.
a
b
c
b
a 1/2007 10/2007 2/2009 9/2009
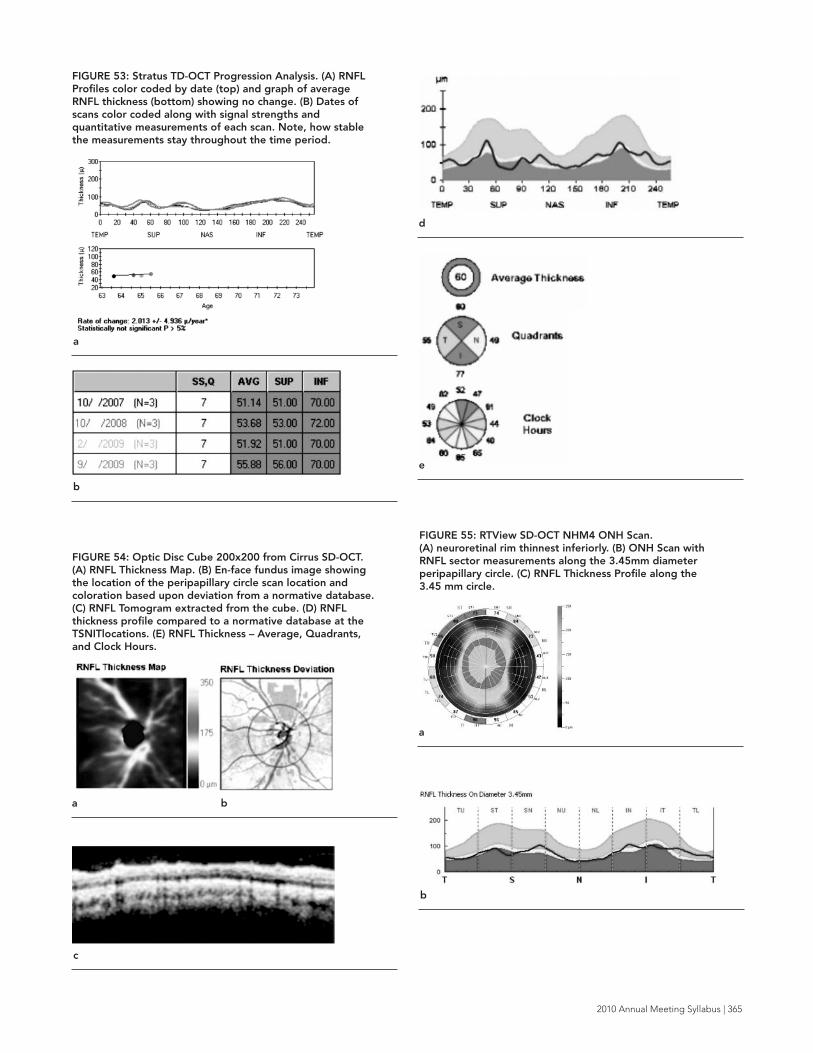
2010 Annual Meeting Syllabus | 365
FIGURE 53: Stratus TD-OCT Progression Analysis. (A) RNFLProfiles color coded by date (top) and graph of averageRNFL thickness (bottom) showing no change. (B) Dates ofscans color coded along with signal strengths andquantitative measurements of each scan. Note, how stablethe measurements stay throughout the time period.
FIGURE 54: Optic Disc Cube 200x200 from Cirrus SD-OCT.(A) RNFL Thickness Map. (B) En-face fundus image showingthe location of the peripapillary circle scan location andcoloration based upon deviation from a normative database.(C) RNFL Tomogram extracted from the cube. (D) RNFLthickness profile compared to a normative database at theTSNITlocations. (E) RNFL Thickness – Average, Quadrants,and Clock Hours.
FIGURE 55: RTView SD-OCT NHM4 ONH Scan. (A) neuroretinal rim thinnest inferiorly. (B) ONH Scan withRNFL sector measurements along the 3.45mm diameterperipapillary circle. (C) RNFL Thickness Profile along the3.45 mm circle.
a
b
e
c
d
a
a b
b

366 | North American Neuro-Ophthalmology Society
TAKE HOME POINTS1. Again, beware of misleading HVF — even large
areas can fluctuate. Do not judge a single VF in
isolation of the others that preceded it.
2. Currently, the various OCT technologies are not
quantitatively comparable to one another.
3. OCT is an excellent quantitative, objective, and
reproducible technology to monitor progression in
glaucoma, or lack thereof. This statement is
especially poignant in clinical management
decisions.
CME ANSWERS1. Retinal Nerve Fiber Layer (RNFL) thickness, ganglion
cell complex (GCC). Optic nerve head parameters
(ONH) may be useful as well, but there is insufficient
evidence base to validate at this time.
2. Circumpapillary Scan, Macular Scan, and ONH Scan.
3. Increase in scanning speed enabling 3D imaging,
improved resolution, post-processing capabilities,
increased reproducibility, and better sensitivity and
specificity in disease detection.
REFERENCES 1. Quigley HA, Broman AT. The number of people with glaucoma
worldwide in 2010 and 2020. Br J Ophthalmol 2006;90:
262-7.
2. Quigley HA. Number of people with glaucoma worldwide.
Br J Ophthalmol 1996;80:389-93.
3. George R, Vijaya L. First World Glaucoma day, March 6, 2008:
tackling glaucoma challenges in India. Indian J Ophthalmol
2008;56:97-8.
4. Abrams LS, Scott IU, Spaeth GL, Quigley HA, Varma R.
Agreement among optometrists, ophthalmologists, and
residents in evaluating the optic disc for glaucoma.
Ophthalmology 1994;101:1662-7.
5. Wong EY, Keeffe JE, Rait JL, et al. Detection of undiagnosed
glaucoma by eye health professionals. Ophthalmology
2004;111:1508-14.
6. Fingeret M, Medeiros FA, Susanna R, Jr., Weinreb RN. Five
rules to evaluate the optic disc and retinal nerve fiber layer
for glaucoma. Optometry 2005;76:661-8.
7. Gaasterland DE, Blackwell B, Dally LG, Caprioli J, Katz LJ,
Ederer F. The Advanced Glaucoma Intervention Study (AGIS):
10. Variability among academic glaucoma subspecialists in
assessing optic disc notching. Trans Am Ophthalmol Soc
2001;99:177-84; discussion 84-5.
8. Tielsch JM, Katz J, Quigley HA, Miller NR, Sommer A.
Intraobserver and interobserver agreement in measurement of
optic disc characteristics. Ophthalmology 1988;95:350-6.
9. Varma R, Steinmann WC, Scott IU. Expert agreement in
evaluating the optic disc for glaucoma. Ophthalmology
1992;99:215-21.
10. Artes PH, Iwase A, Ohno Y, Kitazawa Y, Chauhan BC.
Properties of perimetric threshold estimates from Full
Threshold, SITA Standard, and SITA Fast strategies. Invest
Ophthalmol Vis Sci 2002;43:2654-9.
11. Keltner JL, Johnson CA, Levine RA, et al. Normal visual field
test results following glaucomatous visual field end points in
the Ocular Hypertension Treatment Study. Arch Ophthalmol
2005;123:1201-6.
12. Kerrigan-Baumrind LA, Quigley HA, Pease ME, Kerrigan DF,
Mitchell RS. Number of ganglion cells in glaucoma eyes
compared with threshold visual field tests in the same
persons. Invest Ophthalmol Vis Sci 2000;41:741-8.
FIGURE 56: Spectralis SD-OCT. (A) Peripapillary circleB scan highlighting the RNFL with red lines. (B) RNFLthickness profile compared to a normative database.(C) Sectoral RNFL measurements compared to anormative database.
FIGURE 57: Peripapillary circle scan from TopCon SD-OCT.
a
b
c
a

2010 Annual Meeting Syllabus | 367
13. Schuman JS, Pedut-Kloizman T, Hertzmark E, et al.
Reproducibility of nerve fiber layer thickness measurements
using optical coherence tomography. Ophthalmology
1996;103:1889-98.
14. Paunescu LA, Schuman JS, Price LL, et al. Reproducibility of
nerve fiber thickness, macular thickness, and optic nerve
head measurements using StratusOCT. Invest Ophthalmol Vis
Sci 2004;45:1716-24.
15. Kim JS IH, Sung KR, Xu J, Wollstein G, Bilonick RA, Kagemann
L, Duker JS, Fujimoto JG, Schuman JS. . Retinal Nerve Fiber
Layer Thickness Measurement Reproducibility Improved with
Spectral Domain Optical Coherence Tomography. Br J
Ophthalmol 2009;93:1057-63.
16. Williams ZY, Schuman JS, Gamell L, et al. Optical coherence
tomography measurement of nerve fiber layer thickness and
the likelihood of a visual field defect. Am J Ophthalmol
2002;134:538-46.
17. Bourne RR, Medeiros FA, Bowd C, Jahanbakhsh K, Zangwill LM,
Weinreb RN. Comparability of retinal nerve fiber layer
thickness measurements of optical coherence tomography
instruments. Invest Ophthalmol Vis Sci 2005;46:1280-5.
18. Budenz DL, Michael A, Chang RT, McSoley J, Katz J. Sensitivity
and specificity of the StratusOCT for perimetric glaucoma.
Ophthalmology 2005;112:3-9.
19. Leung CK, Chan WM, Hui YL, et al. Analysis of retinal nerve
fiber layer and optic nerve head in glaucoma with different
reference plane offsets, using optical coherence tomography.
Invest Ophthalmol Vis Sci 2005;46:891-9.
20. Kanamori A, Escano MF, Eno A, et al. Evaluation of the effect
of aging on retinal nerve fiber layer thickness measured by
optical coherence tomography. Ophthalmologica
2003;217:273-8.
21. Nouri-Mahdavi K, Hoffman D, Tannenbaum DP, Law SK,
Caprioli J. Identifying early glaucoma with optical coherence
tomography. Am J Ophthalmol 2004;137:228-35.
22. Kruse FE, Burk RO, Volcker HE, Zinser G, Harbarth U.
Reproducibility of topographic measurements of the optic
nerve head with laser tomographic scanning. Ophthalmology
1989;96:1320-4.
23. Dreher AW, Tso PC, Weinreb RN. Reproducibility of
topographic measurements of the normal and glaucomatous
optic nerve head with the laser tomographic scanner.
Am J Ophthalmol 1991;111:221-9.
24. Rohrschneider K, Burk RO, Kruse FE, Volcker HE.
Reproducibility of the optic nerve head topography with a new
laser tomographic scanning device. Ophthalmology
1994;101:1044-9.
25. Ford BA, Artes PH, McCormick TA, Nicolela MT, LeBlanc RP,
Chauhan BC. Comparison of data analysis tools for detection
of glaucoma with the Heidelberg Retina Tomograph.
Ophthalmology 2003;110:1145-50.
26. Mardin CY, Hothorn T, Peters A, Junemann AG, Nguyen NX,
Lausen B. New glaucoma classification method based on
standard Heidelberg Retina Tomograph parameters by
bagging classification trees. J Glaucoma 2003;12:340-6.
27. Miglior S, Guareschi M, Albe E, Gomarasca S, Vavassori M,
Orzalesi N. Detection of glaucomatous visual field changes
using the Moorfields regression analysis of the Heidelberg
retina tomograph. Am J Ophthalmol 2003;136:26-33.
28. Miglior S, Guareschi M, Romanazzi F, Albe E, Torri V, Orzalesi
N. the impact of definition of primary open-angle glaucoma
on the cross-sectional assessment of diagnostic validity of
Heidelberg retinal tomography. Am J Ophthalmol
2005;139:878-87.
29. Zangwill LM, Chan K, Bowd C, et al. Heidelberg retina
tomograph measurements of the optic disc and parapapillary
retina for detecting glaucoma analyzed by machine learning
classifiers. Invest Ophthalmol Vis Sci 2004;45:3144-51.
30. Hatch WV, Flanagan JG, Etchells EE, Williams-Lyn DE, Trope
GE. Laser scanning tomography of the optic nerve head in
ocular hypertension and glaucoma. Br J Ophthalmol
1997;81:871-6.
31. Iester M, Broadway DC, Mikelberg FS, Drance SM. A
comparison of healthy, ocular hypertensive, and
glaucomatous optic disc topographic parameters. J Glaucoma
1997;6:363-70.
32. Iester M, Mikelberg FS, Drance SM. The effect of optic disc
size on diagnostic precision with the Heidelberg retina
tomograph. Ophthalmology 1997;104:545-8.
33. Wollstein G, Garway-Heath DF, Hitchings RA. Identification of
early glaucoma cases with the scanning laser
ophthalmoscope. Ophthalmology 1998;105:1557-63.
34. Deleon-Ortega JE, Arthur SN, McGwin G, Jr., Xie A, Monheit BE,
Girkin CA. Discrimination between glaucomatous and
nonglaucomatous eyes using quantitative imaging devices
and subjective optic nerve head assessment. Invest
Ophthalmol Vis Sci 2006;47:3374-80.
35. Zangwill LM, Weinreb RN, Beiser JA, et al. Baseline topographic
optic disc measurements are associated with the development
of primary open-angle glaucoma: the Confocal Scanning
Laser Ophthalmoscopy Ancillary Study to the Ocular
Hypertension Treatment Study. Arch Ophthalmol
2005;123:1188-97.
36. Bowd C, Zangwill LM, Medeiros FA, et al. Confocal scanning
laser ophthalmoscopy classifiers and stereophotograph
evaluation for prediction of visual field abnormalities in
glaucoma-suspect eyes. Invest Ophthalmol Vis Sci
2004;45:2255-62.
37. Bowd C, Medeiros FA, Zhang Z, et al. Relevance vector
machine and support vector machine classifier analysis of
scanning laser polarimetry retinal nerve fiber layer
measurements. Invest Ophthalmol Vis Sci 2005;46:1322-9.
38. Essock EA, Zheng Y, Gunvant P. Analysis of GDx-VCC
polarimetry data by Wavelet-Fourier analysis across glaucoma
stages. Invest Ophthalmol Vis Sci 2005;46:2838-47.
39. Medeiros FA, Zangwill LM, Bowd C, Bernd AS, Weinreb RN.
Fourier analysis of scanning laser polarimetry measurements
with variable corneal compensation in glaucoma. Invest
Ophthalmol Vis Sci 2003;44:2606-12.
40. Vessani RM, Moritz R, Batis L, Zagui RB, Bernardoni S, Susanna
R. Comparison of quantitative imaging devices and subjective
optic nerve head assessment by general ophthalmologists to
differentiate normal from glaucomatous eyes. J Glaucoma
2009;18:253-61.

368 | North American Neuro-Ophthalmology Society
41. Greaney MJ, Hoffman DC, Garway-Heath DF, Nakla M,
Coleman AL, Caprioli J. Comparison of optic nerve imaging
methods to distinguish normal eyes from those with
glaucoma. Invest Ophthalmol Vis Sci 2002;43:140-5.
42. Essock EA, Sinai MJ, Bowd C, Zangwill LM, Weinreb RN. Fourier
analysis of optical coherence tomography and scanning laser
polarimetry retinal nerve fiber layer measurements in the
diagnosis of glaucoma. Arch Ophthalmol 2003;121:1238-45.
43. Hoffmann EM, Bowd C, Medeiros FA, et al. Agreement among
3 optical imaging methods for the assessment of optic disc
topography. Ophthalmology 2005;112:2149-56.
44. Leung CK, Chan WM, Chong KK, et al. Comparative study of
retinal nerve fiber layer measurement by StratusOCT and GDx
VCC, I: correlation analysis in glaucoma. Invest Ophthalmol
Vis Sci 2005;46:3214-20.
45. Medeiros FA, Zangwill LM, Bowd C, Weinreb RN. Comparison
of the GDx VCC scanning laser polarimeter, HRT II confocal
scanning laser ophthalmoscope, and stratus OCT optical
coherence tomograph for the detection of glaucoma. Arch
Ophthalmol 2004;122:827-37.
46. Schuman JS, Wollstein G, Farra T, et al. Comparison of optic
nerve head measurements obtained by optical coherence
tomography and confocal scanning laser ophthalmoscopy.
Am J Ophthalmol 2003;135:504-12.
47. Lin SC, Singh K, Jampel HD, et al. Optic nerve head and retinal
nerve fiber layer analysis: a report by the American Academy
of Ophthalmology. Ophthalmology 2007;114:1937-49.

2010 Annual Meeting Syllabus | 369
LEARNING OBJECTIVES 1. Understand the linear relationship between retinal
nerve fiber layer thickness and corresponding visual
field areas of sensitivity.
2. Understand the limitations of using the retinal nerve
fiber layer thickness to diagnose and monitor optic
nerve disorders.
3. Understand the advantages and disadvantages of
using the retinal ganglion cell layer thickness
determined by OCT for diagnosis and management of
optic neuropathy.
CME QUESTIONS1. Which of the following factors may confound the
accurate OCT determination of RNFL thickness for
diagnosing optic nerve damage?
a) Blood vessels
b) Proliferation of glial elements in the retina
c) Scan signal to noise
d) Developmental differences in the distribution of
axon bundles in the retina
e) all of the above
2. Which of the following clinical conditions is likely to
show the highest correlation between structure and
function using OCT?
a) compressive optic neuropathy
b) NAION after 6 months
c) optic neuritis after 6 months from the acute attack
d) visual field loss in a patient with idiopathic
intracranial hypertension
e) all of the above
3. Which of the following factors may significantly
confound the correlation between ganglion cell layer
thickness and corresponding locations of visual
sensitivity?
a) the number of ganglion cell layers in the normal
retina at the locations being evaluated
b) peripheral field location of damage
c) spatial variability in the mapping of ganglion cell
location to corresponding visual field
d) extent of visual field damage
e) all of the above
KEY WORDSOptical Coherence Tomography
Retinal Nerve Fiber Layer
Ganglion Cells
Glaucoma
Anterior Ischemic Optic Neuropathy
Optic Neuritis
Most clinicians, especially neuro-ophthalmlogists and
glaucoma specialists, have been trying to understand
whether the information yielded by optical coherence
tomography is really helping them to improve upon the
clinical care of their patients. In this context, clinical
decision-making has mainly focused on the status of the
retinal nerve fiber layer (RNFL) thickness in relation to the
threshold sensitivity of the corresponding area of visual
field (see review, reference 1). Theoretically, it is expected
that the degree of thinning of the RNFL will have a
meaningful correlation with optic nerve function in a
patient with loss of axons2-4 and less correlation of
structure with function in locations where axons are still
intact, but not functioning. In the latter case, either a
return of function may still be possible, as in the case
with some eyes with compressive optic neuropathy5,
acute optic neuritis6-9, or ischemic optic neuropathy.
Alternatively, the axons may have undergone irreversible
dysfunction but not enough time has elapsed to produce
atrophy and thinning of the RNFL1.
LINKING AXONS AND NEURONS: UNVEILING MYSTERIES OF THE MACULA AND MODELING NEUROPROTECTION
Randy Kardon, M.D. Ph.D. University of Iowa, Hospitals and Clinics
Iowa City, IA

370 | North American Neuro-Ophthalmology Society
The clinical interpretation becomes even more difficult in
the setting of optic disc edema associated with visual field
loss, since there may be swelling of some axons with
atrophy of neighboring axons, confounding the
relationship between RNFL thickness and corresponding
visual field sensitivity, as long as axon swelling is present
and atrophy is not yet complete. Another potential
confounding variable is the status of other components
that make up the thickness of the RNFL, besides axons,
such as blood vessels and glial elements, which may
influence the measured thickness of the RNFL1,10,11.
Attempts to quantify the relationship between structure
and function between RNFL thickness and visual threshold
at corresponding locations have discovered that there is a
correlation (primarily studied in glaucoma and anterior
ischemic optic neuropathy), but not as great as one would
expect (refs). Factors such as measurement variability in
both visual threshold and in RNFL thickness, the influence
of non-neuronal elements on the RNFL thickness such as
blood vessels and glial elements, and the inter-individual
variation in mapping of RNFL bundles to their
corresponding area of the visual field all confound the
correlation in an individual patient. We have recently
reviewed this topic1 and have provided evidence for a
linear model relating visual threshold (unlogged) and
RNFL thickness in glaucoma and AION2-4. This is depicted
in Fig 1 in semi-log plots.
While the relationship between RNFL thickness and visual
field sensitivity appears to correspond to a linear model,
there are still between and within subject components of
measurement variability that impose limitations of this
framework and its application to individual patients (see
Figure 2). In addition, the dynamic range of both the
RNFL and threshold sensitivity and their associated
measurement variability limit meaningful relationships to
be explored once 10 decibels of threshold loss have been
exceeded or if the RNFL thickness drops below 60 microns
for arcuate field loss.
In glaucoma studies, the RNFL thickness has been shown
to have a very good sensitivity and specificity for
diagnosing glaucoma, using Receiver-Operator
Characteristic curve analysis (ROC). It is important to keep
in mind that such analyses are always influenced by the
criteria that are chosen as the gold standard for the
presence or absence of the disease, the characteristics of
the population being studied in terms of the distribution
of severity of damage in the population included, and
whether structure (disc appearance) or function (visual
field sensitivity and the pattern of loss) is used as the
criteria for the presence of glaucomatous or optic nerve
disease.
A great deal of research has also been directed towards
using the RNFL thickness to detect progression of
glaucomatous damage over time (refs). Most of these
studies have applied techniques that have also been used
to study progression of visual field loss, namely a)
significant change in RNFL status at a given time point
from a prior baseline measurement or b) linear regression
analysis of RNFL thickness over time. The main problems
encountered in detecting progression using these
FIGURE. 1: Relationship of the retinal nerve fiber layer(RNFL) thickness to visual field loss in patients with glaucomaand AION. (A) A schematic illustrating the location of thecorresponding disc sectors and field regions for the superiorarcuate field (left panel) and inferior arcuate field (rightpanel). (B) RNFL thickness as a function of field loss for theupper field/inferior disc (left panel) and the lowerfield/superior disc (right panel). Data are shown for patientswith AION (n = 24; filled gray), asymmetric glaucoma (n =15;filled black), and severe glaucoma (n =16; open symbols),and for the mean of a group of 60 age-similar controls (opensquare). The theoretical structure-function curves are fittedto a linear function, but plotted here on a semi-log plot. Forthe upper and lower visual field regions, three theoreticalcurves are shown (50th percentile=solid line, 95th percentile,and 5th percentile = dashed lines). From review reference 1(with author permission).
FIGURE 2: The ellipses are the 95% confidence boundaries ofthe linear model of structure vs function with variabilitycomponent shown for different glaucoma disease states, d,expressed in decibels of field loss. The 95% ellipses for thecombined within- and between-individual variability (green),for between-individual variability excluding within-individualvariability (red), and for within-individual variability excludingbetween-individual variability (blue) are shown for six levelsof decibel visual field loss (from reference 4 with authorpermission).

2010 Annual Meeting Syllabus | 371
approaches are measurement variability and using
population statistics to determine what constitutes a
significant change over time. Individuals appear to vary
considerably in their measurement variability, so applying
population statistics (defining the variability of a given
patient by applying the variability from a population of
patients) to a given patient may not be optimal for
individualizing the analysis of progression for a given
patient. In addition, defining a statistically significant
change over time may not always equate with what is a
clinically significant change — one that would warrant a
deviation in treatment. Because the rate of glaucomatous
visual field progression varies considerably among treated
and untreated patients and the rate is, in general, slow,
the challenge in the future will be to identify as early as
possible which patients are at the most risk for
progression and focus aggressive treatment on those
patients while not applying the same treatment to patients
who are at low risk for significant progression over their
remaining life expectancy.
For neuro-ophthalmology, the OCT landscape for optic
nerve diseases other than glaucoma pose similar
problems. These mostly encompass the following
disorders and focus on questions regarding the
application of OCT to diagnosis and treatment:
1. Multiple Sclerosis: In this setting OCT is being used to
help substantiate the diagnosis of multiple sclerosis,
determine whether OCT can be used to monitor the
course and treatment of demyelinating disease and
predict which patients are likely to progress at a faster
rate, requiring a more tailored treatment approach6-9.
There is also evidence that total macular thickness may
also reflect neuronal loss in multiple sclerosis13. The
main interest at present is whether acute optic neuritis
is a good model for evaluating the efficacy of new CNS
multiple sclerosis treatment strategies, such as the use
of neuro-protectants and whether the use of OCT is a
valid surrogate for modeling the status of multiple
sclerosis and treatment strategy.
2. Non-arteritic anterior ischemic optic neuropathy
(NAION): Structural features on OCT are being
identified (such as neural opening size in the sclera)
which might predict which patients are at the most
risk for progressive visual field loss during the acute
phase of NAION and who may respond to treatment
interventions during the first 2 weeks (e.g. steroids).
It may be possible to use OCT to help identify patients
that are most likely to benefit from treatments aimed
at preserving axons.
3. Compressive optic neuropathy: The presumption is
that the greater number of axons that are present at
the time of diagnosis, the higher potential for visual
recovery if decompression is successful5. Here the
confounding variables are how much time must elapse
before axonal degeneration is detectable on OCT at
the time of diagnosis and how many neurons/axons
are required to support adequate visual function which
may influence treatment decisions?
4. Papilledema: When the optic nerve appears swollen,
the main questions applicable to OCT concern whether
true papilledema is present vs. pseudopapilledema12,
whether the change in optic disc edema over time can
be better quantified using thickening of the RNFL with
OCT compared to the fundus appearance of the optic
nerve and whether axon loss can be detected while the
disc is still swollen and differentiated from a reduction
in RNFL thickness due to lowering of intracranial
pressure.
5. Differentiation of optic neuropathy from
retinopathy and identifying disorders in which
both are present: OCT scans of other portions of the
posterior pole besides the RNFL can be very revealing.
For example, acute or subacute visual field loss with a
thickened macula on OCT but without obvious
evidence of retinal edema on fundus exam may help
point the diagnosis more correctly toward a branch or
central retinal artery occlusion (CRAO), and away from
anterior or posterior ischemic optic neuropathy,
inflammatory, or compressive optic neuropathy. In the
chronic state, an abnormally reduced total macular
thickness keeping company with a thinned RNFL and
pale nerve may also help make the diagnosis of a
previous retinal artery occlusion, without requiring an
electroretinogram (ERG) or neuro-imaging. Another
example is a patient with possible neuroretinitis and
persistent visual field loss; the combination of an OCT
scan of the peripapillary RNFL and macula scan may
help reveal the layer of the retina which is most likely
to be the source of pathology explaining the visual
field loss.
Most ophthalmologists use the macula OCT to
diagnose disorders causing loss of the photoreceptors
in the outer retina or disorders causing fluid
accumulation in the retina (e.g. cystoid macular
edema, diabetic macular edema, vitreal traction,
perifoveal telangiectasia, choroidal neovascular
membrane), or macular holes. Such patients may make
their way into a neuro-ophthalmology clinic and a
macular OCT may be an important diagnostic tool to
narrow the differential and reduce cost of a work-up.
The factors discussed above pose limitations on relating
the retinal nerve fiber layer to visual threshold and axon
loss. This has prompted an interest in going to the source
of the axons – the soma of retinal ganglion cells, which
predominate in the macula. Here the question is whether
the ganglion cell layer can be accurately quantified within
the macula scan using current OCT technology and
whether a change in the number of viable neurons can
accurately be detected with current software. This also
presupposes that the ganglion cells in the macula are
adequate surrogates for disease affecting the visual field
outside of the macula.

372 | North American Neuro-Ophthalmology Society
Segmentation of the ganglion cell layer within the
central macula with spectral domain OCT has a
number of potential advantages:
1. The retinal ganglion cells are densest in the macula
and form a stratified multi-cellular layer within the
central 6 degrees of visual field. Therefore, loss of
axons and the corresponding soma in this location is
likely to cause a thinning of the retinal ganglion cell
layer.
2. The lack of large retinal vessels in this location makes
their confounding contribution to the thickness of the
ganglion cell layer very minimal, compared to the
peripapillary retina, where they do influence the RNFL
measurement.
3. The mapping of visual field location to corresponding
ganglion cell soma is less complicated than the
situation with the RNFL bundles and may show less
inter-individual developmental variability.
Simplistically, a focal light in the macula activates the
ganglion cells directly underlying it. In the foveal and
perifoveal location this is not strictly the case and
some modification has to be made in this area of the
visual field due to displaced ganglion cells.
4. Recent advances in OCT image analysis using both
manual14 and automated analysis in three
dimensions15,16 have provided a potential solution
for delineation of the different neuronal layers in the
macula (Figures 3-4).
5. Preliminary attempts to quantify the correlation
between visual threshold and retinal ganglion cell
thickness in the macula appear to subjectively
correlate with the spatial pattern of visual field loss
in the macula in patients with glaucoma (Figure 5)
and anterior ischemic optic neuropathy. However,
a quantitative correlation between ganglion cell
thickness and corresponding overlying visual threshold
has not yet been reported in detail.
Challenges associated with OCT analysis of the macula
that need to be overcome before clinical monitoring of
optic nerve function is useful:
1. Total macula thickness is a measurement that is not
likely to be specific and sensitive enough to detect
small changes in the ganglion cell layer associated
with optic neuropathy. This is why segmenting the
different layers is likely to be a better approach.
FIGURE 3: Automated software 3D segmentation of theretinal layers of the normal macula using spectral domainSDOCT. Segmenation is shown for one of many successiveslices of the volume macula scan. The software uses allsurrounding volume image information to segment the layers.
FIGURE 4: Thickness and thickness variability (standarddeviation) maps of six macular intraretinal layers from theright eye of 15 normal subjects. The micron thickness of thedifferent macula layers is color coded (red=thickest,blue=thinnest).
FIGURE 5: Example of a glaucoma patient whose visual fielddefect came close to the center of their visual field and wastested with a denser visual field testing program coveringonly 10 degrees of radius and which corresponds to the areaof retina covered by the macula scan on the correspondingspectral domain OCT. The gray scale map shows visualsensitivity loss that was worst in the top part of the visualfield (dark areas), but also shows some loss in the inferiorfield. The visual field sensitivity di�erence from normal plot isalso shown below the gray scale with the abnormal area withdecrease in sensitivity surrounded by a red dotted line. Thestatistical probability plot of the same visual field data isshown in the lower left corner. 3D-OCT was obtained on thiseye and segmented into the inner retinal layer (ganglion cellsand axons) and outer retinal layer containing thephotoreceptors and bipolar cells. Note the high spatialcorrelation between the thinned layer containing theganglion cells in the inferior macula (thinned areas are redand yellow and depicted as di�erence from normal) and thecorresponding superior (and inferior) areas of visual fielddefect. However, there is no such thinning in the outer retinawhich is known not to be a�ected in most glaucomatousdamage.

2010 Annual Meeting Syllabus | 373
2. Current commercially available OCT and associated
software are not capable of segmenting the ganglion
cell layer in three dimensions. At best, one
manufacturer (Optoview) purports to segment the
inner layers of the retina of the macula as a neural
complex layer (RNFL, ganglion cell layer and inner
pleximform layers), but this software analysis has not
yet been rigorously validated. Recently Don Hood and
colleagues reported to have manually segmented two
dimensional line scans through the macula and have
shown correlation of thinning of the ganglion
cell+inner plexiform layer with corresponding loss of
visual threshold in glaucoma, so this approach does
have promise14. Our group has reported automated
segmentation of retinal layers using a 3D graph search
approach applied to volume OCT scans, as shown in
Figures 3-515,16.
3. Outside of the central 6 degrees of the macula, the
ganglion cell layer is less of a multi-cellular layer. In
areas where there is only a single layer of ganglion
cells it is not known if loss of soma will cause a
measurable, significant thinning of the cellular layer or
whether it will just be replaced by glial and Mueller
cells, making structural thinning of the ganglion cell
layer of the inner retina difficult to measure.
4. Focal peripheral visual field damage would be unlikely
to affect the retinal ganglion cell layer in the macula,
making it theoretically less sensitive to detection and
monitoring of peripheral field pathology. On the other
hand, most optic nerve diseases do show some degree
of diffuse loss and although significant abnormalities
in visual threshold may not be detected, there still may
be a measurable decrease in retinal ganglion cell
thickness in the macula, even though a visual field test
may appear to show mainly extra-macular loss of
sensitivity.
5. It is currently not known how much time it takes for a
decrease in the thickness of the ganglion cell layer to
occur after damage to the optic nerve at different
distances from the globe. The time delay between
permanent damage and atrophy of the ganglion cell
layer would provide a framework for dating the time
of injury.
In summary, recent improvements in OCT resolution and
automated segmentation software has provided a means
of relating visual pathway damage to structural changes in
the RNFL and corresponding soma of the ganglion cells in
the macula. Ganglion cell layer analysis in volume OCT
data may provide yet another piece of the puzzle to
understanding structure-function relationships and its
application to diagnosis and monitoring of optic nerve and
retinal diseases.
CME ANSWERS1. e) all of the above; all of these factors may influence
the ability to differentiate a normal RNFL from an
abnormal thinning due to optic nerve damage
2. b) thinning of the RNFL reaches a maximum at
6 months following acute injury from AION. The
other conditions may not show as good a correlation
between structure and function.
3. e) all of the above.
REFERENCES1. Hood DC, Kardon RH: A framework for comparing structural
and functional measures of glaucomatous damage. Prog
Retin Eye Res 2007;26(6):688-710.
2. Hood DC, Anderson SC, Wall M, Kardon RH: Structure versus
function in glaucoma: an application of a linear model. Invest
Ophthalmol Vis Sci 2007;48(8): 3662-3668.
3. Hood DC, Anderson S, Rouleau J, Wenick AS, Grover LK,
Behrens MM, Odel JG, Lee AG, Kardon RH: Retinal nerve fiber
structure versus visual field function in patients with ischemic
optic neuropathy: a test of a linear model. Ophthalmology
2008;115(5):904-910.
4. Hood DC, Anderson SC, Wall M, Raza AS, Kardon RH. A test of
a linear model of glaucomatous structure-function loss
reveals sources of variability in retinal nerve fiber and visual
field measurements. Invest Ophthalmol Vis Sci
2009;50(9):4254-4266.
5. Danesh-Meyer HV, Papchenko T, Savino PJ, Law A, Evans J,
Gamble GD. In vivo retinal nerve fiber layer thickness
measured by optical coherence tomography predicts visual
recovery after surgery for parachiasmal tumors. Invest
Ophthalmol Vis Sci. 2008 May;49(5):1879-85. Epub 2008
Feb 8.
6. Costello F, Hodge W, Pan YI, Metz L, Kardon RH. Retinal nerve
fiber layer and future risk of multiple sclerosis. Can J Neurol
Sci 2008;35(4):482-487.
7. Costello F, Hodge W, Pan Y, Eggenberger E, Coupland S,
Kardon R: Tracking retinal nerve fiber layer loss after optic
neuritis: a prospective study using optical coherence
tomography. Mult Scler 2008;14(7):893-905.
8. Frohman EM, Fujimoto JG, Frohman TC, Calabresi PA, Cutter
G, Balcer LJ. Optical coherence tomography: a window into the
mechanisms of multiple sclerosis. Nat Clin Pract Neurol. 2008
Dec;4(12):664-75. Review.
9. Frohman EM, Costello F, Stüve O, Calabresi P, Miller DH,
Hickman SJ, Sergott R, Conger A, Salter A, Krumwiede KH,
Frohman TC, Balcer L, Zivadinov R. Modeling axonal
degeneration within the anterior visual system: implications
for demonstrating neuroprotection in multiple sclerosis. Arch
Neurol. 2008 Jan;65(1):26-35. Review.
10. Hood DC, Salant JA, Arthur SN, Ritch R, Liebmann JM. The
Location of the Inferior and Superior Temporal Blood Vessels
and Interindividual Variability of the Retinal Nerve Fiber Layer
Thickness. J Glaucoma. 2009 Aug 5. [Epub ahead of print]
11. Hood DC, Fortune B, Arthur SN, Xing D, Salant JA, Ritch R,
Liebmann JM. Blood vessel contributions to retinal nerve fiber
layer thickness profiles measured with optical coherence
tomography. J Glaucoma. 2008 Oct-Nov;17(7):519-28.

374 | North American Neuro-Ophthalmology Society
12. Johnson LN, Diehl ML, Hamm CW, Sommerville DN, Petroski
GF. Differentiating optic disc edema from optic nerve head
drusen on optical coherence tomography. Arch Ophthalmol.
2009 Jan;127(1):45-9.
13. Burkholder BM, Osborne B, Loguidice MJ, Bisker E, Frohman
TC, Conger A, Ratchford JN, Warner C, Markowitz CE, Jacobs
DA, Galetta SL, Cutter GR, Maguire MG, Calabresi PA, Balcer LJ,
Frohman EM. Macular volume determined by optical
coherence tomography as a measure of neuronal loss in
multiple sclerosis. Arch Neurol. 2009 Nov;66(11):1366-72.
14. Wang M, Hood DC, Cho JS, Ghadiali Q, De Moraes GV, Zhang
X, Ritch R, Liebmann JM. Measurement of local retinal
ganglion cell layer thickness in patients with glaucoma using
frequency-domain optical coherence tomography. Arch
Ophthalmol. 2009 Jul;127(7):875-81.
15. Haeker M, Wu X, Abramoff M, Kardon R, Sonka M:
Incorporation of regional information in optimal 3-D graph
search with application for intraretinal layer segmentation of
optical coherence tomography images. Inf Process Med
Imaging 2007;20: 607-618.
16. Garvin MK, Abramoff MD, Kardon R, Russell SR, Wu X, Sonka
M. Intraretinal layer segmentation of macular optical
coherence tomography images using optimal 3-D graph
search. IEEE Trans Med Imaging. 2008;27(10):1495-1505.

2010 Annual Meeting Syllabus | 375
INTRODUCTION: Anterior visual pathway neuronal loss in multiple sclerosis
(MS) has been suggested by optical coherence tomography
(OCT) measurements of macular volume. Software
programs that segment retinal layers are used but not yet
widely available. The purpose of this study was to pilot a
manual method of estimating the retinal ganglion cell
layer volume by Spectral-Domain OCT, and to explore the
relation of this volume to visual function and prior history
of optic neuritis (ON).
METHODS: Patients with MS and control subjects underwent fast
macular OCT scans (25 frames/eye) obtained with
Spectral-Domain OCT technology. Ganglion cell layer
volume was determined by manually outlining these
structures for each frame of the OCT scan. Images were
magnified by 400-800%; contrast was enhanced to
maximize the accuracy of layer delineation. Visual
function testing was performed using low-contrast
(1.25% level) and high-contrast visual acuity (VA).
RESULTS: Eyes of patients with MS (n=16, age 50±6.3 years) had a
lower ganglion cell layer volumes than did control eyes
(MS: 0.76 mm3 vs. controls: 1.06 mm3; p=0.0001, t-test).
MS eyes with a prior history of ON had the greatest degree
of ganglion cell layer thinning. Lower ganglion cell layer
volumes were associated with poorer performance on
tests of low-contrast letter acuity (r=0.60, p<0.001), but
not VA (r=0.10).
CONCLUSION: This exploratory study demonstrates thinning of the
retinal ganglion cell and associated layers in MS eyes.
This finding is most pronounced in the setting of a prior
history of ON, consistent with the occurrence of neuronal
in addition to axonal loss in this setting. Low-contrast
acuity is more sensitive than high-contrast VA to ganglion
cell layer loss in this small cohort. Ongoing longitudinal
studies piloting segmentation software will define the
temporal relation of neuronal to axonal degeneration in
MS, ON, and other optic neuropathies.
REFERENCES:1. Burkholder B, Osborne B, Loguidice M, et al. Macular volume
by optical coherence tomography as a measure of neuronal
loss in multiple sclerosis. Archives of Neurology 2009, in
press.
2. Dijk H, Kok P, Garvin M, et al. Selective loss of inner retinal
layer thickness in type 1 diabetic patients with minimal
diabetic retinopathy. Investigative Ophthalmology & Visual
Science 50:3404-3409, 2009.
3. Wolf-Schnurrbush U, Ceklic L, Brinkmann C, et al. Macular
thickness measurements in healthy eyes using six different
optical coherence tomography instruments. Investigative
Ophthalmology & Visual Science 50:3432-3437, 2008.
KEY WORDS: Multiple Sclerosis (MS), Optical Coherence Tomography
(OCT), Ganglion Cell Layer, Visual Function
FINANCIAL DISCLOSURE: NONE
PLATFORM PRESENTATIONGANGLION CELL LAYER VOLUME BY SPECTRALIS OPTICAL COHERENCE TOMOGRAPHY (OCT) IN MULTIPLE SCLEROSIS
Emma Davies1, Dina Jacobs1, James Wilson1, Clyde Markowitz1, Steven Galetta1, Elliot Frohman2, Peter Calabresi3, Laura Balcer1
1University of Pennsylvania School of Medicine, Philadelphia, PA, United States, 2University of Texas Southwestern Medical Center, Dallas, TX, United States, 3Johns Hopkins University School of Medicine, Baltimore, MD, United States

376 | North American Neuro-Ophthalmology Society

2010 Annual Meeting Syllabus | 377
LEARNING OBJECTIVES1. To understand how OCT helps identify maculopathy
that may mimic optic neuropathy.
2. To understand how OCT can aid in the management of
various optic neuropathies.
3. To understand some of the limitations of OCT and how
to avoid misinterpretation of OCTs.
CME QUESTIONS1. OCT can identify all but which of the following macular
lesions that may not be apparent clinically?
a. Occult outer retinopathy, including MEWDS
b. Stargardt’s disease
c. Cone dystrophy
d. Solar maculopathy
2. OCT can clearly distinguish improvement of
papilledema from evolution of papilledema into
atrophic papilledema. True or False?
3. Nerve fiber layer analysis by OCT can distinguish mild
papilledema from psuedopapilledema. True or False?
KEY WORDS1. Optical Coherence Tomography
2. Occult Maculopathy
3. Optic Neuropathy
4. Papilledema
5. Optic Neuritis
6. Anterior Ischemic Optic Neuropathy
INTRODUCTIONI have been fortunate to have access to optical coherence
tomography (OCT) since its inception thanks to
collaboration between Joel Schuman and others at the New
England Eye Center1 with Jim Fugimoto at M.I.T.2 At first,
this appeared to be a tool primarily useful for retina
specialists, but, as optic nerve analysis became more
refined for the use in glaucoma, its use in other types of
optic neuropathy became more apparent. However, there
are still some difficulties with regard to this, which will be
reviewed below. What turns out to be most useful in
neuro-ophthalmic practice is the ability of OCT to identify
and prove occult maculopathy mimicking optic
neuropathy, and this has had a significantly positive
impact on my practice.
HOW I USE OCT IN MY NEURO-OPHTHALMICPRACTICEProving Maculopathy That May Mimic Optic
Neuropathy
Years ago, the diagnosis of occult maculopathy mimicking
optic neuropathy depended on subtle and often indirect
findings. Frequently, this also required ruling out optic
neuropathy, sometimes at significant expense. It was not
unusual for neuro-ophthalmologists to become engaged
in a dialogue with a retina specialist who insisted that a
patient with unexplained visual loss had optic neuropathy,
when the neuro-ophthalmologist was sure that the
problem was indeed macular, but had no clear way of
proving this. Central serous retinopathy was a common
maculopathy, which could mimic optic neuropathy yet
could easily be identified with fundus fluorescein
angiography. However, now, with more refined OCT
techniques, other retinal conditions mimicking optic
neuropathy are more easily proven.
The diagnosis of macular hole and epiretinal membrane
often required considerable discussion between neuro-
ophthalmologists and retina colleagues in the past. Now
macular hoe is a favorite diagnosis for retina specialists
now that it can be treated surgically. OCT reliably and
consistently demonstrates macular holes and epiretinal
membranes.3 Another group of conditions, now more
easily identified using OCT, the occult outer retinopathies,
includes multiple evanescent white-dot syndrome, acute
zonal occult outer retinopathy, and acute idiopathic blind
spot enlargement syndrome. These conditions are
especially easy to identify with high-resolution OCT
whereby the inner segment/outer segment junction is
usually affected in the retinal areas corresponding to the
clinical findings.4-8 These diagnoses are also made with
more assurance using multifocal retinography. However,
OCT is much easier and quicker for the patient and usually
suffices.
We have also found that ultra-high resolution OCT helps
in localizing the cause of microscotomas to the outer
retina. However, we still do not have a better
understanding of the pathophysiology of this condition.
Hopefully, with more detailed OCT, the mechanism by
which these micro scotomas occur will become apparent.
The structural findings in some patients with
microscotoma that we see with OCT do resemble those
which are seen with phototoxic maculopathy9-11 which can
EVIDENCE MEETS PRACTICE: TAKE-HOME POINTS ON OCT
Thomas R. Hedges III, MDTufts University
Boston, Massachusetts

378 | North American Neuro-Ophthalmology Society
result in a very discrete area of inner segment/outer
segment loss in such individuals. It also resembles what is
occasionally seen in patients with epiretinal membrane.12
Bilateral central visual loss in young people with
apparently normal appearing retinas and optic nerves has
been a diagnostic dilemma until recently. Frequently,
these children have required a variety of rather expensive
investigations. Although multifocal electroretinography
can identify juvenile retinal degeneration or Stargardt’s
disease when it does occur, OCT does show distinctive
macular outer retinal changes early on, and I think OCT
will become the standard way of making this diagnosis in
the future.13 Multifocal electroretinography may be
difficult in young children, although we have been able to
use this approach in some individuals as young as six
years of age. We have also found that OCT is as sensitive
in identifying hydroxychloroquine retinopathy as
multifocal ERG.14 OCT allows neuro-ophthalmologists to
make diagnosis of occult maculopathy much more
efficiently and, this has saved me time and has saved
patients considerable expense.
OPTIC NEUROPATHY IN THE PRESENCE OFRETINOPATHYOCT can identify optic neuropathy when there is nerve
fiber layer loss, and this may be the first clue that there is
an insidious optic neuropathy occurring such as with optic
nerve sheath meningiomas. In individuals with mild
decrease in visual acuity, mild visual field constriction,
mild color vision loss, and subtle visual field constriction,
finding nerve fiber layer thinning provides more objective
evidence that there is an optic neuropathy that requires
further investigation. We have been impressed with how
optic nerve head analysis by OCT will identify optic
neuropathy in the presence of a known maculopathy.
Even though such individuals may have visual field
characteristics that are more typical of optic neuropathy,
such as bitemporal hemianopia, frequently a concomitant
maculopathy makes interpretation of subjective
psychophysical tests difficult. Finding characteristic nerve
fiber layer changes on OCT does help motivate me at least
to obtain MRI scans when a retinal surgeon sends me a
patient in whom the possibility of an optic neuropathy
coexisting with maculopathy arises.
FUNCTIONAL LOSS OF VISIONOCT can provide further objective evidence of normal
structure in patients suspected of having functional visual
loss. However, one must remember that retinal nerve fiber
layer degeneration does take time to develop, and a
normal RNFL thickness does not always rule out a
compressive optic neuropathy. However, in patients who
have had functional visual loss for many months or years,
a normal RNFL thickness, along with a normal macular
scan, is strong, objective evidence that there is no
structural pathology accounting for visual loss that is
likely functional in nature.
OPTIC NERVE SWELLINGWe have attempted to use OCT to differentiate mild
papilledema from pseudopapilledema. OCT can show
optic nerve head drusen, and, when there are significant
drusen, one would expect the retinal nerve fiber layer to
be thin.15 However, in those individuals with congenitally
crowded optic nerve heads, without significant drusen, we
have been impressed that OCT shows thickening of the
nerve fiber layer, similar to that which occurs in mild
papilledema.16 Therefore, we now use OCT to observe
such individuals with suspected pseudopapilledema over
time, just the way we used to use photographs for this
purpose. If the OCT does not show any change in the
nerve fiber layer thickness over time, then we can assume
that such individuals were born with crowded nerves and
thicker nerve fiber layers. The finding of thickened nerve
fiber layer on circumferential OCTs in patients with
pseudopapilledema is not surprising, considering that
there is axoplasmic flow stasis in these individuals, just as
there is in those with true papilledema. Of course, one
must remember that patients with pseudopapilledema can
FIGURE 1. Inner segment/outer segment defect in a patientwith a paracentral microscotoma.
FIGURE 2. Perifoveal inner segment/outer segment loss in apatient with Plaquenil retinal toxicity. Note also the presence ofepiretinal membrane on the right portion of the inner retina.
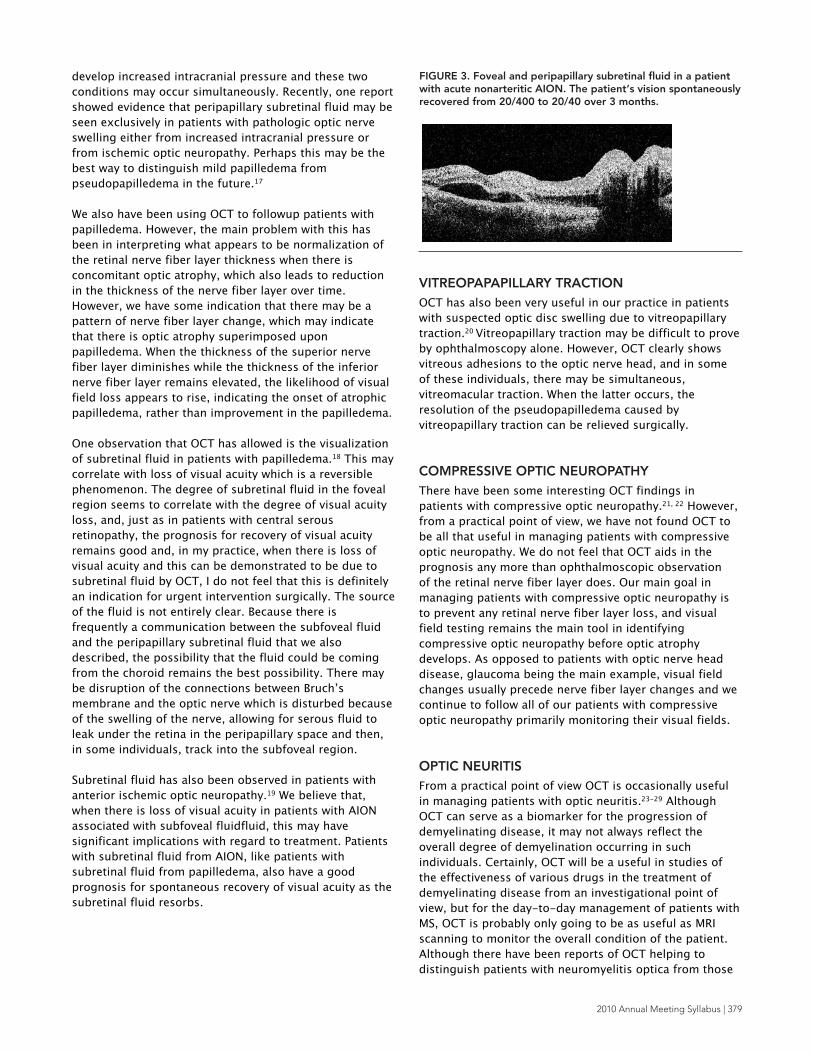
2010 Annual Meeting Syllabus | 379
develop increased intracranial pressure and these two
conditions may occur simultaneously. Recently, one report
showed evidence that peripapillary subretinal fluid may be
seen exclusively in patients with pathologic optic nerve
swelling either from increased intracranial pressure or
from ischemic optic neuropathy. Perhaps this may be the
best way to distinguish mild papilledema from
pseudopapilledema in the future.17
We also have been using OCT to followup patients with
papilledema. However, the main problem with this has
been in interpreting what appears to be normalization of
the retinal nerve fiber layer thickness when there is
concomitant optic atrophy, which also leads to reduction
in the thickness of the nerve fiber layer over time.
However, we have some indication that there may be a
pattern of nerve fiber layer change, which may indicate
that there is optic atrophy superimposed upon
papilledema. When the thickness of the superior nerve
fiber layer diminishes while the thickness of the inferior
nerve fiber layer remains elevated, the likelihood of visual
field loss appears to rise, indicating the onset of atrophic
papilledema, rather than improvement in the papilledema.
One observation that OCT has allowed is the visualization
of subretinal fluid in patients with papilledema.18 This may
correlate with loss of visual acuity which is a reversible
phenomenon. The degree of subretinal fluid in the foveal
region seems to correlate with the degree of visual acuity
loss, and, just as in patients with central serous
retinopathy, the prognosis for recovery of visual acuity
remains good and, in my practice, when there is loss of
visual acuity and this can be demonstrated to be due to
subretinal fluid by OCT, I do not feel that this is definitely
an indication for urgent intervention surgically. The source
of the fluid is not entirely clear. Because there is
frequently a communication between the subfoveal fluid
and the peripapillary subretinal fluid that we also
described, the possibility that the fluid could be coming
from the choroid remains the best possibility. There may
be disruption of the connections between Bruch’s
membrane and the optic nerve which is disturbed because
of the swelling of the nerve, allowing for serous fluid to
leak under the retina in the peripapillary space and then,
in some individuals, track into the subfoveal region.
Subretinal fluid has also been observed in patients with
anterior ischemic optic neuropathy.19 We believe that,
when there is loss of visual acuity in patients with AION
associated with subfoveal fluidfluid, this may have
significant implications with regard to treatment. Patients
with subretinal fluid from AION, like patients with
subretinal fluid from papilledema, also have a good
prognosis for spontaneous recovery of visual acuity as the
subretinal fluid resorbs.
VITREOPAPAPILLARY TRACTIONOCT has also been very useful in our practice in patients
with suspected optic disc swelling due to vitreopapillary
traction.20 Vitreopapillary traction may be difficult to prove
by ophthalmoscopy alone. However, OCT clearly shows
vitreous adhesions to the optic nerve head, and in some
of these individuals, there may be simultaneous,
vitreomacular traction. When the latter occurs, the
resolution of the pseudopapilledema caused by
vitreopapillary traction can be relieved surgically.
COMPRESSIVE OPTIC NEUROPATHYThere have been some interesting OCT findings in
patients with compressive optic neuropathy.21, 22 However,
from a practical point of view, we have not found OCT to
be all that useful in managing patients with compressive
optic neuropathy. We do not feel that OCT aids in the
prognosis any more than ophthalmoscopic observation
of the retinal nerve fiber layer does. Our main goal in
managing patients with compressive optic neuropathy is
to prevent any retinal nerve fiber layer loss, and visual
field testing remains the main tool in identifying
compressive optic neuropathy before optic atrophy
develops. As opposed to patients with optic nerve head
disease, glaucoma being the main example, visual field
changes usually precede nerve fiber layer changes and we
continue to follow all of our patients with compressive
optic neuropathy primarily monitoring their visual fields.
OPTIC NEURITISFrom a practical point of view OCT is occasionally useful
in managing patients with optic neuritis.23-29 Although
OCT can serve as a biomarker for the progression of
demyelinating disease, it may not always reflect the
overall degree of demyelination occurring in such
individuals. Certainly, OCT will be a useful in studies of
the effectiveness of various drugs in the treatment of
demyelinating disease from an investigational point of
view, but for the day-to-day management of patients with
MS, OCT is probably only going to be as useful as MRI
scanning to monitor the overall condition of the patient.
Although there have been reports of OCT helping to
distinguish patients with neuromyelitis optica from those
FIGURE 3. Foveal and peripapillary subretinal fluid in a patientwith acute nonarteritic AION. The patient’s vision spontaneouslyrecovered from 20/400 to 20/40 over 3 months.

380 | North American Neuro-Ophthalmology Society
with multiple sclerosis, the degree of nerve fiber layer
dropout is reflected by the degree of visual loss
demonstrated by visual acuity testing or visual field
testing, so OCT so in and of itself is not all that useful in
that regard.
CAVEATSAlthough OCT has become very useful in my practice over
the last several years, I try to remain aware of some of the
limitations of OCT. OCT can be normal in patients with
compressive optic neuropathy, and visual field testing
remains the most important diagnostic tool in the
diagnosis and followup of patients with compressive optic
neuropathy. OCT can be normal in patients with some
occult maculopathies, and multifocal electroretinography
may be needed to identify maculopathy in these patients
and to prevent extensive evaluations, searching for other
diagnoses. A bad OCT is like a bad MRI or a bad CT scan.
There may be errors in retinal nerve fiber layer analysis.
Sometimes the algorithm used by the OCT machine will
fail and false measurements of the retinal nerve fiber layer
or the macula may occur. It is important to check the
alignment of the circular scans when analyzing retinal
nerve fiber layer measurements. If the scan is not properly
placed which respect to the optic nerve head, inaccurate
measurements may follow. This is especially problematic
in patients with swollen optic nerves where the presence
of subretinal fluid and marked elevation of the nerve fiber
layer may provide measurements which are inaccurate
because they are out of the range of the normal algorithm.
Perhaps, in patients with optic nerve head swelling, a
larger diameter should be used for retinal nerve fiber layer
analysis. Also, there may be errors in macular analysis. To
avoid this, because most macular diagnoses rely on a
more qualitative evaluation of the OCT, I always obtain
line scans, which incorporate the optic nerve head and the
macula. This allows for a better view of the anatomic
details of the macula, which are not always clear on the
typical macular scans. OCT may identify concurrent optic
nerve and macular disease. Therefore, I image the macula
as well as the RNFL in every patient in whom I obtain OCT.
MY STANDARD PROTOCOL FOR OCTMy standard protocol is to obtain a retinal nerve layer
scan, a macula scan, and a line scan of the macula and
nerve. I have not found that the optic nerve head protocol
is useful in analyzing optic nerve disease, and I have very
little experience with this. Spectral domain OCT appears
better than time domain for evaluating macular disease.
However, the time domain appears to be more consistent
with regard to retinal nerve fiber layer analysis, especially
for serial analysis over time. High-speed ultra-high
resolution OCT is best for occult maculopathy, especially
for the occult outer retinopathies, and also in patients
with micro scotomas.
CME ANSWERS1. C
2. False
3. False
REFERENCES1. Huang D, Swanson EA, Lin CP, Schuman JS, Stinson WG, Chang
W, et al. Optical coherence tomography. Science 1991 Nov
22;254(5035):1178-81.
2. Fujimoto JG, Brezinski ME, Tearney GJ, Boppart SA, Bouma B,
Hee MR, et al. Opticalbiopsy and imaging using optical
coherence tomography. Nat Med 1995 Sep;1(9):970-2.
3. Ko TH, Witkin AJ, Fujimoto JG, et al. Ultrahigh-resolution
optical coherence tomography of surgically closed macular
hole. Arch Ophthamol 2006;124:827-836.
4. Witkin AJ, Ko TH, Fujimoto JG, et al. Ultra-high resolution
optical coherence tomography assessment of photoreceptors
in retinitis pigmentosa and related diseases. Am J Ophthlamol
2006;142:945-952.
5. Pieroni CG, Witkin AJ, Ko TH, et al. Ultrahigh resolution optical
coherence tomography in non-exudative age related macular
degeneration. Br J Ophthalmol 2006 Feb;90(2):19-17.
6. Ko TH, Fujimoto JG, Duker JS, et al. Comparison of ultrahigh
and standard resolution optical coherence tomography for
imaging of macular pathology and repair. Ophthalmol
2004;111:2033–43.
7. Drexler W, Sattmann H, Hermann B, et al. Enhanced
visualization of macular pathology with the use of ultrahigh-
resolution optical coherence tomography. Arch Ophthalmol
2003;121(5):695-705.
8. Srinivasan VJ, Wojtkowski M, Witkin AJ, et al. High-definition
and 3-dimensional imaging of macular pathologies with
high-speed ultrahigh-resolution optical coherence
tomography. Ophthalmology 2006;113:2054-2065.
9. Garg SJ, Martidis A, Nelson ML, et al. Optical coherence
tomography chronic solar retinopathy. Am J Ophthalmol
2004;137:351-354.
10. Chen RW, Gorczynska I, Srinivasan VJ, et al. High-speed
ultrahigh resolution optical coherence tomography findings in
chronic solar retinopathy. Retin Cases Brief Rep
2008;2(2):101-102.
11. Kaushik, S, Gupta V, Gupta A. Optical coherence tomography
findings in solar retinopathy. Ophthlamic Surg Lasers Imaging
2004;35(1):52-5.
12. Witkin AJ, Wojtkowski M, Reichel E, et al. Photoreceptor
disruption secondary to posterior vitreous detachment as
visualized using high-speed ultrahigh resolution optical
coherence tomography. Arch Ophthalmol 2007
Nov;125(11):1579-1580.
13. Ergun E, Hermann B, Wirtitsch M, et al. Assessment of Central
Visual Function in Stargardt’s Disease/Fundus Flavimaculatus
with Ultrahigh-Resolution Optical Coherence Tomography.
Investigative Ophthalmology and Visual Science.
2005;46:310-316.
14. Rodriguez-Padilla JA, Hedges TR, Monson B, Srinivasan V, et
al. High-Speed Ultra–High-Resolution Optical Coherence
Tomography Findings in Hydroxychloroquine Retinopathy.
Arch Ophthalmol. 2007;125:775-780.

2010 Annual Meeting Syllabus | 381
15. Roh S, Noecker RJ, Schuman, JS, Hedges TR, Weiter JJ, Mattox
C. Effect of optic nerve head drusen on nerve fiber layer
thickness. Ophthalmology 1998; 105:878-885.
16. Karam EZ, Hedges TR. Optical coherence tomography of the
retinal nerve fibre layer in mild papilloedema and
pseudopapilloedema. Br J Ophthalmol 2005;89:294-298.
17. Johnson LN, Diehl ML, Hamm CW et al. Differentiating Optic
Disc Edema From Optic Nerve Head Drusen on Optical
Coherence Tomography . Arch Ophthalmol. 2009;127(1):
45-49.
18. Hoye VJ, Berrocal AM, Hedges TR, Amaro-Quireza ML. Optical
coherence tomography demonstrates subretinal macular
edema from papilledema. Arch Ophthalmol. 2001;119:
1287-1290.
19. Hedges TR, Vuong, LN, Gonzalez-Garcia AO, Mendoza-
Santiesteban CE, Amaro-Quiereza AL. Subretinal fluid from
anterior ischemic optic neuropathy demonstrated by optical
coherence tomography. Arch Ophthalmol 2008;126:812-815.
20. Hedges TR, Flattem NL, Bagga A. Vitreopapillary traction
confirmed by optical coherence tomography. Arch
Ophthalmol 124; 279-281: 2006.
21. Kanamori A, Nakamura M, Matsui N, et al. Optical coherence
tomography detects characteristic retinal nerve fiber layer
thickness corresponding to band atrophy of the optic discs
Ophthalmology 2004; 111: 2278-2283.
22. Monteiro MLR, Leal BC,Rosa AAM, Bronstein MD. Optical
coherence tomography analysis of axonal loss in band
atrophy of the optic nerve. Br J Ophthalmol 2004;88:896-899.
23. Zaveri MS, Conger A, Salter A, et al. Retinal imaging by laser
polarimetry and optical coherence tomography evidence of
axonal degeneration in multiple sclerosis. Arch Neurol 2008
Jul;65(7):924-8.
24. Frohman EM, Dwyer MG, Frohman T, et al. Relationship of
optic nerve and brain conventional and non-conventional MRI
measures and retinal nerve fiber layer thickness, as assessed
by OCT and GDx: a pilot study. J Neurol Sci 2009 Jul
15;282(1-2):96-105.
25. Costello F, Hodge W, Pan YI, et al. Tracking retinal nerve fiber
layer loss after optic neuritis: a prospective study using
optical coherence tomography. Mult Scler 2008
Aug;14(7):893-905.
26. Henderson AP, Trip SA, Schlottmann PG, Altmann DR,
Garway-Heath DF, Plant GT, et al. An investigation of the
retinal nerve fibre layer in progressive multiple sclerosis using
optical coherence tomography. Brain 2008 Jan;131(Pt 1):
277-87.
27. Pulicken M, Gordon-Lipkin E, Balcer LJ, et al. Optical
coherence tomography and disease subtype in multiple
sclerosis. Neurology 2007 Nov 27;69(22):2085-92.
28. Gordon-Lipkin E, Chodkowski B, Reich DS, et al. Retinal nerve
fiber layer is associated with brain atrophy in multiple
sclerosis. Neurology 2007 Oct 16;69(16):1603-9.
29. Ratchford JN, Quigg ME, Conger A, et al. Optical coherence
tomography helps differentiate neuromyelitis optica and MS
optic neuropathies. Neurology 2009 Jul 28;73(4):302-8.