north carolina agricultural and technical state university modeling driver behavior at intersections...
TRANSCRIPT
North Carolina Agricultural and Technical State University
Modeling Driver Behavior at Intersections with Takagi-Sugeno Fuzzy Models
By: Saina Ramyar Advisors: Dr. Homaifar
Dr. Karimoddini

North Carolina Agricultural and Technical State University
www.ncat.edu2
1• Introduction
2• Background
3• Methodology
4• Simulation
5• Results
6• Discussion/Future Work
North Carolina Agricultural and Technical State University
www.ncat.edu3
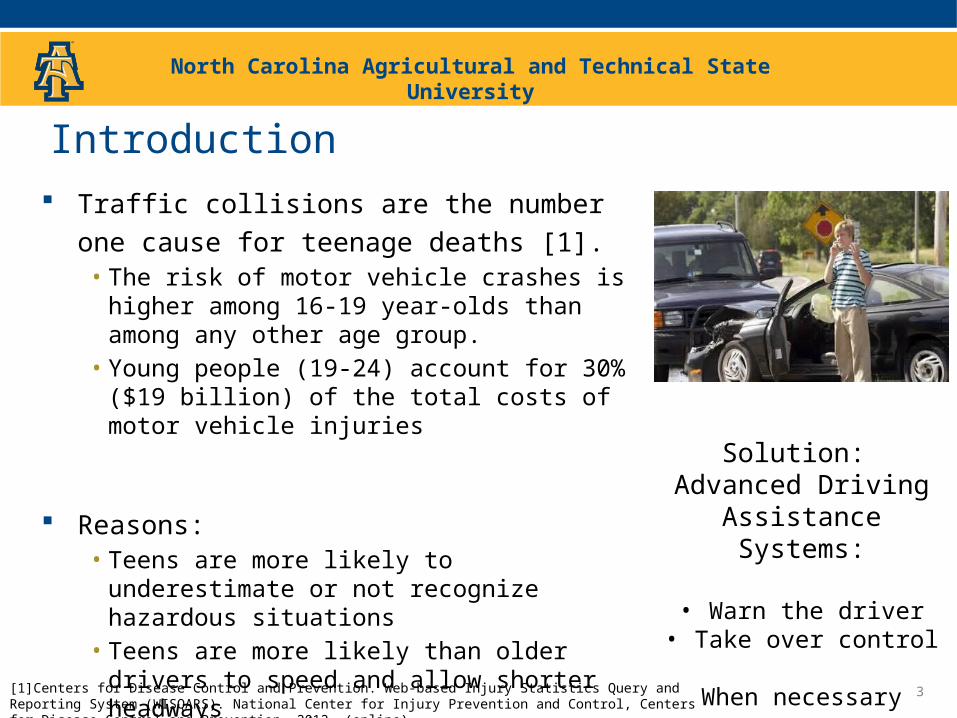
Traffic collisions are the number one cause for
teenage deaths [1].• The risk of motor vehicle crashes is higher among 16-
19 year-olds than among any other age group. • Young people (19-24) account for 30% ($19 billion) of
the total costs of motor vehicle injuries
Reasons:• Teens are more likely to underestimate or not recognize
hazardous situations• Teens are more likely than older drivers to speed and
allow shorter headways• Teens are more likely to drive under the influence of
alcohol.
Introduction
Solution: Advanced Driving
Assistance Systems:
• Warn the driver• Take over control
When necessary[1]Centers for Disease Control and Prevention. Web-based Injury Statistics Query and Reporting System (WISQARS). National Center for Injury Prevention and Control, Centers for Disease Control and Prevention. 2012. (online)
North Carolina Agricultural and Technical State University
www.ncat.edu4
Goal:
Designing an Advanced Driving Assistance System (ADAS)
Objectives• Predict other drivers actions to avoid crashes• Detect and warn drivers of their dangerous driving• Detect driver distraction and take over more control
Challenge:• In urban environment there is more interaction with humans and
other vehicles.• People’s driving patterns are different and complex
Introduction
Future Work

North Carolina Agricultural and Technical State University
www.ncat.edu
Modeling Driver Behavior
5
Driver’s actions at an intersection:
Right TurnLeft TurnStraightStop
The Scenario of interest in this study:
High Number of
other vehicles
High Number of
Pedestrians
Intersection

North Carolina Agricultural and Technical State University
www.ncat.edu6
Background
Approaches for modeling and estimation of Driver Behavior
Dynamic Bayesian Network
Clustering or Classification Techniques [4,5]
Hidden Markov Model (HMM) [7,8]
Rule Based Estimation [6]
[2] Gerdes, A., "Driving manoeuvre recognition," in Proceedings of the 13th World Congress and Exhibition on Intelligent Transport Systems and Services, 2006. [3] Robert Schubert, Karsten Schulze, and Gerd Wanielik, "Situation assessment for automatic lane-change maneuvers," IEEE Transactions on Intelligent Transportation Systems, vol. 11,
no. 3, pp. 607-616, Sept. 2011. [4] Christoph Hermes, Christian Wahlert, Konrad Schenkt and Franz Kummert, "Long-term vehicle motion prediction," in IEEE Intelligent Vehicles Symposium, 2009. [5] F. Large, D. A. V. Govea, T. Fraichard, and C. Laugier, "Avoiding cars and pedestrians using velocity obstacles and motion prediction," in IEEE Intelligent Vehicle Symposium, 2004. [6] Vijay Gadepally, arda Kurt, Ahok Krishnamurthy, and Umit Ozguner, "Driver/Vehicle Estimation and Detection," in 14th International IEEE Conferance on Intelligent Tranportation
Systems (ITS), 2011. [7] A. Kurt, J. Yester, Y. Mochizuki, U. Ozguner, "Hybrid-state driver/vehicle modeling estimation and prediction," in 13th International IEEE Conferance on Intelligent Transportation
Systems (ITSC), 2010. [8] V. Gadepally, A. Krishnamurthy, and Ü. Özgüner, "A Framework for Estimating Driver Decisions near Intersections," Trans. Intell. Transp. Syst., vol. 15, no. 2, 2014.
Modeling driver behavior [2]Making lane change decisions [3]

North Carolina Agricultural and Technical State University
www.ncat.edu7
Modeling Driver Behavior
The ADAS requires data from the vehicle to estimate its motions.
Obtaining information about other vehicles
Proposed Model
a) Define each maneuver as a nonlinear function
b) Estimate the nonlinear functions with local Takagi-Sugeno fuzzy models
GPSV2V (Vehicle to Vehicle Communication)
V2I (Vehicle to Infrastructure Communication)

North Carolina Agricultural and Technical State University
www.ncat.edu
Modeling Driver Behavior
a) Defining Driver’s Actions Nonlinear Models
8
Driver’s actions at an intersection in the proposed technique:
Stop is not important so it is eliminated for simplicity.
Right TurnLeft TurnStraight
Required Observations
Velocity
AccelerationYaw-rate

North Carolina Agricultural and Technical State University
www.ncat.edu9
Modeling Driver Behavior
a) Defining Driver’s Actions Nonlinear Models
Proposed model:
velocity (V), acceleration (A) and yaw-rate (ω) are nonlinear functions of the
observations at one or two time steps before.
V and A : functions of velocity at two time steps before
Yaw-rate: function of yaw rate at two time steps before

North Carolina Agricultural and Technical State University
www.ncat.edu10
Modeling Driver Behavior
b) Approximating The Nonlinear maneuver models
Identifying the nonlinear models
It is very difficult to find an explicit global model for such systems using
basic physical principles.
Takagi-Sugeno fuzzy models:
universal approximator can approximate any nonlinear function
It is used for modeling the system [9, 10]
[9] Sugeno, T. Takagi and M., "Fuzzy identification of systems and its application to modeling and control," IEEE Trans. Syst., Man, Cybern.,, Vols. SMC-15, pp. 116 -132, 1985.
[10] Homaifar, A., Bikdash, M., and Clifton, C, "Feedback Implementation of Optimal Control Laws," Special Issue on Formal Methods for Fuzzy Modeling and Control of the Journal of Fuzzy sets and Systems, pp. 39-57, 2001.

North Carolina Agricultural and Technical State University
www.ncat.edu11
Modeling Driver Behavior
TS fuzzy model:
consists of “if-then” rules
The consequent functions are the local models in the regions specified by the
antecedent membership functions [11, 12].
• membership functions in the antecedent • linear function in the consequent
Ri : If x is Ai(x) then y^ = aiTx + b [wi]
b) Approximating The Nonlinear maneuver models
[11] Kang, M. Sugeno and G. T., "Fuzzy modeling and control of multilayer incinerator," Fuzzy Sets Syst., vol. 18, pp. 329 -346, 1986. [12] Clifton, C., Homaifar, A., and Bikdash, M., "Design of Generalized Sugeno Controllers By Approximating Hybrid Fuzzy-PID Controllers,”," in Proceedings of the Fifth the
IEEE Conference on Fuzzy Systems,, New Orleans, Louisiana, Sept. 2011.

North Carolina Agricultural and Technical State University
www.ncat.edu12
Modeling Driver Behavior
Construction of a TS model:
1) Determining membership functions in the antecedents
2) The parameters of the consequent functions are estimated
Techniques for determining MFs:
Determining the consequent parameters: Least Square error
• Gradient-descent neuro-fuzzy optimization• Genetic Algorithm [13]• Fuzzy Clustering [14]
b) Approximating The Nonlinear maneuver models
[13] Homaifar, A., and McCormick, V. E., "Simultaneous design of membership functions and rule sets for fuzzy controllers using genetic algorithms," IEEE Transactions on Fuzzy Systems, vol. 3, pp. 129-139, May 1995.
[14] Janos Abonyi, Robert Babu, "Modified Gath-Geva Fuzzy Clustering for Identification of Takagi-Sugeno Fuzzy Models," IEEE TRANSACTIONS ON SYSTEMS, MAN, AND CYBERNETICS—PART B: CYBERNETICS, vol. 32, no. 5, pp. 612-621, October 2002.

North Carolina Agricultural and Technical State University
www.ncat.edu13
Modeling Driver Behavior
A modified Gath-Geva fuzzy clustering is used for identification of the TS
models [14]
1) The modified GG algorithm uses a Gaussian mixture model for the
membership functions and calculates its parameters from the data.
2) Then Least Square estimation is applied for obtaining the coefficients of the
consequent.
Identification Algorithm:
Gath-Geva fuzzy clustering + Expectation Maximization of the Guassian Mixture
Models
c) Modified Gath-Geva Fuzzy Clustering for Identification of Takagi-
Sugeno Fuzzy Models
[14] Janos Abonyi, Robert Babu, "Modified Gath-Geva Fuzzy Clustering for Identification of Takagi-Sugeno Fuzzy Models," IEEE TRANSACTIONS ON SYSTEMS, MAN, AND CYBERNETICS—PART B: CYBERNETICS, vol. 32, no. 5, pp. 612-621, October 2002.

North Carolina Agricultural and Technical State University
www.ncat.edu14
Compute the distance measure Di,k2
Start
Update the partition matrix (MF)
End
Yes
No
Calculate the parameters of the clusters• Centers of membership functions
• Standard deviation of Gaussian membership functions• Parameters of the local models• Priori probabilities of clusters
• Weights of the rules
c) Modified Gath-Geva Fuzzy Clustering for Identification of Takagi-
Sugeno Fuzzy Models

North Carolina Agricultural and Technical State University
www.ncat.edu15
Step 1: Calculate cluster parameters
Modeling Driver Behavior (elaborate more)c) Modified Gath-Geva Fuzzy Clustering for Identification of Takagi-
Sugeno Fuzzy Models
Centers of MFs
Standard deviation of MFs:
Parameters of the Sugeno model

North Carolina Agricultural and Technical State University
www.ncat.edu16
Modeling Driver Behavior (elaborate more)c) Modified Gath-Geva Fuzzy Clustering for Identification of Takagi-
Sugeno Fuzzy Models
Step 2: compute the distance measures
Distance between cluster centers and input data x
Performance of the local linear models

North Carolina Agricultural and Technical State University
www.ncat.edu17
Modeling Driver Behavior (elaborate more)c) Modified Gath-Geva Fuzzy Clustering for Identification of Takagi-
Sugeno Fuzzy Models
Step 3: Update the partition matrix

North Carolina Agricultural and Technical State University
www.ncat.edu18
Advantages:
1) It does not use transformed input variables; therefore, the results are more
easily interpretable.
2) Number of rules is equal to the given number of clusters
Modeling Driver Behavior
c) Modified Gath-Geva Fuzzy Clustering for Identification of Takagi-
Sugeno Fuzzy Models
Computation complexity
North Carolina Agricultural and Technical State University
www.ncat.edu19
Data Analysis and Simulations
a) Experimental Setup
The driver behavior data used in this study was collected by the Ohio State
University (OSU) (CITR) [8].
Vehicle: a sensor equipped 2012 Honda Accord
Driving location: Columbus, OH
Driving paths: routine daily routes
Sensors: 1. NovAtel GPS unit: provides GPS latitude, GPS longitude, timestamp of reading and others;
2. Controller Area Network (CAN): bus provides timestamp of reading, yaw rate, lateral acceleration,
speed, and others.
3. Three HD cameras: provide views of the front, left side, and right side of the vehicle[8] V. Gadepally, A. Krishnamurthy, and Ü. Özgüner, "A Framework for Estimating Driver Decisions near Intersections," Trans. Intell. Transp.
Syst., vol. 15, no. 2, 2014.

North Carolina Agricultural and Technical State University
www.ncat.edu20
Data Analysis and Simulations
a) Experimental Setup
Data Extraction:
manually marking the collected videos and the corresponding data (velocity,
acceleration, and yaw-rate) time series are extracted.
The obtained time-series observations are then used to train the membership
functions and TS local models.

North Carolina Agricultural and Technical State University
www.ncat.edu21
Data Analysis and Simulations
b) Simulations
The training data for each model input
consists of three time series from three
incidents. These time series are put
together back to back with two zeros
between them for separation.
The training data is the used to train
models for acceleration, velocity and yaw-
rate of each maneuver.
Example of the Right Turn Velocity
model:
North Carolina Agricultural and Technical State University
www.ncat.edu22
Once all the nine TS models are identified for the three maneuvers, the model
is ready for testing.
The maneuver that its local models result in the smallest error for all three
observation models is the estimated model.
To compensate for the experimental error, a voting strategy is employed, such
that if two models of a specific maneuver produce the smallest error, that
maneuver is considered as the estimated driver action.
Data Analysis and Simulations
c) Simulations

North Carolina Agricultural and Technical State University
www.ncat.edu23
One example of each maneuver is used as testing data
In this table, the combination of MSEs from all the models of maneuvers is
presented as a matrix for each example.
The rows represent the maneuvers: straight, right turn and left turn,
respectively.
The columns represent the error: velocity, acceleration and the yaw rate for
each maneuver respectively.
Simulation Results
a) Simulations

North Carolina Agricultural and Technical State University
www.ncat.edu24
Simulation Results
a) MSE MATRIX
The rows represent the maneuvers:
straight, right turn and left turn,
respectively.
The columns represent the error:
velocity, acceleration and the yaw
rate for each maneuver
respectively.

North Carolina Agricultural and Technical State University
www.ncat.edu25
Acceleration
models simulation
with Right Turn
data
Right Turn model
has the best
performance.

North Carolina Agricultural and Technical State University
www.ncat.edu26
Velocity models
Simulation with
Straight Data:
Straight model
has the best
performance.

North Carolina Agricultural and Technical State University
www.ncat.edu27
Summary
Introduction of Takagi-Sugeno model
Gath-Gava fuzzy clustering for TS model identification
Modified Gath-Gava fuzzy clustering for TS model identification
Examples of applications of the proposed method
Modeling of Driver Behavior with GG fuzzy clustering

North Carolina Agricultural and Technical State University
www.ncat.edu28
Perform a more comprehensive survey on modeling
techniques
Expand the proposed model to predict the driver behavior
more steps into the future
Train the model recursively so we can use it for online
applications.
Future Work

North Carolina Agricultural and Technical State University
www.ncat.edu29
Questions
How to train the models using multiple
experiments?
What is the necessary threshold time window for
predicting drivers action in future?
How to obtain SHRP2 data???

North Carolina Agricultural and Technical State University
www.ncat.edu30