north dakota strategic freight analysis - item i. intermodal
TRANSCRIPT

NORTH DAKOTA STRATEGIC FREIGHT ANALYSIS
Item I Intermodal HighwayRailContainerTransportation and North Dakota
Prepared byMark Berwick
Upper Great Plains Transportation InstituteNorth Dakota State University
Fargo North Dakota
October 2001
Disclaimer
The contents of this report reflect the views of the authors who are responsible for the facts andaccuracy of the information presented herein This document is disseminated under the sponsorship ofthe Department of Transportation University Transportation Centers Program in the interest ofinformation exchange The US government assumes no liability for the contents or use thereof
i
EXECUTIVE SUMMARY
One of the greatest challenges facing rural communities is limited transportation options Many
small companies do not produce quantities sufficient to ship in unit trains or even full truckloads
Intermodal shipping should provide companies and identity-preserved producers with truck trailer and
container convenience while taking advantage of lower costs provided by rail shipping Presently North
Dakota has no intermodal facility Short line railroads may enhance their own traffic base and customer
service by adding an intermodal option
A survey of North Dakota businessesrsquo outboundinbound transportation was conducted to
identify containers now being shipped by truckrail intermodal into and from the state Results showed
that the Southeast portion of North Dakota represented some 63 percent of all traffic This is due to a
combination of business density and willing respondents A Commodity Flow Survey (CFS) was used to
estimate potential container truckrail intermodal traffic generated in North Dakota The increased
shipments identified in the CFS and previous study estimates of potential intermodal traffic indicate that
the railroads view of intermodal is dependant on other variables
This study provides a snapshot of truckrail container intermodal shipping into and out of North
Dakota The study revealed the benefits of intermodal transportation including lower overall
transportation costs increased economic productivity and efficiency reduced congestion and burden on
over-stressed highway infrastructure higher returns from public and private infrastructure investments
reduced energy consumption and increased safety
The truckrail container intermodal shipping problem in North Dakota is circular in nature
Problems exist in the form of rates and service Rates are high and service levels low because there is no
volume and there is no volume because rates are high and service levels are low
ii
iii
TABLE OF CONTENTS
INTRODUCTION 1Objective 3Methodology 3Implications 3Report Organization 4
LITERATURE REVIEW 5Characteristics of Intermodal Transportation 5Intermodal Transportation Facilitators 8Motor Carriers 9Short Line Railroads 11Intermodal and Class I Railroads 15Transportation Technology 19North Dakotarsquos OutboundInbound Intermodal Survey 22Economic Census Commodity Flow Survey 29North Dakota Commodity Flow Analysis 29
Economic Census Commodity Flow Survey 29Analysis 35Transportation Cost Comparisons 38Impact on North Dakota 44
Model 45TruckRail Container Intermodal Terminal Costs 45 Intermodal Facility Costs 45Firm Characteristics 46Costs and Sensitivity Analysis 46
Base Case 47Sensitivity Analysis 50
Lifts Costs and Volume 50Total Investment and Annual Costs 52
CONCLUSIONS 55
REFERENCES 59
APPENDIX A mdash Explanation of Intermodal Equipment 61
APPENDIX B mdash Model Explanation 65
APPENDIX C mdash Intermodal Container Survey 77
iv
LIST OF FIGURES
Figure 1 Estimated Freight Rates Per-Ton from Central Iowa to Japan (Reichert and Vachal
2000) 40
Figure 2 Transportation Cost Comparisons of Soybeans from Fargo ND to Tacoma 42
Figure 3 Equipment Investment versus Total Costs 52
LIST OF TABLES
Table 1 Intermodal Survey State Totals 22
Table 2 Intermodal Survey Northwest Region Totals 23
Table 3 Intermodal Survey North Central Region Totals 24
Table 4 Intermodal Survey Northeast Region Totals 25
Table 5 Intermodal Survey Southeast Region Totals 26
Table 6 Intermodal Survey South Central Region Totals 27
Table 7 Intermodal Survey Southwest Region Total 28
Table 8 Comparison of United States and North Dakota Shipments 33
Table 9 US Shipments by Mode Value Weight and Weight-Distance 34
Table 10 Shipment Characteristics by Mode of Transportation for North Dakota 1993
and 1997 35
Table 11 Anticipated Number of Lifts 38
Table 12 Assumptions and Options for the Base Case Scenario from Sheet One
of the Intermodal Feasibility Costing Model 47
Table 13 Investment for the Base Case Intermodal Facility 48
Table 14 Annualized Costs for the Base Case Intermodal Facility 49
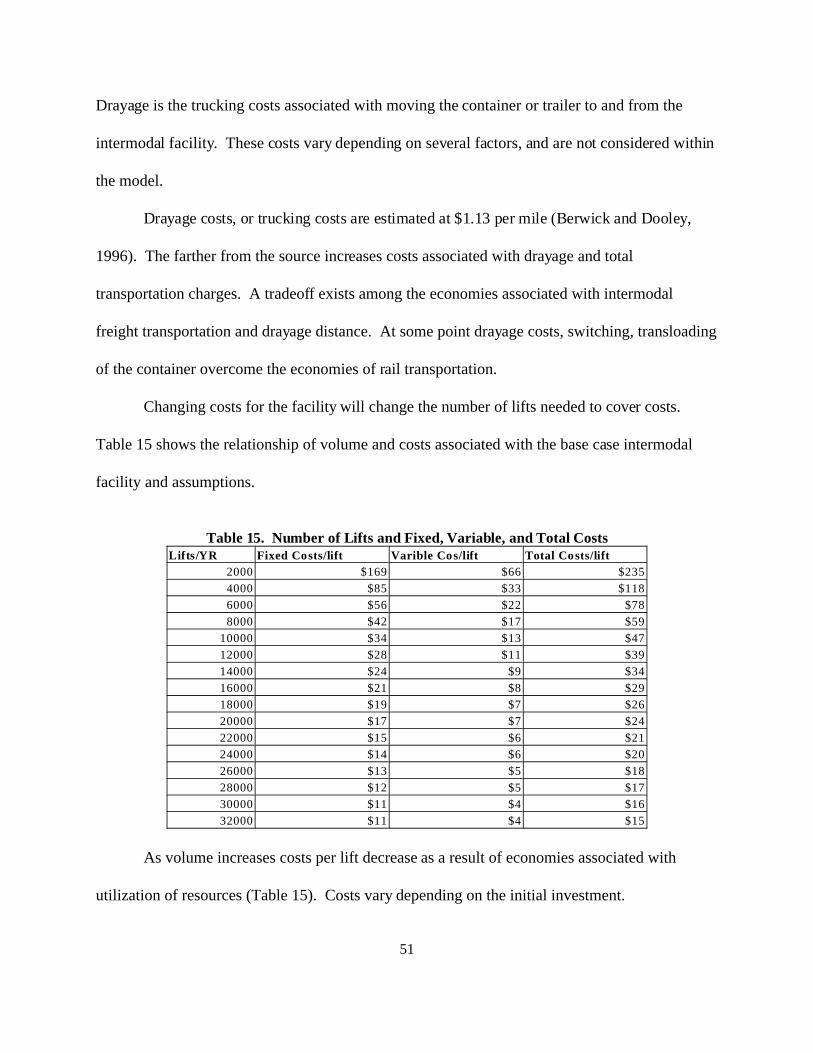
Table 15 Number of Lifts and Fixed Variable and Total Costs 51
Table 16 Change in Annual Cost with Different Levels of Track Investment 53
1
INTRODUCTION
Throughout agricultural history North Dakota has been known for supplying high quality raw
agricultural commodities Throughout the agricultural history of the area and more recently on a larger
scale economic forces have encouraged North Dakota producers to add value to their commodities either
through processing or producing a commodity to fit the specifications of a customer
The challenge facing value-added and identity-preserved producers is distance to markets
Producers and suppliers in the region must transport products long distances and most have few options
In todayrsquos competitive business environment getting the product to the right place when the customer
needs it is increasingly important Producers must deliver high quality product at a competitive price
when the competition often is located closer to the source of final demand
Value-added agriculture has been an economic development tool used to diversify the economic
base of rural communities One of the greatest challenges communities face is limited transportation
options The primary means for freight transportation in the rural regions is truck and rail Many small
companies do not produce quantities sufficient to ship in full truckload or unit trains nor do their
customers demand these large quantities
Rural agricultural communitiesrsquo inbound procurement and outbound distribution options are
limited to local trucking companies and rail Few communities generate enough truck traffic through
existing businesses to offer evidence of excess or available truck capacity Where rail is available Class
I carriers are reluctant to make short less-than unit train movements and offer limited options for
products other than grain originating or terminating in rural areas
North Dakotarsquos rail service is made up of two Class 1 railroads a regional railroad and two short
lines The ideal intermodal freight for Class 1 railroads is a large unit train loaded at one facility and
shipped to another and off loaded This provides the most economical and profitable scenario for Class 1
2
railroads Smaller less than trainload traffic generated is viewed by the Class1 railroad as a train of way
and the rate charged is more and service is less than that of a designated train
The purpose of container on flat car (COFC) or trailer on flat car (TOFC) intermodal shipping is
to take advantage of the economics of each different mode used Intermodal provides for truck trailer
and container convenience while taking advantage of the lower costs provided by rail shipping
Currently in North Dakota there is no intermodal facility Shippers desiring intermodal shipping
either have to use all truck or dray the container or trailer to an intermodal facility Depending on
distance this may provide a distinct disadvantage for North Dakota shippers The closest existing
intermodal facilities are located in Dilworth MN MinneapolisSt Paul MN and Billings MT
Possibilities for siting intermodal facilities on short lines in rural areas may provide rural communities
with an opportunity to diversify their infrastructure transportation rates and transportation equipment
resource base for attracting and growing value-added ventures Cooperation from Class I railroads and
the short line carriers systems may provide opportunities for an intermodal shipping alternative to rural
areas of the state
Intermodal facilities usually are operated by a third party and the railroads serve only as the
transportation provider At present large intermodal freight volumes are necessary for an economically
viable facility An intermodal facility can range from a simple and relatively inexpensive loading facility
using circus ramps to a sophisticated high cost operation involving gantry or overhead cranes allowing
for fast train loading and offloading The cost of the facility is in direct proportion to the equipment
needed trackage amount of land and labor associated with the size and volume of the facility Another
advantage to intermodal is removing some truck traffic from the state highway system Increased truck
traffic may impact the road system to and from the facility but overall impact on state highways may be
lessened
3
Objective
The main objective of this project was to evaluate the current truckrail container intermodal
transportation system in North Dakota This included traffic rates and service and facilities The
secondary objective was to determine costs associated with start-up and operating an intermodal facility
Methodology
This report describes truckrail intermodal short line railroads motor carriers and the Class I
railroads A survey of shippers was performed to determine the intermodal traffic in the state Analysis of
the Commodity Flow Survey (CFS) also was performed along with an examination of BNSFrsquos rates out
of North Dakota Cost comparisons were made among modes to determine least cost mode
Implications
Container intermodal shipping is not an option for many businesses in North Dakota Many
shippers may not know the total landed cost Landed costs include all logistics costs including
transportation to the final customer This cost may be complicated with multi-modal and or international
shipments There are markets for many North Dakota products but many times transportation options
and costs are the barrier Intermodal shipping should reduce shipping costs and provide opportunity for
competition in domestic and international markets
Without competitive truckrail container intermodal service North Dakota shippers remain at a
logistical disadvantage Many industries are affected by lack of intermodal service including agricultural
processors manufacturers identity-preserved commodity producers building suppliers and retailers
negatively impacting the entire state economy through higher shipping costs
Container truckrail intermodal implications to the North Dakota trucking industry would be
evident in the case of a modal shift Diverting freight volume away from truck to rail may be
4
advantageous to shippers but may be negative to the trucking industry Where the rail system seems
reluctant to accept low volume freight it may be the backbone of many trucking firms
Report Organization
This report is organized into four sections The first section is the introduction and background
and the next section is the literature review The report discusses short line railroads Class I railroads
truckrail container intermodal shipping methods or procedures A shipper survey also is discussed and
analyzed Shipping modes and costs are compared and finally the conclusions of the report finding
5
LITERATURE REVIEW
Characteristics of Intermodal Transportation
Intermodal freight transportation is the seamless and continuous door-to-door transportation of
freight on two or more transportation modes for example truck-rail or truck-ocean (Muller 1995)
Intermodal transportation growth has been aided by deregulation of US transportation global business
growth and changes in the business environment (Coyle Bardi and Novack 1994) In 1997 intermodal
marketers reported that loadings of trailers and containers increased by 187 percent after climbing 235
percent in 1996 and revenue grew at 145 percent more than double the 71 percent rise in 1996 (WWD
1998) Service issues including the Union Pacific network problems were listed as one reason for the
drop in the percentage increase in intermodal loadings from 1996 to 1997
According to Spraggins (1997) benefits of intermodal transportation include
bull lower overall transportation costs
bull increased economic productivity and efficiency
bull reduced congestion and burden on over-stressed highway infrastructure
bull higher returns from public and private infrastructure investments
bull reduced energy consumption
bull increased safety
Lower transportation costs are realized by using each mode for the portion of the trip for which it
is best suited For example rail could be used on the long-distance haul and truck on the short-distance
haul to and from the intermodal facility using the door-to-door service of truck and the economies
provided by rail Using rail for the long-haul portion of the trip may result in improved environmental
conditions including improved air quality because of reduced energy consumption Using fewer trucks
for the long-haul portion of the trip lessens congestion in major metropolitan areas and also lessens
damage to the roadway
6
Intermodal is used in domestic and international shipments The domestic movement usually is
truck-rail while internationally it can be truck-rail-ocean or rail-ocean or truck ocean Containers have
increased in popularity in international trade ldquoIt is likely that containers will replace trailers in North
American cross-border movements and even in domestic intermodal movementrdquo (Spraggins 1997)
Trailers will remain important in the short haul and low volume loads Some bulk commodities now are
moving by containers These commodities mostly are food commodities such as bananas and coffee and
other fresh fruits Demand for identity-preserved (IP) commodities also is on the rise Identity-preserved
may be simply providing a customer with a specific product origin or as complex as guaranteeing and
ordering specific agronomical practices (Vachel 2000) Organically grown wheat or soybeans for export
are examples of identity-preserved commodities Although identity-preserved could be a train of 110
cars of 14 percent protein spring wheat weighing 60 pounds per bushel and having 12 percent moisture
with less than 1 percent dockage most identity-preserved shipments tend to be small quantities and of
higher value Containerization ensures the shipper and receiver integrity of the product being shipped
Identity-preserved market demands may increase demand for container shipments in rural settings where
commodities are grown
Many farmers are seeking ways to add value to their farming operations and many are exploring
the possibility of exporting IP grain in small lots Rural North Dakota identity-preserved grains need the
containers and the economies of shipping by rail long distance for this concept to work Without an
intermodal loading facility within a reasonable distance any premium negotiated for the IP shipment may
be lost to transportation costs
Intermodal facilities vary in size equipment used and type of facility Increases in intermodal
freight has led to the development of intermodal hubs or terminal locations where trains are gathered
and cars are exchanged or switched to form new trains ldquoThese lsquohub-and-spokersquo operations take
7
advantage of reducing the number of point-to-point operations when the volume is not large enough to
make them cost efficientrdquo (Muller 1999)
Consolidation in the rail industry created duplicate services and many times the remaining carrier
consolidated duplicate services into one The rail industry targeted less profitable inefficient intermodal
facilities in smaller cities where less-than-unit trains delivered and picked up containers and trailers
which were loaded through the use of circus ramps This service has been reduced from approximately
1500 operations in 1970 to less than 370 in 1998 (Muller 1999) This reduction in facilities has limited
transportation options for many shippers in smaller cities or rural areas Reliable timely cost
competitive intermodal service is not available in many rural areas
Shippers cite that improvements in timeliness and price competitiveness are important
enhancements that would cause them to shift to intermodal usage (Spraggins 1997) A survey reported
by Spraggins (1997) reaffirmed that the service gap between intermodal and truckload services is the
greatest barrier to improving intermodalrsquos share of the North American freight market Intermodal
generally is thought of as a practical alternative for general freight (non-bulk) that moves in full
trailerload or containerload lots (Spraggins 1997) In general intermodal usage varies by the size of the
company products being shipped and distance from an intermodal hub
The largest barrier to many companies using intermodal shipping is the location of intermodal
hub facilities An intermodal loading facility located within a reasonable distance is essential to justify
using intermodal as a viable transport mode As distance to an intermodal facility increases it becomes
uneconomical to use the intermodal option as transit times and distance costs increase This explains
why many small rural companies simply continue to use trucks to transport product
8
Intermodal Transportation Facilitators
Transportation facilitators serve shippers and carriers by arranging the transportation of the
cargo Some facilitators perform transportation functions including consolidation palletizing or
containerizing of freight for shippers (Muller 1999) Facilitators also may use their own documentation
for the movement Facilitators include many categories of participants 1) domestic freight forwarders
2) international freight forwarders 3) import brokers domestic air freight forwarders 4) air cargo
agents 5) shipper councils associations and cooperatives 6) intermodal marketing companies 6)
transportation brokers 7) perishable brokers 8) consolidators 9) transloaders 10) distribution carriers
11) customshouse brokers 12) export management companies and 13) third-party logistics firms
(Muller 1999)
Intermodal marketing companies can provide door-to-door services tailored to specific customer
needs Third-party logistics companies also perform door-to-door service have been growing in
popularity Intermodal marketing companies or third-party firms provide many of the functions provided
by the groups listed above Most intermodal loading facilities are not operated by the railroad that
services the facility Third party providers act as a liaison between shippers and the railroads providing
customer service access to equipment and attractive rates because of volumes associated with the third-
party provider
For an intermodal terminal to provide efficient effective service close cooperation among all
parties is necessary Muller (1999) identified the requirements of a successful intermodal terminal as
follows
bull Furnish necessary personnel and container-handling equipment to receive store anddeliver intermodal trailers and containers
bull Prepare all necessary documents for receiving and delivering intermodal containers andtrailers ensuring that all port airport and other terminal charges customs duties andfreight charges have been paid
9
bull Maintain a status report of all trailers and containers received delivered and on hand inthe terminal for submittal to carriers involved
bull Maintain accurate inventory and locations of all intermodal trailers containers andequipment
bull Preplan all loading and unloading operations from data supplied by carriers and theiragents
bull Provide necessary personnel and equipment to service loading and unloading operationsbetween modes
bull Prepare all cargo plans hazardous cargo manifests and related documents for delivery tothe carrier and its vehicles
bull Maintain security for all containers and equipment in the terminal
bull Prepare all reports relative to terminal functions
bull Furnish adequate supervision to ensure proper performance of all operations
If a sole carrier uses the terminal all functions can easily conform to the needs of that carrier If
more than one carrier is served all carriersrsquo operational requirements must be met without interfering
with other carriers Other characteristics of a good terminal include a convenient location access and
adequate infrastructure
Motor Carriers
Although the trucking industry is perceived as a competitive homogenous industry many
characteristics segment the industry into sub-industries The trucking industry is classified as either local
or intercity There are vast differences between these two segments Local carriers include intercity
delivery services such as dump trucks garbage trucks and other services (Titus 1994) Intercity
trucking is classified between less-than-truckload (trucks hauling less than 10000 pounds) and the
truckload sectors
Many small truckload (TL) firms operate in the motor carrier industry An estimated 590000
trucking companies operate in the United States (Coyle Bardi and Novak 1994) Of the regulated
10
carriers in the trucking industry it is estimated that more than 95 percent are companies with less than $1
million in gross revenue (Coyle Bardi and Novak 1994) Many of these smaller companies are
owneroperators or small firms with a few trucks
Trucks have an important role in moving commodities to market in and out of North Dakota
Grain shipments by truck declined from 34 percent in 1978 to a low point of 21 percent in 1987 (Dooley
Bertram and Wilson 1988) Since 1987 the truck portion of the grain shipments have been on the
increase and in 1999 the truck portion of grain movements was 31 percent (Vachal 2000) This
increase is associated with the increasing proportion of commodities that are shipped to locations in the
state In-state shipments in the 1983-84 crop year were 8 percent of the crop compared to 1999-00 where
18 percent of the crop was shipped to in-state locations (Vachal 2000)
The increase in satellite elevator facilities associated with the changes in the elevator industry
and value-added processing plants in North Dakota give the trucking industry a larger role to play in
grain movement in North Dakota Shuttle trains and heavier grain cars may put short line railroads and
smaller elevators at a disadvantage resulting in longer farm-to-market movements for grain by truck
Even though most of the bulk grain still will leave the state in a unit train the transportation cost saving
that may be provided by shuttlersquos will provide incentive for longer movements by truck
Changes in manufacturing and supply chain management have lowered inventories and created a
move toward just-in-time inventory management These new changes have increased the need for quality
on-time transportation Trucking is a large part of the product movement in the supply chain The
service that trucks can provide in many instances put rail at a disadvantage Using a combination of
trucks and rail for long movements takes advantage of the economies of rail while providing for the
convenience of door-to-door service provided by trucks
11
Short Line Railroads
Short line railroads are an important component of the North Dakota and US transportation
system Short lines although many times limited by infrastructure and equipment availability provide an
added link between rural communities and the world
Although the current rail system will continue to be the mode of choice for origination of the
regionsrsquo commodity shipments it is important to investigate alternatives for enhancing transportation
services that can be used to attract business ventures Because the agriculture community is pursuing
value-added ventures and exploring the value of identity-preserved products having the option of
shipping less-than-trainload quantities with reasonable transportation rates is increasingly critical Short
line railroads may provide the avenue of reasonable rates for shipping smaller quantities North Dakotarsquos
three short line railroads account for 32 percent of the rail track in the state serving the northern tier
western south central and southeastern regions of the state
There are three events tied to the formation of the current short line rail industry (Dooley 1991)
First legislation establishing Conrail in 1973 provided initial stimulus for the formation of new railroads
Second reorganization of the Milwaukee Road and the liquidation of the Rock Island creating
opportunities for short line Third federal railroad deregulation leading to opportunities for short line
creation The deregulation legislation of the 1970s included provisions of operational subsidies and
rehabilitation funds for light density branch lines (Dooley 1991) The Staggers Act of 1980 provided
communities and shippers with opportunities to purchase or support rail lines identified for abandonment
by Class I carriers (Dooley 1991)
Intermodal freight transportation growth has been increasing by double digit gains except for
1996 where there were problems because of Class I railroad mergers Mergers by Class I railroads has
led to larger railroads but a reduction in the total track controlled by the Class Is Class I railroads have
abandoned or sold off light density rail lines The 4-R Act and the Staggers Act eased the abandonment
12
process requiring the Interstate Commerce Commission to speed approval of abandonment (Keeler
1983) The deregulation designed to streamline Class I railroads has paved the way for the formation of
short-line railroads Short line railroads serve as the bridge between rural communities and the larger
railroads leading to markets Short line railroads also serve as low-cost feeder lines for Class I railroads
Dooley (1991) recognized three reasons for the creation of feeder lines or short lines
1 A desire to eliminate the burdens of ownership (high operating and maintenance costs)
2 An expectation to recover some economic value from the line (sales revenue)
3 A desire to preserve the benefits associated with ownership (access to traffic originated
or terminated on the lines)
Babcock Russell Prater and Morrill (1993) evaluated the viability of short line versus
abandonment The study revealed strengths and weaknesses of the short line industry The advantages
short lines have over Class I include lower labor costs superior shipper service and reduction in truck
shipments reducing highway maintenance and rehabilitation Disadvantages to short line include their
inability to make large capital expenditures resulting in deferred maintenance Many times short line are
dependent on limited business sources or customer base and they also are dependent on the Class Is
railroads for equipment and access
Additional factors determining a short line railroadrsquos success or failure are many Possibilities
exist through economic development and by increasing density or customer base by establishing an
intermodal facility would increase volume on a short line creating revenue and adding a transportation
option for shippers in the surrounding area Another important benefit includes reduced highway
maintenance because of less truck traffic
Babcock Russell Prater and Morrill (1993) identified components associated with a short linersquos
success These components include anticipated components such as traffic and efficiency and others
13
unique only to the short line railroad industry The components associated with profitable short line
include
Traffic Components
bull Adequate density
bull Non-seasonal traffic
bull Diversified traffic base
bull Product mix with high valued product
Management and Labor
bull Motivated skilled workforce
bull Experienced management
bull Skilled marketers (understand customer needs)
bull Management close to shippers
bull Cost controls
Relationship to Class I
bull Multiple connections
bull Guaranteed access
bull Reasonable switching costs
bull Set rates
bull Mutual benefits
Financial
bull Equity investment
bull Realistic business plan
bull Realistic purchase price
14
bull Adequate capital
bull Rehabilitate track
Track Quality
bull Track maintenance and investment
State Assistance
bull Financial assistance
bull Information
bull Economic development
bull Financial insurance plan
It would be intuitive that many of the factors that make for a successful short line also could be
the same factors that would make a successful truckrail container intermodal loading facility Moreover
the relative importance of a single value-added venture is much greater for a short line carrier than for a
large Class I railroad Partnering rural communities producers producer-initiated value-added
processors rural manufacturers and a local short line carrier in the start-up and operation of a rural
intermodal loading facility may present opportunity for economic expansion of rural communities and the
surrounding area
North Dakota is well-versed in the importance of short-line railroads as an alternative for
continuing rail service on lines deemed unprofitable by Class I railroads Intermodal facilities on short
lines would provide rural business and communities alternative transportation options for those desiring
expansion of their economic base Moreover short line railroads may enhance their own traffic base and
customer service by adding an intermodal option
15
Intermodal and Class I Railroads
Intermodal transportation has been hailed as the savior of the railroads but the rapid growth of
the 1980s and 1990s has slowed This does not mean that the intermodal business is declining for the
railroads The expedited high reliability low transit time ground transportation for freight is a 400
billion dollar market Of this large pie the railroad only has about a two billion dollar share The growth
potential for rail is huge (Ellis 2000) For the railroad to gain market share from the trucking industry
service and transit time must improve
Even though intermodal is the fastest growing sector for the rail industry the Class Is face
lowered revenue per car than other enterprises Historically intermodal produces the least revenue but
generates the most traffic Financial statements for the Union Pacific (UP) and the Burlington Northern
Sante Fe (BNSF) show the intermodal revenue problem In 1999 the UP moved 2738000 intermodal
carloads an 8 percent increase over 1998 (1999 UP Annual Report) However comparing carload
revenue among shipment types it generated approximately one-half of the next lowest revenue source
The intermodal freight generated $630 per car compared to $1158 for the next lowest revenue
commodity (1999 UP Annual Report)
BNSF moved 3203000 cars in 1999 up from 3080000 in 1998 This intermodal traffic
resulted in $2507000000 in revenue The revenue per car was $783 compared to the next lowest
revenue per car at $1049 (1999 BNSF Annual Report) Industry analysts view the low revenue per car
for intermodal freight as a potential pitfall for the financial health of Class I railroads The concern is
that the growth potential for the railroads is only in intermodal freight and most other commodities have
limited potential Because of service problems historically associated with rail many shippers are
reluctant to switch to rail because of the service levels and timeliness of trucking Improved service
levels or excellent service may provide railroads an avenue for increasing rates on intermodal traffic
16
Fixing service problems is the number one comment from most rail shippers (Ellis 2000) BNSF
is working toward improved service by providing a performance guarantee on intermodal service on five
lanes On-time performance still may not provide the service desired by many shippers A truck legally
can transport from coast to coast in about 100 hours The best rail intermodal service is just under that of
trucks but the actual delivery time is not consistent because of congestion in intermodal yards and other
problems For rail intermodal to meet truck delivery time head to head railroads would have to raise
speed restrictions to between 80 and 90 miles per hour Because of costs and safety issues this is not a
practical approach
Interchange problems also exist for many urban rail yards For instance in 1995 a car was traced
from Los Angeles to Chicago about 2200 miles The main trip was 48 hours but it took another 40
hours to move the next 40 miles through Chicago and get to the final destination Again in 2000 this
same route was timed and dramatic improvement was made but it still took over 24 hours to move the
last 40 miles One reason for the large dwell times in many cities is that each rail carrier uses a separate
intermodal facility which results in slow exchanges (Wallace 2000) Sharing facilities could provide
improved service levels Sharing facilities among different railroads mitigates the space problem and may
increase efficiency Other ways of improving performance is to bypass bottlenecks An example is
Kansas City Southernrsquos ldquoMeridian Speedwayrdquo which connects the BNSF and Norfolk Southern while
bypassing major bottlenecks in urban areas (Wallace 1997)
Fixing the service problems could contribute to successful intermodal operations Management
could reorganize and streamline operations In the early 1990s the Santa Fe railroad turned intermodal
from their least profitable segment to a level comparable to carload traffic Santa Fe modeled their
management after motor carriers viewing intermodal operations as ldquoprofit centersrdquo Santa Fe created an
intermodal business unit to run independently creating a new organizational structure The main
advantage of the new department was a complete picture of the business Previous responsibilities were
17
spread out among many departments Santa Fe focused heavily on intermodal marketing companies
(IMC) Santa Fe found 20 percent of IMC customers produced 80 percent of the business so they
dropped the number if IMCs used from 260 to 55 (Giblin 1996) Santa Fe aggressively invested in new
longer 48-foot containers compared to the old 45-footers The next move is to 53-foot containers
another efficiency move for shippers (Lang 1998) In 1994 Santa Fe offered six levels of service with
six different prices Santa Fe found that premium traffic provided the most profit and customers were
willing to pay for guaranteed service (Giblin 1996)
Another efficiency gain for Santa Fe was improved lane balance Lane balance is the ratio of full
to empties moving in any given direction Trucks usually operate with a ration of 95 percent full and 5
percent empty while Santa Fe was 55 percent full and 45 percent empty Through aggressive pricing
Santa Fe improved the ratio to about 95 percent full Santa Fe also exited from all lanes were they did
not see a clear competitive advantage
Intermodal growth has brought about capacity questions Intermodal loadings increased rapidly
during the 1990s Intermodal loadings are terminal intensive which may provide bottlenecks for
delivery Container loadings increased some 32 percent in the 1990s and trailer loadings decreased
slightly The shift to containerization has brought three changes for international shipping to and from
the United States First the ships have grown much larger demanding that many more containers be
stored at the port facility Second railroads are hauling large amounts of intermodal containers creating
higher infrastructure costs Third the land bridge traffic has increased with higher rail and ship
efficiencies thus Asian traffic is being shipped across land and sea (Luberoff and Walder 2000)
These larger ships force extensive upgrading at port facilities to handle the large ships and
remain viable The ports of Los Angeles and Long Beach have granted $394 million for the Alameda rail
corridor This corridor is a $24 billion 22-mile long depressed grade with separated rail and will connect
the port facility with the rail facilities of the BNSF and UP Other ports like Tacoma and Oakland are
18
considering similar projects (Luberoff and Walder 2000) Other technology like remote controlled
cranes and new smart gates that send draymen directly to loads should help improve port and other
facilities
If the rail capacity exists intermodal transportation has room for growth Chemical shipping has
only begun to use intermodal Over the past decade the worldrsquos tank fleet expanded about 10 percent a
year In Europe the tank container has captured a large share of tank truck traffic The intermodal tank
or tanktainer offers many advantages over tank trucks Intermodal tanks can be shipped overseas easily
placed on ships or railcars quickly and easily used for temporary storage on site and offer more
structural protection than the tank truck Currently there are an estimated 100000 tank containers in
service worldwide most common being the 20- foot International Organization for Standardization (ISO)
tank The chemical industry is the leading user of tank containers but many industries including food
beverage oil gas and electronics also use them (Corkhill 2000) The intermodal usage currently is
most cost effective on moves over 350 miles but the Hoyer Corporation of Germany has proved the
success of the short haul Hoyer runs a 75-mile intermodal tank container shuttle that runs five times a
day with up to 14 tank containers The service is highly used and is profitable (Corkhill 2000)
In the United States about two-thirds of chemical manufacturers rely on a single rail carrier in
tank cars The chemical industry uses rail to ship bulk commodities because they can be handled safer
and more efficiently by rail than by truck (Corkhill 2000) This provides a large potential market to ship
chemicals domestically and internationally The ISO tanktainers are well-suited for international use
They fit existing slots on container ships and carry the maximum volume of product allowed under the
road regulations of various countries around the world Some reasons that these tanks have not been
adopted by US manufacturers include companies are unfamiliar with the method changes would have
to be made to loading facilities and companies may be unwilling to make the necessary investment to
change to a country wide container infrastructure (Corkhill 2000)
19
Beside tanktainers there is a potential to move non-bulk finished chemical goods by intermodal
container Du Pont began using some intermodal in the early 1990s and plans to continue to expand
because it provides a measure of safety and also has a cost advantage
Another system with possible growth potential is the RoadRailer RoadRailers first started in
1964 with the Chesapeake amp Ohio Railroad RoadRailers can be used as a truck trailer or train freight
car RoadRailers captured attention in the 1980s when they began being used extensively on the East
Coast by Northfolk Southern and its Triple Crown service However RoadRailers have been slow to
catch on for long distance moves Amtrak is now using RoadRailers to move mail for the US Post
Office The RoadRailers are bi-directional and can run at speeds up to 114 miles per hour so there is
potential for long distance high-speed transfers The new RoadRailer has half the capacity of a regular
sized boxcar but weighs 75 percent less and saves on fuel The RoadRailer can be added or taken off a
train most anywhere saving on infrastructure costs and may reduce drayage
This technology is used on a limited basis but may provide opportunity Other technological
advances also provide new possibilities and efficiency to the transportation industry
Transportation Technology
Communication technology has revolutionized the transportation decision-making process for
shippers carriers facilitators and government agencies Information technology provides users with
better control over operations and for carriers control results in efficiency gains Muller 1999
identified the current uses for electronic information
bull Identify the best rates and service levels available from carriers and facilitators
bull Book issue account for and generate reports on freight shipments
bull Track and manage assets especially containers and chassis
bull Plan trace and confirm routing of intermodal equipment and their cargoes
20
bull Examine the sequence of intermodal operations especially at terminals
bull Manage documentation
bull Respond quickly to emergencies or change of opertional orders
bull Confirm specific operations associated with the entire shipment including pickup and
delivery
bull Measure performance of carriers and facilitators
bull Budget and manage costs
Total software solutions also are being touted for all businesses SAP and Oracle promote
enterprise software that provides EDI capablities and offers a company other software Software
technology reduces errors by eliminating re-keying of data
The rail industry was first in EDI applications because so much of the traffic is handled on more
than one railroad Railroads now use EDI in many applications including bills of lading shipment
status weights equipment and cargo weights yard management waybill retrieval freight claim
submissions interline tracing rate requests logistics costs evaluation fleet management and other
modules to meet specific customer needs (Muller 1999)
EDI provides trucking firms with many of the same applications of rail These technology tools
help trucking companies improve services offered to customers EDI provides trucking companies with
the ability to partner with customers and develop initiatives such as ldquoquick responserdquo and ldquojust-in-timerdquo
strategies Trucking companies also employ ldquosatellite trackingrdquo systems for load and equipment tracking
These technologies support trucking company goals of increased efficiencies and provide better customer
service resulting in better relations with customers and other carriers
EDI communications systems at port facilities benefit terminals with accelerated gate
movements greater security better data entry and total better overall facility management Ocean
carriers have more international transactions and prefer EDI Most modes find it necessary to employ
21
EDI technology to communicate with exporters customs brokers freight forwarders port authorities and
government agencies
Many carriers are adopting and enjoying the use of financial EDI This provides for better cash
flow and easier payment methods for customers Many large retailers and manufacturers are using the
technology Electronic funds transfer (EFT) and electronic payment remittance advice are being used
widely Using these technologies are labor savings and provide for error free transactions Given the
number of transactions a large company may have daily the savings may be substantial
Other technologies that provide efficiencies and peace of mind for customers are tracking and
routing Satellite technology uses two-way messaging service provides for improved customer service
helps with measuring performance and provides for better overall customer relations Carriers can use a
combination of Global Positioning System (GPS) and EDI to provide customers with real-time status
information about their shipments Other tracking technoligies include cellular phone communications
UPSs system uses cellular and the software system called MaxiTrac which customers can aquire and
install on their own computer systems
Terminals often use barcoding to keep track of equipment or shipments Transponders or
transmitters are located at the yard entrance and other places within a yard or warehouse As products
are moved these transmitters read the barcode and transfer information to a computer and reporting
location of the product Technological changes also occur in the trucking industry Motor carrier
technology changes in trailers and combinations of trailers continue to change the cost structure of the
trucking industry Safety technology such as anti-lock brake systems and air ride suspension for tractor
and trailer improve trucking quality with less freight damage
The use of cell phones satellite tracking on-board computers and other technological changes
also have improved efficiency in the trucking industry Cell phones can be used to locate loads thereby
reducing search time Automatic billing and electronic data interchange (EDI) may reduce time spent
22
Table 1 Intermodal Survey State TotalsOutbound Business
Number Eastbound Westbound
Export
Rail Car 100 0 100
Trucks 2954 61 39
Containers 8011 65 35
Domestic
Rail Car 1416 55 45
Trucks 32162 57 43
Containers 988 50 50
Inbound BusinessNumber Eastbound Westbound
Import
Rail Car 104 50 50
Trucks 2064 61 39
Containers 813 50 50
Domestic
Rail Car 1034 50 50
Trucks 19162 64 36
Containers 0 0 0
billing and doing accounting procedures EDI is direct computer-to-computer communication that can be
processed by the receiver without re-keying information EDI facilitates the move toward efficiency in
the supply chain (Crum Premkumar and Ramamurthy 1996)
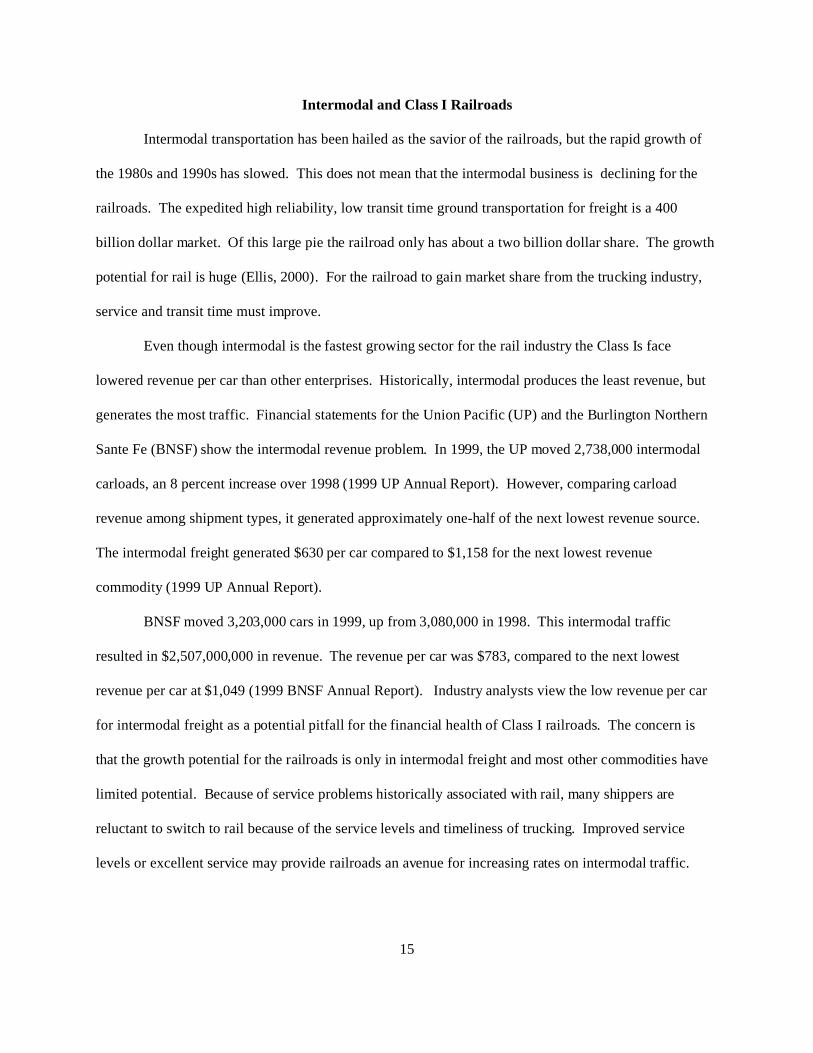
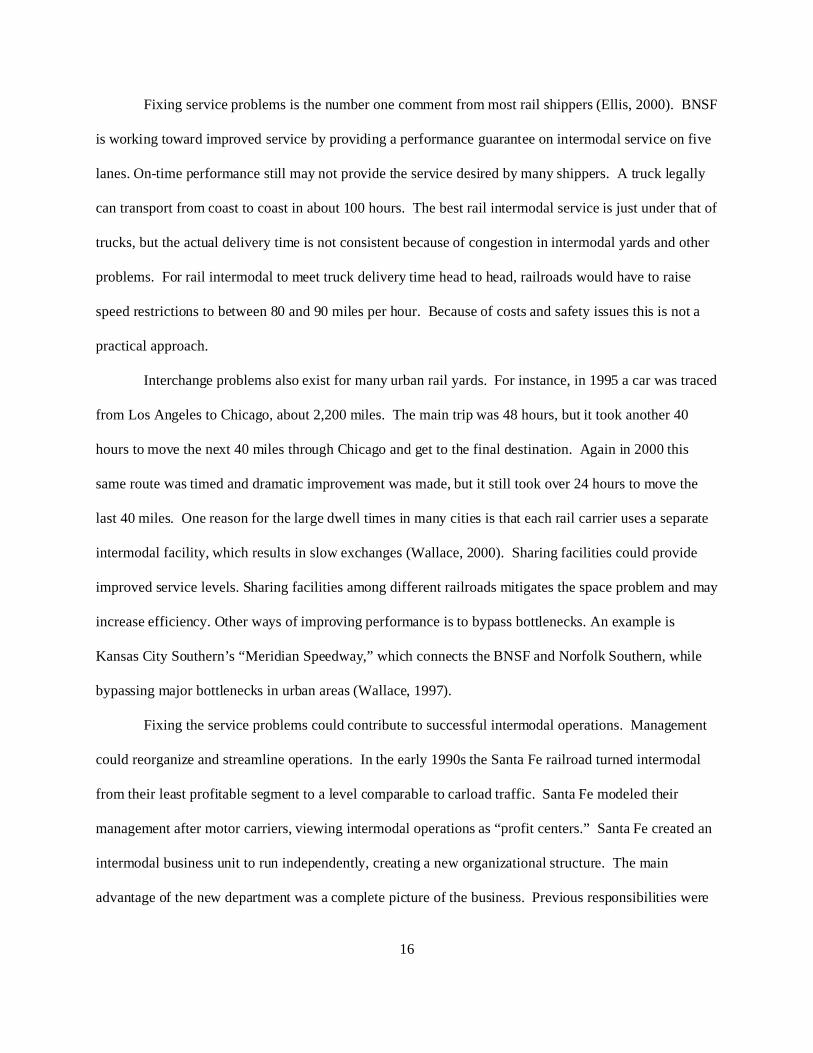
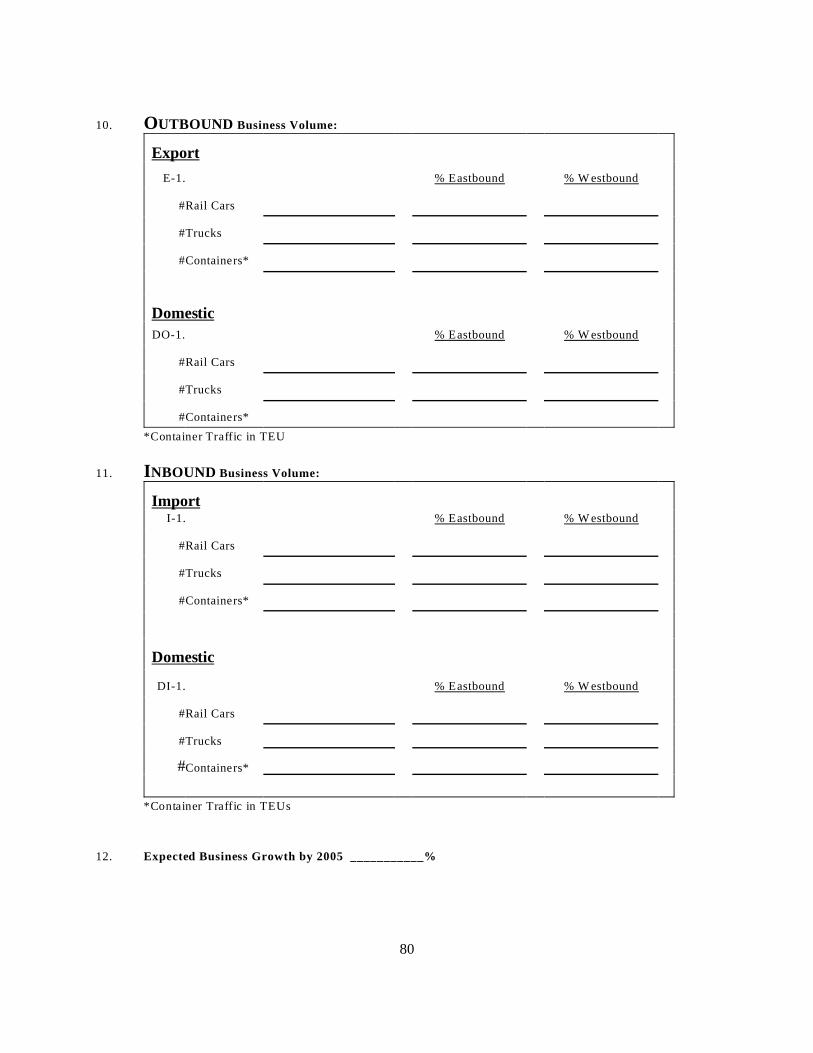
North Dakotarsquos OutboundInbound Intermodal Survey
A survey was conducted of North Dakota businesses Chosen from a combination of the
Department of Economic Development and Finance list of manufacturers in Bismarck and the
Manufacturers Register of the State of
North Dakota A total of 457
businesses were surveyed with 195
responding
The survey identified 8999
containers now being shipped by
truckrail intermodal from North Dakota
(Table 1) This survey did not include
elevators or individual farmers or
groups of farmers now shipping
identity-preserved grain Respondents
identified that the majority of shipments
were from the Southeast portion of the
state The Southeast portion of the state represented some 63 percent of all traffic The Southcentral
area of the state identified the next most traffic There were many more respondents from Southeastern
and Southcentral North Dakota than from the rest of the state Of the 195 respondents 85 were from
Southeastern North Dakota and 28 were from Southcentral North Dakota
23
The respondents in the northwest region identified 17 containers mdash outbound and
inbound This may represent problems associated with the distance to an intermodal loading
facility The northwest region represented a balance for inbound and outbound trucks and
containers The northwest region of North Dakota includes the city of Minot The number of
businesses responding in Ward County was only 10 which does not provide an adequate
representation of the northwest region of North Dakota
Table 2 Intermodal Survey Northwest Region Totals Outbound Business
Number Eastbound Westbound
Export
Rail Car 4 0 100
Trucks 277 50 50
Containers 14 58 42
Domestic
Rail Car 0 0 0
Trucks 838 59 41
Containers 0 0 0
Inbound BusinessNumber Eastbound Westbound
Import
Rail Car 0 0 0
Trucks 293 69 31
Containers 3 50 50
Domestic
Rail Car 0 0 0
Trucks 1150 64 36
Containers 0 0 0
24
The survey identified only truck traffic for the North-central region of North Dakota
Respondents identified no container traffic The survey results are based on respondents and
business density therefore some areas of the state with low volume may not be a true
representation of actual freight flows to and from an area
Table 3 Intermodal Survey North Central Region Totals Outbound Business
Number Eastbound Westbound
Export
Rail Car 0 0 0
Trucks 36 80 20
Containers 0 0 0
Domestic
Rail Car 0 0 0
Trucks 1154 53 48
Containers 0 0 0
Inbound BusinessNumber Eastbound Westbound
Import
Rail Car 0 0 0
Trucks 212 75 25
Containers 0 0 0
Domestic
Rail Car 0 0 0
Trucks 268 40 60
Containers 0 0 0
25
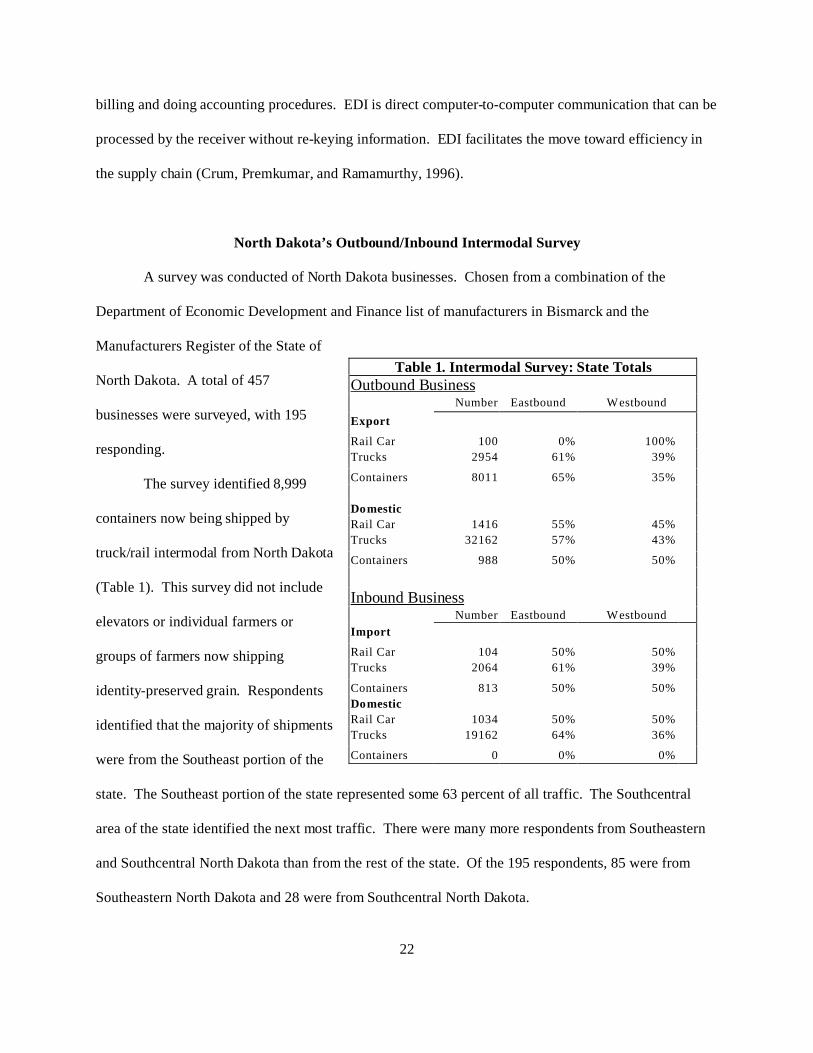
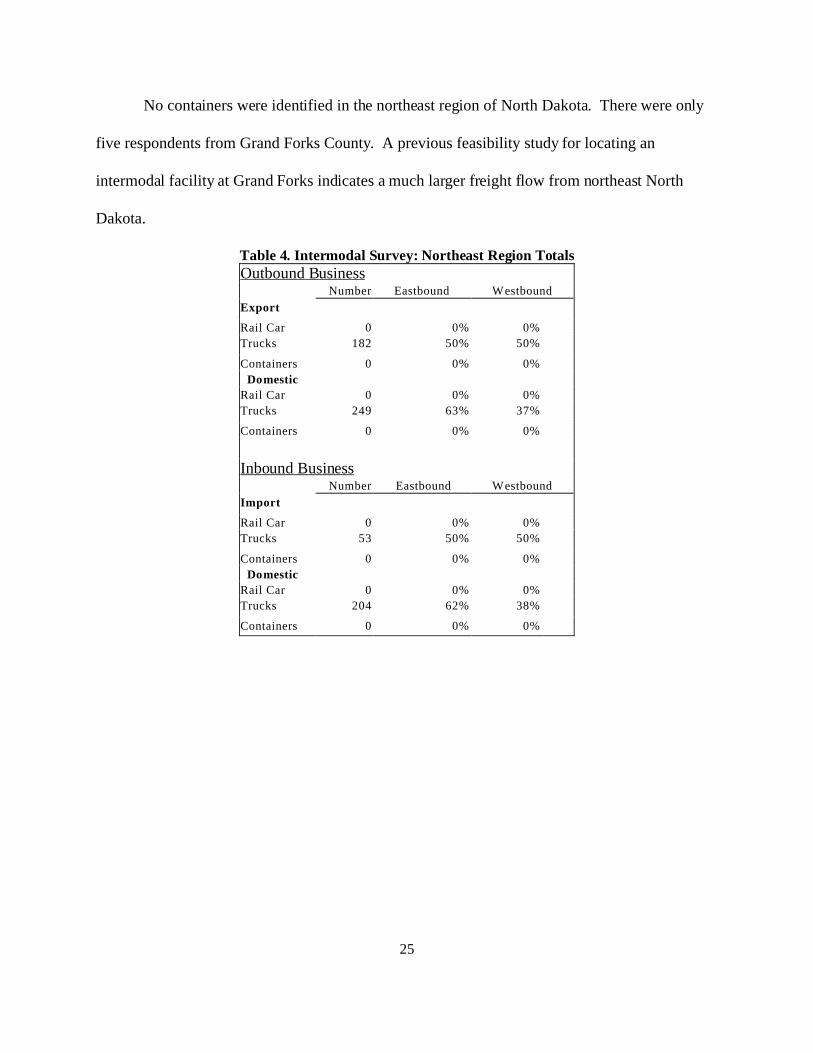
No containers were identified in the northeast region of North Dakota There were only
five respondents from Grand Forks County A previous feasibility study for locating an
intermodal facility at Grand Forks indicates a much larger freight flow from northeast North
Dakota
Table 4 Intermodal Survey Northeast Region TotalsOutbound Business
Number Eastbound Westbound
Export
Rail Car 0 0 0
Trucks 182 50 50
Containers 0 0 0
Domestic
Rail Car 0 0 0
Trucks 249 63 37
Containers 0 0 0
Inbound BusinessNumber Eastbound Westbound
Import
Rail Car 0 0 0
Trucks 53 50 50
Containers 0 0 0
Domestic
Rail Car 0 0 0
Trucks 204 62 38
Containers 0 0 0
26
The southeast region of North Dakota represents the largest freight flow volumes from any
areas in the state This is a combination of business density and willing respondents The
southeast region also is closest to an intermodal loading facility which is located in Dilworth
MN The southeast region identified more than 8000 outbound containers and more than 800
inbound containers This represents a ratio of about 10 to 1 For every 10 containers leaving the
state only one returns loaded There is a cost associated with moving empty containers to
shippers in the state The southeast region also identified more than 20000 trucks originating
freight annually
Table 5 Intermodal Survey Southeast Region TotalsOutbound Business
Number Eastbound Westbound
Export
Rail Car 100 0 0
Trucks 1436 50 50
Containers 7946 65 35
Domestic
Rail Car 50 0 0
Trucks 19164 60 40
Containers 780 50 50
Inbound BusinessNumber Eastbound Westbound
Import
Rail Car 104 50 50
Trucks 1426 75 25
Containers 810 87 13
Domestic
Rail Car 30 100 0
Trucks 14114 68 32
Containers 0 0 0
27
Table 6 shows that respondents reported 208 containers originating in south central North
Dakota The second highest response also was from the south central region of the state This
traffic represents a long drayage movements for empty and full containers to reach an intermodal
loading facility
Table 6 Intermodal Survey South Central Region TotalsOutbound Business
Number Eastbound Westbound
Export
Rail Car 0 0 0
Trucks 4 100 0
Containers 0 0 0
Domestic
Rail Car 1260 60 40
Trucks 7413 56 44
Containers 208 50 50
Inbound BusinessNumber Eastbound Westbound
Import
Rail Car 0 0 0
Trucks 52 50 50
Containers 0 0 0
Domestic
Rail Car 1004 25 75
Trucks 2558 59 42
Containers 0 0 0
28
Respondents from the southwest region of the state reported no container shipments
Outbound truck traffic was significant but the long distance to an intermodal loading facility
makes intermodal shipping impractical because of the high cost of drayage
Table 7 Intermodal Survey Southwest Region TotalOutboundBusines
Number Eastbound Westbound
Export
Rail Car 0 0 0
Trucks 36 67 33
Containers 51 75 25
Domestic
Rail Car 156 50 50
Trucks 3084 49 51
Containers 0 0 0
Inbound BusinessNumber Eastbound Westbound
Import
Rail Car 0 0 0
Trucks 28 50 50
Containers 0 0 0
Domestic
Rail Car 0 0 0
Trucks 868 78 22
Containers 0 0 0
The survey provides some insight into the shipping patterns for North Dakota The low
response rate in some areas of the state may not result in true representation of actual freight
movements
The survey revealed 8999 outbound shipments by container The factor most often
identified by respondents in making shipping mode decisions was price or rate The next factor
respondents identified that determined transportation mode was availability Third on the list
was time or service
29
Economic Census Commodity Flow Survey
Comparisons can be made using the Commodity Flow Survey within the Economic
Census that is compiled every five years covering years ending in two and seven by the United
States Department of Commerce The economic census is the major source of facts about the
structure and functioning of the United States economy The census furnishes an important
framework for such composite measures as the gross domestic product estimate inputoutput
measures production and price indexes and other statistical series that measure short-term
changes in economic conditions
Some of the tables from the Commodity Flow Survey have been replicated here to
provide information as to the type and quantity of freight moving from North Dakota Some
inferences and estimates can be made about truck rail intermodal freight movements from the
data in the CFS
North Dakota Commodity Flow Analysis
North Dakota entities face difficulty in determining the flow of goods to and from the
state Partial data is collected by different organizations but no clear picture exists on the flow
of either manufactured or value added agricultural products The Upper Great Plains
Transportation Institute tracks grain shipments out of the state by mode type and destination
The Commodity Flow Survey data collected by the Department of Commerce provides a snap
shot of freight movement in out of the state every five years
Economic Census Commodity Flow Survey
The following section uses data from the 1997 Commodity Flow Survey from the
economic census to compare transportation trends for North Dakota with National trends Using
30
Commodity Flow Survey (CFS) information provides for estimates in the types of transportation
flows for North Dakota versus National flows and evaluate differences in trends In this survey
framework data are not used that would disclose the operations of an individual firm or
establishment
CFS Inclusions
Modes identified in the CFS are
1 Parcel deliverycourierUS Postal Service2 Private truck3 For-hire truck4 Railroad5 Shallow draft vessels6 Deep draft vessels7 Pipeline8 Air9 Other mode
10 Unknown
Within the tables of the CFS they used eight different classifications or modes They
include
1 Air (includes truck and air)
2 Single modes Shipments using only one of the above-listed modes except parcelor other and unknown
3 Multiple modes Parcel US Postal Service or courier shipments or shipmentsfor which two or more of the following modes of transportation were used
Private truckFor-hire truckRailShallow draft vesselDeep draft vesselPipeline
31
The CFS did not allow for multiple modes in combination with ldquoparcel US Postal
Service or courierrdquo ldquounknownrdquo or ldquootherrdquo By their nature these shipments may already include
various multiple mode activity
4 Other multiple modes Shipments using any other mode combinations notspecifically listed in the tables
5 Other and unknown modes Shipments for which modes were not reported orwere reported by the respondents as ldquootherrdquo or ldquounknownrdquo
6 Truck Shipments using for-hire truck only private truck only or a combinationof for-hire truck and private truck
7 Water Shipments using shallow draft vessel only deep draft vessel only orGreat Lakes vessel only Combinations of these modes such as shallow draftvessel and Great Lakes vessel are included as ldquoOther multiple modesrdquo
8 Great Lakes In the tables ldquoGreat Lakesrdquo appears as a single mode becausemileage calculations are done for only the lakes portion of the movement
The CFS identified shipping within and out of the state of North Dakota Three different
modes are truck rail and air or some combination of two or more modes In the Commodity
Flow Survey (CFS) Economic Census respondents are ask which modes are used for shipments
Table 8 uses data from the CFS and shows shipments by mode from 1993 and 1997 for the whole
US The most notable figures are for all modes where tons increased by 145 percent
Examining truck rail multimode the tonnage increased 335 percent while value decreased
almost 9 percent (Table 8)
Comparing US statistics with the state of North Dakota statistics shows that freight
shipments for North Dakota grew at a much higher rate than that for the average of the US All
categories increased more than the national average Tons of freight originating in North Dakota
32
increased over 44 percent from 1993 to 1997 Comparing North Dakota to the National average
where tons increased by 145 percent This should indicate a growing economy however the
latest statistics on economic growth show that North Dakota lags behind most of the rest of the
nation in many areas This becomes problematic in drawing a conclusion about what is
happening in North Dakota Census Bureau data reveals that the North Dakota economy grew at
an average annual rate of 41 percent in the same time period
There also are gaps in the Commodity Flow data for North Dakota in the multi-modal
section The data is missing because of the nature of the survey where there are few respondents
and the results may not be statistically valid
Table 8 compares the changes in freight shipments from 1993 to 1997 Percentage
change in US freight shipments are compared to the percentage change in North Dakota
shipments by mode value weight and average miles per shipment according to the CFS
33
Table 8 Comparison of United States and North Dakota Shipments
Mode oftransportation
Value Tons Average Miles Per Shipment
PercentChange
USShipments
Percent ChangeNorth Dakota
Shipments
PercentChange USShipments
PercentChange North
DakotaShipments
Percent ChangeUS Shipments
Percent ChangeNorth Dakota
Shipments
All Modes 188 444 145 445 114 54
Single modes 157 465 170 246 -64 353
Truck 131 488 206 448 -1 55
For-hiretruck
105 637 212 542 29 -147
Private truck 160 380 168 307 21 109
Rail 292 599 4 173 3 542
Water 231 - 115 - S -
Air (includestruck amp air)
647 3510 426 2942 -25 373
Pipeline 263 S 278 S S S
On average the value of US shipments grew at a faster rate than tons shipped This
would indicate growth in the shipping of value-added products The largest value increases were
in rail and truckrail parcel This would indicate that the growth in less-than-load (LTL)
shipments are using truckrail intermodal The package companies like UPS or Fed X and other
large package use the railroads to reduce costs for long haul shipments LTL trucking firms also
use the railroads to reduce shipping costs With large volume and consistent business the
railroads strive to meet the rate and service needs of these large customers
34
Table 9 US Shipments by Mode Value Weight and Weight-Distance
Mode oftransportation
Value Tons Ton-miles
1997 1993 percent
change
1997 1993 percent
change
1997 1993 percent
change
All Modes 6943988 5846334 188 11089733 9688493 145 2661363 2420915 99
Single modes 5719558 4941452 157 10436538 8922286 170 2383473 2136873 115
Truck 4981531 4403494 131 7700675 6385915 206 1023506 869536 177
For-hire truck 2901345 2625093 105 3402605 2808279 212 741117 629000 178
Private truck 2036528 1755837 160 4137294 3543513 168 268592 235897 139
Rail 319629 247394 292 1549817 1544148 4 1022547 942897 85
Water 75840 19749 231 563369 505440 115 261747 271998 -38
Air 229062 139086 647 4475 3139 426 6233 1415 555
Pipeline 113497 89849 263 618202 483645 278 S S S
Multiple modes 945874 662603 428 216673 225676 -4 204514 191461 68
Parcel 855897 563277 519 23689 23689 254 17994 13151 368
Truck amp Rail 75695 83082 -89 54246 54246 335 55561 37675 475
Truck amp Water 8241 9392 -123 33215 33215 -512 34767 40610 -144
Rail amp Water 1771 8636 -513 79275 79275 1 77590 70219 105
Other multiplemodes
4269 3216 328 26248 26248 386 18603 S S
Other amp Unknownmodes
278555 242279 150 436521 436521 -192 73376 92581 -207
The CFS statistics that stand out for North Dakota shipments are increases in shipments
originating in North Dakota Shipments increased in value by 44 percent and by 45 percent in
weight (Table 8) This indicates that the nature of the shipments may have remained relatively
constant The most noticeable change from 1993 to 1997 in types of shipments was that in 1997
coal was recognized to make up an estimated 388 percent of all shipments originating in North
Dakota
35
Table 10 Shipment Characteristics by Mode of Transportation for North Dakota 1993 and 1997
Mode oftransportation
Value Tons Average Miles
Per Shipment
1997
(millions
dollars)
1993
(millions
dollars)
Perce nt
Change
1997
(thousands)
1993
(thousands)
Perce nt
Change
1997 1993 Perce nt
Change
All Modes 15999 10527 444 87831 60763 445 244 158 540
Single modes 13647 9315 465 52689 42301 246 151 112 353
Truck 9915 6663 488 25213 17417 448 102 97 55
For-hire truck 4021 2457 637 13410 8698 542 289 339 -147
Private truck 5793 4200 380 11392 8716 307 70 63 109
Ra il 3284 2053 599 25446 21692 173 853 553 542
Water - - - - - - - - -
Air (includes truck
amp a ir)
70 15 351 0 1 - 294 2 1946 1417 373
Pipeline S S S S S S S S S
M ultiple modes
Parcel 850 603 41 29 36 -188 632 349 811
Tru ck amp Ra il 60 S S 75 S S 1305 1996 -346
Truck amp Water - S S- - S S - 2294 -100 0
Rail amp W ater - S S - S S - 1584 -100 0
Other mu ltiple
modes
- - - - - - - - -
Other amp Unknown
modes
642 555 158 35038 18356 909 34 S
Analysis
Using the CFS to estimate potential container truckrail intermodal traffic generated in
North Dakota provides valuable insight into potential intermodal traffic It may only be
necessary to use the national average of intermodal shipments to estimate potential North Dakota
intermodal traffic Because North Dakotarsquos freight types do not mirror the United States
because of the large natural resource base in raw agricultural commodities and coal some
adjustment must be made
36
The CFS survey displayed that North Dakota shipped an estimated 88 million tons in
1997 The Commodity Flow Survey estimated that nationally the portion of all freight that was
truckrail intermodal was 11 percent If North Dakotarsquos truckrail intermodal freight potential
was the same as the national trend then it could be estimated that North Dakota could have
potential of more than 48000 TEUs or 20-foot containers for truckrail intermodal shipments
Factors that determine the shipments include the type of freight distance to an intermodal
facility rates for shipments lift costs or total landed costs of shipments However because
North Dakotarsquos farmers are searching for new ways to market larger portions of the agricultural
products are being shipped direct from the farmer or marketing company in much smaller lots in
container
Because of North Dakotarsquos natural resource-based economy some adjustments must be
made to the CFS numbers An estimation of potential shipments should eliminate the coal and
petroleum-based and other shipments A large portion of North Dakota shipments are large
volume low value raw agricultural products However there is some evidence that consistently
larger portions of raw agricultural commodities are being shipped as identity-preserved product
in smaller lots to a final market for processing Because of this it now is impossible to rule out
raw agricultural commodities for truckrail container intermodal movements An estimation of
potential container movements was made eliminating the previously mentioned commodities
When ruling out this freight only 533 percent of the freight was eligible for truck rail intermodal
leaving North Dakota The next step was to use only the portion of identified freight movements
that were shipped adequate distance to best use the economies of rail Only movements more
than 500 miles were used which was 175 percent Using this method it was estimated that more
37
than 490000 tons of freight potentially could move in containers as truckrail intermodal The
estimated shipments could equate to more than 24500 containers annually if an intermodal
loading facility and acceptable rates and service levels were available
Past studies conducted in North Dakota have indicated smaller results Estimates for a
potential traffic at a proposed site in Casselton ND estimated that current traffic would
generate 13628 containers and within five years from completion of an intermodal loading
facility business volume would grow to more than 47000 containers provided a competitive rate
structure and adequate service levels were met
Leeper Cambridge and Campbell (1996) contacted individual companies to determine
interest in intermodal shipping from a potential Grand Forks intermodal facility The study
estimated the number of lifts in first third and fifth year of operation Table 11 is adapted from
Leeper et al The report estimated an increase from 7857 containers and 1500 trailers in year
one to 18663 containers and 3563 trailers in year five This represents a 138 percent increase in
business in the first five years The report failed to explain existing versus new intermodal
shipments However the Leeper et al study did list one company anticipating using 4000 to
5000 containers and the study identified 1000 of these would be new business
38
Table 11 Anticipated Number of Lifts
Anticipated N umber of Lifts
Grand Forks
Intermodal Facility
Year 1 Year 3 Year 5
ContainerTrailers ContainerTrailers ContainerTrailers
7857 1500 15714 3000 18663 3563
Ada pted from Leep er et al (19 96)
The increased shipments identified in the CFS along with previous study estimates of
potential intermodal traffic indicate that the railroadsrsquo view of intermodal may depend on
variables other than traffic volume The literature review identified reasons for Santa Fersquos
successful container truckrail intermodal venture These reasons included shutting down all
questionable intermodal facilities and concentrating on markets that provide consistently large
volumes resulting in better use of equipment and the best return on investment
Transportation Cost Comparisons
Export freight rates have been on the decline During the last part of the 1980s the cost of
moving a $250 VCR overseas was $30 or 125 percent of the cost of the product (Muller 1999)
In 1997 the cost of moving that same 250 dollar VCR was $3 or one percent of the cost of the
VCR Similarly rates for refrigerated products have decreased along with identity-preserved
agriculture products (Vachal amp Reichert 2000) These rates vary directly on transportation
demand and the balance of shipments
Vachal and Riechert 2000 concentrated on IP grain and discussed freight rates and
logistics costs from the field to the final destination The actual cost of shipping by container
39
may be higher than traditional bulk systems but the logistics of containerized shipping actually
offer ways to reduce costs by taking advantage of services that may be available
Containerization also provides for shippers of smaller lots of grain to be shipped and guarantee
integrity of the product from point of loading to the final destination This product may bring a
premium to the seller or producer as the product meets the criteria specified by the final user
Using rail for the domestic movement may reduce transportation costs and eliminate reloading
expense at a port facility while guaranteeing product quality and quantity
In comparing different transportation methods Vachal and Rieckert used a logistics model
which included storage handling transportation from the field to the farm farm to elevator and
to the final destination Therefore the transportation model involved cost components including
inland drayage inland truck freight ocean freight and inlandocean freight The spreadsheet
model simulated delivery of food-grade soybeans from Iowa to Japan This was packaged in
bags and delivered The illustration in the report used those logistics costs associated with
marketing soybeans truck rail and ocean freight rates and those costs associated with both
containerization and bulk delivery options
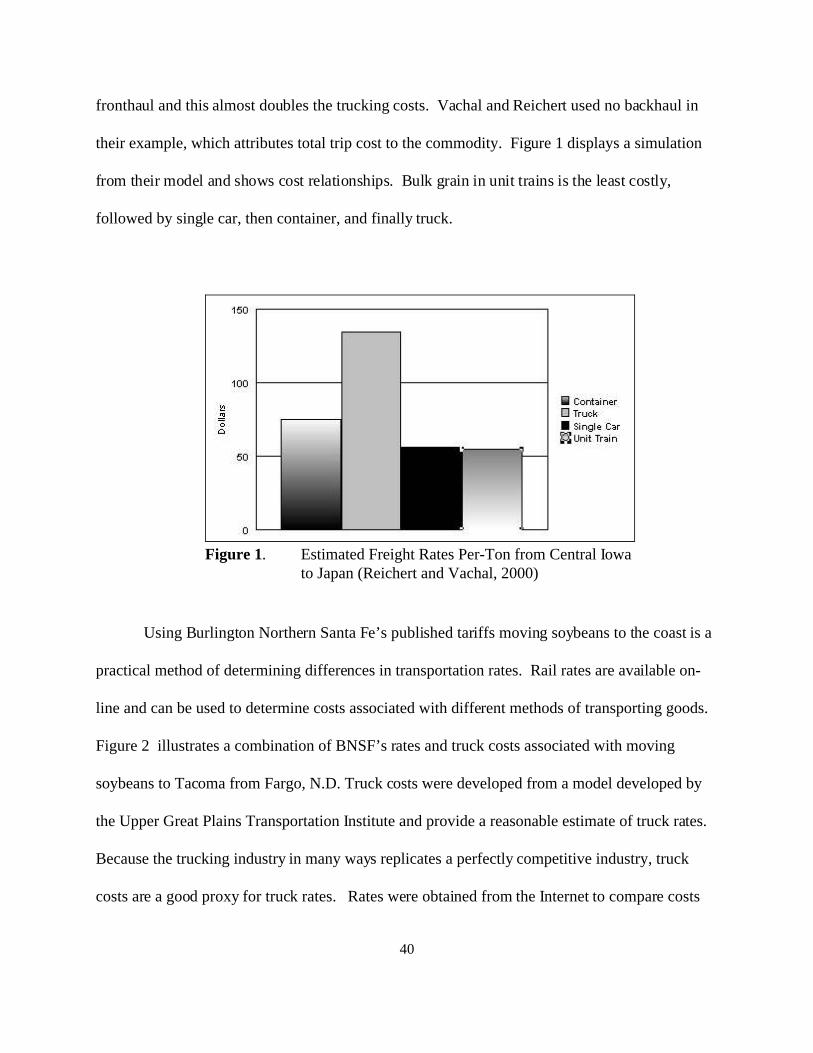
Figure 1 illustrates cost per ton of containerization truck and bulk shipments For this
study the important comparison is among truck and containerization Trucking to the coast and
transloading into a container is a costly endeavor and many products would not be competitive in
any market because of transloading costs Moreover trucking costs are related directly to a
backhaul Transporting small quantities of relatively low valued products long distances by truck
requires that the commodity only be charged for its loaded portion of the trip If there is no
backhaul because of specialty equipment or other reasons than the round trip is covered by the
40
Figure 1 Estimated Freight Rates Per-Ton from Central Iowato Japan (Reichert and Vachal 2000)
fronthaul and this almost doubles the trucking costs Vachal and Reichert used no backhaul in
their example which attributes total trip cost to the commodity Figure 1 displays a simulation
from their model and shows cost relationships Bulk grain in unit trains is the least costly
followed by single car then container and finally truck
Using Burlington Northern Santa Fersquos published tariffs moving soybeans to the coast is a
practical method of determining differences in transportation rates Rail rates are available on-
line and can be used to determine costs associated with different methods of transporting goods
Figure 2 illustrates a combination of BNSFrsquos rates and truck costs associated with moving
soybeans to Tacoma from Fargo ND Truck costs were developed from a model developed by
the Upper Great Plains Transportation Institute and provide a reasonable estimate of truck rates
Because the trucking industry in many ways replicates a perfectly competitive industry truck
costs are a good proxy for truck rates Rates were obtained from the Internet to compare costs
41
shipping by truck by container single rail car rate and unit train rail car rate from Fargo ND
except for the container which originates in Dilworth Minn Comparing Vachal and Reichertrsquos
costs and BNSF public rate estimates the relative cost differences are similar however Vachal
and Reichert attempted to capture total logistics costs Considering trucking to the coast in any
other truck equipment type other than a container that can be transloaded as a unit on to a cargo
ship leads to other expenses which increases the difference between container truckrail
intermodal costs and trucking costs Comparing the Vachal and Reichert method with only
inland freight costs to the port it only may be necessary to capture inland freight costs to
determine the least cost method of shipping Total costs of shipping soybeans to Japan using
Vachal and Reichertrsquos total cost method determined that trucking to the coast was almost 130
percent more costly than using a container on the rail If there is no backhaul for the truck then
the costs for the entire trip is attributable to the fronthaul which may occur with specialty
equipment
Using only inland freight costs and if no loads are available on the return trip the costs
of transporting soybeans by truck is $112 per ton This is similar to Vachal and Riechertrsquos
estimation Truck is 80 percent more costly than the rail portion of shipping the container to the
port However other costs do exist with obtaining the container including moving the container
to the loading point drayage to the intermodal facility lifting the container off the truck lifting
the container onto and off of the train and drayage to the final destination or transloading onto the
cargo ship transloading the container off the cargo ship and load it either onto a train or truck
and transport it to the final destination Vachal and Riechert estimated costs other than
transporting at more than $12 per ton They also estimated the ocean portion of the container
42
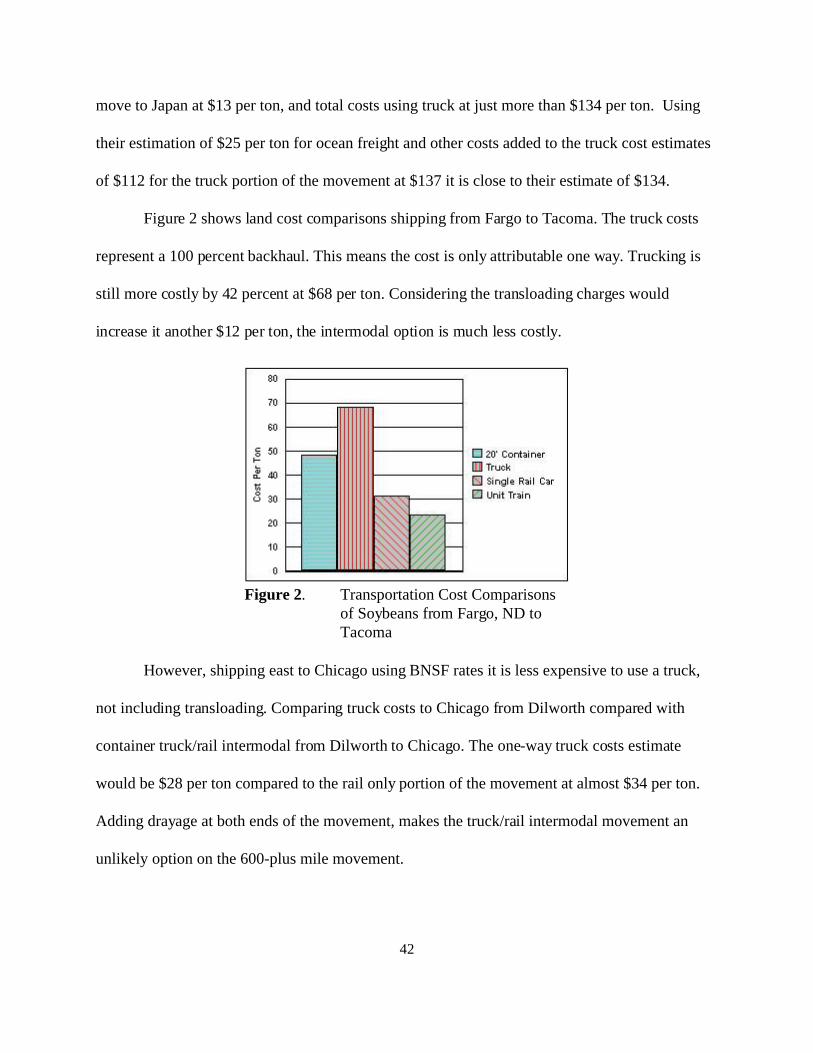
Figure 2 Transportation Cost Comparisonsof Soybeans from Fargo ND toTacoma
move to Japan at $13 per ton and total costs using truck at just more than $134 per ton Using
their estimation of $25 per ton for ocean freight and other costs added to the truck cost estimates
of $112 for the truck portion of the movement at $137 it is close to their estimate of $134
Figure 2 shows land cost comparisons shipping from Fargo to Tacoma The truck costs
represent a 100 percent backhaul This means the cost is only attributable one way Trucking is
still more costly by 42 percent at $68 per ton Considering the transloading charges would
increase it another $12 per ton the intermodal option is much less costly
However shipping east to Chicago using BNSF rates it is less expensive to use a truck
not including transloading Comparing truck costs to Chicago from Dilworth compared with
container truckrail intermodal from Dilworth to Chicago The one-way truck costs estimate
would be $28 per ton compared to the rail only portion of the movement at almost $34 per ton
Adding drayage at both ends of the movement makes the truckrail intermodal movement an
unlikely option on the 600-plus mile movement
43
Examining BNSF rates out of Chicago and Dilworth to Tacoma it was discovered that
the published rate from Chicago to Tacoma is less than the published rate from Dilworth to
Tacoma even though from Chicago to Tacoma is more than 600 miles farther BNSFrsquos
Intermodal Public Rate Retrieval also exposed that their rate from St Paul to Tacoma for the
same equipment is the same as from Chicago to Tacoma even though St Paul is about 400 miles
closer to Tacoma then Chicago (June 2001)
Actual rates are negotiated between the transportation provider and the shipper Many
times shippers use third parties such as a logistics company freight forwarders or brokers to
provide total transportation services These providers may prepare all documentation arrange all
transportation and may provide these services at less cost because of the volume they represent
Shipper associations are another avenue worth exploration by shippers Shipper
associations are viewed as a shipper and must be granted the same rights as shippers and cannot
be discriminated against by transportation providers Because they represent volume they may
have the leverage to negotiate better rates and service levels than an individual shipper Many
times shippersrsquo associations do not provide services such as export documentation or regulation
guidance so it may be important to use other third party providers for those services (Vachal and
Reichert 2000)
Containerization of specialty grains and oil seeds is increasing because of the demand for
smaller shipments with specific specification or characteristics In 1998 sunflowers were
transported by container 88 percent of the time and hops went by container 100 percent of the
time Also large quantities of soybeans move in containers Reasons for containerization is that
the bulk transportation system has inadequately transported the product resulting in co-mingling
44
of product with unwanted product and or the quantities demanded were small and therefore the
shipment did not meet the requirements of bulk movements
Impact on North Dakota
It is difficult to determine the impact on North Dakota the limited truckrail container
intermodal freight option has Quantifying intermodal traffic is difficult and potential
intermodal traffic is even more illusive Determining the impacts on North Dakota businesses
communities and the entire state is an impossible task
Economic factors influence freight rates which in-turn affect the competitive nature of
industry in North Dakota The senario may be that with a competitive freight rate businesses
could become more competitive domestically and internationally which would generate more
business creating more volume causing more economic activity and freight volume creating more
competition etc Therefore it is difficult to quantify the economic impact not having a
competitive intermodal loading facility in North Dakota may have on businesses communities
and the state
Problems are apparent when comparing products moving domestically by truck or
truckrail container intermodal and distance is the key for rate savings out of North Dakota
BNSF published rates for truckrail container intermodal to Tacoma are the same using either
Chicago or St Paul as an origin even though it is much closer to Tacoma from St Paul than
Chicago The published rate from Dilworth to Tacoma is more than the rate from Chicago to
Tacoma
45
Model
TruckRail Container Intermodal Terminal Costs
Bierman Bonini and Hausman (1991) describe a model as a simplified representation of
an empirical situation Variables are classified as decision variables exogenous variables
intermediate variables policies and constraints or performance measures (Bierman Bonini and
Hausman 1991) Decision variables are under the control of the decision maker Other types of
variables affect the model but their values cannot be determined by the decision maker
Exogenous or external variables are outside the decision makers control Intermediate
variables are used to relate decision variables and exogenous variables to performance measures
(Bierman Bonini and Hausman 1991) Exogenous and intermediate variables are represented
in various places throughout the model
Using the previously discussed modeling principles a spread sheet model was developed
to simulate costs for an intermodal facility This model was developed to provide decision
makers with an estimate of start-up and annual costs
Intermodal Facility Costs
Variables represented on sheet one of the model include the initial capital investment
The model is changeable and can be used to estimate costs from a proposed business plan which
includes the size and type of facility Sheet two has performance measures that are the total
investment costs and annual operating costs Sheet three includes sensitivity analysis to evaluate
the costs associated with different levels of investment
46
Firm Characteristics
The spread sheet model was developed to evaluate costing options for an intermodal
facility A facility could vary in size equipment configuration accommodations (reefer etc)
and different options require different levels of investment Different levels of investment
require different traffic volumes to cover expenses or costs
The model consists of changeable fixed and variable cost sections to replicate different
sizes and configurations of facilities allowing for scenario analysis purposes This provided a
range of investment levels for decision making purposes
Costs and Sensitivity Analysis
The spreadsheet model was developed to estimate costs associated with a particular
intermodal facility The strength of using a spreadsheet model is its flexibility for a decision
maker The user has options over a wide range of data for different operational characteristics
and input prices reflecting a specific business plan A determination may be made as to the
feasibility of a particular facility by using the model
A second strength of the model is its ability to run sensitivity analysis over a wide range
of variables This allows a decision maker the options of changing investment decisions at the
outset The model was developed using initial assumptions with the use of sensitivity analysis to
determine investment costs by changing these initial investment decisions
47
Base Case
Assumptions for the base case scenario were developed The base case is based on an 80
acre facility with 5000 feet of track two powered switches and two internal switches To fence
the perimeter of 80 acres on three sides requires 3960 feet of fence It is assumed that 40 acres
of the 80 would be paved There is a need for six work lights and six reefer hookups A 1500
square foot building would be built for office and storage space This facility would need one
lifter one hustler two chassis and no forklifts There would be a manager and four yard
employees Table 12 shows the initial assumptions along with possible options
Table 12 Assumptions and Options for the Base Case Scenario from Sheet One of theIntermodal Feasibility Costing Model
Land acres 80 Cost per acre $200000
Feet of track 5000 Cost per foot of track $10000
No of powered 2 Cost of powered $13000000
No of fence feet 2640 Cost of fence per foot $1000
Acres of pavement 40 Cost per acre $1000000
No of work lights 6 Cost of lights $1000000
No of reefer hookups 6 Cost of reefer hookup $200000
Square feet of building 1500 Cost per square foot $5000
Feet of water line 1000 Cost per foot $1000
Feet of sewer line 1500 Cost per foot $2000
No of lifters 1 Cost of lifter $50000000
No of hustlers 1 Cost of hustlers $5000000
No of forklifts 0 Cost of Forklifts $2500000
No of Chassis 2 Cost of Chassis $500000
Facility Estimated 20 Equipment Estimated 15
Tax rate 5 Insurance 5
Interest rate 8 Estimated Facility Life 20 Years
Maintenance and repair Variable
48
The quantitative expressions of objectives that managers are trying to achieve are
performance measures (Bierman Bonini and Hausman 1991) Sheet two of the spreadsheet
model provides a cost summary which is the performance measures for the model The model
provides performance measures in the form of a total investment estimates and estimated annual
costs
Table 13 Investment for the Base Case Intermodal Facility
Land $16000000
Track $50000000
Powered Switches $26000000
Internal Switches $16000000
Fence $3960000
Building $7500000
Office Equipment $600000
Lighting $6000000
Reefer Hookups $1200000
Water Line $1500000
Sewer Line $3000000
Total $147760000
Total equipment cost is the next portion of the model In the base case there is one lifter
one hustler and two chassis Total equipment estimated investment is $560000 The total
estimated investment for the base case scenario is $2037600
The model has a section with depreciation formulas both for the facility which includes
track switches and the building and also a section for equipment depreciation The yard or
facility expense portion of the model includes taxes insurance maintenance and repair and
49
return on investment (Table 14) The section also lists variable costs including direct and
indirect labor costs accounting and fuel costs The last two categories are building expenses
and management and sales expense
The next portion of the model shows the performance measures in annual fixed variable
and total costs (Table 14) Annual operating costs provide a decision maker estimates of
business volume needed to be successful
Table 14 Annualized Costs for the Base Case Intermodal Facility
Fixed Costs
Land and Track Depreciation $5110400
Equipment $2986700
Taxes Insurance Maintenance and Repair Return on Investment
$20715600
Management $4580000
Building Expense $736500
Variable Costs
Wages $9160000
WC and SS $1099200
Benefits $641200
Accounting $250000
Fuel $2080000
Total $47059600
The base case facility assumptions include 80 acres of land with 40 acres paved one
container lifter two chassis and one hustler and a 1500 square foot building The base case
50
included 5000 feet of track four switches work lights and electrical hookups for reefer units
The annual costs of operating the facility estimated by the model are $470596
Return on investment (ROI) is a large portion of annual costs ROI can be considered as
interest on debt capital or return on equity investment (Casavant 1993) This may be reduced
depending on the type of facility required Used equipment may be purchased however repair
costs would increase or a short line railroad could use existing track and eliminate the need to
invest in switches and track The rest of this chapter will be devoted to sensitivity analysis of
investment variables
Sensitivity Analysis
Sensitivity analysis displays the change in the performance measures by varying a
decision or exogenous variable (Bierman Bonini and Hausman 1991) Lotus 123 has a
function for performing ldquowhat-if analysisrdquo which determines the modelrsquos sensitivity to a given
variable ldquoWhat-if tablesrdquo can be developed providing performance measures as one or two
variables are changed over a range of values The intermodal facility costing modelrsquos sensitivity
analysis shows the decision maker cost relationships in the model Understanding cost
relationships may help a manager minimize total annual costs Variables chosen for sensitivity
analysis include equipment investment building investment track and switch investment labor
costs and the number of lifts required to meet costs
Lifts Costs and Volume
It is estimated that lift costs at Dilworth Minn are in a range from $10 to $15 per lift
(Leeper et al 1996) This is only an estimate lift costs are dependent on other factors Other
factors associated with intermodal transportation costs are the drayage costs and rail costs
51
Drayage is the trucking costs associated with moving the container or trailer to and from the
intermodal facility These costs vary depending on several factors and are not considered within
the model
Drayage costs or trucking costs are estimated at $113 per mile (Berwick and Dooley
1996) The farther from the source increases costs associated with drayage and total
transportation charges A tradeoff exists among the economies associated with intermodal
freight transportation and drayage distance At some point drayage costs switching transloading
of the container overcome the economies of rail transportation
Changing costs for the facility will change the number of lifts needed to cover costs
Table 15 shows the relationship of volume and costs associated with the base case intermodal
facility and assumptions
Table 15 Number of Lifts and Fixed Variable and Total CostsLiftsYR Fixed Costslift Varible Coslift Total Costslift
2000 $169 $66 $235
4000 $85 $33 $118
6000 $56 $22 $78
8000 $42 $17 $59
10000 $34 $13 $47
12000 $28 $11 $39
14000 $24 $9 $34
16000 $21 $8 $29
18000 $19 $7 $26
20000 $17 $7 $24
22000 $15 $6 $21
24000 $14 $6 $20
26000 $13 $5 $18
28000 $12 $5 $17
30000 $11 $4 $16
32000 $11 $4 $15
As volume increases costs per lift decrease as a result of economies associated with
utilization of resources (Table 15) Costs vary depending on the initial investment
52
Figure 3 Equipment Investment versus TotalCosts
Total Investment and Annual Costs
The model performs well over a wide range of different scenarios Varying investments
in equipment results in much small increases in annual costs Figure 3 shows the difference in
total costs with the different levels of equipment investment
A similar relationship exists between investment in track and annual cost estimates
Varying track investment from $50000 to $800000 increases annual costs by $111150 (Table
16)
53
Table 16 Change in Annual Cost with Different Levels of Track Investment
Track
Investment
Annual Operating
Costs
$50000 $403905
$100000 $411725
$150000 $418725
$200000 $426135
$250000 $433545
$300000 $440955
$350000 $448365
$400000 $455775
$450000 $463185
$500000 $470595
$550000 $478005
$600000 $485415
$650000 $492825
$700000 $500235
$750000 $507645
$800000 $515055
This scenario analysis reports relationships that exist between input variables and costs
The equipment and track scenario show that with large increases in capital investment there is a
relatively smaller increase in annual costs Increasing track investment from $50000 to
$100000 only increases total annual costs by 15 percent and as $50000 investment increments
are added the percentage of increase is reduced
54
Table 17 shows the modelrsquos response in varying track and equipment variables The table
is read by seeking investment for equipment and investment for track and aligning the column
and row
Table 17 Equipment and Track Investment Decisions and Total Annual Cost
The relationship between equipment investment and total annual costs and track
investment and total annual cost is that as investment increases in these items total annual costs
increases at a relatively smaller rate This may provide insight into under investing in a facility
Lack of capacity because of fear of overexposure or overinvesting may handicap the operation
and prevent performance needed with increased volume and result in less than desirable customer
service However increasing track investment from $50000 to $800000 does increase annual
costs by $111150 or more than $9000 per month
55
CONCLUSIONS
This study provides a snapshot of truckrail container intermodal shipping in and out of
North Dakota Cost estimates for an intermodal facility also are presented The study revealed
the benefits of intermodal transportation including lower overall transportation costs increased
economic productivity and efficiency reduced congestion and burden on over-stressed highway
infrastructure higher returns from public and private infrastructure investments reduced energy
consumption and increased safety
The Commodity Flow Survey conducted by the Commerce Department was analyzed to
estimate possible container shipments from North Dakota The CFS survey displayed that North
Dakota shipped an estimated 88 million tons in 1997 The Commodity Flow Survey estimated
nationally that the portion of all freight that was truckrail intermodal was 11 percent If North
Dakotarsquos truckrail intermodal freight potential was the same as the national trend then it could
be estimated that North Dakota could have the potential of more than 48000 TEUs or 20-foot
containers for truckrail intermodal shipments Factors determining the shipments include the
type of freight distance to an intermodal facility rates for shipments lift costs or total landed
costs of shipments However because North Dakotarsquos farmers are searching for new ways to
market and demand for identity-preserved commodities larger portions of the agricultural
products are being shipped direct from the farmer or marketing company in much smaller lots in
container
Because of North Dakotarsquos natural resource-based economy some adjustments must be
made to the CFS numbers An estimation of potential shipments should eliminate the coal and
petroleum-based and other shipments A large portion of North Dakota shipments are large-
56
volume low-value raw agricultural products However there is some evidence that consistently
larger portions of raw agricultural commodities are being shipped as identity-preserved product
in smaller lots to a final market for processing Because of this it is now impossible to rule out
raw agricultural commodities for truckrail container intermodal movements An estimation of
potential container movements was made eliminating the previously mentioned commodities
When ruling out this freight only 533 percent of the freight was eligible for truck rail intermodal
leaving North Dakota The next step was to use only the portion of identified freight movements
that were shipped adequate distance to best use the economies of rail Only movements of more
than 500 miles were used which was 175 percent Using this method it was estimated that more
than 490000 tons of freight potentially could move in containers over truckrail intermodal The
estimated shipments could equate to more than 24500 containers annually if intermodal loading
facilities were available along with acceptable rates and service levels
Lower transportation costs are realized with container intermodal shipping by using each
mode for the portion of the trip for which it is best suited However it was discovered that the
BNSF published rates for shipping a container out of Dilworth to Tacoma were higher than
shipping that same container out of Chicago It also was discovered that BNSF published rates to
Chicago from Dilworth would cost more than trucking the 600-plus miles With the convenience
and time factors associated with trucking or unless a reduced rate could be negotiated with the
railroad trucking would be the less expensive mode
A survey developed for this study identified containers now being shipped in and out of
the state This survey asked about a companies freight and expected growth The survey results
estimates that 8999 containers leave the state annually The Southeast portion of the state
57
represented some 63 percent of all traffic and more than 90 percent of all truckrail container
intermodal traffic The two main factors contributing to the majority of container traffic
originating in the Southeast are location of an intermodal loading facility and the size and
number of businesses located in Fargo and surrounding areas The Southcentral area of the state
identified the next most traffic There were many more respondents from Southeastern and
Southcentral North Dakota than from the rest of the state Of the 195 respondents 85 were from
Southeastern North Dakota and 28 were from Southcentral North Dakota
A spreadsheet model was developed to estimate costs associated with starting an
intermodal loading facility in North Dakota The model in this study has many useful features
Costs can be estimated for different equipment configurations and sizes of facilities The base
case estimated and investment of more than $2 million and operating expense at more than
$400000 annually Sensitivity analysis provided insight into investment decisions where the
proportions of annual operating costs increased at a much lower rate than proportionately larger
investment costs This leads to the conclusion that underinvesting may limit capacity of the
loading facility limiting potential of handling larger volumes
The truckrail container intermodal shipping problem in North Dakota is circular in
nature Problems exist in the form of rates and service Rates are high and service levels low
because there is no volume and there is no volume because rates are high and service levels are
low
58
59
REFERENCES
Babcock Michael W Eugene R Russell Marvin Prater amp John Morrill State Shortline Railroads and the Rural Economy Topeka KS Kansas Department of TransportationJune 1993
Berwick M amp Dooley F Truck Costs for OwnerOperators Mountain Plains Consortium No 97-81 Upper Great Plains Transportation Institute North Dakota State UniversityFargo October 1997
Bierman H Bonini C amp Hausman W Quantitative Analysis for Business Decisions 8th ed Richard D Irwin Inc Homewood IL 1991
Burlington Northern Santa Fe Corporation ldquoBNSF Intermodal Public Rate Retrievalrdquolthttpwwwbnsfcomgt (July 2 2001)
Burlington Northern Santa Fe Corporation ldquoBNSF Public Rate Retrievalrdquolthttpwwwbnsfcomgt (June 20 2001)
Burlington Northern Santa Fe Corporation 1999 Burlington Northern Santa Fe CorporationAnnual Report 1999
Casavant K Basic Theory of Calculating Costs Applications to Trucking Upper Great PlainsTransportation Institute No 118 North Dakota State University Fargo 1993
Corkhill M ldquoIntermodal Shakeoutrdquo Chemical Week v162 32-35 (September 20 2000)
Coyle J Barbi E amp Novak R Transportation 4th ed West Publishing Company St Paul MN 1994
Crum M Premkumar G amp Ramamurthy K ldquoAn Assessment of Motor Carrier Adoption UseAnd Satisfation With EDIrdquo Transportation Journal Summer 1996
Dooley F Economies of Size and Density for Short Line Railroads Mountain PlainsConsortium No 91-2 Upper Great Plains Transportation Institute North Dakota StateUniversity Fargo 1991
Dooley F Bertram L amp Wilson W Operating Costs and Characteristics of North DakotaGrain Trucking Firms Upper Great Plains Transportation Institute No 67 NorthDakota State University Fargo 1998
Ellis E ldquoGrowing The Businessrdquo Trains Magizine v60 3 14 (March 2000)
Ellis E ldquoOn Time Isnrsquot Good Enoughrdquo Trains Magizine v60 7 40 (July 2000)
60
Fess P amp Warren W Accounting Principles South-Western Publishing CompanyCincinnati OH 1990
Giblin J ldquoMission Impossible Making Rail Intermodal Profitablerdquo Trains Maginzine v58n7 p64(4) (July 1998)
Lang D ldquoTime To Rethink Intermodalrdquo Railway Age 51(1) (October 1998)
Leeper Cambridge amp Campbell Grand Forks Intermodal Study and Implementation Plan McLean VA June 1996
Muller Gerhardt Intermodal Freight Transportation 3rd ed Eno Transportation FoundationInc Virginia 1995
Muller Gerhardt Intermodal Freight Transportation 4th ed Eno Transportation FoundationInc Virginia 1999
Reichert H amp Vachal K Identity Preserved Grain (Logistical Overview) Mountain PlainsConsortium No 143 Upper Great Plains Transportation Institute North Dakota StateUniversity Fargo January 2000
Spraggins Barry H ldquoThe Potential for International Movements of Goods from Alberta to theUS and Mexicordquo 39th Transportation Research Forum Annual meeting Proceedings Montreal Canada October 16-18 1997
United Pacific Corporation 1999 United Pacific Corporation Annual Report 1999
United Stated Department of Agriculture North Dakota 1997 Commodity Flow SurveyTransportation Washington US Department of Commerce 1999
United Stated Department of Agriculture United States 1997 Commodity Flow SurveyTransportation Washington US Department of Commerce 2000
Vachal K Annual North Dakota Elevator Marketing Report 1999-2000 Mountain PlainsConsortium No 139 Upper Great Plains Transportation Institute North Dakota StateUniversity Fargo November 2000
Wallace RD (1997 April) ldquoIntermodal A Flawed Masterpiecerdquo Railway Age v198 n4945(7) (October 1998)
WWD ldquo97 Volume Rises 187 for Intermodal Shippingrdquo 175 n55 (March 24 1998) 13
61
APPENDIX A mdash Explanation of Intermodal Equipment
62
Intermodal Equipment
This section gives brief descriptions of intermodal equipment An intermodal facility
could have all or part of the equipment listed below There are many different intermodal
options that could be used for a facility depending on volume infrastructure needed and product
characteristics The intermodal equipment listed below comes from Gerhardt Mullerrsquos 3rd
Edition of Intermodal Freight Transportation
Cranes
Cranes of all types are used to move containers from ship-to-shore or truck-to-train etc
The most widely used is the rail mounted gantry crane It is built in the form of a bridge
supported by a trestle at each end This is used mostly at ports to load and unload ships and has
wheels so it can be moved from one pier to the other A hinged boom crane is mounted so it can
pivot at its base
Straddle Carriers
Straddle carriers lift heavy loads to a minimum height for short-distance travel and are
used to transfer containers to and from cranes These straddle cranes also can be used to stack
containers Some straddle carriers are equipped with computer control systems used for direction
and control of the straddle carrier and identification of containers
Stacking Cranes
The rubber-tired gantry crane is a hybrid falling between the gantry crane and straddle
carrier It is fashioned after the ship loading gantry without the boom and its purpose is to stack
containers on the ground It has the ability to stack containers higher and wider than the straddle
carrier
63
Forklift trucks
Forklifts come in many sizes and varieties and these machines perform many tasks
These machines can move palletized freight or containers themselves depending on their size
Forklifts have given way to roadstakers which are similar to forklifts but have the ability to
reach over obstacles such as chassis tracks railcars etc
Container Handlers
Container handlers move stack and load containers like forklift trucks but use an
overhead boom rather than the underlift principle
Yard Hostels
There is a variety of chassis-moving container handling equipment This equipment is
referred to by different names including yard horses hustlers mules or terminal tractors This
equipment is mainly used at a terminal or port but closely resembles an over the road tractor or
truck
Lifting Wheels
This device is attached to a hostel and allows for the operator to raise lower attach and
detach trailers without changing the trailersrsquo dolly wheels The lifting wheel gives the hostel a
unique advantage over ordinary tractors and allows for quick attach and detaching expediting
trailer movement
Intermodal Transfer Point
Line-haul intermodal equipment container-handling equipment enters the intermodal
terminal where containers are transferred between terminal equipment and line-haul equipment
This is the intermodal interchange
64
Container Chassis
A chassis is rail marine and over-the-road equipment This equipment is designed to
handle containers and trailers Chassis come in sizes compatible with containers however there
are adjustable chassis These slide to accommodate the size container needing to be transported
Chassis Flipper
Because of valuable space at terminals chassis are stacked The chassis flipper stands the
chassis vertically Chassis take up only 10 percent of the space stacked versus not stacked
Containers
Containers are the vehicle of choice used to encase the product for an intermodal
movement The number of container boxes have been growing at an increasing rate The
number of containers grew from 82 million in 1994 to 108 million in 1997 Ocean carriers
account for 52 percent of ownership leasing companies some 47 percent and the rest are split
among private and container transport companies
Containers come in many sizes and types Dry freight containers are either 20 or 40 feet
long There is also a 40-foot high cube container refrigerated containers The estimated cost of
a 20-foot dry freight container is between $2000 and $3000 and a 40-foot container is between
$3100 and $4500
For low volume usersrsquo leasing the container may be less costly than purchase Muller
reported that high costs are associated with empty container movements This problem exists
for some North Dakota shippers with less inbound freight than outbound and desiring to use the
intermodal shipping options
65
APPENDIX B mdash Model Explanation
66
TruckRail Container Intermodal Terminal Costs
Bierman Bonini and Hausman (1991) describe a model as a simplified representation of
an empirical situation Variables are classified as decision variables exogenous variables
intermediate variables policies and constraints or performance measures (Bierman Bonini and
Hausman 1991) Decision variables are under the control of the decision maker Other types of
variables affect the model but their values cannot be determined by the decision maker
Exogenous or external variables are outside the decision makers control Intermediate
variables are used to relate decision variables and exogenous variables to performance measures
(Bierman Bonini and Hausman 1991) Exogenous and intermediate variables are represented
in various places throughout the model
Using the previously discussed modeling principles a spread sheet model was developed
to simulate costs for an intermodal facility locating on a short line railroad This model was
developed to provide decision makers with an estimate of start-up and annual costs
Intermodal Facility Costs
Variables represented on sheet one of the model include the initial capital investment
The model is changeable and can be used to estimate costs from a proposed business plan which
includes the size and type of facility Sheet two has performance measures which are the total
investment costs and annual operating costs Sheet three includes sensitivity analysis to evaluate
costs associated with different levels of investment
Firm Characteristics
The spread sheet model was developed to evaluate costing options for an intermodal
facility A facility could vary in size equipment configuration accommodations (reefer etc)
67
and different options require different levels of investment Different levels of investment
require different traffic volumes to cover expenses or costs
The model consists of changeable fixed and variable cost sections to replicate different
sizes and configurations of facilities allowing for scenario analysis purposes This provided a
range of investment levels for decision making purposes
Fixed Costs
The fixed cost portion of the model includes land track and switches fence pavement
and concrete lighting and electrical building options equipment options depreciation
insurance repair taxes and interest These costs all are changeable within the model providing
a wide range of options Depreciation insurance maintenance and repair and interest are a
percentage of the investment In the following section these costs are described individually
Land
Within the land section of the model is the price per acre and the number of acres
required These variables are changeable to accommodate different situations For instance a
company contemplating a facility may already have usable land therefore diminishing the level of
investment needed Conversely a company may need to purchase land near a source of business
which may be a large investment along with needed improvements For the base case land was
priced at $2000 and the number of acres was set at 80 Eighty acres would be more than large
enough for the facility at 1742400 square feet This would allow for ample storage and room
for loading and unloading This dollar amount was arbitrary which could be less or more
depending on the location and current use of the land In rural areas land may be a small portion
of the investment needed but in an urban area land is a large portion of the investment
68
Track and Switches
This section of the model estimates the investment in track and switches There are six
entries possible shown in Table B1 These entries need to reflect decisions made at the outset
from a business plan The estimate of track costs and distance are from a 1996 study The Grand
Forks Intermodal Study amp Implementation Plan was done by Leeper Cambridge and Campbell
Table B1 Track and Switch Costs from the Intermodal Facility Spreadsheet Costing Model
Column
Row A B
5 Dollars per foot of track $100
6 Number of feet 5000
7 Number of powered switches 2
8 Cost of powered switches 130000
9 Number of internal switches 2
10 Cost of internal switches 80000
The track portion of the model allows for many different scenarios Track may already
exist and switches may be in place or a new siding may be needed This section of the model
allows for flexibility and entries for different operations The number and type of switches will
vary If the siding is new switches will be needed An existing siding will have switches
Powered switches may not be required Only two switches would be needed if siding is used as
the loading area Another possibility on a short line is that loading is on a no traffic section of
existing track
69
Fence Pavement and Concrete Lighting and Electrical
Depending on the level of security and desire to keep children animals and other
potential problems out of the site a fence may be required This section allows varying the
length and cost of the fence It is simply multiplying the number of fence feet times the cost per
foot This could be a rather substantial investment if it is desired to have a secure yard The base
case allows for 3960 feet of fence This is enough fence for the perimeter of the yard The cost
is estimated at $10 per foot (Dakota Fence)
Next is pavement and concrete This section simply allows an entry for the number of
acres and the cost of either asphalt or pavement In some cases a gravel yard may serve instead
of pavement or concrete There also may be a combination possibility of some pavement and the
rest gravel The cost per acre is simply multiplied by the number of acres However in some
cases the entire yard may not be paved For instance building space would not be paved
There is a section for lights electrical and reefer hookups Electrical components will
vary with size of the facility and expectations for its type of business For instance it may be
determined that no reefers will be used or no loading will occur at night which would lessen the
electrical investment The base case estimates loading lights cost $10000 each while reefer
hookups are estimated at $2000 each The base case calls for six lights and six reefer hookups
70
Table B2 Fence Pavement and Lighting and Electrical from the Intermodal FacilitySpreadsheet Costing Model
ColumnRow A B14 Fence15 No of fence feet 396016 Cost of fence per foot 101718 Pavement or Concrete19 Acres of Pavement 4020 Cost per acre of pavement 10002122 Lighting and Electrical23 No of lights 624 Cost of lights 1000025 No reefer hookups 626 Cost of hookups 2000
Building Options
This section includes size and cost of the building and costs of water and sewer to the
building The building cost is based on square footage times the size of the building The
building estimate is 1500 square feet at $50 per square foot
Water and sewer lines are cost per foot times the length of the line Water and sewer are
based on the use of city water lines and sewer If built in a rural area additional costs for a well
and septic system would exist The sewer is estimated at $20 per foot and water is estimated at
$15 per foot Building options are determined by the decision maker and may or may not exist
Some facilities may be able to be operated from an existing building lowering overall costs
71
Table B3 Building Options from the Intermodal Facility Spreadsheet Costing Model
ColumnRow A B28 Building Options29 Sq ft of building 150030 Cost per square foot 5031 Feet of water line 100032 Cost per foot 1533 Feet of sewer line 150034 Cost of sewer line 20
Equipment Options
Within the equipment portion of the model the decision maker has the options of lifters
hustlers forklifts and chassis The decision maker may choose the number of each and a cost
factor associated with each piece of equipment The cost factor would depend on equipment
choices New versus used equipment and if the equipment is used if reconditioning was
necessary There also is a fuel consumption entry This cell is linked to the variable cost portion
of the model This section gives the decision maker choices of different equipment depending on
the size and type of facility to be built
Table B4 Equipment Choices from Intermodal Facility Spreadsheet Costing ModelColumn
A BRows Equipment Options
36 Number of lifters 137 Cost of container lifters $50000038 Fuel consumptionhr 539 Number of hustlers 140 Cost of hustlers $5000041 Fuel consumptionhr 542 Number of forklifts 043 Cost of forklifts $2500044 Fuel consumptionhr 245 Number of chassis 246 Cost of chassis $5000
72
Office Equipment
Another portion of the model gives the decision maker the option of making entries for
office equipment There is a section for furniture and electronics The decision maker can enter
zero if a category is not valid This may happen where a short line railroad or third party uses
existing offices or office equipment to operate the intermodal facility
Table B5 Office Equipment from Sheet One of the Intermodal Spreadsheet Costing Model
Column
Rows A B
1 Computer $2500
2 Fax Machine $300
3 Phones $1000
4 Communication Equipment $1000
5 Desk $500
6 Chairs $200
7 Counter $500
Depreciation Equipment Taxes Insurance Interest and Maintenance and Repair
This section of the model uses percentages and time to determine costs associated with
different levels of investment The method allows a decision maker to adjust percentages or the
time factor for different interest insurance or depreciation rates
Depreciation is divided into facility and equipment to allow for different estimated useful
life (EUL) The decision maker can adjust time for different types of equipment or facilities
Depreciation is the cost of using up capital and should reflect the portion of useful life used
during a specified time period (Fess and Warren 1990) Equipment and the facility were
73
depreciated on the straight-line basis Depreciation was calculated by subtracting the salvage
value from the purchase price and dividing this figure by the EUL Salvage values and EULs are
difficult to estimate Salvage value primarily depends on the condition of equipment and type of
maintenance performed
Taxes and insurance are related to a percentage of value of the investment The tax levied
may vary by location and different types of taxes imposed Insurance also may vary with location
and company of issue These variables also are adjustable by the decision maker
Interest rates and terms vary depending on the level of investment and the risk perceived
by the lender The rate and term can be changed by the decision maker to meet different levels
and lengths of financing A rate also is used for return on investment andor a hurdle rate It is
common for companies to set a desired return for investments or hurdle rate which is used to
screen potential investments
Maintenance and repair costs vary with use With higher use there are higher costs A
percentage of the value of the equipment times a rate per hour will provide an estimate of the
cost of maintaining the equipment This is variable in the model Higher levels of repair would
be associated with older or used equipment The maintenance and repair formula is based on
new price for equipment The farther the cost of equipment deviates from new cost the higher
maintenance and repair
Variable Cost Components
The next part of the model is the variable cost components This includes a section for
direct and indirect labor costs Other costs included in the variable cost portion are electricity
water sewer building insurance office supplies and accounting services
74
Wages and Indirect Costs
This portion allows for the number of employees hourly rate hours worked and weeks
per year worked Indirect costs cover workers compensation social security match and benefits
Workers compensation social security match and benefits are based on a percentage of wages
There also is a section for management and sales staff which is based on the cost of hourly
employees This variable is difficult to estimate and would vary according to the type of facility
and the business plan of a proposed facility If the facility is based on a few businesses or a
single business there may be no need for management or sales staff Another scenario may
include the use of existing staff to manage and sell the services of the intermodal facility The
model is set to record management and sales costs at half of total wages This results in a
managerrsquos annual salary of $45000
Electricity Water and Sewer Building Insurance Office Supplies and Accounting Services
Other costs included in the variable cost portion are electricity water sewer building
insurance office supplies and accounting services These costs would vary depending on the
type of facility built the size of the building and if the facility was run using existing staff and
facilities If an existing facility is used costs should be portioned equally to use
Electricity water sewer office supplies and accounting services depend on volume used
Insurance would be a percentage of value and would depend on the value of the building
75
Table B6 Variable Cost Components of the Intermodal Spreadsheet Costing Model
Column
Rows A B
1
2 Variable Cost Components
3 No of Salaried Employees 2
4 Salary $25000
5 No of Hourly Employees 2
6 Hourly rate $10
7 Hours Per Week 40
8 Weeks Per Year 52
9 Fuel Cost Gallon $1
10 Workman Comp 5
11 Social Security match 7
12 Benefits 7
13 Management and Sales 50
14 Electricity $100
15 Water $50
16 Sewer $20
17 Insurance 5
18 Office Supplies $500
19 Accounting $2500
76
77
APPENDIX C mdash Intermodal Container Survey
78
Shipper SurveyND Strategic Freight Analysis
Conducted byUpper Great Plains Transportation Institute
December 2000
79
If 3 and 4 NO - No Additional Information Needed
1 Shipper (Company) ___________________________________________________
2 Name ___________________________________________________
Title ___________________________________________________
Telephone ____________________________ Email __________________________________
Do you arrangemanage transportation for your company (if no who) ____________________________
3 Do you receive truckload railcar or container shipments (other than grain) Yes No
4 Do you ship truckload railcar or container shipments (other than grain) Yes No
5 Do you use a freight forwarder or a broker for transportation Yes No
6 Do you use containers in your freight plan Ship Y N Receive Y N
5-1 If no could containers be an option to receiveship Yes No
52 If no why not ___________________________________________________
7 Do you receive or ship internationally Ship Y N Receive Y N
8 What factors affect your decision on choosing a shipment mode and carrier (eg price time equipment)
__________________________________________________________________________________
9 What is the average distribution of annual inboundoutbound shipments percent by quarter
1st Qtr of Year 2nd Qtr of Year 3rd Qtr of Year 4 th Qtr of Year Total
Traffic
Distribution
100
Service
Availability
Rank 1=poor
2=good
3=excellent
80
10 OUTBOUND Business Volume
Export
E-1 Eastbound W estbound
Rail Cars
Trucks
Containers
Domestic
DO-1 Eastbound W estbound
Rail Cars
Trucks
Containers
Container Traffic in TEU
11 INBOUND Business Volume
ImportI-1 Eastbound W estbound
Rail Cars
Trucks
Containers
Domestic
DI-1 Eastbound W estbound
Rail Cars
Trucks
Containers
Container Traffic in TEUs
12 Expected Business Growth by 2005 ___________
- Introduction
-
- Objective
- Methodology
- Implications
- Report Organization
-
- Literature Review
-
- Characteristics of Intermodal Transportation
- Intermodal Transportation Facilitators
- Motor Carriers
- Short Line Railroads
- Intermodal and Class I Railroads
- Transportation Technology
- North Dakotarsquos OutboundInbound Intermodal Survey
- Economic Census Commodity Flow Survey
- North Dakota Commodity Flow Analysis
-
- Economic Census Commodity Flow Survey
- Analysis
- Transportation Cost Comparisons
- Impact on North Dakota
-
- Model
-
- TruckRail Container Intermodal Terminal Costs
- Intermodal Facility Costs
- Firm Characteristics
- Costs and Sensitivity Analysis
-
- Base Case
-
- Sensitivity Analysis
-
- Lifts Costs and Volume
- Total Investment and Annual Costs
-
- Conclusions
- References
- Appendix A mdash Explanation of Intermodal Equipment
- Appendix B mdash Model Explanation
- Appendix C mdash Intermodal Container Survey
-

Disclaimer
The contents of this report reflect the views of the authors who are responsible for the facts andaccuracy of the information presented herein This document is disseminated under the sponsorship ofthe Department of Transportation University Transportation Centers Program in the interest ofinformation exchange The US government assumes no liability for the contents or use thereof
i
EXECUTIVE SUMMARY
One of the greatest challenges facing rural communities is limited transportation options Many
small companies do not produce quantities sufficient to ship in unit trains or even full truckloads
Intermodal shipping should provide companies and identity-preserved producers with truck trailer and
container convenience while taking advantage of lower costs provided by rail shipping Presently North
Dakota has no intermodal facility Short line railroads may enhance their own traffic base and customer
service by adding an intermodal option
A survey of North Dakota businessesrsquo outboundinbound transportation was conducted to
identify containers now being shipped by truckrail intermodal into and from the state Results showed
that the Southeast portion of North Dakota represented some 63 percent of all traffic This is due to a
combination of business density and willing respondents A Commodity Flow Survey (CFS) was used to
estimate potential container truckrail intermodal traffic generated in North Dakota The increased
shipments identified in the CFS and previous study estimates of potential intermodal traffic indicate that
the railroads view of intermodal is dependant on other variables
This study provides a snapshot of truckrail container intermodal shipping into and out of North
Dakota The study revealed the benefits of intermodal transportation including lower overall
transportation costs increased economic productivity and efficiency reduced congestion and burden on
over-stressed highway infrastructure higher returns from public and private infrastructure investments
reduced energy consumption and increased safety
The truckrail container intermodal shipping problem in North Dakota is circular in nature
Problems exist in the form of rates and service Rates are high and service levels low because there is no
volume and there is no volume because rates are high and service levels are low
ii
iii
TABLE OF CONTENTS
INTRODUCTION 1Objective 3Methodology 3Implications 3Report Organization 4
LITERATURE REVIEW 5Characteristics of Intermodal Transportation 5Intermodal Transportation Facilitators 8Motor Carriers 9Short Line Railroads 11Intermodal and Class I Railroads 15Transportation Technology 19North Dakotarsquos OutboundInbound Intermodal Survey 22Economic Census Commodity Flow Survey 29North Dakota Commodity Flow Analysis 29
Economic Census Commodity Flow Survey 29Analysis 35Transportation Cost Comparisons 38Impact on North Dakota 44
Model 45TruckRail Container Intermodal Terminal Costs 45 Intermodal Facility Costs 45Firm Characteristics 46Costs and Sensitivity Analysis 46
Base Case 47Sensitivity Analysis 50
Lifts Costs and Volume 50Total Investment and Annual Costs 52
CONCLUSIONS 55
REFERENCES 59
APPENDIX A mdash Explanation of Intermodal Equipment 61
APPENDIX B mdash Model Explanation 65
APPENDIX C mdash Intermodal Container Survey 77
iv
LIST OF FIGURES
Figure 1 Estimated Freight Rates Per-Ton from Central Iowa to Japan (Reichert and Vachal
2000) 40
Figure 2 Transportation Cost Comparisons of Soybeans from Fargo ND to Tacoma 42
Figure 3 Equipment Investment versus Total Costs 52
LIST OF TABLES
Table 1 Intermodal Survey State Totals 22
Table 2 Intermodal Survey Northwest Region Totals 23
Table 3 Intermodal Survey North Central Region Totals 24
Table 4 Intermodal Survey Northeast Region Totals 25
Table 5 Intermodal Survey Southeast Region Totals 26
Table 6 Intermodal Survey South Central Region Totals 27
Table 7 Intermodal Survey Southwest Region Total 28
Table 8 Comparison of United States and North Dakota Shipments 33
Table 9 US Shipments by Mode Value Weight and Weight-Distance 34
Table 10 Shipment Characteristics by Mode of Transportation for North Dakota 1993
and 1997 35
Table 11 Anticipated Number of Lifts 38
Table 12 Assumptions and Options for the Base Case Scenario from Sheet One
of the Intermodal Feasibility Costing Model 47
Table 13 Investment for the Base Case Intermodal Facility 48
Table 14 Annualized Costs for the Base Case Intermodal Facility 49
Table 15 Number of Lifts and Fixed Variable and Total Costs 51
Table 16 Change in Annual Cost with Different Levels of Track Investment 53
1
INTRODUCTION
Throughout agricultural history North Dakota has been known for supplying high quality raw
agricultural commodities Throughout the agricultural history of the area and more recently on a larger
scale economic forces have encouraged North Dakota producers to add value to their commodities either
through processing or producing a commodity to fit the specifications of a customer
The challenge facing value-added and identity-preserved producers is distance to markets
Producers and suppliers in the region must transport products long distances and most have few options
In todayrsquos competitive business environment getting the product to the right place when the customer
needs it is increasingly important Producers must deliver high quality product at a competitive price
when the competition often is located closer to the source of final demand
Value-added agriculture has been an economic development tool used to diversify the economic
base of rural communities One of the greatest challenges communities face is limited transportation
options The primary means for freight transportation in the rural regions is truck and rail Many small
companies do not produce quantities sufficient to ship in full truckload or unit trains nor do their
customers demand these large quantities
Rural agricultural communitiesrsquo inbound procurement and outbound distribution options are
limited to local trucking companies and rail Few communities generate enough truck traffic through
existing businesses to offer evidence of excess or available truck capacity Where rail is available Class
I carriers are reluctant to make short less-than unit train movements and offer limited options for
products other than grain originating or terminating in rural areas
North Dakotarsquos rail service is made up of two Class 1 railroads a regional railroad and two short
lines The ideal intermodal freight for Class 1 railroads is a large unit train loaded at one facility and
shipped to another and off loaded This provides the most economical and profitable scenario for Class 1
2
railroads Smaller less than trainload traffic generated is viewed by the Class1 railroad as a train of way
and the rate charged is more and service is less than that of a designated train
The purpose of container on flat car (COFC) or trailer on flat car (TOFC) intermodal shipping is
to take advantage of the economics of each different mode used Intermodal provides for truck trailer
and container convenience while taking advantage of the lower costs provided by rail shipping
Currently in North Dakota there is no intermodal facility Shippers desiring intermodal shipping
either have to use all truck or dray the container or trailer to an intermodal facility Depending on
distance this may provide a distinct disadvantage for North Dakota shippers The closest existing
intermodal facilities are located in Dilworth MN MinneapolisSt Paul MN and Billings MT
Possibilities for siting intermodal facilities on short lines in rural areas may provide rural communities
with an opportunity to diversify their infrastructure transportation rates and transportation equipment
resource base for attracting and growing value-added ventures Cooperation from Class I railroads and
the short line carriers systems may provide opportunities for an intermodal shipping alternative to rural
areas of the state
Intermodal facilities usually are operated by a third party and the railroads serve only as the
transportation provider At present large intermodal freight volumes are necessary for an economically
viable facility An intermodal facility can range from a simple and relatively inexpensive loading facility
using circus ramps to a sophisticated high cost operation involving gantry or overhead cranes allowing
for fast train loading and offloading The cost of the facility is in direct proportion to the equipment
needed trackage amount of land and labor associated with the size and volume of the facility Another
advantage to intermodal is removing some truck traffic from the state highway system Increased truck
traffic may impact the road system to and from the facility but overall impact on state highways may be
lessened
3
Objective
The main objective of this project was to evaluate the current truckrail container intermodal
transportation system in North Dakota This included traffic rates and service and facilities The
secondary objective was to determine costs associated with start-up and operating an intermodal facility
Methodology
This report describes truckrail intermodal short line railroads motor carriers and the Class I
railroads A survey of shippers was performed to determine the intermodal traffic in the state Analysis of
the Commodity Flow Survey (CFS) also was performed along with an examination of BNSFrsquos rates out
of North Dakota Cost comparisons were made among modes to determine least cost mode
Implications
Container intermodal shipping is not an option for many businesses in North Dakota Many
shippers may not know the total landed cost Landed costs include all logistics costs including
transportation to the final customer This cost may be complicated with multi-modal and or international
shipments There are markets for many North Dakota products but many times transportation options
and costs are the barrier Intermodal shipping should reduce shipping costs and provide opportunity for
competition in domestic and international markets
Without competitive truckrail container intermodal service North Dakota shippers remain at a
logistical disadvantage Many industries are affected by lack of intermodal service including agricultural
processors manufacturers identity-preserved commodity producers building suppliers and retailers
negatively impacting the entire state economy through higher shipping costs
Container truckrail intermodal implications to the North Dakota trucking industry would be
evident in the case of a modal shift Diverting freight volume away from truck to rail may be
4
advantageous to shippers but may be negative to the trucking industry Where the rail system seems
reluctant to accept low volume freight it may be the backbone of many trucking firms
Report Organization
This report is organized into four sections The first section is the introduction and background
and the next section is the literature review The report discusses short line railroads Class I railroads
truckrail container intermodal shipping methods or procedures A shipper survey also is discussed and
analyzed Shipping modes and costs are compared and finally the conclusions of the report finding
5
LITERATURE REVIEW
Characteristics of Intermodal Transportation
Intermodal freight transportation is the seamless and continuous door-to-door transportation of
freight on two or more transportation modes for example truck-rail or truck-ocean (Muller 1995)
Intermodal transportation growth has been aided by deregulation of US transportation global business
growth and changes in the business environment (Coyle Bardi and Novack 1994) In 1997 intermodal
marketers reported that loadings of trailers and containers increased by 187 percent after climbing 235
percent in 1996 and revenue grew at 145 percent more than double the 71 percent rise in 1996 (WWD
1998) Service issues including the Union Pacific network problems were listed as one reason for the
drop in the percentage increase in intermodal loadings from 1996 to 1997
According to Spraggins (1997) benefits of intermodal transportation include
bull lower overall transportation costs
bull increased economic productivity and efficiency
bull reduced congestion and burden on over-stressed highway infrastructure
bull higher returns from public and private infrastructure investments
bull reduced energy consumption
bull increased safety
Lower transportation costs are realized by using each mode for the portion of the trip for which it
is best suited For example rail could be used on the long-distance haul and truck on the short-distance
haul to and from the intermodal facility using the door-to-door service of truck and the economies
provided by rail Using rail for the long-haul portion of the trip may result in improved environmental
conditions including improved air quality because of reduced energy consumption Using fewer trucks
for the long-haul portion of the trip lessens congestion in major metropolitan areas and also lessens
damage to the roadway
6
Intermodal is used in domestic and international shipments The domestic movement usually is
truck-rail while internationally it can be truck-rail-ocean or rail-ocean or truck ocean Containers have
increased in popularity in international trade ldquoIt is likely that containers will replace trailers in North
American cross-border movements and even in domestic intermodal movementrdquo (Spraggins 1997)
Trailers will remain important in the short haul and low volume loads Some bulk commodities now are
moving by containers These commodities mostly are food commodities such as bananas and coffee and
other fresh fruits Demand for identity-preserved (IP) commodities also is on the rise Identity-preserved
may be simply providing a customer with a specific product origin or as complex as guaranteeing and
ordering specific agronomical practices (Vachel 2000) Organically grown wheat or soybeans for export
are examples of identity-preserved commodities Although identity-preserved could be a train of 110
cars of 14 percent protein spring wheat weighing 60 pounds per bushel and having 12 percent moisture
with less than 1 percent dockage most identity-preserved shipments tend to be small quantities and of
higher value Containerization ensures the shipper and receiver integrity of the product being shipped
Identity-preserved market demands may increase demand for container shipments in rural settings where
commodities are grown
Many farmers are seeking ways to add value to their farming operations and many are exploring
the possibility of exporting IP grain in small lots Rural North Dakota identity-preserved grains need the
containers and the economies of shipping by rail long distance for this concept to work Without an
intermodal loading facility within a reasonable distance any premium negotiated for the IP shipment may
be lost to transportation costs
Intermodal facilities vary in size equipment used and type of facility Increases in intermodal
freight has led to the development of intermodal hubs or terminal locations where trains are gathered
and cars are exchanged or switched to form new trains ldquoThese lsquohub-and-spokersquo operations take
7
advantage of reducing the number of point-to-point operations when the volume is not large enough to
make them cost efficientrdquo (Muller 1999)
Consolidation in the rail industry created duplicate services and many times the remaining carrier
consolidated duplicate services into one The rail industry targeted less profitable inefficient intermodal
facilities in smaller cities where less-than-unit trains delivered and picked up containers and trailers
which were loaded through the use of circus ramps This service has been reduced from approximately
1500 operations in 1970 to less than 370 in 1998 (Muller 1999) This reduction in facilities has limited
transportation options for many shippers in smaller cities or rural areas Reliable timely cost
competitive intermodal service is not available in many rural areas
Shippers cite that improvements in timeliness and price competitiveness are important
enhancements that would cause them to shift to intermodal usage (Spraggins 1997) A survey reported
by Spraggins (1997) reaffirmed that the service gap between intermodal and truckload services is the
greatest barrier to improving intermodalrsquos share of the North American freight market Intermodal
generally is thought of as a practical alternative for general freight (non-bulk) that moves in full
trailerload or containerload lots (Spraggins 1997) In general intermodal usage varies by the size of the
company products being shipped and distance from an intermodal hub
The largest barrier to many companies using intermodal shipping is the location of intermodal
hub facilities An intermodal loading facility located within a reasonable distance is essential to justify
using intermodal as a viable transport mode As distance to an intermodal facility increases it becomes
uneconomical to use the intermodal option as transit times and distance costs increase This explains
why many small rural companies simply continue to use trucks to transport product
8
Intermodal Transportation Facilitators
Transportation facilitators serve shippers and carriers by arranging the transportation of the
cargo Some facilitators perform transportation functions including consolidation palletizing or
containerizing of freight for shippers (Muller 1999) Facilitators also may use their own documentation
for the movement Facilitators include many categories of participants 1) domestic freight forwarders
2) international freight forwarders 3) import brokers domestic air freight forwarders 4) air cargo
agents 5) shipper councils associations and cooperatives 6) intermodal marketing companies 6)
transportation brokers 7) perishable brokers 8) consolidators 9) transloaders 10) distribution carriers
11) customshouse brokers 12) export management companies and 13) third-party logistics firms
(Muller 1999)
Intermodal marketing companies can provide door-to-door services tailored to specific customer
needs Third-party logistics companies also perform door-to-door service have been growing in
popularity Intermodal marketing companies or third-party firms provide many of the functions provided
by the groups listed above Most intermodal loading facilities are not operated by the railroad that
services the facility Third party providers act as a liaison between shippers and the railroads providing
customer service access to equipment and attractive rates because of volumes associated with the third-
party provider
For an intermodal terminal to provide efficient effective service close cooperation among all
parties is necessary Muller (1999) identified the requirements of a successful intermodal terminal as
follows
bull Furnish necessary personnel and container-handling equipment to receive store anddeliver intermodal trailers and containers
bull Prepare all necessary documents for receiving and delivering intermodal containers andtrailers ensuring that all port airport and other terminal charges customs duties andfreight charges have been paid
9
bull Maintain a status report of all trailers and containers received delivered and on hand inthe terminal for submittal to carriers involved
bull Maintain accurate inventory and locations of all intermodal trailers containers andequipment
bull Preplan all loading and unloading operations from data supplied by carriers and theiragents
bull Provide necessary personnel and equipment to service loading and unloading operationsbetween modes
bull Prepare all cargo plans hazardous cargo manifests and related documents for delivery tothe carrier and its vehicles
bull Maintain security for all containers and equipment in the terminal
bull Prepare all reports relative to terminal functions
bull Furnish adequate supervision to ensure proper performance of all operations
If a sole carrier uses the terminal all functions can easily conform to the needs of that carrier If
more than one carrier is served all carriersrsquo operational requirements must be met without interfering
with other carriers Other characteristics of a good terminal include a convenient location access and
adequate infrastructure
Motor Carriers
Although the trucking industry is perceived as a competitive homogenous industry many
characteristics segment the industry into sub-industries The trucking industry is classified as either local
or intercity There are vast differences between these two segments Local carriers include intercity
delivery services such as dump trucks garbage trucks and other services (Titus 1994) Intercity
trucking is classified between less-than-truckload (trucks hauling less than 10000 pounds) and the
truckload sectors
Many small truckload (TL) firms operate in the motor carrier industry An estimated 590000
trucking companies operate in the United States (Coyle Bardi and Novak 1994) Of the regulated
10
carriers in the trucking industry it is estimated that more than 95 percent are companies with less than $1
million in gross revenue (Coyle Bardi and Novak 1994) Many of these smaller companies are
owneroperators or small firms with a few trucks
Trucks have an important role in moving commodities to market in and out of North Dakota
Grain shipments by truck declined from 34 percent in 1978 to a low point of 21 percent in 1987 (Dooley
Bertram and Wilson 1988) Since 1987 the truck portion of the grain shipments have been on the
increase and in 1999 the truck portion of grain movements was 31 percent (Vachal 2000) This
increase is associated with the increasing proportion of commodities that are shipped to locations in the
state In-state shipments in the 1983-84 crop year were 8 percent of the crop compared to 1999-00 where
18 percent of the crop was shipped to in-state locations (Vachal 2000)
The increase in satellite elevator facilities associated with the changes in the elevator industry
and value-added processing plants in North Dakota give the trucking industry a larger role to play in
grain movement in North Dakota Shuttle trains and heavier grain cars may put short line railroads and
smaller elevators at a disadvantage resulting in longer farm-to-market movements for grain by truck
Even though most of the bulk grain still will leave the state in a unit train the transportation cost saving
that may be provided by shuttlersquos will provide incentive for longer movements by truck
Changes in manufacturing and supply chain management have lowered inventories and created a
move toward just-in-time inventory management These new changes have increased the need for quality
on-time transportation Trucking is a large part of the product movement in the supply chain The
service that trucks can provide in many instances put rail at a disadvantage Using a combination of
trucks and rail for long movements takes advantage of the economies of rail while providing for the
convenience of door-to-door service provided by trucks
11
Short Line Railroads
Short line railroads are an important component of the North Dakota and US transportation
system Short lines although many times limited by infrastructure and equipment availability provide an
added link between rural communities and the world
Although the current rail system will continue to be the mode of choice for origination of the
regionsrsquo commodity shipments it is important to investigate alternatives for enhancing transportation
services that can be used to attract business ventures Because the agriculture community is pursuing
value-added ventures and exploring the value of identity-preserved products having the option of
shipping less-than-trainload quantities with reasonable transportation rates is increasingly critical Short
line railroads may provide the avenue of reasonable rates for shipping smaller quantities North Dakotarsquos
three short line railroads account for 32 percent of the rail track in the state serving the northern tier
western south central and southeastern regions of the state
There are three events tied to the formation of the current short line rail industry (Dooley 1991)
First legislation establishing Conrail in 1973 provided initial stimulus for the formation of new railroads
Second reorganization of the Milwaukee Road and the liquidation of the Rock Island creating
opportunities for short line Third federal railroad deregulation leading to opportunities for short line
creation The deregulation legislation of the 1970s included provisions of operational subsidies and
rehabilitation funds for light density branch lines (Dooley 1991) The Staggers Act of 1980 provided
communities and shippers with opportunities to purchase or support rail lines identified for abandonment
by Class I carriers (Dooley 1991)
Intermodal freight transportation growth has been increasing by double digit gains except for
1996 where there were problems because of Class I railroad mergers Mergers by Class I railroads has
led to larger railroads but a reduction in the total track controlled by the Class Is Class I railroads have
abandoned or sold off light density rail lines The 4-R Act and the Staggers Act eased the abandonment
12
process requiring the Interstate Commerce Commission to speed approval of abandonment (Keeler
1983) The deregulation designed to streamline Class I railroads has paved the way for the formation of
short-line railroads Short line railroads serve as the bridge between rural communities and the larger
railroads leading to markets Short line railroads also serve as low-cost feeder lines for Class I railroads
Dooley (1991) recognized three reasons for the creation of feeder lines or short lines
1 A desire to eliminate the burdens of ownership (high operating and maintenance costs)
2 An expectation to recover some economic value from the line (sales revenue)
3 A desire to preserve the benefits associated with ownership (access to traffic originated
or terminated on the lines)
Babcock Russell Prater and Morrill (1993) evaluated the viability of short line versus
abandonment The study revealed strengths and weaknesses of the short line industry The advantages
short lines have over Class I include lower labor costs superior shipper service and reduction in truck
shipments reducing highway maintenance and rehabilitation Disadvantages to short line include their
inability to make large capital expenditures resulting in deferred maintenance Many times short line are
dependent on limited business sources or customer base and they also are dependent on the Class Is
railroads for equipment and access
Additional factors determining a short line railroadrsquos success or failure are many Possibilities
exist through economic development and by increasing density or customer base by establishing an
intermodal facility would increase volume on a short line creating revenue and adding a transportation
option for shippers in the surrounding area Another important benefit includes reduced highway
maintenance because of less truck traffic
Babcock Russell Prater and Morrill (1993) identified components associated with a short linersquos
success These components include anticipated components such as traffic and efficiency and others
13
unique only to the short line railroad industry The components associated with profitable short line
include
Traffic Components
bull Adequate density
bull Non-seasonal traffic
bull Diversified traffic base
bull Product mix with high valued product
Management and Labor
bull Motivated skilled workforce
bull Experienced management
bull Skilled marketers (understand customer needs)
bull Management close to shippers
bull Cost controls
Relationship to Class I
bull Multiple connections
bull Guaranteed access
bull Reasonable switching costs
bull Set rates
bull Mutual benefits
Financial
bull Equity investment
bull Realistic business plan
bull Realistic purchase price
14
bull Adequate capital
bull Rehabilitate track
Track Quality
bull Track maintenance and investment
State Assistance
bull Financial assistance
bull Information
bull Economic development
bull Financial insurance plan
It would be intuitive that many of the factors that make for a successful short line also could be
the same factors that would make a successful truckrail container intermodal loading facility Moreover
the relative importance of a single value-added venture is much greater for a short line carrier than for a
large Class I railroad Partnering rural communities producers producer-initiated value-added
processors rural manufacturers and a local short line carrier in the start-up and operation of a rural
intermodal loading facility may present opportunity for economic expansion of rural communities and the
surrounding area
North Dakota is well-versed in the importance of short-line railroads as an alternative for
continuing rail service on lines deemed unprofitable by Class I railroads Intermodal facilities on short
lines would provide rural business and communities alternative transportation options for those desiring
expansion of their economic base Moreover short line railroads may enhance their own traffic base and
customer service by adding an intermodal option
15
Intermodal and Class I Railroads
Intermodal transportation has been hailed as the savior of the railroads but the rapid growth of
the 1980s and 1990s has slowed This does not mean that the intermodal business is declining for the
railroads The expedited high reliability low transit time ground transportation for freight is a 400
billion dollar market Of this large pie the railroad only has about a two billion dollar share The growth
potential for rail is huge (Ellis 2000) For the railroad to gain market share from the trucking industry
service and transit time must improve
Even though intermodal is the fastest growing sector for the rail industry the Class Is face
lowered revenue per car than other enterprises Historically intermodal produces the least revenue but
generates the most traffic Financial statements for the Union Pacific (UP) and the Burlington Northern
Sante Fe (BNSF) show the intermodal revenue problem In 1999 the UP moved 2738000 intermodal
carloads an 8 percent increase over 1998 (1999 UP Annual Report) However comparing carload
revenue among shipment types it generated approximately one-half of the next lowest revenue source
The intermodal freight generated $630 per car compared to $1158 for the next lowest revenue
commodity (1999 UP Annual Report)
BNSF moved 3203000 cars in 1999 up from 3080000 in 1998 This intermodal traffic
resulted in $2507000000 in revenue The revenue per car was $783 compared to the next lowest
revenue per car at $1049 (1999 BNSF Annual Report) Industry analysts view the low revenue per car
for intermodal freight as a potential pitfall for the financial health of Class I railroads The concern is
that the growth potential for the railroads is only in intermodal freight and most other commodities have
limited potential Because of service problems historically associated with rail many shippers are
reluctant to switch to rail because of the service levels and timeliness of trucking Improved service
levels or excellent service may provide railroads an avenue for increasing rates on intermodal traffic
16
Fixing service problems is the number one comment from most rail shippers (Ellis 2000) BNSF
is working toward improved service by providing a performance guarantee on intermodal service on five
lanes On-time performance still may not provide the service desired by many shippers A truck legally
can transport from coast to coast in about 100 hours The best rail intermodal service is just under that of
trucks but the actual delivery time is not consistent because of congestion in intermodal yards and other
problems For rail intermodal to meet truck delivery time head to head railroads would have to raise
speed restrictions to between 80 and 90 miles per hour Because of costs and safety issues this is not a
practical approach
Interchange problems also exist for many urban rail yards For instance in 1995 a car was traced
from Los Angeles to Chicago about 2200 miles The main trip was 48 hours but it took another 40
hours to move the next 40 miles through Chicago and get to the final destination Again in 2000 this
same route was timed and dramatic improvement was made but it still took over 24 hours to move the
last 40 miles One reason for the large dwell times in many cities is that each rail carrier uses a separate
intermodal facility which results in slow exchanges (Wallace 2000) Sharing facilities could provide
improved service levels Sharing facilities among different railroads mitigates the space problem and may
increase efficiency Other ways of improving performance is to bypass bottlenecks An example is
Kansas City Southernrsquos ldquoMeridian Speedwayrdquo which connects the BNSF and Norfolk Southern while
bypassing major bottlenecks in urban areas (Wallace 1997)
Fixing the service problems could contribute to successful intermodal operations Management
could reorganize and streamline operations In the early 1990s the Santa Fe railroad turned intermodal
from their least profitable segment to a level comparable to carload traffic Santa Fe modeled their
management after motor carriers viewing intermodal operations as ldquoprofit centersrdquo Santa Fe created an
intermodal business unit to run independently creating a new organizational structure The main
advantage of the new department was a complete picture of the business Previous responsibilities were
17
spread out among many departments Santa Fe focused heavily on intermodal marketing companies
(IMC) Santa Fe found 20 percent of IMC customers produced 80 percent of the business so they
dropped the number if IMCs used from 260 to 55 (Giblin 1996) Santa Fe aggressively invested in new
longer 48-foot containers compared to the old 45-footers The next move is to 53-foot containers
another efficiency move for shippers (Lang 1998) In 1994 Santa Fe offered six levels of service with
six different prices Santa Fe found that premium traffic provided the most profit and customers were
willing to pay for guaranteed service (Giblin 1996)
Another efficiency gain for Santa Fe was improved lane balance Lane balance is the ratio of full
to empties moving in any given direction Trucks usually operate with a ration of 95 percent full and 5
percent empty while Santa Fe was 55 percent full and 45 percent empty Through aggressive pricing
Santa Fe improved the ratio to about 95 percent full Santa Fe also exited from all lanes were they did
not see a clear competitive advantage
Intermodal growth has brought about capacity questions Intermodal loadings increased rapidly
during the 1990s Intermodal loadings are terminal intensive which may provide bottlenecks for
delivery Container loadings increased some 32 percent in the 1990s and trailer loadings decreased
slightly The shift to containerization has brought three changes for international shipping to and from
the United States First the ships have grown much larger demanding that many more containers be
stored at the port facility Second railroads are hauling large amounts of intermodal containers creating
higher infrastructure costs Third the land bridge traffic has increased with higher rail and ship
efficiencies thus Asian traffic is being shipped across land and sea (Luberoff and Walder 2000)
These larger ships force extensive upgrading at port facilities to handle the large ships and
remain viable The ports of Los Angeles and Long Beach have granted $394 million for the Alameda rail
corridor This corridor is a $24 billion 22-mile long depressed grade with separated rail and will connect
the port facility with the rail facilities of the BNSF and UP Other ports like Tacoma and Oakland are
18
considering similar projects (Luberoff and Walder 2000) Other technology like remote controlled
cranes and new smart gates that send draymen directly to loads should help improve port and other
facilities
If the rail capacity exists intermodal transportation has room for growth Chemical shipping has
only begun to use intermodal Over the past decade the worldrsquos tank fleet expanded about 10 percent a
year In Europe the tank container has captured a large share of tank truck traffic The intermodal tank
or tanktainer offers many advantages over tank trucks Intermodal tanks can be shipped overseas easily
placed on ships or railcars quickly and easily used for temporary storage on site and offer more
structural protection than the tank truck Currently there are an estimated 100000 tank containers in
service worldwide most common being the 20- foot International Organization for Standardization (ISO)
tank The chemical industry is the leading user of tank containers but many industries including food
beverage oil gas and electronics also use them (Corkhill 2000) The intermodal usage currently is
most cost effective on moves over 350 miles but the Hoyer Corporation of Germany has proved the
success of the short haul Hoyer runs a 75-mile intermodal tank container shuttle that runs five times a
day with up to 14 tank containers The service is highly used and is profitable (Corkhill 2000)
In the United States about two-thirds of chemical manufacturers rely on a single rail carrier in
tank cars The chemical industry uses rail to ship bulk commodities because they can be handled safer
and more efficiently by rail than by truck (Corkhill 2000) This provides a large potential market to ship
chemicals domestically and internationally The ISO tanktainers are well-suited for international use
They fit existing slots on container ships and carry the maximum volume of product allowed under the
road regulations of various countries around the world Some reasons that these tanks have not been
adopted by US manufacturers include companies are unfamiliar with the method changes would have
to be made to loading facilities and companies may be unwilling to make the necessary investment to
change to a country wide container infrastructure (Corkhill 2000)
19
Beside tanktainers there is a potential to move non-bulk finished chemical goods by intermodal
container Du Pont began using some intermodal in the early 1990s and plans to continue to expand
because it provides a measure of safety and also has a cost advantage
Another system with possible growth potential is the RoadRailer RoadRailers first started in
1964 with the Chesapeake amp Ohio Railroad RoadRailers can be used as a truck trailer or train freight
car RoadRailers captured attention in the 1980s when they began being used extensively on the East
Coast by Northfolk Southern and its Triple Crown service However RoadRailers have been slow to
catch on for long distance moves Amtrak is now using RoadRailers to move mail for the US Post
Office The RoadRailers are bi-directional and can run at speeds up to 114 miles per hour so there is
potential for long distance high-speed transfers The new RoadRailer has half the capacity of a regular
sized boxcar but weighs 75 percent less and saves on fuel The RoadRailer can be added or taken off a
train most anywhere saving on infrastructure costs and may reduce drayage
This technology is used on a limited basis but may provide opportunity Other technological
advances also provide new possibilities and efficiency to the transportation industry
Transportation Technology
Communication technology has revolutionized the transportation decision-making process for
shippers carriers facilitators and government agencies Information technology provides users with
better control over operations and for carriers control results in efficiency gains Muller 1999
identified the current uses for electronic information
bull Identify the best rates and service levels available from carriers and facilitators
bull Book issue account for and generate reports on freight shipments
bull Track and manage assets especially containers and chassis
bull Plan trace and confirm routing of intermodal equipment and their cargoes
20
bull Examine the sequence of intermodal operations especially at terminals
bull Manage documentation
bull Respond quickly to emergencies or change of opertional orders
bull Confirm specific operations associated with the entire shipment including pickup and
delivery
bull Measure performance of carriers and facilitators
bull Budget and manage costs
Total software solutions also are being touted for all businesses SAP and Oracle promote
enterprise software that provides EDI capablities and offers a company other software Software
technology reduces errors by eliminating re-keying of data
The rail industry was first in EDI applications because so much of the traffic is handled on more
than one railroad Railroads now use EDI in many applications including bills of lading shipment
status weights equipment and cargo weights yard management waybill retrieval freight claim
submissions interline tracing rate requests logistics costs evaluation fleet management and other
modules to meet specific customer needs (Muller 1999)
EDI provides trucking firms with many of the same applications of rail These technology tools
help trucking companies improve services offered to customers EDI provides trucking companies with
the ability to partner with customers and develop initiatives such as ldquoquick responserdquo and ldquojust-in-timerdquo
strategies Trucking companies also employ ldquosatellite trackingrdquo systems for load and equipment tracking
These technologies support trucking company goals of increased efficiencies and provide better customer
service resulting in better relations with customers and other carriers
EDI communications systems at port facilities benefit terminals with accelerated gate
movements greater security better data entry and total better overall facility management Ocean
carriers have more international transactions and prefer EDI Most modes find it necessary to employ
21
EDI technology to communicate with exporters customs brokers freight forwarders port authorities and
government agencies
Many carriers are adopting and enjoying the use of financial EDI This provides for better cash
flow and easier payment methods for customers Many large retailers and manufacturers are using the
technology Electronic funds transfer (EFT) and electronic payment remittance advice are being used
widely Using these technologies are labor savings and provide for error free transactions Given the
number of transactions a large company may have daily the savings may be substantial
Other technologies that provide efficiencies and peace of mind for customers are tracking and
routing Satellite technology uses two-way messaging service provides for improved customer service
helps with measuring performance and provides for better overall customer relations Carriers can use a
combination of Global Positioning System (GPS) and EDI to provide customers with real-time status
information about their shipments Other tracking technoligies include cellular phone communications
UPSs system uses cellular and the software system called MaxiTrac which customers can aquire and
install on their own computer systems
Terminals often use barcoding to keep track of equipment or shipments Transponders or
transmitters are located at the yard entrance and other places within a yard or warehouse As products
are moved these transmitters read the barcode and transfer information to a computer and reporting
location of the product Technological changes also occur in the trucking industry Motor carrier
technology changes in trailers and combinations of trailers continue to change the cost structure of the
trucking industry Safety technology such as anti-lock brake systems and air ride suspension for tractor
and trailer improve trucking quality with less freight damage
The use of cell phones satellite tracking on-board computers and other technological changes
also have improved efficiency in the trucking industry Cell phones can be used to locate loads thereby
reducing search time Automatic billing and electronic data interchange (EDI) may reduce time spent
22
Table 1 Intermodal Survey State TotalsOutbound Business
Number Eastbound Westbound
Export
Rail Car 100 0 100
Trucks 2954 61 39
Containers 8011 65 35
Domestic
Rail Car 1416 55 45
Trucks 32162 57 43
Containers 988 50 50
Inbound BusinessNumber Eastbound Westbound
Import
Rail Car 104 50 50
Trucks 2064 61 39
Containers 813 50 50
Domestic
Rail Car 1034 50 50
Trucks 19162 64 36
Containers 0 0 0
billing and doing accounting procedures EDI is direct computer-to-computer communication that can be
processed by the receiver without re-keying information EDI facilitates the move toward efficiency in
the supply chain (Crum Premkumar and Ramamurthy 1996)
North Dakotarsquos OutboundInbound Intermodal Survey
A survey was conducted of North Dakota businesses Chosen from a combination of the
Department of Economic Development and Finance list of manufacturers in Bismarck and the
Manufacturers Register of the State of
North Dakota A total of 457
businesses were surveyed with 195
responding
The survey identified 8999
containers now being shipped by
truckrail intermodal from North Dakota
(Table 1) This survey did not include
elevators or individual farmers or
groups of farmers now shipping
identity-preserved grain Respondents
identified that the majority of shipments
were from the Southeast portion of the
state The Southeast portion of the state represented some 63 percent of all traffic The Southcentral
area of the state identified the next most traffic There were many more respondents from Southeastern
and Southcentral North Dakota than from the rest of the state Of the 195 respondents 85 were from
Southeastern North Dakota and 28 were from Southcentral North Dakota
23
The respondents in the northwest region identified 17 containers mdash outbound and
inbound This may represent problems associated with the distance to an intermodal loading
facility The northwest region represented a balance for inbound and outbound trucks and
containers The northwest region of North Dakota includes the city of Minot The number of
businesses responding in Ward County was only 10 which does not provide an adequate
representation of the northwest region of North Dakota
Table 2 Intermodal Survey Northwest Region Totals Outbound Business
Number Eastbound Westbound
Export
Rail Car 4 0 100
Trucks 277 50 50
Containers 14 58 42
Domestic
Rail Car 0 0 0
Trucks 838 59 41
Containers 0 0 0
Inbound BusinessNumber Eastbound Westbound
Import
Rail Car 0 0 0
Trucks 293 69 31
Containers 3 50 50
Domestic
Rail Car 0 0 0
Trucks 1150 64 36
Containers 0 0 0
24
The survey identified only truck traffic for the North-central region of North Dakota
Respondents identified no container traffic The survey results are based on respondents and
business density therefore some areas of the state with low volume may not be a true
representation of actual freight flows to and from an area
Table 3 Intermodal Survey North Central Region Totals Outbound Business
Number Eastbound Westbound
Export
Rail Car 0 0 0
Trucks 36 80 20
Containers 0 0 0
Domestic
Rail Car 0 0 0
Trucks 1154 53 48
Containers 0 0 0
Inbound BusinessNumber Eastbound Westbound
Import
Rail Car 0 0 0
Trucks 212 75 25
Containers 0 0 0
Domestic
Rail Car 0 0 0
Trucks 268 40 60
Containers 0 0 0
25
No containers were identified in the northeast region of North Dakota There were only
five respondents from Grand Forks County A previous feasibility study for locating an
intermodal facility at Grand Forks indicates a much larger freight flow from northeast North
Dakota
Table 4 Intermodal Survey Northeast Region TotalsOutbound Business
Number Eastbound Westbound
Export
Rail Car 0 0 0
Trucks 182 50 50
Containers 0 0 0
Domestic
Rail Car 0 0 0
Trucks 249 63 37
Containers 0 0 0
Inbound BusinessNumber Eastbound Westbound
Import
Rail Car 0 0 0
Trucks 53 50 50
Containers 0 0 0
Domestic
Rail Car 0 0 0
Trucks 204 62 38
Containers 0 0 0
26
The southeast region of North Dakota represents the largest freight flow volumes from any
areas in the state This is a combination of business density and willing respondents The
southeast region also is closest to an intermodal loading facility which is located in Dilworth
MN The southeast region identified more than 8000 outbound containers and more than 800
inbound containers This represents a ratio of about 10 to 1 For every 10 containers leaving the
state only one returns loaded There is a cost associated with moving empty containers to
shippers in the state The southeast region also identified more than 20000 trucks originating
freight annually
Table 5 Intermodal Survey Southeast Region TotalsOutbound Business
Number Eastbound Westbound
Export
Rail Car 100 0 0
Trucks 1436 50 50
Containers 7946 65 35
Domestic
Rail Car 50 0 0
Trucks 19164 60 40
Containers 780 50 50
Inbound BusinessNumber Eastbound Westbound
Import
Rail Car 104 50 50
Trucks 1426 75 25
Containers 810 87 13
Domestic
Rail Car 30 100 0
Trucks 14114 68 32
Containers 0 0 0
27
Table 6 shows that respondents reported 208 containers originating in south central North
Dakota The second highest response also was from the south central region of the state This
traffic represents a long drayage movements for empty and full containers to reach an intermodal
loading facility
Table 6 Intermodal Survey South Central Region TotalsOutbound Business
Number Eastbound Westbound
Export
Rail Car 0 0 0
Trucks 4 100 0
Containers 0 0 0
Domestic
Rail Car 1260 60 40
Trucks 7413 56 44
Containers 208 50 50
Inbound BusinessNumber Eastbound Westbound
Import
Rail Car 0 0 0
Trucks 52 50 50
Containers 0 0 0
Domestic
Rail Car 1004 25 75
Trucks 2558 59 42
Containers 0 0 0
28
Respondents from the southwest region of the state reported no container shipments
Outbound truck traffic was significant but the long distance to an intermodal loading facility
makes intermodal shipping impractical because of the high cost of drayage
Table 7 Intermodal Survey Southwest Region TotalOutboundBusines
Number Eastbound Westbound
Export
Rail Car 0 0 0
Trucks 36 67 33
Containers 51 75 25
Domestic
Rail Car 156 50 50
Trucks 3084 49 51
Containers 0 0 0
Inbound BusinessNumber Eastbound Westbound
Import
Rail Car 0 0 0
Trucks 28 50 50
Containers 0 0 0
Domestic
Rail Car 0 0 0
Trucks 868 78 22
Containers 0 0 0
The survey provides some insight into the shipping patterns for North Dakota The low
response rate in some areas of the state may not result in true representation of actual freight
movements
The survey revealed 8999 outbound shipments by container The factor most often
identified by respondents in making shipping mode decisions was price or rate The next factor
respondents identified that determined transportation mode was availability Third on the list
was time or service
29
Economic Census Commodity Flow Survey
Comparisons can be made using the Commodity Flow Survey within the Economic
Census that is compiled every five years covering years ending in two and seven by the United
States Department of Commerce The economic census is the major source of facts about the
structure and functioning of the United States economy The census furnishes an important
framework for such composite measures as the gross domestic product estimate inputoutput
measures production and price indexes and other statistical series that measure short-term
changes in economic conditions
Some of the tables from the Commodity Flow Survey have been replicated here to
provide information as to the type and quantity of freight moving from North Dakota Some
inferences and estimates can be made about truck rail intermodal freight movements from the
data in the CFS
North Dakota Commodity Flow Analysis
North Dakota entities face difficulty in determining the flow of goods to and from the
state Partial data is collected by different organizations but no clear picture exists on the flow
of either manufactured or value added agricultural products The Upper Great Plains
Transportation Institute tracks grain shipments out of the state by mode type and destination
The Commodity Flow Survey data collected by the Department of Commerce provides a snap
shot of freight movement in out of the state every five years
Economic Census Commodity Flow Survey
The following section uses data from the 1997 Commodity Flow Survey from the
economic census to compare transportation trends for North Dakota with National trends Using
30
Commodity Flow Survey (CFS) information provides for estimates in the types of transportation
flows for North Dakota versus National flows and evaluate differences in trends In this survey
framework data are not used that would disclose the operations of an individual firm or
establishment
CFS Inclusions
Modes identified in the CFS are
1 Parcel deliverycourierUS Postal Service2 Private truck3 For-hire truck4 Railroad5 Shallow draft vessels6 Deep draft vessels7 Pipeline8 Air9 Other mode
10 Unknown
Within the tables of the CFS they used eight different classifications or modes They
include
1 Air (includes truck and air)
2 Single modes Shipments using only one of the above-listed modes except parcelor other and unknown
3 Multiple modes Parcel US Postal Service or courier shipments or shipmentsfor which two or more of the following modes of transportation were used
Private truckFor-hire truckRailShallow draft vesselDeep draft vesselPipeline
31
The CFS did not allow for multiple modes in combination with ldquoparcel US Postal
Service or courierrdquo ldquounknownrdquo or ldquootherrdquo By their nature these shipments may already include
various multiple mode activity
4 Other multiple modes Shipments using any other mode combinations notspecifically listed in the tables
5 Other and unknown modes Shipments for which modes were not reported orwere reported by the respondents as ldquootherrdquo or ldquounknownrdquo
6 Truck Shipments using for-hire truck only private truck only or a combinationof for-hire truck and private truck
7 Water Shipments using shallow draft vessel only deep draft vessel only orGreat Lakes vessel only Combinations of these modes such as shallow draftvessel and Great Lakes vessel are included as ldquoOther multiple modesrdquo
8 Great Lakes In the tables ldquoGreat Lakesrdquo appears as a single mode becausemileage calculations are done for only the lakes portion of the movement
The CFS identified shipping within and out of the state of North Dakota Three different
modes are truck rail and air or some combination of two or more modes In the Commodity
Flow Survey (CFS) Economic Census respondents are ask which modes are used for shipments
Table 8 uses data from the CFS and shows shipments by mode from 1993 and 1997 for the whole
US The most notable figures are for all modes where tons increased by 145 percent
Examining truck rail multimode the tonnage increased 335 percent while value decreased
almost 9 percent (Table 8)
Comparing US statistics with the state of North Dakota statistics shows that freight
shipments for North Dakota grew at a much higher rate than that for the average of the US All
categories increased more than the national average Tons of freight originating in North Dakota
32
increased over 44 percent from 1993 to 1997 Comparing North Dakota to the National average
where tons increased by 145 percent This should indicate a growing economy however the
latest statistics on economic growth show that North Dakota lags behind most of the rest of the
nation in many areas This becomes problematic in drawing a conclusion about what is
happening in North Dakota Census Bureau data reveals that the North Dakota economy grew at
an average annual rate of 41 percent in the same time period
There also are gaps in the Commodity Flow data for North Dakota in the multi-modal
section The data is missing because of the nature of the survey where there are few respondents
and the results may not be statistically valid
Table 8 compares the changes in freight shipments from 1993 to 1997 Percentage
change in US freight shipments are compared to the percentage change in North Dakota
shipments by mode value weight and average miles per shipment according to the CFS
33
Table 8 Comparison of United States and North Dakota Shipments
Mode oftransportation
Value Tons Average Miles Per Shipment
PercentChange
USShipments
Percent ChangeNorth Dakota
Shipments
PercentChange USShipments
PercentChange North
DakotaShipments
Percent ChangeUS Shipments
Percent ChangeNorth Dakota
Shipments
All Modes 188 444 145 445 114 54
Single modes 157 465 170 246 -64 353
Truck 131 488 206 448 -1 55
For-hiretruck
105 637 212 542 29 -147
Private truck 160 380 168 307 21 109
Rail 292 599 4 173 3 542
Water 231 - 115 - S -
Air (includestruck amp air)
647 3510 426 2942 -25 373
Pipeline 263 S 278 S S S
On average the value of US shipments grew at a faster rate than tons shipped This
would indicate growth in the shipping of value-added products The largest value increases were
in rail and truckrail parcel This would indicate that the growth in less-than-load (LTL)
shipments are using truckrail intermodal The package companies like UPS or Fed X and other
large package use the railroads to reduce costs for long haul shipments LTL trucking firms also
use the railroads to reduce shipping costs With large volume and consistent business the
railroads strive to meet the rate and service needs of these large customers
34
Table 9 US Shipments by Mode Value Weight and Weight-Distance
Mode oftransportation
Value Tons Ton-miles
1997 1993 percent
change
1997 1993 percent
change
1997 1993 percent
change
All Modes 6943988 5846334 188 11089733 9688493 145 2661363 2420915 99
Single modes 5719558 4941452 157 10436538 8922286 170 2383473 2136873 115
Truck 4981531 4403494 131 7700675 6385915 206 1023506 869536 177
For-hire truck 2901345 2625093 105 3402605 2808279 212 741117 629000 178
Private truck 2036528 1755837 160 4137294 3543513 168 268592 235897 139
Rail 319629 247394 292 1549817 1544148 4 1022547 942897 85
Water 75840 19749 231 563369 505440 115 261747 271998 -38
Air 229062 139086 647 4475 3139 426 6233 1415 555
Pipeline 113497 89849 263 618202 483645 278 S S S
Multiple modes 945874 662603 428 216673 225676 -4 204514 191461 68
Parcel 855897 563277 519 23689 23689 254 17994 13151 368
Truck amp Rail 75695 83082 -89 54246 54246 335 55561 37675 475
Truck amp Water 8241 9392 -123 33215 33215 -512 34767 40610 -144
Rail amp Water 1771 8636 -513 79275 79275 1 77590 70219 105
Other multiplemodes
4269 3216 328 26248 26248 386 18603 S S
Other amp Unknownmodes
278555 242279 150 436521 436521 -192 73376 92581 -207
The CFS statistics that stand out for North Dakota shipments are increases in shipments
originating in North Dakota Shipments increased in value by 44 percent and by 45 percent in
weight (Table 8) This indicates that the nature of the shipments may have remained relatively
constant The most noticeable change from 1993 to 1997 in types of shipments was that in 1997
coal was recognized to make up an estimated 388 percent of all shipments originating in North
Dakota
35
Table 10 Shipment Characteristics by Mode of Transportation for North Dakota 1993 and 1997
Mode oftransportation
Value Tons Average Miles
Per Shipment
1997
(millions
dollars)
1993
(millions
dollars)
Perce nt
Change
1997
(thousands)
1993
(thousands)
Perce nt
Change
1997 1993 Perce nt
Change
All Modes 15999 10527 444 87831 60763 445 244 158 540
Single modes 13647 9315 465 52689 42301 246 151 112 353
Truck 9915 6663 488 25213 17417 448 102 97 55
For-hire truck 4021 2457 637 13410 8698 542 289 339 -147
Private truck 5793 4200 380 11392 8716 307 70 63 109
Ra il 3284 2053 599 25446 21692 173 853 553 542
Water - - - - - - - - -
Air (includes truck
amp a ir)
70 15 351 0 1 - 294 2 1946 1417 373
Pipeline S S S S S S S S S
M ultiple modes
Parcel 850 603 41 29 36 -188 632 349 811
Tru ck amp Ra il 60 S S 75 S S 1305 1996 -346
Truck amp Water - S S- - S S - 2294 -100 0
Rail amp W ater - S S - S S - 1584 -100 0
Other mu ltiple
modes
- - - - - - - - -
Other amp Unknown
modes
642 555 158 35038 18356 909 34 S
Analysis
Using the CFS to estimate potential container truckrail intermodal traffic generated in
North Dakota provides valuable insight into potential intermodal traffic It may only be
necessary to use the national average of intermodal shipments to estimate potential North Dakota
intermodal traffic Because North Dakotarsquos freight types do not mirror the United States
because of the large natural resource base in raw agricultural commodities and coal some
adjustment must be made
36
The CFS survey displayed that North Dakota shipped an estimated 88 million tons in
1997 The Commodity Flow Survey estimated that nationally the portion of all freight that was
truckrail intermodal was 11 percent If North Dakotarsquos truckrail intermodal freight potential
was the same as the national trend then it could be estimated that North Dakota could have
potential of more than 48000 TEUs or 20-foot containers for truckrail intermodal shipments
Factors that determine the shipments include the type of freight distance to an intermodal
facility rates for shipments lift costs or total landed costs of shipments However because
North Dakotarsquos farmers are searching for new ways to market larger portions of the agricultural
products are being shipped direct from the farmer or marketing company in much smaller lots in
container
Because of North Dakotarsquos natural resource-based economy some adjustments must be
made to the CFS numbers An estimation of potential shipments should eliminate the coal and
petroleum-based and other shipments A large portion of North Dakota shipments are large
volume low value raw agricultural products However there is some evidence that consistently
larger portions of raw agricultural commodities are being shipped as identity-preserved product
in smaller lots to a final market for processing Because of this it now is impossible to rule out
raw agricultural commodities for truckrail container intermodal movements An estimation of
potential container movements was made eliminating the previously mentioned commodities
When ruling out this freight only 533 percent of the freight was eligible for truck rail intermodal
leaving North Dakota The next step was to use only the portion of identified freight movements
that were shipped adequate distance to best use the economies of rail Only movements more
than 500 miles were used which was 175 percent Using this method it was estimated that more
37
than 490000 tons of freight potentially could move in containers as truckrail intermodal The
estimated shipments could equate to more than 24500 containers annually if an intermodal
loading facility and acceptable rates and service levels were available
Past studies conducted in North Dakota have indicated smaller results Estimates for a
potential traffic at a proposed site in Casselton ND estimated that current traffic would
generate 13628 containers and within five years from completion of an intermodal loading
facility business volume would grow to more than 47000 containers provided a competitive rate
structure and adequate service levels were met
Leeper Cambridge and Campbell (1996) contacted individual companies to determine
interest in intermodal shipping from a potential Grand Forks intermodal facility The study
estimated the number of lifts in first third and fifth year of operation Table 11 is adapted from
Leeper et al The report estimated an increase from 7857 containers and 1500 trailers in year
one to 18663 containers and 3563 trailers in year five This represents a 138 percent increase in
business in the first five years The report failed to explain existing versus new intermodal
shipments However the Leeper et al study did list one company anticipating using 4000 to
5000 containers and the study identified 1000 of these would be new business
38
Table 11 Anticipated Number of Lifts
Anticipated N umber of Lifts
Grand Forks
Intermodal Facility
Year 1 Year 3 Year 5
ContainerTrailers ContainerTrailers ContainerTrailers
7857 1500 15714 3000 18663 3563
Ada pted from Leep er et al (19 96)
The increased shipments identified in the CFS along with previous study estimates of
potential intermodal traffic indicate that the railroadsrsquo view of intermodal may depend on
variables other than traffic volume The literature review identified reasons for Santa Fersquos
successful container truckrail intermodal venture These reasons included shutting down all
questionable intermodal facilities and concentrating on markets that provide consistently large
volumes resulting in better use of equipment and the best return on investment
Transportation Cost Comparisons
Export freight rates have been on the decline During the last part of the 1980s the cost of
moving a $250 VCR overseas was $30 or 125 percent of the cost of the product (Muller 1999)
In 1997 the cost of moving that same 250 dollar VCR was $3 or one percent of the cost of the
VCR Similarly rates for refrigerated products have decreased along with identity-preserved
agriculture products (Vachal amp Reichert 2000) These rates vary directly on transportation
demand and the balance of shipments
Vachal and Riechert 2000 concentrated on IP grain and discussed freight rates and
logistics costs from the field to the final destination The actual cost of shipping by container
39
may be higher than traditional bulk systems but the logistics of containerized shipping actually
offer ways to reduce costs by taking advantage of services that may be available
Containerization also provides for shippers of smaller lots of grain to be shipped and guarantee
integrity of the product from point of loading to the final destination This product may bring a
premium to the seller or producer as the product meets the criteria specified by the final user
Using rail for the domestic movement may reduce transportation costs and eliminate reloading
expense at a port facility while guaranteeing product quality and quantity
In comparing different transportation methods Vachal and Rieckert used a logistics model
which included storage handling transportation from the field to the farm farm to elevator and
to the final destination Therefore the transportation model involved cost components including
inland drayage inland truck freight ocean freight and inlandocean freight The spreadsheet
model simulated delivery of food-grade soybeans from Iowa to Japan This was packaged in
bags and delivered The illustration in the report used those logistics costs associated with
marketing soybeans truck rail and ocean freight rates and those costs associated with both
containerization and bulk delivery options
Figure 1 illustrates cost per ton of containerization truck and bulk shipments For this
study the important comparison is among truck and containerization Trucking to the coast and
transloading into a container is a costly endeavor and many products would not be competitive in
any market because of transloading costs Moreover trucking costs are related directly to a
backhaul Transporting small quantities of relatively low valued products long distances by truck
requires that the commodity only be charged for its loaded portion of the trip If there is no
backhaul because of specialty equipment or other reasons than the round trip is covered by the
40
Figure 1 Estimated Freight Rates Per-Ton from Central Iowato Japan (Reichert and Vachal 2000)
fronthaul and this almost doubles the trucking costs Vachal and Reichert used no backhaul in
their example which attributes total trip cost to the commodity Figure 1 displays a simulation
from their model and shows cost relationships Bulk grain in unit trains is the least costly
followed by single car then container and finally truck
Using Burlington Northern Santa Fersquos published tariffs moving soybeans to the coast is a
practical method of determining differences in transportation rates Rail rates are available on-
line and can be used to determine costs associated with different methods of transporting goods
Figure 2 illustrates a combination of BNSFrsquos rates and truck costs associated with moving
soybeans to Tacoma from Fargo ND Truck costs were developed from a model developed by
the Upper Great Plains Transportation Institute and provide a reasonable estimate of truck rates
Because the trucking industry in many ways replicates a perfectly competitive industry truck
costs are a good proxy for truck rates Rates were obtained from the Internet to compare costs
41
shipping by truck by container single rail car rate and unit train rail car rate from Fargo ND
except for the container which originates in Dilworth Minn Comparing Vachal and Reichertrsquos
costs and BNSF public rate estimates the relative cost differences are similar however Vachal
and Reichert attempted to capture total logistics costs Considering trucking to the coast in any
other truck equipment type other than a container that can be transloaded as a unit on to a cargo
ship leads to other expenses which increases the difference between container truckrail
intermodal costs and trucking costs Comparing the Vachal and Reichert method with only
inland freight costs to the port it only may be necessary to capture inland freight costs to
determine the least cost method of shipping Total costs of shipping soybeans to Japan using
Vachal and Reichertrsquos total cost method determined that trucking to the coast was almost 130
percent more costly than using a container on the rail If there is no backhaul for the truck then
the costs for the entire trip is attributable to the fronthaul which may occur with specialty
equipment
Using only inland freight costs and if no loads are available on the return trip the costs
of transporting soybeans by truck is $112 per ton This is similar to Vachal and Riechertrsquos
estimation Truck is 80 percent more costly than the rail portion of shipping the container to the
port However other costs do exist with obtaining the container including moving the container
to the loading point drayage to the intermodal facility lifting the container off the truck lifting
the container onto and off of the train and drayage to the final destination or transloading onto the
cargo ship transloading the container off the cargo ship and load it either onto a train or truck
and transport it to the final destination Vachal and Riechert estimated costs other than
transporting at more than $12 per ton They also estimated the ocean portion of the container
42
Figure 2 Transportation Cost Comparisonsof Soybeans from Fargo ND toTacoma
move to Japan at $13 per ton and total costs using truck at just more than $134 per ton Using
their estimation of $25 per ton for ocean freight and other costs added to the truck cost estimates
of $112 for the truck portion of the movement at $137 it is close to their estimate of $134
Figure 2 shows land cost comparisons shipping from Fargo to Tacoma The truck costs
represent a 100 percent backhaul This means the cost is only attributable one way Trucking is
still more costly by 42 percent at $68 per ton Considering the transloading charges would
increase it another $12 per ton the intermodal option is much less costly
However shipping east to Chicago using BNSF rates it is less expensive to use a truck
not including transloading Comparing truck costs to Chicago from Dilworth compared with
container truckrail intermodal from Dilworth to Chicago The one-way truck costs estimate
would be $28 per ton compared to the rail only portion of the movement at almost $34 per ton
Adding drayage at both ends of the movement makes the truckrail intermodal movement an
unlikely option on the 600-plus mile movement
43
Examining BNSF rates out of Chicago and Dilworth to Tacoma it was discovered that
the published rate from Chicago to Tacoma is less than the published rate from Dilworth to
Tacoma even though from Chicago to Tacoma is more than 600 miles farther BNSFrsquos
Intermodal Public Rate Retrieval also exposed that their rate from St Paul to Tacoma for the
same equipment is the same as from Chicago to Tacoma even though St Paul is about 400 miles
closer to Tacoma then Chicago (June 2001)
Actual rates are negotiated between the transportation provider and the shipper Many
times shippers use third parties such as a logistics company freight forwarders or brokers to
provide total transportation services These providers may prepare all documentation arrange all
transportation and may provide these services at less cost because of the volume they represent
Shipper associations are another avenue worth exploration by shippers Shipper
associations are viewed as a shipper and must be granted the same rights as shippers and cannot
be discriminated against by transportation providers Because they represent volume they may
have the leverage to negotiate better rates and service levels than an individual shipper Many
times shippersrsquo associations do not provide services such as export documentation or regulation
guidance so it may be important to use other third party providers for those services (Vachal and
Reichert 2000)
Containerization of specialty grains and oil seeds is increasing because of the demand for
smaller shipments with specific specification or characteristics In 1998 sunflowers were
transported by container 88 percent of the time and hops went by container 100 percent of the
time Also large quantities of soybeans move in containers Reasons for containerization is that
the bulk transportation system has inadequately transported the product resulting in co-mingling
44
of product with unwanted product and or the quantities demanded were small and therefore the
shipment did not meet the requirements of bulk movements
Impact on North Dakota
It is difficult to determine the impact on North Dakota the limited truckrail container
intermodal freight option has Quantifying intermodal traffic is difficult and potential
intermodal traffic is even more illusive Determining the impacts on North Dakota businesses
communities and the entire state is an impossible task
Economic factors influence freight rates which in-turn affect the competitive nature of
industry in North Dakota The senario may be that with a competitive freight rate businesses
could become more competitive domestically and internationally which would generate more
business creating more volume causing more economic activity and freight volume creating more
competition etc Therefore it is difficult to quantify the economic impact not having a
competitive intermodal loading facility in North Dakota may have on businesses communities
and the state
Problems are apparent when comparing products moving domestically by truck or
truckrail container intermodal and distance is the key for rate savings out of North Dakota
BNSF published rates for truckrail container intermodal to Tacoma are the same using either
Chicago or St Paul as an origin even though it is much closer to Tacoma from St Paul than
Chicago The published rate from Dilworth to Tacoma is more than the rate from Chicago to
Tacoma
45
Model
TruckRail Container Intermodal Terminal Costs
Bierman Bonini and Hausman (1991) describe a model as a simplified representation of
an empirical situation Variables are classified as decision variables exogenous variables
intermediate variables policies and constraints or performance measures (Bierman Bonini and
Hausman 1991) Decision variables are under the control of the decision maker Other types of
variables affect the model but their values cannot be determined by the decision maker
Exogenous or external variables are outside the decision makers control Intermediate
variables are used to relate decision variables and exogenous variables to performance measures
(Bierman Bonini and Hausman 1991) Exogenous and intermediate variables are represented
in various places throughout the model
Using the previously discussed modeling principles a spread sheet model was developed
to simulate costs for an intermodal facility This model was developed to provide decision
makers with an estimate of start-up and annual costs
Intermodal Facility Costs
Variables represented on sheet one of the model include the initial capital investment
The model is changeable and can be used to estimate costs from a proposed business plan which
includes the size and type of facility Sheet two has performance measures that are the total
investment costs and annual operating costs Sheet three includes sensitivity analysis to evaluate
the costs associated with different levels of investment
46
Firm Characteristics
The spread sheet model was developed to evaluate costing options for an intermodal
facility A facility could vary in size equipment configuration accommodations (reefer etc)
and different options require different levels of investment Different levels of investment
require different traffic volumes to cover expenses or costs
The model consists of changeable fixed and variable cost sections to replicate different
sizes and configurations of facilities allowing for scenario analysis purposes This provided a
range of investment levels for decision making purposes
Costs and Sensitivity Analysis
The spreadsheet model was developed to estimate costs associated with a particular
intermodal facility The strength of using a spreadsheet model is its flexibility for a decision
maker The user has options over a wide range of data for different operational characteristics
and input prices reflecting a specific business plan A determination may be made as to the
feasibility of a particular facility by using the model
A second strength of the model is its ability to run sensitivity analysis over a wide range
of variables This allows a decision maker the options of changing investment decisions at the
outset The model was developed using initial assumptions with the use of sensitivity analysis to
determine investment costs by changing these initial investment decisions
47
Base Case
Assumptions for the base case scenario were developed The base case is based on an 80
acre facility with 5000 feet of track two powered switches and two internal switches To fence
the perimeter of 80 acres on three sides requires 3960 feet of fence It is assumed that 40 acres
of the 80 would be paved There is a need for six work lights and six reefer hookups A 1500
square foot building would be built for office and storage space This facility would need one
lifter one hustler two chassis and no forklifts There would be a manager and four yard
employees Table 12 shows the initial assumptions along with possible options
Table 12 Assumptions and Options for the Base Case Scenario from Sheet One of theIntermodal Feasibility Costing Model
Land acres 80 Cost per acre $200000
Feet of track 5000 Cost per foot of track $10000
No of powered 2 Cost of powered $13000000
No of fence feet 2640 Cost of fence per foot $1000
Acres of pavement 40 Cost per acre $1000000
No of work lights 6 Cost of lights $1000000
No of reefer hookups 6 Cost of reefer hookup $200000
Square feet of building 1500 Cost per square foot $5000
Feet of water line 1000 Cost per foot $1000
Feet of sewer line 1500 Cost per foot $2000
No of lifters 1 Cost of lifter $50000000
No of hustlers 1 Cost of hustlers $5000000
No of forklifts 0 Cost of Forklifts $2500000
No of Chassis 2 Cost of Chassis $500000
Facility Estimated 20 Equipment Estimated 15
Tax rate 5 Insurance 5
Interest rate 8 Estimated Facility Life 20 Years
Maintenance and repair Variable
48
The quantitative expressions of objectives that managers are trying to achieve are
performance measures (Bierman Bonini and Hausman 1991) Sheet two of the spreadsheet
model provides a cost summary which is the performance measures for the model The model
provides performance measures in the form of a total investment estimates and estimated annual
costs
Table 13 Investment for the Base Case Intermodal Facility
Land $16000000
Track $50000000
Powered Switches $26000000
Internal Switches $16000000
Fence $3960000
Building $7500000
Office Equipment $600000
Lighting $6000000
Reefer Hookups $1200000
Water Line $1500000
Sewer Line $3000000
Total $147760000
Total equipment cost is the next portion of the model In the base case there is one lifter
one hustler and two chassis Total equipment estimated investment is $560000 The total
estimated investment for the base case scenario is $2037600
The model has a section with depreciation formulas both for the facility which includes
track switches and the building and also a section for equipment depreciation The yard or
facility expense portion of the model includes taxes insurance maintenance and repair and
49
return on investment (Table 14) The section also lists variable costs including direct and
indirect labor costs accounting and fuel costs The last two categories are building expenses
and management and sales expense
The next portion of the model shows the performance measures in annual fixed variable
and total costs (Table 14) Annual operating costs provide a decision maker estimates of
business volume needed to be successful
Table 14 Annualized Costs for the Base Case Intermodal Facility
Fixed Costs
Land and Track Depreciation $5110400
Equipment $2986700
Taxes Insurance Maintenance and Repair Return on Investment
$20715600
Management $4580000
Building Expense $736500
Variable Costs
Wages $9160000
WC and SS $1099200
Benefits $641200
Accounting $250000
Fuel $2080000
Total $47059600
The base case facility assumptions include 80 acres of land with 40 acres paved one
container lifter two chassis and one hustler and a 1500 square foot building The base case
50
included 5000 feet of track four switches work lights and electrical hookups for reefer units
The annual costs of operating the facility estimated by the model are $470596
Return on investment (ROI) is a large portion of annual costs ROI can be considered as
interest on debt capital or return on equity investment (Casavant 1993) This may be reduced
depending on the type of facility required Used equipment may be purchased however repair
costs would increase or a short line railroad could use existing track and eliminate the need to
invest in switches and track The rest of this chapter will be devoted to sensitivity analysis of
investment variables
Sensitivity Analysis
Sensitivity analysis displays the change in the performance measures by varying a
decision or exogenous variable (Bierman Bonini and Hausman 1991) Lotus 123 has a
function for performing ldquowhat-if analysisrdquo which determines the modelrsquos sensitivity to a given
variable ldquoWhat-if tablesrdquo can be developed providing performance measures as one or two
variables are changed over a range of values The intermodal facility costing modelrsquos sensitivity
analysis shows the decision maker cost relationships in the model Understanding cost
relationships may help a manager minimize total annual costs Variables chosen for sensitivity
analysis include equipment investment building investment track and switch investment labor
costs and the number of lifts required to meet costs
Lifts Costs and Volume
It is estimated that lift costs at Dilworth Minn are in a range from $10 to $15 per lift
(Leeper et al 1996) This is only an estimate lift costs are dependent on other factors Other
factors associated with intermodal transportation costs are the drayage costs and rail costs
51
Drayage is the trucking costs associated with moving the container or trailer to and from the
intermodal facility These costs vary depending on several factors and are not considered within
the model
Drayage costs or trucking costs are estimated at $113 per mile (Berwick and Dooley
1996) The farther from the source increases costs associated with drayage and total
transportation charges A tradeoff exists among the economies associated with intermodal
freight transportation and drayage distance At some point drayage costs switching transloading
of the container overcome the economies of rail transportation
Changing costs for the facility will change the number of lifts needed to cover costs
Table 15 shows the relationship of volume and costs associated with the base case intermodal
facility and assumptions
Table 15 Number of Lifts and Fixed Variable and Total CostsLiftsYR Fixed Costslift Varible Coslift Total Costslift
2000 $169 $66 $235
4000 $85 $33 $118
6000 $56 $22 $78
8000 $42 $17 $59
10000 $34 $13 $47
12000 $28 $11 $39
14000 $24 $9 $34
16000 $21 $8 $29
18000 $19 $7 $26
20000 $17 $7 $24
22000 $15 $6 $21
24000 $14 $6 $20
26000 $13 $5 $18
28000 $12 $5 $17
30000 $11 $4 $16
32000 $11 $4 $15
As volume increases costs per lift decrease as a result of economies associated with
utilization of resources (Table 15) Costs vary depending on the initial investment
52
Figure 3 Equipment Investment versus TotalCosts
Total Investment and Annual Costs
The model performs well over a wide range of different scenarios Varying investments
in equipment results in much small increases in annual costs Figure 3 shows the difference in
total costs with the different levels of equipment investment
A similar relationship exists between investment in track and annual cost estimates
Varying track investment from $50000 to $800000 increases annual costs by $111150 (Table
16)
53
Table 16 Change in Annual Cost with Different Levels of Track Investment
Track
Investment
Annual Operating
Costs
$50000 $403905
$100000 $411725
$150000 $418725
$200000 $426135
$250000 $433545
$300000 $440955
$350000 $448365
$400000 $455775
$450000 $463185
$500000 $470595
$550000 $478005
$600000 $485415
$650000 $492825
$700000 $500235
$750000 $507645
$800000 $515055
This scenario analysis reports relationships that exist between input variables and costs
The equipment and track scenario show that with large increases in capital investment there is a
relatively smaller increase in annual costs Increasing track investment from $50000 to
$100000 only increases total annual costs by 15 percent and as $50000 investment increments
are added the percentage of increase is reduced
54
Table 17 shows the modelrsquos response in varying track and equipment variables The table
is read by seeking investment for equipment and investment for track and aligning the column
and row
Table 17 Equipment and Track Investment Decisions and Total Annual Cost
The relationship between equipment investment and total annual costs and track
investment and total annual cost is that as investment increases in these items total annual costs
increases at a relatively smaller rate This may provide insight into under investing in a facility
Lack of capacity because of fear of overexposure or overinvesting may handicap the operation
and prevent performance needed with increased volume and result in less than desirable customer
service However increasing track investment from $50000 to $800000 does increase annual
costs by $111150 or more than $9000 per month
55
CONCLUSIONS
This study provides a snapshot of truckrail container intermodal shipping in and out of
North Dakota Cost estimates for an intermodal facility also are presented The study revealed
the benefits of intermodal transportation including lower overall transportation costs increased
economic productivity and efficiency reduced congestion and burden on over-stressed highway
infrastructure higher returns from public and private infrastructure investments reduced energy
consumption and increased safety
The Commodity Flow Survey conducted by the Commerce Department was analyzed to
estimate possible container shipments from North Dakota The CFS survey displayed that North
Dakota shipped an estimated 88 million tons in 1997 The Commodity Flow Survey estimated
nationally that the portion of all freight that was truckrail intermodal was 11 percent If North
Dakotarsquos truckrail intermodal freight potential was the same as the national trend then it could
be estimated that North Dakota could have the potential of more than 48000 TEUs or 20-foot
containers for truckrail intermodal shipments Factors determining the shipments include the
type of freight distance to an intermodal facility rates for shipments lift costs or total landed
costs of shipments However because North Dakotarsquos farmers are searching for new ways to
market and demand for identity-preserved commodities larger portions of the agricultural
products are being shipped direct from the farmer or marketing company in much smaller lots in
container
Because of North Dakotarsquos natural resource-based economy some adjustments must be
made to the CFS numbers An estimation of potential shipments should eliminate the coal and
petroleum-based and other shipments A large portion of North Dakota shipments are large-
56
volume low-value raw agricultural products However there is some evidence that consistently
larger portions of raw agricultural commodities are being shipped as identity-preserved product
in smaller lots to a final market for processing Because of this it is now impossible to rule out
raw agricultural commodities for truckrail container intermodal movements An estimation of
potential container movements was made eliminating the previously mentioned commodities
When ruling out this freight only 533 percent of the freight was eligible for truck rail intermodal
leaving North Dakota The next step was to use only the portion of identified freight movements
that were shipped adequate distance to best use the economies of rail Only movements of more
than 500 miles were used which was 175 percent Using this method it was estimated that more
than 490000 tons of freight potentially could move in containers over truckrail intermodal The
estimated shipments could equate to more than 24500 containers annually if intermodal loading
facilities were available along with acceptable rates and service levels
Lower transportation costs are realized with container intermodal shipping by using each
mode for the portion of the trip for which it is best suited However it was discovered that the
BNSF published rates for shipping a container out of Dilworth to Tacoma were higher than
shipping that same container out of Chicago It also was discovered that BNSF published rates to
Chicago from Dilworth would cost more than trucking the 600-plus miles With the convenience
and time factors associated with trucking or unless a reduced rate could be negotiated with the
railroad trucking would be the less expensive mode
A survey developed for this study identified containers now being shipped in and out of
the state This survey asked about a companies freight and expected growth The survey results
estimates that 8999 containers leave the state annually The Southeast portion of the state
57
represented some 63 percent of all traffic and more than 90 percent of all truckrail container
intermodal traffic The two main factors contributing to the majority of container traffic
originating in the Southeast are location of an intermodal loading facility and the size and
number of businesses located in Fargo and surrounding areas The Southcentral area of the state
identified the next most traffic There were many more respondents from Southeastern and
Southcentral North Dakota than from the rest of the state Of the 195 respondents 85 were from
Southeastern North Dakota and 28 were from Southcentral North Dakota
A spreadsheet model was developed to estimate costs associated with starting an
intermodal loading facility in North Dakota The model in this study has many useful features
Costs can be estimated for different equipment configurations and sizes of facilities The base
case estimated and investment of more than $2 million and operating expense at more than
$400000 annually Sensitivity analysis provided insight into investment decisions where the
proportions of annual operating costs increased at a much lower rate than proportionately larger
investment costs This leads to the conclusion that underinvesting may limit capacity of the
loading facility limiting potential of handling larger volumes
The truckrail container intermodal shipping problem in North Dakota is circular in
nature Problems exist in the form of rates and service Rates are high and service levels low
because there is no volume and there is no volume because rates are high and service levels are
low
58
59
REFERENCES
Babcock Michael W Eugene R Russell Marvin Prater amp John Morrill State Shortline Railroads and the Rural Economy Topeka KS Kansas Department of TransportationJune 1993
Berwick M amp Dooley F Truck Costs for OwnerOperators Mountain Plains Consortium No 97-81 Upper Great Plains Transportation Institute North Dakota State UniversityFargo October 1997
Bierman H Bonini C amp Hausman W Quantitative Analysis for Business Decisions 8th ed Richard D Irwin Inc Homewood IL 1991
Burlington Northern Santa Fe Corporation ldquoBNSF Intermodal Public Rate Retrievalrdquolthttpwwwbnsfcomgt (July 2 2001)
Burlington Northern Santa Fe Corporation ldquoBNSF Public Rate Retrievalrdquolthttpwwwbnsfcomgt (June 20 2001)
Burlington Northern Santa Fe Corporation 1999 Burlington Northern Santa Fe CorporationAnnual Report 1999
Casavant K Basic Theory of Calculating Costs Applications to Trucking Upper Great PlainsTransportation Institute No 118 North Dakota State University Fargo 1993
Corkhill M ldquoIntermodal Shakeoutrdquo Chemical Week v162 32-35 (September 20 2000)
Coyle J Barbi E amp Novak R Transportation 4th ed West Publishing Company St Paul MN 1994
Crum M Premkumar G amp Ramamurthy K ldquoAn Assessment of Motor Carrier Adoption UseAnd Satisfation With EDIrdquo Transportation Journal Summer 1996
Dooley F Economies of Size and Density for Short Line Railroads Mountain PlainsConsortium No 91-2 Upper Great Plains Transportation Institute North Dakota StateUniversity Fargo 1991
Dooley F Bertram L amp Wilson W Operating Costs and Characteristics of North DakotaGrain Trucking Firms Upper Great Plains Transportation Institute No 67 NorthDakota State University Fargo 1998
Ellis E ldquoGrowing The Businessrdquo Trains Magizine v60 3 14 (March 2000)
Ellis E ldquoOn Time Isnrsquot Good Enoughrdquo Trains Magizine v60 7 40 (July 2000)
60
Fess P amp Warren W Accounting Principles South-Western Publishing CompanyCincinnati OH 1990
Giblin J ldquoMission Impossible Making Rail Intermodal Profitablerdquo Trains Maginzine v58n7 p64(4) (July 1998)
Lang D ldquoTime To Rethink Intermodalrdquo Railway Age 51(1) (October 1998)
Leeper Cambridge amp Campbell Grand Forks Intermodal Study and Implementation Plan McLean VA June 1996
Muller Gerhardt Intermodal Freight Transportation 3rd ed Eno Transportation FoundationInc Virginia 1995
Muller Gerhardt Intermodal Freight Transportation 4th ed Eno Transportation FoundationInc Virginia 1999
Reichert H amp Vachal K Identity Preserved Grain (Logistical Overview) Mountain PlainsConsortium No 143 Upper Great Plains Transportation Institute North Dakota StateUniversity Fargo January 2000
Spraggins Barry H ldquoThe Potential for International Movements of Goods from Alberta to theUS and Mexicordquo 39th Transportation Research Forum Annual meeting Proceedings Montreal Canada October 16-18 1997
United Pacific Corporation 1999 United Pacific Corporation Annual Report 1999
United Stated Department of Agriculture North Dakota 1997 Commodity Flow SurveyTransportation Washington US Department of Commerce 1999
United Stated Department of Agriculture United States 1997 Commodity Flow SurveyTransportation Washington US Department of Commerce 2000
Vachal K Annual North Dakota Elevator Marketing Report 1999-2000 Mountain PlainsConsortium No 139 Upper Great Plains Transportation Institute North Dakota StateUniversity Fargo November 2000
Wallace RD (1997 April) ldquoIntermodal A Flawed Masterpiecerdquo Railway Age v198 n4945(7) (October 1998)
WWD ldquo97 Volume Rises 187 for Intermodal Shippingrdquo 175 n55 (March 24 1998) 13
61
APPENDIX A mdash Explanation of Intermodal Equipment
62
Intermodal Equipment
This section gives brief descriptions of intermodal equipment An intermodal facility
could have all or part of the equipment listed below There are many different intermodal
options that could be used for a facility depending on volume infrastructure needed and product
characteristics The intermodal equipment listed below comes from Gerhardt Mullerrsquos 3rd
Edition of Intermodal Freight Transportation
Cranes
Cranes of all types are used to move containers from ship-to-shore or truck-to-train etc
The most widely used is the rail mounted gantry crane It is built in the form of a bridge
supported by a trestle at each end This is used mostly at ports to load and unload ships and has
wheels so it can be moved from one pier to the other A hinged boom crane is mounted so it can
pivot at its base
Straddle Carriers
Straddle carriers lift heavy loads to a minimum height for short-distance travel and are
used to transfer containers to and from cranes These straddle cranes also can be used to stack
containers Some straddle carriers are equipped with computer control systems used for direction
and control of the straddle carrier and identification of containers
Stacking Cranes
The rubber-tired gantry crane is a hybrid falling between the gantry crane and straddle
carrier It is fashioned after the ship loading gantry without the boom and its purpose is to stack
containers on the ground It has the ability to stack containers higher and wider than the straddle
carrier
63
Forklift trucks
Forklifts come in many sizes and varieties and these machines perform many tasks
These machines can move palletized freight or containers themselves depending on their size
Forklifts have given way to roadstakers which are similar to forklifts but have the ability to
reach over obstacles such as chassis tracks railcars etc
Container Handlers
Container handlers move stack and load containers like forklift trucks but use an
overhead boom rather than the underlift principle
Yard Hostels
There is a variety of chassis-moving container handling equipment This equipment is
referred to by different names including yard horses hustlers mules or terminal tractors This
equipment is mainly used at a terminal or port but closely resembles an over the road tractor or
truck
Lifting Wheels
This device is attached to a hostel and allows for the operator to raise lower attach and
detach trailers without changing the trailersrsquo dolly wheels The lifting wheel gives the hostel a
unique advantage over ordinary tractors and allows for quick attach and detaching expediting
trailer movement
Intermodal Transfer Point
Line-haul intermodal equipment container-handling equipment enters the intermodal
terminal where containers are transferred between terminal equipment and line-haul equipment
This is the intermodal interchange
64
Container Chassis
A chassis is rail marine and over-the-road equipment This equipment is designed to
handle containers and trailers Chassis come in sizes compatible with containers however there
are adjustable chassis These slide to accommodate the size container needing to be transported
Chassis Flipper
Because of valuable space at terminals chassis are stacked The chassis flipper stands the
chassis vertically Chassis take up only 10 percent of the space stacked versus not stacked
Containers
Containers are the vehicle of choice used to encase the product for an intermodal
movement The number of container boxes have been growing at an increasing rate The
number of containers grew from 82 million in 1994 to 108 million in 1997 Ocean carriers
account for 52 percent of ownership leasing companies some 47 percent and the rest are split
among private and container transport companies
Containers come in many sizes and types Dry freight containers are either 20 or 40 feet
long There is also a 40-foot high cube container refrigerated containers The estimated cost of
a 20-foot dry freight container is between $2000 and $3000 and a 40-foot container is between
$3100 and $4500
For low volume usersrsquo leasing the container may be less costly than purchase Muller
reported that high costs are associated with empty container movements This problem exists
for some North Dakota shippers with less inbound freight than outbound and desiring to use the
intermodal shipping options
65
APPENDIX B mdash Model Explanation
66
TruckRail Container Intermodal Terminal Costs
Bierman Bonini and Hausman (1991) describe a model as a simplified representation of
an empirical situation Variables are classified as decision variables exogenous variables
intermediate variables policies and constraints or performance measures (Bierman Bonini and
Hausman 1991) Decision variables are under the control of the decision maker Other types of
variables affect the model but their values cannot be determined by the decision maker
Exogenous or external variables are outside the decision makers control Intermediate
variables are used to relate decision variables and exogenous variables to performance measures
(Bierman Bonini and Hausman 1991) Exogenous and intermediate variables are represented
in various places throughout the model
Using the previously discussed modeling principles a spread sheet model was developed
to simulate costs for an intermodal facility locating on a short line railroad This model was
developed to provide decision makers with an estimate of start-up and annual costs
Intermodal Facility Costs
Variables represented on sheet one of the model include the initial capital investment
The model is changeable and can be used to estimate costs from a proposed business plan which
includes the size and type of facility Sheet two has performance measures which are the total
investment costs and annual operating costs Sheet three includes sensitivity analysis to evaluate
costs associated with different levels of investment
Firm Characteristics
The spread sheet model was developed to evaluate costing options for an intermodal
facility A facility could vary in size equipment configuration accommodations (reefer etc)
67
and different options require different levels of investment Different levels of investment
require different traffic volumes to cover expenses or costs
The model consists of changeable fixed and variable cost sections to replicate different
sizes and configurations of facilities allowing for scenario analysis purposes This provided a
range of investment levels for decision making purposes
Fixed Costs
The fixed cost portion of the model includes land track and switches fence pavement
and concrete lighting and electrical building options equipment options depreciation
insurance repair taxes and interest These costs all are changeable within the model providing
a wide range of options Depreciation insurance maintenance and repair and interest are a
percentage of the investment In the following section these costs are described individually
Land
Within the land section of the model is the price per acre and the number of acres
required These variables are changeable to accommodate different situations For instance a
company contemplating a facility may already have usable land therefore diminishing the level of
investment needed Conversely a company may need to purchase land near a source of business
which may be a large investment along with needed improvements For the base case land was
priced at $2000 and the number of acres was set at 80 Eighty acres would be more than large
enough for the facility at 1742400 square feet This would allow for ample storage and room
for loading and unloading This dollar amount was arbitrary which could be less or more
depending on the location and current use of the land In rural areas land may be a small portion
of the investment needed but in an urban area land is a large portion of the investment
68
Track and Switches
This section of the model estimates the investment in track and switches There are six
entries possible shown in Table B1 These entries need to reflect decisions made at the outset
from a business plan The estimate of track costs and distance are from a 1996 study The Grand
Forks Intermodal Study amp Implementation Plan was done by Leeper Cambridge and Campbell
Table B1 Track and Switch Costs from the Intermodal Facility Spreadsheet Costing Model
Column
Row A B
5 Dollars per foot of track $100
6 Number of feet 5000
7 Number of powered switches 2
8 Cost of powered switches 130000
9 Number of internal switches 2
10 Cost of internal switches 80000
The track portion of the model allows for many different scenarios Track may already
exist and switches may be in place or a new siding may be needed This section of the model
allows for flexibility and entries for different operations The number and type of switches will
vary If the siding is new switches will be needed An existing siding will have switches
Powered switches may not be required Only two switches would be needed if siding is used as
the loading area Another possibility on a short line is that loading is on a no traffic section of
existing track
69
Fence Pavement and Concrete Lighting and Electrical
Depending on the level of security and desire to keep children animals and other
potential problems out of the site a fence may be required This section allows varying the
length and cost of the fence It is simply multiplying the number of fence feet times the cost per
foot This could be a rather substantial investment if it is desired to have a secure yard The base
case allows for 3960 feet of fence This is enough fence for the perimeter of the yard The cost
is estimated at $10 per foot (Dakota Fence)
Next is pavement and concrete This section simply allows an entry for the number of
acres and the cost of either asphalt or pavement In some cases a gravel yard may serve instead
of pavement or concrete There also may be a combination possibility of some pavement and the
rest gravel The cost per acre is simply multiplied by the number of acres However in some
cases the entire yard may not be paved For instance building space would not be paved
There is a section for lights electrical and reefer hookups Electrical components will
vary with size of the facility and expectations for its type of business For instance it may be
determined that no reefers will be used or no loading will occur at night which would lessen the
electrical investment The base case estimates loading lights cost $10000 each while reefer
hookups are estimated at $2000 each The base case calls for six lights and six reefer hookups
70
Table B2 Fence Pavement and Lighting and Electrical from the Intermodal FacilitySpreadsheet Costing Model
ColumnRow A B14 Fence15 No of fence feet 396016 Cost of fence per foot 101718 Pavement or Concrete19 Acres of Pavement 4020 Cost per acre of pavement 10002122 Lighting and Electrical23 No of lights 624 Cost of lights 1000025 No reefer hookups 626 Cost of hookups 2000
Building Options
This section includes size and cost of the building and costs of water and sewer to the
building The building cost is based on square footage times the size of the building The
building estimate is 1500 square feet at $50 per square foot
Water and sewer lines are cost per foot times the length of the line Water and sewer are
based on the use of city water lines and sewer If built in a rural area additional costs for a well
and septic system would exist The sewer is estimated at $20 per foot and water is estimated at
$15 per foot Building options are determined by the decision maker and may or may not exist
Some facilities may be able to be operated from an existing building lowering overall costs
71
Table B3 Building Options from the Intermodal Facility Spreadsheet Costing Model
ColumnRow A B28 Building Options29 Sq ft of building 150030 Cost per square foot 5031 Feet of water line 100032 Cost per foot 1533 Feet of sewer line 150034 Cost of sewer line 20
Equipment Options
Within the equipment portion of the model the decision maker has the options of lifters
hustlers forklifts and chassis The decision maker may choose the number of each and a cost
factor associated with each piece of equipment The cost factor would depend on equipment
choices New versus used equipment and if the equipment is used if reconditioning was
necessary There also is a fuel consumption entry This cell is linked to the variable cost portion
of the model This section gives the decision maker choices of different equipment depending on
the size and type of facility to be built
Table B4 Equipment Choices from Intermodal Facility Spreadsheet Costing ModelColumn
A BRows Equipment Options
36 Number of lifters 137 Cost of container lifters $50000038 Fuel consumptionhr 539 Number of hustlers 140 Cost of hustlers $5000041 Fuel consumptionhr 542 Number of forklifts 043 Cost of forklifts $2500044 Fuel consumptionhr 245 Number of chassis 246 Cost of chassis $5000
72
Office Equipment
Another portion of the model gives the decision maker the option of making entries for
office equipment There is a section for furniture and electronics The decision maker can enter
zero if a category is not valid This may happen where a short line railroad or third party uses
existing offices or office equipment to operate the intermodal facility
Table B5 Office Equipment from Sheet One of the Intermodal Spreadsheet Costing Model
Column
Rows A B
1 Computer $2500
2 Fax Machine $300
3 Phones $1000
4 Communication Equipment $1000
5 Desk $500
6 Chairs $200
7 Counter $500
Depreciation Equipment Taxes Insurance Interest and Maintenance and Repair
This section of the model uses percentages and time to determine costs associated with
different levels of investment The method allows a decision maker to adjust percentages or the
time factor for different interest insurance or depreciation rates
Depreciation is divided into facility and equipment to allow for different estimated useful
life (EUL) The decision maker can adjust time for different types of equipment or facilities
Depreciation is the cost of using up capital and should reflect the portion of useful life used
during a specified time period (Fess and Warren 1990) Equipment and the facility were
73
depreciated on the straight-line basis Depreciation was calculated by subtracting the salvage
value from the purchase price and dividing this figure by the EUL Salvage values and EULs are
difficult to estimate Salvage value primarily depends on the condition of equipment and type of
maintenance performed
Taxes and insurance are related to a percentage of value of the investment The tax levied
may vary by location and different types of taxes imposed Insurance also may vary with location
and company of issue These variables also are adjustable by the decision maker
Interest rates and terms vary depending on the level of investment and the risk perceived
by the lender The rate and term can be changed by the decision maker to meet different levels
and lengths of financing A rate also is used for return on investment andor a hurdle rate It is
common for companies to set a desired return for investments or hurdle rate which is used to
screen potential investments
Maintenance and repair costs vary with use With higher use there are higher costs A
percentage of the value of the equipment times a rate per hour will provide an estimate of the
cost of maintaining the equipment This is variable in the model Higher levels of repair would
be associated with older or used equipment The maintenance and repair formula is based on
new price for equipment The farther the cost of equipment deviates from new cost the higher
maintenance and repair
Variable Cost Components
The next part of the model is the variable cost components This includes a section for
direct and indirect labor costs Other costs included in the variable cost portion are electricity
water sewer building insurance office supplies and accounting services
74
Wages and Indirect Costs
This portion allows for the number of employees hourly rate hours worked and weeks
per year worked Indirect costs cover workers compensation social security match and benefits
Workers compensation social security match and benefits are based on a percentage of wages
There also is a section for management and sales staff which is based on the cost of hourly
employees This variable is difficult to estimate and would vary according to the type of facility
and the business plan of a proposed facility If the facility is based on a few businesses or a
single business there may be no need for management or sales staff Another scenario may
include the use of existing staff to manage and sell the services of the intermodal facility The
model is set to record management and sales costs at half of total wages This results in a
managerrsquos annual salary of $45000
Electricity Water and Sewer Building Insurance Office Supplies and Accounting Services
Other costs included in the variable cost portion are electricity water sewer building
insurance office supplies and accounting services These costs would vary depending on the
type of facility built the size of the building and if the facility was run using existing staff and
facilities If an existing facility is used costs should be portioned equally to use
Electricity water sewer office supplies and accounting services depend on volume used
Insurance would be a percentage of value and would depend on the value of the building
75
Table B6 Variable Cost Components of the Intermodal Spreadsheet Costing Model
Column
Rows A B
1
2 Variable Cost Components
3 No of Salaried Employees 2
4 Salary $25000
5 No of Hourly Employees 2
6 Hourly rate $10
7 Hours Per Week 40
8 Weeks Per Year 52
9 Fuel Cost Gallon $1
10 Workman Comp 5
11 Social Security match 7
12 Benefits 7
13 Management and Sales 50
14 Electricity $100
15 Water $50
16 Sewer $20
17 Insurance 5
18 Office Supplies $500
19 Accounting $2500
76
77
APPENDIX C mdash Intermodal Container Survey
78
Shipper SurveyND Strategic Freight Analysis
Conducted byUpper Great Plains Transportation Institute
December 2000
79
If 3 and 4 NO - No Additional Information Needed
1 Shipper (Company) ___________________________________________________
2 Name ___________________________________________________
Title ___________________________________________________
Telephone ____________________________ Email __________________________________
Do you arrangemanage transportation for your company (if no who) ____________________________
3 Do you receive truckload railcar or container shipments (other than grain) Yes No
4 Do you ship truckload railcar or container shipments (other than grain) Yes No
5 Do you use a freight forwarder or a broker for transportation Yes No
6 Do you use containers in your freight plan Ship Y N Receive Y N
5-1 If no could containers be an option to receiveship Yes No
52 If no why not ___________________________________________________
7 Do you receive or ship internationally Ship Y N Receive Y N
8 What factors affect your decision on choosing a shipment mode and carrier (eg price time equipment)
__________________________________________________________________________________
9 What is the average distribution of annual inboundoutbound shipments percent by quarter
1st Qtr of Year 2nd Qtr of Year 3rd Qtr of Year 4 th Qtr of Year Total
Traffic
Distribution
100
Service
Availability
Rank 1=poor
2=good
3=excellent
80
10 OUTBOUND Business Volume
Export
E-1 Eastbound W estbound
Rail Cars
Trucks
Containers
Domestic
DO-1 Eastbound W estbound
Rail Cars
Trucks
Containers
Container Traffic in TEU
11 INBOUND Business Volume
ImportI-1 Eastbound W estbound
Rail Cars
Trucks
Containers
Domestic
DI-1 Eastbound W estbound
Rail Cars
Trucks
Containers
Container Traffic in TEUs
12 Expected Business Growth by 2005 ___________
- Introduction
-
- Objective
- Methodology
- Implications
- Report Organization
-
- Literature Review
-
- Characteristics of Intermodal Transportation
- Intermodal Transportation Facilitators
- Motor Carriers
- Short Line Railroads
- Intermodal and Class I Railroads
- Transportation Technology
- North Dakotarsquos OutboundInbound Intermodal Survey
- Economic Census Commodity Flow Survey
- North Dakota Commodity Flow Analysis
-
- Economic Census Commodity Flow Survey
- Analysis
- Transportation Cost Comparisons
- Impact on North Dakota
-
- Model
-
- TruckRail Container Intermodal Terminal Costs
- Intermodal Facility Costs
- Firm Characteristics
- Costs and Sensitivity Analysis
-
- Base Case
-
- Sensitivity Analysis
-
- Lifts Costs and Volume
- Total Investment and Annual Costs
-
- Conclusions
- References
- Appendix A mdash Explanation of Intermodal Equipment
- Appendix B mdash Model Explanation
- Appendix C mdash Intermodal Container Survey
-
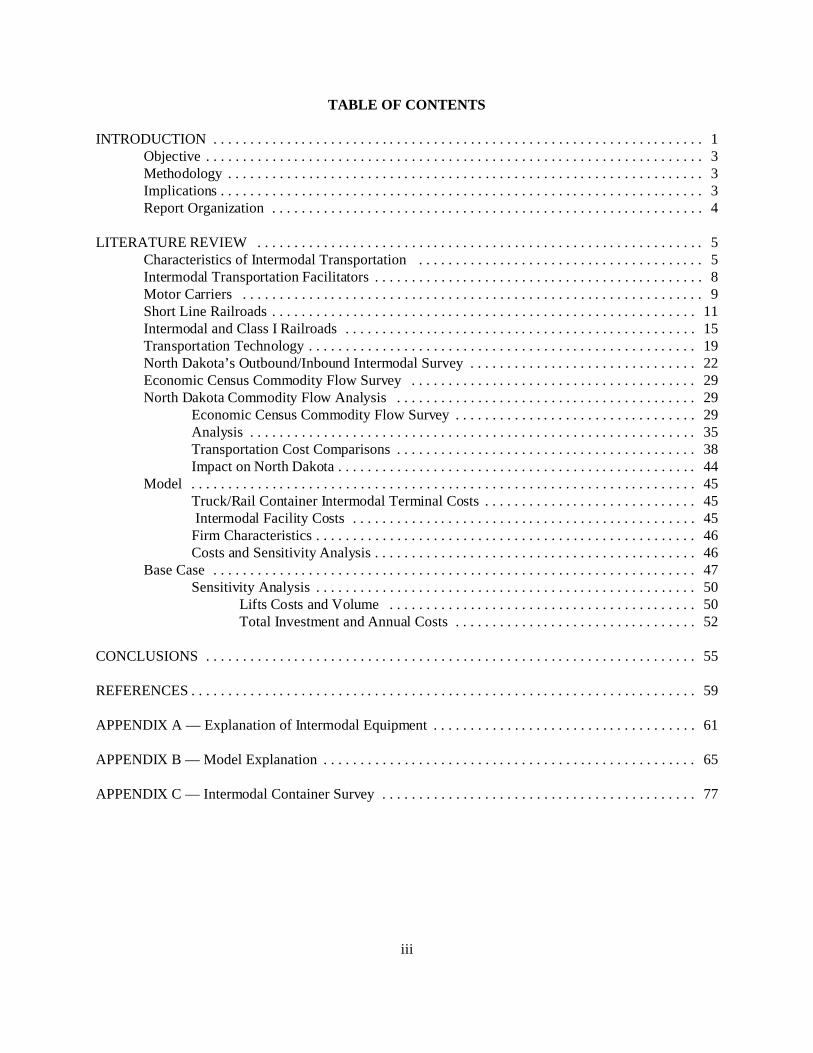
1
INTRODUCTION
Throughout agricultural history North Dakota has been known for supplying high quality raw
agricultural commodities Throughout the agricultural history of the area and more recently on a larger
scale economic forces have encouraged North Dakota producers to add value to their commodities either
through processing or producing a commodity to fit the specifications of a customer
The challenge facing value-added and identity-preserved producers is distance to markets
Producers and suppliers in the region must transport products long distances and most have few options
In todayrsquos competitive business environment getting the product to the right place when the customer
needs it is increasingly important Producers must deliver high quality product at a competitive price
when the competition often is located closer to the source of final demand
Value-added agriculture has been an economic development tool used to diversify the economic
base of rural communities One of the greatest challenges communities face is limited transportation
options The primary means for freight transportation in the rural regions is truck and rail Many small
companies do not produce quantities sufficient to ship in full truckload or unit trains nor do their
customers demand these large quantities
Rural agricultural communitiesrsquo inbound procurement and outbound distribution options are
limited to local trucking companies and rail Few communities generate enough truck traffic through
existing businesses to offer evidence of excess or available truck capacity Where rail is available Class
I carriers are reluctant to make short less-than unit train movements and offer limited options for
products other than grain originating or terminating in rural areas
North Dakotarsquos rail service is made up of two Class 1 railroads a regional railroad and two short
lines The ideal intermodal freight for Class 1 railroads is a large unit train loaded at one facility and
shipped to another and off loaded This provides the most economical and profitable scenario for Class 1
2
railroads Smaller less than trainload traffic generated is viewed by the Class1 railroad as a train of way
and the rate charged is more and service is less than that of a designated train
The purpose of container on flat car (COFC) or trailer on flat car (TOFC) intermodal shipping is
to take advantage of the economics of each different mode used Intermodal provides for truck trailer
and container convenience while taking advantage of the lower costs provided by rail shipping
Currently in North Dakota there is no intermodal facility Shippers desiring intermodal shipping
either have to use all truck or dray the container or trailer to an intermodal facility Depending on
distance this may provide a distinct disadvantage for North Dakota shippers The closest existing
intermodal facilities are located in Dilworth MN MinneapolisSt Paul MN and Billings MT
Possibilities for siting intermodal facilities on short lines in rural areas may provide rural communities
with an opportunity to diversify their infrastructure transportation rates and transportation equipment
resource base for attracting and growing value-added ventures Cooperation from Class I railroads and
the short line carriers systems may provide opportunities for an intermodal shipping alternative to rural
areas of the state
Intermodal facilities usually are operated by a third party and the railroads serve only as the
transportation provider At present large intermodal freight volumes are necessary for an economically
viable facility An intermodal facility can range from a simple and relatively inexpensive loading facility
using circus ramps to a sophisticated high cost operation involving gantry or overhead cranes allowing
for fast train loading and offloading The cost of the facility is in direct proportion to the equipment
needed trackage amount of land and labor associated with the size and volume of the facility Another
advantage to intermodal is removing some truck traffic from the state highway system Increased truck
traffic may impact the road system to and from the facility but overall impact on state highways may be
lessened
3
Objective
The main objective of this project was to evaluate the current truckrail container intermodal
transportation system in North Dakota This included traffic rates and service and facilities The
secondary objective was to determine costs associated with start-up and operating an intermodal facility
Methodology
This report describes truckrail intermodal short line railroads motor carriers and the Class I
railroads A survey of shippers was performed to determine the intermodal traffic in the state Analysis of
the Commodity Flow Survey (CFS) also was performed along with an examination of BNSFrsquos rates out
of North Dakota Cost comparisons were made among modes to determine least cost mode
Implications
Container intermodal shipping is not an option for many businesses in North Dakota Many
shippers may not know the total landed cost Landed costs include all logistics costs including
transportation to the final customer This cost may be complicated with multi-modal and or international
shipments There are markets for many North Dakota products but many times transportation options
and costs are the barrier Intermodal shipping should reduce shipping costs and provide opportunity for
competition in domestic and international markets
Without competitive truckrail container intermodal service North Dakota shippers remain at a
logistical disadvantage Many industries are affected by lack of intermodal service including agricultural
processors manufacturers identity-preserved commodity producers building suppliers and retailers
negatively impacting the entire state economy through higher shipping costs
Container truckrail intermodal implications to the North Dakota trucking industry would be
evident in the case of a modal shift Diverting freight volume away from truck to rail may be
4
advantageous to shippers but may be negative to the trucking industry Where the rail system seems
reluctant to accept low volume freight it may be the backbone of many trucking firms
Report Organization
This report is organized into four sections The first section is the introduction and background
and the next section is the literature review The report discusses short line railroads Class I railroads
truckrail container intermodal shipping methods or procedures A shipper survey also is discussed and
analyzed Shipping modes and costs are compared and finally the conclusions of the report finding
5
LITERATURE REVIEW
Characteristics of Intermodal Transportation
Intermodal freight transportation is the seamless and continuous door-to-door transportation of
freight on two or more transportation modes for example truck-rail or truck-ocean (Muller 1995)
Intermodal transportation growth has been aided by deregulation of US transportation global business
growth and changes in the business environment (Coyle Bardi and Novack 1994) In 1997 intermodal
marketers reported that loadings of trailers and containers increased by 187 percent after climbing 235
percent in 1996 and revenue grew at 145 percent more than double the 71 percent rise in 1996 (WWD
1998) Service issues including the Union Pacific network problems were listed as one reason for the
drop in the percentage increase in intermodal loadings from 1996 to 1997
According to Spraggins (1997) benefits of intermodal transportation include
bull lower overall transportation costs
bull increased economic productivity and efficiency
bull reduced congestion and burden on over-stressed highway infrastructure
bull higher returns from public and private infrastructure investments
bull reduced energy consumption
bull increased safety
Lower transportation costs are realized by using each mode for the portion of the trip for which it
is best suited For example rail could be used on the long-distance haul and truck on the short-distance
haul to and from the intermodal facility using the door-to-door service of truck and the economies
provided by rail Using rail for the long-haul portion of the trip may result in improved environmental
conditions including improved air quality because of reduced energy consumption Using fewer trucks
for the long-haul portion of the trip lessens congestion in major metropolitan areas and also lessens
damage to the roadway
6
Intermodal is used in domestic and international shipments The domestic movement usually is
truck-rail while internationally it can be truck-rail-ocean or rail-ocean or truck ocean Containers have
increased in popularity in international trade ldquoIt is likely that containers will replace trailers in North
American cross-border movements and even in domestic intermodal movementrdquo (Spraggins 1997)
Trailers will remain important in the short haul and low volume loads Some bulk commodities now are
moving by containers These commodities mostly are food commodities such as bananas and coffee and
other fresh fruits Demand for identity-preserved (IP) commodities also is on the rise Identity-preserved
may be simply providing a customer with a specific product origin or as complex as guaranteeing and
ordering specific agronomical practices (Vachel 2000) Organically grown wheat or soybeans for export
are examples of identity-preserved commodities Although identity-preserved could be a train of 110
cars of 14 percent protein spring wheat weighing 60 pounds per bushel and having 12 percent moisture
with less than 1 percent dockage most identity-preserved shipments tend to be small quantities and of
higher value Containerization ensures the shipper and receiver integrity of the product being shipped
Identity-preserved market demands may increase demand for container shipments in rural settings where
commodities are grown
Many farmers are seeking ways to add value to their farming operations and many are exploring
the possibility of exporting IP grain in small lots Rural North Dakota identity-preserved grains need the
containers and the economies of shipping by rail long distance for this concept to work Without an
intermodal loading facility within a reasonable distance any premium negotiated for the IP shipment may
be lost to transportation costs
Intermodal facilities vary in size equipment used and type of facility Increases in intermodal
freight has led to the development of intermodal hubs or terminal locations where trains are gathered
and cars are exchanged or switched to form new trains ldquoThese lsquohub-and-spokersquo operations take
7
advantage of reducing the number of point-to-point operations when the volume is not large enough to
make them cost efficientrdquo (Muller 1999)
Consolidation in the rail industry created duplicate services and many times the remaining carrier
consolidated duplicate services into one The rail industry targeted less profitable inefficient intermodal
facilities in smaller cities where less-than-unit trains delivered and picked up containers and trailers
which were loaded through the use of circus ramps This service has been reduced from approximately
1500 operations in 1970 to less than 370 in 1998 (Muller 1999) This reduction in facilities has limited
transportation options for many shippers in smaller cities or rural areas Reliable timely cost
competitive intermodal service is not available in many rural areas
Shippers cite that improvements in timeliness and price competitiveness are important
enhancements that would cause them to shift to intermodal usage (Spraggins 1997) A survey reported
by Spraggins (1997) reaffirmed that the service gap between intermodal and truckload services is the
greatest barrier to improving intermodalrsquos share of the North American freight market Intermodal
generally is thought of as a practical alternative for general freight (non-bulk) that moves in full
trailerload or containerload lots (Spraggins 1997) In general intermodal usage varies by the size of the
company products being shipped and distance from an intermodal hub
The largest barrier to many companies using intermodal shipping is the location of intermodal
hub facilities An intermodal loading facility located within a reasonable distance is essential to justify
using intermodal as a viable transport mode As distance to an intermodal facility increases it becomes
uneconomical to use the intermodal option as transit times and distance costs increase This explains
why many small rural companies simply continue to use trucks to transport product
8
Intermodal Transportation Facilitators
Transportation facilitators serve shippers and carriers by arranging the transportation of the
cargo Some facilitators perform transportation functions including consolidation palletizing or
containerizing of freight for shippers (Muller 1999) Facilitators also may use their own documentation
for the movement Facilitators include many categories of participants 1) domestic freight forwarders
2) international freight forwarders 3) import brokers domestic air freight forwarders 4) air cargo
agents 5) shipper councils associations and cooperatives 6) intermodal marketing companies 6)
transportation brokers 7) perishable brokers 8) consolidators 9) transloaders 10) distribution carriers
11) customshouse brokers 12) export management companies and 13) third-party logistics firms
(Muller 1999)
Intermodal marketing companies can provide door-to-door services tailored to specific customer
needs Third-party logistics companies also perform door-to-door service have been growing in
popularity Intermodal marketing companies or third-party firms provide many of the functions provided
by the groups listed above Most intermodal loading facilities are not operated by the railroad that
services the facility Third party providers act as a liaison between shippers and the railroads providing
customer service access to equipment and attractive rates because of volumes associated with the third-
party provider
For an intermodal terminal to provide efficient effective service close cooperation among all
parties is necessary Muller (1999) identified the requirements of a successful intermodal terminal as
follows
bull Furnish necessary personnel and container-handling equipment to receive store anddeliver intermodal trailers and containers
bull Prepare all necessary documents for receiving and delivering intermodal containers andtrailers ensuring that all port airport and other terminal charges customs duties andfreight charges have been paid
9
bull Maintain a status report of all trailers and containers received delivered and on hand inthe terminal for submittal to carriers involved
bull Maintain accurate inventory and locations of all intermodal trailers containers andequipment
bull Preplan all loading and unloading operations from data supplied by carriers and theiragents
bull Provide necessary personnel and equipment to service loading and unloading operationsbetween modes
bull Prepare all cargo plans hazardous cargo manifests and related documents for delivery tothe carrier and its vehicles
bull Maintain security for all containers and equipment in the terminal
bull Prepare all reports relative to terminal functions
bull Furnish adequate supervision to ensure proper performance of all operations
If a sole carrier uses the terminal all functions can easily conform to the needs of that carrier If
more than one carrier is served all carriersrsquo operational requirements must be met without interfering
with other carriers Other characteristics of a good terminal include a convenient location access and
adequate infrastructure
Motor Carriers
Although the trucking industry is perceived as a competitive homogenous industry many
characteristics segment the industry into sub-industries The trucking industry is classified as either local
or intercity There are vast differences between these two segments Local carriers include intercity
delivery services such as dump trucks garbage trucks and other services (Titus 1994) Intercity
trucking is classified between less-than-truckload (trucks hauling less than 10000 pounds) and the
truckload sectors
Many small truckload (TL) firms operate in the motor carrier industry An estimated 590000
trucking companies operate in the United States (Coyle Bardi and Novak 1994) Of the regulated
10
carriers in the trucking industry it is estimated that more than 95 percent are companies with less than $1
million in gross revenue (Coyle Bardi and Novak 1994) Many of these smaller companies are
owneroperators or small firms with a few trucks
Trucks have an important role in moving commodities to market in and out of North Dakota
Grain shipments by truck declined from 34 percent in 1978 to a low point of 21 percent in 1987 (Dooley
Bertram and Wilson 1988) Since 1987 the truck portion of the grain shipments have been on the
increase and in 1999 the truck portion of grain movements was 31 percent (Vachal 2000) This
increase is associated with the increasing proportion of commodities that are shipped to locations in the
state In-state shipments in the 1983-84 crop year were 8 percent of the crop compared to 1999-00 where
18 percent of the crop was shipped to in-state locations (Vachal 2000)
The increase in satellite elevator facilities associated with the changes in the elevator industry
and value-added processing plants in North Dakota give the trucking industry a larger role to play in
grain movement in North Dakota Shuttle trains and heavier grain cars may put short line railroads and
smaller elevators at a disadvantage resulting in longer farm-to-market movements for grain by truck
Even though most of the bulk grain still will leave the state in a unit train the transportation cost saving
that may be provided by shuttlersquos will provide incentive for longer movements by truck
Changes in manufacturing and supply chain management have lowered inventories and created a
move toward just-in-time inventory management These new changes have increased the need for quality
on-time transportation Trucking is a large part of the product movement in the supply chain The
service that trucks can provide in many instances put rail at a disadvantage Using a combination of
trucks and rail for long movements takes advantage of the economies of rail while providing for the
convenience of door-to-door service provided by trucks
11
Short Line Railroads
Short line railroads are an important component of the North Dakota and US transportation
system Short lines although many times limited by infrastructure and equipment availability provide an
added link between rural communities and the world
Although the current rail system will continue to be the mode of choice for origination of the
regionsrsquo commodity shipments it is important to investigate alternatives for enhancing transportation
services that can be used to attract business ventures Because the agriculture community is pursuing
value-added ventures and exploring the value of identity-preserved products having the option of
shipping less-than-trainload quantities with reasonable transportation rates is increasingly critical Short
line railroads may provide the avenue of reasonable rates for shipping smaller quantities North Dakotarsquos
three short line railroads account for 32 percent of the rail track in the state serving the northern tier
western south central and southeastern regions of the state
There are three events tied to the formation of the current short line rail industry (Dooley 1991)
First legislation establishing Conrail in 1973 provided initial stimulus for the formation of new railroads
Second reorganization of the Milwaukee Road and the liquidation of the Rock Island creating
opportunities for short line Third federal railroad deregulation leading to opportunities for short line
creation The deregulation legislation of the 1970s included provisions of operational subsidies and
rehabilitation funds for light density branch lines (Dooley 1991) The Staggers Act of 1980 provided
communities and shippers with opportunities to purchase or support rail lines identified for abandonment
by Class I carriers (Dooley 1991)
Intermodal freight transportation growth has been increasing by double digit gains except for
1996 where there were problems because of Class I railroad mergers Mergers by Class I railroads has
led to larger railroads but a reduction in the total track controlled by the Class Is Class I railroads have
abandoned or sold off light density rail lines The 4-R Act and the Staggers Act eased the abandonment
12
process requiring the Interstate Commerce Commission to speed approval of abandonment (Keeler
1983) The deregulation designed to streamline Class I railroads has paved the way for the formation of
short-line railroads Short line railroads serve as the bridge between rural communities and the larger
railroads leading to markets Short line railroads also serve as low-cost feeder lines for Class I railroads
Dooley (1991) recognized three reasons for the creation of feeder lines or short lines
1 A desire to eliminate the burdens of ownership (high operating and maintenance costs)
2 An expectation to recover some economic value from the line (sales revenue)
3 A desire to preserve the benefits associated with ownership (access to traffic originated
or terminated on the lines)
Babcock Russell Prater and Morrill (1993) evaluated the viability of short line versus
abandonment The study revealed strengths and weaknesses of the short line industry The advantages
short lines have over Class I include lower labor costs superior shipper service and reduction in truck
shipments reducing highway maintenance and rehabilitation Disadvantages to short line include their
inability to make large capital expenditures resulting in deferred maintenance Many times short line are
dependent on limited business sources or customer base and they also are dependent on the Class Is
railroads for equipment and access
Additional factors determining a short line railroadrsquos success or failure are many Possibilities
exist through economic development and by increasing density or customer base by establishing an
intermodal facility would increase volume on a short line creating revenue and adding a transportation
option for shippers in the surrounding area Another important benefit includes reduced highway
maintenance because of less truck traffic
Babcock Russell Prater and Morrill (1993) identified components associated with a short linersquos
success These components include anticipated components such as traffic and efficiency and others
13
unique only to the short line railroad industry The components associated with profitable short line
include
Traffic Components
bull Adequate density
bull Non-seasonal traffic
bull Diversified traffic base
bull Product mix with high valued product
Management and Labor
bull Motivated skilled workforce
bull Experienced management
bull Skilled marketers (understand customer needs)
bull Management close to shippers
bull Cost controls
Relationship to Class I
bull Multiple connections
bull Guaranteed access
bull Reasonable switching costs
bull Set rates
bull Mutual benefits
Financial
bull Equity investment
bull Realistic business plan
bull Realistic purchase price
14
bull Adequate capital
bull Rehabilitate track
Track Quality
bull Track maintenance and investment
State Assistance
bull Financial assistance
bull Information
bull Economic development
bull Financial insurance plan
It would be intuitive that many of the factors that make for a successful short line also could be
the same factors that would make a successful truckrail container intermodal loading facility Moreover
the relative importance of a single value-added venture is much greater for a short line carrier than for a
large Class I railroad Partnering rural communities producers producer-initiated value-added
processors rural manufacturers and a local short line carrier in the start-up and operation of a rural
intermodal loading facility may present opportunity for economic expansion of rural communities and the
surrounding area
North Dakota is well-versed in the importance of short-line railroads as an alternative for
continuing rail service on lines deemed unprofitable by Class I railroads Intermodal facilities on short
lines would provide rural business and communities alternative transportation options for those desiring
expansion of their economic base Moreover short line railroads may enhance their own traffic base and
customer service by adding an intermodal option
15
Intermodal and Class I Railroads
Intermodal transportation has been hailed as the savior of the railroads but the rapid growth of
the 1980s and 1990s has slowed This does not mean that the intermodal business is declining for the
railroads The expedited high reliability low transit time ground transportation for freight is a 400
billion dollar market Of this large pie the railroad only has about a two billion dollar share The growth
potential for rail is huge (Ellis 2000) For the railroad to gain market share from the trucking industry
service and transit time must improve
Even though intermodal is the fastest growing sector for the rail industry the Class Is face
lowered revenue per car than other enterprises Historically intermodal produces the least revenue but
generates the most traffic Financial statements for the Union Pacific (UP) and the Burlington Northern
Sante Fe (BNSF) show the intermodal revenue problem In 1999 the UP moved 2738000 intermodal
carloads an 8 percent increase over 1998 (1999 UP Annual Report) However comparing carload
revenue among shipment types it generated approximately one-half of the next lowest revenue source
The intermodal freight generated $630 per car compared to $1158 for the next lowest revenue
commodity (1999 UP Annual Report)
BNSF moved 3203000 cars in 1999 up from 3080000 in 1998 This intermodal traffic
resulted in $2507000000 in revenue The revenue per car was $783 compared to the next lowest
revenue per car at $1049 (1999 BNSF Annual Report) Industry analysts view the low revenue per car
for intermodal freight as a potential pitfall for the financial health of Class I railroads The concern is
that the growth potential for the railroads is only in intermodal freight and most other commodities have
limited potential Because of service problems historically associated with rail many shippers are
reluctant to switch to rail because of the service levels and timeliness of trucking Improved service
levels or excellent service may provide railroads an avenue for increasing rates on intermodal traffic
16
Fixing service problems is the number one comment from most rail shippers (Ellis 2000) BNSF
is working toward improved service by providing a performance guarantee on intermodal service on five
lanes On-time performance still may not provide the service desired by many shippers A truck legally
can transport from coast to coast in about 100 hours The best rail intermodal service is just under that of
trucks but the actual delivery time is not consistent because of congestion in intermodal yards and other
problems For rail intermodal to meet truck delivery time head to head railroads would have to raise
speed restrictions to between 80 and 90 miles per hour Because of costs and safety issues this is not a
practical approach
Interchange problems also exist for many urban rail yards For instance in 1995 a car was traced
from Los Angeles to Chicago about 2200 miles The main trip was 48 hours but it took another 40
hours to move the next 40 miles through Chicago and get to the final destination Again in 2000 this
same route was timed and dramatic improvement was made but it still took over 24 hours to move the
last 40 miles One reason for the large dwell times in many cities is that each rail carrier uses a separate
intermodal facility which results in slow exchanges (Wallace 2000) Sharing facilities could provide
improved service levels Sharing facilities among different railroads mitigates the space problem and may
increase efficiency Other ways of improving performance is to bypass bottlenecks An example is
Kansas City Southernrsquos ldquoMeridian Speedwayrdquo which connects the BNSF and Norfolk Southern while
bypassing major bottlenecks in urban areas (Wallace 1997)
Fixing the service problems could contribute to successful intermodal operations Management
could reorganize and streamline operations In the early 1990s the Santa Fe railroad turned intermodal
from their least profitable segment to a level comparable to carload traffic Santa Fe modeled their
management after motor carriers viewing intermodal operations as ldquoprofit centersrdquo Santa Fe created an
intermodal business unit to run independently creating a new organizational structure The main
advantage of the new department was a complete picture of the business Previous responsibilities were
17
spread out among many departments Santa Fe focused heavily on intermodal marketing companies
(IMC) Santa Fe found 20 percent of IMC customers produced 80 percent of the business so they
dropped the number if IMCs used from 260 to 55 (Giblin 1996) Santa Fe aggressively invested in new
longer 48-foot containers compared to the old 45-footers The next move is to 53-foot containers
another efficiency move for shippers (Lang 1998) In 1994 Santa Fe offered six levels of service with
six different prices Santa Fe found that premium traffic provided the most profit and customers were
willing to pay for guaranteed service (Giblin 1996)
Another efficiency gain for Santa Fe was improved lane balance Lane balance is the ratio of full
to empties moving in any given direction Trucks usually operate with a ration of 95 percent full and 5
percent empty while Santa Fe was 55 percent full and 45 percent empty Through aggressive pricing
Santa Fe improved the ratio to about 95 percent full Santa Fe also exited from all lanes were they did
not see a clear competitive advantage
Intermodal growth has brought about capacity questions Intermodal loadings increased rapidly
during the 1990s Intermodal loadings are terminal intensive which may provide bottlenecks for
delivery Container loadings increased some 32 percent in the 1990s and trailer loadings decreased
slightly The shift to containerization has brought three changes for international shipping to and from
the United States First the ships have grown much larger demanding that many more containers be
stored at the port facility Second railroads are hauling large amounts of intermodal containers creating
higher infrastructure costs Third the land bridge traffic has increased with higher rail and ship
efficiencies thus Asian traffic is being shipped across land and sea (Luberoff and Walder 2000)
These larger ships force extensive upgrading at port facilities to handle the large ships and
remain viable The ports of Los Angeles and Long Beach have granted $394 million for the Alameda rail
corridor This corridor is a $24 billion 22-mile long depressed grade with separated rail and will connect
the port facility with the rail facilities of the BNSF and UP Other ports like Tacoma and Oakland are
18
considering similar projects (Luberoff and Walder 2000) Other technology like remote controlled
cranes and new smart gates that send draymen directly to loads should help improve port and other
facilities
If the rail capacity exists intermodal transportation has room for growth Chemical shipping has
only begun to use intermodal Over the past decade the worldrsquos tank fleet expanded about 10 percent a
year In Europe the tank container has captured a large share of tank truck traffic The intermodal tank
or tanktainer offers many advantages over tank trucks Intermodal tanks can be shipped overseas easily
placed on ships or railcars quickly and easily used for temporary storage on site and offer more
structural protection than the tank truck Currently there are an estimated 100000 tank containers in
service worldwide most common being the 20- foot International Organization for Standardization (ISO)
tank The chemical industry is the leading user of tank containers but many industries including food
beverage oil gas and electronics also use them (Corkhill 2000) The intermodal usage currently is
most cost effective on moves over 350 miles but the Hoyer Corporation of Germany has proved the
success of the short haul Hoyer runs a 75-mile intermodal tank container shuttle that runs five times a
day with up to 14 tank containers The service is highly used and is profitable (Corkhill 2000)
In the United States about two-thirds of chemical manufacturers rely on a single rail carrier in
tank cars The chemical industry uses rail to ship bulk commodities because they can be handled safer
and more efficiently by rail than by truck (Corkhill 2000) This provides a large potential market to ship
chemicals domestically and internationally The ISO tanktainers are well-suited for international use
They fit existing slots on container ships and carry the maximum volume of product allowed under the
road regulations of various countries around the world Some reasons that these tanks have not been
adopted by US manufacturers include companies are unfamiliar with the method changes would have
to be made to loading facilities and companies may be unwilling to make the necessary investment to
change to a country wide container infrastructure (Corkhill 2000)
19
Beside tanktainers there is a potential to move non-bulk finished chemical goods by intermodal
container Du Pont began using some intermodal in the early 1990s and plans to continue to expand
because it provides a measure of safety and also has a cost advantage
Another system with possible growth potential is the RoadRailer RoadRailers first started in
1964 with the Chesapeake amp Ohio Railroad RoadRailers can be used as a truck trailer or train freight
car RoadRailers captured attention in the 1980s when they began being used extensively on the East
Coast by Northfolk Southern and its Triple Crown service However RoadRailers have been slow to
catch on for long distance moves Amtrak is now using RoadRailers to move mail for the US Post
Office The RoadRailers are bi-directional and can run at speeds up to 114 miles per hour so there is
potential for long distance high-speed transfers The new RoadRailer has half the capacity of a regular
sized boxcar but weighs 75 percent less and saves on fuel The RoadRailer can be added or taken off a
train most anywhere saving on infrastructure costs and may reduce drayage
This technology is used on a limited basis but may provide opportunity Other technological
advances also provide new possibilities and efficiency to the transportation industry
Transportation Technology
Communication technology has revolutionized the transportation decision-making process for
shippers carriers facilitators and government agencies Information technology provides users with
better control over operations and for carriers control results in efficiency gains Muller 1999
identified the current uses for electronic information
bull Identify the best rates and service levels available from carriers and facilitators
bull Book issue account for and generate reports on freight shipments
bull Track and manage assets especially containers and chassis
bull Plan trace and confirm routing of intermodal equipment and their cargoes
20
bull Examine the sequence of intermodal operations especially at terminals
bull Manage documentation
bull Respond quickly to emergencies or change of opertional orders
bull Confirm specific operations associated with the entire shipment including pickup and
delivery
bull Measure performance of carriers and facilitators
bull Budget and manage costs
Total software solutions also are being touted for all businesses SAP and Oracle promote
enterprise software that provides EDI capablities and offers a company other software Software
technology reduces errors by eliminating re-keying of data
The rail industry was first in EDI applications because so much of the traffic is handled on more
than one railroad Railroads now use EDI in many applications including bills of lading shipment
status weights equipment and cargo weights yard management waybill retrieval freight claim
submissions interline tracing rate requests logistics costs evaluation fleet management and other
modules to meet specific customer needs (Muller 1999)
EDI provides trucking firms with many of the same applications of rail These technology tools
help trucking companies improve services offered to customers EDI provides trucking companies with
the ability to partner with customers and develop initiatives such as ldquoquick responserdquo and ldquojust-in-timerdquo
strategies Trucking companies also employ ldquosatellite trackingrdquo systems for load and equipment tracking
These technologies support trucking company goals of increased efficiencies and provide better customer
service resulting in better relations with customers and other carriers
EDI communications systems at port facilities benefit terminals with accelerated gate
movements greater security better data entry and total better overall facility management Ocean
carriers have more international transactions and prefer EDI Most modes find it necessary to employ
21
EDI technology to communicate with exporters customs brokers freight forwarders port authorities and
government agencies
Many carriers are adopting and enjoying the use of financial EDI This provides for better cash
flow and easier payment methods for customers Many large retailers and manufacturers are using the
technology Electronic funds transfer (EFT) and electronic payment remittance advice are being used
widely Using these technologies are labor savings and provide for error free transactions Given the
number of transactions a large company may have daily the savings may be substantial
Other technologies that provide efficiencies and peace of mind for customers are tracking and
routing Satellite technology uses two-way messaging service provides for improved customer service
helps with measuring performance and provides for better overall customer relations Carriers can use a
combination of Global Positioning System (GPS) and EDI to provide customers with real-time status
information about their shipments Other tracking technoligies include cellular phone communications
UPSs system uses cellular and the software system called MaxiTrac which customers can aquire and
install on their own computer systems
Terminals often use barcoding to keep track of equipment or shipments Transponders or
transmitters are located at the yard entrance and other places within a yard or warehouse As products
are moved these transmitters read the barcode and transfer information to a computer and reporting
location of the product Technological changes also occur in the trucking industry Motor carrier
technology changes in trailers and combinations of trailers continue to change the cost structure of the
trucking industry Safety technology such as anti-lock brake systems and air ride suspension for tractor
and trailer improve trucking quality with less freight damage
The use of cell phones satellite tracking on-board computers and other technological changes
also have improved efficiency in the trucking industry Cell phones can be used to locate loads thereby
reducing search time Automatic billing and electronic data interchange (EDI) may reduce time spent
22
Table 1 Intermodal Survey State TotalsOutbound Business
Number Eastbound Westbound
Export
Rail Car 100 0 100
Trucks 2954 61 39
Containers 8011 65 35
Domestic
Rail Car 1416 55 45
Trucks 32162 57 43
Containers 988 50 50
Inbound BusinessNumber Eastbound Westbound
Import
Rail Car 104 50 50
Trucks 2064 61 39
Containers 813 50 50
Domestic
Rail Car 1034 50 50
Trucks 19162 64 36
Containers 0 0 0
billing and doing accounting procedures EDI is direct computer-to-computer communication that can be
processed by the receiver without re-keying information EDI facilitates the move toward efficiency in
the supply chain (Crum Premkumar and Ramamurthy 1996)
North Dakotarsquos OutboundInbound Intermodal Survey
A survey was conducted of North Dakota businesses Chosen from a combination of the
Department of Economic Development and Finance list of manufacturers in Bismarck and the
Manufacturers Register of the State of
North Dakota A total of 457
businesses were surveyed with 195
responding
The survey identified 8999
containers now being shipped by
truckrail intermodal from North Dakota
(Table 1) This survey did not include
elevators or individual farmers or
groups of farmers now shipping
identity-preserved grain Respondents
identified that the majority of shipments
were from the Southeast portion of the
state The Southeast portion of the state represented some 63 percent of all traffic The Southcentral
area of the state identified the next most traffic There were many more respondents from Southeastern
and Southcentral North Dakota than from the rest of the state Of the 195 respondents 85 were from
Southeastern North Dakota and 28 were from Southcentral North Dakota
23
The respondents in the northwest region identified 17 containers mdash outbound and
inbound This may represent problems associated with the distance to an intermodal loading
facility The northwest region represented a balance for inbound and outbound trucks and
containers The northwest region of North Dakota includes the city of Minot The number of
businesses responding in Ward County was only 10 which does not provide an adequate
representation of the northwest region of North Dakota
Table 2 Intermodal Survey Northwest Region Totals Outbound Business
Number Eastbound Westbound
Export
Rail Car 4 0 100
Trucks 277 50 50
Containers 14 58 42
Domestic
Rail Car 0 0 0
Trucks 838 59 41
Containers 0 0 0
Inbound BusinessNumber Eastbound Westbound
Import
Rail Car 0 0 0
Trucks 293 69 31
Containers 3 50 50
Domestic
Rail Car 0 0 0
Trucks 1150 64 36
Containers 0 0 0
24
The survey identified only truck traffic for the North-central region of North Dakota
Respondents identified no container traffic The survey results are based on respondents and
business density therefore some areas of the state with low volume may not be a true
representation of actual freight flows to and from an area
Table 3 Intermodal Survey North Central Region Totals Outbound Business
Number Eastbound Westbound
Export
Rail Car 0 0 0
Trucks 36 80 20
Containers 0 0 0
Domestic
Rail Car 0 0 0
Trucks 1154 53 48
Containers 0 0 0
Inbound BusinessNumber Eastbound Westbound
Import
Rail Car 0 0 0
Trucks 212 75 25
Containers 0 0 0
Domestic
Rail Car 0 0 0
Trucks 268 40 60
Containers 0 0 0
25
No containers were identified in the northeast region of North Dakota There were only
five respondents from Grand Forks County A previous feasibility study for locating an
intermodal facility at Grand Forks indicates a much larger freight flow from northeast North
Dakota
Table 4 Intermodal Survey Northeast Region TotalsOutbound Business
Number Eastbound Westbound
Export
Rail Car 0 0 0
Trucks 182 50 50
Containers 0 0 0
Domestic
Rail Car 0 0 0
Trucks 249 63 37
Containers 0 0 0
Inbound BusinessNumber Eastbound Westbound
Import
Rail Car 0 0 0
Trucks 53 50 50
Containers 0 0 0
Domestic
Rail Car 0 0 0
Trucks 204 62 38
Containers 0 0 0
26
The southeast region of North Dakota represents the largest freight flow volumes from any
areas in the state This is a combination of business density and willing respondents The
southeast region also is closest to an intermodal loading facility which is located in Dilworth
MN The southeast region identified more than 8000 outbound containers and more than 800
inbound containers This represents a ratio of about 10 to 1 For every 10 containers leaving the
state only one returns loaded There is a cost associated with moving empty containers to
shippers in the state The southeast region also identified more than 20000 trucks originating
freight annually
Table 5 Intermodal Survey Southeast Region TotalsOutbound Business
Number Eastbound Westbound
Export
Rail Car 100 0 0
Trucks 1436 50 50
Containers 7946 65 35
Domestic
Rail Car 50 0 0
Trucks 19164 60 40
Containers 780 50 50
Inbound BusinessNumber Eastbound Westbound
Import
Rail Car 104 50 50
Trucks 1426 75 25
Containers 810 87 13
Domestic
Rail Car 30 100 0
Trucks 14114 68 32
Containers 0 0 0
27
Table 6 shows that respondents reported 208 containers originating in south central North
Dakota The second highest response also was from the south central region of the state This
traffic represents a long drayage movements for empty and full containers to reach an intermodal
loading facility
Table 6 Intermodal Survey South Central Region TotalsOutbound Business
Number Eastbound Westbound
Export
Rail Car 0 0 0
Trucks 4 100 0
Containers 0 0 0
Domestic
Rail Car 1260 60 40
Trucks 7413 56 44
Containers 208 50 50
Inbound BusinessNumber Eastbound Westbound
Import
Rail Car 0 0 0
Trucks 52 50 50
Containers 0 0 0
Domestic
Rail Car 1004 25 75
Trucks 2558 59 42
Containers 0 0 0
28
Respondents from the southwest region of the state reported no container shipments
Outbound truck traffic was significant but the long distance to an intermodal loading facility
makes intermodal shipping impractical because of the high cost of drayage
Table 7 Intermodal Survey Southwest Region TotalOutboundBusines
Number Eastbound Westbound
Export
Rail Car 0 0 0
Trucks 36 67 33
Containers 51 75 25
Domestic
Rail Car 156 50 50
Trucks 3084 49 51
Containers 0 0 0
Inbound BusinessNumber Eastbound Westbound
Import
Rail Car 0 0 0
Trucks 28 50 50
Containers 0 0 0
Domestic
Rail Car 0 0 0
Trucks 868 78 22
Containers 0 0 0
The survey provides some insight into the shipping patterns for North Dakota The low
response rate in some areas of the state may not result in true representation of actual freight
movements
The survey revealed 8999 outbound shipments by container The factor most often
identified by respondents in making shipping mode decisions was price or rate The next factor
respondents identified that determined transportation mode was availability Third on the list
was time or service
29
Economic Census Commodity Flow Survey
Comparisons can be made using the Commodity Flow Survey within the Economic
Census that is compiled every five years covering years ending in two and seven by the United
States Department of Commerce The economic census is the major source of facts about the
structure and functioning of the United States economy The census furnishes an important
framework for such composite measures as the gross domestic product estimate inputoutput
measures production and price indexes and other statistical series that measure short-term
changes in economic conditions
Some of the tables from the Commodity Flow Survey have been replicated here to
provide information as to the type and quantity of freight moving from North Dakota Some
inferences and estimates can be made about truck rail intermodal freight movements from the
data in the CFS
North Dakota Commodity Flow Analysis
North Dakota entities face difficulty in determining the flow of goods to and from the
state Partial data is collected by different organizations but no clear picture exists on the flow
of either manufactured or value added agricultural products The Upper Great Plains
Transportation Institute tracks grain shipments out of the state by mode type and destination
The Commodity Flow Survey data collected by the Department of Commerce provides a snap
shot of freight movement in out of the state every five years
Economic Census Commodity Flow Survey
The following section uses data from the 1997 Commodity Flow Survey from the
economic census to compare transportation trends for North Dakota with National trends Using
30
Commodity Flow Survey (CFS) information provides for estimates in the types of transportation
flows for North Dakota versus National flows and evaluate differences in trends In this survey
framework data are not used that would disclose the operations of an individual firm or
establishment
CFS Inclusions
Modes identified in the CFS are
1 Parcel deliverycourierUS Postal Service2 Private truck3 For-hire truck4 Railroad5 Shallow draft vessels6 Deep draft vessels7 Pipeline8 Air9 Other mode
10 Unknown
Within the tables of the CFS they used eight different classifications or modes They
include
1 Air (includes truck and air)
2 Single modes Shipments using only one of the above-listed modes except parcelor other and unknown
3 Multiple modes Parcel US Postal Service or courier shipments or shipmentsfor which two or more of the following modes of transportation were used
Private truckFor-hire truckRailShallow draft vesselDeep draft vesselPipeline
31
The CFS did not allow for multiple modes in combination with ldquoparcel US Postal
Service or courierrdquo ldquounknownrdquo or ldquootherrdquo By their nature these shipments may already include
various multiple mode activity
4 Other multiple modes Shipments using any other mode combinations notspecifically listed in the tables
5 Other and unknown modes Shipments for which modes were not reported orwere reported by the respondents as ldquootherrdquo or ldquounknownrdquo
6 Truck Shipments using for-hire truck only private truck only or a combinationof for-hire truck and private truck
7 Water Shipments using shallow draft vessel only deep draft vessel only orGreat Lakes vessel only Combinations of these modes such as shallow draftvessel and Great Lakes vessel are included as ldquoOther multiple modesrdquo
8 Great Lakes In the tables ldquoGreat Lakesrdquo appears as a single mode becausemileage calculations are done for only the lakes portion of the movement
The CFS identified shipping within and out of the state of North Dakota Three different
modes are truck rail and air or some combination of two or more modes In the Commodity
Flow Survey (CFS) Economic Census respondents are ask which modes are used for shipments
Table 8 uses data from the CFS and shows shipments by mode from 1993 and 1997 for the whole
US The most notable figures are for all modes where tons increased by 145 percent
Examining truck rail multimode the tonnage increased 335 percent while value decreased
almost 9 percent (Table 8)
Comparing US statistics with the state of North Dakota statistics shows that freight
shipments for North Dakota grew at a much higher rate than that for the average of the US All
categories increased more than the national average Tons of freight originating in North Dakota
32
increased over 44 percent from 1993 to 1997 Comparing North Dakota to the National average
where tons increased by 145 percent This should indicate a growing economy however the
latest statistics on economic growth show that North Dakota lags behind most of the rest of the
nation in many areas This becomes problematic in drawing a conclusion about what is
happening in North Dakota Census Bureau data reveals that the North Dakota economy grew at
an average annual rate of 41 percent in the same time period
There also are gaps in the Commodity Flow data for North Dakota in the multi-modal
section The data is missing because of the nature of the survey where there are few respondents
and the results may not be statistically valid
Table 8 compares the changes in freight shipments from 1993 to 1997 Percentage
change in US freight shipments are compared to the percentage change in North Dakota
shipments by mode value weight and average miles per shipment according to the CFS
33
Table 8 Comparison of United States and North Dakota Shipments
Mode oftransportation
Value Tons Average Miles Per Shipment
PercentChange
USShipments
Percent ChangeNorth Dakota
Shipments
PercentChange USShipments
PercentChange North
DakotaShipments
Percent ChangeUS Shipments
Percent ChangeNorth Dakota
Shipments
All Modes 188 444 145 445 114 54
Single modes 157 465 170 246 -64 353
Truck 131 488 206 448 -1 55
For-hiretruck
105 637 212 542 29 -147
Private truck 160 380 168 307 21 109
Rail 292 599 4 173 3 542
Water 231 - 115 - S -
Air (includestruck amp air)
647 3510 426 2942 -25 373
Pipeline 263 S 278 S S S
On average the value of US shipments grew at a faster rate than tons shipped This
would indicate growth in the shipping of value-added products The largest value increases were
in rail and truckrail parcel This would indicate that the growth in less-than-load (LTL)
shipments are using truckrail intermodal The package companies like UPS or Fed X and other
large package use the railroads to reduce costs for long haul shipments LTL trucking firms also
use the railroads to reduce shipping costs With large volume and consistent business the
railroads strive to meet the rate and service needs of these large customers
34
Table 9 US Shipments by Mode Value Weight and Weight-Distance
Mode oftransportation
Value Tons Ton-miles
1997 1993 percent
change
1997 1993 percent
change
1997 1993 percent
change
All Modes 6943988 5846334 188 11089733 9688493 145 2661363 2420915 99
Single modes 5719558 4941452 157 10436538 8922286 170 2383473 2136873 115
Truck 4981531 4403494 131 7700675 6385915 206 1023506 869536 177
For-hire truck 2901345 2625093 105 3402605 2808279 212 741117 629000 178
Private truck 2036528 1755837 160 4137294 3543513 168 268592 235897 139
Rail 319629 247394 292 1549817 1544148 4 1022547 942897 85
Water 75840 19749 231 563369 505440 115 261747 271998 -38
Air 229062 139086 647 4475 3139 426 6233 1415 555
Pipeline 113497 89849 263 618202 483645 278 S S S
Multiple modes 945874 662603 428 216673 225676 -4 204514 191461 68
Parcel 855897 563277 519 23689 23689 254 17994 13151 368
Truck amp Rail 75695 83082 -89 54246 54246 335 55561 37675 475
Truck amp Water 8241 9392 -123 33215 33215 -512 34767 40610 -144
Rail amp Water 1771 8636 -513 79275 79275 1 77590 70219 105
Other multiplemodes
4269 3216 328 26248 26248 386 18603 S S
Other amp Unknownmodes
278555 242279 150 436521 436521 -192 73376 92581 -207
The CFS statistics that stand out for North Dakota shipments are increases in shipments
originating in North Dakota Shipments increased in value by 44 percent and by 45 percent in
weight (Table 8) This indicates that the nature of the shipments may have remained relatively
constant The most noticeable change from 1993 to 1997 in types of shipments was that in 1997
coal was recognized to make up an estimated 388 percent of all shipments originating in North
Dakota
35
Table 10 Shipment Characteristics by Mode of Transportation for North Dakota 1993 and 1997
Mode oftransportation
Value Tons Average Miles
Per Shipment
1997
(millions
dollars)
1993
(millions
dollars)
Perce nt
Change
1997
(thousands)
1993
(thousands)
Perce nt
Change
1997 1993 Perce nt
Change
All Modes 15999 10527 444 87831 60763 445 244 158 540
Single modes 13647 9315 465 52689 42301 246 151 112 353
Truck 9915 6663 488 25213 17417 448 102 97 55
For-hire truck 4021 2457 637 13410 8698 542 289 339 -147
Private truck 5793 4200 380 11392 8716 307 70 63 109
Ra il 3284 2053 599 25446 21692 173 853 553 542
Water - - - - - - - - -
Air (includes truck
amp a ir)
70 15 351 0 1 - 294 2 1946 1417 373
Pipeline S S S S S S S S S
M ultiple modes
Parcel 850 603 41 29 36 -188 632 349 811
Tru ck amp Ra il 60 S S 75 S S 1305 1996 -346
Truck amp Water - S S- - S S - 2294 -100 0
Rail amp W ater - S S - S S - 1584 -100 0
Other mu ltiple
modes
- - - - - - - - -
Other amp Unknown
modes
642 555 158 35038 18356 909 34 S
Analysis
Using the CFS to estimate potential container truckrail intermodal traffic generated in
North Dakota provides valuable insight into potential intermodal traffic It may only be
necessary to use the national average of intermodal shipments to estimate potential North Dakota
intermodal traffic Because North Dakotarsquos freight types do not mirror the United States
because of the large natural resource base in raw agricultural commodities and coal some
adjustment must be made
36
The CFS survey displayed that North Dakota shipped an estimated 88 million tons in
1997 The Commodity Flow Survey estimated that nationally the portion of all freight that was
truckrail intermodal was 11 percent If North Dakotarsquos truckrail intermodal freight potential
was the same as the national trend then it could be estimated that North Dakota could have
potential of more than 48000 TEUs or 20-foot containers for truckrail intermodal shipments
Factors that determine the shipments include the type of freight distance to an intermodal
facility rates for shipments lift costs or total landed costs of shipments However because
North Dakotarsquos farmers are searching for new ways to market larger portions of the agricultural
products are being shipped direct from the farmer or marketing company in much smaller lots in
container
Because of North Dakotarsquos natural resource-based economy some adjustments must be
made to the CFS numbers An estimation of potential shipments should eliminate the coal and
petroleum-based and other shipments A large portion of North Dakota shipments are large
volume low value raw agricultural products However there is some evidence that consistently
larger portions of raw agricultural commodities are being shipped as identity-preserved product
in smaller lots to a final market for processing Because of this it now is impossible to rule out
raw agricultural commodities for truckrail container intermodal movements An estimation of
potential container movements was made eliminating the previously mentioned commodities
When ruling out this freight only 533 percent of the freight was eligible for truck rail intermodal
leaving North Dakota The next step was to use only the portion of identified freight movements
that were shipped adequate distance to best use the economies of rail Only movements more
than 500 miles were used which was 175 percent Using this method it was estimated that more
37
than 490000 tons of freight potentially could move in containers as truckrail intermodal The
estimated shipments could equate to more than 24500 containers annually if an intermodal
loading facility and acceptable rates and service levels were available
Past studies conducted in North Dakota have indicated smaller results Estimates for a
potential traffic at a proposed site in Casselton ND estimated that current traffic would
generate 13628 containers and within five years from completion of an intermodal loading
facility business volume would grow to more than 47000 containers provided a competitive rate
structure and adequate service levels were met
Leeper Cambridge and Campbell (1996) contacted individual companies to determine
interest in intermodal shipping from a potential Grand Forks intermodal facility The study
estimated the number of lifts in first third and fifth year of operation Table 11 is adapted from
Leeper et al The report estimated an increase from 7857 containers and 1500 trailers in year
one to 18663 containers and 3563 trailers in year five This represents a 138 percent increase in
business in the first five years The report failed to explain existing versus new intermodal
shipments However the Leeper et al study did list one company anticipating using 4000 to
5000 containers and the study identified 1000 of these would be new business
38
Table 11 Anticipated Number of Lifts
Anticipated N umber of Lifts
Grand Forks
Intermodal Facility
Year 1 Year 3 Year 5
ContainerTrailers ContainerTrailers ContainerTrailers
7857 1500 15714 3000 18663 3563
Ada pted from Leep er et al (19 96)
The increased shipments identified in the CFS along with previous study estimates of
potential intermodal traffic indicate that the railroadsrsquo view of intermodal may depend on
variables other than traffic volume The literature review identified reasons for Santa Fersquos
successful container truckrail intermodal venture These reasons included shutting down all
questionable intermodal facilities and concentrating on markets that provide consistently large
volumes resulting in better use of equipment and the best return on investment
Transportation Cost Comparisons
Export freight rates have been on the decline During the last part of the 1980s the cost of
moving a $250 VCR overseas was $30 or 125 percent of the cost of the product (Muller 1999)
In 1997 the cost of moving that same 250 dollar VCR was $3 or one percent of the cost of the
VCR Similarly rates for refrigerated products have decreased along with identity-preserved
agriculture products (Vachal amp Reichert 2000) These rates vary directly on transportation
demand and the balance of shipments
Vachal and Riechert 2000 concentrated on IP grain and discussed freight rates and
logistics costs from the field to the final destination The actual cost of shipping by container
39
may be higher than traditional bulk systems but the logistics of containerized shipping actually
offer ways to reduce costs by taking advantage of services that may be available
Containerization also provides for shippers of smaller lots of grain to be shipped and guarantee
integrity of the product from point of loading to the final destination This product may bring a
premium to the seller or producer as the product meets the criteria specified by the final user
Using rail for the domestic movement may reduce transportation costs and eliminate reloading
expense at a port facility while guaranteeing product quality and quantity
In comparing different transportation methods Vachal and Rieckert used a logistics model
which included storage handling transportation from the field to the farm farm to elevator and
to the final destination Therefore the transportation model involved cost components including
inland drayage inland truck freight ocean freight and inlandocean freight The spreadsheet
model simulated delivery of food-grade soybeans from Iowa to Japan This was packaged in
bags and delivered The illustration in the report used those logistics costs associated with
marketing soybeans truck rail and ocean freight rates and those costs associated with both
containerization and bulk delivery options
Figure 1 illustrates cost per ton of containerization truck and bulk shipments For this
study the important comparison is among truck and containerization Trucking to the coast and
transloading into a container is a costly endeavor and many products would not be competitive in
any market because of transloading costs Moreover trucking costs are related directly to a
backhaul Transporting small quantities of relatively low valued products long distances by truck
requires that the commodity only be charged for its loaded portion of the trip If there is no
backhaul because of specialty equipment or other reasons than the round trip is covered by the
40
Figure 1 Estimated Freight Rates Per-Ton from Central Iowato Japan (Reichert and Vachal 2000)
fronthaul and this almost doubles the trucking costs Vachal and Reichert used no backhaul in
their example which attributes total trip cost to the commodity Figure 1 displays a simulation
from their model and shows cost relationships Bulk grain in unit trains is the least costly
followed by single car then container and finally truck
Using Burlington Northern Santa Fersquos published tariffs moving soybeans to the coast is a
practical method of determining differences in transportation rates Rail rates are available on-
line and can be used to determine costs associated with different methods of transporting goods
Figure 2 illustrates a combination of BNSFrsquos rates and truck costs associated with moving
soybeans to Tacoma from Fargo ND Truck costs were developed from a model developed by
the Upper Great Plains Transportation Institute and provide a reasonable estimate of truck rates
Because the trucking industry in many ways replicates a perfectly competitive industry truck
costs are a good proxy for truck rates Rates were obtained from the Internet to compare costs
41
shipping by truck by container single rail car rate and unit train rail car rate from Fargo ND
except for the container which originates in Dilworth Minn Comparing Vachal and Reichertrsquos
costs and BNSF public rate estimates the relative cost differences are similar however Vachal
and Reichert attempted to capture total logistics costs Considering trucking to the coast in any
other truck equipment type other than a container that can be transloaded as a unit on to a cargo
ship leads to other expenses which increases the difference between container truckrail
intermodal costs and trucking costs Comparing the Vachal and Reichert method with only
inland freight costs to the port it only may be necessary to capture inland freight costs to
determine the least cost method of shipping Total costs of shipping soybeans to Japan using
Vachal and Reichertrsquos total cost method determined that trucking to the coast was almost 130
percent more costly than using a container on the rail If there is no backhaul for the truck then
the costs for the entire trip is attributable to the fronthaul which may occur with specialty
equipment
Using only inland freight costs and if no loads are available on the return trip the costs
of transporting soybeans by truck is $112 per ton This is similar to Vachal and Riechertrsquos
estimation Truck is 80 percent more costly than the rail portion of shipping the container to the
port However other costs do exist with obtaining the container including moving the container
to the loading point drayage to the intermodal facility lifting the container off the truck lifting
the container onto and off of the train and drayage to the final destination or transloading onto the
cargo ship transloading the container off the cargo ship and load it either onto a train or truck
and transport it to the final destination Vachal and Riechert estimated costs other than
transporting at more than $12 per ton They also estimated the ocean portion of the container
42
Figure 2 Transportation Cost Comparisonsof Soybeans from Fargo ND toTacoma
move to Japan at $13 per ton and total costs using truck at just more than $134 per ton Using
their estimation of $25 per ton for ocean freight and other costs added to the truck cost estimates
of $112 for the truck portion of the movement at $137 it is close to their estimate of $134
Figure 2 shows land cost comparisons shipping from Fargo to Tacoma The truck costs
represent a 100 percent backhaul This means the cost is only attributable one way Trucking is
still more costly by 42 percent at $68 per ton Considering the transloading charges would
increase it another $12 per ton the intermodal option is much less costly
However shipping east to Chicago using BNSF rates it is less expensive to use a truck
not including transloading Comparing truck costs to Chicago from Dilworth compared with
container truckrail intermodal from Dilworth to Chicago The one-way truck costs estimate
would be $28 per ton compared to the rail only portion of the movement at almost $34 per ton
Adding drayage at both ends of the movement makes the truckrail intermodal movement an
unlikely option on the 600-plus mile movement
43
Examining BNSF rates out of Chicago and Dilworth to Tacoma it was discovered that
the published rate from Chicago to Tacoma is less than the published rate from Dilworth to
Tacoma even though from Chicago to Tacoma is more than 600 miles farther BNSFrsquos
Intermodal Public Rate Retrieval also exposed that their rate from St Paul to Tacoma for the
same equipment is the same as from Chicago to Tacoma even though St Paul is about 400 miles
closer to Tacoma then Chicago (June 2001)
Actual rates are negotiated between the transportation provider and the shipper Many
times shippers use third parties such as a logistics company freight forwarders or brokers to
provide total transportation services These providers may prepare all documentation arrange all
transportation and may provide these services at less cost because of the volume they represent
Shipper associations are another avenue worth exploration by shippers Shipper
associations are viewed as a shipper and must be granted the same rights as shippers and cannot
be discriminated against by transportation providers Because they represent volume they may
have the leverage to negotiate better rates and service levels than an individual shipper Many
times shippersrsquo associations do not provide services such as export documentation or regulation
guidance so it may be important to use other third party providers for those services (Vachal and
Reichert 2000)
Containerization of specialty grains and oil seeds is increasing because of the demand for
smaller shipments with specific specification or characteristics In 1998 sunflowers were
transported by container 88 percent of the time and hops went by container 100 percent of the
time Also large quantities of soybeans move in containers Reasons for containerization is that
the bulk transportation system has inadequately transported the product resulting in co-mingling
44
of product with unwanted product and or the quantities demanded were small and therefore the
shipment did not meet the requirements of bulk movements
Impact on North Dakota
It is difficult to determine the impact on North Dakota the limited truckrail container
intermodal freight option has Quantifying intermodal traffic is difficult and potential
intermodal traffic is even more illusive Determining the impacts on North Dakota businesses
communities and the entire state is an impossible task
Economic factors influence freight rates which in-turn affect the competitive nature of
industry in North Dakota The senario may be that with a competitive freight rate businesses
could become more competitive domestically and internationally which would generate more
business creating more volume causing more economic activity and freight volume creating more
competition etc Therefore it is difficult to quantify the economic impact not having a
competitive intermodal loading facility in North Dakota may have on businesses communities
and the state
Problems are apparent when comparing products moving domestically by truck or
truckrail container intermodal and distance is the key for rate savings out of North Dakota
BNSF published rates for truckrail container intermodal to Tacoma are the same using either
Chicago or St Paul as an origin even though it is much closer to Tacoma from St Paul than
Chicago The published rate from Dilworth to Tacoma is more than the rate from Chicago to
Tacoma
45
Model
TruckRail Container Intermodal Terminal Costs
Bierman Bonini and Hausman (1991) describe a model as a simplified representation of
an empirical situation Variables are classified as decision variables exogenous variables
intermediate variables policies and constraints or performance measures (Bierman Bonini and
Hausman 1991) Decision variables are under the control of the decision maker Other types of
variables affect the model but their values cannot be determined by the decision maker
Exogenous or external variables are outside the decision makers control Intermediate
variables are used to relate decision variables and exogenous variables to performance measures
(Bierman Bonini and Hausman 1991) Exogenous and intermediate variables are represented
in various places throughout the model
Using the previously discussed modeling principles a spread sheet model was developed
to simulate costs for an intermodal facility This model was developed to provide decision
makers with an estimate of start-up and annual costs
Intermodal Facility Costs
Variables represented on sheet one of the model include the initial capital investment
The model is changeable and can be used to estimate costs from a proposed business plan which
includes the size and type of facility Sheet two has performance measures that are the total
investment costs and annual operating costs Sheet three includes sensitivity analysis to evaluate
the costs associated with different levels of investment
46
Firm Characteristics
The spread sheet model was developed to evaluate costing options for an intermodal
facility A facility could vary in size equipment configuration accommodations (reefer etc)
and different options require different levels of investment Different levels of investment
require different traffic volumes to cover expenses or costs
The model consists of changeable fixed and variable cost sections to replicate different
sizes and configurations of facilities allowing for scenario analysis purposes This provided a
range of investment levels for decision making purposes
Costs and Sensitivity Analysis
The spreadsheet model was developed to estimate costs associated with a particular
intermodal facility The strength of using a spreadsheet model is its flexibility for a decision
maker The user has options over a wide range of data for different operational characteristics
and input prices reflecting a specific business plan A determination may be made as to the
feasibility of a particular facility by using the model
A second strength of the model is its ability to run sensitivity analysis over a wide range
of variables This allows a decision maker the options of changing investment decisions at the
outset The model was developed using initial assumptions with the use of sensitivity analysis to
determine investment costs by changing these initial investment decisions
47
Base Case
Assumptions for the base case scenario were developed The base case is based on an 80
acre facility with 5000 feet of track two powered switches and two internal switches To fence
the perimeter of 80 acres on three sides requires 3960 feet of fence It is assumed that 40 acres
of the 80 would be paved There is a need for six work lights and six reefer hookups A 1500
square foot building would be built for office and storage space This facility would need one
lifter one hustler two chassis and no forklifts There would be a manager and four yard
employees Table 12 shows the initial assumptions along with possible options
Table 12 Assumptions and Options for the Base Case Scenario from Sheet One of theIntermodal Feasibility Costing Model
Land acres 80 Cost per acre $200000
Feet of track 5000 Cost per foot of track $10000
No of powered 2 Cost of powered $13000000
No of fence feet 2640 Cost of fence per foot $1000
Acres of pavement 40 Cost per acre $1000000
No of work lights 6 Cost of lights $1000000
No of reefer hookups 6 Cost of reefer hookup $200000
Square feet of building 1500 Cost per square foot $5000
Feet of water line 1000 Cost per foot $1000
Feet of sewer line 1500 Cost per foot $2000
No of lifters 1 Cost of lifter $50000000
No of hustlers 1 Cost of hustlers $5000000
No of forklifts 0 Cost of Forklifts $2500000
No of Chassis 2 Cost of Chassis $500000
Facility Estimated 20 Equipment Estimated 15
Tax rate 5 Insurance 5
Interest rate 8 Estimated Facility Life 20 Years
Maintenance and repair Variable
48
The quantitative expressions of objectives that managers are trying to achieve are
performance measures (Bierman Bonini and Hausman 1991) Sheet two of the spreadsheet
model provides a cost summary which is the performance measures for the model The model
provides performance measures in the form of a total investment estimates and estimated annual
costs
Table 13 Investment for the Base Case Intermodal Facility
Land $16000000
Track $50000000
Powered Switches $26000000
Internal Switches $16000000
Fence $3960000
Building $7500000
Office Equipment $600000
Lighting $6000000
Reefer Hookups $1200000
Water Line $1500000
Sewer Line $3000000
Total $147760000
Total equipment cost is the next portion of the model In the base case there is one lifter
one hustler and two chassis Total equipment estimated investment is $560000 The total
estimated investment for the base case scenario is $2037600
The model has a section with depreciation formulas both for the facility which includes
track switches and the building and also a section for equipment depreciation The yard or
facility expense portion of the model includes taxes insurance maintenance and repair and
49
return on investment (Table 14) The section also lists variable costs including direct and
indirect labor costs accounting and fuel costs The last two categories are building expenses
and management and sales expense
The next portion of the model shows the performance measures in annual fixed variable
and total costs (Table 14) Annual operating costs provide a decision maker estimates of
business volume needed to be successful
Table 14 Annualized Costs for the Base Case Intermodal Facility
Fixed Costs
Land and Track Depreciation $5110400
Equipment $2986700
Taxes Insurance Maintenance and Repair Return on Investment
$20715600
Management $4580000
Building Expense $736500
Variable Costs
Wages $9160000
WC and SS $1099200
Benefits $641200
Accounting $250000
Fuel $2080000
Total $47059600
The base case facility assumptions include 80 acres of land with 40 acres paved one
container lifter two chassis and one hustler and a 1500 square foot building The base case
50
included 5000 feet of track four switches work lights and electrical hookups for reefer units
The annual costs of operating the facility estimated by the model are $470596
Return on investment (ROI) is a large portion of annual costs ROI can be considered as
interest on debt capital or return on equity investment (Casavant 1993) This may be reduced
depending on the type of facility required Used equipment may be purchased however repair
costs would increase or a short line railroad could use existing track and eliminate the need to
invest in switches and track The rest of this chapter will be devoted to sensitivity analysis of
investment variables
Sensitivity Analysis
Sensitivity analysis displays the change in the performance measures by varying a
decision or exogenous variable (Bierman Bonini and Hausman 1991) Lotus 123 has a
function for performing ldquowhat-if analysisrdquo which determines the modelrsquos sensitivity to a given
variable ldquoWhat-if tablesrdquo can be developed providing performance measures as one or two
variables are changed over a range of values The intermodal facility costing modelrsquos sensitivity
analysis shows the decision maker cost relationships in the model Understanding cost
relationships may help a manager minimize total annual costs Variables chosen for sensitivity
analysis include equipment investment building investment track and switch investment labor
costs and the number of lifts required to meet costs
Lifts Costs and Volume
It is estimated that lift costs at Dilworth Minn are in a range from $10 to $15 per lift
(Leeper et al 1996) This is only an estimate lift costs are dependent on other factors Other
factors associated with intermodal transportation costs are the drayage costs and rail costs
51
Drayage is the trucking costs associated with moving the container or trailer to and from the
intermodal facility These costs vary depending on several factors and are not considered within
the model
Drayage costs or trucking costs are estimated at $113 per mile (Berwick and Dooley
1996) The farther from the source increases costs associated with drayage and total
transportation charges A tradeoff exists among the economies associated with intermodal
freight transportation and drayage distance At some point drayage costs switching transloading
of the container overcome the economies of rail transportation
Changing costs for the facility will change the number of lifts needed to cover costs
Table 15 shows the relationship of volume and costs associated with the base case intermodal
facility and assumptions
Table 15 Number of Lifts and Fixed Variable and Total CostsLiftsYR Fixed Costslift Varible Coslift Total Costslift
2000 $169 $66 $235
4000 $85 $33 $118
6000 $56 $22 $78
8000 $42 $17 $59
10000 $34 $13 $47
12000 $28 $11 $39
14000 $24 $9 $34
16000 $21 $8 $29
18000 $19 $7 $26
20000 $17 $7 $24
22000 $15 $6 $21
24000 $14 $6 $20
26000 $13 $5 $18
28000 $12 $5 $17
30000 $11 $4 $16
32000 $11 $4 $15
As volume increases costs per lift decrease as a result of economies associated with
utilization of resources (Table 15) Costs vary depending on the initial investment
52
Figure 3 Equipment Investment versus TotalCosts
Total Investment and Annual Costs
The model performs well over a wide range of different scenarios Varying investments
in equipment results in much small increases in annual costs Figure 3 shows the difference in
total costs with the different levels of equipment investment
A similar relationship exists between investment in track and annual cost estimates
Varying track investment from $50000 to $800000 increases annual costs by $111150 (Table
16)
53
Table 16 Change in Annual Cost with Different Levels of Track Investment
Track
Investment
Annual Operating
Costs
$50000 $403905
$100000 $411725
$150000 $418725
$200000 $426135
$250000 $433545
$300000 $440955
$350000 $448365
$400000 $455775
$450000 $463185
$500000 $470595
$550000 $478005
$600000 $485415
$650000 $492825
$700000 $500235
$750000 $507645
$800000 $515055
This scenario analysis reports relationships that exist between input variables and costs
The equipment and track scenario show that with large increases in capital investment there is a
relatively smaller increase in annual costs Increasing track investment from $50000 to
$100000 only increases total annual costs by 15 percent and as $50000 investment increments
are added the percentage of increase is reduced
54
Table 17 shows the modelrsquos response in varying track and equipment variables The table
is read by seeking investment for equipment and investment for track and aligning the column
and row
Table 17 Equipment and Track Investment Decisions and Total Annual Cost
The relationship between equipment investment and total annual costs and track
investment and total annual cost is that as investment increases in these items total annual costs
increases at a relatively smaller rate This may provide insight into under investing in a facility
Lack of capacity because of fear of overexposure or overinvesting may handicap the operation
and prevent performance needed with increased volume and result in less than desirable customer
service However increasing track investment from $50000 to $800000 does increase annual
costs by $111150 or more than $9000 per month
55
CONCLUSIONS
This study provides a snapshot of truckrail container intermodal shipping in and out of
North Dakota Cost estimates for an intermodal facility also are presented The study revealed
the benefits of intermodal transportation including lower overall transportation costs increased
economic productivity and efficiency reduced congestion and burden on over-stressed highway
infrastructure higher returns from public and private infrastructure investments reduced energy
consumption and increased safety
The Commodity Flow Survey conducted by the Commerce Department was analyzed to
estimate possible container shipments from North Dakota The CFS survey displayed that North
Dakota shipped an estimated 88 million tons in 1997 The Commodity Flow Survey estimated
nationally that the portion of all freight that was truckrail intermodal was 11 percent If North
Dakotarsquos truckrail intermodal freight potential was the same as the national trend then it could
be estimated that North Dakota could have the potential of more than 48000 TEUs or 20-foot
containers for truckrail intermodal shipments Factors determining the shipments include the
type of freight distance to an intermodal facility rates for shipments lift costs or total landed
costs of shipments However because North Dakotarsquos farmers are searching for new ways to
market and demand for identity-preserved commodities larger portions of the agricultural
products are being shipped direct from the farmer or marketing company in much smaller lots in
container
Because of North Dakotarsquos natural resource-based economy some adjustments must be
made to the CFS numbers An estimation of potential shipments should eliminate the coal and
petroleum-based and other shipments A large portion of North Dakota shipments are large-
56
volume low-value raw agricultural products However there is some evidence that consistently
larger portions of raw agricultural commodities are being shipped as identity-preserved product
in smaller lots to a final market for processing Because of this it is now impossible to rule out
raw agricultural commodities for truckrail container intermodal movements An estimation of
potential container movements was made eliminating the previously mentioned commodities
When ruling out this freight only 533 percent of the freight was eligible for truck rail intermodal
leaving North Dakota The next step was to use only the portion of identified freight movements
that were shipped adequate distance to best use the economies of rail Only movements of more
than 500 miles were used which was 175 percent Using this method it was estimated that more
than 490000 tons of freight potentially could move in containers over truckrail intermodal The
estimated shipments could equate to more than 24500 containers annually if intermodal loading
facilities were available along with acceptable rates and service levels
Lower transportation costs are realized with container intermodal shipping by using each
mode for the portion of the trip for which it is best suited However it was discovered that the
BNSF published rates for shipping a container out of Dilworth to Tacoma were higher than
shipping that same container out of Chicago It also was discovered that BNSF published rates to
Chicago from Dilworth would cost more than trucking the 600-plus miles With the convenience
and time factors associated with trucking or unless a reduced rate could be negotiated with the
railroad trucking would be the less expensive mode
A survey developed for this study identified containers now being shipped in and out of
the state This survey asked about a companies freight and expected growth The survey results
estimates that 8999 containers leave the state annually The Southeast portion of the state
57
represented some 63 percent of all traffic and more than 90 percent of all truckrail container
intermodal traffic The two main factors contributing to the majority of container traffic
originating in the Southeast are location of an intermodal loading facility and the size and
number of businesses located in Fargo and surrounding areas The Southcentral area of the state
identified the next most traffic There were many more respondents from Southeastern and
Southcentral North Dakota than from the rest of the state Of the 195 respondents 85 were from
Southeastern North Dakota and 28 were from Southcentral North Dakota
A spreadsheet model was developed to estimate costs associated with starting an
intermodal loading facility in North Dakota The model in this study has many useful features
Costs can be estimated for different equipment configurations and sizes of facilities The base
case estimated and investment of more than $2 million and operating expense at more than
$400000 annually Sensitivity analysis provided insight into investment decisions where the
proportions of annual operating costs increased at a much lower rate than proportionately larger
investment costs This leads to the conclusion that underinvesting may limit capacity of the
loading facility limiting potential of handling larger volumes
The truckrail container intermodal shipping problem in North Dakota is circular in
nature Problems exist in the form of rates and service Rates are high and service levels low
because there is no volume and there is no volume because rates are high and service levels are
low
58
59
REFERENCES
Babcock Michael W Eugene R Russell Marvin Prater amp John Morrill State Shortline Railroads and the Rural Economy Topeka KS Kansas Department of TransportationJune 1993
Berwick M amp Dooley F Truck Costs for OwnerOperators Mountain Plains Consortium No 97-81 Upper Great Plains Transportation Institute North Dakota State UniversityFargo October 1997
Bierman H Bonini C amp Hausman W Quantitative Analysis for Business Decisions 8th ed Richard D Irwin Inc Homewood IL 1991
Burlington Northern Santa Fe Corporation ldquoBNSF Intermodal Public Rate Retrievalrdquolthttpwwwbnsfcomgt (July 2 2001)
Burlington Northern Santa Fe Corporation ldquoBNSF Public Rate Retrievalrdquolthttpwwwbnsfcomgt (June 20 2001)
Burlington Northern Santa Fe Corporation 1999 Burlington Northern Santa Fe CorporationAnnual Report 1999
Casavant K Basic Theory of Calculating Costs Applications to Trucking Upper Great PlainsTransportation Institute No 118 North Dakota State University Fargo 1993
Corkhill M ldquoIntermodal Shakeoutrdquo Chemical Week v162 32-35 (September 20 2000)
Coyle J Barbi E amp Novak R Transportation 4th ed West Publishing Company St Paul MN 1994
Crum M Premkumar G amp Ramamurthy K ldquoAn Assessment of Motor Carrier Adoption UseAnd Satisfation With EDIrdquo Transportation Journal Summer 1996
Dooley F Economies of Size and Density for Short Line Railroads Mountain PlainsConsortium No 91-2 Upper Great Plains Transportation Institute North Dakota StateUniversity Fargo 1991
Dooley F Bertram L amp Wilson W Operating Costs and Characteristics of North DakotaGrain Trucking Firms Upper Great Plains Transportation Institute No 67 NorthDakota State University Fargo 1998
Ellis E ldquoGrowing The Businessrdquo Trains Magizine v60 3 14 (March 2000)
Ellis E ldquoOn Time Isnrsquot Good Enoughrdquo Trains Magizine v60 7 40 (July 2000)
60
Fess P amp Warren W Accounting Principles South-Western Publishing CompanyCincinnati OH 1990
Giblin J ldquoMission Impossible Making Rail Intermodal Profitablerdquo Trains Maginzine v58n7 p64(4) (July 1998)
Lang D ldquoTime To Rethink Intermodalrdquo Railway Age 51(1) (October 1998)
Leeper Cambridge amp Campbell Grand Forks Intermodal Study and Implementation Plan McLean VA June 1996
Muller Gerhardt Intermodal Freight Transportation 3rd ed Eno Transportation FoundationInc Virginia 1995
Muller Gerhardt Intermodal Freight Transportation 4th ed Eno Transportation FoundationInc Virginia 1999
Reichert H amp Vachal K Identity Preserved Grain (Logistical Overview) Mountain PlainsConsortium No 143 Upper Great Plains Transportation Institute North Dakota StateUniversity Fargo January 2000
Spraggins Barry H ldquoThe Potential for International Movements of Goods from Alberta to theUS and Mexicordquo 39th Transportation Research Forum Annual meeting Proceedings Montreal Canada October 16-18 1997
United Pacific Corporation 1999 United Pacific Corporation Annual Report 1999
United Stated Department of Agriculture North Dakota 1997 Commodity Flow SurveyTransportation Washington US Department of Commerce 1999
United Stated Department of Agriculture United States 1997 Commodity Flow SurveyTransportation Washington US Department of Commerce 2000
Vachal K Annual North Dakota Elevator Marketing Report 1999-2000 Mountain PlainsConsortium No 139 Upper Great Plains Transportation Institute North Dakota StateUniversity Fargo November 2000
Wallace RD (1997 April) ldquoIntermodal A Flawed Masterpiecerdquo Railway Age v198 n4945(7) (October 1998)
WWD ldquo97 Volume Rises 187 for Intermodal Shippingrdquo 175 n55 (March 24 1998) 13
61
APPENDIX A mdash Explanation of Intermodal Equipment
62
Intermodal Equipment
This section gives brief descriptions of intermodal equipment An intermodal facility
could have all or part of the equipment listed below There are many different intermodal
options that could be used for a facility depending on volume infrastructure needed and product
characteristics The intermodal equipment listed below comes from Gerhardt Mullerrsquos 3rd
Edition of Intermodal Freight Transportation
Cranes
Cranes of all types are used to move containers from ship-to-shore or truck-to-train etc
The most widely used is the rail mounted gantry crane It is built in the form of a bridge
supported by a trestle at each end This is used mostly at ports to load and unload ships and has
wheels so it can be moved from one pier to the other A hinged boom crane is mounted so it can
pivot at its base
Straddle Carriers
Straddle carriers lift heavy loads to a minimum height for short-distance travel and are
used to transfer containers to and from cranes These straddle cranes also can be used to stack
containers Some straddle carriers are equipped with computer control systems used for direction
and control of the straddle carrier and identification of containers
Stacking Cranes
The rubber-tired gantry crane is a hybrid falling between the gantry crane and straddle
carrier It is fashioned after the ship loading gantry without the boom and its purpose is to stack
containers on the ground It has the ability to stack containers higher and wider than the straddle
carrier
63
Forklift trucks
Forklifts come in many sizes and varieties and these machines perform many tasks
These machines can move palletized freight or containers themselves depending on their size
Forklifts have given way to roadstakers which are similar to forklifts but have the ability to
reach over obstacles such as chassis tracks railcars etc
Container Handlers
Container handlers move stack and load containers like forklift trucks but use an
overhead boom rather than the underlift principle
Yard Hostels
There is a variety of chassis-moving container handling equipment This equipment is
referred to by different names including yard horses hustlers mules or terminal tractors This
equipment is mainly used at a terminal or port but closely resembles an over the road tractor or
truck
Lifting Wheels
This device is attached to a hostel and allows for the operator to raise lower attach and
detach trailers without changing the trailersrsquo dolly wheels The lifting wheel gives the hostel a
unique advantage over ordinary tractors and allows for quick attach and detaching expediting
trailer movement
Intermodal Transfer Point
Line-haul intermodal equipment container-handling equipment enters the intermodal
terminal where containers are transferred between terminal equipment and line-haul equipment
This is the intermodal interchange
64
Container Chassis
A chassis is rail marine and over-the-road equipment This equipment is designed to
handle containers and trailers Chassis come in sizes compatible with containers however there
are adjustable chassis These slide to accommodate the size container needing to be transported
Chassis Flipper
Because of valuable space at terminals chassis are stacked The chassis flipper stands the
chassis vertically Chassis take up only 10 percent of the space stacked versus not stacked
Containers
Containers are the vehicle of choice used to encase the product for an intermodal
movement The number of container boxes have been growing at an increasing rate The
number of containers grew from 82 million in 1994 to 108 million in 1997 Ocean carriers
account for 52 percent of ownership leasing companies some 47 percent and the rest are split
among private and container transport companies
Containers come in many sizes and types Dry freight containers are either 20 or 40 feet
long There is also a 40-foot high cube container refrigerated containers The estimated cost of
a 20-foot dry freight container is between $2000 and $3000 and a 40-foot container is between
$3100 and $4500
For low volume usersrsquo leasing the container may be less costly than purchase Muller
reported that high costs are associated with empty container movements This problem exists
for some North Dakota shippers with less inbound freight than outbound and desiring to use the
intermodal shipping options
65
APPENDIX B mdash Model Explanation
66
TruckRail Container Intermodal Terminal Costs
Bierman Bonini and Hausman (1991) describe a model as a simplified representation of
an empirical situation Variables are classified as decision variables exogenous variables
intermediate variables policies and constraints or performance measures (Bierman Bonini and
Hausman 1991) Decision variables are under the control of the decision maker Other types of
variables affect the model but their values cannot be determined by the decision maker
Exogenous or external variables are outside the decision makers control Intermediate
variables are used to relate decision variables and exogenous variables to performance measures
(Bierman Bonini and Hausman 1991) Exogenous and intermediate variables are represented
in various places throughout the model
Using the previously discussed modeling principles a spread sheet model was developed
to simulate costs for an intermodal facility locating on a short line railroad This model was
developed to provide decision makers with an estimate of start-up and annual costs
Intermodal Facility Costs
Variables represented on sheet one of the model include the initial capital investment
The model is changeable and can be used to estimate costs from a proposed business plan which
includes the size and type of facility Sheet two has performance measures which are the total
investment costs and annual operating costs Sheet three includes sensitivity analysis to evaluate
costs associated with different levels of investment
Firm Characteristics
The spread sheet model was developed to evaluate costing options for an intermodal
facility A facility could vary in size equipment configuration accommodations (reefer etc)
67
and different options require different levels of investment Different levels of investment
require different traffic volumes to cover expenses or costs
The model consists of changeable fixed and variable cost sections to replicate different
sizes and configurations of facilities allowing for scenario analysis purposes This provided a
range of investment levels for decision making purposes
Fixed Costs
The fixed cost portion of the model includes land track and switches fence pavement
and concrete lighting and electrical building options equipment options depreciation
insurance repair taxes and interest These costs all are changeable within the model providing
a wide range of options Depreciation insurance maintenance and repair and interest are a
percentage of the investment In the following section these costs are described individually
Land
Within the land section of the model is the price per acre and the number of acres
required These variables are changeable to accommodate different situations For instance a
company contemplating a facility may already have usable land therefore diminishing the level of
investment needed Conversely a company may need to purchase land near a source of business
which may be a large investment along with needed improvements For the base case land was
priced at $2000 and the number of acres was set at 80 Eighty acres would be more than large
enough for the facility at 1742400 square feet This would allow for ample storage and room
for loading and unloading This dollar amount was arbitrary which could be less or more
depending on the location and current use of the land In rural areas land may be a small portion
of the investment needed but in an urban area land is a large portion of the investment
68
Track and Switches
This section of the model estimates the investment in track and switches There are six
entries possible shown in Table B1 These entries need to reflect decisions made at the outset
from a business plan The estimate of track costs and distance are from a 1996 study The Grand
Forks Intermodal Study amp Implementation Plan was done by Leeper Cambridge and Campbell
Table B1 Track and Switch Costs from the Intermodal Facility Spreadsheet Costing Model
Column
Row A B
5 Dollars per foot of track $100
6 Number of feet 5000
7 Number of powered switches 2
8 Cost of powered switches 130000
9 Number of internal switches 2
10 Cost of internal switches 80000
The track portion of the model allows for many different scenarios Track may already
exist and switches may be in place or a new siding may be needed This section of the model
allows for flexibility and entries for different operations The number and type of switches will
vary If the siding is new switches will be needed An existing siding will have switches
Powered switches may not be required Only two switches would be needed if siding is used as
the loading area Another possibility on a short line is that loading is on a no traffic section of
existing track
69
Fence Pavement and Concrete Lighting and Electrical
Depending on the level of security and desire to keep children animals and other
potential problems out of the site a fence may be required This section allows varying the
length and cost of the fence It is simply multiplying the number of fence feet times the cost per
foot This could be a rather substantial investment if it is desired to have a secure yard The base
case allows for 3960 feet of fence This is enough fence for the perimeter of the yard The cost
is estimated at $10 per foot (Dakota Fence)
Next is pavement and concrete This section simply allows an entry for the number of
acres and the cost of either asphalt or pavement In some cases a gravel yard may serve instead
of pavement or concrete There also may be a combination possibility of some pavement and the
rest gravel The cost per acre is simply multiplied by the number of acres However in some
cases the entire yard may not be paved For instance building space would not be paved
There is a section for lights electrical and reefer hookups Electrical components will
vary with size of the facility and expectations for its type of business For instance it may be
determined that no reefers will be used or no loading will occur at night which would lessen the
electrical investment The base case estimates loading lights cost $10000 each while reefer
hookups are estimated at $2000 each The base case calls for six lights and six reefer hookups
70
Table B2 Fence Pavement and Lighting and Electrical from the Intermodal FacilitySpreadsheet Costing Model
ColumnRow A B14 Fence15 No of fence feet 396016 Cost of fence per foot 101718 Pavement or Concrete19 Acres of Pavement 4020 Cost per acre of pavement 10002122 Lighting and Electrical23 No of lights 624 Cost of lights 1000025 No reefer hookups 626 Cost of hookups 2000
Building Options
This section includes size and cost of the building and costs of water and sewer to the
building The building cost is based on square footage times the size of the building The
building estimate is 1500 square feet at $50 per square foot
Water and sewer lines are cost per foot times the length of the line Water and sewer are
based on the use of city water lines and sewer If built in a rural area additional costs for a well
and septic system would exist The sewer is estimated at $20 per foot and water is estimated at
$15 per foot Building options are determined by the decision maker and may or may not exist
Some facilities may be able to be operated from an existing building lowering overall costs
71
Table B3 Building Options from the Intermodal Facility Spreadsheet Costing Model
ColumnRow A B28 Building Options29 Sq ft of building 150030 Cost per square foot 5031 Feet of water line 100032 Cost per foot 1533 Feet of sewer line 150034 Cost of sewer line 20
Equipment Options
Within the equipment portion of the model the decision maker has the options of lifters
hustlers forklifts and chassis The decision maker may choose the number of each and a cost
factor associated with each piece of equipment The cost factor would depend on equipment
choices New versus used equipment and if the equipment is used if reconditioning was
necessary There also is a fuel consumption entry This cell is linked to the variable cost portion
of the model This section gives the decision maker choices of different equipment depending on
the size and type of facility to be built
Table B4 Equipment Choices from Intermodal Facility Spreadsheet Costing ModelColumn
A BRows Equipment Options
36 Number of lifters 137 Cost of container lifters $50000038 Fuel consumptionhr 539 Number of hustlers 140 Cost of hustlers $5000041 Fuel consumptionhr 542 Number of forklifts 043 Cost of forklifts $2500044 Fuel consumptionhr 245 Number of chassis 246 Cost of chassis $5000
72
Office Equipment
Another portion of the model gives the decision maker the option of making entries for
office equipment There is a section for furniture and electronics The decision maker can enter
zero if a category is not valid This may happen where a short line railroad or third party uses
existing offices or office equipment to operate the intermodal facility
Table B5 Office Equipment from Sheet One of the Intermodal Spreadsheet Costing Model
Column
Rows A B
1 Computer $2500
2 Fax Machine $300
3 Phones $1000
4 Communication Equipment $1000
5 Desk $500
6 Chairs $200
7 Counter $500
Depreciation Equipment Taxes Insurance Interest and Maintenance and Repair
This section of the model uses percentages and time to determine costs associated with
different levels of investment The method allows a decision maker to adjust percentages or the
time factor for different interest insurance or depreciation rates
Depreciation is divided into facility and equipment to allow for different estimated useful
life (EUL) The decision maker can adjust time for different types of equipment or facilities
Depreciation is the cost of using up capital and should reflect the portion of useful life used
during a specified time period (Fess and Warren 1990) Equipment and the facility were
73
depreciated on the straight-line basis Depreciation was calculated by subtracting the salvage
value from the purchase price and dividing this figure by the EUL Salvage values and EULs are
difficult to estimate Salvage value primarily depends on the condition of equipment and type of
maintenance performed
Taxes and insurance are related to a percentage of value of the investment The tax levied
may vary by location and different types of taxes imposed Insurance also may vary with location
and company of issue These variables also are adjustable by the decision maker
Interest rates and terms vary depending on the level of investment and the risk perceived
by the lender The rate and term can be changed by the decision maker to meet different levels
and lengths of financing A rate also is used for return on investment andor a hurdle rate It is
common for companies to set a desired return for investments or hurdle rate which is used to
screen potential investments
Maintenance and repair costs vary with use With higher use there are higher costs A
percentage of the value of the equipment times a rate per hour will provide an estimate of the
cost of maintaining the equipment This is variable in the model Higher levels of repair would
be associated with older or used equipment The maintenance and repair formula is based on
new price for equipment The farther the cost of equipment deviates from new cost the higher
maintenance and repair
Variable Cost Components
The next part of the model is the variable cost components This includes a section for
direct and indirect labor costs Other costs included in the variable cost portion are electricity
water sewer building insurance office supplies and accounting services
74
Wages and Indirect Costs
This portion allows for the number of employees hourly rate hours worked and weeks
per year worked Indirect costs cover workers compensation social security match and benefits
Workers compensation social security match and benefits are based on a percentage of wages
There also is a section for management and sales staff which is based on the cost of hourly
employees This variable is difficult to estimate and would vary according to the type of facility
and the business plan of a proposed facility If the facility is based on a few businesses or a
single business there may be no need for management or sales staff Another scenario may
include the use of existing staff to manage and sell the services of the intermodal facility The
model is set to record management and sales costs at half of total wages This results in a
managerrsquos annual salary of $45000
Electricity Water and Sewer Building Insurance Office Supplies and Accounting Services
Other costs included in the variable cost portion are electricity water sewer building
insurance office supplies and accounting services These costs would vary depending on the
type of facility built the size of the building and if the facility was run using existing staff and
facilities If an existing facility is used costs should be portioned equally to use
Electricity water sewer office supplies and accounting services depend on volume used
Insurance would be a percentage of value and would depend on the value of the building
75
Table B6 Variable Cost Components of the Intermodal Spreadsheet Costing Model
Column
Rows A B
1
2 Variable Cost Components
3 No of Salaried Employees 2
4 Salary $25000
5 No of Hourly Employees 2
6 Hourly rate $10
7 Hours Per Week 40
8 Weeks Per Year 52
9 Fuel Cost Gallon $1
10 Workman Comp 5
11 Social Security match 7
12 Benefits 7
13 Management and Sales 50
14 Electricity $100
15 Water $50
16 Sewer $20
17 Insurance 5
18 Office Supplies $500
19 Accounting $2500
76
77
APPENDIX C mdash Intermodal Container Survey
78
Shipper SurveyND Strategic Freight Analysis
Conducted byUpper Great Plains Transportation Institute
December 2000
79
If 3 and 4 NO - No Additional Information Needed
1 Shipper (Company) ___________________________________________________
2 Name ___________________________________________________
Title ___________________________________________________
Telephone ____________________________ Email __________________________________
Do you arrangemanage transportation for your company (if no who) ____________________________
3 Do you receive truckload railcar or container shipments (other than grain) Yes No
4 Do you ship truckload railcar or container shipments (other than grain) Yes No
5 Do you use a freight forwarder or a broker for transportation Yes No
6 Do you use containers in your freight plan Ship Y N Receive Y N
5-1 If no could containers be an option to receiveship Yes No
52 If no why not ___________________________________________________
7 Do you receive or ship internationally Ship Y N Receive Y N
8 What factors affect your decision on choosing a shipment mode and carrier (eg price time equipment)
__________________________________________________________________________________
9 What is the average distribution of annual inboundoutbound shipments percent by quarter
1st Qtr of Year 2nd Qtr of Year 3rd Qtr of Year 4 th Qtr of Year Total
Traffic
Distribution
100
Service
Availability
Rank 1=poor
2=good
3=excellent
80
10 OUTBOUND Business Volume
Export
E-1 Eastbound W estbound
Rail Cars
Trucks
Containers
Domestic
DO-1 Eastbound W estbound
Rail Cars
Trucks
Containers
Container Traffic in TEU
11 INBOUND Business Volume
ImportI-1 Eastbound W estbound
Rail Cars
Trucks
Containers
Domestic
DI-1 Eastbound W estbound
Rail Cars
Trucks
Containers
Container Traffic in TEUs
12 Expected Business Growth by 2005 ___________
- Introduction
-
- Objective
- Methodology
- Implications
- Report Organization
-
- Literature Review
-
- Characteristics of Intermodal Transportation
- Intermodal Transportation Facilitators
- Motor Carriers
- Short Line Railroads
- Intermodal and Class I Railroads
- Transportation Technology
- North Dakotarsquos OutboundInbound Intermodal Survey
- Economic Census Commodity Flow Survey
- North Dakota Commodity Flow Analysis
-
- Economic Census Commodity Flow Survey
- Analysis
- Transportation Cost Comparisons
- Impact on North Dakota
-
- Model
-
- TruckRail Container Intermodal Terminal Costs
- Intermodal Facility Costs
- Firm Characteristics
- Costs and Sensitivity Analysis
-
- Base Case
-
- Sensitivity Analysis
-
- Lifts Costs and Volume
- Total Investment and Annual Costs
-
- Conclusions
- References
- Appendix A mdash Explanation of Intermodal Equipment
- Appendix B mdash Model Explanation
- Appendix C mdash Intermodal Container Survey
-