north east lubbock master plan
DESCRIPTION
Lubbock Master Plan - North East LubbockTRANSCRIPT

CITY OF LUBBOCK | MASTER DEVELOPMENT PLAN

NORTH & EAST LUBBOCK
MASTER DEVELOPMENT PLAN
City of Lubbock, Texas
Adopted by the Lubbock, Texas
City Council
the 28th day of October, 2004

� Marc McDougal � Gary Boren � Jim GilbreathMayor District 3 District 6
� Linda DeLeon � Phyllis Jones � TJ PattersonDistrict 1 District 4 Former Councilmember
� Floyd Price � Tom Martin � Victor HernandezDistrict 2 District 5 Former Councilmember
Acknowledgements
i
NNORORTHTH & E& EASTAST LLUBBOCKUBBOCK
AC K N O W L E D G E M E N T S
master development plan
Lubbock City Counci l
Steer ing Committee Members
� Greg JonesAmerican State Bank
� Chuck KeyKey Residential
� Gary LawrenceMarket Lubbock, Inc.
� Velma LithnedgeNeighborhood Representative
� Eddie LoveNeighborhood Representative
� Ysabel LunaNeighborhood Representative
� David MartinezAttorney at Law
� Corbin PembertonCity of Lubbock - Parks & Recreation
� Maggie TrejoNeighborhood Representative
� Esther SepedaLubbock Hispanic Chamber
� Tom StocktonTyco
� Irasema VelasquezAFLAC
� Randy AndrewsGraco Real Estate
� Ron BetenboughBetenbough Construction
� Matt BumsteadUnited Supermarkets
� Richard ButlerTexas Tech Chancellor�s Office
� Frank CastanedaJosie�s Restaurant
� Billie CavielCaviel�s Pharmacy
� Alice ChavezNeighborhood Representative
� Carolyn Thompson ConwrightLISD
� Regji DavisAfrican American Chamber of Commerce
� Gilbert FloresCounty Commissioner
� Greg GarrisonPan-Tex Plywood and Lumber
� Dr. Heenan JohnsonDrs. Johnson and Johnson

ii
NNORORTHTH & E& EASTAST LLUBBOCKUBBOCK
AC K N O W L E D G E M E N T S
master development plan
� John E. HallExecutive DirectorNorth & East Lubbock CDC
� Rob AllisonManagerBusiness and Neighborhood Development
� Craig FarmerManaging DirectorPlanning and Transportation
City Staff
Gould Evans AffiliatesKansas City, Missouri
San Antonio, Texas
Hammer, Siler, George AssociatesDenver, Colorado
Silver Spring, Maryland
Texas Mezzanine FundDallas, Texas
Prepared By:
With Assistance From:

ONE INTRODUCTION .................................................................1-1� Introduction 1-2
� Regional Context 1-3
� Demographic Comparisons (City of Lubbock vs. Study Area) 1-4
� Planning Process 1-6
TWO PHYSICAL ASSESSMENT ........................................................2-1� Introduction 2-2
� Existing Property Analysis 2-3
� Developabil ity Analysis 2-11
� Site Developabil ity Rating 2-18
� Redevelopment Tools 2-21
THREE MARKET ANALYSIS .............................................................3-1� Introduction 3-2
� Housing Market 3-3
� Retail Market 3-8
FOUR DEVELOPMENT WORKSHOP .................................................... 4-1� Introduction 4-2
� Steering Committee Meeting One 4-2
� Public Meeting 4-3
� Steering Committee Meeting Two - Alternatives 4-7
� Community Revitalization 4-8
� Corridors 4-9
� Build on Amenities 4-10
� New Town 4-11
� Vision and Goals 4-12
FIVE PREFERRED DIRECTION ........................................................5-1� Introduction 5-2
� A Cluster Development Concept 5-2
� Other Key Concepts 5-6
Table of Contents
iii
NNORORTHTH & E& EASTAST LLUBBOCKUBBOCK
TA B L E O F CO N T E N T S
master development plan
sect ion t i t le page number

SIX SPECIALIZED MARKET ANALYSIS .............................................6-1� Residential 6-2
� Commercial 6-8
� Outlet Malls 6-16
SEVEN SITE DESIGN......................................... .......................... 7-1� Introduction 7-2
� Site 1 - University 7-3
� Site 2a - Erskine 7-8
� Site 2b - Hunt 7-11
� Site 3 - Canyon Lakes 7-15
� Form and Function 7-18
EIGHT PLAN IMPLEMENTATION ........................................................8-1� Introduction 8-2
� Study Area Implementation 8-3
� Infrastructure/Public Works 8-3
� Public Policy 8-8
� Economic Development 8-11
� Housing 8-14
� Organizational Strategy 8-16
� Area-Wide Available Tools 8-17
� Specific Site Implementation 8-18
� Site 1 - University 8-18
� Site 2a - Erskine 8-21
� Site 2a - Pro Forma 8-23
� Site 2b - Hunt 8-30
� Site 3 - Canyon Lakes 8-31
� Matrices 8-32
iv
NNORORTHTH & E& EASTAST LLUBBOCKUBBOCK
TA B L E O F CO N T E N T S
master development plan
sect ion t i t le page number

ONE INTRODUCTION .................................................................1-11-A Regional Context 1-3
1-B Location of Study Area 1-3
1-C Population Trend Comparison Between Lubbock and Study Area 1-4
1-D Income Comparison, 2000 1-5
1-E Planning Process 1-6
TWO PHYSICAL ASSESSMENT ........................................................2-12-A Physical Conditions Map 2-4
2-B Property Ownership Map 2-7
2-C Existing Land Use Map 2-9
2-D Floodplain Map 2-11
2-E General Soils Map 2-13
2-F Transit Routes Map 2-14
2-G Sanitary Sewer Map 2-16
2-H Water Line Map 2-16
2-I Neighborhood Association Map 2-17
2-J Site Developabil ity Model 2-19
2-K Site Developabil ity Map 2-20
THREE MARKET ANALYSIS .............................................................3-1
FOUR DEVELOPMENT WORKSHOP ....................................................4-14-A Location of Place of Residence or Employment of Participants 4-6
4-B Preferred Direction Process Diagram 4-7
4-C Community Revitalization Alternative 4-8
4-D Corridor Alternative 4-9
4-E Build on Amenities Alternative 4-10
4-F New Town Alternative 4-11
FIVE PREFERRED DIRECTION ........................................................5-15-A Preferred Direction Map - Core Community Revitalization 5-3
5-B Location of Development Sites 5-12
Figures
v
NNORORTHTH & E& EASTAST LLUBBOCKUBBOCK
F I G U R E S
master development plan
sect ion t i t le page number

SIX SPECIALIZED MARKET ANALYSIS .............................................6-16-A Site 1 Trade Area 6-9
6-B Site 2a Trade Area 6-13
6-C Outlet Malls in Texas 6-18
SEVEN SITE DESIGN...................................................................7-17-A Location of Development Sites 7-2
7-B Site 1 and Vicinity 7-3
7-C Existing Land Use - Site 1 7-3
7-D Site 1 - University 7-6
7-E Site 2a and Vicinity 7-7
7-F Existing Land Use - Site 2a 7-7
7-G Site 2a - Erskine 7-9
7-H Site 2b and Vicinity 7-11
7-I Existing Land Use - Site 2b 7-11
7-J Site 2b - Hunt 7-14
7-K Site 3 and Vicinity 7-15
7-L Existing Land Use - Site 3 7-15
7-M Site 3 - Canyon Lakes 7-17
EIGHT PLAN IMPLEMENTATION ........................................................8-18-A Implementation Through Public Policy 8-2
8-B Direct Bus Routes and Branch Transfer Hub 8-4
8-C How NMIC Will Work 8-19
vi
NNORORTHTH & E& EASTAST LLUBBOCKUBBOCK
F I G U R E S
master development plan
sect ion t i t le page number

ONE INTRODUCTION .................................................................1-11-A Population by Race and Ethnicity 1-5
TWO PHYSICAL ASSESSMENT ....................................................... 2-12-A Top Ten Land Owners 2-6
2-B Existing Land Use 2-8
THREE MARKET ANALYSIS .............................................................3-13-A Population and Housing, Lubbock County 3-3
3-B Housing Production, Lubbock County 3-4
3-C Residential Distribution 3-5
3-D Sales Price of Housing 3-6
3-E Housing Demand Profi le 3-7
3-F Retail Expenditures by Lubbock County Residents, 2003-2020 3-10
3-G Retail Sales by Source 3-11
3-H Retail Sales, Lubbock County, 2003-2020 3-12
3-I Retail Space Growth Demand 3-13
3-J Retail Space Distribution 3-14
3-K Growth and Replacement Retail Space Demand, Lubbock Co. 2003-2020 3-15
FOUR DEVELOPMENT WORKSHOP ....................................................4-1
FIVE PREFERRED DIRECTION ........................................................5-1
SIX SPECIALIZED MARKET ANALYSIS .............................................6-16-A Income by Tenure, North & East Lubbock 6-3
6-B Housing Price Points 6-4
6-C Annual Turnover 6-5
6-D Annual Demand by Price Points, North & East Lubbock 6-5
6-E Target Project Capture Rates and Demand 6-7
6-F Retail Potential, North Lubbock Trade Area Residents and Students 6-11
6-G Retail Potential, East Lubbock Trade Area Residents 6-14
6-H Outlet Malls in Texas 6-17
6-I New Outlet Malls Opened Nationally 6-19
Tables
vii
NNORORTHTH & E& EASTAST LLUBBOCKUBBOCK
TA B L E S
master development plan
sect ion t i t le page number

SEVEN SITE DESIGN...................................................................7-1
EIGHT PLAN IMPLEMENTATION ........................................................8-18-A Development Profi les 8-23
8-B Site Development Costs 8-23
8-C Housing Unit Cost Profi le 8-24
8-D Residential Absorption and Pricing 8-25
8-E Lot Sales Revenue 8-25
8-F Building Costs Assumptions 8-26
8-G Building Operating Assumptions 8-26
8-H Financing Assumptions 8-27
8-I MLK Commercial Project, Base Case 8-28
8-J Erskine Site - Commercial Development 8-28
8-K MLK Commercial Project - 10 Year Pro Forma 8-29
8-L MLK Commercial Project - Sensitivity Analysis 8-29
8-M Infrastructure/Public Works Matrix 8-32
8-N Public Policy Matrix 8-35
8-O Economic Development Matrix 8-37
8-P Housing Matrix 8-39
8-Q Organizational Strategy Matrix 8-40
Tables
viii
NNORORTHTH & E& EASTAST LLUBBOCKUBBOCK
TA B L E S
master development plan
sect ion t i t le page number

SS ECTIONECTION OO NENE
II NTRODUCTIONNTRODUCTION
master development plan

In the fall of 2003, the City of Lubbock and the North &
East Lubbock Development Advisory Committee (NELDAC)
initiated the North & East Lubbock Master Development
Plan project. This plan was created by citizens, city staff,
shareholders, and local elected officials to provide guid-
ance on future community development issues. The plan
provides a future vision for the study area, a set of com-
mon goals in which to strive, and a pathway of steps to
attain these goals. In addition, the plan also provides
more detailed analysis and development strategies on cho-
sen specific sites to attract short-term investment and
development interest.
The North & East Lubbock Master Development Plan is
intended to provide a framework for future development
decisions in North & East Lubbock and be used as a “tool”
to accomplish the following:
• Foster general decision-making as an
implementation guide for the development of the
defined study area
• Build a long-range development strategy with
targeted short-range initiatives that enhance the
overall environment
• Establish a study area wide framework in which
future investments may be integrated in a cohesive
manner.
• Seek to achieve a quality of life reflecting the vision
and goals set forth by the community
CITIZEN DRIVEN PLAN
Introduction
1-2
NNORORTHTH & E& EASTAST LLUBBOCKUBBOCK
IN T R O D U C T I O N
master development plan
“BREAKING GROUND” ON THE FUTUREOF NORTH & EAST LUBBOCK

The City of Lubbock, Texas is located in
northwestern Texas, just south of the pan-
handle. In driving distance, Lubbock is
approximately 346 miles west of Dallas,
174 miles east of Roswell, NM; and 124
miles south of Amarillo. Lubbock is con-
nected to Amarillo by Interstate 27, and
is the most southern point on Interstate
27.
The City of Lubbock is both the county
seat and largest municipality in Lubbock
County. In 2000, the U.S. Census
Bureau reported Lubbock as having a
total population of 199,564. Lubbock is
home to Texas Tech University. In 2003,
Texas Tech had an enrollment of 27,569
students and has been quickly approach-
ing an enrollment of 30,000 students.
The North & East Lubbock Study Area is
located in the northeastern portion of
Lubbock. The study boundary is (clock-
wise) the city limits, East 34th Street,
Interstate 27, 4th Street, and University.
The area is approximately 31 square
miles in size.
FIGURE 1-B: LOCATION OF STUDY AREA WITHIN LUBBOCKSOURCE: GOULD EVANS AFFILIATES
Regional Context
1-3
NNORORTHTH & E& EASTAST LLUBBOCKUBBOCK
IN T R O D U C T I O N
master development plan
FIGURE 1-A: REGIONAL CONTEXTSOURCE: GOULD EVANS AFFILIATES
UN
IVER
SITY
34TH ST
4TH ST

For over 50 years, Lubbock has experienced steady growth in its total population.
Since 1950, Lubbock’s population has increased by just under 180%. In more recent
years (between 1990 and 2000), Lubbock’s population grew by 7%.
During the same 50-year period, North & East Lubbock has experienced an out-migra-
tion of people. From 1960 to 2000, the study area’s population decreased from 34,416
to 18,365 people (or 47%). The largest decennial decrease in population occurred
between 1980 and 1990. During this 10 year period, the population dropped by almost
24%. Future projections forecast a continued loss in population. Between 2000 and
2010, the study area population is expected to decrease by roughly 4%.
The North & East Lubbock Study Area is more diverse than Lubbock as a whole. In
2000, over 48% of the study area classified their ethnicity as Hispanic. Also in 2000,
over 40% of the study area’s residents were Black and 10% White. At the same time,
Lubbock was comprised of 28% Hispanic, 9% Black, and 61% White.
Historic trends show that a greater percentage of North & East Lubbock’s total popula-
tion is minority, compared to 30 years ago. However, the study area’s overall minority
population has decreased too. Since 1990, the White population has decreased by over
500 residents (2%), the Black population has decreased by 750 residents (2%), and
the Hispanic population has increased by 300 residents (4%).
Population Trends (1960-2000)
-
50,000
100,000
150,000
200,000
1960 1970 1980 1990 2000Lubbock Study Area
FIGURE 1-C: POPULATION TREND COMPARISON BETWEEN LUBBOCK AND STUDY AREA (1960-2000)SOURCE: U.S. CENSUS
Demographic Comparisons (City of Lubbock vs. Study Area)
1-4
NNORORTHTH & E& EASTAST LLUBBOCKUBBOCK
IN T R O D U C T I O N
master development plan

FIGURE 1-D: INCOME COMPARISON, 2000SOURCE:: U.S. CENSUS
In 2000, The North & East Lubbock Study Area had both the lowest average household
income and per capita income when compared to Lubbock and Lubbock County. The
U.S. Census showed the study area with an average household income of $32,087.
This was 40% lower than the city’s household average of $45,075. The study area’s
per capita income for 2000 was $10,399. Lubbock’s per capita income was almost 70%
higher at $17,510. In both household and per capita income, Lubbock County was
slightly lower than the city’s average at $44,712 (household) and $17,323 (per capita).
Study Area Lubbock Study Area LubbockPopulation 19,239 186,206 18,365 199,564 Hispanic 8,561 41,916 8,865 54,786 Non-Hispanic White 2,370 125,475 1,834 122,330 Non-Hispanic Black 8,225 15,483 7,445 16,907 Non-Hispanic Other 83 3,332 221 5,541
Study Area Lubbock Study Area LubbockPopulation 100.0% 100.0% 100.0% 100.0%Hispanic 44.5% 22.5% 48.3% 27.5%Non-Hispanic White 12.3% 67.4% 10.0% 61.3%Non-Hispanic Black 42.8% 8.3% 40.5% 8.5%Non-Hispanic Other 0.4% 1.8% 1.2% 2.8%
1990 2000
1-5
NNORORTHTH & E& EASTAST LLUBBOCKUBBOCK
IN T R O D U C T I O N
“The study area’s
per capita incomefor 2000 was
$10,399.”
master development plan
TABLE 1-A: POPULATION BY RACE AND ETHNICITYSOURCE:: U.S. CENSUS
$-
$10,000
$20,000
$30,000
$40,000
$50,000
Average Household Income Per Capita Income
Study Area Lubbock City Lubbock County

Recognizing that portions of northern and
eastern Lubbock were in serious disre-
pair, the City of Lubbock and the North &
East Lubbock Development Advisory
Committee (NELDAC) decided to take
action. The solution was to create a
comprehensive master development plan,
a plan that would represent the future
goals of the area residents, a plan that
would depict a clear direction for the
future and a way to achieve this desired
future.
The North & East Master Development
Plan was prepared through an extensive
community participation process. A
broad based steering committee com-
prised of local community and business
leaders was formed to give ongoing
advice and input to the project planning
team. Acting as the “eyes and ears” of
the study area’s residents, the steering
committee was the link between the proj-
ect team and the general public.
Additionally, a town hall style meeting
was held so area residents and business
leaders could express their concerns, pri-
orities, and future goals.
The intent of this process was to seek a
wide range of public input so that the
community has a broader understanding
and sense of ownership of the plan.
FIGURE 1-E: PLANNING PROCESSSOURCE:: GOULD EVANS AFFILIATES
Planning Process
1-6
NNORORTHTH & E& EASTAST LLUBBOCKUBBOCK
IN T R O D U C T I O N
master development plan
Planning Process Diagram

The North & East Lubbock Master Development Plan
planning process was broken down into eight basic
tasks. The eight tasks were the following:
1. Development Framework2. Development Workshop3. Interim Report4. Specialized Market Analysis5. Definition of Specific Projects6. Implementation7. Plan Preparation8. Plan Presentation
The first three tasks focused on the entire study area.
Physical characteristics, redevelopment opportunities,
and market conditions were all analyzed. The analysis
was incorporated with the citizen input to get a
desired future, or preferred direction. Written reports
were produced and submitted to city officials after
completion of each of the initial three tasks. The pur-
pose of the reports were to document the process and
analysis that produced the preferred direction of North
& East Lubbock.
Tasks four through six were more detailed and specific
in nature. They described the steps and strategies
required to achieve the preferred direction. In addi-
tion, four specific sites in the study area were chosen
for further analysis. For each chosen site a market
analysis, as well as site development and implementa-
tion strategies were created. The desired outcome is
that the chosen development sites will become cata-
lysts for achieving the community’s desired future.
Tasks seven and eight involved the finalization and
adoption of the plan itself.
PUBLIC MEETING BREAK-OUT GROUP
1-7
NNORORTHTH & E& EASTAST LLUBBOCKUBBOCK
IN T R O D U C T I O N
master development plan
GROUND BREAKING CEREMONY
STEERING COMMITTEE MEMBERS

SS ECTIONECTION TT WOWO
PP HYSICALHYSICAL AA SSESSMENTSSESSMENT
master development plan
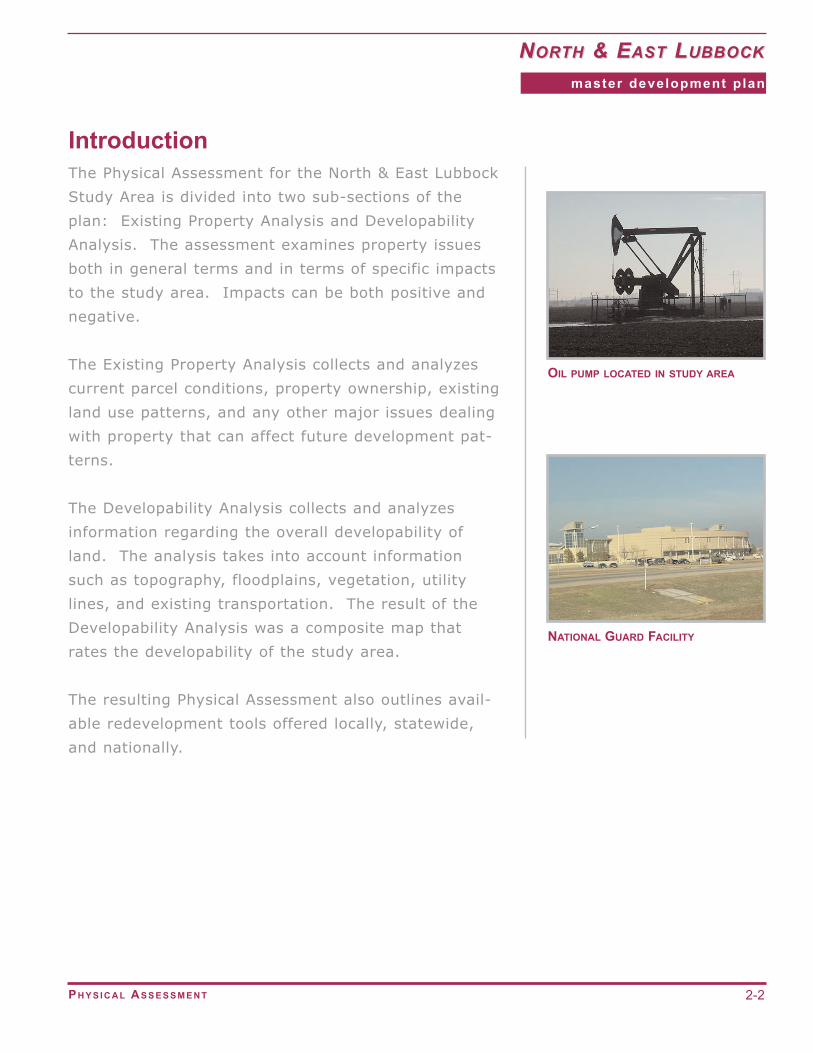
The Physical Assessment for the North & East Lubbock
Study Area is divided into two sub-sections of the
plan: Existing Property Analysis and Developability
Analysis. The assessment examines property issues
both in general terms and in terms of specific impacts
to the study area. Impacts can be both positive and
negative.
The Existing Property Analysis collects and analyzes
current parcel conditions, property ownership, existing
land use patterns, and any other major issues dealing
with property that can affect future development pat-
terns.
The Developability Analysis collects and analyzes
information regarding the overall developability of
land. The analysis takes into account information
such as topography, floodplains, vegetation, utility
lines, and existing transportation. The result of the
Developability Analysis was a composite map that
rates the developability of the study area.
The resulting Physical Assessment also outlines avail-
able redevelopment tools offered locally, statewide,
and nationally.
NATIONAL GUARD FACILITY
Introduction
2-2
NNORORTHTH & E& EASTAST LLUBBOCKUBBOCK
PH Y S I C A L AS S E S S M E N T
master development plan
OIL PUMP LOCATED IN STUDY AREA

An inventory of the existing property is
needed so city officials and residents will
have a better understanding of the exist-
ing overall conditions to better direct
future resources to areas of the commu-
nity that are in greatest need.
A block-by-block inventory of the existing
property conditions was undertaken for
the study area. The property inventory
was conducted from the adjacent street
or right-of-way. After viewing the exist-
ing housing units and/or vacant property
on a given block, a composite rating was
given to the entire block or portion of
block. A rating system of good, fair, and
poor condition was used. The “good”
category includes housing that is well
kept, well maintained, and structurally
sound. The “fair” category is housing
that is generally well kept. However,
neglect in certain areas is apparent and
may be deteriorating. The “poor” cate-
gory can be described as housing that is
severely dilapidated. Severe neglect is
visible on most areas of the structure
and/or property.
The ratings were determined after view-
ing various physical characteristics in the
study area. The physical characteristics
include the condition of the foundation,
roof, siding, and overall appearance. In
addition, neglect to the property and lack
of maintenance and upkeep of the paint,
gutters, garages, carports, patios, decks,
yard, and any other potential amenity or
additional structures was noted. The
existence and quantity of debris, trash,
and scrap was also taken into account.
The following map (Figure 2-A) illustrates
the result of the property condition
inventory. The graphic shows which por-
tions of the study area were rated in
good condition (pink), fair condition
(red), poor condition (brown), and unde-
veloped (gray).
Undeveloped is the largest category in
terms of acreage and defined as yet to
be developed into a use more intense
than agriculture. Over 8,150 acres were
classified as undeveloped. The highest
concentration of undeveloped land is
located outside of Loop 289, on the outer
edges of Lubbock.
Land classified as “good” was second
largest in acreage with over 5,150 acres.
The vast majority of land classified as
“good” is publicly owned. City parks, the
airport, schools, fire departments,
national guard, and golf courses were all
considered in good condition. Fewer pri-
vately owned commercial, residential, or
Existing Property Analysis
2-3
NNORORTHTH & E& EASTAST LLUBBOCKUBBOCK
PH Y S I C A L AS S E S S M E N T
master development plan
Property Condit ions
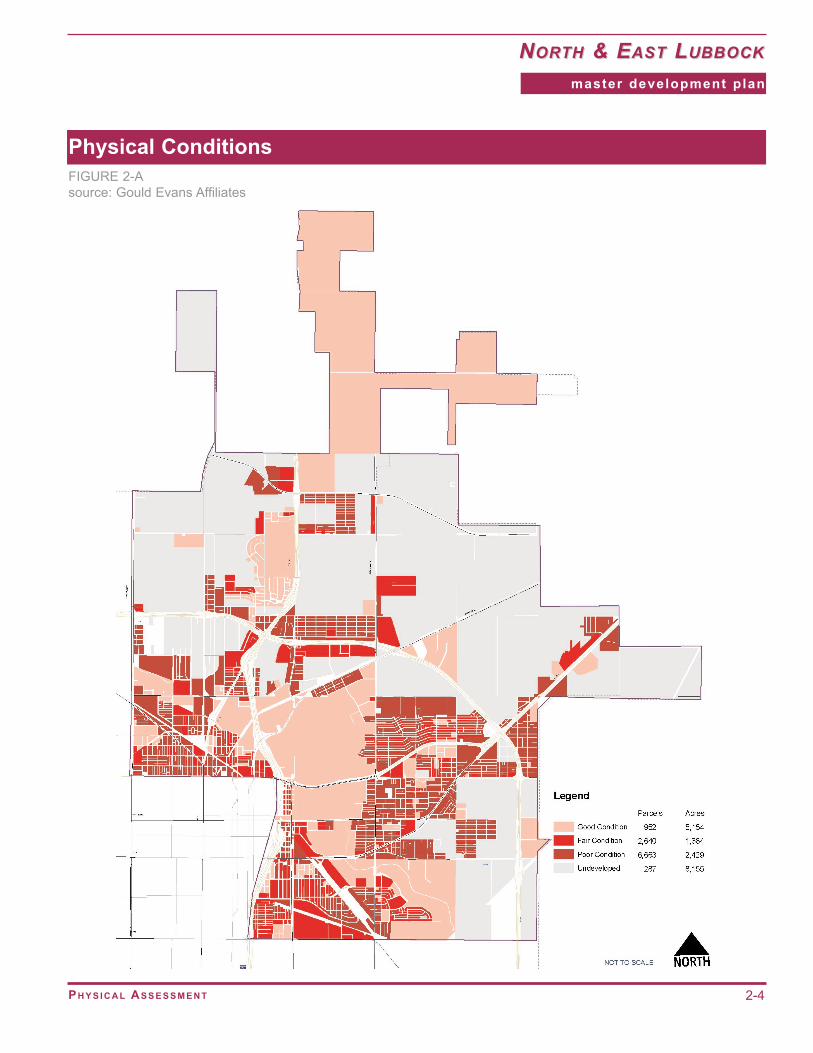
Physical Conditions
2-4
NNORORTHTH & E& EASTAST LLUBBOCKUBBOCK
PH Y S I C A L AS S E S S M E N T
master development plan
FIGURE 2-Asource: Gould Evans Affiliates

industrial properties were in good condition. However,
high concentration areas of “good” private property
can be found northwest of the I-27/Loop 289 junction,
along University, and around the Parkway/Zenith
intersection.
Fair condition property was the lowest in total acreage
with under 1,400 acres. However, more residential
property was classified as fair than good. Over 2,600
parcels were considered in fair condition; most of
these were privately owned. Areas that have the
highest concentration of fair conditions are located
southwest of the 19th Street/Martin Luther King inter-
section and in the Cherry Point Neighborhood.
Property classified as being in poor physical condition
was third in size based on its 2,429 acres. However,
poor physical conditions were the most prevalent in
terms of number of parcels with 6,663. Residential
neighborhoods is the study area generally received
the most poor ratings. Property of poor condition was
generally found to be highest inside Loop 289.
The path from vision to implementation is less difficult
when owners of multiple parcels and large tracts of
land are known and are involved in the planning
process.
There are over 10,500 parcels of land within the study
area totaling over 17,000 acres in size. Out of the
10,542 parcels, almost 2,800 are owned by an entity
that controls at least five or more parcels in the study
area. The largest individual owner of land, in terms of
EXAMPLE OF HOUSING IN STUDY AREA
2-5
NNORORTHTH & E& EASTAST LLUBBOCKUBBOCK
PH Y S I C A L AS S E S S M E N T
master development plan
Ownership Patterns
EXAMPLE OF HOUSING IN STUDY AREA

number of parcels and size, is the City of Lubbock with 269 parcels totaling 4,215
acres. This represents almost 25% of the total parcel acreage in North & East
Lubbock. Other public entities that are major property owners include LCAD, Urban
Renewal, the State of Texas, and the Lubbock Housing Authority. Swartz & Brough
Incorporated is the largest private sector property owner at 122 parcels. The chart
below lists the ten largest landowners in North & East Lubbock. The eleventh category
represents the remainder of the property owners who own five or more parcels and the
total acreage they represent.
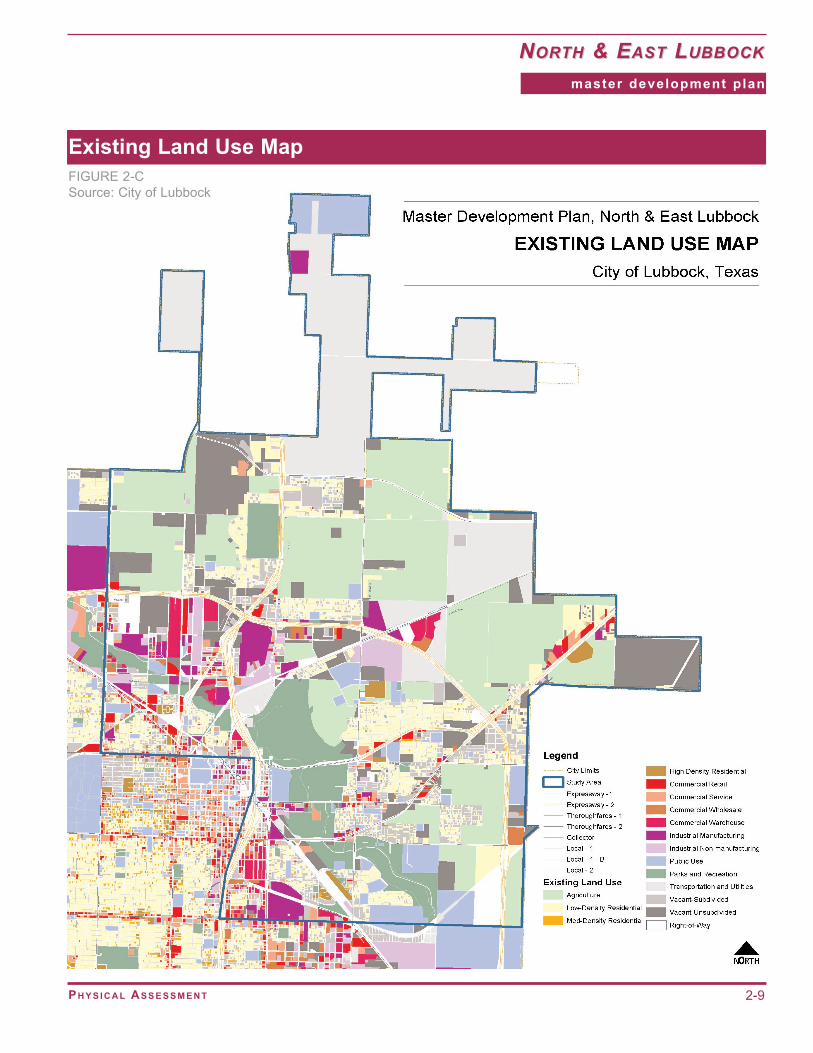
Analysis of the existing land use patterns helps give a better understanding of the
types of uses present in the study area, the percentage makeup of each use, and the
inter-relationship between neighboring uses. Sixteen classifications of use, determined
by the City of Lubbock, exist in the study area. They range from Agriculture to
Industrial Manufacturing. The largest land use, Agriculture, comprises over 4,800
acres, representing 28% of the total land use area. The second largest land use,
Transportation and Utilities, comprises over 3,000 acres, or 18% of the total land use
area. (The Lubbock International Airport is included in the Transportation and Utilities
Top Ten Land Owners by Number of ParcelsOwner # of Parcels Acres % of Total
1 City of Lubbock 269 4,215.35 54%2 LCAD 144 41.60 1%3 Urban Renewal 118 75.74 1%4 Swartz & Brough Inc. 112 19.70 0%5 State of Texas 111 31.86 0%6 Panhandle South Plains 93 68.28 1%7 Lubbock Housing Authority 87 17.43 0%8 Guadalupe Economic Services 61 23.05 0%9 Llamas Juilo T & Rosa L 57 9.76 0%
10 Lubbock Habitat 51 7.07 0%11 Other 1,694 3,313.02 42%
2797 7,822.86 100%
TABLE 2-A: TOP TEN LAND OWNERSSOURCE: CITY OF LUBBOCK
2-6
NNORORTHTH & E& EASTAST LLUBBOCKUBBOCK
PH Y S I C A L AS S E S S M E N T
master development plan
Exist ing Land Use

Property Ownership
2-7
NNORORTHTH & E& EASTAST LLUBBOCKUBBOCK
PH Y S I C A L AS S E S S M E N T
master development plan
FIGURE 2-Bsource: Gould Evans Affiliates

category.) The smallest land use catego-
ry is Rights-of-way, which is only 25
acres in size (less than 1%). The follow-
ing chart lists the sixteen classifications,
their size, and their percent of the total
area.
Agriculture, Vacant-subdivided, and
Vacant-unsubdivided constitute 46%, or
almost 8,000 acres of the total land use
for the study area. This land has little or
no existing structural development. With
dilapidated structures already razed or
land yet to be developed, the land in
these three categories is typically less
expensive and time consuming for devel-
opment or redevelopment process. Other
development factors must be analyzed
before deciding to develop a random
vacant property. However, for the North
& East Lubbock study area, vacant land
presents an opportunity for future growth
and development.
The study area contains an existing land
use pattern that is piecemeal in nature.
Residential neighborhoods are divided
from one another by five-lane arterial
roads, highways, elevated freeways,
topographic conditions, and railroad
lines. These barriers isolate both local
neighborhoods from one another and
from areas outside the study area.
Commercial and retail uses located in the
study area are found along some of the
major transportation corridors. These
corridors include Avenue Q, Parkway,
Idalou, University, and Martin Luther
King.
The Existing Land Use Map can be found
on the following page. Agriculture,
Vacant-subdivided, and Vacant-unsubdi-
vided land uses are located throughout
the study area. The Agriculture and
Vacant-unsubdivided categories typically
contain larger size parcels, Vacant-subdi-
vided parcels tend to be smaller in size.
Land Use Acres % Land Use Acres %Agriculture 4,810 28% Industrial Manufacturing 549 3%Low-Density Residential 1,458 9% Industrial Non-manufacturing 349 2%Medium Density Residential 13 0% Public 1,277 7%High-Density Residential 120 1% Parks & Recreation 1,473 9%Commercial Retail 198 1% Transportation & Utilities 3,089 18%Commercial Service 178 1% Vacant-subdivided 1,029 6%Commercial Wholesale 254 1% Vacant-unsubdivided 2,128 12%Commercial Warehouse 173 1% Right-of-way 25 0%
TABLE 2-BSOURCE: GOULD EVANS AFFILIATES
2-8
NNORORTHTH & E& EASTAST LLUBBOCKUBBOCK
PH Y S I C A L AS S E S S M E N T
master development plan
Exist ing Land Use
Existing Land Use Map
2-9
NNORORTHTH & E& EASTAST LLUBBOCKUBBOCK
PH Y S I C A L AS S E S S M E N T
master development plan
FIGURE 2-C Source: City of Lubbock

Zoning is the act of establishing districtsand regulations governing the use, anddevelopment of property. Zoning, as asystem of land use regulation, designatesthe permitted uses of land based on itslocation and a plan for the future. Onepurpose of zoning is to prevent newdevelopment from negatively impactingexisting residents or businesses and,thus, protect the health, safety, and wel-fare of citizens. Zoning commonlyincludes outlining the kinds of activitiesthat are acceptable on particular proper-ties, the densities or intensities of thoseactivities, the height of buildings, theamount of space structures may occupy(by limiting how close a building may beto the property line), and the amount ofparking that must be provided. Mostzoning ordinances have a procedure forgranting variances. Variances are excep-tions to the zoning rules, typicallybecause of a hardship due to the partic-ular inherent nature of the property.
Zoning will have a significant impact onthe future development of North & EastLubbock. Proper zoning can reinforce themaster plan and better ensure that thecommunity achieves its desired future.In addition, updated zoning can moreefficiently regulate the developmentprocess of going from planning to bricksand mortar. In contrast, zoning that isout dated can hinder the developmentprocess and produce a finished productthat is not representative of the commu-nity’s intent.
The City of Lubbock’s zoning ordinancestates that its intent and purpose is to,“...promote and protect the health, safe-ty, comfort, convenience, prosperity andgeneral welfare of the citizens of Lubbockby assuring quality development...”. Thecity’s current zoning ordinance hasapproximately 30 district classifications.Examples of the classifications includeSingle-Family District (R-1), High-RiseApartment (A-3), Commercial District (C-4), Light Manufacturing (M-1), GardenOffice (GO), and Depot District (CB-4).Some of these districts are broad andcan be found throughout Lubbock, suchas R-1, other districts are more specific,sometimes pertaining to a single area,such as CB-4.
The city’s up-to-date zoning map can beviewed at city hall. Currently, the city isworking to convert the zoning map intoelectronic format. Once completed, cityofficials will be able to update zoningchanges and respond to zoning requestsand questions more efficiently. However,continuous maintenance to the electronicmap is necessary in order to keep themap up-to-date.
The North & East Master DevelopmentPlan recommends changes to the existingland use pattern in the study area.Updates to the existing zoning will benecessary to better reflect the new landuse pattern and recommendations madein this plan.
2-10
NNORORTHTH & E& EASTAST LLUBBOCKUBBOCK
PH Y S I C A L AS S E S S M E N T
master development plan
Zoning

Physical constraints and natural forces influence the developability of any potential site.
These constraints and forces include topography, water drainage, vegetation, and soils.
Depending on the site’s geographic location, certain constraints and natural forces have
greater impact on the future development potential of the size. For instance, topogra-
phy is a greater constraint for a site located on a coastal bluff or in hilly terrain as
compared to a site on the plains.
Topography and Floodplains - The change in topography in and around Lubbock is
minimal. However, some of the city’s most significant topography contrasts are located
in the North & East Lubbock Study Area, namely adjacent to Blackwater Draw and
Yellowhouse riverbeds. The land along the river beds can be described as rolling. The
vast majority of the land away from the river beds is relatively flat, having minimal
change in elevation.
Topography has a major influence on water
drainage and the areas with flood risk.
The majority of areas with significant risk of
flooding are located in the Blackwater and
Yellowhouse River beds. Most of the land at
significant risk is parkland. The major
exception to this is the neighborhood locat-
ed along Coronado Drive, just west of the
rail lines. Much of this neighborhood is in
the floodplain.
Climate and Vegetation - The climate of
Lubbock is known as “Continental Steppe”,
which is prevalent in the Texas High Plains.
It is common in the interiors of continents
and is characterized by large variations in
daily temperature extremes, low relative FIGURE 2-D: FLOODPLAIN MAPSOURCE: CITY OF LUBBOCK
Developability Analysis
2-11
NNORORTHTH & E& EASTAST LLUBBOCKUBBOCK
PH Y S I C A L AS S E S S M E N T
master development plan
Physical Constraints and Natural Forces
Floodplain Map

humidity, and irregularly spaced rainfall
of moderate amounts. In Texas, this cli-
mate is semi-arid with mild winters. The
area’s landscape is flat to rolling, with
natural vegetation of mixed-grass plains,
shortgrass high plains, shinnery oak
grasslands, and mesquite grasslands.
Grasses and forbs are the dominant veg-
etation.
The North & East Study Area contains lit-
tle vegetation that would hinder or
obstruct future development. Many
areas that do contain high concentrations
of vegetation, tree coverage, or land-
scaping belong to the City of Lubbock,
and are located in public parks and/or
recreational areas. These areas are pro-
tected from future private development
and are to be enjoyed by the public.
Soils - According to the U.S.
Department of Agriculture, there are four
general soil types within the North & East
Lubbock Study Area. The four general
soils are the following:
• Amarillo-Acuff
• Olton-Acuff
• Potter-Berda-Bippus
• Posey-Mansker-Bippus
Amarillo-Acuff is a deep, nearly level to
gently sloping, moderately permeable
loamy soil on uplands. Amarillo-Acuff
covers the vast majority of the study
area.
Olton-Acuff is a deep, nearly level to
gently sloping, moderately slowly perme-
able and moderately permeable loamy
soil on uplands. Olton-Acuff is only
found in the northern portions of the
study area.
Potter-Berda-Bippus is a very shallow,
shallow and deep, nearly level to steep,
moderately permeable loamy soil on
uplands and bottomlands. Potter-Berda-
Bippus is found only along the Blackwater
and Yellow House riverbeds.
Posey-Mansker Bippus is a deep, nearly
level to sloping, moderately permeable
loamy soil on bottomlands and uplands.
Within the study area, Posey-Mansker-
Bippus is only found along the northern
portions of the Blackwater riverbed.
Overall, the soils found in the study area
do not deter future development from
occurring. Basic construction methods
can overcome any potential minor prob-
lem caused by existing soils. However,
the Potter-Berda-Bippus and Posey-
Mansker Bippus general soil categories
typically occur in areas that have greater
2-12
NNORORTHTH & E& EASTAST LLUBBOCKUBBOCK
PH Y S I C A L AS S E S S M E N T
master development plan

slopes and are more susceptible to flood-
ing. In addition, the Olton-Acuff soils
have a moderate risk of soil-swelling.
Soil-swelling is the expanding and con-
tracting of the soil caused by the amount
of water in the soil. The “swelling” of the
soil can cause damage to certain built
structures and foundations.
Citibus is the public transportation
provider for the City of Lubbock.
According to www.citibus.com, Lubbock
has had public transportation since 1932,
when the Lubbock Bus Company began
operations. In 1971 the City began to
subsidize the public transportation sys-
tem. FIGURE 2-E: GENERAL SOILS MAPSOURCE: GOULD EVANS AFFILIATES
2-13
NNORORTHTH & E& EASTAST LLUBBOCKUBBOCK
PH Y S I C A L AS S E S S M E N T
master development plan
General Soi ls Map
Five bus routes currently service the North & East Lubbock Study Area. These routes
include the Dunbar (1), East Broadway (2), Guadalupe (7), Arnett Benson/ 4th Street
(12), and the Cherry Point (14). Figure 2-F illustrates the five routes and the portions
of the study area they serve. Currently, all routes converge at the Downtown Transfer
Plaza, located at the intersection of Buddy Holly Avenue and Broadway Street. This
“hub” concept can be more cost efficient by reducing the number of routes and simpli-
fying the routing logistics. However, it can also create inefficiency by reducing direct
routes and increasing commuting times. Inefficiency, real or perceived, can reduce rid-
ership numbers and increase the negative stigma many public transit systems face.
Many North & East Lubbock residents rely on public transportation to get them to their
place of employment or to essential services. As stated previously, there is a low num-
ber of service and retail establishments within the study area. In addition, the lower
Transportat ion

than city average median household income levels means a greater percentage of resi-
dents in the area do not own an automobile. Because of these existing conditions, a
comprehensive public transportation system that both connects the neighborhoods
within the study area to each other and to the major retail, entertainment, and
employment centers outside of North & East Lubbock is a critical component in the
study area’s future.
The major form of transportation in Lubbock
is the automobile. Lubbock is served by
many roadways. Major roadways in North &
East Lubbock include I-27, I-289, Martin
Luther King, Idalou Road, Municipal Drive,
Parkway, 4th Street, and 19th Street.
Future development is reliant on sufficient
road access. Road expansion and improve-
ments are costly and time consuming; land
that is adjacent to, or in close proximity to,
adequate road access is more likely to be
developed. However, roadways that have
wide rights-of-way and/or carry high volumes
of traffic can create barriers. These barriers
can separate neighborhoods and even divide
communities both physically and perceptually.
Marsh Sharp Freeway- Property has already been cleared for the proposed Marsha
Sharp Freeway. The plan is to transform 4th Street into a limited access freeway,
eventually connecting I-27 to the southwest corner of Loop 289. The widening of the
right-of-way and the increased traffic volume will impact the study area, specifically the
neighborhoods located immediately north of the current 4th Street alignment.
The idea for an east-west limited access freeway was first introduced in 1964. The
freeway was originally planned for somewhere between 32nd and 38th Street.
However, it was later deemed not appropriate for freeway traffic and by 1989 the cur-
rent planned location was selected.
2-14
NNORORTHTH & E& EASTAST LLUBBOCKUBBOCK
PH Y S I C A L AS S E S S M E N T
master development plan
FIGURE 2-F: TRANSIT ROUTES MAPSOURCE: GOULD EVANS AFFILIATES
Transit Routes Map

Community leaders expressed concerns at public hearings as to how the proposed free-
way would impact Lubbock and the adjacent neighborhoods. However, by 1995 the
environmental impact document was approved and the purchase of right-of-way had
begun. The freeway is to be completed in five phases. The final phase is to be com-
pleted sometime after 2010.
The Texas Department of Transportation lists a number of benefits the Marsha Sharp
Freeway will provide. These include:
• Efficient movement of traffic and reduction of congestion
• Faster access to all points in Lubbock, specifically Texas Tech University, the central business district, education centers and medical facilities
• The freeway complements city plans to encourage development and preservation in the central business district
However, history has shown that freeway systems located within urban areas createunintended consequences on both adjacent neighborhoods and the community as awhole. Some of these negative impacts include:
• Perceptual and physical division of adjacent neighborhoods
• Hindrance of traffic flow that runs perpendicular to the freeway
• Promotion of residential and employment migration from developed areas to newly accessible undeveloped areas
• Increase in noise, air, and light pollution
2-15
NNORORTHTH & E& EASTAST LLUBBOCKUBBOCK
PH Y S I C A L AS S E S S M E N T
“The finalphase is to
be completedsometime
after 2010.”
master development plan
MARSHA SHARPFREEWAY RENDERINGSOURCE: TEXAS D.O.T.

Utility line location and planned availabil-
ity, such as sanitary sewer and water,
influence where development takes place.
If a development site or parcel is not
located adjacent to utility lines, then the
lines must be extended from the closest
source. This can be very costly and hin-
der the feasibility of a potential develop-
ment project.
The previous map illustrates the location
of major sewer lines in the North & East
Study Area. Most of the sewer lines are
located in the southwestern portion of
the area. A majority of the residents and
businesses requiring sewer connections
are located in this vicinity. Land to the
north and northeast is generally less
developed and populated and, thus, the
utility network is not as extensive in that
area. The adjacent figures illustrate the
location of major water and sewer lines
in the North & East Lubbock Study Area.
Most of the water lines follow the exist-
ing street network, because they are
generally buried in the city owned public
rights-of-way that are shared by both
streets and utilities.
2-16
NNORORTHTH & E& EASTAST LLUBBOCKUBBOCK
PH Y S I C A L AS S E S S M E N T
master development plan
FIGURE 2-G: SANITARY SEWER MAPSOURCE: CITY OF LUBBOCK
Sanitary Sewer Map
FIGURE 2-H: WATER LINE MAPSOURCE: CITY OF LUBBOCK
Water Line Map
Uti l i t ies
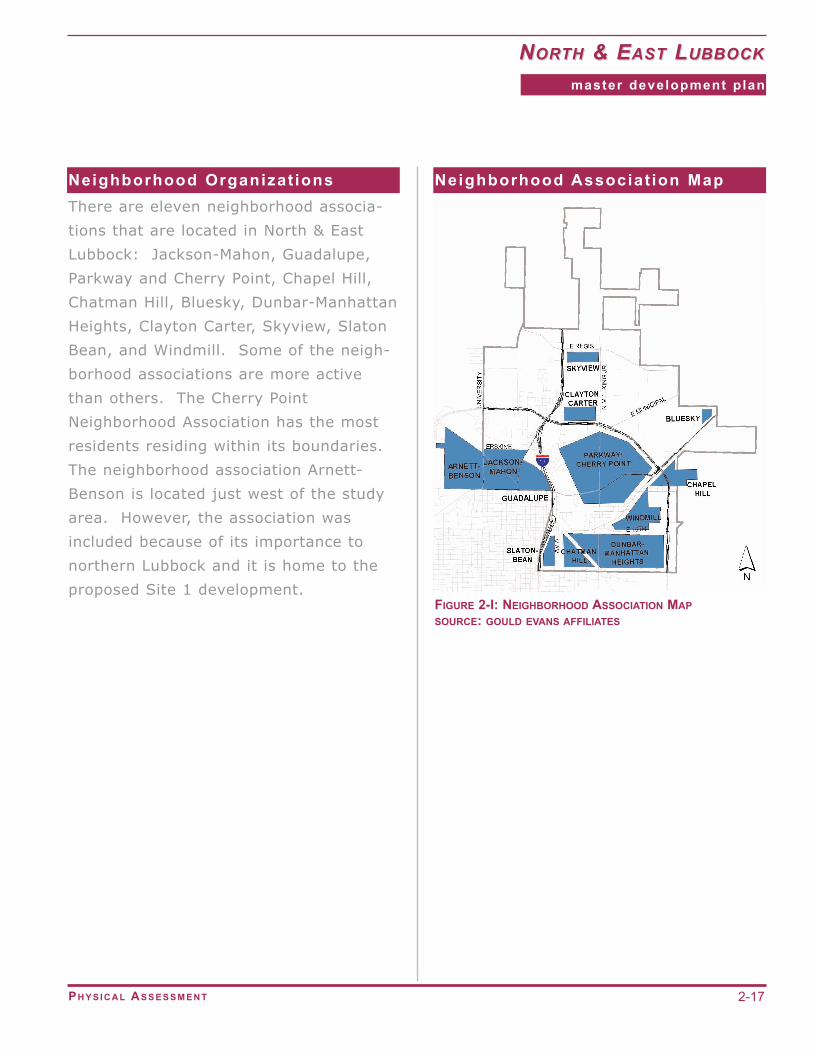
There are eleven neighborhood associa-
tions that are located in North & East
Lubbock: Jackson-Mahon, Guadalupe,
Parkway and Cherry Point, Chapel Hill,
Chatman Hill, Bluesky, Dunbar-Manhattan
Heights, Clayton Carter, Skyview, Slaton
Bean, and Windmill. Some of the neigh-
borhood associations are more active
than others. The Cherry Point
Neighborhood Association has the most
residents residing within its boundaries.
The neighborhood association Arnett-
Benson is located just west of the study
area. However, the association was
included because of its importance to
northern Lubbock and it is home to the
proposed Site 1 development.
2-17
NNORORTHTH & E& EASTAST LLUBBOCKUBBOCK
PH Y S I C A L AS S E S S M E N T
master development plan
Neighborhood Organizat ions
FIGURE 2-I: NEIGHBORHOOD ASSOCIATION MAPSOURCE: GOULD EVANS AFFILIATES
Neighborhood Associat ion Map

A basic computer model was developed based on the potential opportunities and con-
straints analysis. The result is a composite map that rates the developability of the
North & East Study Area. Areas range from most developable to least developable,
with eight categories in between. The lighter colors on the accompanying map repre-
sent sites that are more desirable for development, and the darker colors are less
desirable. The map is not the definitive answer to the question about where future
development should take place. Instead, it is another tool that will assist participants
in determining the preferred future development direction for North & East Lubbock.
Areas that the model has classified as most and least developable should be analyzed
further to determine why they are most or least suitable for future development, given
the resources available.
The following are general assumptions and limitations based on the Site Developability
Map.
General Assumptions:
• More development opportunities exist inside Loop 289
• Infill and development opportunities are available in existing neighborhoods
• Significant concentrations of land possessing ratings of higher developability are
located along the Idalou corridor east of Martin Luther King and north of 4th
Street, west of I-27
Limitations:
• Compatibility of neighboring land uses is not part of the model
• Impact of variables outside the study area was not introduced into the model
• Economic and political conditions are not factored into the model
Site Developability Rating
2-18
NNORORTHTH & E& EASTAST LLUBBOCKUBBOCK
PH Y S I C A L AS S E S S M E N T
master development plan

Based on the Developability Model, the highest concentration of developable land is
located inside Loop 289. Within the Loop, there are pockets of land that best meet the
established qualifications. These areas are located along Idalou, west of Martin Luther
King between Parkway and Emory; north of 4th Street; and the 19th Street and Avenue
A intersection. Most of these development opportunities are located within existing
neighborhoods. This is primarily because the needed roads, utilities, and services are
already present.
Focusing future development on sites located within existing neighborhoods has both
positive and negative aspects. A significant positive factor is that current residents will
be in close proximity to the development. This could mean that new housing could
improve property values, provide greater housing options, or increase local population
levels, which in turn could generate future commercial development. New commercial
development could mean improved services, services in closer proximity to existing
neighborhoods, and more choices for residents. However, a future development could
negatively impact a neighborhood. Increased traffic, lowered property values, and
increased noise and light pollution are a few examples of negative impact.
FIGURE 2-J: SITE DEVELOPABILITY MODELSOURCE: GOULD EVANS AFFILIATES
2-19
NNORORTHTH & E& EASTAST LLUBBOCKUBBOCK
PH Y S I C A L AS S E S S M E N T
master development plan
Analysis

Site Developability Map
2-20
NNORORTHTH & E& EASTAST LLUBBOCKUBBOCK
PH Y S I C A L AS S E S S M E N T
master development plan
FIGURE 2-KSource: Gould Evans Affiliates

The City of Lubbock has a number a programs and
public funding sources that promote and assist with
community redevelopment. These programs help to
create both housing and business opportunities. In
addition, there are a variety of development tools and
financial aid available for communities offered through
both state and national agencies. The following are
development tools, programs, and agencies that exist
and are available to assist areas experiencing distress.
Some of these development tools are currently being
used in Lubbock.
Community Service Block Grants - Community
Services Block Grant (CSBG) is a state grant program,
provided by the Texas Department of Housing and
Community Affairs, to be used for a variety of social
services and anti-poverty activities.
Community Development Block Grant Program
(CDBG) - According to the Lubbock Community
Development web site, the primary objective of the
(CDBG) Program is "the development of viable urban
communities." While virtually all citizens of the City
benefit from CDBG, either directly or indirectly, the
focus of the program is "principally for low and mod-
erate income persons."
Hope VI Grants - The HOPE VI Program, originally
known as Urban Revitalization Demonstration (URD),
was developed as a result of recommendations by the
National Commission on Severely Distressed Public
Housing. It was charged with proposing a National
Action Plan to eliminate severely distressed public
housing. The Commission recommended revitalization
DEMOLITION OF INADEQUATE HOUSING
Redevelopment Tools
2-21
NNORORTHTH & E& EASTAST LLUBBOCKUBBOCK
PH Y S I C A L AS S E S S M E N T
master development plan
EXISTING PUBLIC HOUSING
ANNOUNCEMENT OF NEW HOUSING

in three general areas: physical improvements, management improvements, and social
and community services to address resident needs.
Low-Income Housing Tax Credits - The tax credit program was created by the Tax
Reform Act of 1986 and was first utilized by the real estate development community
during 1987. The tax credit program is a way of directing private capital towards the
creation of affordable rental housing. Tax credits provide developers of low income
rental housing with a benefit that may be used to offset their federal tax liability in
exchange for the production of affordable rental housing.
Enterprise Zones - The purpose of the Texas Enterprise Zone Program is to encour-
age job creation and capital investment in areas of economic distress. The program
provides communities with an economic development tool to offer state and local incen-
tives to new or expanding business in designated areas. Businesses must make a
$250,000 investment or create at least 12 new jobs in order to receive state abate-
ments. Currently, the entire North & East Lubbock Study Area is classified as an enter-
prise zone.
Job Creation Incentives - Market Lubbock, Inc. offers monetary compensation for
new jobs created with an annual salary of $25,000 or above.
Community Development Financial Institution Fund (CDFI) - The CDFI was
authorized in 1994 with the goal of expanding the availability of credit, investment cap-
ital, and financial services in distressed urban and rural communities. The CDFI’s
activities leverage private-sector investments from foundations and other funding
sources.
National Congress for Community Economic Development (NCCED) - The
NCCED represents Community Development Corporations (CDCs) across the United
States. CDCs create affordable housing and employment through business and com-
mercial development activities. A CDC is established to develop economic programs
and provide financial support for a community.
Local Initiatives Support Corporation (LISC) - The LISC assists local community
development corporations in their efforts to improve distressed and neglected neighbor-
hoods. LISC offers private-sector support and extends technical and financial support
to CDCs in the form of loans, grants, and equity investments.
2-22
NNORORTHTH & E& EASTAST LLUBBOCKUBBOCK
PH Y S I C A L AS S E S S M E N T
master development plan

Social Investment Forum’s Community Investment Information - This organi-
zation offers investment strategies that support development initiatives in low-income
communities. Community Investment provides financial support to create affordable
housing, create jobs, and capacity for businesses.
Community Development Venture Capital Alliance (CDVCA) - The CDVCA pro-
motes venture capital tools to create jobs and entrepreneurial wealth to advance the
livelihoods of low-income people and the economies of distressed communities.
Lubbock Housing Finance Corporation (LHFC)
The Lubbock Housing Finance Corporation carries out programs to finance affordable
housing. (FHA loans only)
Economic Development Administration
The Economic Development Administration provides matching grants for economic
development that could be utilized for physical programs; e.g., office buildings, busi-
ness incubation centers, etc. The EDC is within the U.S. Department of Commerce.
Office of Community Services
The Office of Community Services provides grants up to $700,000 to non-profits to
carry out commercial real estate projects that benefit low- to moderate-income per-
sons. The OCS is under the U.S. Department of Health and Human Services.
New Markets Tax Credits
The New Markets Tax Credit Program, a U.S. Department of Treasury program and car-
ried out by the Community Development Financial Institutions (CDFI) Fund, has thir-
teen recipients in the 2004-2005 funding round that indicated they were interested in
funding projects in Texas. Total tax allocation available to these awardees on a nation-
al basis is $1,170,000,000.
Federal Home Loan Bank Board
The Federal Home Loan Bank Board has four programs that could be utilized including
affordable housing grants, the CIP program for infrastructure, economic development
programs for economic development projects, and an economic development program
plus grants of up to $25,000 for small businesses.
2-23
NNORORTHTH & E& EASTAST LLUBBOCKUBBOCK
PH Y S I C A L AS S E S S M E N T
master development plan

HUD 108 Program
The HUD 108 Program allows municipalities to leverage their community development
block grant funds five-to-one for eligible projects including affordable housing and
mixed-use development.
Local Foundations
Lubbock foundations, such as the Helen Jones Foundation and CH Foundation, provide
funds to finance community development projects.
Texas Foundations
Statewide foundations, such as the Meadows Foundation and the Houston Endowment,
fund community development throughout Texas.
National Foundations
The Fannie Mae Foundation as well as the JP Morgan Chase Foundation and the Bank of
America Foundation fund projects for affordable housing, neighborhood retail, and eco-
nomic development.
Enterprise Foundation
The Enterprise Foundation has a social investment corporation similar to the LISC pro-
gram that provides financing and technical assistance for community development cor-
porations.
Texas Economic Development Council
The Texas Economic Development Council (TEDC) is a membership organization com-
posed of economic developers throughout the state of Texas. They provide special
training sessions on the use of sales tax funds for economic development and other
economic development techniques.
Texas Community Development Association
The Texas Community Development Association is a membership organization that
focuses on housing and neighborhood economic development. It is a resource for tech-
nical assistance and training.
2-24
NNORORTHTH & E& EASTAST LLUBBOCKUBBOCK
PH Y S I C A L AS S E S S M E N T
master development plan

Texas Department of Housing and Community Affairs
The Texas Department of Housing and Community Affairs runs a variety of programs;
e.g., the housing trust fund, in addition to administering the low-income housing tax
credit program in Texas.
Texas Mezzanine Fund, Inc.
The Texas Mezzanine Fund is a statewide community development financial institution
that provides financing for businesses located in distressed areas, women- or minority-
owned businesses, and small businesses that create jobs for low-and-moderate income
people. TMF also provides financing to for-profit and nonprofit developers of single-and
multifamily affordable housing units for families, senior citizens and households with
special needs. The fund was capitalized by a consortium of financial institutions in
Texas.
Tax Increment Financing
Tax Increment Financing is a technique used by local governments, through Chapter
311 of the Texas Tax Code, to capture the future tax benefits of publicly financed
improvements to pay the present cost of implementing the improvements. The develop-
er will front related costs to finance public improvements. To repay the developer, the
taxing jurisdiction agrees to set aside all tax revenues above the predefined base level
(tax increment) generated in that area during the financing period.
2-25
NNORORTHTH & E& EASTAST LLUBBOCKUBBOCK
PH Y S I C A L AS S E S S M E N T
master development plan

SS ECTIONECTION TT HREEHREE
MM ARKETARKET AA NALNALYSISYSIS
master development plan

Development in the North & East Lubbock Study Area
will occur in the context of the overall economy of
Lubbock and the surrounding area. The primary area
of influence is Lubbock County as a whole, which was,
until recently, the Lubbock metropolitan area. The
official census metropolitan designation was recently
expanded to include Crosby County, but for consisten-
cy with past census reports and Lubbock city planning
analysis, we have used the single county (Lubbock
County) in most of the data analyzed here.
The initial analysis focuses on the housing and retail
markets, in that these two sectors are closely related
and represent the primary concerns of the city and
the residents of the study area. Other topics will be
investigated, and these two sectors will be refined in
Section Six of this report.
Introduction
3-2
NNORORTHTH & E& EASTAST LLUBBOCKUBBOCK
MA R K E T AN A LY S I S
master development plan

Table 3-A below shows the principal demographic characteristics used in both the hous-
ing and retail analysis for past census years, a current estimate, and forecasts for 2010
and 2020. The information for 1990 and 2000 is from the US Census. The current esti-
mate is from Claritas, a proprietary data source, and the forecasts are by Hammer,
Siler, George Associates, based on an extrapolation of recent trends. The population
forecasts are consistent with projections currently used by the Lubbock planning
department and the State of Texas. No comparable projections exist for the other
parameters in the table.
The projected growth in housing units is the key variable in projecting future housing
demand; however, projections must also account for the ongoing need to replace hous-
ing that is lost through redevelopment, conversion to other use, or, as in the past in
Lubbock, disasters and clearance for highway construction. We have estimated this
component by comparing the net change in housing units with the amount of new con-
struction as reported by the census and local permit data. As shown in Table 3-B, we
have estimated future replacement need at 300 units per year over the forecast period.
When combined with the forecast growth, this results in a total housing demand of
21,614 new units between now and 2020, or an annual average of 1,270. This projec-
tion is generally consistent with recent permit activity and the city's own analysis, but
it is somewhat higher than the short-term outlook in a market analysis conducted by
the Department of Housing and Urban Development (HUD) in 2002.
1990 2000 2003 2010 2020Population 222,636 242,628 249,789 260,792 277,357Group Quarters 9,726 9,606 9,500 9,500 9,500Pop in Households 212,910 233,022 240,289 251,292 267,857Average Hsld Size 2.61 2.52 2.49 2.45 2.40Households 81,534 92,516 96,414 102,568 111,607Housing Units 91,770 100,595 104,798 111,487 121,312Occupancy Rate 88.8% 92.0% 92.0% 92.0% 92.0%
TABLE 3-A: POPULATION AND HOUSING, LUBBOCK COUNTYSOURCE: HAMMER, SILER, GEORGE ASSOCIATES
Housing Market
3-3
NNORORTHTH & E& EASTAST LLUBBOCKUBBOCK
MA R K E T AN A LY S I S
master development plan
Demographic Forecasts
Total Housing Market

Despite the relatively strong housing market at the area-wide level, the study area has
not seen much residential activity. The area had declined in population steadily in
recent decades-from 34,416 in 1960 to 18,640 in 2000-due. Some of the decline in
population can be attributed out-migration trends of the White population, demolition of
housing units for urban renewal and the construction of Interstate 27, and reduction in
median household size. And while the rate of decline has been sharply reduced, the
Lubbock planning department still projects a continuing loss in study area population
through 2020.
However, the study area planning effort is not about projecting what might occur under
current conditions, but rather what can occur given a concentrated effort to effect
change.
In this regard, there are two points to consider:
• Even if there is no net growth in population and housing, there can still be
considerable new construction to improve the housing stock and to offset the loss
of existing units, and
• There may be opportunities to alter market conditions, or the real estate
economics, to create developments that otherwise would not have occurred.
Housing Production, Lubbock County
1990-2000 2000-2003 2003-2010 2010-2020Units Built 13,989 4,465 8,789 12,825Net Change 8,825 4,203 6,689 9,825Units Lost-Total 5,164 262 2,100 3,000Units Lost-Annual 516 87 300 300
3-4
NNORORTHTH & E& EASTAST LLUBBOCKUBBOCK
MA R K E T AN A LY S I S
“a total housingdemand of 21,614new units betweennow and 2020 (in
Lubbock County)”
master development plan
TABLE 3-B: HOUSING PRODUCTION, LUBBOCK COUNTYSOURCE: HAMMER, SILER, GEORGE ASSOCIATES
Study Area Resident ia l Act iv i ty

To set the framework for these opportunities, Table 3-C shows the distribution of resi-
dential parameters within the city. The first two columns show the total land area and
building area, respectively, of residential land use in Lubbock, as derived from the city's
GIS data files. Population and households are from the census. The study area’s share
of the city in each category is shown and ranges from 10.1 percent of the land area to
4.8 percent of the building floor space. These shares suggest that on average the
housing in the study area is less dense, smaller units, yet with larger households than
the city average.
Based on these factors, we suggest that as a goal or target, the study area planning
effort should strive to achieve housing development equal to its current share of the
county’s households of 6.2% of the area’s forecast housing production. (This is roughly
equivalent to the 7.7% of the city’s households shown in Table 3-C). That would be a
rate of 80 units per year on average through 2020. While 80 units per year is used in
this calculation, there are many variables that will influence the market, such as inter-
est rates, available subsidies and the ultimate price points of the product offered.
Therefore, this should be considered the mid-point of a range that might be between
60 and 100 units under optimum conditions. Since the total production forecast
includes replacement, this will not necessarily mean a net increase; however, it would
represent a substantial upgrading of the housing stock over time. Table 3-E summa-
rizes the housing forecasts and further breaks down the future demand into single-fam-
ily and multi-family components.
LandAcres
BuildingSquare Feet
Population(2000)
Households(2000)
City Total 15,781 128,736,622 199,564 77,527Study Area Total 1,591 6,177,300 18,640 5,962 North Lubbock 396 943,390 4,399 1,407 East Lubbock 1,195 5,233,910 14,241 4,555Study Area Share 10.1% 4.8% 9.3% 7.7%TABLE 3-C: RESIDENTIAL DISTRIBUTIONSOURCE: HAMMER, SILER, GEORGE ASSOCIATES
3-5
NNORORTHTH & E& EASTAST LLUBBOCKUBBOCK
MA R K E T AN A LY S I S
master development plan

A tabulation of data from the Lubbock
Association of Realtors' Multiple Listing
Service indicates the profile of resale
homes (not new construction) in
Lubbock. While the data covers only
homes sold by member Realtors, the
data available included over 11,000 sales
from 1999 to the present, which is clear-
ly representative of the city total. That
shows an average price of $100,654 over
the period. In contrast the North & East
Lubbock Study Area average was only
$66,109, and the houses were only
slightly smaller on average. Table 3-D
shows the sales price profile and the
study area share of the city activity in
each price range. The disparity is
greater if the area around the Lubbock
Country Club is excluded. That area
alone accounted for all of the reported
sales over $75,000.
TABLE 3-D: SALES PRICE OF HOUSINGSOURCE: HAMMER, SILER, GEORGE ASSOCIATES
3-6
NNORORTHTH & E& EASTAST LLUBBOCKUBBOCK
MA R K E T AN A LY S I S
master development plan
Housing Market Pr ice Prof i le
The data may not be representative in
reporting the study area activity. Since
the study area contains 8.7 percent of
the city's owner-occupied housing, more
than 1.3 percent of the resales might be
expected. Study area residents could be
more long-term residents and less likely
to move than those in the rest of the
city, or perhaps more sales in the Study
Area take place without the assistance of
Realtors. Whatever the reason, it is
clear that 1) housing in the study area is
not getting the exposure to the market
that other areas of the city are, and 2)
there is virtually no "move-up" housing
available.
While the data above does not include
newly constructed housing, builders and
lenders indicated that homes could be
and have been built in the Study
Area for $60-65,000 and have been
accepted by the market in limited
numbers. The low price of land is
the primary reason that homes can
be sold in North & East Lubbock for
less than a comparable unit in the
south and west neighborhoods.
Price RangeCity of
Lubbock
N&EStudyArea
N&EShareof City
N&EDistribution
Less than $25,000 263 47 17.9% 30.9%$25,000-49,999 1310 42 3.2% 27.6%$50,000-74,999 2838 21 0.7% 13.8%$75,000-99,999 3041 14 0.5% 9.2%$100,000-124,999 1304 7 0.5% 4.6%$125,000-149,000 901 4 0.4% 2.6%$150,000-199,000 857 7 0.8% 4.6%$200,000-249,999 358 3 0.8% 2.0%$250,000-299,000 206 5 2.4% 3.3%$300,000 and over 218 2 0.9% 1.3% Total Sales 11296 152 1.3% 100.0% Average Price $100,654 $66,109 65.7% Average Size (sf) 1856 1657 89.3%

The suggested target is not a "market"
forecast in that the private development
industry is likely to respond to normal
market forces. Achieving this goal will
require proactive efforts to create oppor-
tunities and to assist in the development
and rehabilitation of housing. To sum-
marize some of the opportunities and
constraints in a qualitative manner:
• Housing production in the study area is limited by resources and public program
capacity
• There will be continued opportunity for odd-lot infill, both new construction and
relocating existing structures
• There is an opportunity to provide upgraded housing to long-term area residents
who would otherwise need to move out of the area
• There is an opportunity for smaller new subdivisions
• There is limited opportunity to attract whole new markets to the Study Area
• What opportunities exist could be enhanced by:
• A high amenity location
• A stronger job base around the airport
2003-2010
2010-2020
Annual Rate 1,256 1,282 Single Family (70%) 879 896 Multi-Family (30%) 377 385Study Acres "Share" 80 80
TABLE 3-E: HOUSING DEMAND, PROFILESOURCE: HAMMER, SILER, GEORGE ASSOCIATES
3-7
NNORORTHTH & E& EASTAST LLUBBOCKUBBOCK
MA R K E T AN A LY S I S
master development plan
Opportunit ies and Constraints

The retail market in the study area suffers from the
long-term decline in the population base and the sub-
sequent loss of business, closing and even demolition
of enterprises that once served the community. This
is particularly true in the east sector of the study
area, as businesses in the north continue to serve a
market area to the west that lies outside the study
area boundaries. The bright spot in both areas is that
they are served by relatively new, high quality super-
markets, often the lead effort in revitalizing the retail
structure of distressed areas. On the other hand,
there is a shortage of services and hard goods within
the area.
As economic development specialists, we agree with
the theory that "roof tops" must precede retail and
commercial development. But that is less true in an
already built up area. While additional rooftops (as
described in the residential section above) can do a
lot to improve the image of the area and boost the
confidence of commercial investors and operators that
the area is worthy of consideration, the reality is that
the 1,360 units of new housing targeted are insuffi-
cient, in themselves, to create a market for new retail
and service activities.
Therefore, the approach to the retail analysis is, like
the housing analysis, to describe the broader market
framework and then establish a reasonable and
achievable target for development in the study area,
which must be accomplished through proactive efforts
by the city, the newly created North & East Lubbock
Community Development Corporation, and the private
sector.
EXISTING RETAIL
Retail Market
3-8
NNORORTHTH & E& EASTAST LLUBBOCKUBBOCK
MA R K E T AN A LY S I S
master development plan
EXISTING RETAIL

The amount of retail sales in a community is determined largely by the size of the
area, the income level of the population and the amount of that income that is spent
on retail goods. In analyzing the retail market, it is useful to look at various categories
of retail goods. In this analysis, there are three broad categories; "shoppers goods,"
which include department stores, apparel, furniture, and single-line specialty stores
such as sporting goods or books, tend to locate in major shopping centers or in clusters
at high-access locations. Shoppers are willing to travel further from home to do com-
parison shopping to increase their selection and find the best price. Most expenditures
for such goods are made at regional shopping centers or increasingly at "big box" spe-
cialty stores. In Lubbock, this is generally at the South Plains Mall and adjacent areas
along Loop 289. For "convenience goods," expenditures are made closer to home and
generally at a neighborhood center or retail strip anchored by a supermarket. This cat-
egory includes grocery stores, home centers, and pharmacies. Although liquor stores
are not permitted in Lubbock, because the city is “dry”, the expenditures made are in
other portions of Lubbock County. A third category encompasses "eating and drinking"
establishments, which can exhibit the characteristics of either shoppers or convenience
goods, depending on their market orientation and coverage pattern. Some categories
of retail sales that have a lot of outdoor sales area, such as automobile dealers and
nurseries, are not included in the analysis.
The first step in the retail analysis is to estimate and project the expenditures of local
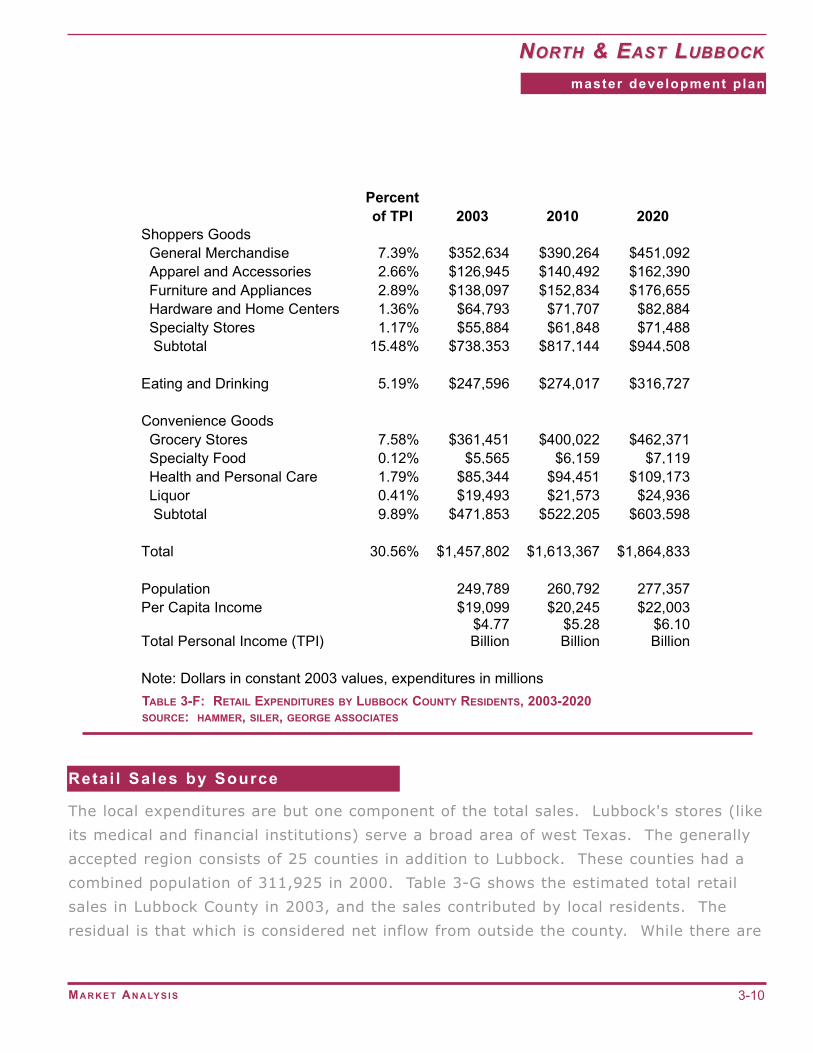
residents in these categories. Table 3-F shows the population, per capita income and
total personal income (TPI) of Lubbock County residents, and the expenditures for
2003, 2010, and 2020 based on the typical percentage of TPI spent in each category.
This later figure is calculated from census data for the State of Texas. Note that this is
based on the type of store in which the purchase is made, not the type of merchandise
bought. Thus, there may be a wide variation in the pattern in a small area, depending
on the types of stores available-for example, clothing could be bought at a clothing
store or a department store. Therefore the analysis is more valid regarding the totals
in each of the three major categories, than in the individual subcategories.
Based on the projected population and income levels, local expenditures are projected
to increase by $407 million between 2003 and 2020.
3-9
NNORORTHTH & E& EASTAST LLUBBOCKUBBOCK
MA R K E T AN A LY S I S
master development plan
Retai l Expenditures
3-10
NNORORTHTH & E& EASTAST LLUBBOCKUBBOCK
MA R K E T AN A LY S I S
master development plan
Percentof TPI 2003 2010 2020
Shoppers Goods General Merchandise 7.39% $352,634 $390,264 $451,092 Apparel and Accessories 2.66% $126,945 $140,492 $162,390 Furniture and Appliances 2.89% $138,097 $152,834 $176,655 Hardware and Home Centers 1.36% $64,793 $71,707 $82,884 Specialty Stores 1.17% $55,884 $61,848 $71,488 Subtotal 15.48% $738,353 $817,144 $944,508
Eating and Drinking 5.19% $247,596 $274,017 $316,727
Convenience Goods Grocery Stores 7.58% $361,451 $400,022 $462,371 Specialty Food 0.12% $5,565 $6,159 $7,119 Health and Personal Care 1.79% $85,344 $94,451 $109,173 Liquor 0.41% $19,493 $21,573 $24,936 Subtotal 9.89% $471,853 $522,205 $603,598
Total 30.56% $1,457,802 $1,613,367 $1,864,833
Population 249,789 260,792 277,357Per Capita Income $19,099 $20,245 $22,003
Total Personal Income (TPI)$4.77Billion
$5.28Billion
$6.10Billion
Note: Dollars in constant 2003 values, expenditures in millionsTABLE 3-F: RETAIL EXPENDITURES BY LUBBOCK COUNTY RESIDENTS, 2003-2020SOURCE: HAMMER, SILER, GEORGE ASSOCIATES
Retai l Sales by Source
The local expenditures are but one component of the total sales. Lubbock's stores (like
its medical and financial institutions) serve a broad area of west Texas. The generally
accepted region consists of 25 counties in addition to Lubbock. These counties had a
combined population of 311,925 in 2000. Table 3-G shows the estimated total retail
sales in Lubbock County in 2003, and the sales contributed by local residents. The
residual is that which is considered net inflow from outside the county. While there are

other offsetting factors (such as spending by tourists and local expenditures made out-
side of the county), the net inflow is usually an accurate assessment of the relative
contribution of the broader region. In this case, it is estimated that the outlying 25
counties contributed $511.7 million, 26 percent of the total county sales of $1,969.5
million.
Total Resident InflowShoppers Goods General Merchandise $520,953 $352,634 $168,320 Apparel and Accessories $164,980 $126,945 $38,035 Furniture and Appliances $170,999 $138,097 $32,902 Hardware and Home Centers $78,051 $64,793 $13,258 Specialty Stores $88,920 $55,884 $33,036 Subtotal $1,023,904 $738,353 $285,550
Eating and Drinking $364,564 $247,596 $116,968
Convenience Goods Grocery Stores $353,529 $361,451 -$7,922 Specialty Food $4,292 $5,565 -$1,273 Health and Personal Care $153,529 $85,344 $68,185 Liquor $69,638 $19,493 $50,145 Subtotal $580,987 $471,853 $109,134
Total $1,969,455 $1,457,802 $511,653
Note: Dollars in millions and constant 2003 valuesTABLE 3-G: RETAIL SALES BY SOURCE, LUBBOCK COUNTY, 2003SOURCE: HAMMER, SILER, GEORGE ASSOCIATES
3-11
NNORORTHTH & E& EASTAST LLUBBOCKUBBOCK
MA R K E T AN A LY S I S
master development plan
(The negative contribution in the food categories is a statistical anomaly that may indi-
cate some difference in the statewide expenditures and local characteristics, but sup-
ports the logical presumption that residents of the outlying counties do indeed make
most of their grocery purchases near home but come to Lubbock for major shoppers
goods purchases and entertainment.)

The forecast of total retail sales in Lubbock County is made by projecting the resident
component and the inflow separately. The resident expenditures were shown in Table
3-F. The inflow was projected by extrapolating the rate of growth in inflow from 1997
(the date of the latest available Census of Retail Trade and the 2003 estimate. Over
time the inflow will still be a significant source of sales, but will not grow as fast as the
local market, in part because the 25 outlying counties in the trade area are projected
to collectively lose population in the future. Even so, as shown in Table 3-H, total retail
sales in Lubbock County are projected to reach $2.398 million in 2020, an increase of
21.7 percent over sales in 2003.
Sales Growth
2003 2010 20202003-2010
2010-2220
Shoppers Goods General Merchandise $520,953 $560,193 $623,346 $39,239 $63,153 Apparel and Accessories $164,980 $178,890 $201,313 $13,910 $22,423 Furniture and Appliances $170,999 $186,050 $210,326 $15,051 $24,276 Hardware and Home Centers $78,051 $85,092 $96,452 $7,041 $11,360 Specialty Stores $88,920 $95,200 $105,296 $6,279 $10,096 Subtotal $1,023,904 $1,105,425 $1,236,733 $81,521 $131,308
Eating and Drinking $364,564 $392,103 $436,429 $27,540 $44,325
Convenience Goods Grocery Stores $353,529 $400,022 $462,371 $46,494 $62,349 Specialty Food $4,292 $6,159 $7,119 $1,867 $960 Health and Personal Care $153,529 $163,288 $178,951 $9,759 $15,664 Liquor $69,638 $72,197 $76,252 $2,560 $4,055 Subtotal $580,987 $641,666 $724,694 $60,679 $83,028
Total $1,969,455 $2,139,194 $2,397,856 $169,740 $258,661
Note: Dollars in millions and constant 2003 values
TABLE 3-H: RETAIL SALES, LUBBOCK COUNTY, 2003-2020SOURCE: HAMMER, SILER, GEORGE ASSOCIATES
3-12
NNORORTHTH & E& EASTAST LLUBBOCKUBBOCK
MA R K E T AN A LY S I S
master development plan
Projected Retai l Sales

This increase in retail sales will support the development of new retail space. The
amount of new space supported will be a function of the productivity of the space.
Expressed as "sales per square foot" of floor space, the expected productivity is shown
in Table 3-I and is based on industry standards and averages. Of course, there will be
wide variations among individual establishments, but in general these are the minimum
levels that will support the development of new space. Based on the averages, the
market will support a net growth of about 591,000 square feet of additional space by
2010 and an additional 912,000 square feet between 2010 and 2020. This is sufficient
to support five or six new neighborhood centers, but not enough for a new regional
center, unless South Plains Mall becomes obsolete over the next 17 years.
According to the city's GIS land use database and as shown in Table 3-J, the city has a
total of about 9.0 million square feet of retail floor space on 1,484 acres of land. The
study area accounts for 9.0 percent of the space, a greater share than its share of the
population or households.
Sales/SF2003-2010
2010-2020 Total
Shoppers Goods General Merchandise $250 156,958 252,614 409,571 Apparel and Accessories $250 55,641 89,692 145,333 Furniture and Appliances $250 60,205 97,103 157,308 Hardware and Home Centers $250 28,164 45,439 73,603 Specialty Stores $250 25,117 40,385 65,502 Subtotal 326,084 525,233 851,318
Eating and Drinking $300 91,799 147,751 239,550
Convenience Goods Grocery Stores $400 116,234 155,873 272,106 Specialty Food $250 7,467 3,840 11,307 Health and Personal Care $250 39,036 62,654 101,690 Liquor $250 10,238 16,221 26,459 Subtotal 172,975 238,587 411,562
Total 590,858 911,572 1,502,430
Note: Dollars in constant 2003 valuesTABLE 3-I: RETAIL SPACE GROWTH DEMANDSOURCE: HAMMER, SILER, GEORGE ASSOCIATES
3-13
NNORORTHTH & E& EASTAST LLUBBOCKUBBOCK
MA R K E T AN A LY S I S
master development plan
Retai l Space Supported
Retai l Space Distr ibut ion

In projecting the total demand for retail
space two additional factors must be
taken into account:
Although the expenditure and sales
analysis addressed only retail activity, in
most shopping centers and retail dis-
tricts, "retail" space is leased to related
service businesses providing personal
services, financial services, entertain-
ment and community services.
Therefore, the amount of supportable
"retail" space is greater than that pro-
jected above. In a neighborhood-serving
complex, these supporting uses typically
amount to 20 percent of the total space.
Second, the process of retail develop-
ment is much more volatile than the resi-
dential market. New merchants enter
the market and compete. Some stores
will shut down due to market demand.
Older store may convert to other uses or
much less productive retail activity.
Whatever the cause, the rate of construc-
tion of retail space, in any setting, is
greater that the growth in the market
would theoretically support. In this
analysis we have assumed a rate of
obsolescence and replacement of
existing space of 2.0 percent per year,
or the equivalent of an average useful
life of a building of 50 years. With a
total of 9.0 million square feet of retail
space in Lubbock, that would be 180,000
square feet per year. We further
assumed that it would be distributed
among the retail categories in the same
proportion as the new growth demand,
since that also generally reflects the cur-
rent make up of activity.
These additions are made in Table 3-K,
bringing the total retail space demand to
nearly 5.0 million square feet of new
space in Lubbock County, virtually all of
it within the city. As a goal and target for
the study area, just over 300,000 or 6.0
percent of the total should be achievable,
if the housing production goal is met as
well. This reflects the fact that the
incomes and expenditures in the study
area will continue to be less on a per
capita basis than in the rest of the city.
As with the residential market, this will
not occur through normal development
processes, at least not to the extent pro-
jected. Proactive project packaging by
the North & East Lubbock Community
Land AcresBuilding
Square FeetCity Total 1,484 9,043,155Study Area Total 199 816,616 North Lubbock 98 287,188 East Lubbock 101 529,428Study Area Share 13.4% 9.0%
TABLE 3-J: RETAIL SPACE DISTRIBUTIONSOURCE: HAMMER, SILER, GEORGE ASSOCIATES
3-14
NNORORTHTH & E& EASTAST LLUBBOCKUBBOCK
MA R K E T AN A LY S I S
master development plan

Development Corporation, other CDCs and/or the city will be required to assemble sites
and lessen the perceived risk.
Qualitative observations concerning the most promising opportunities include:
• Build on the existing supermarket anchors and provide opportunities for
additional support businesses in these established locations.
• There will be opportunities for spot in-fill of free-standing businesses, particularly
minority-owned franchises.
• If a suitable high-access location can be found, there should be an opportunity
for a value-oriented mass merchandiser to locate in the area, yet serving a larger
trade area.
Due toGrowth
ReplaceObsolete
Space
TotalSpace
Demand
StudyAreaShare
Shoppers Goods 851,318 1,387,104 2,238,422 138,800Eating and Drinking 239,550 390,313 629,863 37,800Convenience Goods 411,562 670,583 1,082,145 64,900Other Commercial Space (20%) 375,608 612,000 987,608 59,300 Total 1,878,038 3,060,000 4,938,038 300,800
Note: Obsolete space at 180,000 sf per year. Study area share at 6.0%Figures in square feet
TABLE 3-K: GROWTH AND REPLACEMENT RETAIL SPACE DEMAND, LUBBOCK COUNTY, 2003-2020SOURCE: HAMMER, SILER, GEORGE ASSOCIATES
3-15
NNORORTHTH & E& EASTAST LLUBBOCKUBBOCK
MA R K E T AN A LY S I S
master development plan

SS ECTIONECTION FF OUROUR
DD EVELOPMENTEVELOPMENT
WW ORKSHOPORKSHOP
master development plan
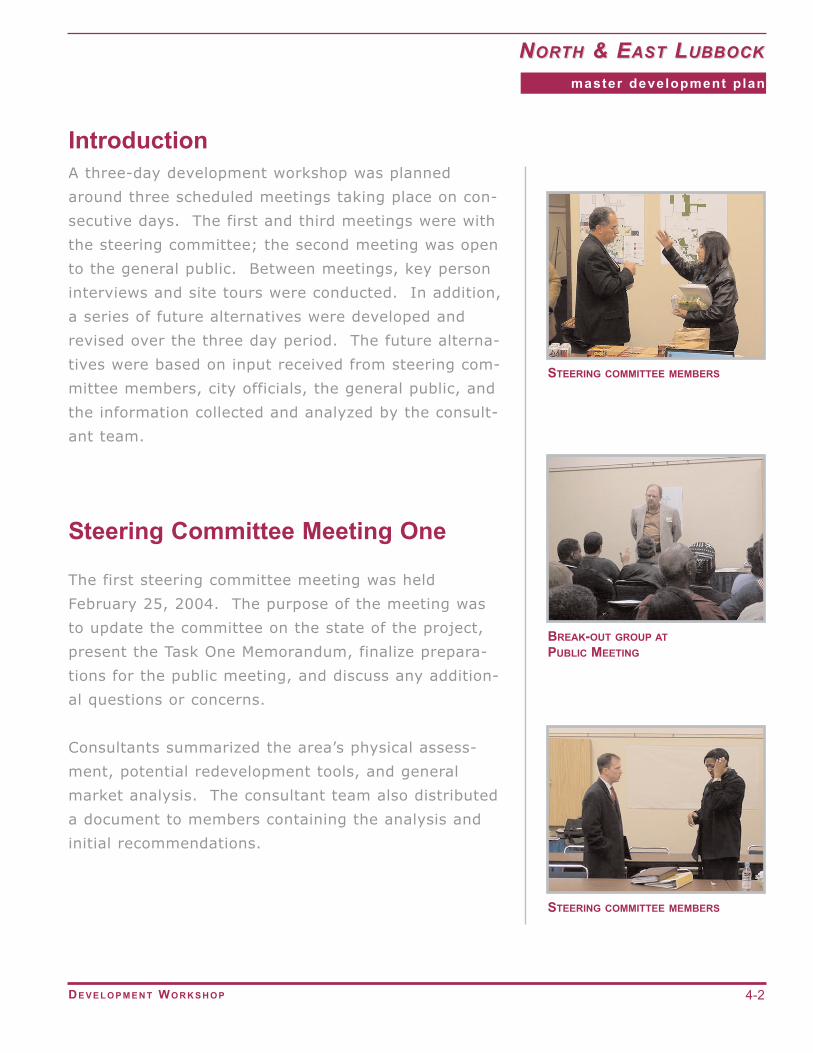
A three-day development workshop was planned
around three scheduled meetings taking place on con-
secutive days. The first and third meetings were with
the steering committee; the second meeting was open
to the general public. Between meetings, key person
interviews and site tours were conducted. In addition,
a series of future alternatives were developed and
revised over the three day period. The future alterna-
tives were based on input received from steering com-
mittee members, city officials, the general public, and
the information collected and analyzed by the consult-
ant team.
The first steering committee meeting was held
February 25, 2004. The purpose of the meeting was
to update the committee on the state of the project,
present the Task One Memorandum, finalize prepara-
tions for the public meeting, and discuss any addition-
al questions or concerns.
Consultants summarized the area’s physical assess-
ment, potential redevelopment tools, and general
market analysis. The consultant team also distributed
a document to members containing the analysis and
initial recommendations.
BREAK-OUT GROUP ATPUBLIC MEETING
Introduction
4-2
NNORORTHTH & E& EASTAST LLUBBOCKUBBOCK
DE V E L O P M E N T WO R K S H O P
master development plan
STEERING COMMITTEE MEMBERS
Steering Committee Meeting One
STEERING COMMITTEE MEMBERS

A public “town hall” style meeting was held during the
evening of February 26, 2004 at the Lubbock
Memorial Civic Center. The purpose of the meeting
was to ascertain the issues and priorities of the
broader community. The meeting had a large turnout
with over 300 people in attendance. Local residents,
business owners, and city officials were present.
Consultants conducted various exercises in order to
ascertain the attitudes of local citizens concerning
North & East Lubbock. The exercises included
Visioning, Issues and Assets Identification, Goal
Formation, Suggested Solutions, and Resource
Availability.
During the Visioning exercise, audience members were
asked to picture how they would envision North & East
Lubbock looking twenty years into the future.
Audience members were then asked to cite the char-
acteristics of their ideal future community. Members
of the consultant team recorded comments onto large
sheets of paper.
After completion of the Visioning exercise, audience
members were divided into four groups. These small-
er groups were designed to create a more conducive
atmosphere for public participation. The four groups
were designated by the colors: Red, Blue, Green, and
Yellow.
Group members were lead through five exercises,
OPENING SESSION
Public Meeting
4-3
NNORORTHTH & E& EASTAST LLUBBOCKUBBOCK
DE V E L O P M E N T WO R K S H O P
master development plan
Process and Results
PUBLIC MEETING ATTENDEES
OPENING SESSIONJOHN HALLEXECUTIVE DIRECTORN&E LUBBOCK CDC

conducted in a similar manner as the Visioning exercise. Consultants asked first for
issues concerning North Lubbock and then East Lubbock. Participants were then asked
to state what they view as assets in the study area, then their goals for the study area,
and, finally, to suggest any solutions for the study area.
After the public’s input was recorded, participants were given three adhesive dots in
the colors of red, blue, and yellow. The group members were told that the three dots
represented the limited resources available. The red dot signified what they believed
to be the most important priority, blue second priority, and yellow third priority. Group
members were instructed to place their dots on the comment(s) they felt were most
important to the future development of the study area.
Through the placement of the colored dots, the general themes that were most impor-
tant to the group as a whole became apparent. One participant was selected to report
the chosen priorities back to the entire group.
To conclude the public meeting, the four groups reassembled to present each group’s
findings to the larger group. The following are the four group’s areas of focus:
Red Group Blue Group • More jobs • Drug free neighborhoods
• Affordable housing • Beautification
• Drug free neighborhoods
• More services - retail
Green Group Yellow Group • Drug free neighborhoods • Affordable housing/increase
• Improve safety/security ownership
• Better jobs/local business ownership • More jobs
• Address environmental issues
4-4
NNORORTHTH & E& EASTAST LLUBBOCKUBBOCK
DE V E L O P M E N T WO R K S H O P
master development plan

Over 300 people attended the public meeting. Upon arrival, attendees were given a
label dot and were asked to place it on a displayed map of the study area, in the gen-
eral vicinity of their residence or place of employment. This was done so city officials
and the consultant team could attain a better understanding of the geographic dis-
bursement of public attendance. The graphic on the following page shows the result of
the exercise. The vast majority of the attendees resided or worked in the study area
inside the Loop 289. In addition, it can be seen that a minority of attendees either
lived or worked outside the study area.
4-5
NNORORTHTH & E& EASTAST LLUBBOCKUBBOCK
DE V E L O P M E N T WO R K S H O P
master development plan
ADDITIONAL PHOTOS FROM THE PUBLIC MEETING
Locat ion of Publ ic Meet ing Part ic ipants

Location of Place of Residence or Employment of Participants
4-6
NNORORTHTH & E& EASTAST LLUBBOCKUBBOCK
DE V E L O P M E N T WO R K S H O P
master development plan
FIGURE 4-A(some public meeting attendees did not participate in the location exercise)Source: Gould Evans Affiliates
Loop 289
MAR
TIN
LU
THER
KIN
G
I-27
Idalou
4th St
19th St
34th St

The second steering committee meeting
was held February 27, 2004. The pur-
pose of the meeting was to discuss the
outcome of the public meeting, present
the alternatives, and discuss the project’s
next steps.
The consultant team presented four
future development alternatives to the
steering committee. The four alterna-
tives are unique by design; each incorpo-
rating distinct concepts separating them
from one another. The four alternatives
were titled:
1. Community Revitalization
2. Corridors
3. Build on Amenities
4. New Town
After the presentation of the alternatives,
steering committee members discussed
what they liked and disliked about each
alternative. The steering committee
feedback was used to help develop the
preferred direction presented in Section
Five. Figure 4-B illustrates the preferred
direction process. Notice how individual
components of the alternatives are used
as opposed to the selection one of the
four alternatives.
FIGURE 4-B: PREFERRED DIRECTION PROCESS DIAGRAMSOURCE: GOULD EVANS AFFILIATES
Steering Committee Meeting Two - Alternatives
4-7
NNORORTHTH & E& EASTAST LLUBBOCKUBBOCK
DE V E L O P M E N T WO R K S H O P
master development plan

The Community Revitalization Alternative
seeks to revitalize existing neighborhoods
by concentrating future resources and
investment for maximum return. Future
residential development, in the form of
both infill housing and greenfield devel-
opment, would be located within and
immediately adjacent to existing neigh-
borhoods. The increase and concentra-
tion of “rooftops” would increase the like-
lihood of commercial and/or office devel-
opment. This would create jobs, increase
service options, and reduce commuting
distances.
Pros:
• Addresses Community Revitalization
Needs
• Focused Concentration of Resources
• Concentrated "Rooftops" Reinforces
Existing Retail
• Creates "Community Scale" Projects
• Existing Infrastructure/Lower Cost/
Better Price Points
Cons:
• Focused Concentration Excludes
Peripheral Areas
• Absorption Obstacles
• New Neighborhoods vs. Single Family
Infill
4-8
NNORORTHTH & E& EASTAST LLUBBOCKUBBOCK
DE V E L O P M E N T WO R K S H O P
master development plan
FIGURE 4-C: COMMUNITY REVITALIZATION ALTERNATIVESOURCE: GOULD EVANS AFFILIATES
Market Observations:
• Infill housing limits the range of
products/prices that can be provided
• Supports retail/service in current
locations
• Most efficient use of existing infra
structure
Community Revital izat ion

The Corridors Alternative focuses
resources along existing transportation
and greenway corridors, primarily within
Loop 289. The major corridors incorpo-
rated into this alternative would be
Martin Luther King, University, 4th
Street/Parkway, 19th Street/ Idalou, and
along McKenzie Park/Canyon Lakes. The
result is improved connectivity between
neighborhoods, better linkage among
commercial centers, corridor beautifica-
tion, and infill residential at specified
sites.
Pros:
• Addresses Comprehensive
Revitalization Strategies
• Uses Existing Patterns of Commercial,
Residential, and Entertainment
• Uses Existing Infrastructure
• Builds Rooftops to Support Retail
Activities
• Creates Community Scale Projects
• Addresses I-27 and Marsha Sharp
barriers
• Existing Infrastructure/Lower Cost/
Better Price Points
Cons:
• Absorption Obstacles
• New Neighborhoods vs. Single Family
Infill
FIGURE 4-D: CORRIDORS ALTERNATIVESOURCE: GOULD EVANS AFFILIATES
4-9
NNORORTHTH & E& EASTAST LLUBBOCKUBBOCK
DE V E L O P M E N T WO R K S H O P
master development plan
Corr idors
Market Observations:
• Strengthens integration with rest of
city, access to retail
and service, and could help attract a
wider commercial market
• Could help attract new markets for
housing

The Build on Amenities Alternative
directs future development to the land
surrounding existing amenities within the
study area. Three areas of focused
development, to be planned around
existing or planned amenities, were cho-
sen. The first development area would
be focused around Estacado High School.
The planning and construction of new
housing has already occurred in the area.
The second development area would be
centered on the Yellowhouse Canyon
Lakes Park. Strong neighborhoods, pris-
tine parks, and topographic conditions
create opportunities for future develop-
ment. The third development area would
be located around the Lubbock Country
Club. Continuation of the Canyon Lakes
development into the undeveloped
Blackwater Draw basin is suggested.
Within these three development areas,
the existing and future amenities would
act as "catalysts" for future development,
"anchoring" the chosen areas.
Pros:
• Focused Use of High Amenity, Visual,
Cultural Resources
• Immediate Theme/Potential Quicker
Market Response
• New Development/ Higher Market
Appeal
• Adds New Park Land to the North
Cons:
• Political Questions
• Potential Neighborhood Opposition to
the North
• Does not Solve Basic Community
Issues
• Requires Subsidy to Meet Price Points
Market Observations:
• Strong impact on image, but limits
overall housing absorption
• Provides opportunity to retain
upwardly mobile area residents
• Doesn't focus retail/service in high-
access locations
FIGURE 4-E: BUILD ON AMENITIES ALTERNATIVESOURCE: GOULD EVANS AFFILIATES
4-10
NNORORTHTH & E& EASTAST LLUBBOCKUBBOCK
DE V E L O P M E N T WO R K S H O P
master development plan
Bui ld on Amenit ies

The New Town Alternative suggests
developing a "new community" on land
currently used for agriculture. Resources
would be diverted from existing neigh-
borhoods to develop a planned communi-
ty that would be located just north of
Loop 289 and east of I-27. New housing
and retail would be developed, attracting
residents from both the study area and
from other portions of Lubbock.
Pros:
• Creates a New Environment/No
Existing Blight/Crime/Etc./Outside the
Loop
• Adjacent to Country Club and
Environs/Airport/Stronger Market
Image
Cons:
• Political Support
• Does not Support Existing
Shopping/Must Build New
• Requires Subsidy for Land and
Infrastructure
• Reduces available resources for
existing neighborhoods
Market Observations:
• Potentially higher overall absorption
• Rationalizes new retail/service location
along I-27
• New higher-end housing would have
statistical impact,
but little direct benefit to existing
residents.
FIGURE 4-F: NEW TOWN ALTERNATIVESOURCE: GOULD EVANS AFFILIATES
4-11
NNORORTHTH & E& EASTAST LLUBBOCKUBBOCK
DE V E L O P M E N T WO R K S H O P
master development plan
New Town

Out of the community participation process a vision statement was conceived. From this vision
of North & East Lubbock, five planning goals were formed. These five broad categories cover
the areas of greatest public concern and make up the basic framework of the implementation
strategies discussed later in Section Eight.
Working together to enhance the image, livability, and overall
quality of life for North & East Lubbock.
Infrastructure/Public Works - Plan, provide, and maintain efficient and effective infra-
structure that promotes sustained development, connects neighborhoods and centers, is aes-
thetically pleasing, environmentally sound, safe, and in harmony with the stated vision and
preferred direction of North & East Lubbock.
Public Policy - Through various regulatory and safety means, develop and enforce a
framework that adheres to the quality of life sought by residents.
Economic Development - Create an economic environment that promotes business,
encourages entrepreneurship, seeks employment growth, and maintains cooperation
between, public and private entities.
Housing - Seek a fair and diversified housing market that encourages homeownership and
provides quality housing for all stages of life and for all socioeconomic groups.
Organization Strategy - Create an environment that promotes efficiency and cooperation
between organizations and the general public.
Vision and Goals
4-12
NNORORTHTH & E& EASTAST LLUBBOCKUBBOCK
DE V E L O P M E N T WO R K S H O P
master development plan
Planning Goals
Vision Statement

SS ECTIONECTION FF IVEIVE
PP REFERREDREFERRED DD IRECTIONIRECTION
master development plan

The Preferred Direction Plan for North & East Lubbock
reflects a compilation of the best attributes of each of
the alternative concepts previously described. It rep-
resents a conceptual framework upon which to build
future planning concepts, implementation strategies,
and development actions.
Development activity in North & East Lubbock needs a
"critical mass" of activity in order to be successful and
effect long-range change. As a result of this philoso-
phy, it is proposed that North & East Lubbock target
development and redevelopment into two key zones of
activity - one in North Lubbock and one in East
Lubbock, as represented by the red dashed circles on
the accompanying map.
This strategy does not suggest that no development
activity take place in other areas. It does, however,
call for a concentrated effort in these two zones. It
should include the active promotion of development,
as well as the targeted use of development stimulus
tools.
The two zones can generally be described as:
1. The North Lubbock Zone
2. The East Lubbock Zone
THE NORTH LUBBOCK ZONE
Introduction
5-2
NNORORTHTH & E& EASTAST LLUBBOCKUBBOCK
PR E F E R R E D DI R E C T I O N
master development plan
THE EAST LUBBOCK ZONE
A Clustered Development Concept
I-27
UN
IVER
SITY
MLK

Preferred Direction Map - Core Community Revitalization
5-3
NNORORTHTH & E& EASTAST LLUBBOCKUBBOCK
PR E F E R R E D DI R E C T I O N
master development plan
FIGURE 5-Asource: Gould Evans Affiliates

The North Lubbock Zone encompasses approximately 1.75 square miles in area. It is
located just to the north of the North Overton Revitalization Project, the currently sub-
ject of substantial clearance and redevelopment effort. It is also just north and east
from the Texas Tech campus.
A significant impact on the area is the development of the Marsha Sharp Freeway,
which aligns with 4th Street, connecting with I-27 to the east. As the freeway passes
through the area, some segments to the west will be constructed below grade, while
segments to the east, approaching I-27, will be above grade. Extensive areas aligning
4th Street have already been cleared to accommodate the highway construction.
Whether above or below grade, the existence of the new freeway will have a significant
impact on the nature of potential development in the area.
The concepts for this zone should include:
1. Beautification of the right-of-way and its environs along the Marsha Sharp Freeway and portions of the University Avenue and Avenue U corridors
2. Housing infill, stabilization, rehabilitation, and new development in the area, particularly housing adjacent to the Marsha Sharp Freeway
3. New commercial development and stabilization, serving the community and the Texas Tech campus, replacing the commercial that has been undermined or removed due to the highway construction
4. Exploration of pedestrian, vehicular, and trail linkages between this zone and the North Overton Revitalization Project
5. Lessening the impact of the industrial uses on the surrounding residences
6. Engaging the green, linear corridor created by the Canyon Lakes parks and the destinations located corridor such as Fiesta Plaza
7. Better connecting this zone and Texas Tech by converting the abandoned rail line into a pedestrian trail, thereby linking Tech and the Canyon Lakes through Site 1
8. Gateway project along University Avenue
5-4
NNORORTHTH & E& EASTAST LLUBBOCKUBBOCK
PR E F E R R E D DI R E C T I O N
master development plan
The North Lubbock Zone

The East Lubbock Zone encompasses approximately 3.75 square miles in area. It is
located in an area bounded by the Canyon Lakes linear park to the south and west and
Loop 289 to the north and east. Parkway and Idalou provide major east-west thorough-
fares in the area, while Martin Luther King traverses the area in a north-south direc-
tion. A new shopping district, anchored by a grocery store, has been developed on
Parkway. The residential neighborhoods in the area represent a mix of character and
quality, and some areas in the zone remain in an agricultural use.
The concepts for this zone include:
1. Enhancing designated corridors with streetscape improvements, elevating their
character to “boulevard” status. Parkway, should be developed as a boulevard
connector to better link the North and East development zones. Likewise,
Broadway should be developed as a boulevard connector to better link East
Lubbock with downtown Lubbock.
2. Housing infill, stabilization, and rehabilitation in existing neighborhoods.
Targeting "cluster" residential development on current agricultural sites that help
complete the residential nature of the area.
3. Enhancing the two Parkway retail districts, including the new grocery store-
oriented district and the smaller commercial district at the intersection of
Parkway and Martin Luther King Jr., through aesthetic improvements, addition of
quality tenants, and improved pedestrian connections between buildings.
4. Targeting key vacant sites for residential and/or mixed-use development that
align with or overlook the Canyon Lakes.
5. Maintaining and enhancing institutions in the area as employment and
educational centers, as well as means for area stability.
6. Using “public anchors” as catalysts for infill/rehab and cluster site development.
5-5
NNORORTHTH & E& EASTAST LLUBBOCKUBBOCK
PR E F E R R E D DI R E C T I O N
master development plan
The East Lubbock Zone
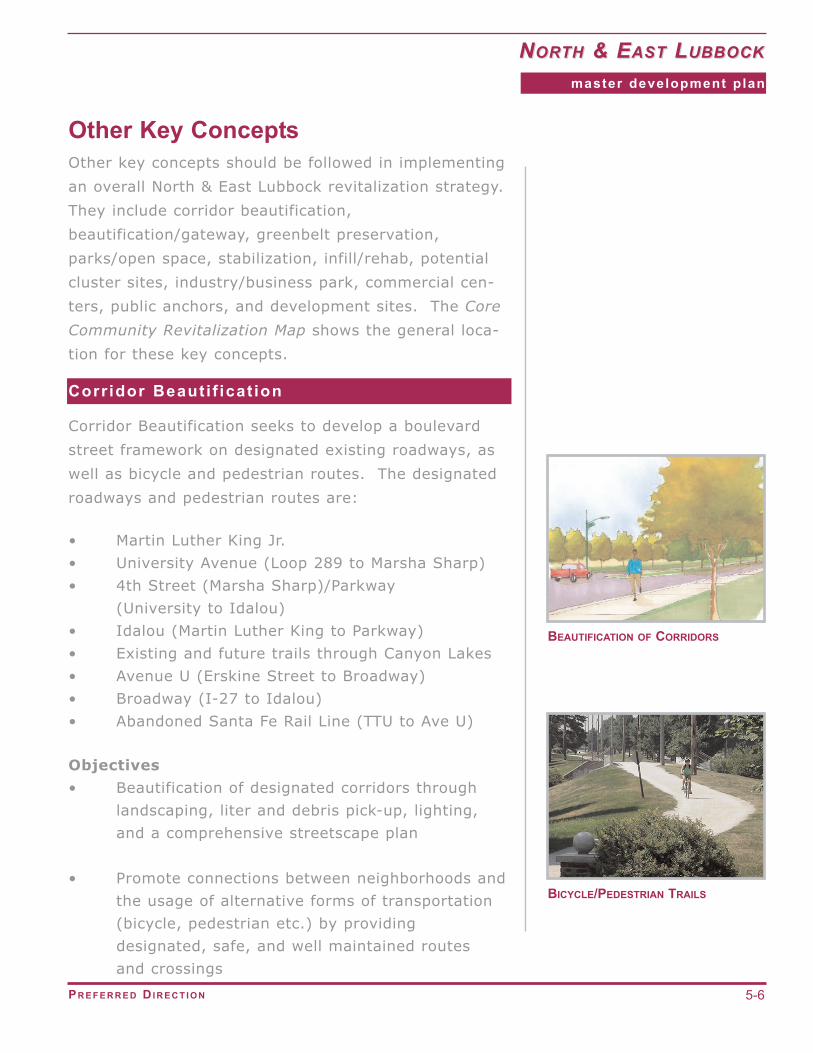
Other key concepts should be followed in implementing
an overall North & East Lubbock revitalization strategy.
They include corridor beautification,
beautification/gateway, greenbelt preservation,
parks/open space, stabilization, infill/rehab, potential
cluster sites, industry/business park, commercial cen-
ters, public anchors, and development sites. The Core
Community Revitalization Map shows the general loca-
tion for these key concepts.
Corridor Beautification seeks to develop a boulevard
street framework on designated existing roadways, as
well as bicycle and pedestrian routes. The designated
roadways and pedestrian routes are:
• Martin Luther King Jr.
• University Avenue (Loop 289 to Marsha Sharp)
• 4th Street (Marsha Sharp)/Parkway
(University to Idalou)
• Idalou (Martin Luther King to Parkway)
• Existing and future trails through Canyon Lakes
• Avenue U (Erskine Street to Broadway)
• Broadway (I-27 to Idalou)
• Abandoned Santa Fe Rail Line (TTU to Ave U)
Objectives
• Beautification of designated corridors through
landscaping, liter and debris pick-up, lighting,
and a comprehensive streetscape plan
• Promote connections between neighborhoods and
the usage of alternative forms of transportation
(bicycle, pedestrian etc.) by providing
designated, safe, and well maintained routes
and crossings
BEAUTIFICATION OF CORRIDORS
Other Key Concepts
5-6
NNORORTHTH & E& EASTAST LLUBBOCKUBBOCK
PR E F E R R E D DI R E C T I O N
master development plan
Corr idor Beaut i f icat ion
BICYCLE/PEDESTRIAN TRAILS

• Bring together North Lubbock and East Lubbock through improvements to the
Parkway corridor
• Reinforce and beautify the connection between eastern Lubbock and downtown
Lubbock by way of Broadway, as stated in the Canyon Lakes Master Plan
Feasibility Study
• Increase pedestrian connectivity, thereby decreasing Marsha Sharp divide,
between North Lubbock and Texas Tech/Overton Park through a designated trail
system along Avenue U and the abandoned Santa Fe rail line.
Beautification/Gateway seeks to develop
prominent gateways at key entrances into
the study area. The gateways should be
located on the designated boulevard sys-
tem creating “entrances” into Lubbock
and the study area. The designated gate-
ways should be located at:
• Martin Luther King Jr./Regis Street
• Broadway/Yellowhouse River
• University Avenue/2nd Street
• I-27/Parkway
• Idalou/Parkway
BROADWAYGATEWAYSOURCE: CANYONLAKES MASTERPLAN FEASIBILITYSTUDY
5-7
NNORORTHTH & E& EASTAST LLUBBOCKUBBOCK
PR E F E R R E D DI R E C T I O N
master development plan
Beaut i f icat ion/Gateway
GATEWAY EXAMPLE

Greenbelt Preservation seeks to preserve the agricultural
land and other undeveloped land that exists primarily out-
side of Loop 289.
Objectives
• Avoid the costly extension of public utilities, city
services, and infrastructure
• Avoid “leapfrog” development
• Attempt to maintain and/or increase overall land
value by reducing supply
• Focus resources on identified “zones”
• Protect and preserve the agriculture industry
Parks/Open Space represents the Canyon Lakes and all of
the parkland and open space incorporated into the linear
park. The 2,000 acres of park is arguably the greatest
asset located in the study area. Because of its size, natu-
ral beauty, and recreational and entertainment compo-
nents; Canyon Lakes has the opportunity to be a great cat-
alyst for future development. Canyon Lakes a planning
development “spine” of North & East Lubbock.
Objectives
• Enhance a timeless, enduring, multi-purpose
recreational resource for the City of Lubbock
• Improve connectivity between North Lubbock and
East Lubbock
• Use the park as catalyst for quality development
5-8
NNORORTHTH & E& EASTAST LLUBBOCKUBBOCK
PR E F E R R E D DI R E C T I O N
master development plan
GREENBELT PRESERVATION
MACKENZIE PARKSOURCE: CITY OF LUBBOCK
Parks/Open Space
Greenbelt Preservat ion

Stabilization seeks to either preserve or stabilize existing
neighborhoods. Stabilization neighborhoods are located
outside of the focus areas. Some neighborhoods within the
stabilization category are experiencing upward trends and
require minimal assistance. The goal for these neighbor-
hoods is to preserve their quality of life. Other neighbor-
hoods experiencing a downward trend may require greater
assistance. The goal for these neighborhoods is to stabi-
lize the negative trends and then reverse them.
Objectives
• Preserve or enhance quality of life in residential
neighborhoods that are not located in either zone
• Arrest deterioration of neighborhoods in decline
Infill/Rehab seeks to achieve “critical mass” by focusing
primarily residential development initiatives towards the
redevelopment of vacant or dilapidated property. The
Infill/Rehab category is only located within the focus areas.
Objectives
• Focus resources as catalysts to existing
neighborhoods
• Infill of vacant lots and the replacement of severely
dilapidated structures with quality housing
• Rehabilitation of existing housing structures
• Redevelop in neighborhoods where city services,
public utilities, and infrastructure already exist
HOUSING IN NEED OF REHAB
5-9
NNORORTHTH & E& EASTAST LLUBBOCKUBBOCK
PR E F E R R E D DI R E C T I O N
master development plan
Stabi l izat ion
STABILIZATION AREA(PRESERVE NEIGHBORHOOD)
Inf i l l /Rehab

Cluster Sites are designated areas within the two zones or
focus areas. The Cluster Sites are located on land that is
currently agriculture or otherwise undeveloped. Cluster
Sites are adjacent to existing residential neighborhoods or
Infill/Rehab areas. The intent of a Cluster Site is to direct
new subdivision development to predefined areas.
Developing these areas fills in the vacant land thereby con-
necting existing neighborhoods that are currently separat-
ed. Developing the Cluster Sites increases both the hous-
ing stock and population within the focus areas. This con-
centration of neighborhood growth, in turn, will improve
the market conditions necessary for retail growth.
Objective
• Concentrate new residential subdivision growth
within Focus Areas or zones
• Fill in vacant land between existing neighborhoods
Industry/Business Park seeks to promote and expand
Lubbock’s economic base, while at the same time minimize
the impact of industry on adjacent, less intense land uses.
Objective
• Concentrate existing and future industry to
designated employment centers
• Promote expansion of existing industry and
encourage development of new industry
• Use the Lubbock International Airport as a catalyst
for future economic growth - locate business park in
the vicinity of the airport
5-10
NNORORTHTH & E& EASTAST LLUBBOCKUBBOCK
PR E F E R R E D DI R E C T I O N
master development plan
Cluster Si tes
CLUSTER SITE ON 19TH STREET
LUBBOCK TERMINALSOURCE: LUBBOCK INTERNATIONALAIRPORT
Industry/Business Park

Commercial Centers seek to expand on and improve the
existing neighborhood centers by concentrating retail com-
mercial services into one general area. The new centers
will sufficiently serve the surrounding neighborhoods.
Objectives
• Improve upon existing commercial centers by
increasing the number and quality of services
provided
• Achieve a “critical mass” of businesses so further
growth and development can be fostered
• Promote access to centers by alternate forms of
transportation (bus, bicycle, pedestrian etc.)
Public Anchors seek to identify community assets and use
them as catalysts, or anchors, for future growth and devel-
opment. The Core Community Revitalization Map locates
seven public anchors. They include a fire station, parks,
and schools.
Objectives
• Use existing public anchors and catalysts for future
growth and development
• Locate future “public anchors” in areas where the
greatest positive impact can be made, yet make
certain that new “public anchors” are compatible
with the existing surrounding land uses
5-11
NNORORTHTH & E& EASTAST LLUBBOCKUBBOCK
PR E F E R R E D DI R E C T I O N
master development plan
Publ ic Anchors
EXISTING COMMERCIAL CENTER
STATE MENTAL HEALTH FACILITYSOURCE: TDMHMR
Commercial Centers

Development Sites seek to select and posi-
tion a number of high-priority and high-
potential projects to attract investments and
development attention. Four development
sites were chosen for additional analysis.
The development sites were selected
because they are the most likely to have a
lasting and catalytic impact on the study
area. The chosen development sites are all
located within the focus areas. Development
is also encouraged on smaller infill sites as
well. Figure 5-B shows the location of the
development sites within the study area.
The selected sites are the following:
1. University
2a. Erskine
2b. Hunt
3. Canyon Lakes
The analysis and implementation strategies
for the selected development sites can be
found in Section Six: Specialized Market
Analysis and Section Seven: Specific Site
Analysis and Implementation.
FIGURE 5-B: LOCATION OF DEVELOPMENT SITESSOURCE: GOULD EVANS AFFILIATES
5-12
NNORORTHTH & E& EASTAST LLUBBOCKUBBOCK
PR E F E R R E D DI R E C T I O N
master development plan
Development Si tes
HUNT SITE
CANYON LAKE SITE

SS ECTIONECTION SS IXIX
SS PECIALIZEDPECIALIZED
MM ARKETARKET AA NALNALYSISYSIS
master development plan

This sub-section presents a refined look at the housing
market, focusing on the sales potential of single-family
housing on the three sites identified as "potential develop-
ment sites" in the Preferred Direction. These conclusions
have been reviewed with builders, lenders and Realtors in
the Lubbock market and there is general agreement on
their reasonableness. The three sites are:
Site 2a (Erskine) - A site of approximately 30 acres at
the northeast quadrant of the intersection of Martin Luther
King Jr. Boulevard and Erskine Street. The site is currently
owned by the Lubbock Independent School District. The
North & East Lubbock Community Development
Corporation has targeted this site for acquisition and
development as a predominately single-family neighbor-
hood, possibly complemented by a retirement facility and,
along Martin Luther King Jr. Blvd, supporting commercial
use.
Site 2b (Hunt) - This site lies west of Martin Luther King
Jr. Blvd in the same vicinity as Site 2a. It wraps behind
Estacado High School and the now closed Hunt Elementary
School. The western edge of the property overlooks the
golf course at Mackenzie State Park. The entire site
encompasses 187 acres, of which a 24-acre parcel is under
consideration for a multi-family project since an allocation
of tax credits was awarded to the Lubbock Housing
Authority. Also, a large portion of the site could be poten-
tially acquired by the Lubbock Parks and Recreation
Department for development of additional parkland. While
the amount of land that might ultimately be available for
single-family development on Site 2b is uncertain, the
analysis nevertheless considers this to be the preferred use
of the property.
SITE 2B - HUNT
Residential
6-2
NNORORTHTH & E& EASTAST LLUBBOCKUBBOCK
SP E C I A L I Z E D MA R K E T AN A LY S I S
master development plan
SITE 2A - ERSKINE
SITE 3 - CANYON LAKES

Site 3 (Canyon Lakes) - The third site lies
south of 19th Street along the canyon rim
overlooking and currently a part of Mae
Simmons Park. The master plan for the
city's parks calls for the development of pri-
vate homes on the site, although a public
vote would be required to dispose of the
property. The site could accommodate about
a dozen homes.
As noted in the earlier sections of this report,
North & East Lubbock has been losing popu-
lation and housing for decades, although the
rate of decline has slowed. There have been
a few new homes built on scattered infill
sites in recent years. The pricing of existing
homes nevertheless is low, and there has
been no new construction beyond what are
generally considered "starter" homes for first
time homebuyers. Census statistics show,
however, that many existing homeowners
(and renters as well) have incomes that
would support higher priced housing, if it
were available and otherwise met the needs
and desires of the potential buyers. The pre-
sumption is that since there is no "move-up"
housing available in the neighborhood, many
people have moved out of the neighborhood
to south and west Lubbock, where such
housing is relatively abundant, or those who
wished to remain have stayed in their
homes. Therefore, the primary new housing
market, in the near term, is by current resi-
dents who wish to and can afford to upgrade
- or in some cases, former residents who
would like to return. Housing products that
are not now available could also attract new-
comers to Lubbock to locate in North & East
Lubbock, although that is more likely a
longer term result of the overall revitaliza-
tion of the area.
A key input to the analysis is the 2000
Census data on the income profile of owners
and renters in the study area, shown in Table
6-A.
Income Percent HouseholdsOwner occupied: 100.00% 3735
Less than $5,000 3.72% 139$5,000 to $9,999 12.62% 471$10,000 to $14,999 12.34% 461$15,000 to $19,999 10.52% 393$20,000 to $24,999 9.10% 340$25,000 to $34,999 17.03% 636$35,000 to $49,999 19.70% 736$50,000 to $74,999 8.90% 332$75,000 to $99,999 2.50% 93$100,000 to $149,999 1.53% 57$150,000 or more 2.05% 76
Renter occupied: 100.00% 2373Less than $5,000 13.28% 315$5,000 to $9,999 16.83% 399$10,000 to $14,999 17.79% 422$15,000 to $19,999 15.77% 374$20,000 to $24,999 8.29% 197$25,000 to $34,999 11.51% 273$35,000 to $49,999 10.02% 238$50,000 to $74,999 4.31% 102$75,000 to $99,999 1.25% 30$100,000 to $149,999 0.29% 7$150,000 or more 0.67% 16
TABLE 6-A: INCOME BY TENURE, NORTH & EAST LUBBOCKSOURCE: HAMMER, SILER, GEORGE ASSOCIATES
6-3
NNORORTHTH & E& EASTAST LLUBBOCKUBBOCK
SP E C I A L I Z E D MA R K E T AN A LY S I S
master development plan

From this data, a profile has been constructed of the price of housing that these residents could
qualify for based on income alone. Of course, not all of the current residents will be in the
market for new housing. Neither would all of those who are in the market be qualified nor
choose to purchase the highest price home for which they would qualify. It is, nevertheless,
a useful step in the analysis to convert incomes to housing price points.
In the profile shown in the table below:
• It is assumed that households could normally qualify for a home with a price equal to 2.5 times their income
• Only incomes of $20,000 or more and home prices of $50,000 are shown, recognizing that new homes cannot feasibly be produced for less than that amount. (Actually the minimum price for new homes is $60-65,000, and even this requires minimal land costs.Perhaps with some assistance from support programs in Lubbock, the price could be lower.)
• The percent of current owners and renters that could afford each indicated price point,or higher, is shown.
From Census data, the turnover rate of ownership and rental units-that is the actual number
of households that are "in the market" for different housing in a given year is calculated. This
is the market that a new housing product would be exposed to annually, and it provides the
basis from which to estimate the "capture" of any given project in consideration of its location,
competitiveness and pricing. Table 6-C
shows the percent of the owner and
renter households who moved into their
unit in the year prior to the 2000
Census. The table shows the calculated
rate for North & East Lubbock and the
city as a whole, as well as the rounded
rate used in the subsequent analysis.
Note that this confirms that the study
area is more stable than the rest of the
city.
Percent AboveQualifying Income
HousingPrice
QualifyingIncome Owners Renters
$50,000 $20,000 60.8% 36.4%$60,000 $24,000 50.0% 29.8%$70,000 $28,000 46.6% 24.6%$80,000 $32,000 39.8% 20.0%$90,000 $36,000 33.4% 15.9%
$100,000 $40,000 28.2% 13.2%$120,000 $48,000 16.3% 7.3%
TABLE 6-B: HOUSING PRICE POINTSSOURCE: HAMMER, SILER, GEORGE ASSOCIATES
6-4
NNORORTHTH & E& EASTAST LLUBBOCKUBBOCK
SP E C I A L I Z E D MA R K E T AN A LY S I S
master development plan

By multiplying the turnover rate by the
total households in each of the price
brackets over $50,000, in both the own-
ership and rental households, the market
that has both the opportunity and afford-
ability to consider new housing in the
target projects is quantified. That is,
they will be in the market, actively considering alternative housing choices, and they have the
income that would support housing products priced generally above that which can be found
in the area today. Of course, not all home buyers will choose to do so, but this still defines the
available market. Even some current renters may consider ownership, particularly if new prod-
ucts that are more to their liking than the existing re-sales now available. Of course, many
renters, even if income qualified, may prefer to stay renters or cannot qualify for a mortgage
on other grounds. To account for this, the potential market has been discounted from current
renters to one-third of those who are income qualified and expect to be in the housing market
by virtue of the normal turnover rate.
Taking these factors into consider-
ation, it is estimated that there is
a total market potential over the
next few years to support up to
221 units per year priced over
$50,000. Based on the income
profile, these would be distributed
as indicated in the Annual
Demand by Price Points Table 6-D.
It is important to note that this is
a potential market that new development can draw upon, not a projection of the total new units
that can be supported. In the earlier analysis, a total of up to 100 units per year were pro-
jected over the long run, through 2020, including both multifamily and single-family units.
That is a reasonable target. In contrast, the overall demand described above will not all be
satisfied in new projects. Some buyers will select less expensive re-sales in the area (as they
Housing Price By Owners By Renters Total$50,000-59,999 24 15 39$60,000-69,999 8 12 20$70,000-79,999 15 11 26$80,000-89,999 14 10 24$90,000-99,999 12 6 18
$100,000-119,999 26 14 40$120,000 and over 37 17 54
Total 136 85 221
TABLE 6-D: ANNUAL DEMAND BY PRICE POINTS, NORTH & EAST LUBBOCKSOURCE: HAMMER, SILER, GEORGE ASSOCIATES
6-5
NNORORTHTH & E& EASTAST LLUBBOCKUBBOCK
SP E C I A L I Z E D MA R K E T AN A LY S I S
master development plan
N&ELubbock
City ofLubbock
Used inCalculations
Owner occupied 5.56% 8.62% 6.00% Renter Occupied 30.60% 44.60% 30.00%
TABLE 6-C: ANNUAL TURNOVERSOURCE: HAMMER, SILER, GEORGE ASSOCIATES

do now) despite being able to afford a bigger or better home. Some will locate in the limited
supply of higher priced re-sales that exist in the area. to the Census, 19 percent of the owner-
occupied homes in 2000 were valued at over $50,000.) Others may still move out of the area
if they cannot find the specific combination of location, price and product that meets their
needs. Furthermore, this methodological approach capitalizes on a pent-up demand that may
not be sustainable over the long run.
The demand for any given project will be even more limited, as each would be tied to a spe-
cific location and would likely offer a limited range of products and pricing. In gauging demand
for each of the three targeted sites, the following factors have been considered:
• Site 2a (Erskine) - is likely to be the first to develop as the NELCDC is actively pursuing
it as its first project. The CDC is attempting to generate support programs, such as down pay-
ment assistance and favorable financing. These factors suggest that it would be most effective
in serving first-time homebuyers at the $60,000 to 90,000 price points.
• Site 2b (Hunt) - is potentially the largest (depending on how much of the site is available
for development) and, therefore, has the ability to develop and market a wider range of hous-
ing sizes and prices. The differing "edge" conditions surrounding the site also suggests tran-
sitioning to higher priced units closest to Mackenzie State Park and, perhaps, amenities that
the city parks department may develop. And finally, as the largest project, it can build an
image and environment over time that would allow a steady upgrading of the product and pric-
ing. Therefore, this site could accommodate a wider range of pricing than the other two.
• Site 3 (Canyon Lakes) - this site has the capacity for approximately a dozen homes; the
price for these homes is likely to be around $120,000. Given the spectacular setting, it is like-
ly to support the highest average prices of the three sites.
The Target Project Capture Rates and Demand table (6-E) shows the projected share or "cap-
ture" that each of the projects could achieve in each of the probable price ranges. Note that
the totals for the three projects do not sum to 100 percent in any one category for the rea-
sons stated earlier, and summing would only be meaningful in those few years when they
might be marketing simultaneously. In addition to the three projects, it is also expected and
6-6
NNORORTHTH & E& EASTAST LLUBBOCKUBBOCK
SP E C I A L I Z E D MA R K E T AN A LY S I S
master development plan

hoped that there would be continued infill of vacant lots, refurbishing and upgrading of exist-
ing homes, and other new developments within North & East Lubbock that will also serve sim-
ilar market segments.
6-7
NNORORTHTH & E& EASTAST LLUBBOCKUBBOCK
SP E C I A L I Z E D MA R K E T AN A LY S I S
master development plan
Percent Capture Annual Unit DemandHousing Price Annual Site 2a Site 2b Site 3 Site 2a Site 2b Site 3
$50,000-59,999 39 0.0% 0.0% 0.0% 0 0 0$60,000-69,999 20 30.0% 20.0% 0.0% 6 4 0$70,000-79,999 26 20.0% 40.0% 0.0% 5 10 0$80,000-89,999 24 20.0% 40.0% 0.0% 5 10 0$90,000-99,999 18 10.0% 30.0% 10.0% 2 5 2
$100,000-119,999 40 0.0% 20.0% 10.0% 0 8 4$120,000 and over 54 0.0% 0.0% 0.0% 0 0 0
Total 18 37 6
TABLE 6-E: TARGET PROJECT CAPTURE RATES AND DEMANDSOURCE: HAMMER, SILER, GEORGE ASSOCIATES

This sub-section presents a refined look at the commercial development potential of two areas
identified as "potential development sites" in the Preferred Direction. The analysis builds upon
the city-wide retail analysis and the range of development targeted for the overall North & East
area, but it focuses on the specific sites, their locational characteristics, and the trade areas
that might logically be served by and supporting each.
Site 1 - Development Site 1, as identified in the preferred direction, is a general area in North
Lubbock in the vicinity of University Avenue north of the intersection with 4th Street (now) and
Marsha Sharp Freeway (in the future). While a specific site was not identified, the physical
analysis presumes development on the triangle of land formed by Marsha Sharp, University,
and the Santa Fe right-of-way to the west. This includes what is left of the Town and Country
Shopping Center and a number of sparsely developed properties to the north. Whether this
property could be assembled for a cohesive development is unknown, but even if not, the mar-
ket analysis presented here would still be generally valid for other sites in the vicinity. The tri-
angle contains approximately 19 acres and can accommodate about 150,000 square feet of
development and associated surface parking.
Site 2a - This site is the LISD property at Martin Luther King Jr. Blvd and Erskine, as described
in the residential market analysis sub-section. The amount of the site that can or should be
dedicated to commercial use will depend, in part, on the findings of this analysis, but it is clear
in the Preferred Direction that the primary use of the site will be residential and commercial
development. It will also be supportive of the needs of the nearby community.
This sub-section presents the analysis of each site separately; and while the methodology is
similar for both, their settings, their trade areas, and development potential are quite differ-
ent.
Commercial
6-8
NNORORTHTH & E& EASTAST LLUBBOCKUBBOCK
SP E C I A L I Z E D MA R K E T AN A LY S I S
master development plan

The North Lubbock site will serve a large and diverse trade area. Fourth and University is
already a major intersection, with the Texas Tech campus at the southwest corner and the
Overton Park redevelopment in the southeast. The completion of the Marsha Sharp Freeway
will increase the accessibility and prominence of the area. Moreover, Overton Park not only
has removed a blighting influence, it will also generate new customers and set a new standard
of retail quality that will spin-off to adjacent properties, like the targeted site. It can be con-
cluded, therefore, that the primary residential trade area for the site will be a three-mile
radius, with substantial support from students who live outside the trade area and visitors to
campus events. This trade area, shown on Figure 6-A, extends south to 50th Street, west to
Slide Road, and north and east into the Study Area, but the bulk of the market served lies out-
side North & East Lubbock neighborhoods.
FIGURE 6-A: SITE 1 TRADE AREASOURCE: HAMMER, SILER, GEORGE ASSOCIATES
6-9
NNORORTHTH & E& EASTAST LLUBBOCKUBBOCK
SP E C I A L I Z E D MA R K E T AN A LY S I S
master development plan
Site 1 - Universi ty (North Lubbock)

Trade Area Expenditures and Sales Potential - As with
the city-wide analysis, the most important factor in esti-
mating retail potential is the spending potential of those
residing in the trade area. Using a similar methodology as
that analysis, the expenditures for the North Lubbock trade
area in key retail categories have been projected. In this
case, however, two major adjustments were made to the
current demographics:
• Based on the development program and the Overton
Park development program and the expected pricing
of the housing, (and associated incomes) it is
estimated that there will be about 6,400 new
residents, with a per capita income of about
$16,000. Thus, the total trade area will have a
population of 73,676 and a total personal income
(TPI) of $1.33 billion.
• The second adjustment was to account for the
expenditures of Texas Tech students who live
outside the trade area (those within the trade area
are already accounted for in the base population and
TPI), but who visit the campus almost daily.
According to Census reports on school enrollment,
there are about 14,000 undergraduate and graduate
students who live outside a three-mile radius from
the site. The estimates of student spending levels
were derived from surveys at other universities. An
average expenditure of $300 per month was used
for off-campus food and retail goods (rent, services
and entertainment are not included).
With these two adjustments, the total retail expenditures
will reach $388.3 million. At typical productivity levels
6-10
NNORORTHTH & E& EASTAST LLUBBOCKUBBOCK
SP E C I A L I Z E D MA R K E T AN A LY S I S
master development plan
TEXAS TECH UNIVERSITY STUDENTSIMPACT THE NORTH TRADE AREASOURCE: TTU

(sales per square foot), this will support over 1.3 million square feet of retail space, plus sup-
porting community-oriented services. The distribution of this potential among the various
retail categories is shown in the table below.
Potential Site Capture - The final step in the analysis is to estimate how much of this poten-
tial can be captured at the subject site. Except for the new development at Overton Park,
which accounts for about eight percent of the total expenditures, there is little new growth
expected in the trade area. So most of the sales potential is already being satisfied some-
where in the Lubbock community. And the Overton Park development itself will provide a sub-
stantial commercial component, approximately 200,000 square feet, which will more than sat-
isfy the demand generated by its residential components. Nevertheless there is an opportuni-
ty to develop new commercial space due to several factors:
Resident Expenditures
Student Adjustment
Total Expenditures Sales per SF Supportable
Square FeetShoppers Goods
General Merchandise $83,776,000 $8,024,000 $91,800,000 $250 367,200 Apparel and Accessories $30,159,000 $2,888,000 $33,047,000 $250 132,200 Furniture and Appliances $32,808,000 $3,142,000 $35,950,000 $250 143,800 Hardware and Home Centers $15,393,000 $1,474,000 $16,867,000 $250 67,500 Specialty Stores $13,277,000 $1,272,000 $14,549,000 $250 58,200 Subtotal $175,413,000 $16,800,000 $192,213,000 768,900
Eating and Drinking $58,822,000 $12,600,000 $71,422,000 $300 238,100
Convenience GoodsGrocery Stores $85,871,000 $9,651,000 $95,522,000 $400 238,800 Specialty Food $1,322,000 $149,000 $1,471,000 $250 5,900 Health and Personal Care $20,275,000 $2,279,000 $22,554,000 $250 90,200 Liquor $4,631,000 $521,000 $5,152,000 $250 20,600 Subtotal $112,099,000 $12,600,000 $124,699,000 355,500
TOTAL $346,334,000 $42,000,000 $388,334,000 1,362,500
Population 73,676Per Capita Income $15,383Total Personal Income (TPI) $1,133,394,075
TABLE 6-F: RETAIL POTENTIAL, NORTH LUBBOCK TRADE AREA RESIDENTS AND STUDENTSSOURCE: HAMMER, SILER, GEORGE ASSOCIATES
6-11
NNORORTHTH & E& EASTAST LLUBBOCKUBBOCK
SP E C I A L I Z E D MA R K E T AN A LY S I S
master development plan

• There is very little viable commercial space within the trade area. The area seems well
served by supermarkets and other convenience goods and some student-oriented
restaurants and bookstores; however, shoppers goods stores are lacking, suggesting
that these needs are now being met outside the trade area, most likely in the southern
tier of commercial activity paralleling Loop 289.
• The construction of the Marsha Sharp Freeway creates a whole new dynamic to the
commercial opportunities of the site. Not only does the new freeway create better
access, visibility and prominence to the location, but the construction itself has
dislocated some existing business and disrupted some existing shopping patterns that
will provide opportunities for new or relocated merchants to step in and serve the
market once the project is complete.
• The development of Overton Park will be beneficial in two important ways, despite
its own significant retail presence. First, it will help establish the general area as an
important retail node, serving well beyond the traditional student market at that
location. And second, as with any commercial project, Overton Park will have limited
opportunities for stores that are direct competitors. That will create the opportunity for
another development nearby to accommodate those who would compete. For example,
if Overton Park landed a Borders Books, that could provide the impetus for a Barnes and
Noble nearby.
• Even in an area that is well served by commercial development (and this area is not well
served) there are opportunities for new development in attractive locations. New
merchants may seek to enter the market, and existing merchants may need a new
location to expand. Also, there is constant change in the retail sector, and a
theoretically satisfied market does not preclude new development.
Therefore, the optimum development on the subject site would be somewhat a mirror image
of the Overton Park commercial site, with an emphasis on restaurants and few "medium" box
specialty stores.
6-12
NNORORTHTH & E& EASTAST LLUBBOCKUBBOCK
SP E C I A L I Z E D MA R K E T AN A LY S I S
master development plan

The situation at the East Lubbock site is
quite different from North Lubbock in sever-
al respects. The commercial development
on the site is intended to complement the
residential and to serve community needs for
goods and services now lacking on the east
side. Nevertheless, it would not become the
primary commercial node in East Lubbock.
That would remain along Parkway, surround-
ing or near the United supermarket. It is
well established and the logical base upon
which to expand commercial activity.
Furthermore, the location on Martin Luther
King Jr. Blvd at Erskine does not have the
traffic volume, accessibility, or visibility to be
a major commercial node, even if that was
the objective.
Because of the more limited scope of this
opportunity, the primary trade area has been
defined as a two-mile radius of the site,
which, as can be seen on Figure 6-B, encom-
passes most of the East Lubbock neighbor-
hood.
FIGURE 6-B: SITE 2A TRADE AREASOURCE: HAMMER, SILER, GEORGE ASSOCIATES
6-13
NNORORTHTH & E& EASTAST LLUBBOCKUBBOCK
SP E C I A L I Z E D MA R K E T AN A LY S I S
master development plan
Site 2a - Erskine (East Lubbock)

East Lubbock Trade Area Expenditures and Sales Potential - As with the North Lubbock
site, the trade area retail opportunities are tied to the expenditure potential of the trade area
residents and the competition for those dollars. Only in this case, the total retail expenditures
are less than a tenth of those for the North Lubbock site. As indicated in the table below, the
trade area TPI of $108.3 million will generate $33.0 million in retail sales, which in turn will
support 116,200 square feet of space.
The United supermarket satisfies the need for food stores in the area. Except for the adjacent
Family Dollar store, however, there is no competitive shoppers good outlet in the trade area.
The potential market is insufficient to support any significant new space. At most a few small
specialty stores such as books, music, gifts, home furnishings and clothing can be supported.
Resident Expenditures Sales per SF Supportable
Square FeetShoppers Goods
General Merchandise $8,002,000 $250 32,000 Apparel and Accessories $2,881,000 $250 11,500 Furniture and Appliances $3,134,000 $250 12,500 Hardware and Home Centers $1,470,000 $250 5,900 Specialty Stores $1,268,000 $250 5,100 Subtotal $16,755,000 67,000
Eating and Drinking $5,619,000 $300 18,700
Convenience GoodsGrocery Stores $8,203,000 $400 20,500 Specialty Food $126,000 $250 500 Health and Personal Care $1,937,000 $250 7,700 Liquor $442,000 $250 1,800 Subtotal $10,708,000 30,500
TOTAL $33,082,000 116,200
Population 10,678Per Capita Income $10,139Total Personal Income (TPI) $108,264,242
note: dollars in constant 2003 valuesTABLE 6-G: RETAIL POTENTIAL, EAST LUBBOCK TRADE AREA RESIDENTSSOURCE: HAMMER, SILER, GEORGE ASSOCIATES
6-14
NNORORTHTH & E& EASTAST LLUBBOCKUBBOCK
SP E C I A L I Z E D MA R K E T AN A LY S I S
master development plan

Restaurants are also in short supply, although the market should support more than the new
Sonic. The potential in the health and personal care category is sufficient to support a
Walgreen's or similar outlet, although United does have a prescription department and a full
line of personal care products.
The Martin Luther King Jr. site does have two features in common with the North Lubbock site,
although at a much smaller scale. First, the development opportunity is generated in large
part due to a change in the physical context of the site in North Lubbock due to the freeway
and Overton Park. Likewise, on Martin Luther King Jr. site, the development will be one of the
first new residential development in decades. In fact, it is the overall development activity of
the entire 30 acres that will justify the infrastructure, the involvement of the CDC, and effi-
ciencies that can make it a viable commercial development opportunity. The second is that the
high school directly across the street mimics the influence of students, in that they will provide
a supplemental support factor and a locational rationale for some potential tenants, particu-
larly, day-time oriented food service outlets, such as a Subway or pizzeria.
The commercial component must be small enough to not detract from the residential charac-
ter of the overall development. It should also be designed so that it appears to be an inte-
grated part of the project. The market analysis and design considerations suggest a pad or
two for freestanding restaurants and/or a drug store, and a multi-tenant flexible space for
restaurants, small shops, and service establishments such as cleaners, beauty/barber shop, or
a finance or insurance office. While the specific design should be developed in concert with a
developer and potential leasing agent, two pads accommodating buildings of about 6,000
square feet each are recommended (which could be combined, if necessary to accommodate
a larger user), and a multi-tenant building of 12,000-15,000 square feet.
6-15
NNORORTHTH & E& EASTAST LLUBBOCKUBBOCK
SP E C I A L I Z E D MA R K E T AN A LY S I S
master development plan

In the course of the public workshops and steering com-
mittee meetings, there was considerable interest in
attracting an "outlet mall" to the area as a means of
addressing the shortage of retail services in the neighbor-
hood. Consequently, a further analysis of the issue has
been undertaken as a part of the "specialized market
analysis".
The analysis has been based primarily on evaluating the
location patterns and criteria of outlet malls currently
located in Texas. Most of the large national developers of
such facilities are active in the state. The term "outlet
mall" is used, although most are indeed not enclosed
malls. In the industry, outlet malls (also called factory out-
lets, factory stores, and outlet projects) refer to shopping
centers that are tenanted primarily by stores owned and
operated by the manufacturers of the goods sold.
The listing of outlet malls in Texas was compiled from the
shopping center directory, published by the International
Council of Shopping Centers (ICSC), a separate listing pub-
lished by the Value Retail News (also a part of the ICSC),
2004 Global Outlet Project Directory, and an Internet
search of other sources. The 2004 Project Directory
included more detail on the centers it listed, but it did not
include all of the centers listed in the ICSC directory. This
information was supplemented with telephone calls and e-
mails to resolve conflicts in the individual center's current
name and characteristics. Twenty-five centers in Texas fit
the general definition of outlet mall. These are shown in
the Table 6-H, along with their pertinent characteristics.
OUTLET MALL
Outlet Malls
6-16
NNORORTHTH & E& EASTAST LLUBBOCKUBBOCK
SP E C I A L I Z E D MA R K E T AN A LY S I S
master development plan
OUTLET MALL
OUTLET MALL

There is a wide variety in the size of these centers. The largest, the "Mills" projects, are real-
ly regional shopping centers with a value orientation and with only a few true factory outlet
stores (and are noted as such in the directories). The New Braunfels Marketplace (formerly
the Mill Store Plaza) is reorienting itself and is no longer a true factory outlet center. The rest
generally conform to the definition of an outlet mall.
The Average Daily Traffic (ADT), reported for most of the centers listed in the 2004 Project
Directory, gives one indication of the criteria of the developers and tenants of such centers.
Location Size (SF). Year ADTAllen Premium Outlets Allen 348,000 2000 78,000Conroe Outlet Center Conroe 282,000 1992 134,624Denton Factory Stores Denton 135,232 1992Factory Stores of America Hempstead 63,605 1989 37,200Factory Stores of America Livingston 63,605 1989 23,600Factory Stores of America Sulphur Springs 84,917 1998Factory Stores of America Corsicana 63,605 1989Factory Stores of America Mineral Wells 63,609 1989Factory to You Outlet Center Sulphur Springs 110,000 1997Fort Worth Outlet Square Fort Worth 160,000 1977Gainesville Factory Shops Gainesville 316,000 1993 24,000Grapevine Mills Grapevine 1,300,000 1997Inwood Outlet Center Dallas 102,064 1987Katy Mills Katy 1,300,000 1999 60,000Las Entradas Factory Stores Hidalgo 225,000 1995New Braunfels Marketplace New Braunfels 264,066 1988Outlet Shops of La Marque La Marque 176,554 1990 48,000Prime Outlets at Hillsboro Hillsboro 359,000 1989 40,000Prime Outlets at San Marcos San Marcos 610,096 1990 77,500Richland Point N Richland Hills 163,831 1982Rio Grand Valley Factory Stores Mercedes 200,000 2004 53,000Sealy Outlet Center Sealy 191,865 1995 32,000Tanger Outlet Center San Marcos 663,170 1993 77,500Tanger Outlet Center Terrell 177,435 1994 47,850The Strand Outlet Stores Galveston 150,000 1989
Note: ADT is Average Daily Traffic
6-17
NNORORTHTH & E& EASTAST LLUBBOCKUBBOCK
SP E C I A L I Z E D MA R K E T AN A LY S I S
master development plan
TABLE 6-H: OUTLET MALLS IN TEXASSOURCE: HAMMER, SILER, GEORGE ASSOCIATES AND ISCS

High traffic volumes are a requirement, and
most exceed by a considerable margin, the
ADT along I-27 in Lubbock, which is 30,000
vehicles per day between Loop 289 and the
airport.
The most significant criterion appears to be
the size of the market served. While many
of the outlet malls are located in smaller
communities, they all serve the major met-
ropolitan regions of the state. As noted on
the accompanying map, virtually all are
located within 50 miles of Dallas, Houston, or
San Antonio. Those few that are not serve
tourist areas and border communities.
There are none currently located in west
Texas. There was at one time an outlet mall
in Lubbock, at what is now Wayland Baptist
University at Loop 289 and 19th Street.
FIGURE 6-C: OUTLET MALLS IN TEXASSOURCE: HAMMER, SILER, GEORGE ASSOCIATES AND ISCS
6-18
NNORORTHTH & E& EASTAST LLUBBOCKUBBOCK
SP E C I A L I Z E D MA R K E T AN A LY S I S
master development plan
Outlet Mal ls in Texas

Another factor to consider is recent trends in
the industry. There has been a great deal of
activity in buying and selling and expanding
existing centers and a sharp decline in the
development of new centers in new loca-
tions. As shown in the Table 6-I, only six new
outlet malls opened in the country in the last
three years, compared to an average of over
30 per year in the late 1980s and early
1990s, according to the industry publication,
Value Retail News. In contrast, there are 12
centers that have announced expansion
plans for 2004.
Based on the above facts, it is not believed
an outlet mall is a viable opportunity for
Lubbock in general, or the North & East
neighborhoods specifically. The broader
market region does not meet the threshold
standards. The traffic volume on I-27 is
insufficient and without enough through,
tourist traffic to make it attractive.
Should a developer seek a location in
Lubbock, the city should be prepared to
assist with incentives and a suitable site to
offer. Possible appropriate sites could
include the new interchange of Marcia Sharp
Freeway and I-27, University and Loop 289,
and an exit on I-27 in the vicinity of the air-
port. But in the context of a development
and action plan for North & East Lubbock, an
outlet mall should not be a high priority for
community action or expectations.
YEAR NUMBER % Change
1988 361989 43 19%1990 40 -7%1991 25 -38%1992 26 4%1993 32 23%1994 27 -16%1995 22 -19%1996 13 -41%1997 7 -46%1998 7 0%1999 5 -29%2000 5 0%2001 3 -40%2002 1 -67%2003 2 100%
TABLE 6-I: NEW OUTLET MALLS OPENED NATIONALLYSOURCE: VALUE RETAIL NEWS
6-19
NNORORTHTH & E& EASTAST LLUBBOCKUBBOCK
SP E C I A L I Z E D MA R K E T AN A LY S I S
master development plan
Conclusion

SS ECTIONECTION SS EVENEVEN
SS ITEITE DD ESIGNESIGN
master development plan

Within the study area, four specific sites
were selected as high-priority and high-
potential projects with the idea of attracting
both investment and development attention.
The four selected sites are referred to as:
1. University
2a. Erskine
2b. Hunt
3. Canyon Lakes
In Section Six, the present and anticipated
market conditions of each specific site were
analyzed and, based on these market forces,
it was determined what type of future devel-
opment is most suitable for each site. This
section depicts the best way in which each
suitable use can be planned while meeting
the market determinations. In addition to
the specific site designs, a sub-section
describing the preferred form and function
for future design is included. These basic
guidelines promote quality and sustainability
for the specific development sites and the
overall study area.
The four sites were chosen after extensive
analysis of the physical assessment and
input from city officials and the general pub-
lic. All four sites are within close proximity
to existing transit lines, are served by exist-
ing water and sewer lines, and have a high FIGURE 7-A: LOCATION OF DEVELOPMENT SITESSOURCE: GOULD EVANS AFFILIATES
Introduction
7-2
NNORORTHTH & E& EASTAST LLUBBOCKUBBOCK
SI T E DE S I G N
master development plan
site developability rating (Section Two).
Three of the four sites are vacant parcels,
eliminating demolition costs. Only Site 1 has
existing structures on site, however, all the
existing structures were rated in poor to fair
condition, making potential acquisition less
costly.
Most importantly, all four sites are located
inside the Focus Areas or designated zones
(discussed in Section Five), keeping the
development sites in compliance with the
preferred direction - Core Community
Revitalization - and the vision and goals set
forth in this plan.

Location - Site 1 is located at the northwest
corner of the University Avenue/4th Street
(future Marsha Sharp Freeway) intersection.
The north and west side of the site is bound-
ed by the abandoned Santa Fe Railroad line.
Site 1 is technically located outside of the
North & East Lubbock Study Area; the study
area’s western boundary is University
Avenue. However, the site was chosen
because it has the potential to greatly bene-
fit the adjacent North Lubbock area, while at
the same time having minimum negative
impact.
Area Size - Approximately 840,000 sq. ft.
or 19 acres
Existing Land Use - The dominant land use
on Site 1 is currently commercial.
Commercial Retail and Commercial Service
are the most prevalent uses. Both residen-
tial and vacant land also exist on the site. In
addition, a public utility company owns a
parcel located on a portion of the develop-
ment site. The property is in use and unlike-
ly to be moved, creating a potential con-
straint.
Preferred Use - Based on analysis and
community input, it was determined that
the optimum use for Site 1 would be com-
mercial retail and multi-family residential.
FIGURE 7-B: SITE 1 AND VICINITYSOURCE: GOULD EVANS AFFILIATES
Site 1 - University
7-3
NNORORTHTH & E& EASTAST LLUBBOCKUBBOCK
SI T E DE S I G N
master development plan
Site Descript ion
FIGURE 7-C: EXISTING LAND USE - SITE 1 SOURCE: GOULD EVANS AFFILIATES

Opportunities and Constraints - Site 1 appears to have
the most opportunities and constraints. The opportunities
include neighboring Texas Tech, the Overton Park redevel-
opment, and the future Marsha Sharp Freeway. The con-
straints include the grade separation of the future Marsha
Sharp Freeway, the public waterworks facility, existing
structures that have not been razed, and the numerous
existing property owners.
Because of the close proximity of Texas Tech, the opportu-
nity is created to service the demand created for both retail
and housing needs. Likewise, Site 1 could benefit from the
additional traffic volumes predicted to be created by the
future Marsha Sharp Freeway. Finally, with the develop-
ment of Overton Park to the south, University Avenue has
the potential to become a vibrant corridor again.
The Marsha Sharp Freeway creates some opportunities for
the site, however, the freeway expansion also creates a
constraint on site access which is hindered by the limited
access design, grade separation and planned one-way
frontage roads. The public utilities facility will most likely
remain in its current location. This is a constraint, because
it limits the design options for the site. Finally, there are a
number of buildings that still exist on the site and are
owned by various property owners. This is also a con-
straint because of the additional time and funds needed to
first acquire the land and then raze the existing structures.
LAND CLEARED FOR FUTURE THEMARSHA SHARP FREEWAY
7-4
NNORORTHTH & E& EASTAST LLUBBOCKUBBOCK
SI T E DE S I G N
master development plan
EXISTING RETAIL ON SITE 1
OVERTON PARK (UNDER CONSTRUCTION)

The proposed development site is located on the edge of
the study boundary and bordered by University Avenue to
the east, Fourth Street (Marsha Sharp Freeway) to the
south, and the abandoned Santa Fe Railroad to the north.
The Marsha Sharp freeway development will require acqui-
sition of a large portion of the site leaving approximately
15 acres suitable for development. The proposed develop-
ment would be mixed use and consist of two retail centers,
two pad sites, and multi-family housing. Access to the site
would be enhanced by the extension of Third Street from
University Avenue to the access road for the Marsha Sharp
Freeway.
There are two retail developments within the site. The
larger of these is located at the intersection of University
Avenue and Marsh Sharp Freeway providing 60,000 square
feet of specialty/boutique shops, dining and entertain-
ment. The development would be pedestrian oriented with
interior courtyards and enhanced landscaping and site
amenities. Access would be from the Third Street exten-
sion and parking would be provided near store fronts to
allow ease of access.
The second retail development is located north of Third
Street and fronts on University Avenue. This center would
contain 20,000 square feet of development and should
have a common architectural style and theme with the
other proposed retail center. The focus of this develop-
ment would be to provide goods and services to the adja-
cent neighborhoods. Access would be from University
Avenue and the Third Street extension with parking pro-
vided near store fronts to allow ease of access.
7-5
NNORORTHTH & E& EASTAST LLUBBOCKUBBOCK
SI T E DE S I G N
master development plan
Site Design
RENDERING OF STREETSCAPE LIGHTINGFOR SITE 1 AND UNIVERSITY AVENUE
EXAMPLE OF SCALE AND CHARACTEROF SITE 1
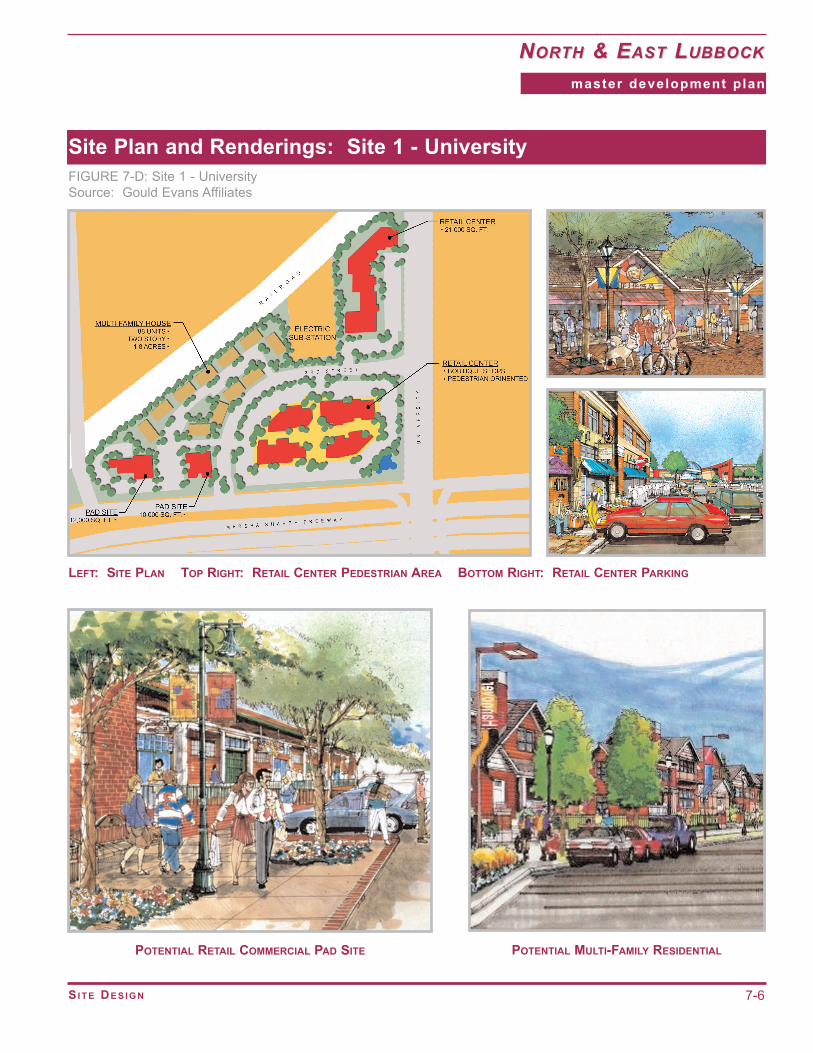
Site Plan and Renderings: Site 1 - University
7-6
NNORORTHTH & E& EASTAST LLUBBOCKUBBOCK
SI T E DE S I G N
master development plan
FIGURE 7-D: Site 1 - UniversitySource: Gould Evans Affiliates
POTENTIAL RETAIL COMMERCIAL PAD SITE POTENTIAL MULTI-FAMILY RESIDENTIAL
LEFT: SITE PLAN TOP RIGHT: RETAIL CENTER PEDESTRIAN AREA BOTTOM RIGHT: RETAIL CENTER PARKING

Two pad sites are located along the west end of the site adjacent to the Marsha Sharp Freeway
and provide 22,000 square feet of development.
On the western edge of the site, adjacent to the abandoned railroad right-of-way, 88 units of
multi-family housing are proposed. The development would consist of two stories, 8 unit build-
ings consistent with architectural theme of the retail structures. The new neighborhood would
be similar to the new housing developments currently underway in the Overton North area.
This development area offers some unique opportunities and challenges for pedestrian con-
nections to Texas Tech, North Overton, and the neighborhoods north and west of the site. The
development of the Marsha Sharp Freeway creates a major pedestrian barrier between this
development site and Texas Tech and North Overton. Special consideration should be given to
providing enhanced pedestrian access across the freeway that encourages walking, jogging,
and bicycling as alternative transportation methods. The abandoned railroad right of way north
of the development site offers an opportunity to provide a pedestrian connection to the neigh-
borhoods north of the development site.
7-7
NNORORTHTH & E& EASTAST LLUBBOCKUBBOCK
SI T E DE S I G N
master development plan

Location - Site 2a is located at the north-
east corner of the Martin Luther King
Jr./Erskine intersection and in the eastern
portion of the study area. Site 2a is within
Loop 289 and adjacent to Estacado High
School.
Area Size - Approximately 1,311,000 sq. ft.
or 29 acres
Existing Land Use - The existing land use
of Site 2a is considered Vacant Un-subdivid-
ed. Two parcels, the first roughly 19 acres
and the second roughly 10 acres, make up
Site 2a. The current land use to the north
and east is classified as Industrial-Non
Manufacturing, however, the land is current-
ly vacant. To the south, a higher density
gated residential development and church
are located, and Estacado High School lies to
the west.
Preferred Use - Based on analysis and
community input, it was determined that
the optimum use for Site 2a would be pri-
marily single family residential with some
commercial and higher density residential in
the form of senior housing.
FIGURE 7-E: SITE 2A AND VICINITYSOURCE: GOULD EVANS AFFILIATES
Site 2a - Erskine
7-8
NNORORTHTH & E& EASTAST LLUBBOCKUBBOCK
SI T E DE S I G N
master development plan
Site Descript ion
FIGURE 7-F: EXISTING LAND USE - SITE 2ASOURCE: GOULD EVANS AFFILIATES

Opportunities and Constraints - Site 2a is currently owned by the Lubbock Independent
School District (LISD). In an attempt to reverse declining school enrollment in the study area,
LISD has decided to sell the two parcels to the North & East Lubbock CDC at below market
level prices with the idea that the CDC would develop new housing. As stated in Section Six,
the minimal cost in both time and funds to acquire the property has made Site 2a a likely site
for early development. If the CDC cannot successfully acquire the site at below market cost,
however, then it will become more problematic to implement this future development.
The proposed 29 acre development site is located at the northeast corner of the intersection
of Martin Luther King Jr. Blvd. and East Erskine Street. The proposed development would be
mixed use and consist of one retail center, single family residential, and senior citizen housing.
The retail development would be located on 3 acres and contain 15,000-20,000 square feet of
businesses to serve local and neighborhood needs. The retail center would be designed for
ease of access and linked to the proposed neighborhood by a green pedestrian corridor.
The 23 acre single family development would provide approximately 117 lots or about 5 lots
per acre. The housing units would be typical construction for the area and range in cost from
$60,000-$100,000. The street system would be designed to allow future, adjacent residential
developments to blend with the site creating the greater sense of neighborhood. A central
wooded green belt with trails is proposed that would link the retail center, residential areas and
the future park site.
The southern edge of the site contains a three acre senior housing development. The devel-
opment would contain 30 units of about 550 square feet each. The senior housing was locat-
ed to provide ease of access to the development site and close pedestrian access to the retail
center.
7-9
NNORORTHTH & E& EASTAST LLUBBOCKUBBOCK
SI T E DE S I G N
master development plan
Site Design

Site Plan and Renderings: Site 2a - Erskine
7-10
NNORORTHTH & E& EASTAST LLUBBOCKUBBOCK
SI T E DE S I G N
master development plan
FIGURE 7-G: Site 2a - ErskineSource: Gould Evans Affiliates
LEFT: NEIGHBORHOOD STREETSCAPE AND PARK TOP RIGHT: POTENTIAL MIXED USE AT CORNER OF MLK/ERSKINEBOTTOM RIGHT: STREET FURNITURE OF BUS STOP AT NEIGHBORHOOD MIXED USE CENTER

Location - Site 2b is located just west of
Martin Luther King Jr., behind the vacated
Hunt Elementary School. At 190 acres, Site
2b is by far the largest site in size and is laid
out between existing neighborhoods and a
golf course. The site is flat and undevel-
oped.
Area Size - Approximately 8,300,000 sq. ft.
or 190 acres; largest of the four
sites
Existing Land Use - Site 2b is primarily
classified as Agriculture. A small portion of
the site, however, is classified as Vacant
Unsubdivided. Site 2b surrounds the vacant
Hunt Elementary School on three sides. To
the west and south, Canyon Lakes Parks
System is located and to the northwest and
southeast are low-density residential neigh-
borhoods.
Preferred Use - Due to the vistas and views
created by the adjacent park and the
Lubbock Park & Recreation Department’s
desire to develop additional park land, a
regional park with an outlining single family
residential neighborhood is recommended.
Opportunities and Constraints - Site 2b
benefits from the neighboring uses that
include the Canyon Lakes Park System, a
golf course, Estacado High School, and the
FIGURE 7-H: SITE 2B AND VICINITYSOURCE: GOULD EVANS AFFILIATES
Site 2b - Hunt
7-11
NNORORTHTH & E& EASTAST LLUBBOCKUBBOCK
SI T E DE S I G N
master development plan
Site Descript ion
FIGURE 7-I: EXISTING LAND USE - SITE 2BSOURCE: GOULD EVANS AFFILIATES

vacant Hunt Elementary School. Site 2b also benefits from
the Lubbock Park and Recreation Department’s desire to
construct youth sport facilities on a large portion of the
site.
The neighboring Canyon Lakes Park System and golf
course are located in a valley below Site 2b. The serene
views and vistas created by the topography can be used to
create demand for future housing. Estacado High School
is a quality school with modern facilities. A strong local
school system greatly assists the development of housing
and the stabilization of property values. The vacant Hunt
Elementary School could be incorporated into the site
design as a neighborhood community center. The vacant
facility has classrooms, a gymnasium, and surrounding
open space ideal for community centers. In addition, the
potential purchase of a portion of the site by the Parks and
Recreation Department creates a desirable amenity and
another public anchor. With proper site design, new hous-
ing could dramatically benefit from a new park. An
increase in both demand and property value could result.
The property making up Site 2b is privately owned. This
means there is uncertainty concerning land valuation, the
ability for the Parks and Recreation Department to pur-
chase the land, or even if the land owner wants to sell.
This is a constraint to the potential future housing and its
ability to be implemented. The site design is contiguous to
the development of the future park. Without the park the
site plan will more than likely require changes in order to
be successfully implemented.
EXAMPLE OF YOUTH SPORTS PARK
7-12
NNORORTHTH & E& EASTAST LLUBBOCKUBBOCK
SI T E DE S I G N
master development plan
EXISTING CONDITION OF SITE 2B

The 148 acre development site is located west of Martin Luther King Jr. Blvd. and east of the
Meadow Brook Golf Course. The proposed development would center around a 82 acre park
currently proposed by the City of Lubbock in this area that includes athletic facilities, practice
fields, and open recreation areas.
Hunt Elementary School is located in the center of this development site. The school is vacant
and the school district has no current plans to reopen. The facilities at this school are in good
condition and present an excellent opportunity for adaptive reuse. Possible uses for this facil-
ity could be as a neighborhood/community center that would serve the surrounding neighbor-
hoods and also support the new park facilities.
The 48 acre single family development would provide approximately 192 lots or about 4 lots
per acre. The housing units would be of typical construction for the area and range in cost from
$80,000-$100,000. The street system would be designed to blend the neighborhood with
existing developments. The majority of the housing would take advantage of the two
enhanced view opportunities of the site. The first of these are the lots facing west overlook-
ing the Meadow Brook Golf Course and the Yellow House Canyon. The view from these lots is
dramatic and will provide an enhanced lot value. The second enhanced view opportunity is into
the park. Historically residential lots adjacent to well maintained park facilities are considered
more desirable also providing greater lot value.
A 17 acre multi-family development is located on the eastern edge of the site between North
Emory Street and the proposed park. The site would contain 80 four-plex single story units
typical of similar construction in the area. The development would have direct access to the
new park and be adjacent at the proposed neighborhood center at Hunt Elementary School.
7-13
NNORORTHTH & E& EASTAST LLUBBOCKUBBOCK
SI T E DE S I G N
master development plan
Site Design

Site Plan and Renderings: Site 2b - Hunt
7-14
NNORORTHTH & E& EASTAST LLUBBOCKUBBOCK
SI T E DE S I G N
master development plan
FIGURE 7-J: Site 2b - HuntSource: Gould Evans Affiliates
TOP LEFT: SITE PLANTOP RIGHT: PARK ENTRANCEBOTTOM RIGHT: PARKGATEWAYBOTTOM LEFT: NEIGHBORHOODENTRANCE

Location - Site 3 is located east of Martin
Luther King Jr., and south of 19th Street. At
17 acres, Site 3 is the smallest site of the
four, is roughly one parcel long but four
blocks wide. Site 3 is located on top of the
bluff that overlooks the Lake 6 area of the
Canyon Lakes Park System. A pedestrian
trail and the scenic Canyon Drive are just
south of the site.
Area Size - Approximately 729,200 sq. ft.
or 17 acres; smallest of the four
sites
Existing Land Use - Site 3 is owned by the
Lubbock Parks and Recreation Department
and is currently open space. The Canyon
Lakes Linear Park System is located to the
south and west of Site 3. Existing residen-
tial neighborhoods can be found to the north
and east.
Preferred Use - The agreed upon preferred
use for Site 3 is single family residential.
This is in compliance with the Canyon Lakes
Master Plan Feasibility Study. The site is too
narrow for most other uses, and the existing
views and vistas are sweeping and dramatic.
Because of the views overlooking the park
and lake, Site 3 is most likely to attract the
highest home prices out of the four sites.
FIGURE 7-K: SITE 3 AND VICINITYSOURCE: GOULD EVANS AFFILIATES
Site 3 - Canyon Lakes
7-15
NNORORTHTH & E& EASTAST LLUBBOCKUBBOCK
SI T E DE S I G N
master development plan
Site Descript ion
FIGURE 7-L: EXISTING LAND USE - SITE 3 SOURCE: GOULD EVANS AFFILIATES

Opportunities and Constraints - Site 3 is arguably the most desirable of the four sites for
residential use. The site is surrounded by park land on three sides and refurbished/new sin-
gle family homes on the fourth side. The major constraint is that the land is currently owned
by the Lubbock Parks and Recreation Department. In order for the public park land to be sold
for private development, the citizens of Lubbock will have to approve the transaction by major-
ity vote.
Getting the issue on an election ballot will take a substantial political and economic effort.
However, with the vocal support of the North & East council members, it is quite possible to
accomplish this task. Once on the ballot, citizens of Lubbock need to be informed that the park
land is not being sold to a private developer, but rather to the CDC. Also, it is important to
note that the land development was recommended in the Canyon Lakes Master Plan Feasibility
Study. These two factors may raise the confidence of voters.
The development site is located east of Martin Luther King Jr. Blvd. and south of Spruce Street.
Of the 17 acre site, roughly 7 acres would be used for a single family development that would
have approximately 15 lots at about 2 lots per acre. The housing units would be typical con-
struction for the area and range in cost from $100,000-$120,000. The housing would take
advantage of the enhanced view opportunity overlooking the Yellowhouse Canyon and lake.
The view from these lots is dramatic and should provide an enhanced lot value. Careful con-
sideration must be taken to insure the security of the private property owners and still allow
open views of the canyon. The remaining 10 acres would be left as park land. This is due to
the steeper contours at the south end of the development site.
7-16
NNORORTHTH & E& EASTAST LLUBBOCKUBBOCK
SI T E DE S I G N
master development plan
Site Design
POTENTIAL RESIDENTIALSCALE AND CHARACTEROF SITE 3

Site Plan and Renderings: Site 3 - Canyon Lakes
7-17
NNORORTHTH & E& EASTAST LLUBBOCKUBBOCK
SI T E DE S I G N
master development plan
FIGURE 7-M: Site 3 - Canyon LakesSource: Gould Evans Affiliates
TOP: SITE 3 SITE PLANBOTTOM LEFT: TOPOGRAPHIC VIEW OF HOUSING AND CANYON LAKES PARKBOTTOM RIGHT: LOOKING SOUTH FROM 19TH STREET OVER PARK; VIEW FROM BACKYARD OF POTENTIAL HOUSING

Good design is paramount to the sustained development
and longevity of any community. The identity of a com-
munity or neighborhood is often times determined by its
aesthetics, scale and character, and quality of design.
Design is more than simply the face of buildings, but
expands to include the quality of materials, the scale of
public spaces and neighborhoods, pedestrian linkages
between land uses, streetscapes, green spaces and the
community’s willingness to accept innovation. The Form
and Function sub-section is located in Section Seven
because it can be most applicable to the specific site design
and analysis completed on the four potential development
sites. However, these design concepts should be incorpo-
rated into any and all future development proposed for
North & East Lubbock.
This section provides policy guidance on design principles
that can help bring about North & East Lubbock’s vision.
This section is organized by the overall general design
objectives and design objectives that are specific to the
basic “components” of the study area. These basic com-
ponents are corridors, nodes, and neighborhoods or dis-
tricts. The general design and three component categories
are then divided into the sub-categories public rights-of-
way, buildings, site access and circulation, public or open
space, and transitions. Preferred forms of design that per-
tain to the sub-category then are listed.
NODE EXAMPLE
Form and Function
7-18
NNORORTHTH & E& EASTAST LLUBBOCKUBBOCK
SI T E DE S I G N
master development plan
CORRIDOR EXAMPLE
NEIGHBORHOOD OR DISTRICTEXAMPLE

General Design looks at the overall concept of proper design based on the five sub-categories.
Public Rights-of-Way
• Public rights-of-way are the single largest public space in the city. Therefore, they
should be designed to reflect the city's pride and its priorities. Streets should not only
be designed to get people someplace but also be designed to be "someplace."
• All rights-of-way should be designed as shared public space, balancing safety,
connectivity, and transportation needs for pedestrians, bicycles, and motor vehicles.
• All streets should be laid out to provide multiple alternative routes to areas within the
study area, often providing a different pace or character along any of the routes
that an individual may choose to take.
• Design vehicle speeds should be compatible with the functions of adjacent land uses.
• Public art should be incorporated into right-of-ways
Buildings
• Buildings should be designed with the greatest attention paid toward public spaces.
Architectural features, quality building materials, building openings and entrances
should concentrate toward areas with the greatest public exposure. However, all sides
of a building should be designed with comparable materials and architectural styles.
• Architectural diversity and creativity should be encouraged and rewarded to avoid dull
or homogeneous buildings.
• High-impact building elements, such as loading docks, drive-through facilities,
mechanical equipment, storage areas, or vehicle service bays, should be oriented away
from public streets wherever possible.
• Exterior lighting should be provided at a pedestrian scale and should coordinate with
building architecture and landscape materials.
7-19
NNORORTHTH & E& EASTAST LLUBBOCKUBBOCK
SI T E DE S I G N
master development plan
General Design

Site Access and Circulation
• All sites should be accessible by a variety of
transportation modes including pedestrian,
bicycle, and motor vehicle. Wherever feasible and
supportive of planned or existing land uses,
improvements of connections to rail and the airport
should also be sought.
• Link adjacent sites physically and perceptually, even
when they are not being developed simultaneously.
Design techniques that link sites should discourage
multiple short automobile trips that increase parking
needs and traffic congestion.
Public or Open Spaces
• Establish a hierarchy of public or open spaces,
recognizing that it is the quality, location, and
accessibility of the open and public space network
and not simply the quantity that adds value to the
community.
• Link open spaces throughout the community
through a variety of methods, including trails or
greenways, public streets, and when physical
connection is not possible - through visual
connections.
• Concentrate public and open spaces central to
neighborhoods, corridors, or nodes to provide the
greatest impact, rather than relegating open space
to a series of disconnected, remnant parcels on
individual sites.
• Use natural systems and corridors for common or
public open spaces.
ARCHITECTURAL DIVERSITY ANDCREATIVITY SHOULD BE ENCOURAGEDAND REWARDED
7-20
NNORORTHTH & E& EASTAST LLUBBOCKUBBOCK
SI T E DE S I G N
master development plan
LINK OPEN SPACE BY TRAILS
SMOOTH TRANSITION

Transitions
• Corridors should occasionally be interrupted by nodes or intersect with neighborhoods
or districts. Where corridors are interrupted by a node or intersect neighborhoods or
districts, its design should demonstrate a smooth transition to reflect the character of
this new area.
• Corridors may function as the edge of a neighborhood or district.
• Neighborhoods or districts should have an identifiable edge and an identifiable center
that are distinct from each other, with suitable transitions.
• Nodes should be connected by corridors. Nodes may function as the center of a
neighborhood or district.
Corridors can be defined as the linear route between points. Corridors can follow roadways,
pedestrian trails, waterways, or parks.
Public Rights-of-way
• Predominant travel patterns are linear along the length of a corridor. However, side
streets should provide frequent access points to the corridor. Cross-corridor travel
patterns may be less frequent typically concentrated at a node along the corridor.
• Sidewalks should be separated from the street edge by a landscaped planting strip.
• Street trees should be located frequently enough to provide a definable edge to the
street.
• Pedestrian crossings of the corridor should be concentrated at strategic locations along
the corridor. Intersection treatments that shorten pedestrian crossing treatments or
provide pedestrian refuge are encouraged.
7-21
NNORORTHTH & E& EASTAST LLUBBOCKUBBOCK
SI T E DE S I G N
master development plan
Corr idor Design Principles

Buildings
• Buildings should provide a stronger sense of physical definition along corridors.
Buildings shall provide a consistent front building line along the length of the corridor.
The building line may be brought closer to the right-of-way provided sufficient space
remains for green space, streetscape improvements, and improved pedestrian
amenities - particularly at key corridor intersections.
• Avoid long expanses of blank building facades without architectural relief. Architectural
relief typically consists of a combination of windows or storefronts, primary entrances,
and structural or decorative deviations along long wall or roof planes.
• Any areas between buildings and the right-of-way should be designed and landscaped
consistently along the length of the corridor. This is most often accomplished with
similar landscape treatments, which can occasionally be complemented by small
decorative walls or fences.
Site Access and Circulation
• Where possible, vehicular access to sites should be concentrated along the corridor.
This minimizes curb cuts and provides a more consistent setting for pedestrians. Shared
mid-block access points or site access from side streets is encouraged for corridors.
• Parking behind buildings is encouraged. Where parking must be located to the side of
buildings or where it must be in front of buildings, the side of buildings is the preferred
7-22
NNORORTHTH & E& EASTAST LLUBBOCKUBBOCK
SI T E DE S I G N
“Sidewalks should be
separated from the street
edge by a landscaped
planting strip”
master development plan
CORRIDOR ILLUSTRATIONSOURCE: GOULD EVANS AFFILIATES

location. All parking should be screened from the
public right-of-way by a landscape
edge or a small decorative fence or wall. Buildings
should remain oriented toward the corridor in all
cases.
Public or Open Spaces
• Stream and floodplain corridors should be
maintained in their natural state and serve
natural functions. However, opportunities to provide
linear recreation or alternative
transportation routes should be explored for these
areas.
• Public or open spaces should generally support the
linear function of a corridor, such as trails and
greenways. However, smaller "pocket parks" or
plazas may be appropriate, particularly at strategic
cross-corridor connections, intersections, or at
major building entrances.
Transitions
• Corridors may support a variety of land uses along
their length - including residential, commercial,
civic, or industrial uses along a single corridor.
Similar or compatible uses should be located on
facing sides or the corridor.
• Design standards for street cross sections (street
widths, landscape medians or planting strips, and
sidewalk) should transition according to the
adjacent land use. For example, planting strips or
medians can expand to provide a buffer for
residential uses but those areas can be used for
expanded side walks, street amenities, or on-street
parking in non-residential areas.
7-23
NNORORTHTH & E& EASTAST LLUBBOCKUBBOCK
SI T E DE S I G N
master development plan
TRANSITION BETWEEN CORRIDOR ANDNEIGHBORHOOD - NOTICE BOTHRESIDENTIAL AND COMMERCIAL PARKINGIN REAR, ON-STREET PARALLELPARKING ALLOWEDSOURCE: GOULD EVANS AFFILIATES

• Where there is a difference in intensity between uses along a corridor and uses in
adjacent neighborhoods or districts, suitable transitions should be developed to
minimize the potentially negative impacts of the more intense uses.
• Where corridors are interrupted by nodes or intersect with neighborhoods or districts,
gateway features should be used to signify entry into these areas. Gateway features
should be coordinated with the change in design of the street cross sections. Small
monument markers or special landscape treatments may serve as gateways.
A node is a center of activity. A node may be primary junctions, places of a break in trans-
portation, a crossing or convergence of paths or may be simply concentrations of uses or activ-
ities.
Public Rights-of-way
• Travel patterns within a Node should provide equal connections in all directions through
out the node with no predominant linear patterns.
• Street designs should create transitions at node entrances, calming traffic and signaling
a different development pattern. These transitions may occur through narrower vehicle
lanes, enhanced landscape elements, expanded pedestrian facilities, or the addition of
on-street parking. An appropriate design transition will be dictated by the intensity of
the node and the character of adjacent land uses.
• Sidewalks may be immediately adjacent to the street edge, particularly where on-street
parking is allowed, expanded sidewalks are provided, and an amenity zone is between
the street edge and the primary pedestrian way.
• Street trees should be located to provide shade for pedestrians, yet achieve
canopy heights and crown heights that maintain visibility to adjacent land uses.
• Frequent connections to adjacent neighborhoods or districts should provide multiple
alternative routes between the neighborhood or district and the node. However the
design of these connections should discourage through traffic which does not originate
in the neighborhood or district.
7-24
NNORORTHTH & E& EASTAST LLUBBOCKUBBOCK
SI T E DE S I G N
master development plan
Node Design Principles

Buildings
• Buildings should be constructed at the right-of-way line in areas where appropriate and
supportive of other design goals for the node pattern. Alternatively, buildings may
frame public gathering spaces such as courtyards, plazas, or parks that abut the right-
of-way.
• All buildings should have "active" facades facing public streets, including ground level
entrances, windows on ground and upper levels, and enhanced architectural details such
as ornamental doors, window treatments, and cornices.
• A mix of uses - particularly a vertical mix - is encouraged to allow more compact site
designs.
• In larger nodes, a higher intensity of uses should occur at the center of the node with
less intensity on the edges.
Site Access and Circulation
• Primary access to most individual sites should be pedestrian oriented, with vehicle
access concentrated at shared or central parking facilities or on-street parking.
• Individual site access for vehicles should be via side streets or rear alleys wherever
feasible.
• Off-street parking should be located behind buildings out of view from public streets,
wherever possible.
• When off-street parking is required, recommend “shared” parking lots - lots used by
multiple businesses and types of land uses
7-25
NNORORTHTH & E& EASTAST LLUBBOCKUBBOCK
SI T E DE S I G N
master development plan
APPROPRIATE BUILDING FRONTAGE PUBLIC SPACE SCREENED PARKING

Public or Open Spaces
• Nodes may be entirely made up of public or open space.
• Public or open space should be consolidated at intersections of two corridors or where
corridors intersect with neighborhoods or districts.
• Incorporate sensitive natural areas or prominent topographic features into public or
open space plans.
Transitions
• Nodes should be centers or "focal points" for neighborhoods or districts, and should
have suitable transitions to adjacent uses.
• Nodes should provide concentrated transition points along a corridor to limit strip
development patterns.
Neighborhoods or Districts are sections of the city, usually relatively substantial in size, which
have an identifying character about them.
Public Rights-of-way
• Rights-of-way should be organized to form a series of blocks and connections through
out the neighborhood or district.
• Sidewalks should be separated from the street edge by a landscape planting strip.
Where buildings are constructed to the right-of-way expanded sidewalks or tree wells
may abut the street edge in place of a planting strip.
• Streets should be connected. Cul-de-sacs or dead end streets should be avoided, except
for where topographic constraints or important natural features make connections
impractical. However, local streets should discourage through traffic either through
narrow cross sections, off-set or "T" intersections, or other traffic-calming devices.
• Collector streets should provide continuous routes to corridors or between adjacent
neighborhoods or districts.
7-26
NNORORTHTH & E& EASTAST LLUBBOCKUBBOCK
SI T E DE S I G N
master development plan
Neighborhood or Distr ict Design Principles

Buildings
• Buildings should maintain a consistent or similar
setback along facing sides of a single block.
• Intensity or density of uses may be mixed within a
neighborhood or district, with more intense sites
and greater density located adjacent to nodes or
corridors.
• Buildings of different sizes should use pedestrian-
oriented architectural features, such as single-story
entrance features or porches, to create a similar
scale throughout the district or neighborhood.
However, immediately adjacent buildings should
have a similar mass.
• Land uses within the neighborhood or district should
generally be similar or complimentary. Where
different uses or different intensity of uses are
provided, compatibility should be ensured by
maintaining a similar building and site design
character within the neighborhood or district.
Site Access and Circulation
• Individual site access for vehicles in neighborhoods
or districts may be provided by private or shared
drives or alleys, dependent on the site conditions.
• Direct pedestrian connections from the public right-
of-way to building entrances should be provided on
all sites.
• Off-street vehicle parking should be located and
designed to provide the least intrusive visual impact
on the public rights-of-way.
DIRECT PEDESTRIAN CONNECTIONS
7-27
NNORORTHTH & E& EASTAST LLUBBOCKUBBOCK
SI T E DE S I G N
master development plan
DISTRICT RENDERING
NEIGHBORHOOD RENDERING

Public or Open Spaces
• Public or open space should be concentrated and located within walking distance of most
neighborhood or district land uses.
• Incorporate sensitive natural areas or prominent topographic features into public or
open space plans.
• Locate active public or open spaces (i.e. playgrounds or plazas) in prominent areas of
the neighborhood or district with high visibility from adjacent land uses.
• Link public or open space to areas outside the neighborhood or district through
sidewalks or joint-use trails.
Transitions
• All Neighborhoods or Districts should have well defined edges and a concentrated focal
point. Edges may often be a corridor (natural or developed) or open space, and focal
points may often be an adjacent node or a significant civic use or landmark (i.e. a park,
school, church, or community center).
• Suitable transitions should be provided from the center to the edge of the neighborhood
or district and between neighborhoods or districts and adjacent corridors or nodes.
GATEWAY MARKER
7-28
NNORORTHTH & E& EASTAST LLUBBOCKUBBOCK
SI T E DE S I G N
master development plan
RETAIL CENTER ALONG CORRIDORPROPER BUILDING MATERIAL AND SCALE

SS ECTIONECTION EE IGHTIGHT
PP LANLAN II MPLEMENTMPLEMENTAATIONTION
master development plan

This section identifies the means to implement the MasterDevelopment Plan. Implementation is not the culmination ofthe planning process, rather it is part of the continual planningcycle of input, analysis, evaluation, plan development, andaction. Implementation is both incremental and cumulative.Successful implementation requires participation from both pri-vate and public entities, a true partnership that includes thecity, the CDC, not-for-profits, local businesses, neighborhoodgroups, and corporations to name a few. In order to ensurethat both private and public entities play their part and that thevision and goals stated in this plan are realized, a comprehen-sive and thorough implementation strategy has been devel-oped.
The implementation strategy is based on the five broad plan-ning goals first listed in Section Four. The planning goal cate-gories are:
1. Infrastructure/Public Works2. Public Policy3. Economic Development4. Housing5. Organizational Strategy
These five categories create the basic framework of the imple-mentation strategy. From these categories, specific objectivesand strategies were developed that focus on the major issuesderived from the public process. In addition, a matrix for eachcategory is included that shows how to achieve the goal throughsmaller incremental steps. By implementing the plan one taskat a time, the community can quickly see success and alsoavoid the pitfalls of becoming overwhelmed. Finally, financialresources and programs are listed for each of the four specificdevelopment sites, increasing the likelihood that the catalyticprojects will be realized.
Introduction
8-2
NNORORTHTH & E& EASTAST LLUBBOCKUBBOCK
PL A N IM P L E M E N TAT I O N
master development plan
FIGURE 8-A: IMPLEMENTATION
THROUGH PUBLIC POLICY
SOURCE: GOULD EVANS AFFILIATES

�Plan, provide, and maintain efficient and effective infrastructure that promotes sustaineddevelopment, connects neighborhoods and centers, is aesthetically pleasing, environmentallysound, safe, and is in harmony with the stated vision and preferred direction of North & EastLubbock.�
Infrastructure and public works enhancements provide visible and tangible signs of a success-ful and prosperous community. The Infrastructure/Public Works category is to be implement-ed through four basic objectives; utilities, transportation, land use, and beautification.Improving the current infrastructure conditions can be a quick way to produce results andimprove community support.
UtilitiesThe utilities objectives include both water and sewer.
Water and Sewer- The study area and its major residential and commercial areas all appearto have adequate service. Utility resources should be used to maintain and improve existinglines when required. Efforts should be made to limit utility expansion to undeveloped areasoutside of Loop 289 or to areas classified as Agricultural Preservation in this plan. This willdecrease expansion and maintenance costs and deter development in areas with no publicwater or sewer access. In turn, limiting expansion will help promote future development with-in the planning concept�s �Focus Areas�. Incremental improvements should be made to exist-ing neighborhoods outside Loop 289, when necessary to maintain or develop a basic level ofservice.
STRATEGIES
� Focus bond funds towards areas that will create the most positive benefit
� Limit expansion of the water grid, in particular to undeveloped areas outside the �Focus Areas� and Loop 289
TransportationThe transportation objective includes a boulevard system, public transportation, and pedestri-an/bicycle integration.
Boulevard System - The advisory committee (NELDAC) recommends that North & EastLubbock and the CDC work with the City of Lubbock to create a boulevard street framework.The framework should consist of portions of existing major streets within the study area.
Study Area Implementation
8-3
NNORORTHTH & E& EASTAST LLUBBOCKUBBOCK
PL A N IM P L E M E N TAT I O N
master development plan
Infrastructure/Publ ic Works

Section Five lists the portions of the major streets to be included in the boulevard system.These roadways include Martin Luther King Jr., 4th Street (Marsha Sharp)/Parkway (fromUniversity to Idalou), Idalou (from Martin Luther King to Parkway), and Broadway (fromI-27 to Idalou). These designated streets would become the area�s premiere streets andwould be most visible to residents and visitors. Because of the tremendous visibility, boule-vards should require and receive higher levels of service than what currently exists. The serv-ices would include regular maintenance and up-keep, snow removal, trash and debris pick-up,beautification, uniform streetscape design, public art, and incorporation of gateways.
STRATEGIES
� North & East Lubbock and the CDC work with the City of Lubbock to create a boulevard street framework
� Improve service level quality to designated streets
� Beautify and aesthetically enhance designated streets
Public Transportation - Currently, public bustransportation provided by Citibus serves North &East Lubbock. Five bus routes service all majorneighborhoods within Loop 289. Inefficiencies,however, currently exist and are the result of diffi-culty in transferring between routes. As the systemexists now, transit riders must take the bus to thedowntown transfer hub to access different routes.In order to increase efficiency and improve connec-tivity between neighborhoods and employmentcenters, it is recommended that Citibus explore thedevelopment of a branch transfer station at the cor-ner of Parkway and Martin Luther King Jr. or anoth-er similar intersection within the study area thatwould promote greater ridership numbers. TheParkway/MLK site was chosen because the inter-section already has access to existing Citibus routesand its central location in the study area. It is alsoin a Commercial Center depicted in the Preferred Direction Plan. From this branch transfer sta-tion, direct routes to the growing airport employment center (along Martin Luther King Jr.) andthe Site 1/Texas Tech on University (along Parkway) would better connect residents to employ-ment centers and the existing and proposed neighborhoods along the way.
8-4
NNORORTHTH & E& EASTAST LLUBBOCKUBBOCK
PL A N IM P L E M E N TAT I O N
master development plan
FIGURE 8-B: DIRECT BUS ROUTES AND BRANCH
TRANSFER HUB
SOURCE: GOULD EVANS AFFILIATES

STRATEGIES
� Explore the development of a branch transfer bus station at the corner of Parkway and Martin Luther King Jr. Blvd
� Explore the development of direct routes, potentially from the branch station to Site 1 and the Lubbock International Airport
Pedestrian/Bicycle Integration - It is important for communities to have access to safe,well-maintained, and aesthetically pleasing pedestrian and bicycle routes and trails. Theseroutes and trails can be used for both recreation and as a means to get from one place toanother. It is recommended that a comprehensive pedestrian/bicycle trail system be exploredso that residents will have access to alternative forms of transportation. It is also recom-mended that a trail system be integrated into the Canyon Lakes Linear Park System and pro-posed boulevard framework. North & East Lubbock should explore the development of pedes-trian routes along the abandoned Santa Fe rail line and Avenue U, both in North Lubbock. Apedestrian route on the abandoned rail line would give the neighborhoods better access toCanyon Lakes to the north and Site 1 to the southwest. Likewise, a pedestrian route alongAvenue U would connect the Canyon Lakes to Overton Park. Pedestrian access across thefuture Marsha Sharp Freeway is needed, potentially via Santa Fe and Avenue U. This wouldbenefit the study area by providing access to both Texas Tech and Overton Park, potentiallycreating a �spillover� effect into North Lubbock.
STRATEGIES
� Explore the development of a comprehensive pedestrian/bicycle trail system
� Explore development of pedestrian routes along the abandoned Santa Fe rail line
� Explore development of pedestrian routes along Avenue U and crossing Marsha Sharp
Land UseThe land use objective includes public/semi-public and parks/open space uses.
Public/Semi-Public - Public/semi-public land uses represent government uses, educationaluses, religious, and other civic uses. As stated in Section Five, public and semi-public uses canbe used as �anchors� in developing neighborhoods. It is recommended that futurepublic/semi-public uses be located where they will have the greatest catalytic effect within theFocus Areas, provided that public use does not have a negative influence on neighboring res-idences or businesses. When appropriate, North & East Lubbock should lobby the City ofLubbock to locate any future city or regional facility within the study area.
8-5
NNORORTHTH & E& EASTAST LLUBBOCKUBBOCK
PL A N IM P L E M E N TAT I O N
master development plan

STRATEGIES
� Locate public uses in Focus Areas when appropriate
� Proactive measures to attract local, state, and federal public uses to study area
Parks/Open Space - The greatest city amenity in North & East Lubbock is the Canyon Lakeslinear park system. This pristine park system is a �spine� in the study area connecting its twosides. Improvement in the connection between North Lubbock and East Lubbock, through thepark system, benefits the study area. As recommend-ed in the Canyon Lakes Master Plan Feasibility Study,the connection by building pedestrian walkways underI-27, also referred to as the riverwalk, should beimproved. In addition, when any future developmentis proposed in close proximity to the park system, it isimportant to ask, "How can the proposed developmentbenefit from the park?" By taking advantage of thesplendid views and vistas, by architecturally engagingthe park, and by creating connections into the park adevelopment can be improved.
STRATEGIES
� Improve north/east connection through park system
� Encourage and promote new development to incorporate park into design when applicable
BeautificationThe beautification objective includes corridors, publicspace, and gateways.
Corridors - A corridor is the linear route between/among two or more points. Corridors canbe created from roadways, rail lines, pedestrian trails, waterways, or parks. The prevalent cor-ridors in the study area were discussed under the Transportation objective (Boulevards, PublicTransportation, and Ped/Bike Integration). It is important to recognize, however, that there ismore to a corridor than functionality. Therefore, it is recommended that a beautification com-ponent be included into the planning and development stages of the recommended trans-portation improvements. Beautification improvements could include landscaped medians,street trees, shrubs, seasonal color, illumination, berms, ornamental brick design, neighbor-hood markers, monuments, public art, banners, and other general streetscaping elements.
8-6
NNORORTHTH & E& EASTAST LLUBBOCKUBBOCK
PL A N IM P L E M E N TAT I O N
master development plan
EXAMPLE OF HOW BUILDINGS CAN ENGAGE THE
ADJACENT PARK SYSTEM
SOURCE: GOULD EVANS AFFILIATES

STRATEGIES
� Incorporate beautification component into the planning and development stages
Public Space - Communities and neighborhoods that take advantage of designated publicspace create areas that are inviting to the public. They are places of gathering. Designed cor-rectly, public space can give neighborhoods a point of common identity, increase pedestriantraffic, create a place for refuge, and be aesthetically pleasing.
STRATEGIES
� City officials identify existing and future public space incorporating similar beautification/ design elements and the proposed boulevard system
� Use community groups to maintain and supervise public space
Gateways - Gateway features reinforce the �sense of place and arrival�. Four sites have beenselected as the best locations for gateways. Listed in Section Five, they are at Martin LutherKing Jr. Blvd/Regis, Idalou/Parkway, I-27/Parkway, and Broadway/ Yellowhouse River. It is rec-ommended that North & East Lubbock prioritize the four gateway sites and then seek fundingto design and build gateways. Proper planning and design is needed so the gateways are wel-coming and have the proper scale and character in relation to their surroundings.
STRATEGIES
� Prioritize the four gateway sites
� Assure gateways are designed and built to complement surroundings
� Seek funding for gateway improvements
8-7
NNORORTHTH & E& EASTAST LLUBBOCKUBBOCK
master development plan
EXAMPLE OF GATEWAY
SOURCE: GOULD EVANS AFFILIATES
PL A N IM P L E M E N TAT I O N

�Through various regulatory and safety means, develop and enforce a framework thatadheres to the quality of life sought by residents.�
Public policy addresses both regulatory and safety programs for the study area. Effective pub-lic policy is needed to encourage and guide private development efforts by setting parametersand desired expectations. Equally important, consistent enforcement of the public policy isrequired to ensure both public safety and an improved quality of life.
Regulatory ProgramsThe regulatory objective includes zoning, subdivision, design guidelines and code enforcement.
Zoning - Zoning is the act of establishing districts and regulations governing the use, place-ment, spacing, and size of lots and buildings. Zoning district standards can be more flexiblethan subdivision standards in that they may evolve and change with market conditions, demo-graphic trends, political priorities, or investment decisions of landowners. Zoning decisions,however, impact surrounding areas and collectively shape the community character.Therefore, zoning decisions should be made with long-term focus and in accordance with thevision and goals set forth in this plan. It is recommended that the city zoning ordinance andmap be updated and that areas within North & East Lubbock be rezoned to better representthe vision, goals, and preferred direction of the plan.
STRATEGIES
� Update city zoning ordinance to better reflect plan
� Update city zoning map
Subdivision Regulations - Regulation of the subdivision of land deals primarily with pro-moting and establishing land development patterns that can be most efficiently served by pub-lic facilities, establishing efficient transportation networks, and meeting present environmentalstandards. In contrast to zoning, subdivision regulations establish long-standing patternswithin the community, which are not easily changed or altered. Because of this, subdivisionregulations have an inherent and immediate link to a long-term master plan. Subdivision reg-ulations will ultimately determine how smoothly a community transitions from urban to non-urban areas. It is recommended existing subdivision regulations be updated to better repre-sent the vision, goals, and preferred direction of the plan.
8-8
NNORORTHTH & E& EASTAST LLUBBOCKUBBOCK
PL A N IM P L E M E N TAT I O N
master development plan
Publ ic Pol icy

STRATEGIES
� Update pertinent subdivision regulations to assure neighborhood connectivity, pedestrian friendliness, and the goals of the plan
Design Guidelines - Design guidelines are a very specific form of land use regulation. Theyguide form and character of development within established zoning districts. These guidelinesare often incorporated into the zoning ordinance when they are applicable. They can be inde-pendent from the zoning districts, incorporated as a zoning overlay ordinance, or through anindependently adopted design guidelines. Design guidelines can be either mandatory or rec-ommended. A set of design guidelines can be found in Section Seven under the sub-sectionForm and Function. It is recommended that the design principles and guidelines set forth inForm and Function be used to help update the zoning ordinance and any subdivision regula-tions.
Code Enforcement - Written policy is ineffectivewithout a means of enforcement. It is recom-mended that current codes and ordinances beenforced consistently and in a timely manner.Expansion of city enforcement staff may be inorder. In addition, cooperation between neighbor-hood associations and city officials could dramati-cally improve efficiency leading to quicker results.City code enforcement staff should be assigned toNorth & East Lubbock, meeting with neighborhoodassociation presidents on a bi-weekly basis, todiscuss the pressing issues and concerns thathave been brought to the presidents� attention byassociation residents. Having the associationsreport to the same assigned staff will improvetrust and cooperation between city officials andarea residents.
STRATEGIES
� Create an enforcement committee comprised of neighborhood association leaders and city officials to improve efficiency and response time
� Increase city code enforcement staff and assign percentage of staff to study area
� Create incentives for code compliance
8-9
NNORORTHTH & E& EASTAST LLUBBOCKUBBOCK
PL A N IM P L E M E N TAT I O N
master development plan
PROPERTY IMPROVEMENTS

Safety ProgramsThe safety objective consists of crime and safety, community programs, and public/private/cit-izen partnerships. The existence of and perception of crime in the study area is of great con-cern to community leaders and the public. Issues of child safety, senior safety, prevalence ofdrugs, and programs for youth were discussed frequently in prior meetings.
Crime and Safety - Greater police presence can be beneficial to the area. Location of anyfuture police branch stations, potentially in the proposed mixed use bus transfer station, wouldcreate a permanent area presence and improve response time. Likewise, the permanent policepresence in the study area would make regular patrols on bicycle and by foot more practicaland potentially improve relations with surrounding neighborhoods.
STRATEGIES
� Increase police presence in study area
� Encourage higher frequency of regular patrols; by car, bicycle, and foot
Community Programs - Programs creating an increased sense of community are encouragedto give youth more opportunities, educate and re-train residents, and bridge the gap amongthe different generations. It is recommended that the vacant Hunt Elementary School be con-verted into a community center. Hunt Elementary School class space, gymnasium and sur-rounding recreational facilities are ideal for a center. Programs and classes could be offered tohelp residents earn their GED, study for college entrance exams, or learn a skill or trade. Thefacility and programs could be subsidized through a lowered purchase price, volunteer hoursfrom retired university professors, and training paid for by the private sector and perspectiveemployers.
STRATEGIES
� Open community center at current Hunt Elementary School site
� Offer programs for youth, workforce, and elderly
� Subsidize community center cost by incorporating local resources
Public/Private/Citizen Partnerships - Greater cooperation and communication betweenneighborhood associations and the police department is recommended. The association lead-ers can represent their neighborhoods when meeting with police for regular meetings. Themeetings would be a time to discuss specific issues and concerns.
STRATEGIES
� Create crime and safety committee comprised of neighborhood leaders and police
8-10
NNORORTHTH & E& EASTAST LLUBBOCKUBBOCK
PL A N IM P L E M E N TAT I O N
master development plan

�Create an economic environment that promotes business, encourages entrepreneurship,seeks employment growth, and maintains cooperation between, public and private entities.�
Economic Development addresses the lack of existing employment opportunities and retailservices available within the study area. Both are vital to the revitalization of North & EastLubbock.
EmploymentThe employment objective is comprised of education/re-training, business relocation, localbusiness growth and development, private sector leadership, and development assistance.
Education/Re-training - A well-educated and properly trained work force is better positionedto attract and create employment opportunities. It is important to concentrate efforts on boththe current work force and the future work force. Classes could be offered at the proposedcommunity center (Hunt Elementary). They could include high school credits, GED exams,college preparatory, SAT preparation, ACT preparation, business development, and pertinenttrades. In addition, the Byron Martin Advanced Technology Center could offer classes at thecommunity center too. Retired professors from Texas Tech could volunteer and the private-sector could donate supplies.
STRATEGIES
� Offer classes and testing for high school equivalence and college placement
� Offer job training for specific area companies
Business Relocation - A single clearinghouse for employment attraction should be estab-lished for North & East Lubbock, possibly within the CDC, to coordinate job attraction and serveas an �objective catalyst� working with Market Lubbock, the Lubbock Workforce Center, andother local and regional entities. Relocation efforts should be focused on the LubbockInternational Airport and the continued cultivation and growth of the intermodal opportunities,such as the rail spur. Development of the adjacent interport business park would furtherenhance the economic potential of the airport and railroad located in the northern portion ofthe study area.
STRATEGIES
� Create entity solely dedicated to job attraction
� Work with other local and regional organizations, such as Market Lubbock
8-11
NNORORTHTH & E& EASTAST LLUBBOCKUBBOCK
PL A N IM P L E M E N TAT I O N
master development plan
Economic Development

Local Business Growth and Development - It is generally easier to create jobs from busi-nesses already located within a community than to get an out-of-town company to relocate.Yet, typically a greater effort is made to do the latter. Similarly, entrepreneurship or businessstart-ups can tap into the energy and creativity inherent in North & East Lubbock, creating jobsand job growth potential. An environment is needed that supports and aids local businessexpansion and entrepreneurial activity.
STRATEGIES
� Work with local businesses helping with expansion and growth
� Foster development with regional-wide appeal and attraction
Private Sector Leadership - Private sector businesses must be fully engaged in the growthgoals of North & East Lubbock. Private sector leadership is important to convey a �communi-ty spirit� in achieving these goals. It is recommended that a �Business Association� be creat-ed, made up of key business leaders from a variety of types and sizes of businesses located inNorth & East Lubbock. Participants must be business leaders (partners, proprietors and CEOs)in order to be successful. Regular agenda items should involve cooperative actions that cancreate a climate for job stability and creation.
STRATEGIES
� Create Business Association
Development Assistance - The three sites recommended for a focused effort are not the onlyprojects that will happen in the study area. In fact, it is expected that these are catalyst proj-ects that will stimulate a new image, expand markets, and improve the investment climate. Tocapitalize on these opportunities, the CDC should monitor development activity and real estateconditions throughout the study area. Information should be readily available on potentialdevelopment sites. The CDC can assist in development in ways other than developer.
STRATEGIES
� Be an advocate for the distribution of any public funding needed for the project.
� Keep up communications with property owners of potential development sites
� Make input to the public review process to assure maximum benefit to the community from development activity
8-12
NNORORTHTH & E& EASTAST LLUBBOCKUBBOCK
PL A N IM P L E M E N TAT I O N
master development plan

Retail ServicesThe retail services objective is comprised of local business development, focus areas, andregionalism.
Local Business Development - Just as in the employment component �Local BusinessGrowth and Development,� an effort should be made to support and aid the local businessexpansion and entrepreneurial activity in the service sector. In addition, a coordinated publicand private sector effort should be made to develop and build the mixed use center/branchtransfer bus station at Martin Luther King Jr. Blvd and Parkway
STRATEGIES
� Work with local businesses helping with expansion and growth
� Develop the retail components of Site 1 and Site 2a
� Develop mixed use center/transfer station
Focus Areas (Zones) - The Preferred Direction Plan, Core Community Revitalization, calls forcreating two zones in an attempt to concentrate both residents and services. When imple-mented an increase in service demand will be the result. This in turn will attract retail andother service options to the study area. As called for in the plan, it is recommended that retailgrowth and development be directed toward the �Commercial Centers,� located in the zones.
STRATEGIES
� Encourage all future retail growth to locate in Focus Areas, in particular, in Commercial Centers
Regionalism - Regional attractions, such as prominent retail chains, farmers markets, ethnicfestivals, regional parks, and cultural celebrations, should be encouraged to locate within theFocus Areas. Proactive measures, such as marketing and financial incentives, could be neces-sary to attract potential attractions. In addition, efforts should be made to improve on North& East Lubbock�s existing regional attractions and attract additional non-retail regional desti-nations. The incorporation of new retail around existing regional attractions should be exam-ined.
STRATEGIES
� Seek regional attractions, both retail and non-retail, to locate in study area
� Improve and connect existing regional attractions
8-13
NNORORTHTH & E& EASTAST LLUBBOCKUBBOCK
PL A N IM P L E M E N TAT I O N
master development plan

�Seek a fair and diversified housing market that encourages homeownership and providesquality housing for all stages of life and for all socioeconomic groups.�
Quality housing is a key component to the future of North & East Lubbock. It is recom-mended that major expansion of the housing market occur within the Focus Areas and undercategories cluster and infill/rehab depicted on the preferred direction map. The Housing cat-egory is to be implemented through the new subdivision/cluster, infill/rehab, and housingtypes categories.
New Subdivision/ClusterThe Cluster Sites are all located in the Focus Areas and are intended for development of newhousing and new neighborhoods. The sites are all adjacent to Infill/Rehab areas. The rea-son for this is to create the desired density and number of roof-tops in order to attract theneeded retail and services. The Cluster Sites give home buyers an alternative to living inmature neighborhoods with aging housing stock. This category is ideal for those who desireto build a new house in a new subdivision, yet still want to live closer to neighborhood cen-ters and the heart of the community. And even though the Cluster Sites are undeveloped,they still are in relative close proximity to basic infrastructure and services, reducing thedevelopment city operating costs.
STRATEGIES
� Develop new subdivisions proposed in Site 2a, Site 2b, and Site 3
� Engage in proactive effort to attract new residential development
Infill/RehabThe Infill/Rehab sites are all located in the Focus Areas and are comprised of existing neigh-borhoods. Many of the existing neighborhoods are in need of rehabilitation. The physical con-ditions analysis (Section Two) shows the severity of need in each neighborhood. These neigh-borhoods, however, still possess many of the characteristics desired by residents and emulat-ed in new subdivisions such as mature trees, scale, and character. If given an opportunity ofimproved housing stock, many residents would prefer to stay or relocate to these neighbor-hoods. This category promotes reinvestment into the existing neighborhoods through rehabil-itation of existing housing and construction of new quality infill housing the empty lots.
STRATEGIES
� Encourage rehabilitation of existing housing stock located existing neighborhoods
8-14
NNORORTHTH & E& EASTAST LLUBBOCKUBBOCK
PL A N IM P L E M E N TAT I O N
master development plan
Housing

� Encourage quality infill development, on empty lots, that incorporate the positive existing qualities of the neighborhood.
Housing TypesDiverse, quality housing is encouraged in North & East Lubbock. Diverse housing allowspeople of different needs, socioeconomic groups, age groups, and household size to all livein the study area.
STRATEGIES
� Encourage housing that supports residents and families in all stages of life
� Update Lubbock Zoning Ordinance to better meet the housing goals of the plan
� Encourage home ownership
� Provide quality housing options for all residents
8-15
NNORORTHTH & E& EASTAST LLUBBOCKUBBOCK
PL A N IM P L E M E N TAT I O N
master development plan

�Create an environment that promotes efficiency and cooperation between organizations andthe general public.�
Organizational Strategy addresses the way in which organizations should interact and work tosuccessfully implement the plan. Organizational Strategy consists of NeighborhoodAssociations and various other area groups.
Neighborhood AssociationsThe current activity level of area neighborhood associations differs by neighborhood. Someneighborhoods have very active associations, while other neighborhoods have no association.Active neighborhood association participation is a large component of the North & East MasterDevelopment Plan. It is envisioned that, with the assistance of the CDC and the Neighborhoodand Business Development Department, active associations will be established for all neigh-borhoods. The associations would meet regularly within their neighborhoods addressing con-cerns and issues. In addition, a representative of each association would meet with city offi-cials and the CDC on a regular basis. Through the neighborhood associations, many of therecommended programs and strategies would be implemented.
The benefits of cohesive and active neighborhood associations would create a grass roots typeorganization, thus, improving communication, efficiency, trust, and involvement within theirrespective neighborhoods and with city officials. In short, quicker success and achievement ofthe set community goals.
STRATEGIES
� Establish active associations for all neighborhoods in the study area
� Create area-wide board comprised on neighborhood association representatives and CDC/City of Lubbock officials
� Implement programs and strategies through neighborhood associations when appropriate
Other Area GroupsOther local groups and stakeholders must play an active role in order for the plan to be suc-
cessfully implemented. Some of these groups are:
� City of Lubbock � Lubbock Housing Authority
� Guadalupe Economic Services � High Plains Capital Corporation
� Community Housing Resource Board � Lubbock Housing Finance Corporation
8-16
NNORORTHTH & E& EASTAST LLUBBOCKUBBOCK
PL A N IM P L E M E N TAT I O N
master development plan
Organizat ional Strategy

This sub-section provides a listing of tools that can be used throughout the North & EastLubbock area for housing and economic development. A description of these tools was listedearlier in this report under the section entitled �Redevelopment Tools�.
Tools available to finance housing include:� Federal Home Loan Bank loans and grants� Fannie Mae Foundation loans� Community Development Block Grant funds� Hope VI grants� Low-income housing tax credits� The Texas Mezzanine Fund, Inc. (TMF)� Programs of the Lubbock Housing Finance Corporation� The City of Lubbock
Programs to finance economic development include:� Grants from the Federal Economic Development Administration (EDA)� Grants from the Federal Office of Community Services (OCS)� Loans from the Federal Home Loan Bank Board (FHLBB)� Use of the New Markets Tax Credit Program� Use of U.S. Small Business Administration (SBA) loans secured through financial
institutions� TMF loans� The U.S. Department of Housing and Urban Development (HUD) 108 program loans � Single bank community development corporations, which provide equity investment for
economic development, in specific "qualified" projects as approved by federal regulators� High Plains Community Capital� HUD CDBG business loans Community facilities may be financed through grants from the OCS, loans through the FHLBB,or the use of the New Markets Tax Credits program.
In addition, there is a potential role for foundation financing of non-profit projects including:
� Financing from local foundations, including the C.H. Foundation and the Helen Jones Foundation
� Financing from state foundations such as the Meadows Foundation and the Houston Endowment
� Financing from national bank-related foundations, such as the Bank of America Foundation and the Wells Fargo Community Development Corporation
8-17
NNORORTHTH & E& EASTAST LLUBBOCKUBBOCK
PL A N IM P L E M E N TAT I O N
master development plan
Area-Wide Avai lable Tools

The primary financial options and tools available to promote development of the University Siteare owner finance, use of new markets tax credits, use of low income housing tax credits, anduse of tax increment financing.
North Lubbock Commercial SiteDevelopment of Site 1 as a mixed-use center with a heavy emphasis on restaurants and retailuse will require acquisition and assembly of parcels and some existing right-of-way. The devel-opment program proposed is conceptual, and it represents a recommendation on what best fitsthe market, the site characteristics, and the objectives of the Preferred Direction. How thedevelopment is undertaken, however, must remain flexible. It is possible the owner of thelargest parcel, the Town and Country Shopping Center, could take the lead, or a third partycould acquire that site as well as the others. In any case, the total costs of assembly, clear-ance, and site development must be ascertained as the development process is more clearlyarticulated.
The value of the site as a commercial parcel can be estimated based on land values establishedat nearby Overton Park, where developed commercial sites are being marketed at $25 persquare foot of land. Values north of Marsha Sharp are likely to be somewhat less, so a valueof $18 per square foot should be supportable once the site is cleared, prepared for develop-ment, and the Marsha Sharp construction is complete. At a net size of about 19 acres, thiswould support a total value of $14.9 million (In 2004 dollars) for the entire site.
To be a feasible project, this value would need to cover land assembly, site development, mar-keting, and the land developer's profit and overhead. Should a more detailed analysis andappraisals (not a part of this master plan) indicate that this is insufficient, some public supportmay be necessary. If so, the most likely sources are 1) to extend the Public Works expendi-tures being undertaken in the University gateway area just to the north onto the site, reduc-ing the needed (or improving the quality of) site development, and 2) using tax incrementfinancing to support appropriate components of the project.
Owner FinancingThe 19 acre mixed-use site, which includes the development of multi-family housing units anda new configuration of retail, can be carried out by the existing owners entering into a part-nership for the redevelopment of the site to accomplish the preferred plan or by a single ownerpurchasing the land from other owners and then undertaking a site development process.Presumably this consortium of owners, or a single owner, could seek development financing
Specific Site Implementation
8-18
NNORORTHTH & E& EASTAST LLUBBOCKUBBOCK
PL A N IM P L E M E N TAT I O N
master development plan
Site 1 - Universi ty

from private financial institutions and use of their own equity.
To facilitate this development process, the City of Lubbock should provide the necessary zon-ing changes to enable this site development plan, if publicly adopted, to be carried out.
New Markets Tax CreditsBecause this site is located in a low- to moderate-income census tract, which is part of the Cityof Lubbock Enterprise Zone, it is an area that is eligible for assistance under the Federal NewMarkets Tax Credit Program. This assistance is delivered through Community DevelopmentEntities (CDEs) that are recognized by the Community Development Financial Institutions(CDFI) Fund of the U.S. Department of Treasury.
In the recent second round of the tax credit allocation process, eleven recipients identifiedTexas as part of their market area for the use of new markets tax credits totaling$1,700,000,000. Several of these recipients specifically focused on commercial real estatedevelopment in low- and mod-erate-income areas. The newmarkets tax credits provideinvestors a 39% write-off oftheir investments over aseven-year period. The NewMarkets Tax Credits processfollows:
� CDEs apply for an allocation of New Markets Tax Credits
� The CDFI Fund selects CDEs to receive the allocation
� The CDE offers the allocation of tax credits to investors for cash
� CDEs use proceeds to make "qualified investments" in low-income communities
CDEs with tax credit allocations may provide loans to other CDEs and also purchase loans fromthem.
8-19
NNORORTHTH & E& EASTAST LLUBBOCKUBBOCK
PL A N IM P L E M E N TAT I O N
master development plan
FIGURE 8-C: HOW NMTC WILL WORK
SOURCE: TEXAS MEZZANINE FUND, INC.

The Texas Mezzanine Fund, Inc., for example, is currently a federally recognized CDE. It isalso possible for the North & East Lubbock organization to similarly become designated as aCDE.
Low Income Housing Tax CreditsIt is possible that the housing portion of the development plan can be financed through an allo-cation of low-income housing tax credits. These tax credits, which are allocated each year bythe State of Texas, provide a substantial incentive for the development of multi-family rentalhouses as affordable housing.
Low-income housing tax credits are awarded to non-profit and for-profit developers of low-income housing. The developer offers these credits to investors who receive a reduction intheir federal tax liability, providing equity to finance the development of affordable housing.The incentive provided by the program is essential because rental income may not be adequateto cover project construction, operations and maintenance costs.
Tax Increment FinancingAnother financial option to facilitate the development process can be put in place by the Cityof Lubbock agreeing to establish a Tax Increment Financing (TIF) District focused on a subjectproperty. Basically, the city would approve the development plan for the site and agree to usethe proceeds for future taxes generated by the redevelopment to finance certain costs of thedevelopment plan, such as infrastructure, street amenities, or other public improvements.
The City of Lubbock undertook a similar process to facilitate the redevelopment of the adja-cent Overton Park project.
8-20
NNORORTHTH & E& EASTAST LLUBBOCKUBBOCK
PL A N IM P L E M E N TAT I O N
master development plan

The North & East Lubbock Community Development Corporation (NELCDC) has already begunthe implementation process for this site by winning the bid to receive a donation of 30 acresof land from the Lubbock Independent School District, securing $50,000 in pre-developmentfunds from the City of Lubbock's Community Development Block Grant (CDBG) program, andsecuring $250,000 in infrastructure funds from the City of Lubbock's CDBG program
Further, the NELCDC is developing a $2 million request of the U.S. Department of Housing andUrban Development (HUD) for 202 grant funds to be used for the construction of a 30-unit sen-ior citizens housing project on three acres of the site. It is estimated that 24 acres of the sitewill be used to construct 117 units of single-family housing.
The options for financing the development of single-family housing include grants and loansfrom the Federal Home Loan Bank, grants from the Fannie Mae Foundation, loans from theTexas Mezzanine Fund, Inc. (TMF), a loan from the High Plains Capital Corporation, and fur-ther investments by the City of Lubbock.
Also, the Lubbock Housing Finance Corporation (LHFC) may play a role in the development andimplementation process. The primary tool of the LHFC to finance development is through theissuance of single-family mortgage bonds to be used for single-family construction. Further,the LHFC can play a key role to promote home ownership through down payment assistance,individual credit and budget counseling, and securing mortgage loans for the purchasers of thesingle-family sites.
Federal Home Loan BankThe Federal Home Loan Bank's affordable housing program provides loans and grants for theconstruction and rehabilitation of single-family homes and rental housing. A member bankmust apply for these funds on behalf of the project sponsor. If a grant is received through themember bank, the institution does not receive credit under the Community Reinvestment Act(CRA). Loans made by the bank can provide CRA credit.
Fannie Mae FoundationThe Fannie Mae Foundation provides grants for the development of affordable housing andcould be a source for financing for single-family units.
Texas Mezzanine Fund, Inc. (TMF)TMF provides loans for pre-development expenses, lot acquisition, infrastructure development,and interim construction. TMF could provide up to $500,000 to the NELCDC for the latter twopurposes.
8-21
NNORORTHTH & E& EASTAST LLUBBOCKUBBOCK
PL A N IM P L E M E N TAT I O N
master development plan
Site 2a - Erskine

High Plains Community Capital, LLCHigh Plains Community Capital, LLC provides subordinate financing loans to increase the sup-ply of affordable housing for low-income persons, or to revitalize or stabilize low-income areas.
City of LubbockThe City of Lubbock has already provided assistance for pre-development and infrastructurecosts. The infrastructure funds provided thus far will support the construction of approximately25-30 housing units. It is possible that the City of Lubbock's CBDC program could be a sourceof additional infrastructure funds in 2005.
Financing options for the 3-acre commercial portion of the site include New Market Tax Creditsdescribed in the implementation plan for site 1, the Federal Home Loan Bank's economic devel-opment program (EDP), the Federal Office of Community Services, and The Texas MezzanineFund, Inc.
Federal Home Loan Bank Economic Development Program (EDP)The EDP provides long-term, low and fixed rate financing for commercial real estate projectsthat benefit low- and moderate-income neighborhoods. A member bank must apply on behalfof the project sponsor and then secure an allocation and advance of funds for the project. Thefunds can be available up to 40 years, at a rate not to exceed 300 basis points above the mem-ber bank's cost of funds.
Federal Office of Community Services (OCS)The OCS provides grants to nonprofit corporations for the development of real estate projectsthat benefit low- to moderate-income persons. These grants typically range from $350,000 to$700,000. The process of receiving these grants is very competitive, with approximately 15%of the applicants for funding actually receiving an award. However, because it is a straightequity injection with no debt service, it is a highly desirable source of funds.
Texas Mezzanine Fund, Inc. (TMF)TMF can be used as a source of business loans to the commercial tenant(s) of the shoppingcenter. These loans can be used for tenant improvements, equipment, and working capital.
High Plains Community Capital, LLCThe High Plains Community Capital, LLC may also be a source of funding for loans to smallbusinesses located on the site. These funds can be used for working capital, machinery andequipment.
8-22
NNORORTHTH & E& EASTAST LLUBBOCKUBBOCK
PL A N IM P L E M E N TAT I O N
master development plan

Site 2a, at the northeast corner of MLK and Erskine, will be an important first project for theNorth & East Lubbock Community Development Corporation. As such, it deserves a moredetailed overview of the economic considerations than the other high priority projects identi-fied in the Preferred Direction of the plan. As noted previously, the roughly 29 acre site hasthree components as summarized below, the largest being 117 single-family homes.
Residential DevelopmentThis analysis focuses on thesingle-family component,with some further discussionof the commercial space. Itdoes not address the detailsof the HUD 202, elderlyhousing project. That willneed to be addressed separately as a part of the HUD application and review process. Also,the intention of the NELCDC to seek additional support for down payment assistance and othersubsidies to the individual purchasers of the proposed units has not been addressed. As notedin the market analysis section, such activities could have the effect of broadening the qualifiedpurchasers for a given price point.
The NELCDC has taken steps to acquire the site for a nominal sum and has secured commit-ment from the city for $250,000 for site infrastructure, such as internal streets and utilities tothe individual lots and other costs needed to prepare building lots to be sold to homebuilders.As shown below, the total site development costs are expected to be about $25,000 per acre,or a total of $575,000 for the 23-acre residential component. With the $250,000 commitment,there remains $325,000, or $2,778 per unit to be recovered through the lot and home prices-unless additional support can be obtained.
Unit Cost Factors and Land Value - The mar-ket analysis quantified the demand for housingon the site by price point. This pro forma analy-sis adds additional detail to the product descrip-tion and cost components. The bottom line is aprojection of the supportable lot prices that thesite developer (presumably NELCDC) canachieve. The following measures are shown inTable 8-C.
Land BuildingsSingle Family Residential 23 acres 117 UnitsHUD 202 Elderly 3 acres 30 UnitsCommercial 3 acres 20,000 Square Feet
TABLE 8-A: DEVELOPMENT PROFILES
SOURCE: HAMMER, SILER, GEORGE ASSOCIATES
8-23
NNORORTHTH & E& EASTAST LLUBBOCKUBBOCK
PL A N IM P L E M E N TAT I O N
master development plan
Site Work $25,000 per acreResidential $575,000 for 23 acresFunds Committed $250,000Net Cost $325,000 totalNet Cost $2,778 per unit
TABLE 8-B: SITE DEVELOPMENT COSTS
SOURCE: HAMMER, SILER, GEORGE ASSOCIATES
Site 2a - Pro Forma

� The selling price of the unit. These are the mid-points of the price ranges used in the market analysis.
� The average square footage of the units in each price range. The size is the key variable in the differentiation of prices, but other factors such as features, extras, lot size, and amenities would also affect the price. The selling price per square foot is also shown.
� Several deductions are then taken from the market-driven sales price to derive a supportable lot price.
� Fifteen percent of the sales price has been allocated to the homebuilders' overheadand profit.
� The actual construction cost of the units to be $45.00 per square foot has been estimated. The table also shows the per-unit total construction cost.
� The site development costs (in excess of the $250,000 already committed) of $2,778 per unit has been shown.
� The result of subtracting these costs from the sales price is a "residual land value" for each price range of housing. In the case of the lowest priced housing, this value is negative. This is consistent with the experience of builders in the North and East markets who have purchased lots at less than the cost of the site improvements required for the Erskine site.
� The final column in the table is the supportable sales price of the lots to a homebuilder. It is the sum of the residual land value and the per unit site development costs.
Absorption- The market analysis section projected the potential sales pace for each of theprice points. In Table 8-D , the projected sales are shown on a year-by-year basis to match theproject�s total of 117 units. This reflects some differential in the price distribution in the earlyand later years of the project.
Sales Sales Construction Cost
PriceSquare Feet Price/SF Per SF Total
Profitand
OverheadSite
Work
ResidualLandValue
DevelopedLot Price
$65,000 1,200 $54.17 $45.00 $54,000 $9,750 $2,778 -$1,528 $1,250$75,000 1,350 $55.56 $45.00 $60,750 $11,250 $2,778 $222 $3,000$85,000 1,500 $56.67 $45.00 $67,500 $12,750 $2,778 $1,972 $4,750$95,000 1,650 $57.58 $45.00 $74,250 $14,250 $2,778 $3,722 $6,500
TABLE 8-C: HOUSING UNIT COST PROFILE
SOURCE: HAMMER, SILER, GEORGE ASSOCIATES
8-24
NNORORTHTH & E& EASTAST LLUBBOCKUBBOCK
PL A N IM P L E M E N TAT I O N
master development plan

R e v e n u eProjection - Basedon the absorptionschedule and thesupportable lot salesprices, the NELCDC(or other land devel-opment entity)would receive a total of nearly $400,000 over the development period. This is sufficient tofinance the portion of the site development costs not covered by the current commitment. Ifadditional grant funding can be obtained for the infrastructure, these funds could support otheractivities of the CDC.
Commercial Development Although residential is the largest land use component, and it entails the most risk-due to theneed to provide most of the infrastructure up front, commercial is potentially the most finan-cially lucrative component. With minimal site development costs (three acres at the projectaverage of $25,000 per acre), the commercial site, or individual pads, can be sold to com-mercial builders or tenants. Local appraisers should be consulted before setting prices for thecommercial lots, but it is anticipated that a value of about $5.00-8.00 per square foot could beachieved.
The tables on 8-26 describe the likely financial performance of a commercial development onthe site. In general, the analysis shows that a developer can expect an internal rate of returnof between 8 to 15 percent on the initial investment, depending on the price of the land andother factors. This should be sufficiently attractive to deem the project feasible depending on,among other things, whether the developer is a community-based non-profit or a for-profitentity. The key assumptions and the steps in the analysis are summarized below.
Building Cost Assumptions - Table 8-F shows the assumptions regarding the per unit landacquisition and building construction costs, based on interviews with real estate professionals
8-25
NNORORTHTH & E& EASTAST LLUBBOCKUBBOCK
PL A N IM P L E M E N TAT I O N
master development plan
Year 1 Year 2 Year 3 Year 4 Year 5 Year 6 Year 7 Year 8 TotalPlan 1 6 6 6 6 6 6 0 0 36Plan 2 5 5 5 5 5 5 2 0 32Plan 3 0 5 5 5 5 5 5 5 35Plan 4 0 2 2 2 2 2 2 2 14Total 11 18 18 18 18 18 9 7 117
TABLE 8-D: RESIDENTIAL ABSORPTION AND PRICING
SOURCE: HAMMER, SILER, GEORGE ASSOCIATES
Year 1 Year 2 Year 3 Year 4 Year 5 Year 6 Year 7 Year 8 TotalPlan 1 $7,500 $7,500 $7,500 $7,500 $7,500 $7,500 $0 $0 $45,000Plan 2 $15,000 $15,000 $15,000 $15,000 $15,000 $15,000 $6,000 $0 $96,000Plan 3 $0 $23,750 $23,750 $23,750 $23,750 $23,750 $23,750 $23,750 $166,250Plan 4 $0 $13,000 $13,000 $13,000 $13,000 $13,000 $13,000 $13,000 $91,000Total $22,500 $59,250 $59,250 $59,250 $59,250 $59,250 $42,750 $36,750 $398,250
TABLE 8-E: LOT SALES REVENUE
SOURCE: HAMMER, SILER, GEORGE ASSOCIATES

in Lubbock and industry guide-lines. Although the land cost isshown as $8.00 per square foot,the pro forma has been run withalternative assumptions to testthe return under various scenar-ios. The site development costsare the developer�s costs for site-specific improvements. They arein addition to the overall site development costs for roads and utilities for the overall project,most of which are allocated to the residential component.
Building Operating Characteristics - Table 8-G shows the assumptions regarding the perunit operating characteristics. One of the most critical and, in the �real world,� volatile factorsis the rent that can be achieved in the competitive marketplace. In this Lubbock location, andin new quality space, it is judged that the project could achieve a rent of approximately $12.00per square foot of building space per year, on a "triple net" basis that is the lessee pays allexpenses, such as taxes, utilities and insurance in addition to the base rent. The pro formaincludes a vacancy factor (after initial lease-up) of five percent, for an effective rent of $11.40per square foot of net rentable space (which in a retail building is essentially equal to the grosssquare footage).
Financing Variables - Mostof the factors discussedabove are on a per-square-foot basis. Before translatingthem into project-specifictotal values, one additionalset of assumptions must beestablished. Those are the financing variables that will determine the viability of the projects.There are several critical assumptions in this section, but the overall approach is to look at aproject the way a lender would to determine viability. As such, the actual factors will varyalmost daily, as financial markets change, and it is impossible to predict what the terms mightbe in a year, or more from now when the project comes to fruition. Nevertheless, these rep-resent the best estimate of current conditions.
� Capitalization Rate - This is a factor lenders use to determine the true "value" of a project. It is the rate at which the annual revenue stream is converted into a present total value. Mathematically, it is divided into the annual Net Operating Income to determine the value. A "cap rate" will vary by the location, type and age of a building and is influenced by
8-26
NNORORTHTH & E& EASTAST LLUBBOCKUBBOCK
PL A N IM P L E M E N TAT I O N
master development plan
TABLE 8-F: BUILDING COSTS ASSUMPTIONS
SOURCE: HAMMER, SILER, GEORGE ASSOCIATES
TABLE 8-G: BUILDING OPERATING ASSUMPTIONS
SOURCE: HAMMER, SILER, GEORGE ASSOCIATES

many factors, but the value derived is independent of the cost of constructing a project. The cap rate of 9.5 percent used in this analysis is consistent with this type of development in the Lubbock market.
� Loan Ratio - This is the percent of the determined value that the lender is willing to finance. This too varies by the project, the creditworthiness of the borrower, and other factors. The ratio used in this analysis is 75 percent. In fact, a higher ratio may be available from community-based lenders which would boost the viability of the project. The difference between the value and the loan amount is "equity" in the eyes of the lender. The actual cash equity required by the developer is the difference between the project cost and the loan amount.
� Loan Terms - This is the interest rate and number of years of payments. In practice, there can be many approaches; but for simplicity the pro forma assumes a single "permanent" loan of 25 years at 7.0 percent.
Base Case Analysis - To test the feasibility of theproject, the factors above have been converted intototals associated with the specific building. The analysis is shown in Table 8-I and explained inthree elements: building program, project costs, and financial characteristics. This is a staticpro forma for the first stabilized year of operations. A ten-year pro forma is presented as Table8-M.
� Building Program - Consistent with the site plan and market analysis presented earlier, the project consists of 24,000 square feet of leasable commercial space on three acres of land.
� Project Cost - Based on the unit factors, the total project cost is estimated at $3.07 million, including $1.045 million for the land at $8.00 per square foot.
� Financial Characteristics - Based on the financial parameters outlined above, the project would have a capitalized value of $2.88 million on which a loan of $2.16 million (75 percent) could be obtained. After paying the annual payment on the loan, the building developer would realize a cash return of $88,249 in the first stabilized year of operation, a return of 9.69 percent on the required equity of $910,440 (the project cost less the loan amount). The table shows a line for grants and subsidies for purposes of testing the return under various scenarios. In this base case, the amount shown is zero.
Internal Rate of Return - Another measure of financial performance is the internal rate ofreturn (IRR), which is the average annual return over time considering the out flows and
8-27
NNORORTHTH & E& EASTAST LLUBBOCKUBBOCK
PL A N IM P L E M E N TAT I O N
master development plan
TABLE 8-H: FINANCING ASSUMPTIONS
SOURCE: HAMMER, SILER, GEORGE ASSOCIATES

inflows in any given year. As shown in Table 8-L,over a ten-year period the building would yield anIRR of 8.03 percent, after allowing for a three yearlease-up period for the project. In making this cal-culation, the proforma assumes a sale of the proj-ect at the end of the tenth year and a pay-off of theremaining loan balance. However, this is primarilya convenient way of incorporating an indefinitenumber of years in the future and the building neednot be sold to achieve the indicated IRR.
Sensitivity Analysis - The return that any partic-ular developer would seek would depend on his orher objectives, perception of the risk, and alterna-tive opportunities elsewhere. Should the assumedterms of the project be insufficient, there is theopportunity of providing assistance in the form ofreducing the price of the land or gaining govern-ment or foundation grants to subsidize the project.Both methods are essentially equal in how a givendollar amount would impact the operating perform-ance. In Table 8-L the base case is altered to show the impact of reducing the land price to$6.00 and $5.00 per square foot and with a direct subsidy of $200,000 to the developer.
Under the scenario of offering the land at $5.00 per square foot, the IRR increases to over 15percent, which should be sufficient to attract an experienced private sector commercial devel-oper. A grant/subsidy of about $260,000 would have the same effect. As noted, a formalappraisal should be conducted before setting a land value, whether for a sale or in a partici-pation agreement with a developer.
Return to the CDC - At $8.00 per square foot, theproperties would net nearly $1.0 million to the CDC orother land developer. This could be used to further theactivities of the CDC or, if necessary and desirable,provide some flexibility to subsidize specific tenants. Asstated in the market analysis section of this report,successful development of the commercial site wouldonly be achieved if the residential component has received momentum and the commercial ele-ment is designed to be physically and aesthetically integrated into the overall project.
TABLE 8-I: MLK COMMERCIAL PROJECT, BASE CASE
SOURCE: HAMMER, SILER, GEORGE ASSOCIATES
8-28
NNORORTHTH & E& EASTAST LLUBBOCKUBBOCK
PL A N IM P L E M E N TAT I O N
master development plan
Site Work $75,000 for 3 acres Land Value $8.00 per square foot Land Value $1,045,440 total Net Return $970,440
TABLE 8-J: ERSKINE SITE - COMMERCIAL
DEVELOPMENT
SOURCE: HAMMER, SILER, GEORGE ASSOCIATES

8-29
NNORORTHTH & E& EASTAST LLUBBOCKUBBOCK
PL A N IM P L E M E N TAT I O N
master development plan
TABLE 8-K: MLK COMMERCIAL PROJECT - 10 YEAR PRO FORMA
SOURCE: HAMMER, SILER, GEORGE ASSOCIATES
TABLE 8-L: MLK COMMERCIAL PROJECT - SENSITIVITY ANALYSIS
SOURCE: HAMMER, SILER, GEORGE ASSOCIATES

Development incentives that have already been undertaken for part of the 187-acre Hunt siteinclude:
� A private initiative to develop low-density rental housing on 17 acres using low-income housing tax credits
� Financial options for the remainder of the site assume a private developer will follow the plan�s recommendation to develop 45 acres into 192 sites for single-family housing
� Further, the school on the site would be converted to a community center. It is assumed the North & East Lubbock Community Development Corporation (NELCDC) would develop the center.
The primary financing options for the single-family housing include:
� Owner financing using conventional loan sources
� Financing through the Texas Mezzanine Fund, Inc. (TMF) for predevelopment and infrastructure development costs
� Financial assistance from the Lubbock Housing Finance Corporation (LHFC)
This initiative to create a community center on the site could be financed by:
� Grants from the Federal Economic Development Administration (EDA)
� CIP loans through the Federal Home Loan Bank (FHLB). These long-term loans are available for community facilities and infrastructure
� The New Markets Tax Credit Program
8-30
NNORORTHTH & E& EASTAST LLUBBOCKUBBOCK
PL A N IM P L E M E N TAT I O N
master development plan
Site 2b - Hunt

The development strategy for this site, which has been approved in the Lubbock ParksDepartment's master plan for residential development, will require obtaining public approvalsto convey the 6.8-acre site to the North & East Lubbock Community Development Corporation(NELCDC). Subsequent to this conveyance taking place, the NELCDC must secure funds forpre-development studies and infrastructure finance to carry out the development of 15 single-family homes.
The NELCDC may seek pre-developments funds from the state housing trust fund via TexasCommunity Capital, LLC.
Other financing options for this process include those previously described for Site 2a, theErskine Site, including Federal Home Loan Bank grants and loans, the Fannie Mae Foundation,the Texas Mezzanine Fund, Inc., the High Plains Capital Corporation, and the City of Lubbock.
8-31
NNORORTHTH & E& EASTAST LLUBBOCKUBBOCK
PL A N IM P L E M E N TAT I O N
master development plan
Site 3 - Canyon Lakes

IMPLEMENTATION - Infrastructure/Public WorksTABLE 8-M
Short 0-2 Yrs
Medium 2-5 Yrs
Long 5+ Yrs
On Going Public Private Not-For-Profit
���������
Water and Sewer� Focus bond funds towards areas that will create the most positive benefit
a.Residents report water & sewer line problems and needed improvements to their neighborhood association board
� � �
b.Group representing associations meet with Public Works Dept on regular basis to address improvements and benefits
� � �
� Limit expansion of water and sewer grid
a. Achieve "buy-in" of city staff � � �
b. Incorporate utilities review before approving any future development � � �
�����������
Boulevard System� Create a boulevard street framework
a. Identify all portions of streets to be designated into boulevard framework � �
b. Create document containing engineering & design standards, criteria, & specifications � �
� Improve service level quality to designated streets
a. Adopt new service level into existing transportation plans � �
Lubbock Transportation Department, Business & Neighborhood Development Department, N&E CDC
� Beautify and aesthetically enhance designated streets
a. Establish long-range budget for street beautification � � �
b.Create list of enhancements and organize them under categories such as streetscape, landscape & vegetation, public art, safety etc.
� � �
c. Incorporate enhancements into boulevard document � �
d. Ask local corporations and TTU to sponsor public art or other amenities on boulevards � � �
Public Transportation� Explore the development of a branch transfer bus station
a.Through surveys and analysis, determine potential usage for branch transit station located in N&E Lubbock
� �
b.Analyze major intersections in study area, including MLK/Parkway, to determine optimum location of station
� �
c.
Submit RFP to design firms, choosing a design that best fits the riders' needs and the surrounding conditions - incorporate other uses into station, such as daycare, laundry, dry cleaning, post office etc.
� � � �Lubbock Transportation Department (Citibus), Business & Neighborhood Development Department, N&E CDC, Private Development, Corporations and Businesses, Design Firms
Federal Grants, Private and Not-For-Profit SponsorshipMake transfer station into multi-use facility - act as catalyst bringing services to the area and demand for housing in walking distance
RemarksParticipants Funding
Lubbock Transportation Department, Parks & Recreation Department, Business & Neighborhood Development Department, N&E CDC
Volunteer association boardsOrganized neighborhood associations, Public Works Department, Business & Neighborhood Development Department
Public Works Department, Business & Neighborhood Development Department, City Council, Planning & Zoning Board
Time Frame Project Type
Public Input, Lubbock Transportation Department (Citibus), Business & Neighborhood Development Department, N&E CDC
City of Lubbock, N&E CDC
Lubbock Transportation Department, Parks & Rec Department, Business & Neighborhood Development Department, N&E CDC, TTU, Private Corporations, and Businesses
Private donations, advertisement, City of Lubbock, State & Federal Grants

IMPLEMENTATION - Infrastructure/Public WorksTABLE 8-M
Short 0-2 Yrs
Medium 2-5 Yrs
Long 5+ Yrs
On Going Public Private Not-For-ProfitRemarksParticipants Funding
Time Frame Project Type
� Explore the development of direct routes
a. Further analyze ridership numbers to find optimum routes � �
Public Input, Lubbock Transportation Department (Citibus), Business & Neighborhood Development Department, N&E CDC
City of Lubbock
b.
Build up-to-date bus stops at route terminus that protect riders from the elements, incorporate safety measures, and is in close proximity to employment centers
� � �Lubbock Transportation Department (Citibus), Business & Neighborhood Development Department, N&E CDC
Federal Grants, Private Sponsorship
Ped/Bike Integration� Explore the development of a comprehensive pedestrian/bicycle trail system
a.
Analyze and determine optimum routes that service major areas of study area - while incorporating Canyon Lakes and proposed Boulevard Framework
� �
b. Incorporate existing trails and routes into system � �
c.Incorporate uniform (AASHTO) design standards (landscaping, trail materials, lighting, furniture, signage etc.) throughout system
� � � �Parks & Recreation Department, Business & Neighborhood Development Department, Private Sector, Not For Profit
Federal Grants, Private and Not-For-Profit Sponsorship
� Ped route along Santa Fe
a. Work with ROW owners to lease or buy segment between TTU to Canyon Lakes � � �
Parks & Rec Department, Business & Neighborhood Development Department, N&E CDC, Property Owner, TTU, Texas DOT
b. Seek Federal programs, such as "Rails to Trails" for funding � �
Parks & Rec Department, Business & Neighborhood Development Department
c. Incorporate Santa Fe trail into comprehensive trail system � �
Parks & Rec Department, Business & Neighborhood Development Department
d. Design and build trail - incorporating Site 1 and its access potential � � � �
Parks & Rec Department, Business & Neighborhood Development Department, Site 1 Developer, TTU
� Ped route along Avenue U
a. Incorporate trail into comprehensive trail system � �Parks & Rec Department, Business & Neighborhood Development Department
b.Work with TDOT to confirm pedestrian crossing indicated on site plans - making access as pedestrian friendly as possible
� �Parks & Rec Department, Business & Neighborhood Development Department, N&E CDC, TDOT
State & Federal Funding
c. Work with Overton Park developer to properly integrate connection with new development � � �
Parks & Rec Department, Business & Neighborhood Development Department, N&E CDC, TDOT, Private Developer
Public/Private Partnership
��� ���
Public/Semi-Public� Locate public uses in Focus Areas
a. Create and update inventory of public uses in study area � � �
b.
Conduct analysis of new public use to determine the future location that will give maximum benefit to neighborhoods within Focus Area - working with the public entity
� � �
� Proactive measures to attract local, state, and federal public uses to study area
a. Market and advertise to potential public uses � � N&E CDC
City of Lubbock, Property Owner, TTU, Site 1 Developer, Private Sector Donation, Federal Grants (Rails to Trails)
Public Input - Business & Neighborhood Development Department, N&E CDC, New Public Entity
Public Input, Parks & Recreation Department, Business & Neighborhood Development Department, N&E CDC
City of Lubbock

IMPLEMENTATION - Infrastructure/Public WorksTABLE 8-M
Short 0-2 Yrs
Medium 2-5 Yrs
Long 5+ Yrs
On Going Public Private Not-For-ProfitRemarksParticipants Funding
Time Frame Project Type
Parks/Open Space� Improve north/east connection through park system
a. Design and build walkways under I-27 � �
b. Incorporate walkways and park trails into trail system � �
� Promote new development to incorporate park into design
a.Create handouts and other materials, to be given to perspective developers, that lists various design elements (Section Five)
� � �Business & Neighborhood Development Department, N&E CDC, Private Developer
b.Work with P&Z Board to encourage incorporation of park elements into proposed site plans along linear park system
� �Business & Neighborhood Development Department, N&E CDC, Planning & Zoning
�������������
Corridors� Incorporate beautification component into the planning and development
a. Require % of construction/improvement costs to be allocated towards beautification � �
Business & Neighborhood Development Department, Planning & Zoning, Transportation Dept, City Council
Public and Private
b. Encourage private sector to sponsor beautification through incentives � � �
Business & Neighborhood Development Department, Private Sector
Private Sector
Public Space� Incorporate beautification component into the planning and development
a. Require % of construction/improvement costs to be allocated towards beautification � � �
b. Require % of large developments be designated public space/parks � �
c.Encourage private sector to sponsor beautification through incentives (monetary and status)
� � �Business & Neighborhood Development Department, Private Sector
Private Sector
� Use community groups to maintain and supervise
a.Create program that makes neighborhood associations accountable for basic upkeep and supervision
� � � �
b. Create positive incentives for neighborhood associations to maintain public space � � � �
Incentives could be competition between neighborhood associations - winners get free block party, p.s. improv.
Gateways� Prioritize the four gateway sites
a. Rank sites 1-4 on criteria, such as most visible, greatest positive impact, cost, etc. � �
Business & Neighborhood Development Department, N&E CDC, Parks & Recreation
City of Lubbock
� Seek funding for gateway improvements
a. Seek funding for site based on ranking � � � �Business & Neighborhood Development Department, Private Sector, N&E CDC, Parks & Recreation
State & Federal Grants/ Private Sector
� Assure gateways are designed and built to compliment surroundings
a.Submit RFP for design of gateway(s), requiring entries to be in compliance with the plan and its design elements
� �Business & Neighborhood Development Department, Private Sector, N&E CDC, Parks & Recreation
Parks & Rec Department, Business & Neighborhood Development Department, N&E CDC, TDOT
Business & Neighborhood Development Department, Planning & Zoning, Transportation Dept, City Council
Public and Private
Business & Neighborhood Development Department, N&E CDC, Neighborhood Associations, Not-For-Profits
Private Sector/ Not-For-Profit Sponsorship

IMPLEMENTATION - Public PolicyTABLE 8-N
Short 0-2 Yrs
Medium 2-5 Yrs
Long 5+ Yrs
On Going Public Private Not-For-Profit
����������������
Zoning� Update city zoning ordinance
a. Update existing ordinance in-house or seek professional assistance � � �
b. Update ordinance to reflect plan and preferred direction � �
c. After completion, review and update ordinance on regular basis � �
� Update city zoning map
a. Through existing data maps, field surveys, GPS, etc., update/create existing zoning map � �
b. Build and store map electronically using GIS technology � �
c. Dedicate staff member to maintain and update electronic map on regular basis � �
Subdivision� Update pertinent subdivision regulations
a. Update existing ordinance in-house or seek professional assistance � � �
b. Update ordinance to reflect plan and preferred direction � �
c. After completion, review and update ordinance on regular basis � �
Design Guidelines
Code Enforcement� Create an enforcement committee
a.Create volunteer position within neighborhood associations for residents to report need improvements and/or violations
� �
b. Assign city official(s) as enforcement contact for N&E Lubbock � �
c.
Form committee from neighborhood representatives and city official(s), meeting on regular basis in the study area, to discuss community issues
� � �
d.Assign neigh. assoc, schools, not-for-profit, private sector to public areas, and streets for maintenance and upkeep
� � � � �Public Input, Business & Neighborhood Development Department, Code Enforcement, Private Sector, Not-For-Profits
� Increase city code enforcement staff and assign percentage of staff to study area
a.Compare existing resources and staff to current and future needs to determine needed improvements and upgrades
� �
b. Hire additional qualified staff to meet desired improved level of service � �
c.Assign % of staff to N&E Lubbock and engage in regular public communication so that trust and cooperation is improved
� �
� Create incentives for code compliance
Time Frame Project Type
Planning Department, Business & Neighborhood Development Department
Public Input, Business & Neighborhood Development Department, N&E CDC
Public Input, Business & Neighborhood Development Department, N&E CDC
Participants
Requires coordinated city effort
RemarksFunding
Planning Department, Business & Neighborhood Development Department, N&E CDC, Planning & Zoning Board, potential Planning & Zoning consultant
City of Lubbock
City of Lubbock
City of Lubbock, Volunteers
Planning Department, Business & Neighborhood Development Department, potential Planning & Zoning consultant
City of Lubbock
City of Lubbock

IMPLEMENTATION - Public PolicyTABLE 8-N
Short 0-2 Yrs
Medium 2-5 Yrs
Long 5+ Yrs
On Going Public Private Not-For-Profit
Time Frame Project TypeParticipants RemarksFunding
a.Create competition between neighborhood associations - awarding "best kept" assoc, "most improved" etc.
� � �Parks & Rec Department, Business & Neighborhood Development Department
b.Create reward for complying home owners, landlords, and neigh assoc. - private sector to donate prizes
� � �Parks & Rec Department, Business & Neighborhood Development Department, N&E CDC, TDOT
State & Federal FundingPrivate sector rewards could include gift certificates, landscaping, paint, maintenance checks etc.
c.Simplify enforcement procedures and penalties into a few basic steps - advertise and publish steps so public is aware
� �
d.Improve cooperation between code enforcement personnel and police department to better enforce penalties
� �
e.Deter habitual offenders by showing properties of landlords in severe violation on public access t.v.
� � �Parks & Rec Department, Business & Neighborhood Development Department, N&E CDC, TDOT, Private Developer
Public/Private Partnership
�����������
Crime and Safety� Increase police presence in study area
a. Encourage location of police branch station to create permanent presence in area � � �
Business & Neighborhood Development Department, N&E CDC, Police Department
b. Combine potential police branch with proposed mixed-use transit station � � � �
Business & Neighborhood Development Department, N&E CDC, Citibus, Police Department, Private Developer
Public/Private PartnershipCombining public safety, transpiration, and private retail into one facility could create a catalytic effect
� Encourage higher frequency of regular patrols
a. Increase patrols on foot and bicycle, as well as by car � �
Business & Neighborhood Development Department, Police Department
Police Department
Community Programs� Open community center at current Hunt Elementary School site
a. Discussin C.C. concept with school building owner (LISD) � �
b. Conduct community center feasibility study � �
c. Seek private funding and sponsorship of center � � � Business & Neighborhood Development Department, N&E CDC, Private Sector
� Offer programs for youth, workforce, and elderly
a. Offer programs for youth, such as sports, clubs, classes, exam prep courses � � � �
b.Offer educational and re-training programs for area workforce- GED, college prep classes, training for local businesses
� � � �
c. Offer senior programs, senior center activities, and youth mentorship programs � � � �
� Subsidize community center cost by incorporating local resources
a. Negotiate below market rate price with LISD � �N&E CDC, Business & Neighborhood Development Department, LISD
b.Create volunteer mentor and teaching program- use abundant resource of retired TTU professors
� � � �N&E CDC, Business & Neighborhood Development Department, TTU
c. Create training programs for specific local companies - subsidized by companies � � � �
Business & Neighborhood Development Department, N&E CDC, Private Sector, Market Lubbock
Partnerships� Create crime and safety committee comprised of neighborhood leaders and police
a.Meet regularly to discuss specific issues and concerns - improving safety through communication, education, and cooperation
� � �Business & Neighborhood Development Department, Neighborhood Associations, Police Department
Business & Neighborhood Development Department, N&E CDC, Community Development, Private Sector, Parks & Recreation, Senior Groups
Business & Neighborhood Development Department, N&E CDC, Community Development

IMPLEMENTATION - Economic DevelopmentTABLE 8-O
Short 0-2 Yrs
Medium 2-5 Yrs
Long 5+ Yrs
On Going Public Private Not-For-Profit
����������
Education/Re-training� Offer classes and testing for high school equivalency and college placement
a. Incorporate classes into proposed community center � � � �
b. Use volunteer TTU retired professors to teach and give exams � � � � �
� Offer job training for specific area companies
a. Incorporate training into proposed community center � � �
b. Offer vocational training in information technology for Allied Health Fields � � �
c. Establish a satelitte office of the Lubbock Workforce Center in the community center � � �
d. Work with local employers to develop specific training programs � � � �
e. Seek funding from local employers and private-sector � � �
Business Relocation� Create entity solely dedicated to job attraction for N&E Lubbock
a. Coordinate into CDC � � N&E CDC
� Work with other local and regional organizations
a. Communicate and meet with other organizations of similar purpose � � �
b.Aggressively promote the Interport development around the airport for industrial, office, and logistical uses
� � � �
c. Pool available resources when appropriate � � �
d. Target incentives to specific industries at geographic areas � � � N&E CDC, City of Lubbock
Local Business Growth & Development� Work with local businesses
a. Seek area businesses pursuing growth � � �
b. Provide businesses with information and contacts � � �
c. Promote the SBDC as a resource to community-based entrepreneurs � � �
� Foster development with regional-wide appeal and attraction
a. Help entrepreneurs and private sector development, such as Monument Park � � � � N&E CDC, Market Lubbock
Private Sector Leadership� Create a Business Association
a. Seek participants from wide range of retailers within study area � � �
Sub-groups focusing on North Lubbock and East Lubbock seperately, might be beneficial
b.Require that company representatives must be an executive to increase credibility and better assure success
� � �
c. Meet on regular basis � � �
RemarksParticipants Funding
N&E CDC, Community Development, TTU, Business & Neighborhood Development
Time Frame Project Type
N&E CDC, Community Development, Private Sector, Business & Neighborhood Development
N&E CDC, Private Sector
N&E CDC, Market Lubbock, others
N&E CDC

IMPLEMENTATION - Economic DevelopmentTABLE 8-O
Short 0-2 Yrs
Medium 2-5 Yrs
Long 5+ Yrs
On Going Public Private Not-For-ProfitRemarksParticipants Funding
Time Frame Project Type
����� �����
Local Business Development� Work with local businesses
a. Seek area businesses pursuing growth � � �
b. Provide businesses with information and contacts � � �
c. Encourage local residents to establish businesses in the area � �
d.Encourage local business owners and employees to live in study area through incentives
� �Incentives could be tax, façade improvements, landscaping etc.
e. Use SBDC to foster entrepreneurship and support to existing businesses
� Develop the retail components of Site 1 and Site 2a
a. Seek private sector developer to champion development � � �
b. Follow specific site implementation listed in plan � � �
� Develop mixed use center/transfer stationa. Bring public/private stakeholders together � � � �
b.Incorporate private retail and services together with proposed transfer station and police department
� � � �
Focus Areas� Encourage all future retail growth to locate in Focus Areas
a. Create tax incentives to encourage business to locate in commercial centers � �
b. Work with P&Z Board to achieve plan concepts and strategies � �
Regionalism� Seek regional attractions, both retail and non-retail, to locate in study area
a. Contact national retail chains that have regional pull to locate in study area � � �
Encourage retail to locate in Focus Areas and comply with design standards (Home Depot, Sam's Club)
b. Attract supporting retail to locate adjacent to the regional retail attraction � � �
"Support" retail does not have the regional pull but will strengthen the commercial center (convenience goods store i.e. Walgreen's)
c. Encourage non-retail attractions to locate in study area � � Non-retail attractions can include Monument Park
� Improve and connect existing regional attractions
a. Market and advertise existing regional attractions as one major attraction � � �
b.Consolidate entrance fees into "packages" so that visitors can gain entry into multiple attractions with a single pass
� � �
c. When possible, share parking facilities and connect attractions by pedestrian trails � � �
N&E CDC, Market Lubbock, City of Lubbock N&E CDC, Market Lubbock
N&E CDC, City of Lubbock, Private Sector, Market LubbockN&E CDC, Private Sector, City of Lubbock, State and Federal Grants
N&E CDC, Private Sector, City of Lubbock, State and Federal Grants
N&E CDC, Private Sector, Citibus, Police Department, City of Lubbock
N&E CDC, Private Sector, City of Lubbock, Police Department, Citibus, State and Federal Grants, Dept of Transportation
City of Lubbock, LISD
N&E CDC, Business & Neighborhood Department, Planning & Zoning Board
N&E CDC, Private Sector, City of Lubbock
N&E CDC

IMPLEMENTATION - HousingTABLE 8-P
Short 0-2 Yrs
Medium 2-5 Yrs
Long 5+ Yrs
On Going Public Private Not-For-Profit
������������ ������� Develop new subdivisions proposed in Site 2a, Site 2b, and Site 3
a. Seek private developer to champion projects � � �Private Sector, N&E CDC, Business & Neighborhood Development Department
Developer
b. Seek federal and state financing to initiate design and construction costs � � �
N&E CDC, Business & Neighborhood Development Department
HUD, Texas Mezzanine Fund, State and Federal Grants
c.Create building demand by compiling list of interested homeowners - offer realtors incentive of higher commissions
� � � �N&E CDC, Business & Neighborhood Development Department, city realtors
Realty Sector
d. Work with local financial institutions - help with homeownership education and site investment � � �
N&E CDC, Business & Neighborhood Development Department, Area Financial Institutions
Area Financial Institutions
� Engage in proactive effort to attract new residential development
a. Work with local financial institutions - help with homeownership education and site investment � � �
N&E CDC, Business & Neighborhood Development Department, Area Financial Institutions
Area Financial Institutions
����������� Encourage rehabilitation of existing housing stock
a. Work with local financial institutions to help provide housing rehab funding � � �
b.Seek private sector donations of building and housing rehab supplies (I.e. paint, landscape, etc.)
� Encourage quality infill development
a. Encourage Habitat for Humanity and similar not-for-profits to build quality infill housing � � �
Not-For-Profits, N&E CDC, Business & Neighborhood Developments
b.Purchase and raze abandoned structures deemed too dilapidated for rehab - making site ready for development
� � �
c. Sell parcels at reduced price to developers who agree to requirements � � �
Requirements could include a perspective homeowner ready for each site, below market prices, buyers must live on site
������������� Encourage housing that supports residents and families in all stages of life
a.Actively pursue housing that includes apartments, townhouses, single family houses, and/or senior housing
� � �
b. Encourage housing developments to conform to the suggested guidelines � �
c. Work with LISD to provide quality single family housing in close proximity to local schools � �
N&E CDC, Business & Neighborhood Development Department, LISD
LISD
� Update Lubbock Zoning Ordinance
a. Update ordinance to better fit the preferred direction � � Planning & Zoning
� Encourage home ownership
a.Sell parcels at reduced price to future homeowners who want to build and live in Focus Areas
� � �
b.Offer classes through proposed community center to assist and educate first time home owners
� � �
N&E CDC, Local Financial Institutions, Business & Neighborhood Development Department
N&E CDC, Business & Neighborhood Development Department, Area Financial Institutions, Retail Sector, Construction Sector and other private entities
Private Sector
City of Lubbock, Lubbock Housing Authority, LCAD, Urban Renewal
Not-For-Profits
N&E CDC, Business & Neighborhood Development Department
RemarksParticipants FundingTime Frame Project Type

IMPLEMENTATION - Organizational StrategiesTABLE 8-Q
Short 0-2 Yrs
Medium 2-5 Yrs
Long 5+ Yrs
On Going Public Private Not-For-Profit
��������������� �������
� Establish active associations for all neighborhoods in the study area
a. Define and establish geographic boundaries for neighborhood associations � �
b. Advertise for volunteers � �
c.Incorporate administrative and management techniques deemed successful in existing associations into new ones
� �
� Create area-wide board
a. Combine existing and newly formed associations into board � �
b. City and CDC involvement must come from highest levels to show importance of board � �
c. Set regular meeting times for Neighborhood, City, and CDC representatives � �
� Implement programs and strategies through neighborhood associations
a. Use board to inform and implement suggested programs � �
CDC, Business & Neighborhood Development Department, Neigh Assoc
b. Seek funding to help offset any organizational or administrative costs � � � �
CDC, Business & Neighborhood Development Department, Neigh Assoc.
Private/Not-For-Profit, Federal Grants
c. Maintain proactive associations for all neighborhoods � �
CDC, Business & Neighborhood Development Department, Neigh Assoc
Neigh Assoc., CDC, Business & Neighborhood Development Department
CDC, Business & Neighborhood Development Department
RemarksParticipants FundingTime Frame Project Type