north orange county community college district …aug 31, 2015 · north orange county community...
TRANSCRIPT

NORTH ORANGE COUNTY COMMUNITY COLLEGE DISTRICT
The Board retains the right to change the order in which agenda items are discussed. Subject to review by the Board, the agenda is to be approved as presented. Items may be deleted or added for discussion only according to G.C. Section 54954.2.
RETIREMENT BOARD MEETING August 31, 2015
2:30 PM Anaheim Campus, Room 100B
1830 West Romneya Dr. Anaheim, CA. 92801
AGENDA 1) Call to Order
2) Roll Call
3) Public Comments Information
4) Approval of July 27, 2015, Minutes (Pages 1-2) Action
5) Administration Action
A) Major Vendor Selection Criteria (Page 3)
B) Major Vendor Benefits & Features Comparison (Pages 4-7)
C) Actual Portfolio Vendor “Net Annual” Cost Shown in Dollars:
i) $10-$40 Million 40% Equities/60% Fixed (Page 8) ii) $50-$60 Million 40% Equities/60% Fixed (Page 9) iii) $10-$40 Million 50% Equities/50% Fixed (Page 10) iv) $50-$60 Million 50% Equities/50% Fixed (Page 11) v) $10-$40 Million 60% Equities/40% Fixed (Page 12) vi) $50-$60 Million 60% Equities/40% Fixed (Page 13) vii) $10-$40 Million 75% Equities/25% Fixed (Page 14) viii) $50-$60 Million 75% Equities/25% Fixed (Page 15)
6) Information Reports
A) Retirement Board Member Comments Information
B) Consultant Comments Information
7) Future Meeting(s) Action
8) Adjournment ______________________________________________________________________________ Americans with Disabilities Act: It is the intention of The North Orange County Community College District (NOCCCD) to comply with the Americans with Disabilities (ADA) in all respects. If, as an attendee or a participant at this meeting you will need special assistance, the NOCCCD will attempt to accommodate you in every reasonable manner. Please contact Brian Fahnestock, Vice Chancellor, 714-808-4746, at least 48 hours prior to the meeting to inform us of your particular needs so that appropriate accommodations may be made.

Retirement Board Meeting July 27, 2015 Page 1
NORTH ORANGE COUNTY COMMUNITY COLLEGE DISTRICT Retirement Board
July 27, 2015
UNAPPROVED MINUTES MEMBERS PRESENT: Bea Bates, Joe Boyle, Carol Brown, Jennifer Combs, Tina Johannsen, Brian Fahnestock, Irma Ramos, and Jacqueline Rodarte
MEMBERS ABSENT: Jim Phillips
DISTRICT STAFF: Rodrigo Garcia, Sandra Palmer
VISITORS: Chuck Thompson (RPM Consultant Group) Consultant Chuck Thompson called the meeting to order at 9:04 a.m. and led a round of introductions.
ELECTION OF OFFICERS A. Chair: It was moved by Carol Brown and seconded by Joe Boyle to elect Brian
Fahnestock as Chair. Motion was carried with Members Bates, Boyle, Brown, Combs, Johannsen, Ramos and Rodarte voting yes.
B. Vice Chair: It was moved by Brian Fahnestock and seconded by Carol Brown to elect Joe Boyle as Vice Chair; the motion was carried with Members Bates, Brown, Combs, Johannsen, Fahnestock, Ramos and Rodarte voting yes.
PUBLIC COMMENTS: None
ADMINISTRATION A. Mr. Thompson welcomed all members.
B. Mr. Thompson reviewed the duties and responsibilities of the Board stating that the Board cannot change retiree benefits. The Board will initially meet quarterly and then perhaps semi-annually thereafter. He also stated that the 700 Form will need to be completed for all Board members.
C. Mr. Thompson provided an overview and updates of the Other Post-Employment Benefits (OPEB) Governmental Accounting Standards Board (GASB) 43 & 45 and GASB 74 & 75 guidelines including monitoring agencies, compliance guidelines and codes.
D. Mr. Thompson reviewed the handout displaying a sample compliance plan benefits and feature comparisons and provided an introduction to fiduciary liability including conflict of interest, exposure mitigation, etc.
E. Mr. Thompson provided a brief status of the RFP by identifying the five RFP candidates.

Retirement Board Meeting July 27, 2015 Page 2
INFORMATION REPORTS A. Board Member Comments: Chair Fahnestock noted the tasks for future Board Agendas:
(1) United Faculty may appoint new members; (2) Review Errors & Omissions; (3) Determine whether Board Members need to complete Form 700; (4) RFP review; (5) create Bylaws after RFP review.
B. Consultant Comments: Mr. Thompson provided a few more handouts for review (e.g. fee structures).
FUTURE MEETINGS: The suggested dates of August 12 & 26 were not confirmed as it was shared that United Faculty may appoint a new member in mid-August; new meeting dates will be determined.
ADJOURNMENT: The meeting was adjourned at 11:00 a.m.

North Orange County Community College District
Page 3
OPEB GASB 43 & 45 Compliance “Process”
Request for Proposals (RFP) Areas of Comparison
Major Vendor Selection Criteria
1. Compliance with RFP Requirements & Underwriting
2. Methods & Approaches to Accomplish the Scope of Work
3. Knowledge & Experience of Community Colleges
4. Inclusive OPEB GASB Including “Substantive Plan” Development Support
5. Vendor Staff Members Provided for On Sight Meeting, Other Support and Reports
6. Website Access
7. Employer Trust Structure Flexibility
8. Investment Policy Statement Flexibility
9. Number of Community College/School District Clients Making Investments
10. Total Assets Under Management
11. Total Add On Fees
12. Actual Rate of Return Results
13. Overall Plan Cost Competitiveness
14. Discretionary Trust and Investment Management
15. Revenue Sharing and Other Commissions Status
16. Status of Proprietary Funds Used In Platform
17. Trust, Investment Management & Administration Firms Ownership Relationship
18. Assistance With Establishing Investment Risk Tolerance & Exposure
19. Employer Direct Choice of Investment Platform
20. Fiduciary Liability & Conflict of Interest Mitigation

North Orange County Community College DistrictMajor Vendors Benefits and Features Comparison
Plan Name CERBT RHBP-JPA Futuris PlanGASB 45
Solutions
OPEB GASB 45
Plan
Plan Sponsor CalPERS CCLC
Keenan
Financial
Services
PARS/CSBA PAFA
Plan Feature Response Response Response Response Response
Trust Company
Trust Structure
IRC 115 Trust Yes Yes Yes Yes Yes
Irrevocable Yes Yes Yes Yes Yes
S-Employer No No Yes No Yes
Multi -Employer Yes No No Yes No
JPA Structure No Yes No No No
Trust Formation
Discretionary No No Yes Yes Yes
Directed Yes Yes No No Yes/No
(RIA) Registered
Investment Advisor
RIA Structure
Institutional Shares Yes Yes Yes Yes Yes
Investment Policy Statement
Provided
Yes
MET
Yes
JPA
Yes
Individual
Yes
MET
Yes Individual/
Additional Cost
District Formal Investment
Porfolio Risk Tollerance
Exposure Process
No No Yes No No
Custom Investment Platform
AvailableNo Yes Yes Yes Only Option
Plan Investment Risk
Tolerance Allocation
Equity%/Fixed%
Three (3) Options
Three (3) Have
$ Invested
Eight (8) Options
Two (2) Have
$ Invested
Eight (8) Options
Eight (8) Have
$ Invested
Four (4) Options
Two (2) Have
$ Invested
One (1) Options
One (1) Has $
Invested
Page 4

North Orange County Community College DistrictMajor Vendors Benefits and Features Comparison
Plan Name CERBT RHBP-JPA Futuris PlanGASB 45
Solutions
OPEB GASB 45
Plan
Plan Sponsor CalPERS CCLC
Keenan
Financial
Services
CSBA/PARS PAFA
Plan Feature Response Response Response Response Response
RIA Formation
Discretionary No No Yes Yes Yes
Directed Yes Yes No Yes/Optional No
Trust and RIA Conflict of
Interest and Fiduciary
Liability Areas of Review
Conflict of Interest
Areas of Review
Separate Trust Company and
Investment Manager
Relationship
No Yes Yes No Yes
Proprietary Funds Utilized in
Investment PlatformYes No No No/Yes No
Revenue Sharing,
12 (b) 1 Fees Investment
Expenses Received
No No No No/Yes No
Page 5

North Orange County Community College DistrictMajor Vendors Benefits and Features Comparison
Plan Name CERBT RHBP-JPA Futuris PlanGASB 45
Solutions
OPEB GASB 45
Plan
Plan Sponsor CalPERS CCLC
Keenan
Financial
Services
CSBA/PARS PAFA
Plan Feature Response Response Response Response Response
Fiduciary Liability
Areas of Review
Prudent Person Investment
Mitigation Fiduciary StructureYes Yes Yes Yes Yes
Fiduciary Mitigation Structure in
Addition to the Prudent Person
Possible Conflict of
Interest with
Proprietary Funds
Yes. Revenue
Sharing and
Proprietary Funds
Not Allowed by
Contract
Yes. Revenue
Sharing and
Proprietary Funds
Not Allowed by
Contract
Possible Conflict of
Interest with
Proprietary Funds
Yes. Revenue
Sharing and
Proprietary Funds
Not Allowed by
Contract
Public Entity OPEB GASB
Experience Sponsor and
Partners
Yes Yes Yes Yes Yes/Limited
Administrator/Sponsor
Comprehensive Compliance
& Substantive Plan Support
Maintainence Assistance No No Yes No/Yes No
Program Document
ProvidedNo No Yes Yes No
Page 6

North Orange County Community College DistrictMajor Vendors Benefits and Features Comparison
Plan Name CERBT RHBP-JPA Futuris PlanGASB 45
Solutions
OPEB GASB 45
Plan
Plan Sponsor CalPERS CCLCKeenan
Financial CSBA/PARS PAFA
Plan Feature Response Response Response Response Response
Administration Support
Brown Act Meeting Installation
Support No No Yes No No
Plan Flexibility Limited/ MET Limited/ JPA Complete Limited/2/3rd VoteLimited/
Investment Options
Website Access for Trust
Information Available to
Employer and Employee
Yes/No Yes/No Yes/Yes Yes/No Yes
Eligible Employee and Retiree
Communication SupportNo No Yes No No
Education Market Penatration
Number of Education Trusts
Created 39 13 51 30 1
Number of Education Trusts
Funded39 13 51 30 1
Number of Community College
Clients9 13 19 3 1
Estimated Education $ Dollars
Under Management Not Disclosed $189 Million $576 Million $105 Million $70 Million
08/27/2015-Errors in information presented not intentional. Please advise of any errors found so they can be corrected. Private and Confidential
Information which is property of RPM Consultant Group (RPM). Permision to duplicate or use for other reasons must be approved by Chuck Thompson
President RPM.
Page 7
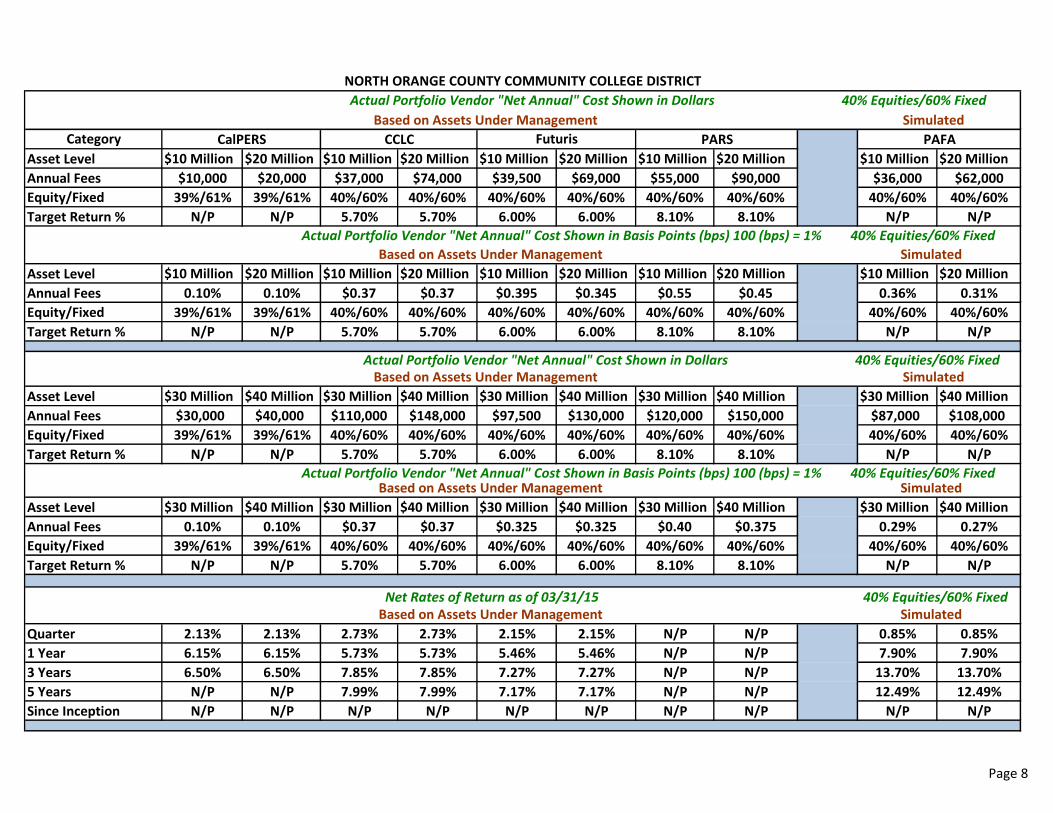
$10 Million $20 Million $10 Million $20 Million $10 Million $20 Million $10 Million $20 Million $10 Million $20 Million
$10,000 $20,000 $37,000 $74,000 $39,500 $69,000 $55,000 $90,000 $36,000 $62,000
39%/61% 39%/61% 40%/60% 40%/60% 40%/60% 40%/60% 40%/60% 40%/60% 40%/60% 40%/60%
N/P N/P 5.70% 5.70% 6.00% 6.00% 8.10% 8.10% N/P N/P
$10 Million $20 Million $10 Million $20 Million $10 Million $20 Million $10 Million $20 Million $10 Million $20 Million
0.10% 0.10% $0.37 $0.37 $0.395 $0.345 $0.55 $0.45 0.36% 0.31%
39%/61% 39%/61% 40%/60% 40%/60% 40%/60% 40%/60% 40%/60% 40%/60% 40%/60% 40%/60%
N/P N/P 5.70% 5.70% 6.00% 6.00% 8.10% 8.10% N/P N/P
$30 Million $40 Million $30 Million $40 Million $30 Million $40 Million $30 Million $40 Million $30 Million $40 Million
$30,000 $40,000 $110,000 $148,000 $97,500 $130,000 $120,000 $150,000 $87,000 $108,000
39%/61% 39%/61% 40%/60% 40%/60% 40%/60% 40%/60% 40%/60% 40%/60% 40%/60% 40%/60%
N/P N/P 5.70% 5.70% 6.00% 6.00% 8.10% 8.10% N/P N/P
$30 Million $40 Million $30 Million $40 Million $30 Million $40 Million $30 Million $40 Million $30 Million $40 Million
0.10% 0.10% $0.37 $0.37 $0.325 $0.325 $0.40 $0.375 0.29% 0.27%
39%/61% 39%/61% 40%/60% 40%/60% 40%/60% 40%/60% 40%/60% 40%/60% 40%/60% 40%/60%
N/P N/P 5.70% 5.70% 6.00% 6.00% 8.10% 8.10% N/P N/P
2.13% 2.13% 2.73% 2.73% 2.15% 2.15% N/P N/P 0.85% 0.85%
6.15% 6.15% 5.73% 5.73% 5.46% 5.46% N/P N/P 7.90% 7.90%
6.50% 6.50% 7.85% 7.85% 7.27% 7.27% N/P N/P 13.70% 13.70%
N/P N/P 7.99% 7.99% 7.17% 7.17% N/P N/P 12.49% 12.49%
N/P N/P N/P N/P N/P N/P N/P N/P N/P N/P
PARS PAFA
Actual Portfolio Vendor "Net Annual" Cost Shown in Basis Points (bps) 100 (bps) = 1% 40% Equities/60% Fixed
Based on Assets Under Management Simulated
Actual Portfolio Vendor "Net Annual" Cost Shown in Dollars 40% Equities/60% Fixed
Based on Assets Under Management Simulated
Actual Portfolio Vendor "Net Annual" Cost Shown in Dollars 40% Equities/60% Fixed Based on Assets Under Management Simulated
Actual Portfolio Vendor "Net Annual" Cost Shown in Basis Points (bps) 100 (bps) = 1% 40% Equities/60% Fixed
Target Return %
Category FuturisCCLCCalPERS
NORTH ORANGE COUNTY COMMUNITY COLLEGE DISTRICT
Asset Level
Annual Fees
Asset Level
Annual Fees
Equity/Fixed
Equity/Fixed
Asset Level
Annual Fees
Target Return %
Since Inception
Annual Fees
Equity/Fixed
Target Return %
Quarter
1 Year
Based on Assets Under Management Simulated
Net Rates of Return as of 03/31/15 40% Equities/60% Fixed Based on Assets Under Management Simulated
3 Years
5 Years
Equity/Fixed
Target Return %
Asset Level
Page 8

$50 Million $60 Million $50 Million $60 Million $50 Million $60 Million $50 Million $60 Million $50 Million $60 Million
$50,000 $50,000 $185,000 $222,000 $130,000 $195,000 $180,000 $200,000 $131,000 $151,000
39%/61% 39%/61% 40%/60% 40%/60% 40%/60% 40%/60% 40%/60% 40%/60% 40%/60% 40%/60%
N/P N/P 5.70% 5.70% 6.00% 6.00% 8.10% 8.10% N/P N/P
$50 Million $60 Million $50 Million $60 Million $50 Million $60 Million $50 Million $60 Million $50 Million $60 Million
0.10% 0.10% $0.37 $0.37 $0.325 $0.325 $0.36 $0.33 0.26% 0.25%
39%/61% 39%/61% 40%/60% 40%/60% 40%/60% 40%/60% 40%/60% 40%/60% 40%/60% 40%/60%
N/P N/P 5.70% 5.70% 6.00% 6.00% 8.10% 8.10% N/P N/P
2.13% 2.13% 2.73% 2.73% 2.15% 2.15% N/P N/P 0.85% 0.85%
6.15% 6.15% 5.73% 5.73% 5.46% 5.46% N/P N/P 7.90% 7.90%
6.50% 6.50% 7.05% 7.05% 7.27% 7.27% N/P N/P 13.70% 13.70%
N/P N/P 7.97% 7.97% 7.37% 7.37% N/P N/P $12.49 $12.49
N/P N/P N/P N/P N/P N/P N/P N/P N/P N/P
Target Return %
5 Years
Asset Level
Annual Fees
Equity/Fixed
Equity/Fixed
Target Return %
Net Rates of Return as of 03/31/15 40% Equities/60% Fixed
Based on Assets Under Management Simulated
Since Inception
Quarter
1 Year
Based on Assets Under Management Simulated
3 Years
FuturisCCLCCalPERSCategory
NORTH ORANGE COUNTY COMMUNITY COLLEGE DISTRICT
Asset Level
Annual Fees
PARS
Actual Portfolio Vendor "Net Annual" Cost Shown in Basis Points (bps) 100 (bps) = 1% 40% Equities/60% Fixed
Based on Assets Under Management Simulated
Actual Portfolio Vendor "Net Annual" Cost Shown in Dollars 40% Equities/60% Fixed
Page 9

$10 Million $20 Million $10 Million $20 Million $10 Million $20 Million $10 Million $20 Million $10 Million $20 Million
N/P N/P $39,000 $78,000 $34,500 $69,000 $45,000 $80,000 $36,000 $62,000
50%/50% 50%/50% 50%/50% 50%/50% 50%/50% 50%/50% 50%/50% 50%/50% 50%/50% 50%/50%
N/P N/P 6.30% 6.30% 7.00% 7.00% 8.50% 8.50% N/P N/P
$10 Million $20 Million $10 Million $20 Million $10 Million $20 Million $10 Million $20 Million $10 Million $20 Million
N/P N/P $0.39 $0.39 $0.345 $0.345 $0.45 $0.40 0.36% 0.31%
50%/50% 50%/50% 50%/50% 50%/50% 50%/50% 50%/50% 50%/50% 50%/50% 50%/50% 50%/50%
N/P N/P 6.30% 6.30% 7.00% 7.00% 8.50% 8.50% N/P N/P
$30 Million $40 Million $30 Million $40 Million $30 Million $40 Million $30 Million $40 Million $30 Million $40 Million
N/P N/P $117,000 $156,000 $97,500 $130,000 $120,000 $150,000 $87,000 $108,000
50%/50% 50%/50% 50%/50% 50%/50% 50%/50% 50%/50% 50%/50% 50%/50% 50%/50% 50%/50%
N/P N/P 6.30% 6.30% 7.00% 7.00% 8.50% 8.50% N/P N/P
$30 Million $40 Million $30 Million $40 Million $30 Million $40 Million $30 Million $40 Million $30 Million $40 Million
N/P N/P $0.39 $0.39 $0.325 $0.325 $0.40 $0.375 0.29% 0.27%
50%/50% 50%/50% 50%/50% 50%/50% 50%/50% 50%/50% 50%/50% 50%/50% 50%/50% 50%/50%
N/P N/P 6.30% 6.30% 7.00% 7.00% 8.50% 8.50% N/P N/P
N/P N/P 2.41% 2.41% 2.15% 2.15% N/P N/P 1.14% 1.14%
N/P N/P 5.11% 5.11% 5.46% 5.46% 2.99% 2.99% 9.93% 9.93%
N/P N/P 8.11% 8.11% 7.27% 7.27% 4.21% 4.21% 15.53% 15.53%
N/P N/P 8.11% 8.11% 7.17% 7.17% N/P N/P 13.65% 13.65%
N/P N/P N/P N/P N/P N/P N/P N/P N/P N/P
*Not a full 36 Months. Based on 26 Months of Investing.
PARS* PAFA
Actual Portfolio Vendor "Net Annual" Cost Shown in Basis Points (bps) 100 (bps) = 1% 5 0% Equities/50% Fixed Based on Assets Under Management Simulated
Actual Portfolio Vendor "Net Annual" Cost Shown in Dollars 50% Equities/50% Fixed Based on Assets Under Management Simulated
Actual Portfolio Vendor "Net Annual" Cost Shown in Dollars 50% Equities/50% Fixed
Based on Assets Under Management Simulated
Actual Portfolio Vendor "Net Annual" Cost Shown in Basis Points (bps) 100 (bps) = 1% 5 0% Equities/50% Fixed
Target Return %
Category FuturisCCLCCalPERS
NORTH ORANGE COUNTY COMMUNITY COLLEGE DISTRICT
Asset Level
Annual Fees
Asset Level
Annual Fees
Equity/Fixed
Equity/Fixed
Asset Level
Annual Fees
Target Return %
Since Inception
Annual Fees
Equity/Fixed
Target Return %
Quarter
1 Year
Based on Assets Under Management Simulated
Based on Assets Under Management Simulated
3 Years
5 Years
Equity/Fixed
Target Return %
Asset Level
Net Rates of Return as of 03/31/15 50% Equities/50% Fixed
Page 10

$50 Million $60 Million $50 Million $60 Million $50 Million $60 Million $50 Million $60 Million $50 Million $60 Million
N/P N/P $195,000 $234,000 $162,500 $195,000 $180,000 $200,000 $131,000 $151,000
50%/50% 50%/50% 50%/50% 50%/50% 50%/50% 50%/50% 50%/50% 50%/50% 50%/50% 50%/50%
N/P N/P 6.30% 6.30% 7.00% 7.00% 8.50% 8.50% N/P N/P
$50 Million $60 Million $50 Million $60 Million $50 Million $60 Million $50 Million $60 Million $50 Million $60 Million
N/P N/P $0.39 $0.39 $0.325 $0.325 $0.36 $0.33 0.26% 0.25%
50%/50% 50%/50% 50%/50% 50%/50% 50%/50% 50%/50% 50%/50% 50%/50% 50%/50% 50%/50%
N/P N/P 6.30% 6.30% 7.00% 7.00% 8.50% 8.50% N/P N/P
N/P N/P 2.80% 2.80% 2.15% 2.15% N/P N/P 1.14% 1.14%
N/P N/P 5.50% 5.50% 5.46% 5.46% 3.03% 3.03% 9.93% 9.93%
N/P N/P 8.50% 8.50% 7.27% 7.27% 4.25% 4.25% 15.53% 15.53%
N/P N/P 8.50% 8.50% 7.17% 7.17% N/P N/P $13.65 $13.65
N/P N/P N/P N/P N/P N/P N/P N/P N/P N/P
Target Return %
5 Years
Asset Level
Annual Fees
Equity/Fixed
Equity/Fixed
Target Return %
Net Rates of Return as of 03/31/15 50% Equities/50% Fixed
Based on Assets Under Management Simulated
Since Inception
Quarter
1 Year
Based on Assets Under Management Simulated
3 Years
FuturisCCLCCalPERSCategory
NORTH ORANGE COUNTY COMMUNITY COLLEGE DISTRICT
Asset Level
Annual Fees
*Not a Full 36 Months. Based on 24 Months of Investing.
PARS* PAFA
Actual Portfolio Vendor "Net Annual" Cost Shown in Basis Points (bps) 100 (bps) = 1% 5 0% Equities/50% Fixed
Based on Assets Under Management Simulated
Actual Portfolio Vendor "Net Annual" Cost Shown in Dollars 50% Equities/50% Fixed
Page 11

$10 Million $20 Million $10 Million $20 Million $10 Million $20 Million $10 Million $20 Million $10 Million $20 Million
$10,000 $20,000 $40,000 $80,000 $34.500 $69,000 $55,000 $90,000 $36,000 $62,000
60%/40% 60%/40% 60%/40% 60%/40% 60%/40% 60%/40% 60%/40% 60%/40% 60%/40% 60%/40%
N/P N/P 6.40% 6.40% 8.00% 8.00% $9.00 $9.00 N/P N/P
$10 Million $20 Million $10 Million $20 Million $10 Million $20 Million $10 Million $20 Million $10 Million $20 Million
$0.10 $0.10 $0.40 $0.40 $0.345 $0.345 $0.55 $0.45 0.36% 0.31%
60%/40% 60%/40% 60%/40% 60%/40% 60%/40% 60%/40% 60%/40% 60%/40% 60%/40% 60%/40%
N/P N/P 6.40% 6.40% 8.00% 8.00% $9.00 $9.00 N/P N/P
$30 Million $40 Million $30 Million $40 Million $30 Million $40 Million $30 Million $40 Million $30 Million $40 Million
$30,000 $40,000 $120,000 $160,000 $97,500 $130,000 $120,000 $140,000 $87,000 $108,000
60%/40% 60%/40% 60%/40% 60%/40% 60%/40% 60%/40% 60%/40% 60%/40% 60%/40% 60%/40%
N/P N/P 6.40% 6.40% 8.00% 8.00% $9.00 $9.00 N/P N/P
$30 Million $40 Million $30 Million $40 Million $30 Million $40 Million $30 Million $40 Million $30 Million $40 Million
$0.10 $0.10 $0.40 $0.40 $0.325 $0.325 $0.40 $0.35 0.29% 0.27%
60%/40% 60%/40% 60%/40% 60%/40% 60%/40% 60%/40% 60%/40% 60%/40% 60%/40% 60%/40%
N/P N/P 6.40% 6.40% 8.00% 8.00% $9.00 $9.00 N/P N/P
2.41% 2.41% N/P N/P 2.37% 2.37% N/P N/P 1.14% 1.14%
5.87% 5.87% N/P N/P 5.74% 5.74% $3.63 $3.63 9.93% 9.93%
7.89% 7.89% N/P N/P 8.28% 8.28% $7.05 $7.05 15.53% 15.53%
N/P N/P N/P N/P 7.71% 7.71% $6.93 $6.93 13.65% 13.65%
N/P N/P N/P N/P N/P N/P N/P N/P N/P N/P
PARS PAFA
Actual Portfolio Vendor "Net Annual" Cost Shown in Basis Points (bps) 100 (bps) = 1% 6 0% Equities/40% Fixed
Based on Assets Under Management Simulated
Actual Portfolio Vendor "Net Annual" Cost Shown in Dollars 60% Equities/40% Fixed
Based on Assets Under Management Simulated
Actual Portfolio Vendor "Net Annual" Cost Shown in Dollars 60% Equities/40% Fixed
Based on Assets Under Management Simulated
Actual Portfolio Vendor "Net Annual" Cost Shown in Basis Points (bps) 100 (bps) = 1% 6 0% Equities/40% Fixed
Target Return %
Category FuturisCCLCCalPERS
NORTH ORANGE COUNTY COMMUNITY COLLEGE DISTRICT
Asset Level
Annual Fees
Asset Level
Annual Fees
Equity/Fixed
Equity/Fixed
Asset Level
Annual Fees
Target Return %
Since Inception
Annual Fees
Equity/Fixed
Target Return %
Quarter
1 Year
Based on Assets Under Management Simulated
Based on Assets Under Management Simulated
3 Years
5 Years
Equity/Fixed
Target Return %
Asset Level
Net Rates of Return as of 03/31/15 60% Equities/40% Fixed
Page 12

$50 Million $60 Million $50 Million $60 Million $50 Million $60 Million $50 Million $60 Million $50 Million $60 Million
$50,000 $60,000 $200,000 $240,000 $162,500 $195,000 $180,000 $200,000 $131,000 $151,000
60%/40% 60%/40% 60%/40% 60%/40% 60%/40% 60%/40% 60%/40% 60%/40% 60%/40% 60%/40%
N/P N/P 6.90% 6.90% 8.00% 8.00% 8.50% 8.50% N/P N/P
$50 Million $60 Million $50 Million $60 Million $50 Million $60 Million $50 Million $60 Million $50 Million $60 Million
0.10% 0.10% $0.40 $0.40 $0.325 $0.325 $0.36 $0.33 0.26% 0.25%
60%/40% 60%/40% 60%/40% 60%/40% 60%/40% 60%/40% 60%/40% 60%/40% 60%/40% 60%/40%
N/P N/P 6.90% 6.90% 8.00% 8.00% 8.50% 8.50% N/P N/P
2.41% 2.41% N/P N/P 2.37% 2.37% N/P N/P 1.40% 1.40%
5.87% 5.87% N/P N/P 5.74% 5.74% 3.72% 3.72% 10.51% 10.51%
7.89% 7.89% N/P N/P 8.28% 8.28% 7.14% 7.14% 16.71% 16.71%
N/P N/P N/P N/P 7.71% 7.71% 7.02% 7.02% 14.43% 14.43%
N/P N/P N/P N/P N/P N/P N/P N/P N/P N/P
Category
NORTH ORANGE COUNTY COMMUNITY COLLEGE DISTRICT
Asset Level
Annual Fees
PARS PAFA
Actual Portfolio Vendor "Net Annual" Cost Shown in Basis Points (bps) 100 (bps) = 1% 6 0% Equities/40% Fixed
Based on Assets Under Management Simulated
Actual Portfolio Vendor "Net Annual" Cost Shown in Dollars 60% Equities/40% Fixed
Based on Assets Under Management Simulated
Since Inception
Quarter
1 Year
Based on Assets Under Management Simulated
3 Years
FuturisCCLCCalPERS
Target Return %
5 Years
Asset Level
Annual Fees
Equity/Fixed
Equity/Fixed
Target Return %
Net Rates of Return as of 03/31/15 60% Equities/40% Fixed
Page 13

$10 Million $20 Million $10 Million $20 Million $10 Million $20 Million $10 Million $20 Million $10 Million $20 Million
$10,000 $20,000 $42,000 $84,000 $42,000 $84,000 $55,000 $90,000 $36,000 $62,000
73%/27% 73%/27% 75%/25% 75%/25% 75%/25% 75%/25% 75%/25% 75%/25% 75%/25% 75%/25%
N/P N/P 7.50% 7.50% 7.50% 7.50% 9.40% 9.40% N/P N/P
$10 Million $20 Million $10 Million $20 Million $10 Million $20 Million $10 Million $20 Million $10 Million $20 Million
$0.10 $0.10 $0.42 $0.42 $0.42 $0.42 $0.55 $0.45 0.36% 0.31%
73%/27% 73%/27% 75%/25% 75%/25% 75%/25% 75%/25% 75%/25% 75%/25% 75%/25% 75%/25%
N/P N/P 7.50% 7.50% 7.50% 7.50% 9.40% 9.40% N/P N/P
$30 Million $40 Million $30 Million $40 Million $30 Million $40 Million $30 Million $40 Million $30 Million $40 Million
$30,000 $40,000 $120,000 $160,000 $97,500 $130,000 $120,000 $150,000 $87,000 $108,000
73%/27% 73%/27% 75%/25% 75%/25% 75%/25% 75%/25% 75%/25% 75%/25% 75%/25% 75%/25%
N/P N/P 7.50% 7.50% 9.00% 9.00% 9.40% 9.40% N/P N/P
$30 Million $40 Million $30 Million $40 Million $30 Million $40 Million $30 Million $40 Million $30 Million $40 Million
$0.10 $0.10 $0.40 $0.40 $0.325 $0.325 $0.40 $0.375 0.29% 0.27%
73%/27% 73%/27% 75%/25% 75%/25% 75%/25% 75%/25% 75%/25% 75%/25% 75%/25% 75%/25%
N/P N/P 7.50% 7.50% 9.00% 9.00% 9.40% 9.40% N/P N/P
2.46% 2.46% N/P N/P 2.48% 2.48% N/P N/P 1.69% 1.69%
5.66% 5.66% N/P N/P 5.84% 5.84% $3.74 $3.74 13.04% 13.04%
9.20% 9.20% N/P N/P 9.27% 9.27% $7.82 $7.82 19.24% 19.24%
9.02% 9.02% N/P N/P 8.29% 8.29% $7.50 $7.50 16.06% 16.06%
N/P N/P N/P N/P N/P N/P N/P N/P N/P N/P
Based on Assets Under Management Simulated
3 Years
5 Years
Equity/Fixed
Target Return %
Asset Level
Net Rates of Return as of 03/31/15 75% Equities/25% Fixed
Asset Level
Annual Fees
Target Return %
Since Inception
Annual Fees
Equity/Fixed
Target Return %
Quarter
1 Year
Based on Assets Under Management Simulated
NORTH ORANGE COUNTY COMMUNITY COLLEGE DISTRICT
Asset Level
Annual Fees
Asset Level
Annual Fees
Equity/Fixed
Equity/Fixed
Target Return %
Category FuturisCCLCCalPERS PARS PAFA
Actual Portfolio Vendor "Net Annual" Cost Shown in Basis Points (bps) 100 (bps) = 1% 75 % Equities/25% Fixed Based on Assets Under Management Simulated
Actual Portfolio Vendor "Net Annual" Cost Shown in Dollars 75% Equities/25% Fixed
Based on Assets Under Management Simulated
Actual Portfolio Vendor "Net Annual" Cost Shown in Dollars 75% Equities/25% Fixed Based on Assets Under Management Simulated
Actual Portfolio Vendor "Net Annual" Cost Shown in Basis Points (bps) 100 (bps) = 1% 75 % Equities/25% Fixed
Page 14

$50 Million $60 Million $50 Million $60 Million $50 Million $60 Million $50 Million $60 Million $50 Million $60 Million
$50,000 $60,000 $200,000 $240,000 $162,500 $195,000 $180,000 $200,000 $131,000 $151,000
73%/27% 73%/27% 75%/25% 75%/25% 75%/25% 75%/25% 75%/25% 75%/25% 75%/25% 75%/25%
N/P N/P 7.50% 7.50% 9.00% 9.00% 9.40% 9.40% N/P N/P
$50 Million $60 Million $50 Million $60 Million $50 Million $60 Million $50 Million $60 Million $50 Million $60 Million
0.10% 0.10% $0.40 $0.40 $0.325 $0.325 $0.36 $0.33 0.26% 0.25%
73%/27% 73%/27% 75%/25% 75%/25% 75%/25% 75%/25% 75%/25% 75%/25% 75%/25% 75%/25%
N/P N/P 7.50% 7.50% 9.00% 9.00% 8.50% 9.40% N/P N/P
2.46% 2.46% N/P N/P 2.48% 2.48% N/P N/P 1.69% 1.69%
5.66% 5.66% N/P N/P 5.84% 5.84% 3.74% 3.74% 13.04% 13.04%
9.20% 9.20% N/P N/P 9.27% 9.27% 7.82% 7.82% 19.24% 19.24%
9.02% 9.02% N/P N/P 8.29% 8.29% 7.50% 7.50% 16.06% 16.06%
N/P N/P N/P N/P N/P N/P N/P N/P N/P N/P
Target Return %
5 Years
Asset Level
Annual Fees
Equity/Fixed
Equity/Fixed
Target Return %
Net Rates of Return as of 03/31/15 75% Equities/25% Fixed
Based on Assets Under Management Simulated
Since Inception
Quarter
1 Year
Based on Assets Under Management Simulated
3 Years
FuturisCCLCCalPERSCategory
NORTH ORANGE COUNTY COMMUNITY COLLEGE DISTRICT
Asset Level
Annual Fees
PARS PAFA
Actual Portfolio Vendor "Net Annual" Cost Shown in Basis Points (bps) 100 (bps) = 1% 75 % Equities/25% Fixed
Based on Assets Under Management Simulated
Actual Portfolio Vendor "Net Annual" Cost Shown in Dollars 75% Equities/25% Fixed
Page 15