north tarrant express mobility … tarrant express mobility partners ... text sub section title bar...
TRANSCRIPT

NORTH TARRANT EXPRESS MOBILITY PARTNERS
MDP Conceptual Financing Plan forSegment 3C
Assumed NTP1: 12/31/2014
Start of Operations: 12/31/2019
End of Concession: 12/31/2066
Model Name: NTE_Segment 3C
Proposers Name: North Tarrant Express Mobility Partners (NTEMP)
Model Author: JPMorgan
Version: Final
Model Date: 11/19/2008
Run Date: 11/19/2008
Tab Legend Format Legend
Sheet Input Tab Text Row or Column Title
Sheet Calculation Tab Text Cell used in model
Sheet Output Tab Text Model Input
Text Main Section Title Bar
Text Sub Section Title Bar
NTE_Segment 3C_Final4.xls - 11/19/2008

NTEMP Base Scope Proposal
SPONSOR SEGEMENT 3C
Project SummaryAll amounts in nominal US Dollars (000s)
PROJECT SOURCES AND APPLICATION OF FUNDS (END CONSTRUCTION) IRR (LEVERAGED) Nominal Real(1) Project IRR(2)
Pre Equity Dis Tax 12.7% 9.9% Pre-Corp. Tax 10.1%
SOURCES 12/31/2019 % Post Equity Dis Tax 12.3% 9.6% Post Corp. Tax 8.7%
Public Funds Request (Nominal) - 0.00%
Sr (Bank) Facility 200,000 31.52% ANNUAL DEBT SERVICE COVERAGE RATIOS AND LOAN LIFE COVERAGE RATIOS
Sr (Bond) Facility - 0.00%
TIFIA Facility Draws 200,000 31.52%
TIFIA Facility Interest Capitalized 15,292 2.41%
Mez Facility - 0.00%
Share Holder Loan - 0.00%
Equity 219,212 34.55%
Total Sources 634,504
APPLICATION 12/31/2019
Initial Construction 516,339
Sponsor Fee/Bid Cost 16,000
Sr (Bank) Interest 21,460
Sr (Bond) Interest -
TIFIA Interest 15,292
Mex Fac Interest - PROJECT CASH FLOW AVAILABLE FOR EQUITY (POST CORPORATE TAX)
Equity Bridge Interest -
Total Capitalized Interest 36,752
Sr (Bank) Fees & Expenses 9,167
Liquidity Fees -
Sr (Bond) Fees & Expenses -
Future Cap Ex Fac Fees -
TIFIA Fees & Expenses 1,246
Mez Fac Fees & Expenses -
Total Fin Fees & Expenses 10,413
Debt Service Reserve Funds 25,000
Major Maintenance Reserve 30,000
Total Application 634,504
(1) Assumes an inflation factor of 2.5%
(2) Project IRR assumes 100% funding of project, no Public Funds
-
1.00
2.00
3.00
4.00
5.00
6.00
7.00
8.00
9.00
10.00
2020
2023
2026
2029
2032
2035
2038
2041
2044
2047
2050
2053
2056
2059
2062
2065
Coverage by Net Revenues
Gloabal using Mandatory TIFIA (Post Liquidity)
Global Term LLCR
Global Post Liquidity (Scheduled)
1/0/1900
2/19/1900
4/9/1900
5/29/1900
7/18/1900
9/6/1900
10/26/1900
12/15/1900
2/3/1901
2020
2024
2028
2032
2036
2040
2044
2048
2052
2056
2060
2064
2068
$ Millions
Retained Equity Fund Balance
DSRF
MMRA Fund Balance
Ending Cash Flow
NTE_Segment 3C_Final4.xls - 11/19/2008 Page 2 of 35

NTEMP Base Scope Proposal
SPONSOR SEGEMENT 3C
Funding Summary ($ 000s)All amounts in nominal US Dollars (000s)
APPLICATION OF FUNDS
Year: TOTALS 2015 2016 2017 2018 2019 2020 2021 2022
Project Capital Requirements 516,339 17,563 65,613 111,360 179,856 141,947 - - -
Sr Debt (Bonds) DSRF 25,000 - - - - 25,000 - - -
Upfront Developer Fee 16,000 16,000 - - - - - - -
Capitalized Interest and Financing Fee 47,165 6,362 4,237 7,013 12,494 17,058 - - -
MMR/Future Capex Funded 30,000 - - - - 30,000 - - -
TOTAL COSTS 634,504 39,925 69,850 118,373 192,350 214,005 - - -
SOURCE OF FUNDS
Government Subsidy - - - - - - - - -
Construction Fund Interest - - - - - - - - -
NET PROJECT COSTS FOR DEBT/EQUITY 634,504 39,925 69,850 118,373 192,350 214,005 - - -
Senior Bond (PAB) Debt Draw
TIFIA Loan Draw 200,000 12,791 22,244 37,520 60,681 66,765 - - -
TIFIA Interest Capitalized 15,292 325 982 2,209 4,479 7,298 - - -
Senior Bank Debt Draw 200,000 12,791 22,244 37,520 60,681 66,765 - - -
Equity Draw 219,212 14,019 24,381 41,124 66,510 73,178 - - -
TOTAL DEBT / EQUITY 634,504 39,925 69,850 118,373 192,350 214,005 - - -
Check - - - - - - - - -
Equity funding percent: 35.11% 34.90% 34.74% 34.58% 34.19%
NTE_Segment 3C_Final4.xls - 11/19/2008 Page 3 of 35

NTEMP Base Scope Proposal
SPONSOR SEGEMENT 3C
Annual Cashflow Report
Cash Flow Cascade Total2015 2016 2017 2018 2019 2020 2021 2022 2023 2024 2025
Gross Tolling Revenues 9,725,346 - - - - - 12,912 19,745 26,589 31,445 35,057 36,498
Interest Income from Cap Ex and DSRF Fund Balances 8,782 - - - - - 900 900 900 900 900 -
Interest Income from Retained Fund Balances 3,589 0 0 0 0 0 0 20 209 608 1,148 1,604
3,721 - - - - - 741 730 750 750 750 -
Total Revenues 9,741,438 0 0 0 0 0 14,552 21,396 28,448 33,703 37,855 38,102
Developments Costs (16,000) (16,000) - - - - - - - - - -
ConstructionCapex (516,339) (17,563) (65,613) (111,360) (179,856) (141,947) - - - - - -
Total Expenditures Construction Period (532,339) (33,563) (65,613) (111,360) (179,856) (141,947) - - - - - -
State Financial Contributions (during Construction) - - - - - - - - - - - -
Revenue Sharing Payments - - - - - - - - - - - -
Total Province Payments Operations Period - - - - - - - - - - - -
Construction Interest and Financing Fees (47,165) (6,362) (4,237) (7,013) (12,494) (17,058) - - - - - -
Total Debt Expenditures & Fees Construction Period (47,165) (6,362) (4,237) (7,013) (12,494) (17,058) - - - - - -
Operating & Maintenance (630,866) - - - - - (3,912) (4,135) (4,359) (4,599) (4,840) (4,974)
Local Taxes (68,190) (0) (0) (0) (0) (0) (102) (150) (199) (236) (265) (267)
- (167,639) - - - - - - - - - - (1,886)
- (61,361) - - - - - - - - - - -
- - - - - - - - - - - -
- - - - - - - - - - - -
- - - - - - - - - - - -
Total Expenditures Operating Period (928,057) (0) (0) (0) (0) (0) (4,014) (4,285) (4,558) (4,835) (5,105) (7,127)
SUB Total Future Capex (229,000) - - - - - - - - - - (1,886)
(125,283) - - - - (30,000) - - - - - -
Movement in MMRA 95,283 - - - - - - - - - - -
Accounts Movements (30,000) - - - - (30,000) - - - - - -
Net Pre-Funding Cashflow 8,203,878 (39,925) (69,850) (118,373) (192,350) (189,005) 10,539 17,111 23,890 28,868 32,750 30,975
Equity Funding 219,212 14,019 24,381 41,124 66,510 73,178 - - - - - -
Other Funding - - - - - - - - - - - -
Sr Debt (Bank) Facility 200,000 12,791 22,244 37,520 60,681 66,765 - - - - - -
Sr Debt (Bond) - - - - - - - - - - - -
Liquidity Facility - - - - - - - - - - - -
Future Cap Ex Facility 133,717 - - - - - - - - - - 1,886
TIFIA Loan 215,292 13,115 23,226 39,729 65,160 74,062 - - - - - -
Mez Facility - - - - - - - - - - - -
Share Holder Loan - - - - - - - - - - - -
Equity Bridge Facility - - - - - - - - - - - -
Regearing Facility (Regearing Draw) - - - - - - - - - - - -
Regearing Facility (Refinance Draw) 599,912 - - - - - - - - - 200,000 -
Total Debt Funding 1,148,921 25,906 45,469 77,249 125,841 140,827 - - - - 200,000 1,886
Financinge Fees and Exp (During Operations) (15,547) - - - - - (150) (150) (150) (150) (2,150) (785)
Net Pre-Debt Service Cashflow (CFADS) 9,556,463 0 0 (0) 0 25,000 10,389 16,961 23,740 28,718 230,600 32,076 NTE_Segment 3C_Final4.xls - 4 Page 4 of 35
NTEMP Base Scope Proposal
SPONSOR SEGEMENT 3C
Annual Cashflow Report
Cash Flow Cascade Total2015 2016 2017 2018 2019 2020 2021 2022 2023 2024 2025
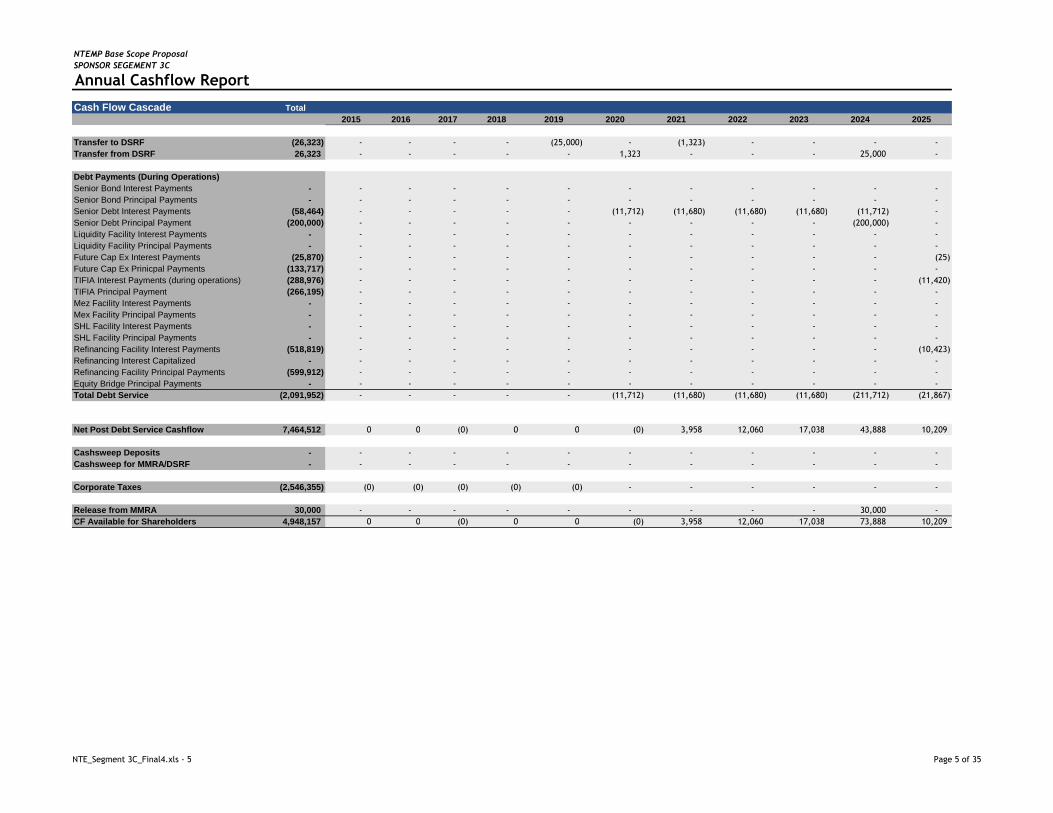
Transfer to DSRF (26,323) - - - - (25,000) - (1,323) - - - -
Transfer from DSRF 26,323 - - - - - 1,323 - - - 25,000 -
Debt Payments (During Operations)Senior Bond Interest Payments - - - - - - - - - - - -
Senior Bond Principal Payments - - - - - - - - - - - -
Senior Debt Interest Payments (58,464) - - - - - (11,712) (11,680) (11,680) (11,680) (11,712) -
Senior Debt Principal Payment (200,000) - - - - - - - - - (200,000) -
Liquidity Facility Interest Payments - - - - - - - - - - - -
Liquidity Facility Principal Payments - - - - - - - - - - - -
Future Cap Ex Interest Payments (25,870) - - - - - - - - - - (25)
Future Cap Ex Prinicpal Payments (133,717) - - - - - - - - - - -
TIFIA Interest Payments (during operations) (288,976) - - - - - - - - - - (11,420)
TIFIA Principal Payment (266,195) - - - - - - - - - - -
Mez Facility Interest Payments - - - - - - - - - - - -
Mex Facility Principal Payments - - - - - - - - - - - -
SHL Facility Interest Payments - - - - - - - - - - - -
SHL Facility Principal Payments - - - - - - - - - - - -
Refinancing Facility Interest Payments (518,819) - - - - - - - - - - (10,423)
Refinancing Interest Capitalized - - - - - - - - - - - -
Refinancing Facility Principal Payments (599,912) - - - - - - - - - - -
Equity Bridge Principal Payments - - - - - - - - - - - -
Total Debt Service (2,091,952) - - - - - (11,712) (11,680) (11,680) (11,680) (211,712) (21,867)
Net Post Debt Service Cashflow 7,464,512 0 0 (0) 0 0 (0) 3,958 12,060 17,038 43,888 10,209
Cashsweep Deposits - - - - - - - - - - - -
Cashsweep for MMRA/DSRF - - - - - - - - - - - -
Corporate Taxes (2,546,355) (0) (0) (0) (0) (0) - - - - - -
Release from MMRA 30,000 - - - - - - - - - 30,000 -
CF Available for Shareholders 4,948,157 0 0 (0) 0 0 (0) 3,958 12,060 17,038 73,888 10,209
NTE_Segment 3C_Final4.xls - 5 Page 5 of 35

NTEMP Base Scope Proposal
SPONSOR SEGEMENT 3C
Annual Cashflow Report
Cash Flow Cascade Total
Gross Tolling Revenues 9,725,346 Interest Income from Cap Ex and DSRF Fund Balances 8,782 Interest Income from Retained Fund Balances 3,589
3,721 Total Revenues 9,741,438
Developments Costs (16,000) ConstructionCapex (516,339) Total Expenditures Construction Period (532,339)
State Financial Contributions (during Construction) - Revenue Sharing Payments - Total Province Payments Operations Period -
Construction Interest and Financing Fees (47,165) Total Debt Expenditures & Fees Construction Period (47,165)
Operating & Maintenance (630,866) Local Taxes (68,190)
- (167,639) - (61,361)
- - -
Total Expenditures Operating Period (928,057) SUB Total Future Capex (229,000)
(125,283) Movement in MMRA 95,283 Accounts Movements (30,000)
Net Pre-Funding Cashflow 8,203,878
Equity Funding 219,212
Other Funding - Sr Debt (Bank) Facility 200,000 Sr Debt (Bond) - Liquidity Facility - Future Cap Ex Facility 133,717 TIFIA Loan 215,292 Mez Facility - Share Holder Loan - Equity Bridge Facility - Regearing Facility (Regearing Draw) - Regearing Facility (Refinance Draw) 599,912 Total Debt Funding 1,148,921
Financinge Fees and Exp (During Operations) (15,547)
Net Pre-Debt Service Cashflow (CFADS) 9,556,463
2026 2027 2028 2029 2030 2031 2032 2033 2034 2035 203641,476 46,680 52,118 57,799 63,731 69,924 76,386 83,128 90,160 97,491 105,132
- - - - - - - - - - -
- - - - - - - - - - -
- - - - - - - - - - -
41,476 46,680 52,118 57,799 63,731 69,924 76,386 83,128 90,160 97,491 105,132
- - - - - - - - - - -
- - - - - - - - - - -
- - - - - - - - - - -
- - - - - - - - - - -
- - - - - - - - - - -
- - - - - - - - - - -
- - - - - - - - - - -
- - - - - - - - - - -
(5,288) (5,622) (5,960) (6,320) (6,684) (7,070) (7,457) (7,871) (8,286) (8,730) (9,176)
(290) (327) (365) (405) (446) (489) (535) (582) (631) (682) (736)
- - - - (17,726) - - - - (2,414) -
- - - - (10,199) - - - - - -
- - - - - - - - - - -
- - - - - - - - - - -
- - - - - - - - - - -
(5,578) (5,949) (6,325) (6,725) (35,055) (7,559) (7,992) (8,453) (8,918) (11,826) (9,912)
- - - - (27,925) - - - - (2,414) -
- - - - - - - - - - -
- - - - - - - - - - -
- - - - - - - - - - -
35,898 40,731 45,793 51,074 28,676 62,365 68,394 74,676 81,242 85,664 95,220
- - - - - - - - - - -
- - - - - - - - - - -
- - - - - - - - - - -
- - - - - - - - - - -
- - - - - - - - - - -
- - - - 27,925 (0) - (0) (0) 2,414 -
- - - - - - - - - - -
- - - - - - - - - - -
- - - - - - - - - - -
- - - - - - - - - - -
- - - - - - - - - - -
- - - - - - - - 29,811 - -
- - - - 27,925 (0) - (0) 29,811 2,414 -
(251) (251) (252) (251) (209) (82) (82) (82) (380) (1,311) (401)
35,647 40,480 45,541 50,822 56,392 62,283 68,313 74,594 110,673 86,767 94,819 NTE_Segment 3C_Final4.xls - 6 Page 6 of 35

NTEMP Base Scope Proposal
SPONSOR SEGEMENT 3C
Annual Cashflow Report
Cash Flow Cascade Total
Transfer to DSRF (26,323) Transfer from DSRF 26,323
Debt Payments (During Operations)Senior Bond Interest Payments - Senior Bond Principal Payments - Senior Debt Interest Payments (58,464) Senior Debt Principal Payment (200,000) Liquidity Facility Interest Payments - Liquidity Facility Principal Payments - Future Cap Ex Interest Payments (25,870) Future Cap Ex Prinicpal Payments (133,717) TIFIA Interest Payments (during operations) (288,976) TIFIA Principal Payment (266,195) Mez Facility Interest Payments - Mex Facility Principal Payments - SHL Facility Interest Payments - SHL Facility Principal Payments - Refinancing Facility Interest Payments (518,819) Refinancing Interest Capitalized - Refinancing Facility Principal Payments (599,912) Equity Bridge Principal Payments - Total Debt Service (2,091,952)
Net Post Debt Service Cashflow 7,464,512
Cashsweep Deposits - Cashsweep for MMRA/DSRF -
Corporate Taxes (2,546,355)
Release from MMRA 30,000 CF Available for Shareholders 4,948,157
2026 2027 2028 2029 2030 2031 2032 2033 2034 2035 2036
- - - - - - - - - - -
- - - - - - - - - - -
- - - - - - - - - - -
- - - - - - - - - - -
- - - - - - - - - - -
- - - - - - - - - - -
- - - - - - - - - - -
- - - - - - - - - - -
(98) (97) (96) (96) (454) (1,517) (1,521) (1,517) (1,517) (31) (123)
- - - - - - - - (29,811) - -
(11,420) (11,420) (11,420) (11,420) (11,420) (11,420) (11,420) (11,420) (11,420) (11,420) (11,420)
- - - - - - - - - - -
- - - - - - - - - - -
- - - - - - - - - - -
- - - - - - - - - - -
- - - - - - - - - - -
(10,342) (10,261) (10,207) (10,179) (10,179) (10,179) (10,207) (10,179) (10,179) (11,697) (11,729)
- - - - - - - - - - -
- - - - - - - - - - -
- - - - - - - - - - -
(21,859) (21,777) (21,723) (21,695) (22,053) (23,116) (23,149) (23,116) (52,927) (23,147) (23,272)
13,788 18,703 23,818 29,127 34,339 39,167 45,164 51,478 57,746 63,620 71,547
- - - - - - - - - - -
- - - - - - - - - - -
(7) (56) (107) (53) (175) (227) (347) (474) (599) (3,374) (9,134)
- - - - - - - - - - -
13,780 18,646 23,711 29,074 34,164 38,939 44,817 51,004 57,147 60,245 62,413
NTE_Segment 3C_Final4.xls - 7 Page 7 of 35
NTEMP Base Scope Proposal
SPONSOR SEGEMENT 3C
Annual Cashflow Report
Cash Flow Cascade Total
Gross Tolling Revenues 9,725,346 Interest Income from Cap Ex and DSRF Fund Balances 8,782 Interest Income from Retained Fund Balances 3,589
3,721 Total Revenues 9,741,438
Developments Costs (16,000) ConstructionCapex (516,339) Total Expenditures Construction Period (532,339)
State Financial Contributions (during Construction) - Revenue Sharing Payments - Total Province Payments Operations Period -
Construction Interest and Financing Fees (47,165) Total Debt Expenditures & Fees Construction Period (47,165)
Operating & Maintenance (630,866) Local Taxes (68,190)
- (167,639) - (61,361)
- - -
Total Expenditures Operating Period (928,057) SUB Total Future Capex (229,000)
(125,283) Movement in MMRA 95,283 Accounts Movements (30,000)
Net Pre-Funding Cashflow 8,203,878
Equity Funding 219,212
Other Funding - Sr Debt (Bank) Facility 200,000 Sr Debt (Bond) - Liquidity Facility - Future Cap Ex Facility 133,717 TIFIA Loan 215,292 Mez Facility - Share Holder Loan - Equity Bridge Facility - Regearing Facility (Regearing Draw) - Regearing Facility (Refinance Draw) 599,912 Total Debt Funding 1,148,921
Financinge Fees and Exp (During Operations) (15,547)
Net Pre-Debt Service Cashflow (CFADS) 9,556,463
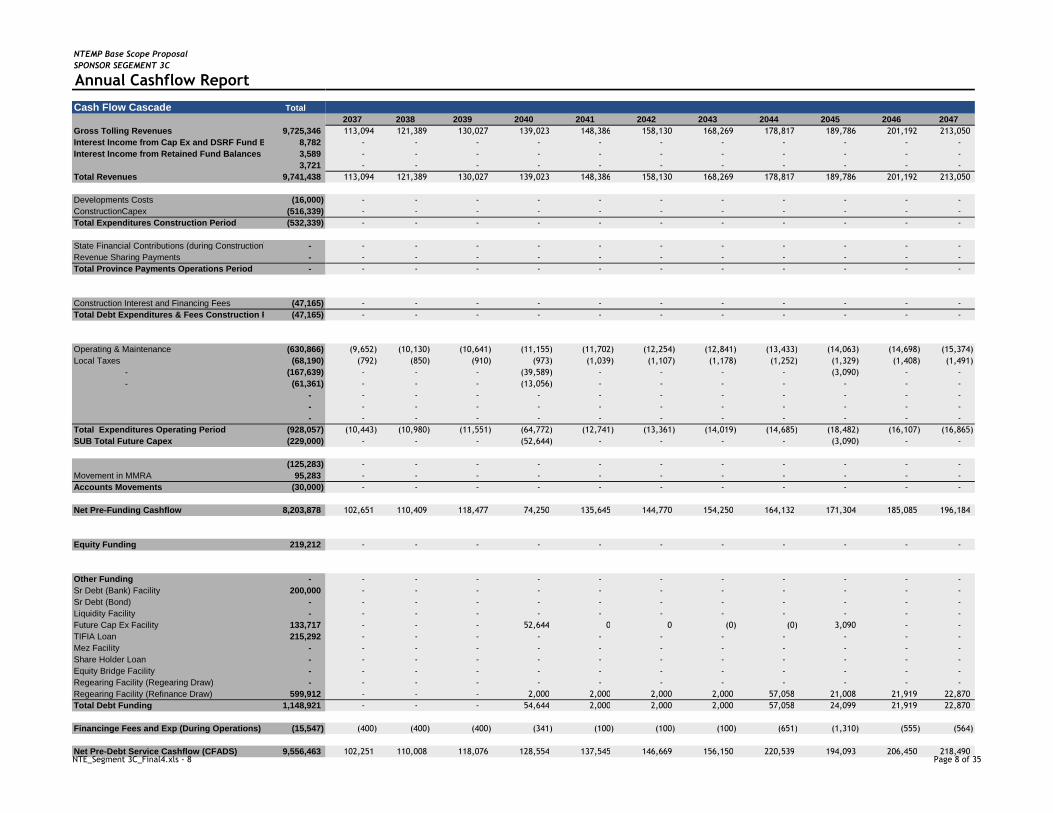
2037 2038 2039 2040 2041 2042 2043 2044 2045 2046 2047113,094 121,389 130,027 139,023 148,386 158,130 168,269 178,817 189,786 201,192 213,050
- - - - - - - - - - -
- - - - - - - - - - -
- - - - - - - - - - -
113,094 121,389 130,027 139,023 148,386 158,130 168,269 178,817 189,786 201,192 213,050
- - - - - - - - - - -
- - - - - - - - - - -
- - - - - - - - - - -
- - - - - - - - - - -
- - - - - - - - - - -
- - - - - - - - - - -
- - - - - - - - - - -
- - - - - - - - - - -
(9,652) (10,130) (10,641) (11,155) (11,702) (12,254) (12,841) (13,433) (14,063) (14,698) (15,374)
(792) (850) (910) (973) (1,039) (1,107) (1,178) (1,252) (1,329) (1,408) (1,491)
- - - (39,589) - - - - (3,090) - -
- - - (13,056) - - - - - - -
- - - - - - - - - - -
- - - - - - - - - - -
- - - - - - - - - - -
(10,443) (10,980) (11,551) (64,772) (12,741) (13,361) (14,019) (14,685) (18,482) (16,107) (16,865)
- - - (52,644) - - - - (3,090) - -
- - - - - - - - - - -
- - - - - - - - - - -
- - - - - - - - - - -
102,651 110,409 118,477 74,250 135,645 144,770 154,250 164,132 171,304 185,085 196,184
- - - - - - - - - - -
- - - - - - - - - - -
- - - - - - - - - - -
- - - - - - - - - - -
- - - - - - - - - - -
- - - 52,644 0 0 (0) (0) 3,090 - -
- - - - - - - - - - -
- - - - - - - - - - -
- - - - - - - - - - -
- - - - - - - - - - -
- - - - - - - - - - -
- - - 2,000 2,000 2,000 2,000 57,058 21,008 21,919 22,870
- - - 54,644 2,000 2,000 2,000 57,058 24,099 21,919 22,870
(400) (400) (400) (341) (100) (100) (100) (651) (1,310) (555) (564)
102,251 110,008 118,076 128,554 137,545 146,669 156,150 220,539 194,093 206,450 218,490 NTE_Segment 3C_Final4.xls - 8 Page 8 of 35

NTEMP Base Scope Proposal
SPONSOR SEGEMENT 3C
Annual Cashflow Report
Cash Flow Cascade Total
Transfer to DSRF (26,323) Transfer from DSRF 26,323
Debt Payments (During Operations)Senior Bond Interest Payments - Senior Bond Principal Payments - Senior Debt Interest Payments (58,464) Senior Debt Principal Payment (200,000) Liquidity Facility Interest Payments - Liquidity Facility Principal Payments - Future Cap Ex Interest Payments (25,870) Future Cap Ex Prinicpal Payments (133,717) TIFIA Interest Payments (during operations) (288,976) TIFIA Principal Payment (266,195) Mez Facility Interest Payments - Mex Facility Principal Payments - SHL Facility Interest Payments - SHL Facility Principal Payments - Refinancing Facility Interest Payments (518,819) Refinancing Interest Capitalized - Refinancing Facility Principal Payments (599,912) Equity Bridge Principal Payments - Total Debt Service (2,091,952)
Net Post Debt Service Cashflow 7,464,512
Cashsweep Deposits - Cashsweep for MMRA/DSRF -
Corporate Taxes (2,546,355)
Release from MMRA 30,000 CF Available for Shareholders 4,948,157
2037 2038 2039 2040 2041 2042 2043 2044 2045 2046 2047
- - - - - - - - - - -
- - - - - - - - - - -
- - - - - - - - - - -
- - - - - - - - - - -
- - - - - - - - - - -
- - - - - - - - - - -
- - - - - - - - - - -
- - - - - - - - - - -
(123) (123) (123) (799) (2,802) (2,802) (2,802) (2,810) (40) (157) (157)
- - - - - - - (55,058) - - -
(11,420) (11,420) (11,420) (11,398) (11,312) (11,227) (11,141) (11,055) (10,766) (9,855) (8,904)
- - - (2,000) (2,000) (2,000) (2,000) (2,000) (21,008) (21,919) (22,870)
- - - - - - - - - - -
- - - - - - - - - - -
- - - - - - - - - - -
- - - - - - - - - - -
(11,697) (11,697) (11,697) (11,754) (11,824) (11,926) (12,028) (12,163) (15,275) (16,355) (17,483)
- - - - - - - - - - -
- - - - - - - - - - -
- - - - - - - - - - -
(23,239) (23,239) (23,239) (25,951) (27,939) (27,955) (27,971) (83,086) (47,089) (48,287) (49,415)
79,011 86,769 94,837 102,603 109,606 118,715 128,179 137,453 147,004 158,163 169,075
- - - - - - - - - - -
- - - - - - - - - - -
(10,626) (12,178) (20,380) (33,554) (34,747) (38,185) (42,029) (45,472) (49,208) (53,568) (57,506)
- - - - - - - - - - -
68,385 74,591 74,457 69,049 74,859 80,529 86,150 91,981 97,796 104,595 111,570
NTE_Segment 3C_Final4.xls - 9 Page 9 of 35

NTEMP Base Scope Proposal
SPONSOR SEGEMENT 3C
Annual Cashflow Report
Cash Flow Cascade Total
Gross Tolling Revenues 9,725,346 Interest Income from Cap Ex and DSRF Fund Balances 8,782 Interest Income from Retained Fund Balances 3,589
3,721 Total Revenues 9,741,438
Developments Costs (16,000) ConstructionCapex (516,339) Total Expenditures Construction Period (532,339)
State Financial Contributions (during Construction) - Revenue Sharing Payments - Total Province Payments Operations Period -
Construction Interest and Financing Fees (47,165) Total Debt Expenditures & Fees Construction Period (47,165)
Operating & Maintenance (630,866) Local Taxes (68,190)
- (167,639) - (61,361)
- - -
Total Expenditures Operating Period (928,057) SUB Total Future Capex (229,000)
(125,283) Movement in MMRA 95,283 Accounts Movements (30,000)
Net Pre-Funding Cashflow 8,203,878
Equity Funding 219,212
Other Funding - Sr Debt (Bank) Facility 200,000 Sr Debt (Bond) - Liquidity Facility - Future Cap Ex Facility 133,717 TIFIA Loan 215,292 Mez Facility - Share Holder Loan - Equity Bridge Facility - Regearing Facility (Regearing Draw) - Regearing Facility (Refinance Draw) 599,912 Total Debt Funding 1,148,921
Financinge Fees and Exp (During Operations) (15,547)
Net Pre-Debt Service Cashflow (CFADS) 9,556,463
2048 2049 2050 2051 2052 2053 2054 2055 2056 2057 2058 2059225,375 238,183 251,490 265,314 279,673 294,583 310,063 326,134 342,815 360,126 378,087 396,722
- - - - - 18 71 83 - - 518 1,553
- - - - - - - - - - - -
- - - - - - - - - - - -
225,375 238,183 251,490 265,314 279,673 294,600 310,135 326,217 342,815 360,126 378,605 398,275
- - - - - - - - - - - -
- - - - - - - - - - - -
- - - - - - - - - - - -
- - - - - - - - - - - -
- - - - - - - - - - - -
- - - - - - - - - - - -
- - - - - - - - - - - -
- - - - - - - - - - - -
(16,056) (16,780) (17,511) (18,287) (19,070) (19,902) (20,742) (21,632) (22,532) (23,486) (24,450) (25,471)
(1,578) (1,667) (1,760) (1,857) (1,958) (2,062) (2,171) (2,284) (2,400) (2,521) (2,650) (2,788)
- - (29,046) - - - - (3,956) - - - -
- - (16,712) - - - - - - - - -
- - - - - - - - - - - -
- - - - - - - - - - - -
- - - - - - - - - - - -
(17,633) (18,447) (65,029) (20,144) (21,028) (21,964) (22,913) (27,871) (24,932) (26,007) (27,100) (28,259)
- - (45,758) - - - - (3,956) - - - -
- - - - - (1,978) (1,582) (396) - (8,626) (34,506) (34,506)
- - - - - - - 3,956 - - - -
- - - - - (1,978) (1,582) 3,560 - (8,626) (34,506) (34,506)
207,742 219,736 186,461 245,170 258,645 270,659 285,640 301,906 317,883 325,492 316,999 335,511
- - - - - - - - - - - -
- - - - - - - - - - - -
- - - - - - - - - - - -
- - - - - - - - - - - -
- - - - - - - - - - - -
- - 45,758 (0) - - - - - - - -
- - - - - - - - - - - -
- - - - - - - - - - - -
- - - - - - - - - - - -
- - - - - - - - - - - -
- - - - - - - - - - - -
23,861 24,896 25,976 27,102 77,125 29,503 30,782 - - - - -
23,861 24,896 71,733 27,102 77,125 29,503 30,782 - - - - -
(575) (584) (525) (328) (825) (345) (358) - - - - -
231,028 244,047 257,670 271,944 334,945 299,817 316,064 301,906 317,883 325,492 316,999 335,511 NTE_Segment 3C_Final4.xls - 10 Page 10 of 35
NTEMP Base Scope Proposal
SPONSOR SEGEMENT 3C
Annual Cashflow Report
Cash Flow Cascade Total
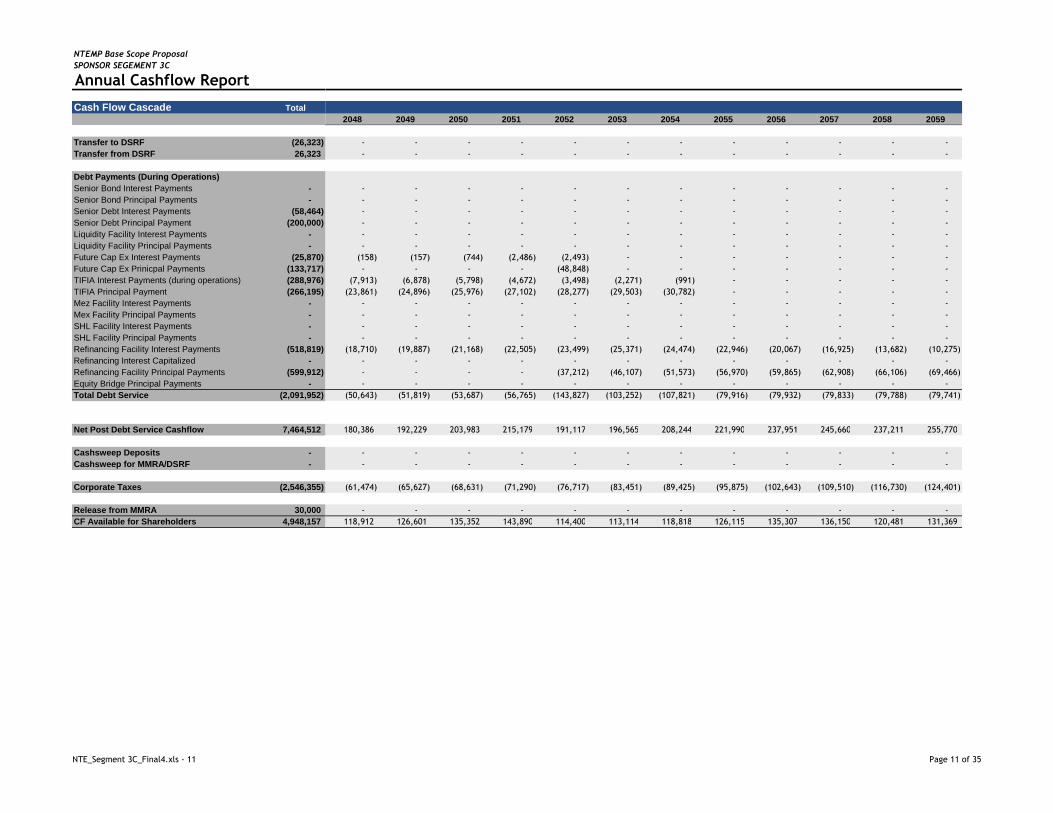
Transfer to DSRF (26,323) Transfer from DSRF 26,323
Debt Payments (During Operations)Senior Bond Interest Payments - Senior Bond Principal Payments - Senior Debt Interest Payments (58,464) Senior Debt Principal Payment (200,000) Liquidity Facility Interest Payments - Liquidity Facility Principal Payments - Future Cap Ex Interest Payments (25,870) Future Cap Ex Prinicpal Payments (133,717) TIFIA Interest Payments (during operations) (288,976) TIFIA Principal Payment (266,195) Mez Facility Interest Payments - Mex Facility Principal Payments - SHL Facility Interest Payments - SHL Facility Principal Payments - Refinancing Facility Interest Payments (518,819) Refinancing Interest Capitalized - Refinancing Facility Principal Payments (599,912) Equity Bridge Principal Payments - Total Debt Service (2,091,952)
Net Post Debt Service Cashflow 7,464,512
Cashsweep Deposits - Cashsweep for MMRA/DSRF -
Corporate Taxes (2,546,355)
Release from MMRA 30,000 CF Available for Shareholders 4,948,157
2048 2049 2050 2051 2052 2053 2054 2055 2056 2057 2058 2059
- - - - - - - - - - - -
- - - - - - - - - - - -
- - - - - - - - - - - -
- - - - - - - - - - - -
- - - - - - - - - - - -
- - - - - - - - - - - -
- - - - - - - - - - - -
- - - - - - - - - - - -
(158) (157) (744) (2,486) (2,493) - - - - - - -
- - - - (48,848) - - - - - - -
(7,913) (6,878) (5,798) (4,672) (3,498) (2,271) (991) - - - - -
(23,861) (24,896) (25,976) (27,102) (28,277) (29,503) (30,782) - - - - -
- - - - - - - - - - - -
- - - - - - - - - - - -
- - - - - - - - - - - -
- - - - - - - - - - - -
(18,710) (19,887) (21,168) (22,505) (23,499) (25,371) (24,474) (22,946) (20,067) (16,925) (13,682) (10,275)
- - - - - - - - - - - -
- - - - (37,212) (46,107) (51,573) (56,970) (59,865) (62,908) (66,106) (69,466)
- - - - - - - - - - - -
(50,643) (51,819) (53,687) (56,765) (143,827) (103,252) (107,821) (79,916) (79,932) (79,833) (79,788) (79,741)
180,386 192,229 203,983 215,179 191,117 196,565 208,244 221,990 237,951 245,660 237,211 255,770
- - - - - - - - - - - -
- - - - - - - - - - - -
(61,474) (65,627) (68,631) (71,290) (76,717) (83,451) (89,425) (95,875) (102,643) (109,510) (116,730) (124,401)
- - - - - - - - - - - -
118,912 126,601 135,352 143,890 114,400 113,114 118,818 126,115 135,307 136,150 120,481 131,369
NTE_Segment 3C_Final4.xls - 11 Page 11 of 35

NTEMP Base Scope Proposal
SPONSOR SEGEMENT 3C
Annual Cashflow Report
Cash Flow Cascade Total
Gross Tolling Revenues 9,725,346 Interest Income from Cap Ex and DSRF Fund Balances 8,782 Interest Income from Retained Fund Balances 3,589
3,721 Total Revenues 9,741,438
Developments Costs (16,000) ConstructionCapex (516,339) Total Expenditures Construction Period (532,339)
State Financial Contributions (during Construction) - Revenue Sharing Payments - Total Province Payments Operations Period -
Construction Interest and Financing Fees (47,165) Total Debt Expenditures & Fees Construction Period (47,165)
Operating & Maintenance (630,866) Local Taxes (68,190)
- (167,639) - (61,361)
- - -
Total Expenditures Operating Period (928,057) SUB Total Future Capex (229,000)
(125,283) Movement in MMRA 95,283 Accounts Movements (30,000)
Net Pre-Funding Cashflow 8,203,878
Equity Funding 219,212
Other Funding - Sr Debt (Bank) Facility 200,000 Sr Debt (Bond) - Liquidity Facility - Future Cap Ex Facility 133,717 TIFIA Loan 215,292 Mez Facility - Share Holder Loan - Equity Bridge Facility - Regearing Facility (Regearing Draw) - Regearing Facility (Refinance Draw) 599,912 Total Debt Funding 1,148,921
Financinge Fees and Exp (During Operations) (15,547)
Net Pre-Debt Service Cashflow (CFADS) 9,556,463
2060 2061 2062 2063 2064 2065 2066 2067416,053 436,102 456,894 478,452 500,803 523,972 537,072 -
1,812 - - 30 91 106 - -
- - - - - - - -
- - - - - - - -
417,865 436,102 456,894 478,482 500,894 524,079 537,072 -
- - - - - - - -
- - - - - - - -
- - - - - - - -
- - - - - - - -
- - - - - - - -
- - - - - - - -
- - - - - - - -
- - - - - - - -
(26,504) (27,596) (28,701) (29,869) (31,053) - - -
(2,925) (3,053) (3,198) (3,349) (3,506) (3,669) (3,760) -
(64,870) - - - - (5,064) - -
(21,393) - - - - - - -
- - - - - - - -
- - - - - - - -
- - - - - - - -
(115,692) (30,648) (31,900) (33,219) (34,559) (8,732) (3,760) -
(86,264) - - - - (5,064) - -
(8,626) - (506) (2,025) (2,025) (506) - -
86,264 - - - - 5,064 - -
77,637 - (506) (2,025) (2,025) 4,557 - -
379,810 405,454 424,488 443,238 464,310 519,904 533,312 -
- - - - - - - -
- - - - - - - -
- - - - - - - -
- - - - - - - -
- - - - - - - -
- - - - - - - -
- - - - - - - -
- - - - - - - -
- - - - - - - -
- - - - - - - -
- - - - - - - -
- - - - - - - -
- - - - - - - -
- - - - - - - -
379,810 405,454 424,488 443,238 464,310 519,904 533,312 - NTE_Segment 3C_Final4.xls - 12 Page 12 of 35

NTEMP Base Scope Proposal
SPONSOR SEGEMENT 3C
Annual Cashflow Report
Cash Flow Cascade Total
Transfer to DSRF (26,323) Transfer from DSRF 26,323
Debt Payments (During Operations)Senior Bond Interest Payments - Senior Bond Principal Payments - Senior Debt Interest Payments (58,464) Senior Debt Principal Payment (200,000) Liquidity Facility Interest Payments - Liquidity Facility Principal Payments - Future Cap Ex Interest Payments (25,870) Future Cap Ex Prinicpal Payments (133,717) TIFIA Interest Payments (during operations) (288,976) TIFIA Principal Payment (266,195) Mez Facility Interest Payments - Mex Facility Principal Payments - SHL Facility Interest Payments - SHL Facility Principal Payments - Refinancing Facility Interest Payments (518,819) Refinancing Interest Capitalized - Refinancing Facility Principal Payments (599,912) Equity Bridge Principal Payments - Total Debt Service (2,091,952)
Net Post Debt Service Cashflow 7,464,512
Cashsweep Deposits - Cashsweep for MMRA/DSRF -
Corporate Taxes (2,546,355)
Release from MMRA 30,000 CF Available for Shareholders 4,948,157
2060 2061 2062 2063 2064 2065 2066 2067
- - - - - - - -
- - - - - - - -
- - - - - - - -
- - - - - - - -
- - - - - - - -
- - - - - - - -
- - - - - - - -
- - - - - - - -
- - - - - - - -
- - - - - - - -
- - - - - - - -
- - - - - - - -
- - - - - - - -
- - - - - - - -
- - - - - - - -
- - - - - - - -
(6,716) (2,932) - - - - - -
- - - - - - - -
(72,997) (76,707) - - - - - -
- - - - - - - -
(79,713) (79,640) - - - - - -
300,097 325,814 424,488 443,238 464,310 519,904 533,312 -
- - - - - - - -
- - - - - - - -
(128,476) (133,835) (142,554) (150,247) (157,622) (175,810) (180,030) -
- - - - - - - -
171,621 191,980 281,934 292,991 306,688 344,094 353,282 -
NTE_Segment 3C_Final4.xls - 13 Page 13 of 35

NTEMP Base Scope Proposal
SPONSOR SEGEMENT 3C
All amounts in nominal US Dollars (000s) Date 1/31/2015 2/28/2015 3/31/2015 4/30/2015 5/31/2015 6/30/2015 7/31/2015 8/31/2015 9/30/2015 10/31/2015
BALANCE SHEET (Monthly Construction) Totals
CURRENT ASSETS
Cash
Fund Balances 0 0 0 0 0 0 0 0 0 0
Construction Fund 0.0% - - - 0.0% - - - - -
DSRF Cash Balance - - - - - - - - - -
Total 0 0 0 0 0 0 0 0 0 0
FIXED ASSETS
Opening Balance/Project Book Value 16,903 17,341 17,781 18,221 18,663 19,105 20,111 21,120 22,130
Concession -
Sponsor's subsidy - - - - - - - - - - -
Capital Expenditures 532,339 16,903 439 440 440 441 442 1,006 1,008 1,011 2,710
MMRA Expenditures 229,000 - - - - - - - - - -
Depreciation (761,339) - - - - - - - - - -
Net Book value 16,903 17,341 17,781 18,221 18,663 19,105 20,111 21,120 22,130 24,840
Future Income Tax Asset - - - - - - - - - -
CAPITALISED FINANCE CHARGES
Opening Balance 4,000 4,153 4,324 4,489 4,662 5,018 5,192 5,368 5,540
Capitalized Finance Charges 4,000 153 170 166 172 356 174 176 172 180
Depreciation - - - - - - - - - -
Net Capitalized Finance Charges 4,000 4,153 4,324 4,489 4,662 5,018 5,192 5,368 5,540 5,720
TOTAL ASSETS 20,903 21,494 22,104 22,711 23,324 24,123 25,303 26,488 27,670 30,560
LONG TERM LIABILITIES
Oustanding Sr Debt 6,751 6,943 7,140 7,335 7,534 7,751 8,132 8,515 8,897 9,830
Outstanding Sr Bond - - - - - - - - - -
Outstanding Liquidity Fac - - - - - - - - - -
Outstanding Cap Ex Fac - - - - - - - - - -
Outstanding TIFIA 6,751 6,943 7,140 7,335 7,534 7,877 8,258 8,641 9,023 9,956
Outstanding Mez Fac - - - - - - - - - -
Outstanding SHL - - - - - - - - - -
Outstanding Regearing Fac - - - - - - - - - -
Outstanding Equity Bridge - - - - - - - - - -
Total 13,503 13,885 14,279 14,671 15,067 15,628 16,390 17,155 17,919 19,786
Defferred Tax Liability - - - - - - - - - -
TOTAL LIABILITIES 13,503 13,885 14,279 14,671 15,067 15,628 16,390 17,155 17,919 19,786
EQUITY
Beginning Share Capital Balance 7,400 7,609 7,825 8,040 8,257 8,495 8,913 9,333 9,751
Share Capital Added / (Removed) 7,400 209 216 215 217 238 418 419 419 1,023
Ending Share Capital Balance 7,400 7,609 7,825 8,040 8,257 8,495 8,913 9,333 9,751 10,774
Cumulative FIRTA Distribution - 0 0 0 0 0 0 0 0 0
Retained Earnings (0) (0) (0) (0) (0) (0) (0) (0) (0) (0)
TOTAL EQUITY 7,400 7,609 7,825 8,040 8,257 8,495 8,913 9,333 9,751 10,774
TOTAL LIABILITIES AND EQUITY 20,903 21,494 22,104 22,711 23,324 24,123 25,303 26,488 27,670 30,560
NTE_Segment 3C_Final4.xls - 11/19/2008 Page 14 of 35

NTEMP Base Scope Proposal
SPONSOR SEGEMENT 3C
All amounts in nominal US Dollars (000s) Date
BALANCE SHEET (Monthly Construction) Totals
CURRENT ASSETS
Cash
Fund Balances
Construction Fund
DSRF Cash Balance
Total
FIXED ASSETS
Opening Balance/Project Book Value
Concession -
Sponsor's subsidy -
Capital Expenditures 532,339
MMRA Expenditures 229,000
Depreciation (761,339)
Net Book value
Future Income Tax Asset
CAPITALISED FINANCE CHARGES
Opening Balance
Capitalized Finance Charges
Depreciation
Net Capitalized Finance Charges
TOTAL ASSETS
LONG TERM LIABILITIES
Oustanding Sr Debt
Outstanding Sr Bond
Outstanding Liquidity Fac
Outstanding Cap Ex Fac
Outstanding TIFIA
Outstanding Mez Fac
Outstanding SHL
Outstanding Regearing Fac
Outstanding Equity Bridge
Total
Defferred Tax Liability
TOTAL LIABILITIES
EQUITY
Beginning Share Capital Balance
Share Capital Added / (Removed)
Ending Share Capital Balance
Cumulative FIRTA Distribution
Retained Earnings
TOTAL EQUITY
TOTAL LIABILITIES AND EQUITY
11/30/2015 12/31/2015 1/31/2016 2/29/2016 3/31/2016 4/30/2016 5/31/2016 6/30/2016 7/31/2016 8/31/2016 9/30/2016
0 0 0 0 0 0 0 0 0 0 0
- - - - - - - - - - -
- - - - - - - - - - -
0 0 0 0 0 0 0 0 0 0 0
24,840 29,197 33,563 37,939 42,323 47,438 52,564 57,700 63,573 69,458 75,355
- - - - - - - - - - -
4,357 4,366 4,376 4,384 5,115 5,126 5,136 5,873 5,885 5,897 5,909
- - - - - - - - - - -
- - - - - - - - - - -
29,197 33,563 37,939 42,323 47,438 52,564 57,700 63,573 69,458 75,355 81,264
- - - - - - - - - - -
5,720 5,898 6,362 6,579 6,789 7,020 7,252 7,499 8,187 8,453 8,728
178 465 217 210 231 232 248 687 266 275 276
- - - - - - - - - - -
5,898 6,362 6,579 6,789 7,020 7,252 7,499 8,187 8,453 8,728 9,004
35,095 39,925 44,518 49,112 54,458 59,815 65,199 71,759 77,910 84,083 90,268
11,295 12,791 14,274 15,758 17,485 19,215 20,954 22,955 24,942 26,936 28,933
- - - - - - - - - - -
- - - - - - - - - - -
- - - - - - - - - - -
11,421 13,115 14,599 16,083 17,809 19,540 21,279 23,644 25,631 27,625 29,622
- - - - - - - - - - -
- - - - - - - - - - -
- - - - - - - - - - -
- - - - - - - - - - -
22,715 25,906 28,873 31,840 35,294 38,755 42,233 46,599 50,573 54,560 58,556
0 0 0 0 - - - - - - -
22,715 25,906 28,873 31,840 35,294 38,755 42,233 46,599 50,573 54,560 58,556
10,774 12,379 14,019 15,645 17,271 19,164 21,061 22,967 25,160 27,338 29,523
1,605 1,640 1,626 1,626 1,893 1,897 1,906 2,193 2,178 2,185 2,190
12,379 14,019 15,645 17,271 19,164 21,061 22,967 25,160 27,338 29,523 31,713
0 0 0 0 0 0 0 0 0 0 0
(0) (0) (0) (0) (0) (0) (0) (0) (0) (0) (0)
12,379 14,019 15,645 17,271 19,164 21,061 22,967 25,160 27,338 29,523 31,713
35,095 39,925 44,518 49,112 54,458 59,815 65,199 71,759 77,910 84,083 90,268
NTE_Segment 3C_Final4.xls - 11/19/2008 Page 15 of 35

NTEMP Base Scope Proposal
SPONSOR SEGEMENT 3C
All amounts in nominal US Dollars (000s) Date
BALANCE SHEET (Monthly Construction) Totals
CURRENT ASSETS
Cash
Fund Balances
Construction Fund
DSRF Cash Balance
Total
FIXED ASSETS
Opening Balance/Project Book Value
Concession -
Sponsor's subsidy -
Capital Expenditures 532,339
MMRA Expenditures 229,000
Depreciation (761,339)
Net Book value
Future Income Tax Asset
CAPITALISED FINANCE CHARGES
Opening Balance
Capitalized Finance Charges
Depreciation
Net Capitalized Finance Charges
TOTAL ASSETS
LONG TERM LIABILITIES
Oustanding Sr Debt
Outstanding Sr Bond
Outstanding Liquidity Fac
Outstanding Cap Ex Fac
Outstanding TIFIA
Outstanding Mez Fac
Outstanding SHL
Outstanding Regearing Fac
Outstanding Equity Bridge
Total
Defferred Tax Liability
TOTAL LIABILITIES
EQUITY
Beginning Share Capital Balance
Share Capital Added / (Removed)
Ending Share Capital Balance
Cumulative FIRTA Distribution
Retained Earnings
TOTAL EQUITY
TOTAL LIABILITIES AND EQUITY
10/31/2016 11/30/2016 12/31/2016 1/31/2017 2/28/2017 3/31/2017 4/30/2017 5/31/2017 6/30/2017 7/31/2017
0 0 0 0 0 0 0 0 0 0
- - - - - - - - - -
- - - - - - - - - -
0 0 0 0 0 0 0 0 0 0
81,264 87,186 93,120 99,175 104,504 109,842 118,001 125,434 135,647 145,881
- - - - - - - - - -
5,922 5,934 6,056 5,328 5,339 8,158 7,434 10,213 10,234 8,863
- - - - - - - - - -
- - - - - - - - - -
87,186 93,120 99,175 104,504 109,842 118,001 125,434 135,647 145,881 154,744
- - - - - - - - - -
9,004 9,299 9,593 10,600 10,924 11,225 11,567 11,910 12,278 13,615
295 295 1,006 324 301 342 344 367 1,337 400
- - - - - - - - - -
9,299 9,593 10,600 10,924 11,225 11,567 11,910 12,278 13,615 14,015
96,485 102,713 109,775 115,428 121,067 129,567 137,345 147,925 159,496 168,759
30,941 32,953 35,035 36,860 38,682 41,427 43,939 47,356 50,806 53,798
- - - - - - - - - -
- - - - - - - - - -
- - - - - - - - - -
31,630 33,642 36,341 38,167 39,988 42,734 45,246 48,663 53,003 55,995
- - - - - - - - - -
- - - - - - - - - -
- - - - - - - - - -
- - - - - - - - - -
62,571 66,595 71,375 75,027 78,670 84,161 89,185 96,019 103,809 109,794
- - - - - - - - - -
62,571 66,595 71,375 75,027 78,670 84,161 89,185 96,019 103,809 109,794
31,713 33,913 36,118 38,400 40,401 42,397 45,407 48,160 51,905 55,686
2,201 2,205 2,282 2,001 1,996 3,009 2,753 3,746 3,781 3,280
33,913 36,118 38,400 40,401 42,397 45,407 48,160 51,905 55,686 58,966
0 0 0 0 0 0 0 0 0 0
(0) (0) 0 0 0 0 0 0 0 0
33,913 36,118 38,400 40,401 42,397 45,407 48,160 51,905 55,686 58,966
96,485 102,713 109,775 115,428 121,067 129,567 137,345 147,925 159,496 168,759
NTE_Segment 3C_Final4.xls - 11/19/2008 Page 16 of 35
NTEMP Base Scope Proposal
SPONSOR SEGEMENT 3C
All amounts in nominal US Dollars (000s) Date
BALANCE SHEET (Monthly Construction) Totals
CURRENT ASSETS
Cash
Fund Balances
Construction Fund
DSRF Cash Balance
Total
FIXED ASSETS
Opening Balance/Project Book Value
Concession -
Sponsor's subsidy -
Capital Expenditures 532,339
MMRA Expenditures 229,000
Depreciation (761,339)
Net Book value
Future Income Tax Asset
CAPITALISED FINANCE CHARGES
Opening Balance
Capitalized Finance Charges
Depreciation
Net Capitalized Finance Charges
TOTAL ASSETS
LONG TERM LIABILITIES
Oustanding Sr Debt
Outstanding Sr Bond
Outstanding Liquidity Fac
Outstanding Cap Ex Fac
Outstanding TIFIA
Outstanding Mez Fac
Outstanding SHL
Outstanding Regearing Fac
Outstanding Equity Bridge
Total
Defferred Tax Liability
TOTAL LIABILITIES
EQUITY
Beginning Share Capital Balance
Share Capital Added / (Removed)
Ending Share Capital Balance
Cumulative FIRTA Distribution
Retained Earnings
TOTAL EQUITY
TOTAL LIABILITIES AND EQUITY
8/31/2017 9/30/2017 10/31/2017 11/30/2017 12/31/2017 1/31/2018 2/28/2018 3/31/2018 4/30/2018 5/31/2018
0 0 0 0 0 0 0 0 0 0
- - - - - - - - - -
- - - - - - - - - -
0 0 0 0 0 0 0 0 0 0
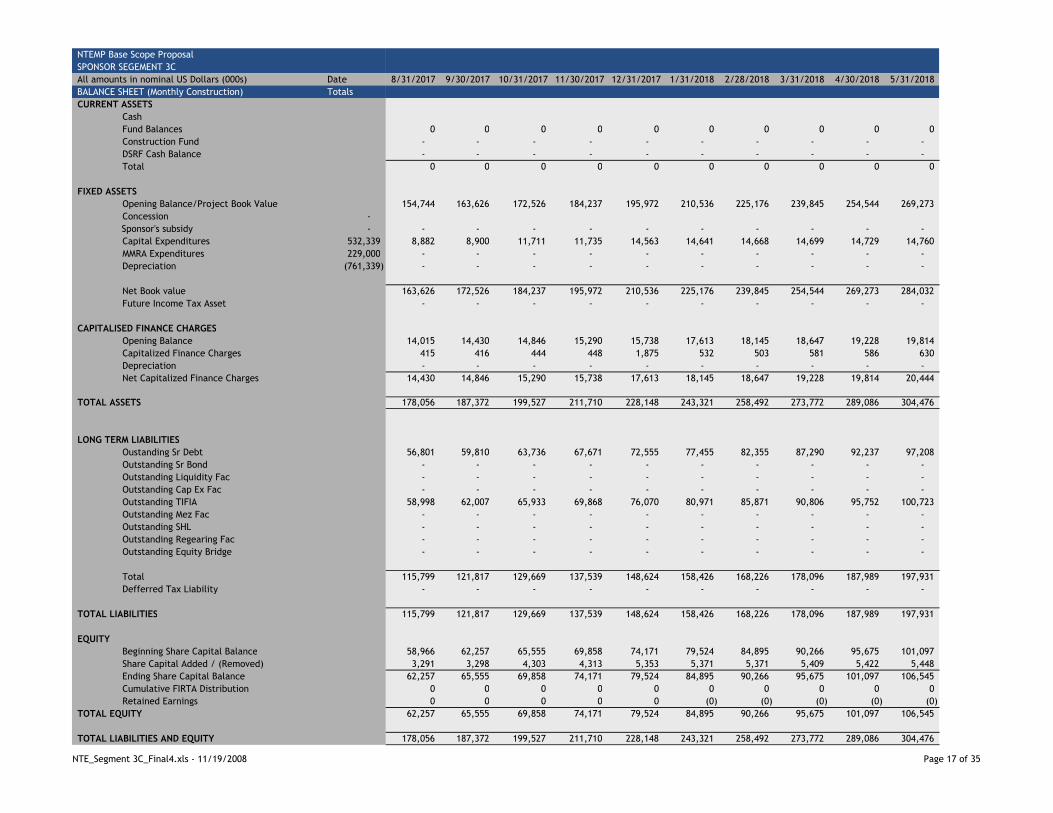
154,744 163,626 172,526 184,237 195,972 210,536 225,176 239,845 254,544 269,273
- - - - - - - - - -
8,882 8,900 11,711 11,735 14,563 14,641 14,668 14,699 14,729 14,760
- - - - - - - - - -
- - - - - - - - - -
163,626 172,526 184,237 195,972 210,536 225,176 239,845 254,544 269,273 284,032
- - - - - - - - - -
14,015 14,430 14,846 15,290 15,738 17,613 18,145 18,647 19,228 19,814
415 416 444 448 1,875 532 503 581 586 630
- - - - - - - - - -
14,430 14,846 15,290 15,738 17,613 18,145 18,647 19,228 19,814 20,444
178,056 187,372 199,527 211,710 228,148 243,321 258,492 273,772 289,086 304,476
56,801 59,810 63,736 67,671 72,555 77,455 82,355 87,290 92,237 97,208
- - - - - - - - - -
- - - - - - - - - -
- - - - - - - - - -
58,998 62,007 65,933 69,868 76,070 80,971 85,871 90,806 95,752 100,723
- - - - - - - - - -
- - - - - - - - - -
- - - - - - - - - -
- - - - - - - - - -
115,799 121,817 129,669 137,539 148,624 158,426 168,226 178,096 187,989 197,931
- - - - - - - - - -
115,799 121,817 129,669 137,539 148,624 158,426 168,226 178,096 187,989 197,931
58,966 62,257 65,555 69,858 74,171 79,524 84,895 90,266 95,675 101,097
3,291 3,298 4,303 4,313 5,353 5,371 5,371 5,409 5,422 5,448
62,257 65,555 69,858 74,171 79,524 84,895 90,266 95,675 101,097 106,545
0 0 0 0 0 0 0 0 0 0
0 0 0 0 0 (0) (0) (0) (0) (0)
62,257 65,555 69,858 74,171 79,524 84,895 90,266 95,675 101,097 106,545
178,056 187,372 199,527 211,710 228,148 243,321 258,492 273,772 289,086 304,476
NTE_Segment 3C_Final4.xls - 11/19/2008 Page 17 of 35
NTEMP Base Scope Proposal
SPONSOR SEGEMENT 3C
All amounts in nominal US Dollars (000s) Date
BALANCE SHEET (Monthly Construction) Totals
CURRENT ASSETS
Cash
Fund Balances
Construction Fund
DSRF Cash Balance
Total
FIXED ASSETS
Opening Balance/Project Book Value
Concession -
Sponsor's subsidy -
Capital Expenditures 532,339
MMRA Expenditures 229,000
Depreciation (761,339)
Net Book value
Future Income Tax Asset
CAPITALISED FINANCE CHARGES
Opening Balance
Capitalized Finance Charges
Depreciation
Net Capitalized Finance Charges
TOTAL ASSETS
LONG TERM LIABILITIES
Oustanding Sr Debt
Outstanding Sr Bond
Outstanding Liquidity Fac
Outstanding Cap Ex Fac
Outstanding TIFIA
Outstanding Mez Fac
Outstanding SHL
Outstanding Regearing Fac
Outstanding Equity Bridge
Total
Defferred Tax Liability
TOTAL LIABILITIES
EQUITY
Beginning Share Capital Balance
Share Capital Added / (Removed)
Ending Share Capital Balance
Cumulative FIRTA Distribution
Retained Earnings
TOTAL EQUITY
TOTAL LIABILITIES AND EQUITY
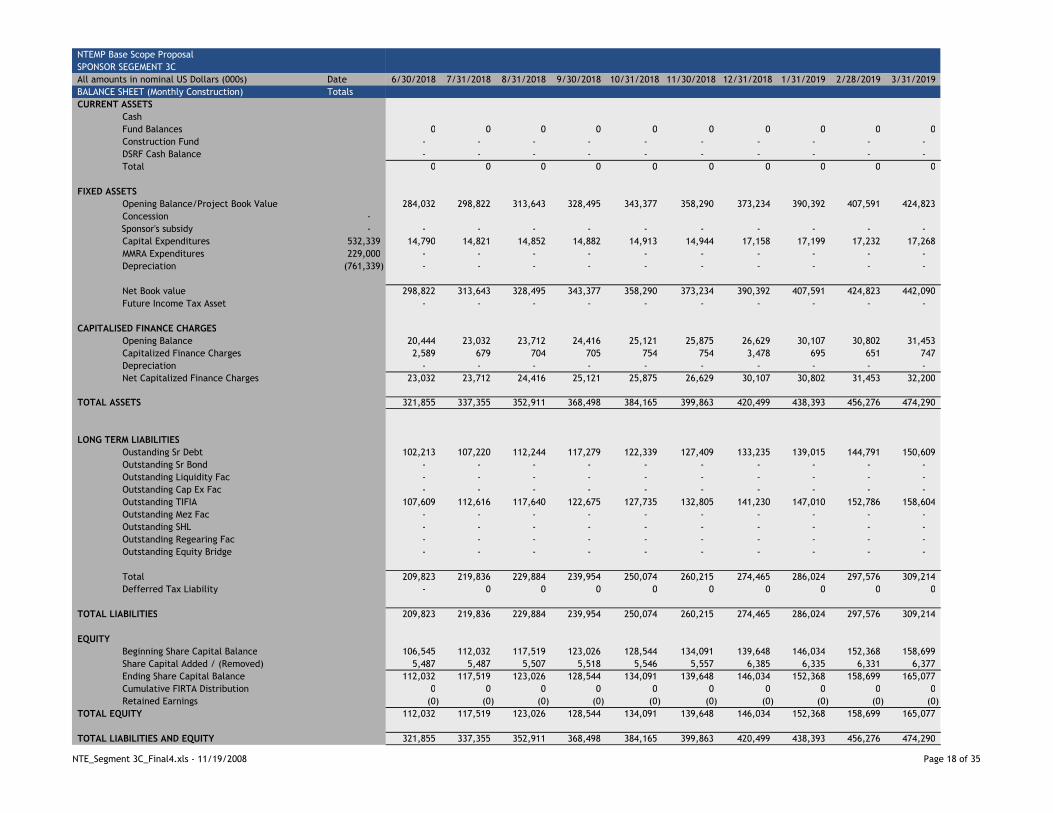
6/30/2018 7/31/2018 8/31/2018 9/30/2018 10/31/2018 11/30/2018 12/31/2018 1/31/2019 2/28/2019 3/31/2019
0 0 0 0 0 0 0 0 0 0
- - - - - - - - - -
- - - - - - - - - -
0 0 0 0 0 0 0 0 0 0
284,032 298,822 313,643 328,495 343,377 358,290 373,234 390,392 407,591 424,823
- - - - - - - - - -
14,790 14,821 14,852 14,882 14,913 14,944 17,158 17,199 17,232 17,268
- - - - - - - - - -
- - - - - - - - - -
298,822 313,643 328,495 343,377 358,290 373,234 390,392 407,591 424,823 442,090
- - - - - - - - - -
20,444 23,032 23,712 24,416 25,121 25,875 26,629 30,107 30,802 31,453
2,589 679 704 705 754 754 3,478 695 651 747
- - - - - - - - - -
23,032 23,712 24,416 25,121 25,875 26,629 30,107 30,802 31,453 32,200
321,855 337,355 352,911 368,498 384,165 399,863 420,499 438,393 456,276 474,290
102,213 107,220 112,244 117,279 122,339 127,409 133,235 139,015 144,791 150,609
- - - - - - - - - -
- - - - - - - - - -
- - - - - - - - - -
107,609 112,616 117,640 122,675 127,735 132,805 141,230 147,010 152,786 158,604
- - - - - - - - - -
- - - - - - - - - -
- - - - - - - - - -
- - - - - - - - - -
209,823 219,836 229,884 239,954 250,074 260,215 274,465 286,024 297,576 309,214
- 0 0 0 0 0 0 0 0 0
209,823 219,836 229,884 239,954 250,074 260,215 274,465 286,024 297,576 309,214
106,545 112,032 117,519 123,026 128,544 134,091 139,648 146,034 152,368 158,699
5,487 5,487 5,507 5,518 5,546 5,557 6,385 6,335 6,331 6,377
112,032 117,519 123,026 128,544 134,091 139,648 146,034 152,368 158,699 165,077
0 0 0 0 0 0 0 0 0 0
(0) (0) (0) (0) (0) (0) (0) (0) (0) (0)
112,032 117,519 123,026 128,544 134,091 139,648 146,034 152,368 158,699 165,077
321,855 337,355 352,911 368,498 384,165 399,863 420,499 438,393 456,276 474,290
NTE_Segment 3C_Final4.xls - 11/19/2008 Page 18 of 35

NTEMP Base Scope Proposal
SPONSOR SEGEMENT 3C
All amounts in nominal US Dollars (000s) Date
BALANCE SHEET (Monthly Construction) Totals
CURRENT ASSETS
Cash
Fund Balances
Construction Fund
DSRF Cash Balance
Total
FIXED ASSETS
Opening Balance/Project Book Value
Concession -
Sponsor's subsidy -
Capital Expenditures 532,339
MMRA Expenditures 229,000
Depreciation (761,339)
Net Book value
Future Income Tax Asset
CAPITALISED FINANCE CHARGES
Opening Balance
Capitalized Finance Charges
Depreciation
Net Capitalized Finance Charges
TOTAL ASSETS
LONG TERM LIABILITIES
Oustanding Sr Debt
Outstanding Sr Bond
Outstanding Liquidity Fac
Outstanding Cap Ex Fac
Outstanding TIFIA
Outstanding Mez Fac
Outstanding SHL
Outstanding Regearing Fac
Outstanding Equity Bridge
Total
Defferred Tax Liability
TOTAL LIABILITIES
EQUITY
Beginning Share Capital Balance
Share Capital Added / (Removed)
Ending Share Capital Balance
Cumulative FIRTA Distribution
Retained Earnings
TOTAL EQUITY
TOTAL LIABILITIES AND EQUITY
4/30/2019 5/31/2019 6/30/2019 7/31/2019 8/31/2019 9/30/2019 10/31/2019 11/30/2019 12/31/2019 12/31/2020
0 0 0 0 0 0 0 0 30,000 30,000
- - - - - - - - - -
- - - - - - - - 25,000 23,677
0 0 0 0 0 0 0 0 55,000 53,677
442,090 456,496 470,931 482,487 494,067 505,671 514,371 523,089 528,886 532,339
- - - - - - - - - -
14,405 14,436 11,556 11,580 11,604 8,700 8,718 5,796 3,453 -
- - - - - - - - - -
- - - - - - - - - (16,791)
456,496 470,931 482,487 494,067 505,671 514,371 523,089 528,886 532,339 515,548
- - - - - - - - - 9,959
32,200 32,948 33,742 37,911 38,744 39,596 40,438 41,321 42,189 47,165
748 794 4,169 834 852 842 883 868 4,975 -
- - - - - - - - - (1,004)
32,948 33,742 37,911 38,744 39,596 40,438 41,321 42,189 47,165 46,161
489,443 504,673 520,398 532,811 545,267 554,809 564,411 571,075 634,504 625,344
155,504 160,423 164,435 168,444 172,467 175,549 178,650 180,803 200,000 200,000
- - - - - - - - - -
- - - - - - - - - -
- - - - - - - - - -
163,498 168,418 175,733 179,743 183,766 186,848 189,949 192,102 215,292 224,627
- - - - - - - - - -
- - - - - - - - - -
- - - - - - - - - -
- - - - - - - - - -
319,002 328,840 340,168 348,187 356,233 362,397 368,599 372,905 415,292 424,627
0 0 0 - - - - 0 - -
319,002 328,840 340,168 348,187 356,233 362,397 368,599 372,905 415,292 424,627
165,077 170,441 175,833 180,230 184,625 189,034 192,412 195,811 198,171 219,212
5,364 5,392 4,397 4,395 4,410 3,378 3,399 2,359 21,041 -
170,441 175,833 180,230 184,625 189,034 192,412 195,811 198,171 219,212 219,212
0 0 0 0 0 0 0 0 0 0
(0) (0) (0) (0) (0) (0) (0) (0) 0 (18,495)
170,441 175,833 180,230 184,625 189,034 192,412 195,811 198,171 219,212 200,717
489,443 504,673 520,398 532,811 545,267 554,809 564,411 571,075 634,504 625,344
NTE_Segment 3C_Final4.xls - 11/19/2008 Page 19 of 35

NTEMP Base Scope Proposal
SPONSOR SEGEMENT 3C
All amounts in nominal US Dollars (000s) Date
BALANCE SHEET (Monthly Construction) Totals
CURRENT ASSETS
Cash
Fund Balances
Construction Fund
DSRF Cash Balance
Total
FIXED ASSETS
Opening Balance/Project Book Value
Concession -
Sponsor's subsidy -
Capital Expenditures 532,339
MMRA Expenditures 229,000
Depreciation (761,339)
Net Book value
Future Income Tax Asset
CAPITALISED FINANCE CHARGES
Opening Balance
Capitalized Finance Charges
Depreciation
Net Capitalized Finance Charges
TOTAL ASSETS
LONG TERM LIABILITIES
Oustanding Sr Debt
Outstanding Sr Bond
Outstanding Liquidity Fac
Outstanding Cap Ex Fac
Outstanding TIFIA
Outstanding Mez Fac
Outstanding SHL
Outstanding Regearing Fac
Outstanding Equity Bridge
Total
Defferred Tax Liability
TOTAL LIABILITIES
EQUITY
Beginning Share Capital Balance
Share Capital Added / (Removed)
Ending Share Capital Balance
Cumulative FIRTA Distribution
Retained Earnings
TOTAL EQUITY
TOTAL LIABILITIES AND EQUITY
12/31/2021 12/31/2022 12/31/2023 12/31/2024 12/31/2025 12/31/2026 12/31/2027 12/31/2028 12/31/2029 12/31/2030
33,958 46,018 63,056 106,944 - - - - - -
- - - - - - - - - -
25,000 25,000 25,000 - - - - - - -
58,958 71,018 88,056 106,944 - - - - - -
515,548 498,756 481,965 465,174 448,382 439,581 428,858 418,135 407,414 396,693
- - - - - - - - - -
- - - - - - - - - -
- - - - 1,886 - - - - 27,925
(16,791) (16,791) (16,791) (16,791) (10,688) (10,723) (10,722) (10,721) (10,721) (11,592)
498,756 481,965 465,174 448,382 439,581 428,858 418,135 407,414 396,693 413,025
17,747 23,311 27,287 30,776 31,295 30,574 28,132 23,899 17,808 10,198
46,161 45,158 44,154 43,151 42,147 41,144 40,140 39,137 38,133 37,130
- - - - - - - - - -
(1,004) (1,004) (1,004) (1,004) (1,004) (1,004) (1,004) (1,004) (1,004) (1,004)
45,158 44,154 43,151 42,147 41,144 40,140 39,137 38,133 37,130 36,126
620,619 620,449 623,668 628,250 512,019 499,572 485,404 469,446 451,631 459,350
200,000 200,000 200,000 - - - - - - -
- - - - - - - - - -
- - - - - - - - - -
- - - - 1,886 1,886 1,886 1,886 1,886 29,811
234,367 244,529 255,132 266,195 266,195 266,195 266,195 266,195 266,195 266,195
- - - - - - - - - -
- - - - - - - - - -
- - - 200,000 200,000 200,000 200,000 200,000 200,000 200,000
- - - - - - - - - -
434,367 444,529 455,132 466,195 468,080 468,080 468,080 468,080 468,080 496,005
- - - - - - - - - -
434,367 444,529 455,132 466,195 468,080 468,080 468,080 468,080 468,080 496,005
219,212 219,212 219,212 219,212 219,212 102,058 88,278 69,632 45,921 16,847
- - - - (117,153) (13,780) (18,646) (23,711) (29,074) (16,846)
219,212 219,212 219,212 219,212 102,058 88,278 69,632 45,921 16,847 1
0 0 0 0 0 0 0 0 0 (6,614)
(32,959) (43,292) (50,676) (57,156) (58,119) (56,787) (52,309) (44,555) (33,297) (30,043)
186,252 175,919 168,536 162,056 43,939 31,491 17,324 1,366 (16,450) (36,656)
620,619 620,449 623,668 628,250 512,019 499,572 485,404 469,446 451,631 459,350
NTE_Segment 3C_Final4.xls - 11/19/2008 Page 20 of 35

NTEMP Base Scope Proposal
SPONSOR SEGEMENT 3C
All amounts in nominal US Dollars (000s) Date
BALANCE SHEET (Monthly Construction) Totals
CURRENT ASSETS
Cash
Fund Balances
Construction Fund
DSRF Cash Balance
Total
FIXED ASSETS
Opening Balance/Project Book Value
Concession -
Sponsor's subsidy -
Capital Expenditures 532,339
MMRA Expenditures 229,000
Depreciation (761,339)
Net Book value
Future Income Tax Asset
CAPITALISED FINANCE CHARGES
Opening Balance
Capitalized Finance Charges
Depreciation
Net Capitalized Finance Charges
TOTAL ASSETS
LONG TERM LIABILITIES
Oustanding Sr Debt
Outstanding Sr Bond
Outstanding Liquidity Fac
Outstanding Cap Ex Fac
Outstanding TIFIA
Outstanding Mez Fac
Outstanding SHL
Outstanding Regearing Fac
Outstanding Equity Bridge
Total
Defferred Tax Liability
TOTAL LIABILITIES
EQUITY
Beginning Share Capital Balance
Share Capital Added / (Removed)
Ending Share Capital Balance
Cumulative FIRTA Distribution
Retained Earnings
TOTAL EQUITY
TOTAL LIABILITIES AND EQUITY
12/31/2031 12/31/2032 12/31/2033 12/31/2034 12/31/2035 12/31/2036 12/31/2037 12/31/2038 12/31/2039 12/31/2040
- - - - - - - - - -
- - - - - - - - - -
- - - - - - - - - -
- - - - - - - - - -
413,025 399,781 386,538 373,294 360,051 349,674 338,394 327,115 315,835 304,555
- - - - - - - - - -
- - - - - - - - - -
- - - - 2,414 - - - - 52,644
(13,244) (13,244) (13,244) (13,244) (12,791) (11,280) (11,280) (11,280) (11,280) (13,039)
399,781 386,538 373,294 360,051 349,674 338,394 327,115 315,835 304,555 344,160
1,477 - - - - - - - - -
36,126 35,123 34,119 33,116 32,112 31,109 30,105 29,102 28,098 27,095
- - - - - - - - - -
(1,004) (1,004) (1,004) (1,004) (1,004) (1,004) (1,004) (1,004) (1,004) (1,004)
35,123 34,119 33,116 32,112 31,109 30,105 29,102 28,098 27,095 26,091
436,381 420,657 406,410 392,163 380,783 368,500 356,216 343,933 331,650 370,251
- - - - - - - - - -
- - - - - - - - - -
- - - - - - - - - -
29,811 29,811 29,811 - 2,414 2,414 2,414 2,414 2,414 55,058
266,195 266,195 266,195 266,195 266,195 266,195 266,195 266,195 266,195 264,195
- - - - - - - - - -
- - - - - - - - - -
200,000 200,000 200,000 229,811 229,811 229,811 229,811 229,811 229,811 231,811
- - - - - - - - - -
496,005 496,005 496,005 496,005 498,419 498,419 498,419 498,419 498,419 551,063
- 9,344 22,375 37,600 55,039 75,781 99,136 99,487 96,361 93,803
496,005 505,350 518,380 533,605 553,458 574,200 597,555 597,906 594,780 644,867
1 1 1 1 1 1 1 1 1 1
- - - - - - - - - -
1 1 1 1 1 1 1 1 1 1
(20,861) (35,108) (49,355) (63,602) (77,396) (89,679) (101,963) (114,246) (126,529) (140,572)
(38,765) (49,586) (62,616) (77,841) (95,280) (116,022) (139,377) (139,728) (136,602) (134,045)
(59,624) (84,692) (111,970) (141,442) (172,675) (205,701) (241,339) (253,973) (263,131) (274,616)
436,381 420,657 406,410 392,163 380,783 368,500 356,216 343,933 331,650 370,251
NTE_Segment 3C_Final4.xls - 11/19/2008 Page 21 of 35
NTEMP Base Scope Proposal
SPONSOR SEGEMENT 3C
All amounts in nominal US Dollars (000s) Date
BALANCE SHEET (Monthly Construction) Totals
CURRENT ASSETS
Cash
Fund Balances
Construction Fund
DSRF Cash Balance
Total
FIXED ASSETS
Opening Balance/Project Book Value
Concession -
Sponsor's subsidy -
Capital Expenditures 532,339
MMRA Expenditures 229,000
Depreciation (761,339)
Net Book value
Future Income Tax Asset
CAPITALISED FINANCE CHARGES
Opening Balance
Capitalized Finance Charges
Depreciation
Net Capitalized Finance Charges
TOTAL ASSETS
LONG TERM LIABILITIES
Oustanding Sr Debt
Outstanding Sr Bond
Outstanding Liquidity Fac
Outstanding Cap Ex Fac
Outstanding TIFIA
Outstanding Mez Fac
Outstanding SHL
Outstanding Regearing Fac
Outstanding Equity Bridge
Total
Defferred Tax Liability
TOTAL LIABILITIES
EQUITY
Beginning Share Capital Balance
Share Capital Added / (Removed)
Ending Share Capital Balance
Cumulative FIRTA Distribution
Retained Earnings
TOTAL EQUITY
TOTAL LIABILITIES AND EQUITY
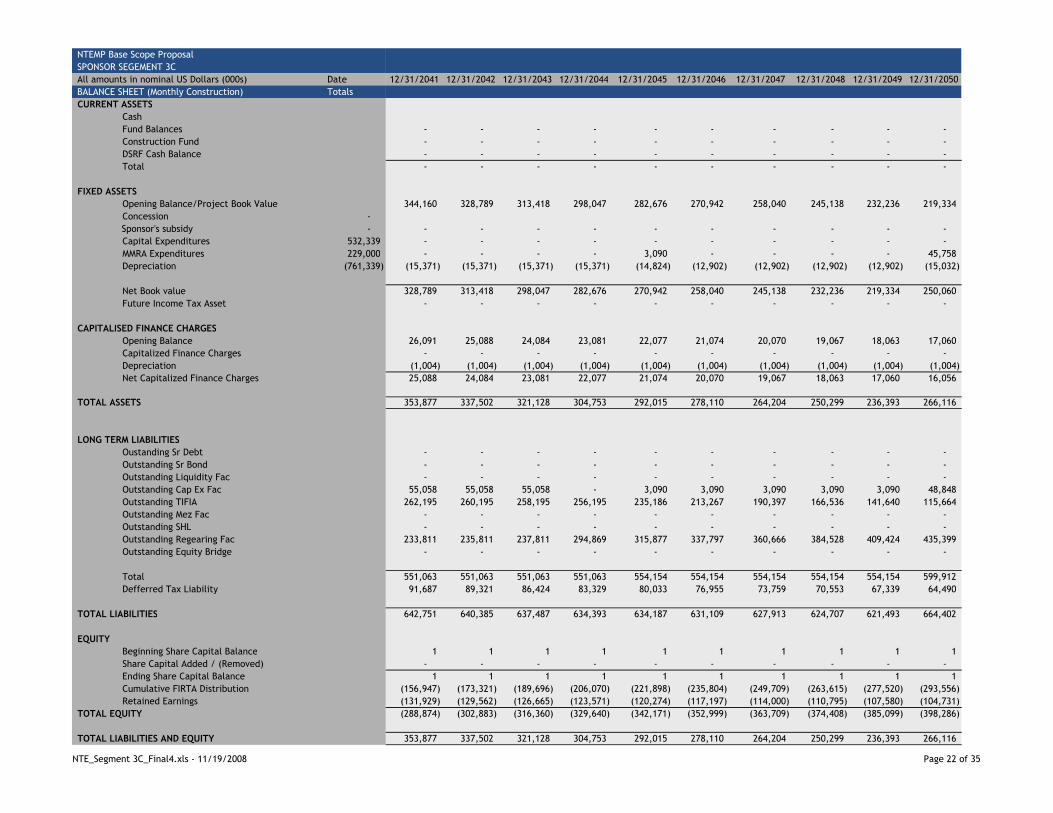
12/31/2041 12/31/2042 12/31/2043 12/31/2044 12/31/2045 12/31/2046 12/31/2047 12/31/2048 12/31/2049 12/31/2050
- - - - - - - - - -
- - - - - - - - - -
- - - - - - - - - -
- - - - - - - - - -
344,160 328,789 313,418 298,047 282,676 270,942 258,040 245,138 232,236 219,334
- - - - - - - - - -
- - - - - - - - - -
- - - - 3,090 - - - - 45,758
(15,371) (15,371) (15,371) (15,371) (14,824) (12,902) (12,902) (12,902) (12,902) (15,032)
328,789 313,418 298,047 282,676 270,942 258,040 245,138 232,236 219,334 250,060
- - - - - - - - - -
26,091 25,088 24,084 23,081 22,077 21,074 20,070 19,067 18,063 17,060
- - - - - - - - - -
(1,004) (1,004) (1,004) (1,004) (1,004) (1,004) (1,004) (1,004) (1,004) (1,004)
25,088 24,084 23,081 22,077 21,074 20,070 19,067 18,063 17,060 16,056
353,877 337,502 321,128 304,753 292,015 278,110 264,204 250,299 236,393 266,116
- - - - - - - - - -
- - - - - - - - - -
- - - - - - - - - -
55,058 55,058 55,058 - 3,090 3,090 3,090 3,090 3,090 48,848
262,195 260,195 258,195 256,195 235,186 213,267 190,397 166,536 141,640 115,664
- - - - - - - - - -
- - - - - - - - - -
233,811 235,811 237,811 294,869 315,877 337,797 360,666 384,528 409,424 435,399
- - - - - - - - - -
551,063 551,063 551,063 551,063 554,154 554,154 554,154 554,154 554,154 599,912
91,687 89,321 86,424 83,329 80,033 76,955 73,759 70,553 67,339 64,490
642,751 640,385 637,487 634,393 634,187 631,109 627,913 624,707 621,493 664,402
1 1 1 1 1 1 1 1 1 1
- - - - - - - - - -
1 1 1 1 1 1 1 1 1 1
(156,947) (173,321) (189,696) (206,070) (221,898) (235,804) (249,709) (263,615) (277,520) (293,556)
(131,929) (129,562) (126,665) (123,571) (120,274) (117,197) (114,000) (110,795) (107,580) (104,731)
(288,874) (302,883) (316,360) (329,640) (342,171) (352,999) (363,709) (374,408) (385,099) (398,286)
353,877 337,502 321,128 304,753 292,015 278,110 264,204 250,299 236,393 266,116
NTE_Segment 3C_Final4.xls - 11/19/2008 Page 22 of 35
NTEMP Base Scope Proposal
SPONSOR SEGEMENT 3C
All amounts in nominal US Dollars (000s) Date
BALANCE SHEET (Monthly Construction) Totals
CURRENT ASSETS
Cash
Fund Balances
Construction Fund
DSRF Cash Balance
Total
FIXED ASSETS
Opening Balance/Project Book Value
Concession -
Sponsor's subsidy -
Capital Expenditures 532,339
MMRA Expenditures 229,000
Depreciation (761,339)
Net Book value
Future Income Tax Asset
CAPITALISED FINANCE CHARGES
Opening Balance
Capitalized Finance Charges
Depreciation
Net Capitalized Finance Charges
TOTAL ASSETS
LONG TERM LIABILITIES
Oustanding Sr Debt
Outstanding Sr Bond
Outstanding Liquidity Fac
Outstanding Cap Ex Fac
Outstanding TIFIA
Outstanding Mez Fac
Outstanding SHL
Outstanding Regearing Fac
Outstanding Equity Bridge
Total
Defferred Tax Liability
TOTAL LIABILITIES
EQUITY
Beginning Share Capital Balance
Share Capital Added / (Removed)
Ending Share Capital Balance
Cumulative FIRTA Distribution
Retained Earnings
TOTAL EQUITY
TOTAL LIABILITIES AND EQUITY
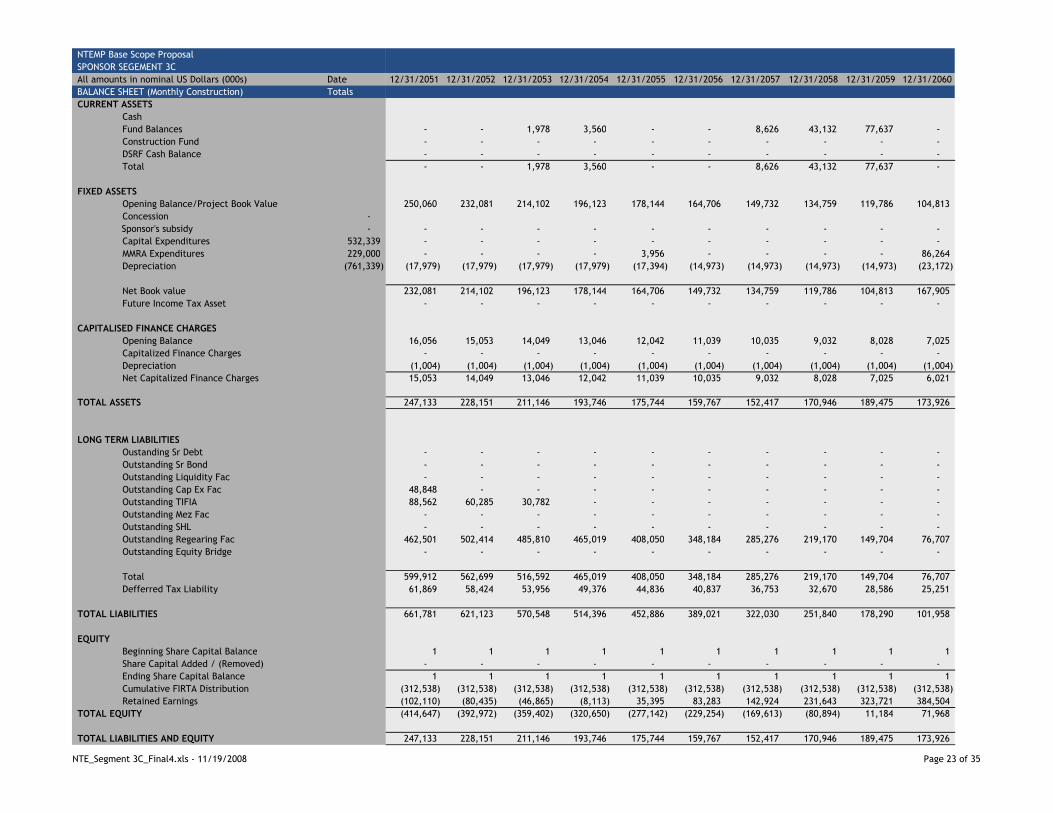
12/31/2051 12/31/2052 12/31/2053 12/31/2054 12/31/2055 12/31/2056 12/31/2057 12/31/2058 12/31/2059 12/31/2060
- - 1,978 3,560 - - 8,626 43,132 77,637 -
- - - - - - - - - -
- - - - - - - - - -
- - 1,978 3,560 - - 8,626 43,132 77,637 -
250,060 232,081 214,102 196,123 178,144 164,706 149,732 134,759 119,786 104,813
- - - - - - - - - -
- - - - - - - - - -
- - - - 3,956 - - - - 86,264
(17,979) (17,979) (17,979) (17,979) (17,394) (14,973) (14,973) (14,973) (14,973) (23,172)
232,081 214,102 196,123 178,144 164,706 149,732 134,759 119,786 104,813 167,905
- - - - - - - - - -
16,056 15,053 14,049 13,046 12,042 11,039 10,035 9,032 8,028 7,025
- - - - - - - - - -
(1,004) (1,004) (1,004) (1,004) (1,004) (1,004) (1,004) (1,004) (1,004) (1,004)
15,053 14,049 13,046 12,042 11,039 10,035 9,032 8,028 7,025 6,021
247,133 228,151 211,146 193,746 175,744 159,767 152,417 170,946 189,475 173,926
- - - - - - - - - -
- - - - - - - - - -
- - - - - - - - - -
48,848 - - - - - - - - -
88,562 60,285 30,782 - - - - - - -
- - - - - - - - - -
- - - - - - - - - -
462,501 502,414 485,810 465,019 408,050 348,184 285,276 219,170 149,704 76,707
- - - - - - - - - -
599,912 562,699 516,592 465,019 408,050 348,184 285,276 219,170 149,704 76,707
61,869 58,424 53,956 49,376 44,836 40,837 36,753 32,670 28,586 25,251
661,781 621,123 570,548 514,396 452,886 389,021 322,030 251,840 178,290 101,958
1 1 1 1 1 1 1 1 1 1
- - - - - - - - - -
1 1 1 1 1 1 1 1 1 1
(312,538) (312,538) (312,538) (312,538) (312,538) (312,538) (312,538) (312,538) (312,538) (312,538)
(102,110) (80,435) (46,865) (8,113) 35,395 83,283 142,924 231,643 323,721 384,504
(414,647) (392,972) (359,402) (320,650) (277,142) (229,254) (169,613) (80,894) 11,184 71,968
247,133 228,151 211,146 193,746 175,744 159,767 152,417 170,946 189,475 173,926
NTE_Segment 3C_Final4.xls - 11/19/2008 Page 23 of 35
NTEMP Base Scope Proposal
SPONSOR SEGEMENT 3C
All amounts in nominal US Dollars (000s) Date
BALANCE SHEET (Monthly Construction) Totals
CURRENT ASSETS
Cash
Fund Balances
Construction Fund
DSRF Cash Balance
Total
FIXED ASSETS
Opening Balance/Project Book Value
Concession -
Sponsor's subsidy -
Capital Expenditures 532,339
MMRA Expenditures 229,000
Depreciation (761,339)
Net Book value
Future Income Tax Asset
CAPITALISED FINANCE CHARGES
Opening Balance
Capitalized Finance Charges
Depreciation
Net Capitalized Finance Charges
TOTAL ASSETS
LONG TERM LIABILITIES
Oustanding Sr Debt
Outstanding Sr Bond
Outstanding Liquidity Fac
Outstanding Cap Ex Fac
Outstanding TIFIA
Outstanding Mez Fac
Outstanding SHL
Outstanding Regearing Fac
Outstanding Equity Bridge
Total
Defferred Tax Liability
TOTAL LIABILITIES
EQUITY
Beginning Share Capital Balance
Share Capital Added / (Removed)
Ending Share Capital Balance
Cumulative FIRTA Distribution
Retained Earnings
TOTAL EQUITY
TOTAL LIABILITIES AND EQUITY
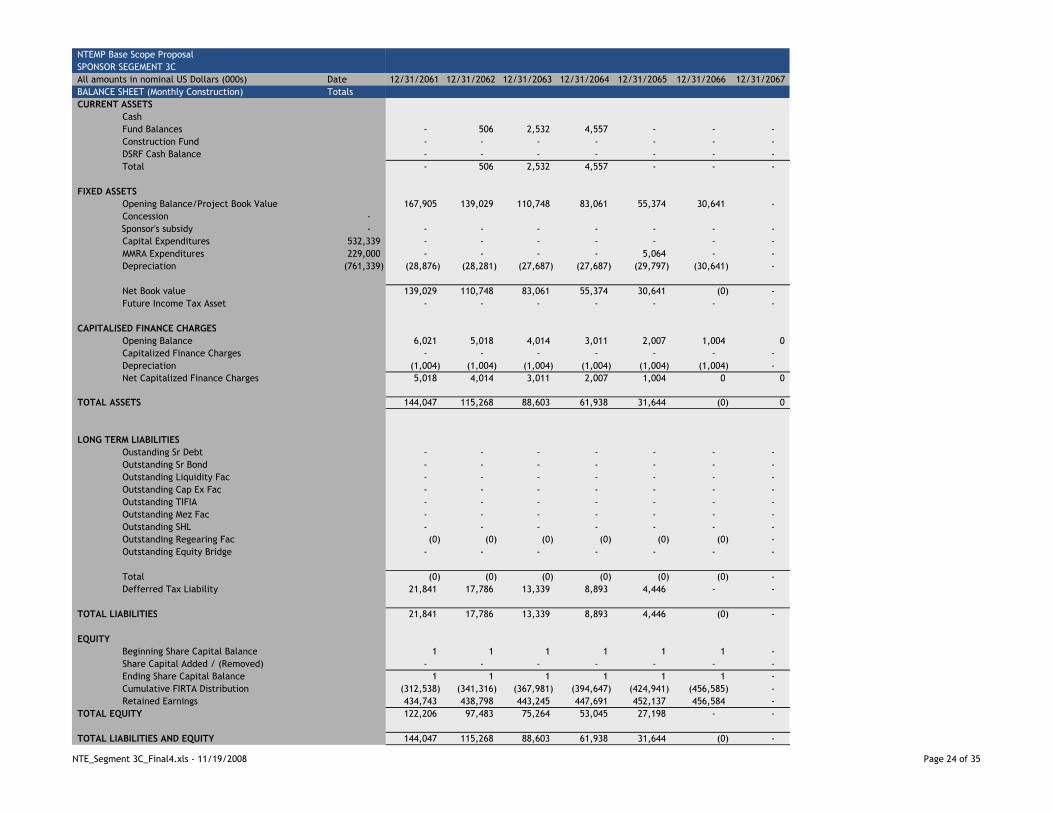
12/31/2061 12/31/2062 12/31/2063 12/31/2064 12/31/2065 12/31/2066 12/31/2067
- 506 2,532 4,557 - - -
- - - - - - -
- - - - - - -
- 506 2,532 4,557 - - -
167,905 139,029 110,748 83,061 55,374 30,641 -
- - - - - - -
- - - - - - -
- - - - 5,064 - -
(28,876) (28,281) (27,687) (27,687) (29,797) (30,641) -
139,029 110,748 83,061 55,374 30,641 (0) -
- - - - - - -
6,021 5,018 4,014 3,011 2,007 1,004 0
- - - - - - -
(1,004) (1,004) (1,004) (1,004) (1,004) (1,004) -
5,018 4,014 3,011 2,007 1,004 0 0
144,047 115,268 88,603 61,938 31,644 (0) 0
- - - - - - -
- - - - - - -
- - - - - - -
- - - - - - -
- - - - - - -
- - - - - - -
- - - - - - -
(0) (0) (0) (0) (0) (0) -
- - - - - - -
(0) (0) (0) (0) (0) (0) -
21,841 17,786 13,339 8,893 4,446 - -
21,841 17,786 13,339 8,893 4,446 (0) -
1 1 1 1 1 1 -
- - - - - - -
1 1 1 1 1 1 -
(312,538) (341,316) (367,981) (394,647) (424,941) (456,585) -
434,743 438,798 443,245 447,691 452,137 456,584 -
122,206 97,483 75,264 53,045 27,198 - -
144,047 115,268 88,603 61,938 31,644 (0) -
NTE_Segment 3C_Final4.xls - 11/19/2008 Page 24 of 35
NTEMP Base Scope Proposal
SPONSOR SEGEMENT 3C
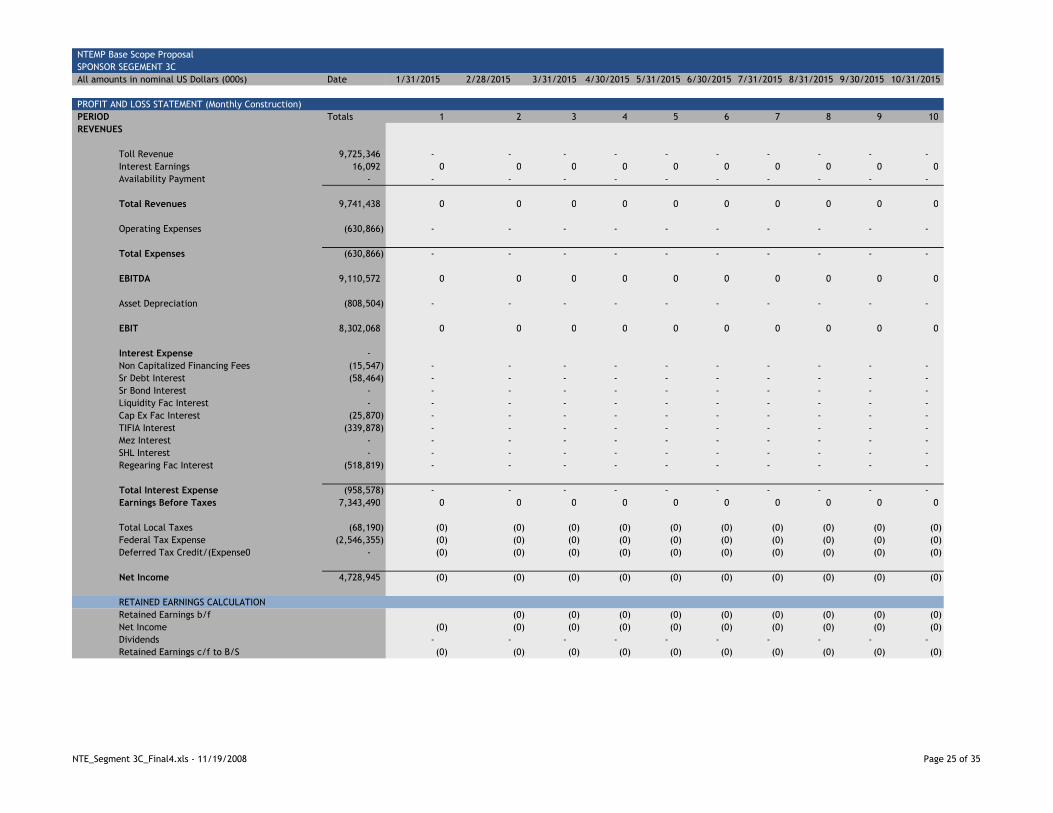
All amounts in nominal US Dollars (000s) Date 1/31/2015 2/28/2015 3/31/2015 4/30/2015 5/31/2015 6/30/2015 7/31/2015 8/31/2015 9/30/2015 10/31/2015
- - - - - - - - - 0.00
PROFIT AND LOSS STATEMENT (Monthly Construction)
PERIOD Totals 1 2 3 4 5 6 7 8 9 10
REVENUES
Toll Revenue 9,725,346 - - - - - - - - - -
Interest Earnings 16,092 0 0 0 0 0 0 0 0 0 0
Availability Payment - - - - - - - - - - -
Total Revenues 9,741,438 0 0 0 0 0 0 0 0 0 0
Operating Expenses (630,866) - - - - - - - - - -
Total Expenses (630,866) - - - - - - - - - -
EBITDA 9,110,572 0 0 0 0 0 0 0 0 0 0
Asset Depreciation (808,504) - - - - - - - - - -
EBIT 8,302,068 0 0 0 0 0 0 0 0 0 0
Interest Expense -
Non Capitalized Financing Fees (15,547) - - - - - - - - - -
Sr Debt Interest (58,464) - - - - - - - - - -
Sr Bond Interest - - - - - - - - - - -
Liquidity Fac Interest - - - - - - - - - - -
Cap Ex Fac Interest (25,870) - - - - - - - - - -
TIFIA Interest (339,878) - - - - - - - - - -
Mez Interest - - - - - - - - - - -
SHL Interest - - - - - - - - - - -
Regearing Fac Interest (518,819) - - - - - - - - - -
Total Interest Expense (958,578) - - - - - - - - - -
Earnings Before Taxes 7,343,490 0 0 0 0 0 0 0 0 0 0
Total Local Taxes (68,190) (0) (0) (0) (0) (0) (0) (0) (0) (0) (0)
Federal Tax Expense (2,546,355) (0) (0) (0) (0) (0) (0) (0) (0) (0) (0)
Deferred Tax Credit/(Expense0 - (0) (0) (0) (0) (0) (0) (0) (0) (0) (0)
Net Income 4,728,945 (0) (0) (0) (0) (0) (0) (0) (0) (0) (0)
RETAINED EARNINGS CALCULATION
Retained Earnings b/f (0) (0) (0) (0) (0) (0) (0) (0) (0)
Net Income (0) (0) (0) (0) (0) (0) (0) (0) (0) (0)
Dividends - - - - - - - - - -
Retained Earnings c/f to B/S (0) (0) (0) (0) (0) (0) (0) (0) (0) (0)
NTE_Segment 3C_Final4.xls - 11/19/2008 Page 25 of 35
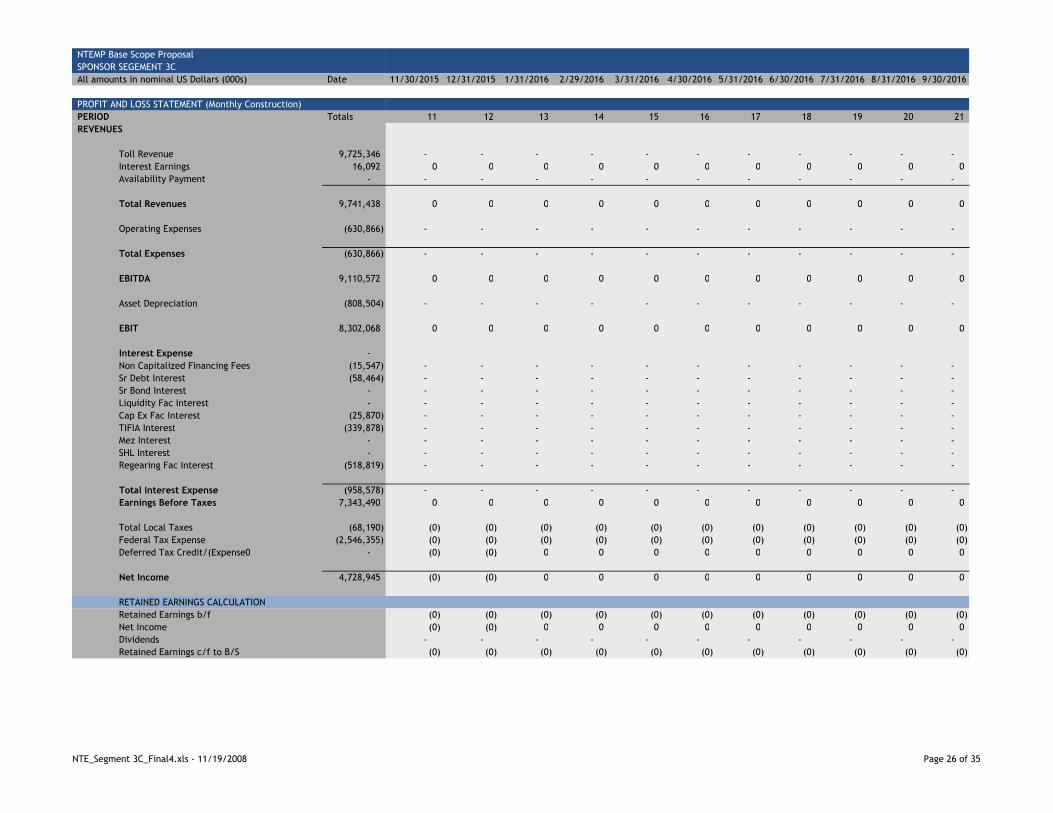
NTEMP Base Scope Proposal
SPONSOR SEGEMENT 3C
All amounts in nominal US Dollars (000s) Date
PROFIT AND LOSS STATEMENT (Monthly Construction)
PERIOD Totals
REVENUES
Toll Revenue 9,725,346
Interest Earnings 16,092
Availability Payment -
Total Revenues 9,741,438
Operating Expenses (630,866)
Total Expenses (630,866)
EBITDA 9,110,572
Asset Depreciation (808,504)
EBIT 8,302,068
Interest Expense -
Non Capitalized Financing Fees (15,547)
Sr Debt Interest (58,464)
Sr Bond Interest -
Liquidity Fac Interest -
Cap Ex Fac Interest (25,870)
TIFIA Interest (339,878)
Mez Interest -
SHL Interest -
Regearing Fac Interest (518,819)
Total Interest Expense (958,578)
Earnings Before Taxes 7,343,490
Total Local Taxes (68,190)
Federal Tax Expense (2,546,355)
Deferred Tax Credit/(Expense0 -
Net Income 4,728,945
RETAINED EARNINGS CALCULATION
Retained Earnings b/f
Net Income
Dividends
Retained Earnings c/f to B/S
11/30/2015 12/31/2015 1/31/2016 2/29/2016 3/31/2016 4/30/2016 5/31/2016 6/30/2016 7/31/2016 8/31/2016 9/30/2016
- - - - - - - - - - -
11 12 13 14 15 16 17 18 19 20 21
- - - - - - - - - - -
0 0 0 0 0 0 0 0 0 0 0
- - - - - - - - - - -
0 0 0 0 0 0 0 0 0 0 0
- - - - - - - - - - -
- - - - - - - - - - -
0 0 0 0 0 0 0 0 0 0 0
- - - - - - - - - - -
0 0 0 0 0 0 0 0 0 0 0
- - - - - - - - - - -
- - - - - - - - - - -
- - - - - - - - - - -
- - - - - - - - - - -
- - - - - - - - - - -
- - - - - - - - - - -
- - - - - - - - - - -
- - - - - - - - - - -
- - - - - - - - - - -
- - - - - - - - - - -
0 0 0 0 0 0 0 0 0 0 0
(0) (0) (0) (0) (0) (0) (0) (0) (0) (0) (0)
(0) (0) (0) (0) (0) (0) (0) (0) (0) (0) (0)
(0) (0) 0 0 0 0 0 0 0 0 0
(0) (0) 0 0 0 0 0 0 0 0 0
(0) (0) (0) (0) (0) (0) (0) (0) (0) (0) (0)
(0) (0) 0 0 0 0 0 0 0 0 0
- - - - - - - - - - -
(0) (0) (0) (0) (0) (0) (0) (0) (0) (0) (0)
NTE_Segment 3C_Final4.xls - 11/19/2008 Page 26 of 35

NTEMP Base Scope Proposal
SPONSOR SEGEMENT 3C
All amounts in nominal US Dollars (000s) Date
PROFIT AND LOSS STATEMENT (Monthly Construction)
PERIOD Totals
REVENUES
Toll Revenue 9,725,346
Interest Earnings 16,092
Availability Payment -
Total Revenues 9,741,438
Operating Expenses (630,866)
Total Expenses (630,866)
EBITDA 9,110,572
Asset Depreciation (808,504)
EBIT 8,302,068
Interest Expense -
Non Capitalized Financing Fees (15,547)
Sr Debt Interest (58,464)
Sr Bond Interest -
Liquidity Fac Interest -
Cap Ex Fac Interest (25,870)
TIFIA Interest (339,878)
Mez Interest -
SHL Interest -
Regearing Fac Interest (518,819)
Total Interest Expense (958,578)
Earnings Before Taxes 7,343,490
Total Local Taxes (68,190)
Federal Tax Expense (2,546,355)
Deferred Tax Credit/(Expense0 -
Net Income 4,728,945
RETAINED EARNINGS CALCULATION
Retained Earnings b/f
Net Income
Dividends
Retained Earnings c/f to B/S
10/31/2016 11/30/2016 12/31/2016 1/31/2017 2/28/2017 3/31/2017 4/30/2017 5/31/2017 6/30/2017 7/31/2017
- - - - - - - - - -
22 23 24 25 26 27 28 29 30 31
- - - - - - - - - -
0 0 0 0 0 0 0 0 0 0
- - - - - - - - - -
0 0 0 0 0 0 0 0 0 0
- - - - - - - - - -
- - - - - - - - - -
0 0 0 0 0 0 0 0 0 0
- - - - - - - - - -
0 0 0 0 0 0 0 0 0 0
- - - - - - - - - -
- - - - - - - - - -
- - - - - - - - - -
- - - - - - - - - -
- - - - - - - - - -
- - - - - - - - - -
- - - - - - - - - -
- - - - - - - - - -
- - - - - - - - - -
- - - - - - - - - -
0 0 0 0 0 0 0 0 0 0
(0) (0) (0) (0) (0) (0) (0) (0) (0) (0)
(0) (0) (0) (0) (0) (0) (0) (0) (0) (0)
0 0 0 - - - - - - -
0 0 0 0 0 0 0 0 0 0
(0) (0) (0) 0 0 0 0 0 0 0
0 0 0 0 0 0 0 0 0 0
- - - - - - - - - -
(0) (0) 0 0 0 0 0 0 0 0
NTE_Segment 3C_Final4.xls - 11/19/2008 Page 27 of 35

NTEMP Base Scope Proposal
SPONSOR SEGEMENT 3C
All amounts in nominal US Dollars (000s) Date
PROFIT AND LOSS STATEMENT (Monthly Construction)
PERIOD Totals
REVENUES
Toll Revenue 9,725,346
Interest Earnings 16,092
Availability Payment -
Total Revenues 9,741,438
Operating Expenses (630,866)
Total Expenses (630,866)
EBITDA 9,110,572
Asset Depreciation (808,504)
EBIT 8,302,068
Interest Expense -
Non Capitalized Financing Fees (15,547)
Sr Debt Interest (58,464)
Sr Bond Interest -
Liquidity Fac Interest -
Cap Ex Fac Interest (25,870)
TIFIA Interest (339,878)
Mez Interest -
SHL Interest -
Regearing Fac Interest (518,819)
Total Interest Expense (958,578)
Earnings Before Taxes 7,343,490
Total Local Taxes (68,190)
Federal Tax Expense (2,546,355)
Deferred Tax Credit/(Expense0 -
Net Income 4,728,945
RETAINED EARNINGS CALCULATION
Retained Earnings b/f
Net Income
Dividends
Retained Earnings c/f to B/S
8/31/2017 9/30/2017 10/31/2017 11/30/2017 12/31/2017 1/31/2018 2/28/2018 3/31/2018 4/30/2018 5/31/2018
- - - - - - - - - -
32 33 34 35 36 37 38 39 40 41
- - - - - - - - - -
0 0 0 0 0 0 0 0 0 0
- - - - - - - - - -
0 0 0 0 0 0 0 0 0 0
- - - - - - - - - -
- - - - - - - - - -
0 0 0 0 0 0 0 0 0 0
- - - - - - - - - -
0 0 0 0 0 0 0 0 0 0
- - - - - - - - - -
- - - - - - - - - -
- - - - - - - - - -
- - - - - - - - - -
- - - - - - - - - -
- - - - - - - - - -
- - - - - - - - - -
- - - - - - - - - -
- - - - - - - - - -
- - - - - - - - - -
0 0 0 0 0 0 0 0 0 0
(0) (0) (0) (0) (0) (0) (0) (0) (0) (0)
(0) (0) (0) (0) (0) (0) (0) (0) (0) (0)
- - - - - (0) (0) (0) (0) (0)
0 0 0 0 0 (0) (0) (0) (0) (0)
0 0 0 0 0 0 (0) (0) (0) (0)
0 0 0 0 0 (0) (0) (0) (0) (0)
- - - - - - - - - -
0 0 0 0 0 (0) (0) (0) (0) (0)
NTE_Segment 3C_Final4.xls - 11/19/2008 Page 28 of 35
NTEMP Base Scope Proposal
SPONSOR SEGEMENT 3C
All amounts in nominal US Dollars (000s) Date
PROFIT AND LOSS STATEMENT (Monthly Construction)
PERIOD Totals
REVENUES
Toll Revenue 9,725,346
Interest Earnings 16,092
Availability Payment -
Total Revenues 9,741,438
Operating Expenses (630,866)
Total Expenses (630,866)
EBITDA 9,110,572
Asset Depreciation (808,504)
EBIT 8,302,068
Interest Expense -
Non Capitalized Financing Fees (15,547)
Sr Debt Interest (58,464)
Sr Bond Interest -
Liquidity Fac Interest -
Cap Ex Fac Interest (25,870)
TIFIA Interest (339,878)
Mez Interest -
SHL Interest -
Regearing Fac Interest (518,819)
Total Interest Expense (958,578)
Earnings Before Taxes 7,343,490
Total Local Taxes (68,190)
Federal Tax Expense (2,546,355)
Deferred Tax Credit/(Expense0 -
Net Income 4,728,945
RETAINED EARNINGS CALCULATION
Retained Earnings b/f
Net Income
Dividends
Retained Earnings c/f to B/S
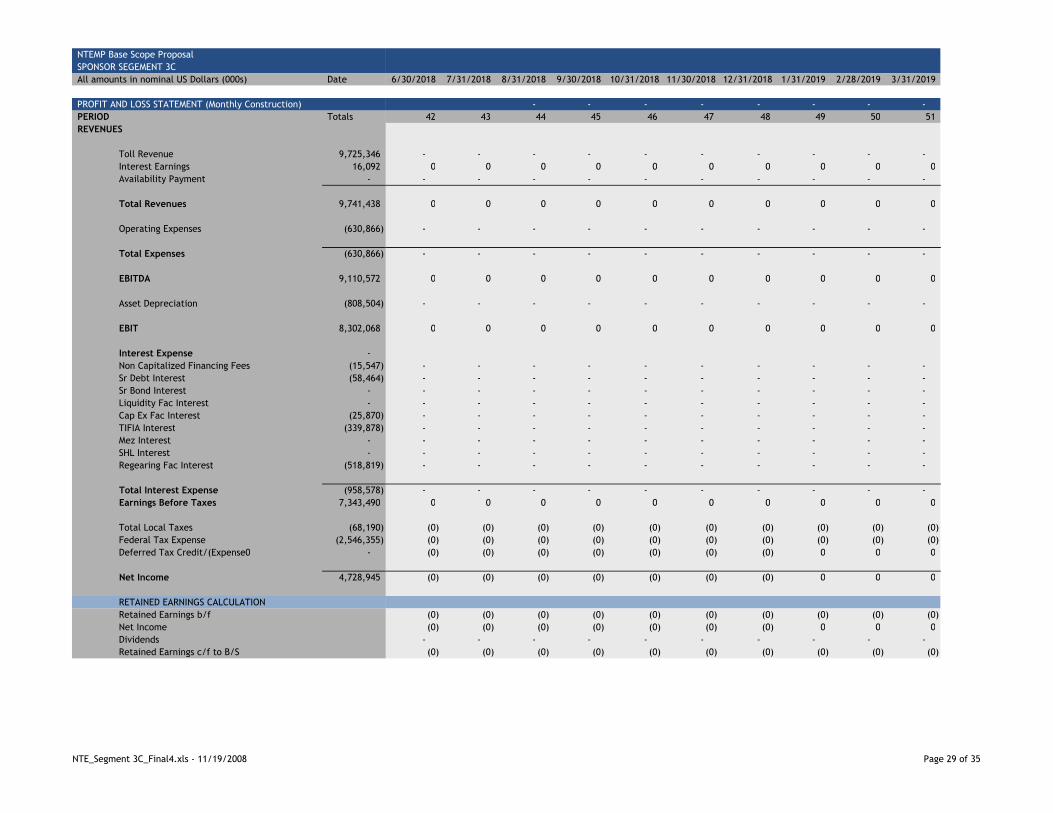
6/30/2018 7/31/2018 8/31/2018 9/30/2018 10/31/2018 11/30/2018 12/31/2018 1/31/2019 2/28/2019 3/31/2019
- - - - - - - - - -
- - - - - - - -
42 43 44 45 46 47 48 49 50 51
- - - - - - - - - -
0 0 0 0 0 0 0 0 0 0
- - - - - - - - - -
0 0 0 0 0 0 0 0 0 0
- - - - - - - - - -
- - - - - - - - - -
0 0 0 0 0 0 0 0 0 0
- - - - - - - - - -
0 0 0 0 0 0 0 0 0 0
- - - - - - - - - -
- - - - - - - - - -
- - - - - - - - - -
- - - - - - - - - -
- - - - - - - - - -
- - - - - - - - - -
- - - - - - - - - -
- - - - - - - - - -
- - - - - - - - - -
- - - - - - - - - -
0 0 0 0 0 0 0 0 0 0
(0) (0) (0) (0) (0) (0) (0) (0) (0) (0)
(0) (0) (0) (0) (0) (0) (0) (0) (0) (0)
(0) (0) (0) (0) (0) (0) (0) 0 0 0
(0) (0) (0) (0) (0) (0) (0) 0 0 0
(0) (0) (0) (0) (0) (0) (0) (0) (0) (0)
(0) (0) (0) (0) (0) (0) (0) 0 0 0
- - - - - - - - - -
(0) (0) (0) (0) (0) (0) (0) (0) (0) (0)
NTE_Segment 3C_Final4.xls - 11/19/2008 Page 29 of 35
NTEMP Base Scope Proposal
SPONSOR SEGEMENT 3C
All amounts in nominal US Dollars (000s) Date
PROFIT AND LOSS STATEMENT (Monthly Construction)
PERIOD Totals
REVENUES
Toll Revenue 9,725,346
Interest Earnings 16,092
Availability Payment -
Total Revenues 9,741,438
Operating Expenses (630,866)
Total Expenses (630,866)
EBITDA 9,110,572
Asset Depreciation (808,504)
EBIT 8,302,068
Interest Expense -
Non Capitalized Financing Fees (15,547)
Sr Debt Interest (58,464)
Sr Bond Interest -
Liquidity Fac Interest -
Cap Ex Fac Interest (25,870)
TIFIA Interest (339,878)
Mez Interest -
SHL Interest -
Regearing Fac Interest (518,819)
Total Interest Expense (958,578)
Earnings Before Taxes 7,343,490
Total Local Taxes (68,190)
Federal Tax Expense (2,546,355)
Deferred Tax Credit/(Expense0 -
Net Income 4,728,945
RETAINED EARNINGS CALCULATION
Retained Earnings b/f
Net Income
Dividends
Retained Earnings c/f to B/S
4/30/2019 5/31/2019 6/30/2019 7/31/2019 8/31/2019 9/30/2019 10/31/2019 11/30/2019 12/31/2019 12/31/2020
- - - - - - - - - -
- - - - -
52 53 54 55 56 57 58 59 60 61
- - - - - - - - - 12,912
0 0 0 0 0 0 0 0 0 1,641
- - - - - - - - - -
0 0 0 0 0 0 0 0 0 14,552
- - - - - - - - - (3,912)
- - - - - - - - - (3,912)
0 0 0 0 0 0 0 0 0 10,641
- - - - - - - - - (17,795)
0 0 0 0 0 0 0 0 0 (7,154)
- - - - - - - - - (150)
- - - - - - - - - (11,712)
- - - - - - - - - -
- - - - - - - - - -
- - - - - - - - - -
- - - - - - - - - (9,335)
- - - - - - - - - -
- - - - - - - - - -
- - - - - - - - - -
- - - - - - - - - (21,197)
0 0 0 0 0 0 0 0 0 (28,351)
(0) (0) (0) (0) (0) (0) (0) (0) (0) (102)
(0) (0) (0) (0) (0) (0) (0) (0) (0) -
0 0 0 0 0 0 0 0 0 9,959
0 0 0 0 0 0 0 0 0 (18,495)
(0) (0) (0) (0) (0) (0) (0) (0) (0) 0
0 0 0 0 0 0 0 0 0 (18,495)
- - - - - - - - - -
(0) (0) (0) (0) (0) (0) (0) (0) 0 (18,495)
NTE_Segment 3C_Final4.xls - 11/19/2008 Page 30 of 35
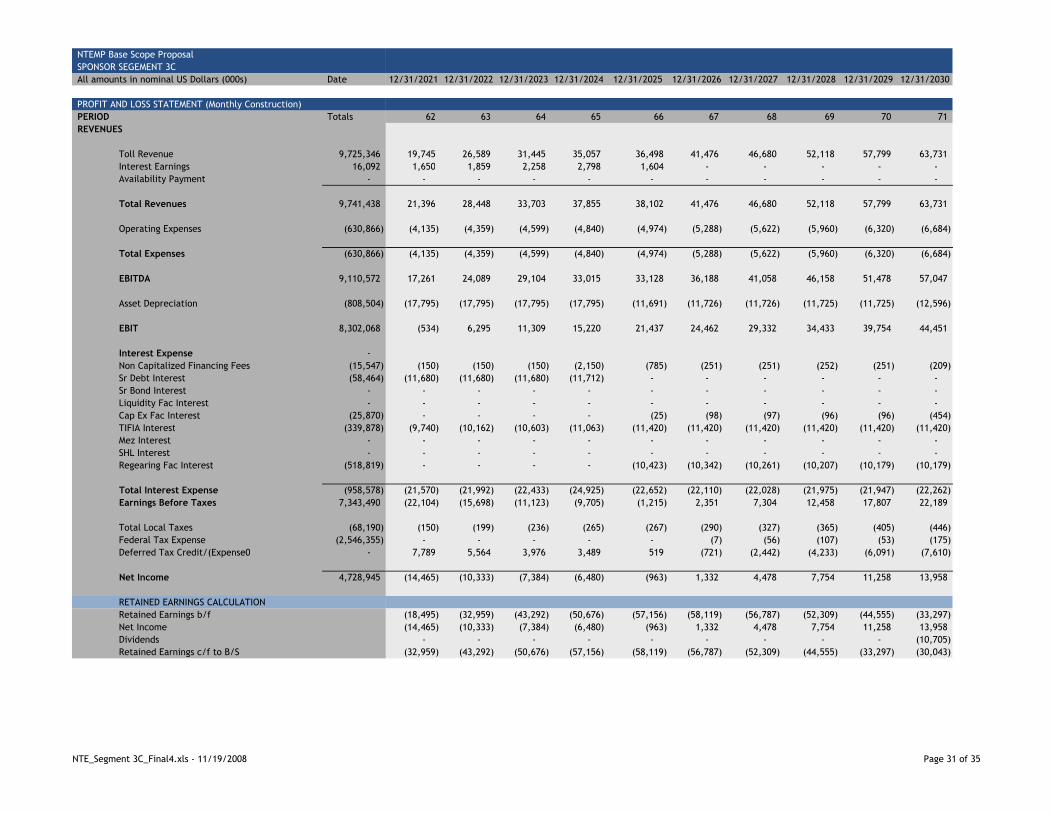
NTEMP Base Scope Proposal
SPONSOR SEGEMENT 3C
All amounts in nominal US Dollars (000s) Date
PROFIT AND LOSS STATEMENT (Monthly Construction)
PERIOD Totals
REVENUES
Toll Revenue 9,725,346
Interest Earnings 16,092
Availability Payment -
Total Revenues 9,741,438
Operating Expenses (630,866)
Total Expenses (630,866)
EBITDA 9,110,572
Asset Depreciation (808,504)
EBIT 8,302,068
Interest Expense -
Non Capitalized Financing Fees (15,547)
Sr Debt Interest (58,464)
Sr Bond Interest -
Liquidity Fac Interest -
Cap Ex Fac Interest (25,870)
TIFIA Interest (339,878)
Mez Interest -
SHL Interest -
Regearing Fac Interest (518,819)
Total Interest Expense (958,578)
Earnings Before Taxes 7,343,490
Total Local Taxes (68,190)
Federal Tax Expense (2,546,355)
Deferred Tax Credit/(Expense0 -
Net Income 4,728,945
RETAINED EARNINGS CALCULATION
Retained Earnings b/f
Net Income
Dividends
Retained Earnings c/f to B/S
12/31/2021 12/31/2022 12/31/2023 12/31/2024 12/31/2025 12/31/2026 12/31/2027 12/31/2028 12/31/2029 12/31/2030
- - - - - - - - - -
62 63 64 65 66 67 68 69 70 71
19,745 26,589 31,445 35,057 36,498 41,476 46,680 52,118 57,799 63,731
1,650 1,859 2,258 2,798 1,604 - - - - -
- - - - - - - - - -
21,396 28,448 33,703 37,855 38,102 41,476 46,680 52,118 57,799 63,731
(4,135) (4,359) (4,599) (4,840) (4,974) (5,288) (5,622) (5,960) (6,320) (6,684)
(4,135) (4,359) (4,599) (4,840) (4,974) (5,288) (5,622) (5,960) (6,320) (6,684)
17,261 24,089 29,104 33,015 33,128 36,188 41,058 46,158 51,478 57,047
(17,795) (17,795) (17,795) (17,795) (11,691) (11,726) (11,726) (11,725) (11,725) (12,596)
(534) 6,295 11,309 15,220 21,437 24,462 29,332 34,433 39,754 44,451
(150) (150) (150) (2,150) (785) (251) (251) (252) (251) (209)
(11,680) (11,680) (11,680) (11,712) - - - - - -
- - - - - - - - - -
- - - - - - - - - -
- - - - (25) (98) (97) (96) (96) (454)
(9,740) (10,162) (10,603) (11,063) (11,420) (11,420) (11,420) (11,420) (11,420) (11,420)
- - - - - - - - - -
- - - - - - - - - -
- - - - (10,423) (10,342) (10,261) (10,207) (10,179) (10,179)
(21,570) (21,992) (22,433) (24,925) (22,652) (22,110) (22,028) (21,975) (21,947) (22,262)
(22,104) (15,698) (11,123) (9,705) (1,215) 2,351 7,304 12,458 17,807 22,189
(150) (199) (236) (265) (267) (290) (327) (365) (405) (446)
- - - - - (7) (56) (107) (53) (175)
7,789 5,564 3,976 3,489 519 (721) (2,442) (4,233) (6,091) (7,610)
(14,465) (10,333) (7,384) (6,480) (963) 1,332 4,478 7,754 11,258 13,958
(18,495) (32,959) (43,292) (50,676) (57,156) (58,119) (56,787) (52,309) (44,555) (33,297)
(14,465) (10,333) (7,384) (6,480) (963) 1,332 4,478 7,754 11,258 13,958
- - - - - - - - - (10,705)
(32,959) (43,292) (50,676) (57,156) (58,119) (56,787) (52,309) (44,555) (33,297) (30,043)
NTE_Segment 3C_Final4.xls - 11/19/2008 Page 31 of 35

NTEMP Base Scope Proposal
SPONSOR SEGEMENT 3C
All amounts in nominal US Dollars (000s) Date
PROFIT AND LOSS STATEMENT (Monthly Construction)
PERIOD Totals
REVENUES
Toll Revenue 9,725,346
Interest Earnings 16,092
Availability Payment -
Total Revenues 9,741,438
Operating Expenses (630,866)
Total Expenses (630,866)
EBITDA 9,110,572
Asset Depreciation (808,504)
EBIT 8,302,068
Interest Expense -
Non Capitalized Financing Fees (15,547)
Sr Debt Interest (58,464)
Sr Bond Interest -
Liquidity Fac Interest -
Cap Ex Fac Interest (25,870)
TIFIA Interest (339,878)
Mez Interest -
SHL Interest -
Regearing Fac Interest (518,819)
Total Interest Expense (958,578)
Earnings Before Taxes 7,343,490
Total Local Taxes (68,190)
Federal Tax Expense (2,546,355)
Deferred Tax Credit/(Expense0 -
Net Income 4,728,945
RETAINED EARNINGS CALCULATION
Retained Earnings b/f
Net Income
Dividends
Retained Earnings c/f to B/S
12/31/2031 12/31/2032 12/31/2033 12/31/2034 12/31/2035 12/31/2036 12/31/2037 12/31/2038 12/31/2039 12/31/2040
- - - - - - - - - -
72 73 74 75 76 77 78 79 80 81
69,924 76,386 83,128 90,160 97,491 105,132 113,094 121,389 130,027 139,023
- - - - - - - - - -
- - - - - - - - - -
69,924 76,386 83,128 90,160 97,491 105,132 113,094 121,389 130,027 139,023
(7,070) (7,457) (7,871) (8,286) (8,730) (9,176) (9,652) (10,130) (10,641) (11,155)
(7,070) (7,457) (7,871) (8,286) (8,730) (9,176) (9,652) (10,130) (10,641) (11,155)
62,854 68,929 75,258 81,873 88,761 95,956 103,443 111,258 119,387 127,868
(14,247) (14,247) (14,247) (14,247) (13,794) (12,283) (12,283) (12,283) (12,283) (14,043)
48,607 54,682 61,011 67,626 74,967 83,673 91,159 98,975 107,103 113,825
(82) (82) (82) (380) (1,311) (401) (400) (400) (400) (341)
- - - - - - - - - -
- - - - - - - - - -
- - - - - - - - - -
(1,517) (1,521) (1,517) (1,517) (31) (123) (123) (123) (123) (799)
(11,420) (11,420) (11,420) (11,420) (11,420) (11,420) (11,420) (11,420) (11,420) (11,398)
- - - - - - - - - -
- - - - - - - - - -
(10,179) (10,207) (10,179) (10,179) (11,697) (11,729) (11,697) (11,697) (11,697) (11,754)
(23,198) (23,230) (23,198) (23,496) (24,459) (23,673) (23,640) (23,640) (23,640) (24,292)
25,409 31,452 37,813 44,130 50,508 60,000 67,520 75,335 83,464 89,533
(489) (535) (582) (631) (682) (736) (792) (850) (910) (973)
(227) (347) (474) (599) (3,374) (9,134) (10,626) (12,178) (20,380) (33,554)
(8,722) (10,821) (13,031) (15,225) (17,439) (20,742) (23,355) (351) 3,126 2,558
15,970 19,749 23,726 27,675 29,012 29,388 32,747 61,956 65,299 57,564
(30,043) (38,765) (49,586) (62,616) (77,841) (95,280) (116,022) (139,377) (139,728) (136,602)
15,970 19,749 23,726 27,675 29,012 29,388 32,747 61,956 65,299 57,564
(24,692) (30,570) (36,757) (42,900) (46,451) (50,130) (56,101) (62,308) (62,173) (55,007)
(38,765) (49,586) (62,616) (77,841) (95,280) (116,022) (139,377) (139,728) (136,602) (134,045)
NTE_Segment 3C_Final4.xls - 11/19/2008 Page 32 of 35
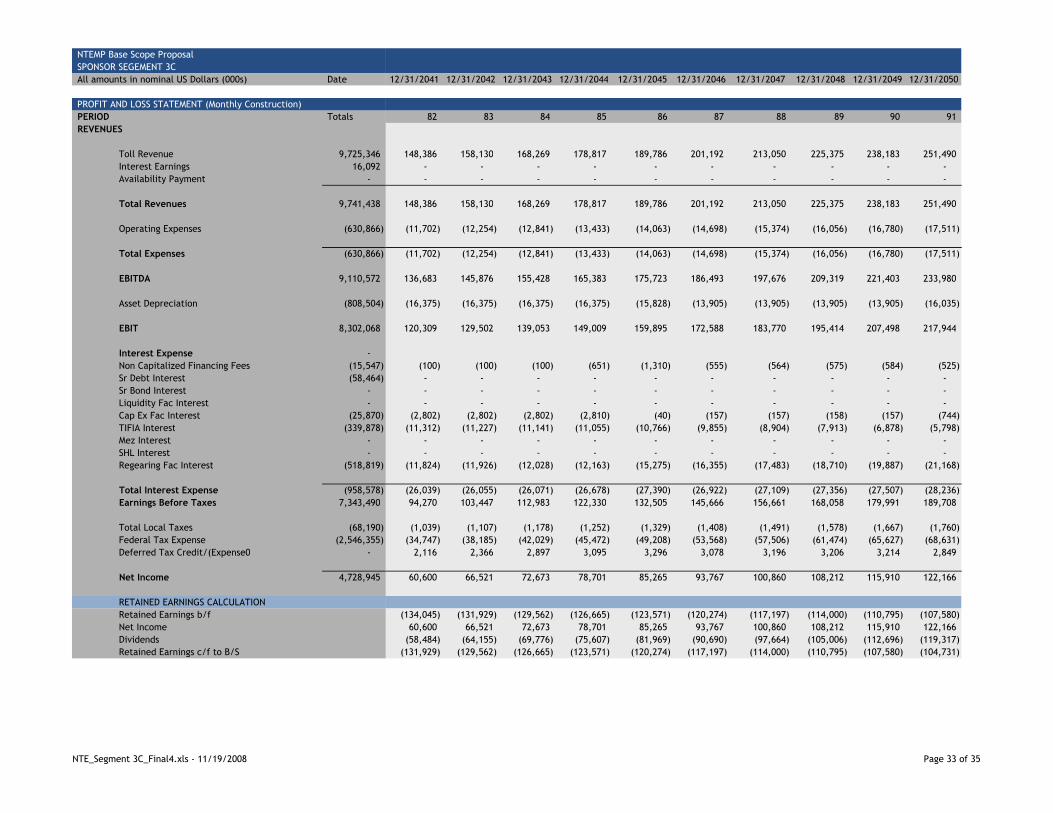
NTEMP Base Scope Proposal
SPONSOR SEGEMENT 3C
All amounts in nominal US Dollars (000s) Date
PROFIT AND LOSS STATEMENT (Monthly Construction)
PERIOD Totals
REVENUES
Toll Revenue 9,725,346
Interest Earnings 16,092
Availability Payment -
Total Revenues 9,741,438
Operating Expenses (630,866)
Total Expenses (630,866)
EBITDA 9,110,572
Asset Depreciation (808,504)
EBIT 8,302,068
Interest Expense -
Non Capitalized Financing Fees (15,547)
Sr Debt Interest (58,464)
Sr Bond Interest -
Liquidity Fac Interest -
Cap Ex Fac Interest (25,870)
TIFIA Interest (339,878)
Mez Interest -
SHL Interest -
Regearing Fac Interest (518,819)
Total Interest Expense (958,578)
Earnings Before Taxes 7,343,490
Total Local Taxes (68,190)
Federal Tax Expense (2,546,355)
Deferred Tax Credit/(Expense0 -
Net Income 4,728,945
RETAINED EARNINGS CALCULATION
Retained Earnings b/f
Net Income
Dividends
Retained Earnings c/f to B/S
12/31/2041 12/31/2042 12/31/2043 12/31/2044 12/31/2045 12/31/2046 12/31/2047 12/31/2048 12/31/2049 12/31/2050
- - - - - - - (0.00) (0.00) (0.00)
82 83 84 85 86 87 88 89 90 91
148,386 158,130 168,269 178,817 189,786 201,192 213,050 225,375 238,183 251,490
- - - - - - - - - -
- - - - - - - - - -
148,386 158,130 168,269 178,817 189,786 201,192 213,050 225,375 238,183 251,490
(11,702) (12,254) (12,841) (13,433) (14,063) (14,698) (15,374) (16,056) (16,780) (17,511)
(11,702) (12,254) (12,841) (13,433) (14,063) (14,698) (15,374) (16,056) (16,780) (17,511)
136,683 145,876 155,428 165,383 175,723 186,493 197,676 209,319 221,403 233,980
(16,375) (16,375) (16,375) (16,375) (15,828) (13,905) (13,905) (13,905) (13,905) (16,035)
120,309 129,502 139,053 149,009 159,895 172,588 183,770 195,414 207,498 217,944
(100) (100) (100) (651) (1,310) (555) (564) (575) (584) (525)
- - - - - - - - - -
- - - - - - - - - -
- - - - - - - - - -
(2,802) (2,802) (2,802) (2,810) (40) (157) (157) (158) (157) (744)
(11,312) (11,227) (11,141) (11,055) (10,766) (9,855) (8,904) (7,913) (6,878) (5,798)
- - - - - - - - - -
- - - - - - - - - -
(11,824) (11,926) (12,028) (12,163) (15,275) (16,355) (17,483) (18,710) (19,887) (21,168)
(26,039) (26,055) (26,071) (26,678) (27,390) (26,922) (27,109) (27,356) (27,507) (28,236)
94,270 103,447 112,983 122,330 132,505 145,666 156,661 168,058 179,991 189,708
(1,039) (1,107) (1,178) (1,252) (1,329) (1,408) (1,491) (1,578) (1,667) (1,760)
(34,747) (38,185) (42,029) (45,472) (49,208) (53,568) (57,506) (61,474) (65,627) (68,631)
2,116 2,366 2,897 3,095 3,296 3,078 3,196 3,206 3,214 2,849
60,600 66,521 72,673 78,701 85,265 93,767 100,860 108,212 115,910 122,166
(134,045) (131,929) (129,562) (126,665) (123,571) (120,274) (117,197) (114,000) (110,795) (107,580)
60,600 66,521 72,673 78,701 85,265 93,767 100,860 108,212 115,910 122,166
(58,484) (64,155) (69,776) (75,607) (81,969) (90,690) (97,664) (105,006) (112,696) (119,317)
(131,929) (129,562) (126,665) (123,571) (120,274) (117,197) (114,000) (110,795) (107,580) (104,731)
NTE_Segment 3C_Final4.xls - 11/19/2008 Page 33 of 35
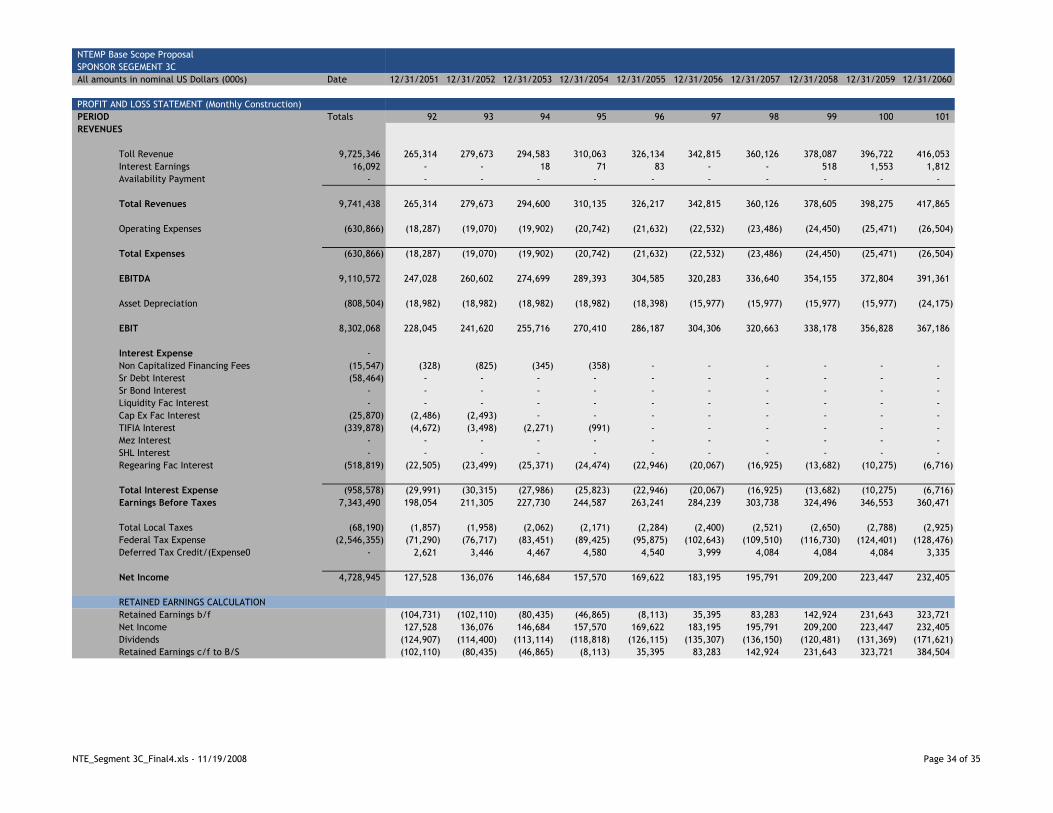
NTEMP Base Scope Proposal
SPONSOR SEGEMENT 3C
All amounts in nominal US Dollars (000s) Date
PROFIT AND LOSS STATEMENT (Monthly Construction)
PERIOD Totals
REVENUES
Toll Revenue 9,725,346
Interest Earnings 16,092
Availability Payment -
Total Revenues 9,741,438
Operating Expenses (630,866)
Total Expenses (630,866)
EBITDA 9,110,572
Asset Depreciation (808,504)
EBIT 8,302,068
Interest Expense -
Non Capitalized Financing Fees (15,547)
Sr Debt Interest (58,464)
Sr Bond Interest -
Liquidity Fac Interest -
Cap Ex Fac Interest (25,870)
TIFIA Interest (339,878)
Mez Interest -
SHL Interest -
Regearing Fac Interest (518,819)
Total Interest Expense (958,578)
Earnings Before Taxes 7,343,490
Total Local Taxes (68,190)
Federal Tax Expense (2,546,355)
Deferred Tax Credit/(Expense0 -
Net Income 4,728,945
RETAINED EARNINGS CALCULATION
Retained Earnings b/f
Net Income
Dividends
Retained Earnings c/f to B/S
12/31/2051 12/31/2052 12/31/2053 12/31/2054 12/31/2055 12/31/2056 12/31/2057 12/31/2058 12/31/2059 12/31/2060
(0.00) (0.00) (0.00) (0.00) (0.00) (0.00) (0.00) (0.00) (0.00) (0.00)
92 93 94 95 96 97 98 99 100 101
265,314 279,673 294,583 310,063 326,134 342,815 360,126 378,087 396,722 416,053
- - 18 71 83 - - 518 1,553 1,812
- - - - - - - - - -
265,314 279,673 294,600 310,135 326,217 342,815 360,126 378,605 398,275 417,865
(18,287) (19,070) (19,902) (20,742) (21,632) (22,532) (23,486) (24,450) (25,471) (26,504)
(18,287) (19,070) (19,902) (20,742) (21,632) (22,532) (23,486) (24,450) (25,471) (26,504)
247,028 260,602 274,699 289,393 304,585 320,283 336,640 354,155 372,804 391,361
(18,982) (18,982) (18,982) (18,982) (18,398) (15,977) (15,977) (15,977) (15,977) (24,175)
228,045 241,620 255,716 270,410 286,187 304,306 320,663 338,178 356,828 367,186
(328) (825) (345) (358) - - - - - -
- - - - - - - - - -
- - - - - - - - - -
- - - - - - - - - -
(2,486) (2,493) - - - - - - - -
(4,672) (3,498) (2,271) (991) - - - - - -
- - - - - - - - - -
- - - - - - - - - -
(22,505) (23,499) (25,371) (24,474) (22,946) (20,067) (16,925) (13,682) (10,275) (6,716)
(29,991) (30,315) (27,986) (25,823) (22,946) (20,067) (16,925) (13,682) (10,275) (6,716)
198,054 211,305 227,730 244,587 263,241 284,239 303,738 324,496 346,553 360,471
(1,857) (1,958) (2,062) (2,171) (2,284) (2,400) (2,521) (2,650) (2,788) (2,925)
(71,290) (76,717) (83,451) (89,425) (95,875) (102,643) (109,510) (116,730) (124,401) (128,476)
2,621 3,446 4,467 4,580 4,540 3,999 4,084 4,084 4,084 3,335
127,528 136,076 146,684 157,570 169,622 183,195 195,791 209,200 223,447 232,405
(104,731) (102,110) (80,435) (46,865) (8,113) 35,395 83,283 142,924 231,643 323,721
127,528 136,076 146,684 157,570 169,622 183,195 195,791 209,200 223,447 232,405
(124,907) (114,400) (113,114) (118,818) (126,115) (135,307) (136,150) (120,481) (131,369) (171,621)
(102,110) (80,435) (46,865) (8,113) 35,395 83,283 142,924 231,643 323,721 384,504
NTE_Segment 3C_Final4.xls - 11/19/2008 Page 34 of 35

NTEMP Base Scope Proposal
SPONSOR SEGEMENT 3C
All amounts in nominal US Dollars (000s) Date
PROFIT AND LOSS STATEMENT (Monthly Construction)
PERIOD Totals
REVENUES
Toll Revenue 9,725,346
Interest Earnings 16,092
Availability Payment -
Total Revenues 9,741,438
Operating Expenses (630,866)
Total Expenses (630,866)
EBITDA 9,110,572
Asset Depreciation (808,504)
EBIT 8,302,068
Interest Expense -
Non Capitalized Financing Fees (15,547)
Sr Debt Interest (58,464)
Sr Bond Interest -
Liquidity Fac Interest -
Cap Ex Fac Interest (25,870)
TIFIA Interest (339,878)
Mez Interest -
SHL Interest -
Regearing Fac Interest (518,819)
Total Interest Expense (958,578)
Earnings Before Taxes 7,343,490
Total Local Taxes (68,190)
Federal Tax Expense (2,546,355)
Deferred Tax Credit/(Expense0 -
Net Income 4,728,945
RETAINED EARNINGS CALCULATION
Retained Earnings b/f
Net Income
Dividends
Retained Earnings c/f to B/S
12/31/2061 12/31/2062 12/31/2063 12/31/2064 12/31/2065 12/31/2066 12/31/2067
(0.00) (0.00) (0.00) (0.00) (0.00) (0.00) 0.00
102 103 104 105 106 107 108
436,102 456,894 478,452 500,803 523,972 537,072 -
- - 30 91 106 - -
- - - - - - -
436,102 456,894 478,482 500,894 524,079 537,072 -
(27,596) (28,701) (29,869) (31,053) - - -
(27,596) (28,701) (29,869) (31,053) - - -
408,507 428,192 448,613 469,841 524,079 537,072 -
(29,879) (29,285) (28,691) (28,691) (30,800) (31,644) -
378,628 398,908 419,922 441,151 493,278 505,427 -
- - - - - - -
- - - - - - -
- - - - - - -
- - - - - - -
- - - - - - -
- - - - - - -
- - - - - - -
- - - - - - -
(2,932) - - - - - -
(2,932) - - - - - -
375,695 398,908 419,922 441,151 493,278 505,427 -
(3,053) (3,198) (3,349) (3,506) (3,669) (3,760) -
(133,835) (142,554) (150,247) (157,622) (175,810) (180,030) -
3,410 4,055 4,446 4,446 4,446 4,446 -
242,218 257,211 270,772 284,469 318,246 326,084 -
384,504 434,743 438,798 443,245 447,691 452,137 -
242,218 257,211 270,772 284,469 318,246 326,084 -
(191,980) (253,156) (266,326) (280,023) (313,800) (321,638) -
434,743 438,798 443,245 447,691 452,137 456,584 -
NTE_Segment 3C_Final4.xls - 11/19/2008 Page 35 of 35