north texas demographic characteristics and trends dfw international luncheon dallas public library...
TRANSCRIPT

North Texas Demographic Characteristics and Trends
DFW International Luncheon
Dallas Public LibraryMay 19, 2010
Dallas, TX
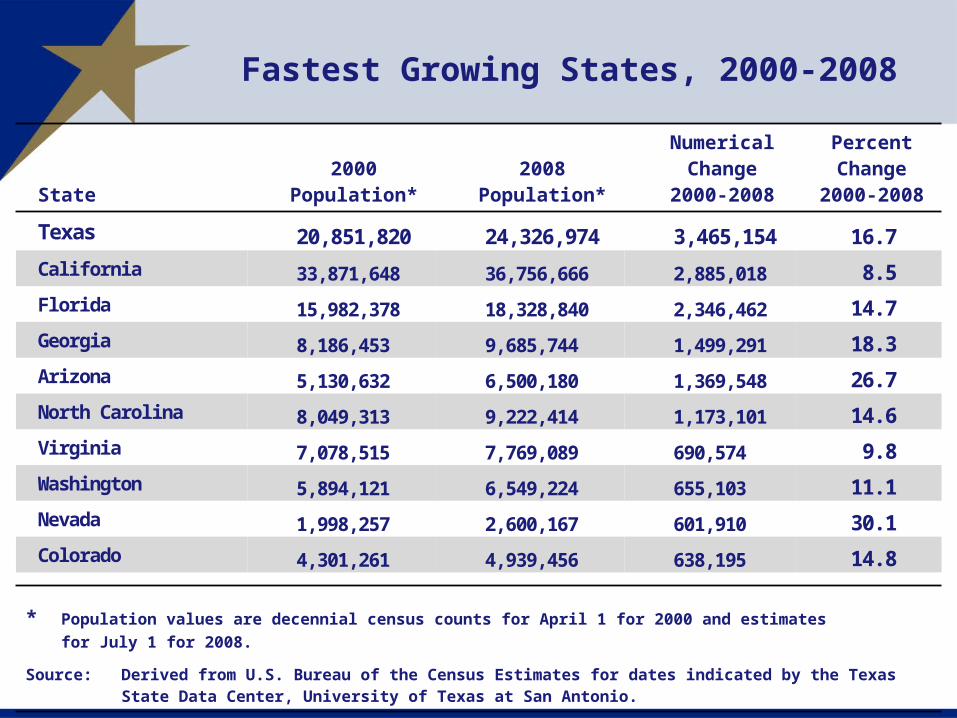
Fastest Growing States, 2000-2008
State2000
Population*2008
Population*
NumericalChange
2000-2008
PercentChange
2000-2008
Texas 20,851,820 24,326,974 3,465,154 16.7
California 33,871,648 36,756,666 2,885,018 8.5
Florida 15,982,378 18,328,840 2,346,462 14.7
Georgia 8,186,453 9,685,744 1,499,291 18.3
Arizona 5,130,632 6,500,180 1,369,548 26.7
North Carolina 8,049,313 9,222,414 1,173,101 14.6Virginia 7,078,515 7,769,089 690,574 9.8Washington 5,894,121 6,549,224 655,103 11.1Nevada 1,998,257 2,600,167 601,910 30.1Colorado 4,301,261 4,939,456 638,195 14.8
* Population values are decennial census counts for April 1 for 2000 and estimatesfor July 1 for 2008.
Source: Derived from U.S. Bureau of the Census Estimates for dates indicated by the Texas State Data Center, University of Texas at San Antonio.
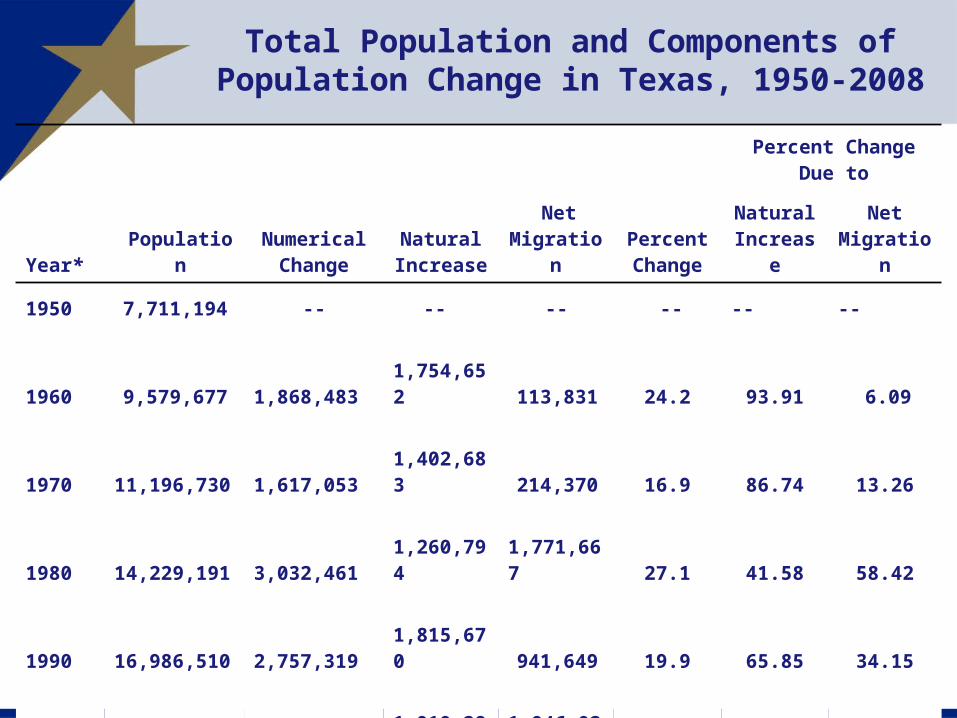
Percent ChangeDue to
Year* PopulationNumerical
ChangeNatural
IncreaseNet
MigrationPercentChange
NaturalIncrease
NetMigration
1950 7,711,194 -- -- -- -- -- --
1960 9,579,677 1,868,483 1,754,652 113,831 24.2 93.91 6.09
1970 11,196,730 1,617,053 1,402,683 214,370 16.9 86.74 13.26
1980 14,229,191 3,032,461 1,260,794 1,771,667 27.1 41.58 58.42
1990 16,986,510 2,757,319 1,815,670 941,649 19.9 65.85 34.15
2000 20,851,820 3,865,310 1,919,281 1,946,029 22.8 49.65 50.35
2008 24,326,974 3,475,154 1,884,947 1,563,694 16.7 54.20 45.00
* All values for the decennial dates are for the indicated census year. Values for 2008 is for July 1 as estimated by the U.S. Bureau of the Census.
Source: Derived from U.S. Bureau of the Census Estimates for dates indicated by the Texas State Data Center, University of Texas at San Antonio.
Total Population and Components of Population Change in Texas, 1950-2008
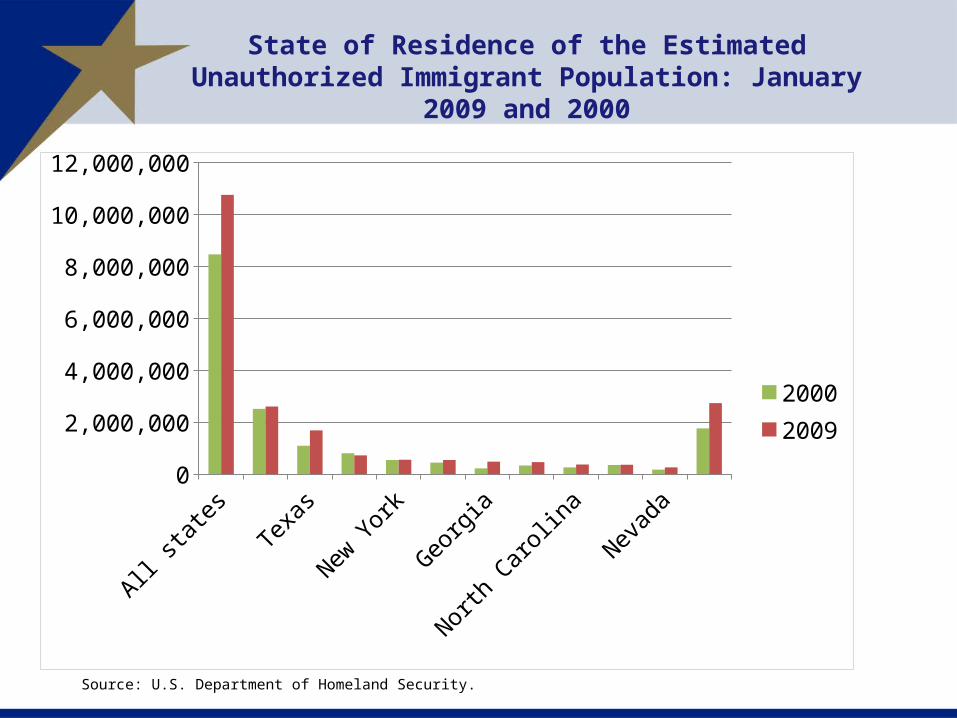
State of Residence of the Estimated Unauthorized Immigrant Population: January
2009 and 2000
Source: U.S. Department of Homeland Security.
All stat
es
Californ
iaTexa
s
Florid
a
New York
Illinois
Georgia
Arizona
North Caro
lina
New Jerse
y
Nevada
Other s
tates
0
2,000,000
4,000,000
6,000,000
8,000,000
10,000,000
12,000,000
20002009
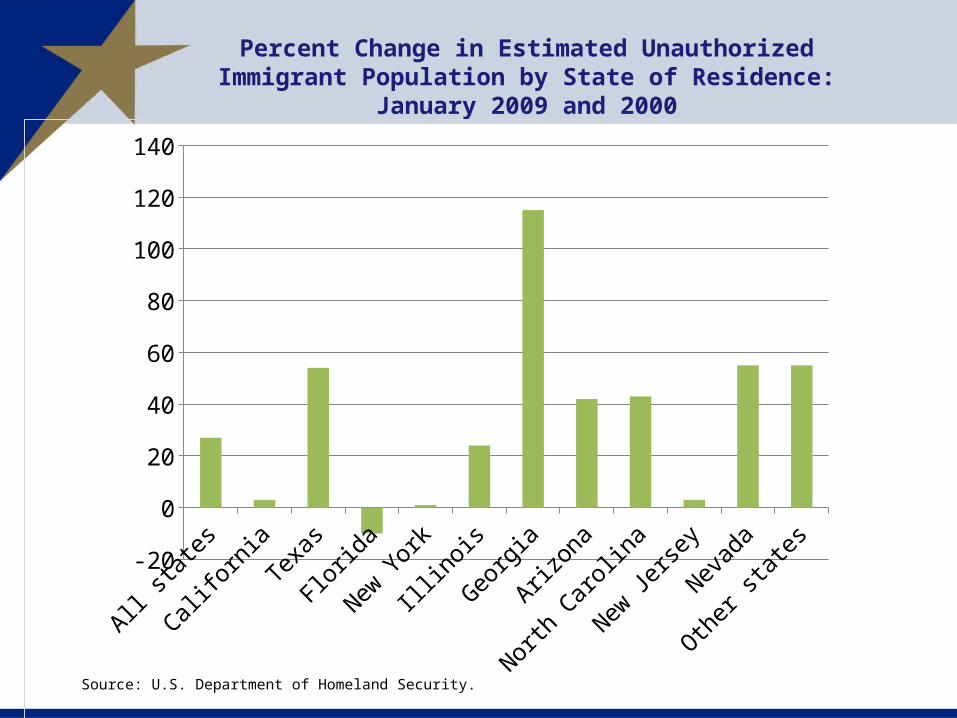
Percent Change in Estimated Unauthorized Immigrant Population by State of Residence:
January 2009 and 2000
Source: U.S. Department of Homeland Security.
All stat
es
Californ
iaTexa
s
Florid
a
New York
Illinois
Georgia
Arizona
North Caro
lina
New Jerse
y
Nevada
Other s
tates
-20
0
20
40
60
80
100
120
140
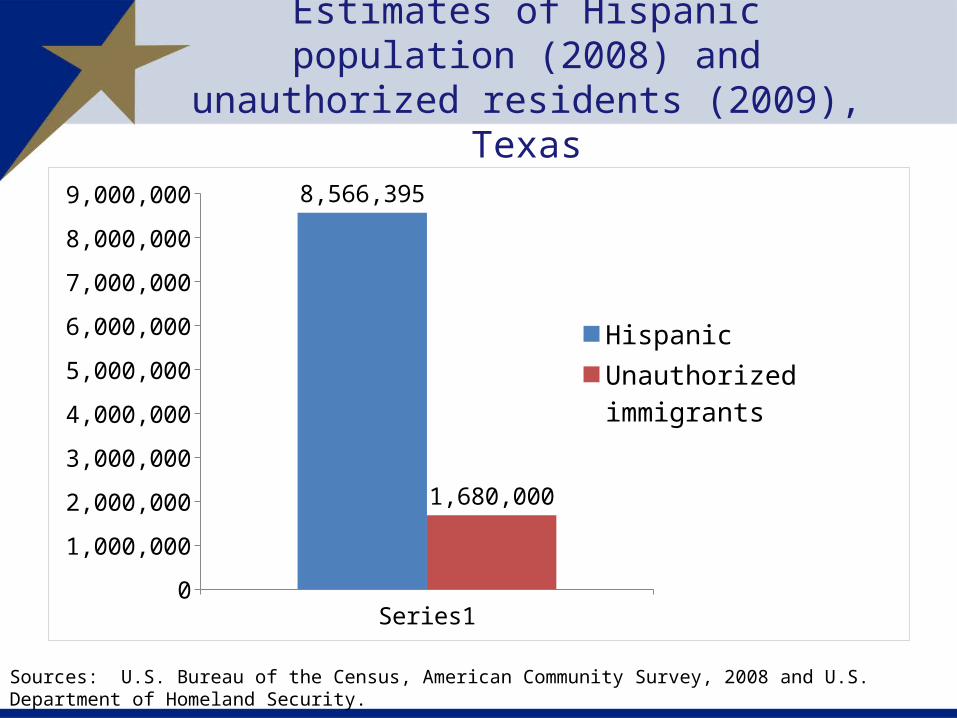
Estimates of Hispanic population (2008) and unauthorized residents (2009), Texas
Series10
1,000,000
2,000,000
3,000,000
4,000,000
5,000,000
6,000,000
7,000,000
8,000,000
9,000,000 8,566,395
1,680,000
Hispanic
Unauthorized immigrants
Sources: U.S. Bureau of the Census, American Community Survey, 2008 and U.S. Department of Homeland Security.
20
25
30
35
40
45
50
55
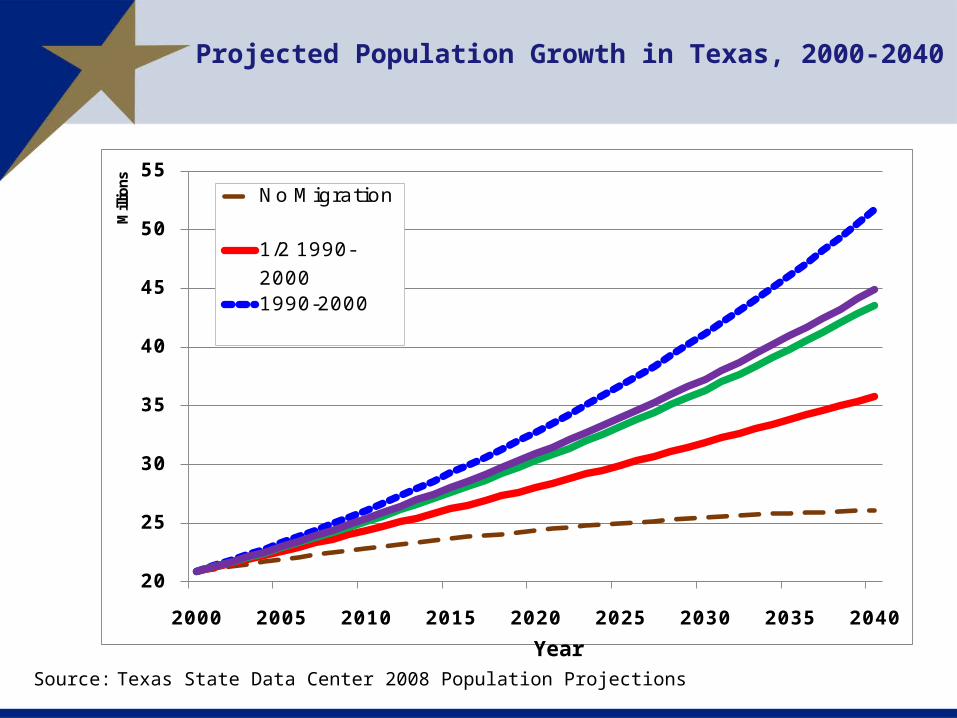
2000 2005 2010 2015 2020 2025 2030 2035 2040
Mill
ions
No Migration
1/2 1990-
20001990-2000
Source: Texas State Data Center 2008 Population Projections
Year
Projected Population Growth in Texas, 2000-2040

Racial and Ethnic Composition
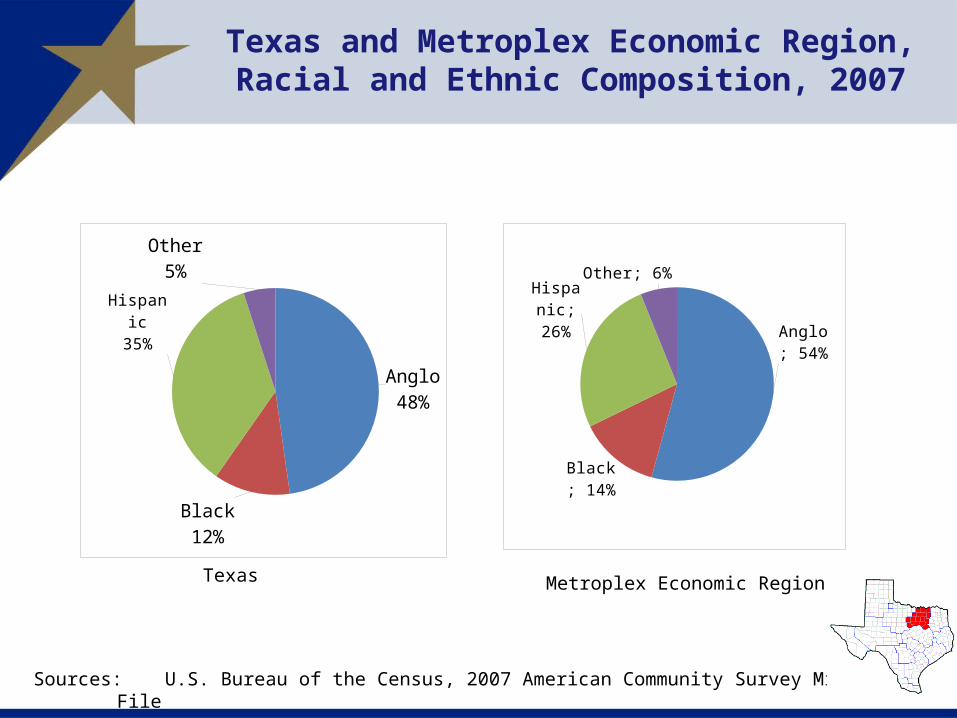
Sources: U.S. Bureau of the Census, 2007 American Community Survey Microdata File
Texas and Metroplex Economic Region,Racial and Ethnic Composition, 2007
Anglo48%
Black12%
His-panic35%
Other5%
Anglo; 54%
Black; 14%
His-panic; 26%
Other; 6%
Metroplex Economic RegionTexas

0.0
10.0
20.0
30.0
40.0
50.0
60.0
70.0
80.0
90.0
1980-1990 1990-2000 2000-2007 2000-2040
Anglo Black Hispanic Other
% of Growth Due to Each Ethnicity in Texas, 1980-1990, 1990-2000, 2000-2007, and 2000-2040
Source: U.S. Census Counts, and Texas State Data Center 2008 Population Projections, 0.5 Scenario
0%
10%
20%
30%
40%
50%
60%
70%20
0020
0220
0420
0620
0820
1020
1220
1420
1620
1820
2020
2220
2420
2620
2820
3020
3220
3420
3620
3820
40
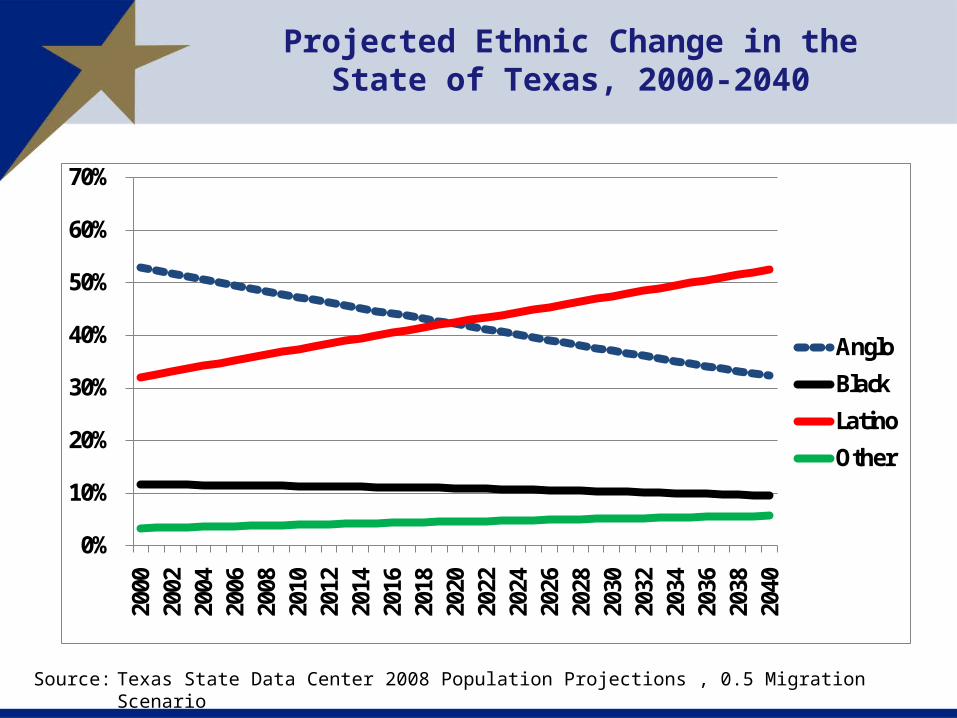
Anglo
Black
Latino
Other
Source: Texas State Data Center 2008 Population Projections , 0.5 Migration Scenario
Projected Ethnic Change in theState of Texas, 2000-2040
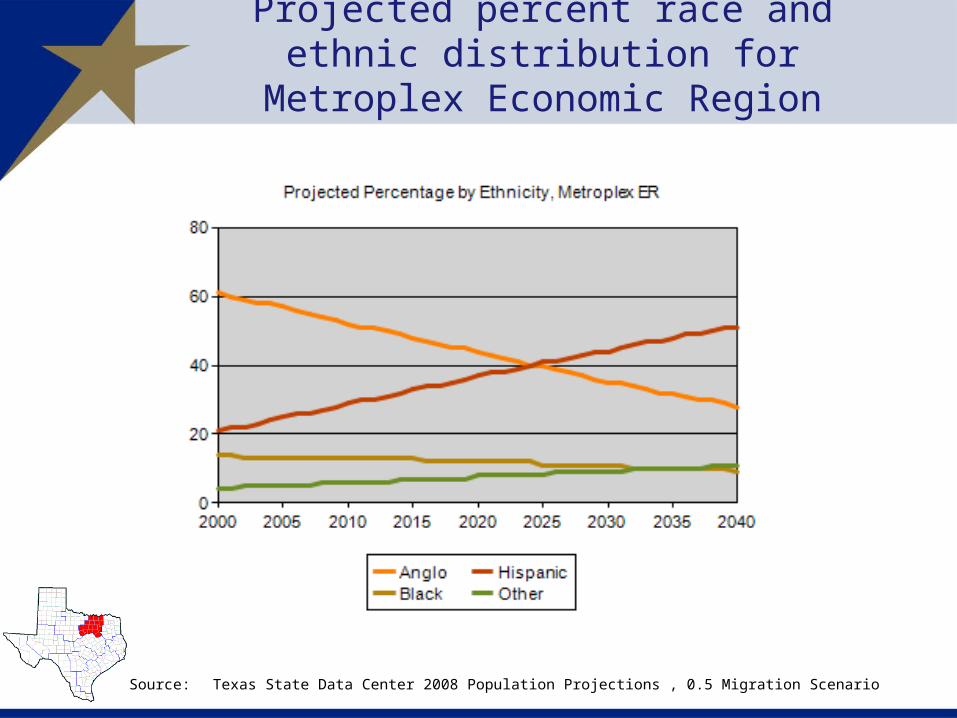
Projected percent race and ethnic distribution for Metroplex Economic Region
Source: Texas State Data Center 2008 Population Projections , 0.5 Migration Scenario
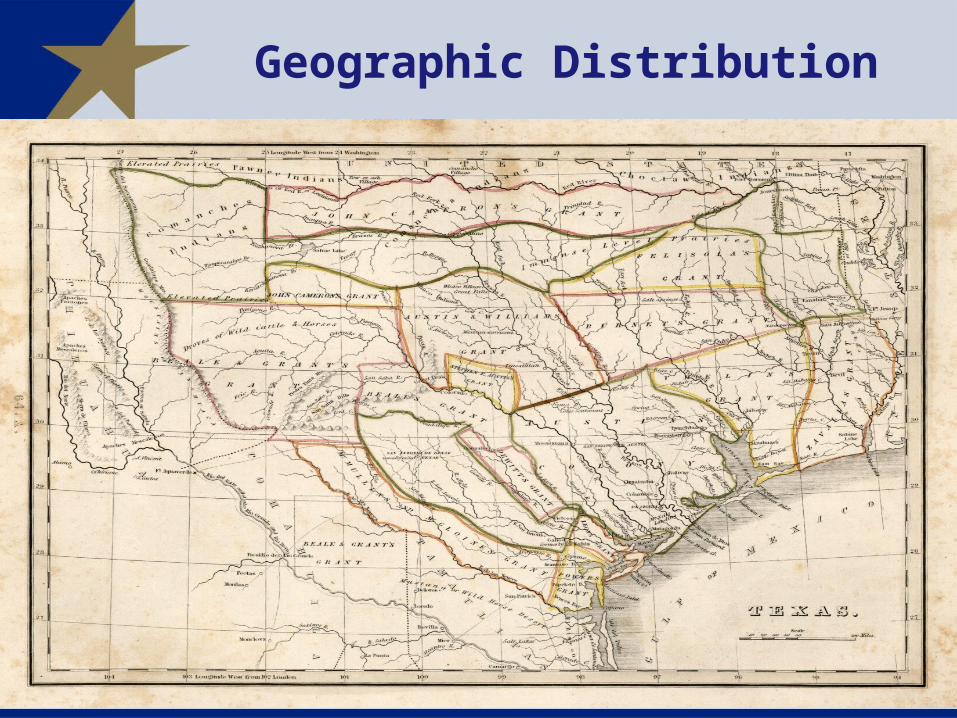
Geographic Distribution
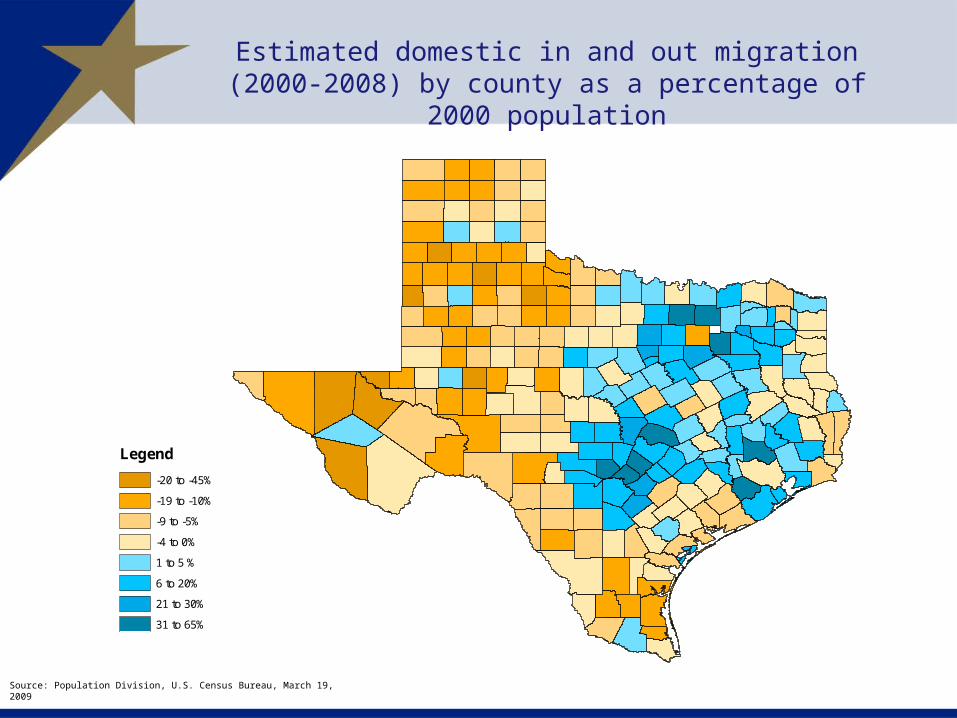
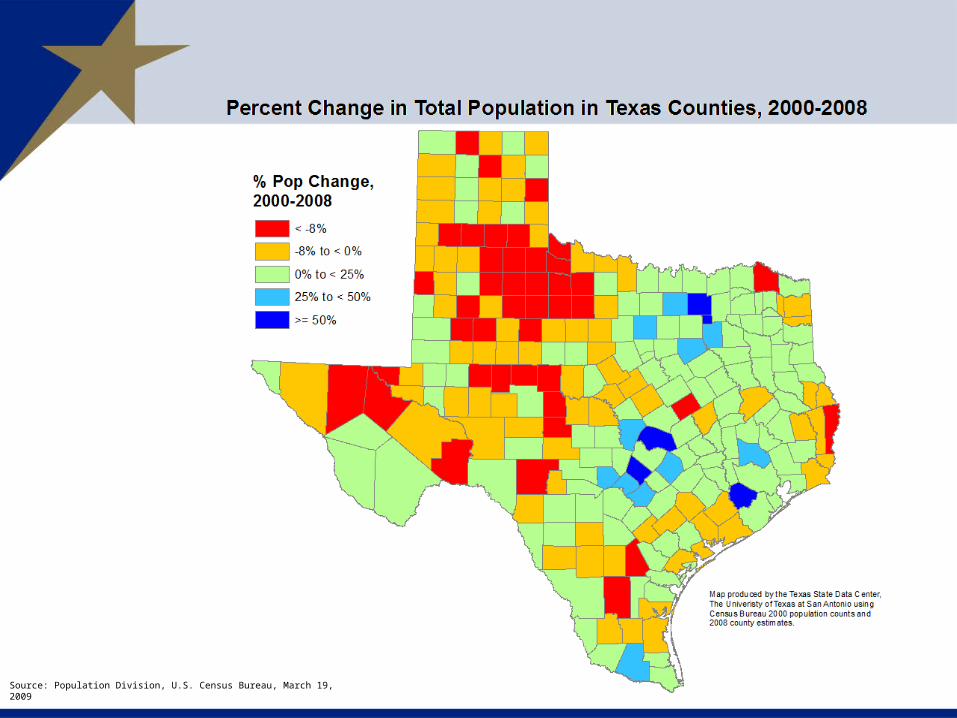
Estimated domestic in and out migration (2000-2008) by county as a percentage of 2000 population
Source: Population Division, U.S. Census Bureau, March 19, 2009
Legend
-20 to -45%
-19 to -10%
-9 to -5%
-4 to 0%
1 to 5 %
6 to 20%
21 to 30%
31 to 65%
Legend
0-1%
1-2.5%
2.5-3.5%
3.5-5%
5-10%
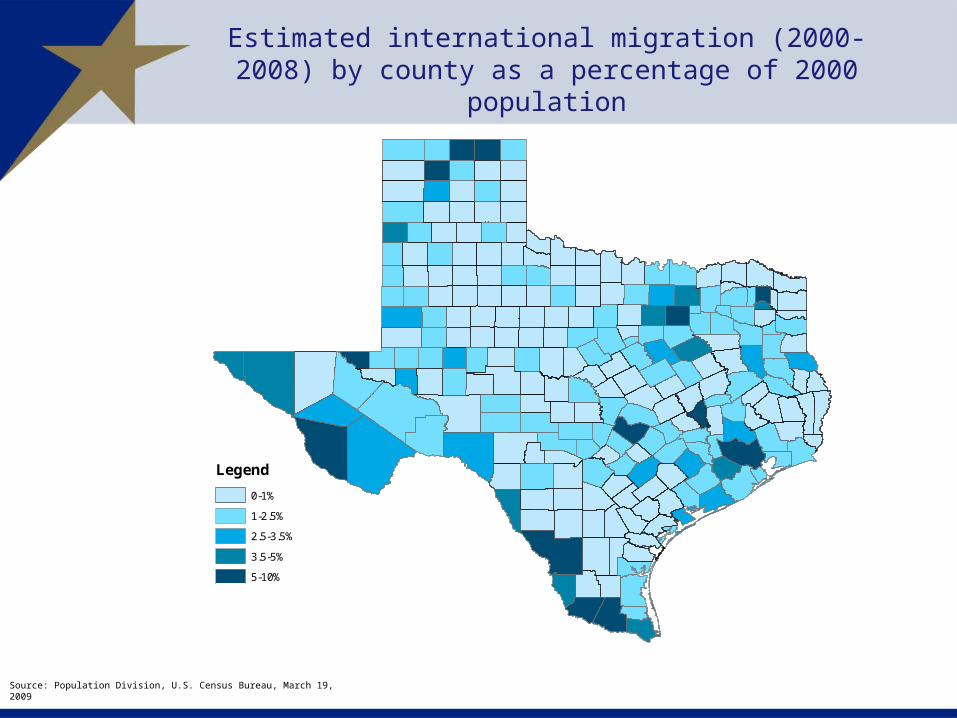
Estimated international migration (2000-2008) by county as a percentage of 2000 population
Source: Population Division, U.S. Census Bureau, March 19, 2009
Source: Population Division, U.S. Census Bureau, March 19, 2009
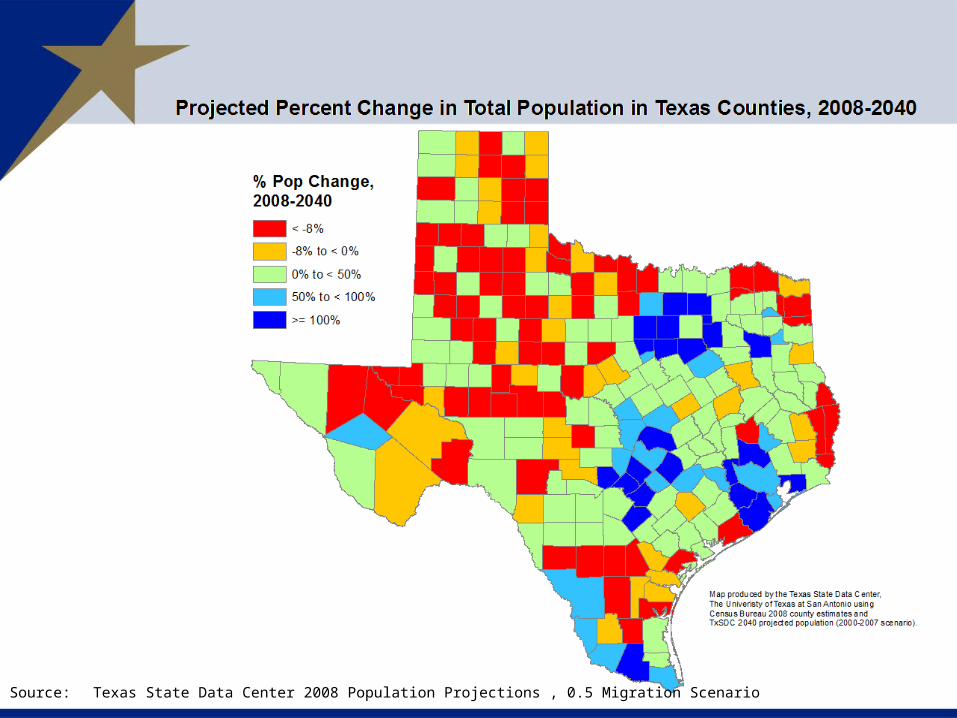
Source: Texas State Data Center 2008 Population Projections , 0.5 Migration Scenario
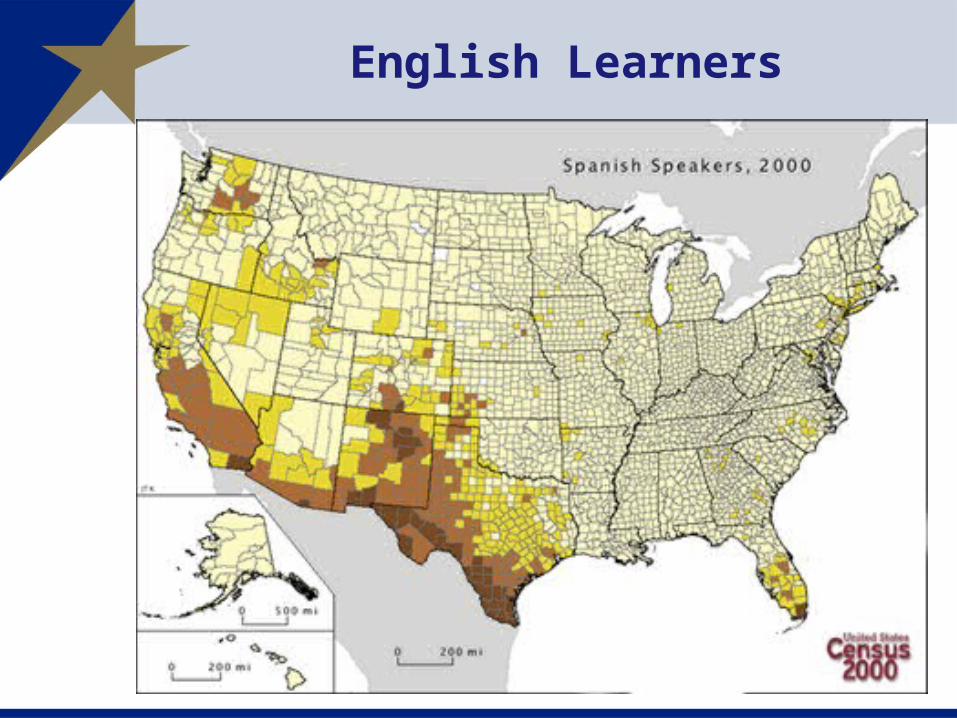
English Learners
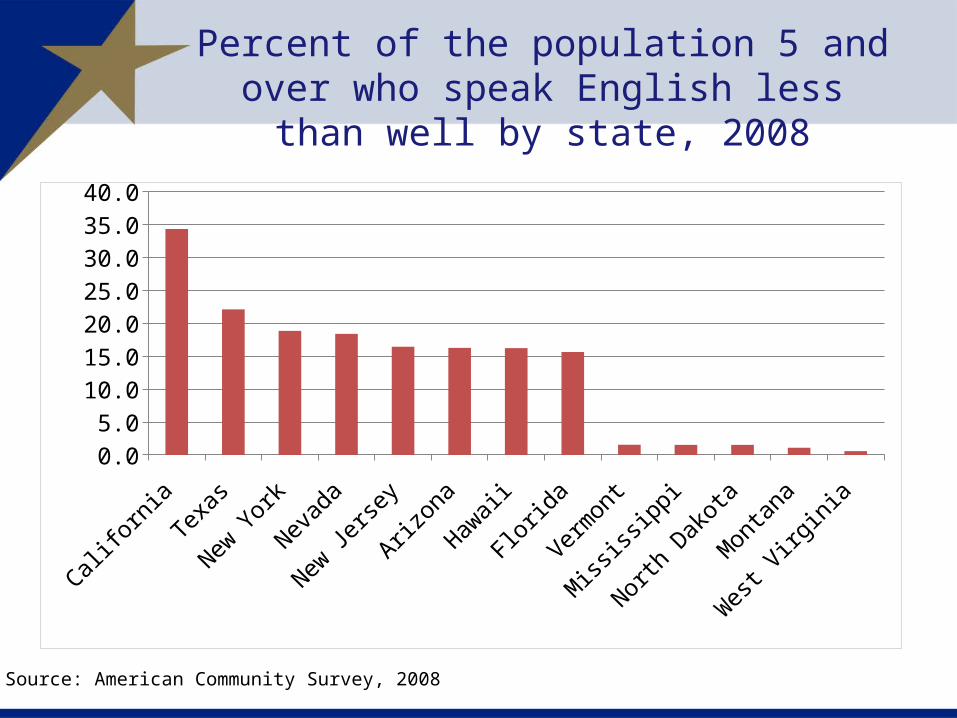
Percent of the population 5 and over who speak English less than well by state, 2008
Californ
ia
Texas
New York
Nevada
New Jerse
y
Arizona
Hawaii
Florid
a
Vermont
Miss
issippi
North Dak
ota
Montan
a
West
Virginia
0.0
5.0
10.0
15.0
20.0
25.0
30.0
35.0
40.0
Source: American Community Survey, 2008
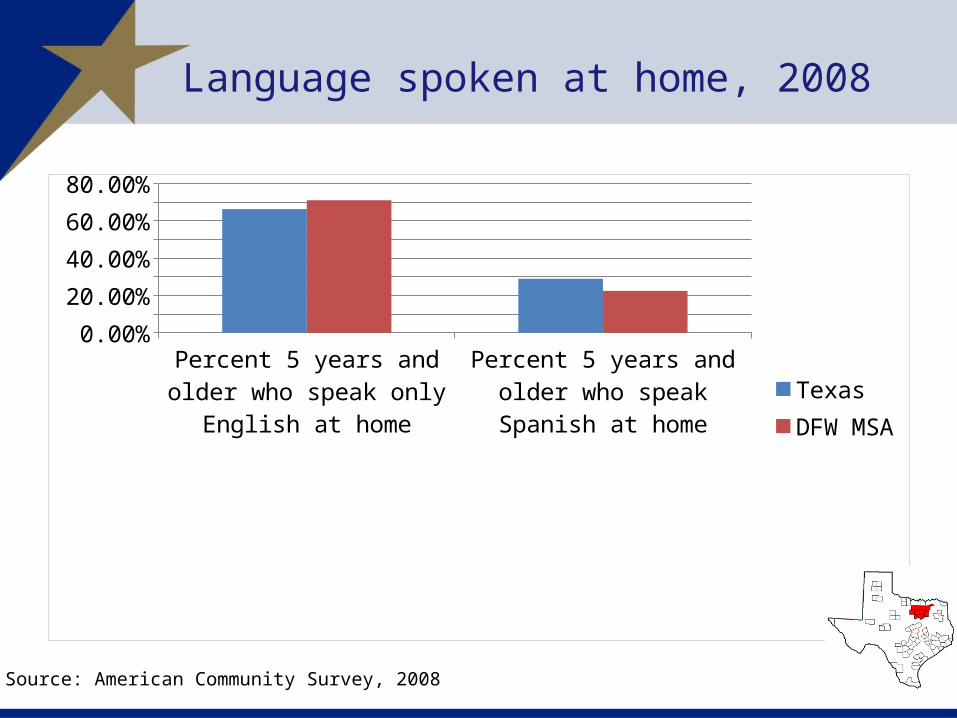
Language spoken at home, 2008
Percent 5 years and older who speak only English at
home
Percent 5 years and older who speak Spanish at home
0.00%
10.00%
20.00%
30.00%
40.00%
50.00%
60.00%
70.00%
80.00%
TexasDFW MSA
Source: American Community Survey, 2008
Social and Economic Characteristics
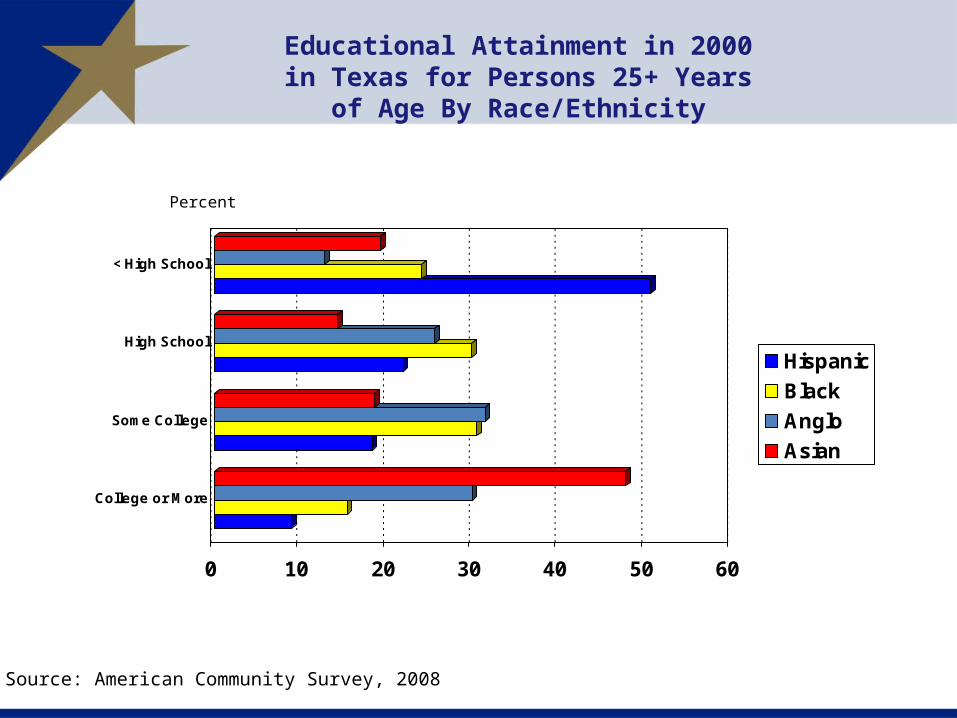
Educational Attainment in 2000 in Texas for Persons 25+ Years
of Age By Race/Ethnicity
0 10 20 30 40 50 60
< High School
High School
Some College
College or More
Hispanic
Black
Anglo
Asian
Percent
Source: American Community Survey, 2008
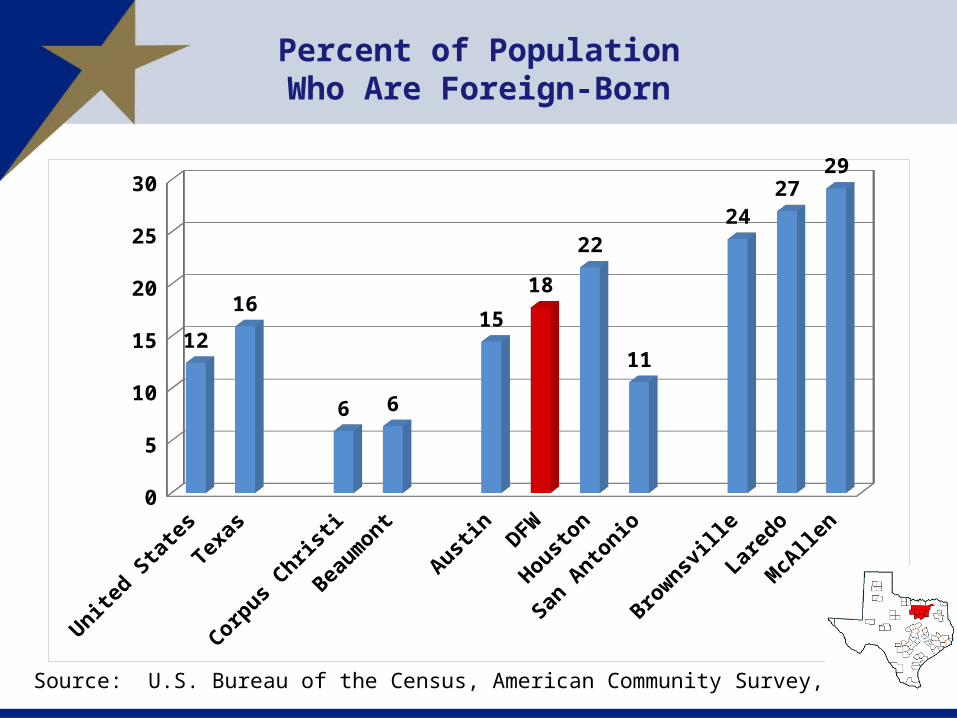
Percent of PopulationWho Are Foreign-Born
United St
ates
Texa
s
Corpus Chris
ti
Beaumont
Austin
DFW
Houston
San Antonio
Brownsville
Laredo
McAlle
n0
5
10
15
20
25
30
12
16
6 6
15
18
22
11
24
2729
Source: U.S. Bureau of the Census, American Community Survey, 2008
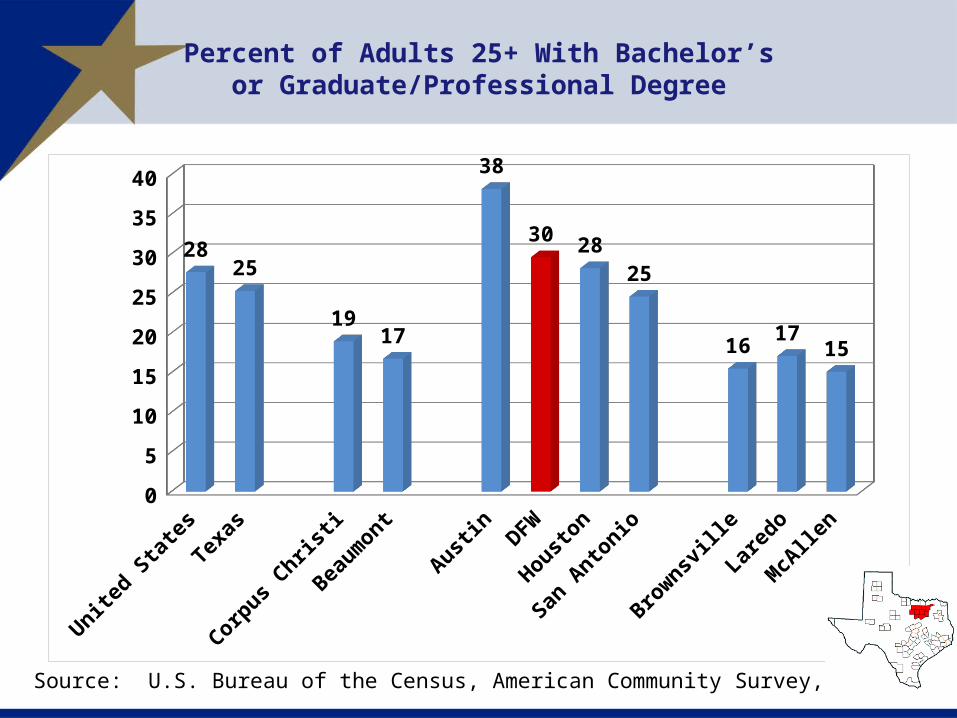
Percent of Adults 25+ With Bachelor’sor Graduate/Professional Degree
United St
ates
Texa
s
Corpus Chris
ti
Beaumont
Austin
DFW
Houston
San Antonio
Brownsville
Laredo
McAlle
n0
5
10
15
20
25
30
35
40
2825
1917
38
30 28
25
1617
15
Source: U.S. Bureau of the Census, American Community Survey, 2008
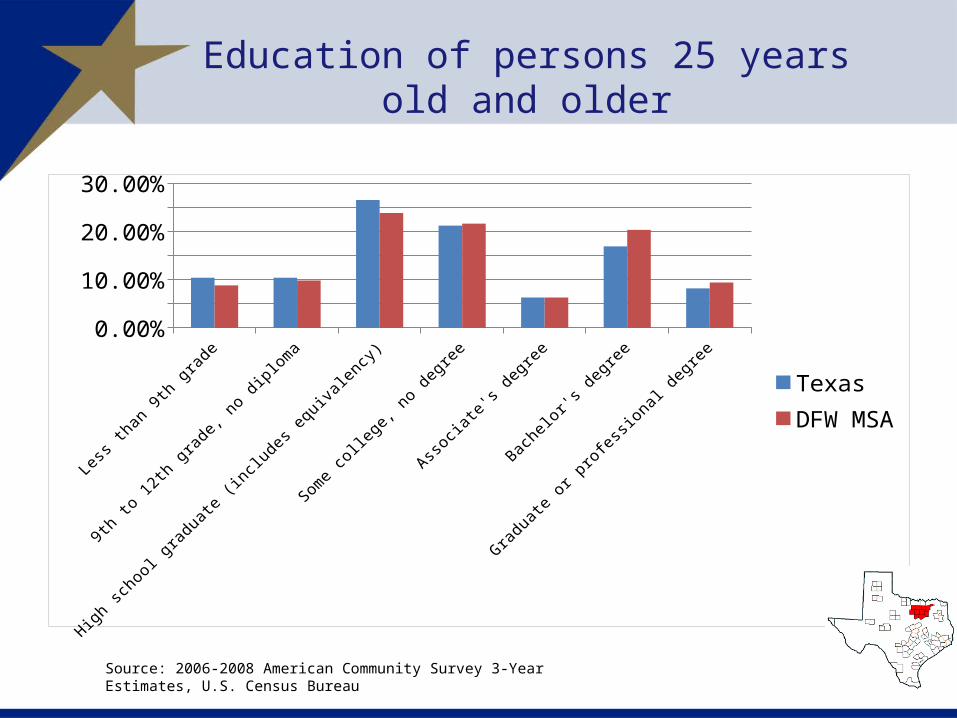
Education of persons 25 years old and older
Less
than 9th grade
9th to 12th gra
de, no diploma
High school g
raduate (in
cludes e
quivalency
)
Some co
llege, n
o degree
Associa
te's degre
e
Bachelor's
degree
Graduate or p
rofessi
onal degre
e0.00%
5.00%
10.00%
15.00%
20.00%
25.00%
30.00%
TexasDFW MSA
Source: 2006-2008 American Community Survey 3-Year Estimates, U.S. Census Bureau