northeast napa area: special groundwater study
TRANSCRIPT

Northeast Napa Area: Special Groundwater Study
Vicki Kretsinger Grabert
October 10, 2017
Overview
• Background • NE Napa Study • Findings • Recommendations
Acknowledgements LSCE Staff: • Reid Bryson • Barb Dalgish • Jeevan Jayakody • Ken Utley • Andrew Francis

Background: Northeast Napa Area
• Dec 2015: Review of GW data shows area of interest near MST Subarea
• Historical declines in 2 wells • Levels stabilized since 2009 • Petra Drive well replacements
• Several winery permit applications received by PBES in this area
• April 5, 2016: BOS Annual Report on the GW Monitoring Program
• Recommends Northeast Napa Special Study Area
Area of Interest

NV Subbasin, Northeast Napa Area & MST: Spring 2016
NapaCounty-2
6N/4W-27L2
NapaCounty-76 Faults

Northeast Napa Study
Northeast Napa Study Area
Napa Valley Subbasin
Study and GW Model to Evaluate: • Historical WL declines local area east of Napa River • Mutual well interference • Potential for affect from MST Subarea • Potential effects of pumping on streamflow • GW availability (esp. east of Napa River)

Land and Water Use

1987 and 2011 Land Use 1987 2011

1987 and 2011 Land Use and Irrigation 1987 2011

1987 and 2011 Land Use – Water Sources 1987 2011

Permitted and Proposed Wineries

Groundwater Flow Model

Geologic Setting
• Develop Hydrogeologic Conceptualization

Geologic Cross Section E-E’ E E’
Napa Valley Subbasin Extent

Geology and Layers 1-6
• Hydrogeologic Conceptualization
• Physical Basis for Model Structure
• Important Structural Features

Model Features: Detail Near Petra Drive
Petra Drive Area

Alluvium Thickness: Layers 1-3

Thickness of Older Formations Tertiary/Quaternary Deposits: Layers 4-5
Sonoma Volcanics: Layer 6

Horizontal Hydraulic Conductivity
Lower Capacity to Transmit Water
Low Moderate
Capacity to Transmit
Water

Permitted Surface Water
Diversions

Well Locations: Actual and
Inferred

Groundwater Demand:
Example July 2003

Water Level Targets for Calibration (examples)
East
Nap
a Fa
ult Z
one
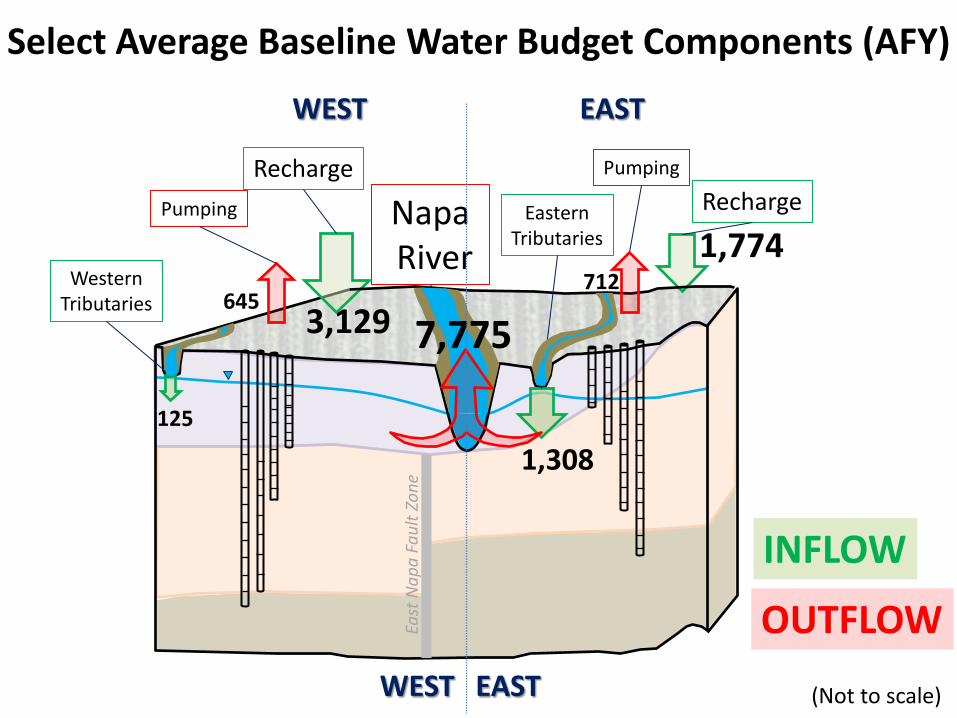
WEST EAST
WEST EAST
Western Tributaries
Eastern Tributaries
Napa River
Recharge Recharge Pumping
Pumping
(Not to scale)
Select Average Baseline Water Budget Components (AFY)
125
645 3,129
1,308
1,774
7,775 712
INFLOW
OUTFLOW

Average Annual Water Budgets: Baseline and 3 Scenarios
Discharge to Napa River: No Pumping
Discharge to Napa River: Double Pumping
Discharge to Napa River: 1988 Amt of Pumping
Discharge to Napa River: Baseline Pumping

Comparison of Water Budget Baseline Double Pumping
-6342 -6011 (All Streams)
Average Stream Leakage (GW Discharge to Streams) Only About 5% Different for Double Pumping Compared to Baseline Pumping Average Change in Groundwater Storage About in Balance
110 101

Simulated SW Flow: Baseline Model Gaining & Losing
Losi
ng
Stre
am
Gai
ning
Str
eam
Drier Years
Drier Years
Wetter Years
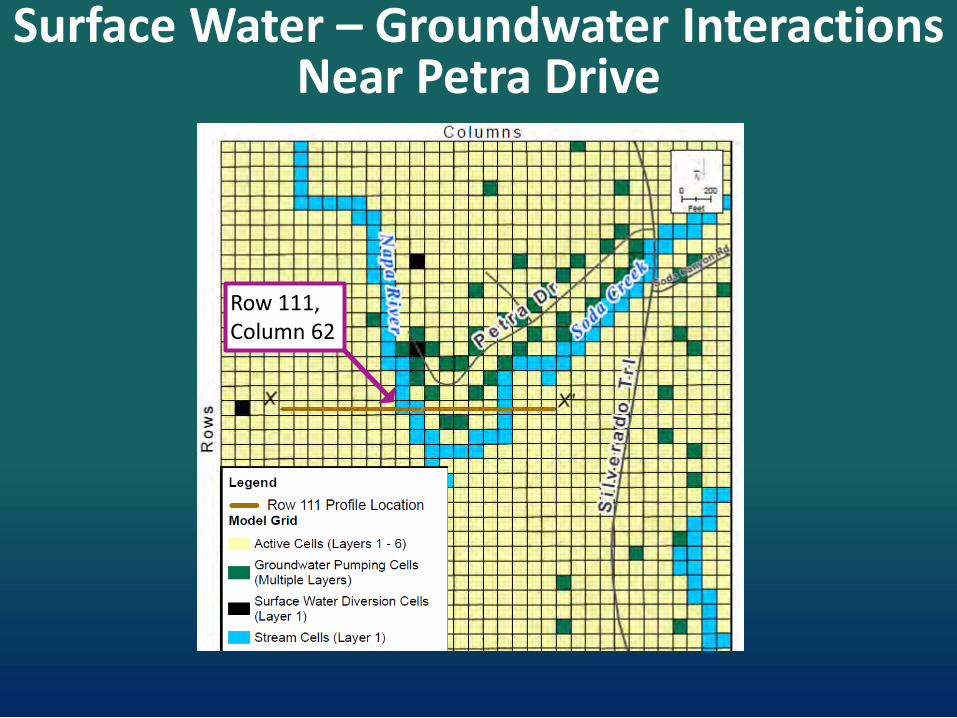
Surface Water – Groundwater Interactions Near Petra Drive
Row 111, Column 62

Profile X – X’ Near Petra Drive

Napa River Stage at Row 111, Col. 62 Baseline vs. No Pumping
Diff. ~0.01 ft in Sept.
Diff. ~0.014 ft in August

Water Table at Row 111, Col. 62 Baseline vs. No Pumping
Diff. ~0.048 ft in August
Diff. ~0.057 ft in August

NE Napa Area: Influence of Water Budget Components on GW-SW Interactions
The small variations between these scenarios indicates the primary role of climate-driven effects.

Proposed Management
Area • Conditions different than overall Napa Valley Subbasin • Management Area = NE Napa Area/ East of Napa River

Report: Findings NE Napa Study Area • GW storage change is ~ net-zero annually.
• Pumping is relatively small part of water budget.
• Recharge is 2nd largest water budget component.
• Within the model, GW discharge into the Napa River dominates the GW budget.
• Tributaries in the area most often recharge the GW on a seasonal basis. Tributaries east of Napa River consistently show net losing stream conditions. Soda Creek is more affected by climate, than pumping in determining the rate of stream leakage to GW.

Report: Findings (cont.)
• Starting in the late 1990s, a decrease in GW discharge to streams occurs. This recent trend can be attributed to less precipitation (climatic effects), including reduced recharge and subsurface lateral flows, rather than to pumping.
• Geologic faulting in the model area is important to the overall behavior of water levels east of Napa River. Additional concealed faults may be present, which may affect water levels in deeper wells in the Petra Drive area.

Report: Findings (cont.) • The modeling scenarios indicate the primary role of
climate–driven effects.
• Statistical analyses of model recharge, lateral flows and pumping relative to baseflow in Napa River show climate effects contribute to 87 to 92% of the effect on baseflow in Napa River, while pumping contributes to 8 to 13% of the effect on baseflow.
• Some drawdown in the Petra Dr. area is associated with mutual well interference (compounded by high well density). The lowered GW levels near Petra Dr. are not as significant as the regional influence of GW movement away from Petra Dr. towards the MST Subarea.

Report: Recommendations A. Surface Water/Groundwater Monitoring Facilities
– Construct shallow nested MWs (like LGA SW/GW) east of Napa River near Petra Drive
B. SGMA Management Area Designation – Management Area = Northeast Napa Area/East of Napa River – Meets criteria for designation due to geologic features and
aquifer parameters distinct from the Napa Valley Subbasin
C. Discretionary Project WAA Review in Management Area – For discretionary projects, recommend additional project-
specific analyses (WAA Tier 2) be conducted to ensure that proposed project location or planned GW use does not cause an undesirable result (i.e., may include water use criteria)

Report: Recommendations (cont.)
D. New Well Tracking in the Management Area – Track new non-discretionary groundwater wells constructed in
the Management Area, including planned usage and location. E. New Well Pump Testing
– Management Area, and also deeper geologic units in Napa Valley Subbasin
F. Groundwater Flow Model Development – Develop model for entire Napa Valley Subbasin
G. Increased Water Conservation and Recharge – Promote sustainable water use, including maintain/improve
ecosystem health. – Evaluate approaches stormwater management and increase
water conservation, create additional climate resiliency through targeted recharge strategies.
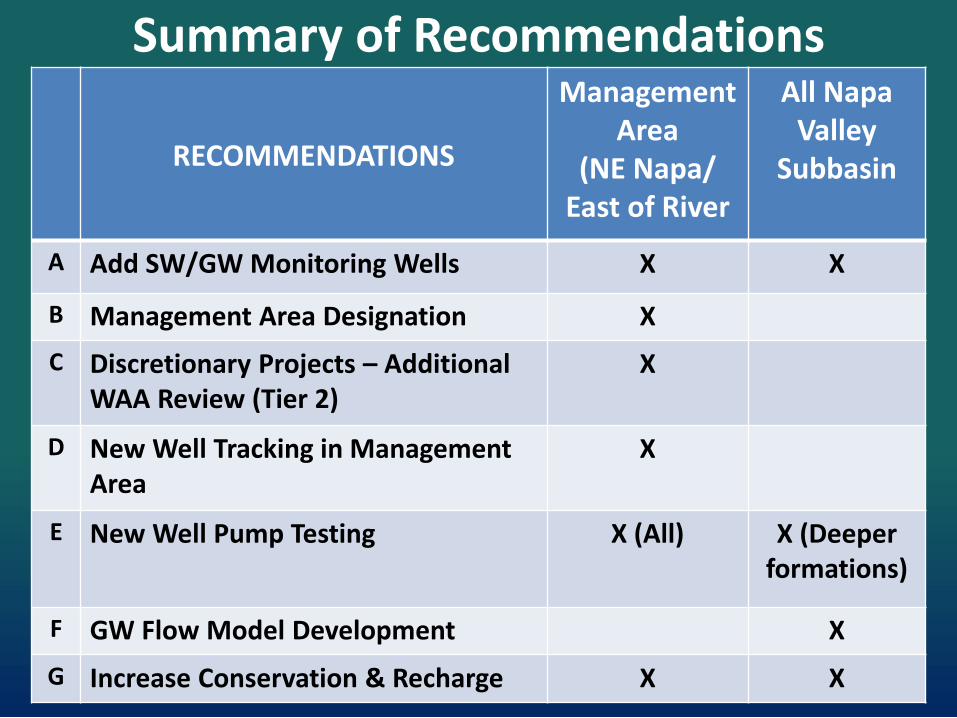
Summary of Recommendations
RECOMMENDATIONS
Management Area
(NE Napa/ East of River
All Napa Valley
Subbasin
A Add SW/GW Monitoring Wells X X
B Management Area Designation X C Discretionary Projects – Additional
WAA Review (Tier 2) X
D New Well Tracking in Management Area
X
E New Well Pump Testing X (All) X (Deeper formations)
F GW Flow Model Development X G Increase Conservation & Recharge X X

Thank You