northeast regional expert team education development center, inc. 55 chapel street newton, ma...
TRANSCRIPT

Northeast Regional Expert TeamEducation Development Center, Inc.55 Chapel StreetNewton, MA 02458-1060888-EDC-CAPT
CSAP’s Center for the Application of Prevention Technologies
Tools and Tales: Measuring the Success of Environmental Strategies
Chuck Klevgaard, Regional Coordinator
Pamela Imm, CAPT Associate
Erica Schmitz, CAPT Associate
CADCA’s 20th Annual National Leadership ForumFebruary 8-11, 2010National Harbor, MD

CSAP’s Center for the Application of Prevention Technologies
Objectives
1. To understand recent advances in the field associated with the selection, implementation and evaluation of environmental strategies.
2. To understand specific evaluation methods, strategies and tools that can be used to measure short- and long-term outcomes applicable to particular environmental strategies.
3. To understand how communities can successfully implement environmental strategies that can be linked to community- and state-level outcomes.
CSAP’s Center for the Application of Prevention Technologies
The CAPT’s Role
• Builds the capacity of state TA and training systems to select and implement environmental strategies at the local level
• Provides trainings to local state grantees on the selection, implementation and evaluation of environmental strategies
• Provides networking opportunities for grantees implementing environmental strategies across states.

CSAP’s Center for the Application of Prevention Technologies
What is Getting To Outcomes (GTO)?
• GTO is a system based on 10 accountability questions that include elements of successful planning, implementation, and evaluation
• Manuals published by the RAND Corporation
• Primary Authors: Pam Imm, Matthew Chinman, Abe Wandersman

CSAP’s Center for the Application of Prevention Technologies
Background of Getting to Outcomes
• Initially published by CSAP in 1999 for the Drug Free Community Grantees
• Updated versions including 2007: Getting to Outcomes for Underage Drinking and other contents are available (e.g., pregnancy prevention, youth development)
• American Evaluation Association 2008 - Outstanding Publication

CSAP’s Center for the Application of Prevention Technologies
Accountability Questions®
• What are the underlying needs and conditions that must be addressed? (NEEDS/RESOURCES)
• What are the goals, target populations, and desired outcomes? (GOALS)
• What evidence-based programs/practices can be useful in achieving the goals? (PRACTICES)

CSAP’s Center for the Application of Prevention Technologies
Accountability Questions® (continued)
• How do these programs/practices fit with existing initiatives? (FIT)
• What capacities are needed to implement these selected programs/practices? (CAPACITIES)
• What is the plan for implementing these programs/practices? (PLAN)

CSAP’s Center for the Application of Prevention Technologies
Accountability Questions® (continued)
• How will the quality of the implementation be assessed? (PROCESS EVALUATION)
• How well is it working? (OUTCOME EVALUATION)
• How will continuous quality improvement strategies be incorporated? (CQI)
• If successful, how will the programs/outcomes be sustained? (SUSTAIN)

CSAP’s Center for the Application of Prevention Technologies
Getting to Outcomes Circle Chart

CSAP’s Center for the Application of Prevention Technologies
Who Uses Getting To Outcomes?
• Community coalitions
• State level agencies
• Program directors
• Funders to promote accountability
• Viewed as a way to operationalize the Strategic Prevention Framework (SPF)

CSAP’s Center for the Application of Prevention Technologies
Evidence-Based Environmental Strategies
• Compliance Checks
• Alcohol Outlet Density
• Responsible Beverage Service
• Social Host Laws
• Sobriety Checkpoints/Traffic Safety Checkpoints
CSAP’s Center for the Application of Prevention Technologies
Evidence-Based Environmental Strategies (contd.)
• Happy Hour Restrictions
• Restricting Alcohol Availability at Events
• Increasing Taxes on Alcohol
• Graduated Driver’s Licensing Laws
• Keg Registration

CSAP’s Center for the Application of Prevention Technologies
Accessing Getting To Outcomes
RAND Corporation
• www.rand.org/publications/TR/TR/101 (General ATOD prevention)
• www.rand.org/publications/TR/TR403 (underage drinking prevention
• www.search-institute.org (youth development)

CSAP’s Center for the Application of Prevention Technologies
Population-Level Data
• Maine Youth Drug and Alcohol Use Survey (MYDAUS)
• Portland Parent Phone Survey
• Law Enforcement Violations
Complemented by 1x1, focus groups, anecdotal

Assessment/Baseline: Youth Perceptions
• Alcohol is easy to get
• Won’t get caught by police
• Won’t get caught by parents
Source: Grades 6-12, Portland Public Schools, Maine Youth Drug and Alcohol Use Survey, 2004

Assessment/Baseline: Parent Perceptions
• Teen drinking is inevitable.
• Dangers: legal trouble, drinking/driving.
• I can’t influence teen’s choices about alcohol.
• I don’t know what actions to take.
• Better to teach my kid to drink responsibly.
• Supervise & take the keys.
Source: Portland Parent Phone Survey, 2006

Assessment/Baseline: Enforcement
• 12 underage drinking violations per year
• 3 furnishing/hosting violations per year
• No liquor enforcement with retailers
Source: Portland Police Department, 2004 Violations

CSAP’s Center for the Application of Prevention Technologies
Planning/Strategic Priorities
• Strengthen enforcement (& youth perception that they’ll be caught)
• Strengthen parental monitoring (& youth perception that they’ll be caught)
• Reduce availability (& youth perception that it’s easy to get)

CSAP’s Center for the Application of Prevention Technologies
Implementation: Multi-Strategy Approach
• Collaboration/Outreach
• Policy (PD, DA, retailers, schools)
• Training (officers, retailers, seller/servers)
• Enforcement
• Media advocacy
• Marketing, information dissemination
FMI: www.21reasons.org

CSAP’s Center for the Application of Prevention Technologies
Outcome Evaluation
Did we strengthen enforcement?
… And youth perception that they’ll be caught?

0
20
40
60
80
100
2003 2004 2005 2006 2007
Viol
atio
ns
Source: Portland Police Department
Results from Enforcement DataUnderage Drinking Violations

Results: Student Survey Data“I would be caught by police”
Source: 2004, 2006, 2008 MYDAUS, Grades 6-12

CSAP’s Center for the Application of Prevention Technologies
Outcome Evaluation
Did we reduce availability?
…And youth perception that it’s easy to get?

02468
1012141618
2003 2004 2005 2006 2007
Vio
latio
ns
Source: Portland Police Department
Results From Enforcement DataFurnishing and Hosting Violations
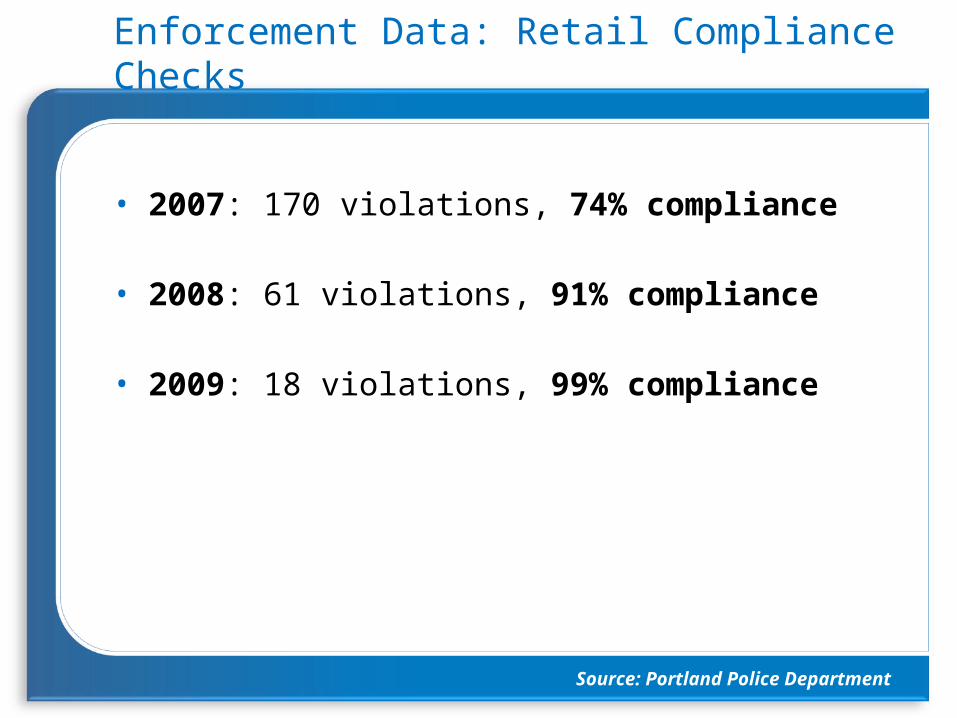
Enforcement Data: Retail Compliance Checks
• 2007: 170 violations, 74% compliance
• 2008: 61 violations, 91% compliance
• 2009: 18 violations, 99% compliance
Source: Portland Police Department

RESULTS: Student Survey DataAvailability: “Alcohol is hard or very hard to get”
Source: 2004, 2006, 2008 MYDAUS, grades 11 and 12

CSAP’s Center for the Application of Prevention Technologies
Outcome Evaluation
Did we strengthen parental
monitoring?
…And youth perception that they’ll be caught?

RESULTS: Parent Survey, Attitudes
• 40% increase in AGREE: “I have the ability to influence my teen’s decisions about alcohol.”
• 130% increase in STRONGLY DISAGREE: “My job isn’t to prevent my teen from drinking. Rather it’s to teach my teen to drink responsibly.”
Source: Parent Survey, 2006-2008

RESULTS: Parent SurveyConcern Regarding Long-Term Effects
0%
5%
10%
15%
20%
25%
2006 2008
May Negatively Affect Brain Development
May Lead to Depression or Suicide
May Move on to Other Drugs
May Become Addicted
Source: Parent Survey, 2006-2008
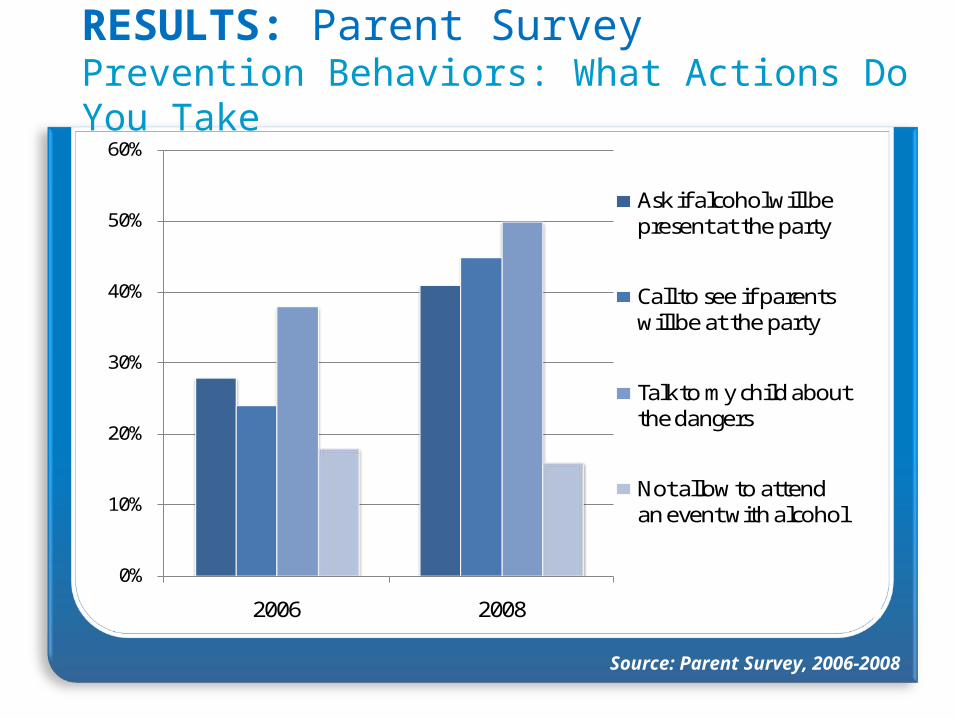
RESULTS: Parent SurveyPrevention Behaviors: What Actions Do You Take
0%
10%
20%
30%
40%
50%
60%
2006 2008
Ask if alcohol will be present at the party
Call to see if parents will be at the party
Talk to my child about the dangers
Not allow to attend an event with alcohol
Source: Parent Survey, 2006-2008
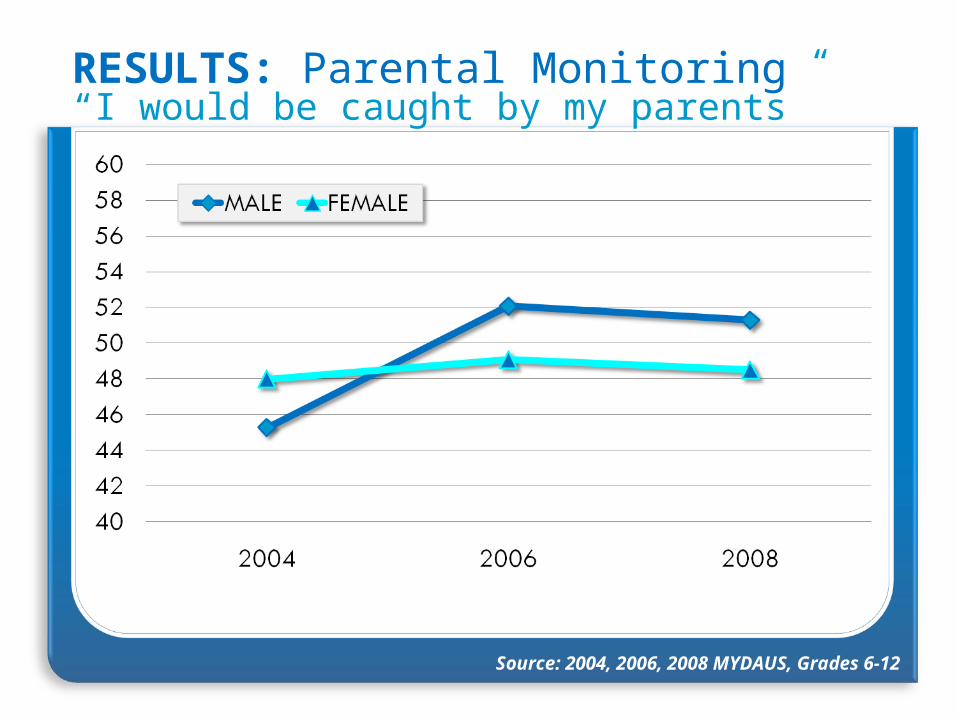
RESULTS: Parental Monitoring“I would be caught by my parents”
Source: 2004, 2006, 2008 MYDAUS, Grades 6-12

Outcome Evaluation
Did we reduce underage drinking?

2022242628303234363840
2004 2006 2008
Source: 2004, 2006, 2008 Portland MYDAUS, Grades 6-12
RESULTS: Student Survey Data30-Day Alcohol Use

0
5
10
15
20
25
2004 2006 2008
Source: 2004, 2006, 2008 Portland MYDAUS, Grades 6-12
RESULTS: Student Survey DataTwo Week Binge Drinking

CSAP’s Center for the Application of Prevention Technologies
Portland vs. Statewide Trends
SPF-SIG Funding focused on similar strategies across Maine
• Implementation started 2006; 2-year delay compared to Portland
Maine data shows similar trend• 2-year lag compared to Portland

CSAP’s Center for the Application of Prevention Technologies
For More Information
Maine's Environmental Substance Abuse Prevention Center (MESAP) Training, Consulting, Technical [email protected] - Erica Schmitz
21 Reasons Data & Reportswww.21reasons.org
Maine Evaluation Reportswww.maineosa.org