northern agriculture and westward expansion. accounting for growth between 1840-1860, – 49% growth...
TRANSCRIPT
Northern Agriculture and Westward Expansion
Accounting for Growth
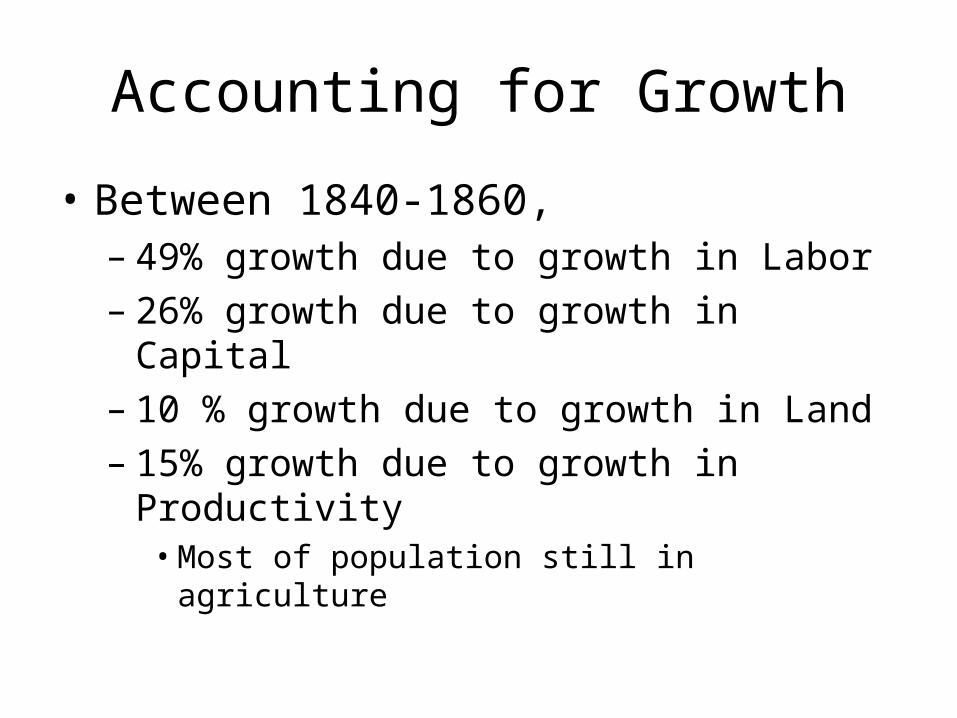
• Between 1840-1860,– 49% growth due to growth in Labor– 26% growth due to growth in Capital– 10 % growth due to growth in Land– 15% growth due to growth in Productivity
• Most of population still in agriculture

Increases in Agricultural Productivity
• Growth of Markets due to reduction in transportation costs
• New Land• Technological Change
– Mechanization– New techniques– Plant breeding


Land Policy
• Louisiana Purchase of 1803 doubled the size of country
• New Questions– Distribution of Public Land– Government of new territory
Land Distribution
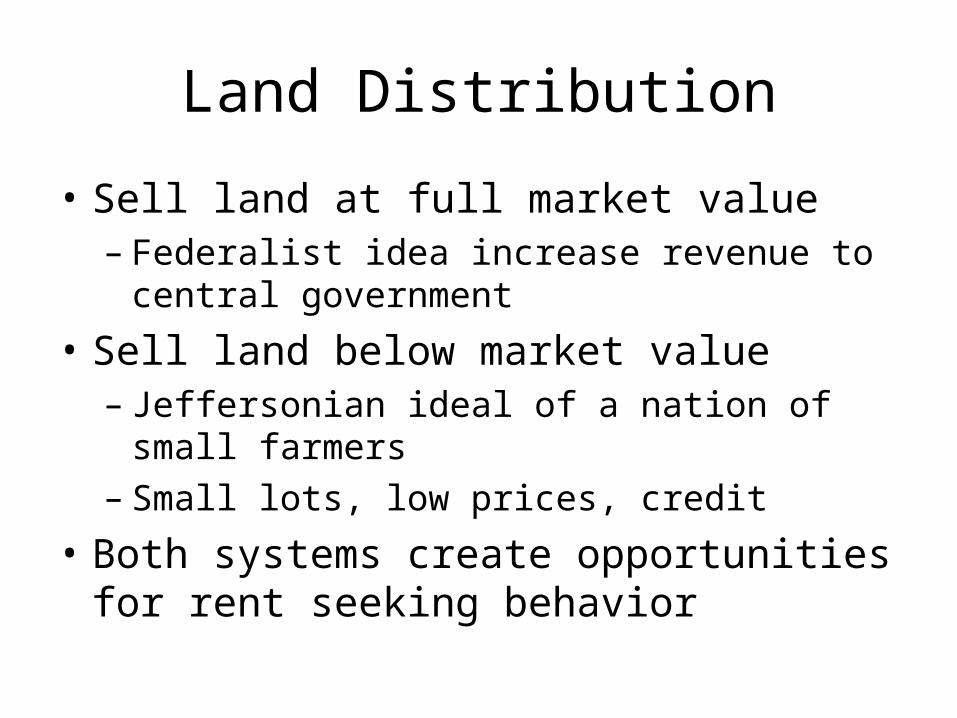
• Sell land at full market value– Federalist idea increase revenue to central
government
• Sell land below market value– Jeffersonian ideal of a nation of small farmers– Small lots, low prices, credit
• Both systems create opportunities for rent seeking behavior

• Set price at profit maximizing level creates rents for existing government– Demand curve may not be known
• Low price encourage speculators– What happens when price is set below the market
level?– Qd>Qs, rationing of some type is necessary

Pattern of settlement
• New England model-orderly settlement– Land Ordinance of 1785 – Surveyed parcels, public auction– Lots of corruption
• Difficult to enforce rules
– Lots of Changing rules– Federal Government never makes much money

Distributional effects
• If land in West is better than the East– Wages rise– Rents in East decline
• Fogel and Ruttner model

Too much cheap land?
• Were settlers rational?– Returns of agricultural investment about the same
as other investments
• Cost of land was a small part of farm– Clearing land, capital, transportation costs
• Land speculation– Informational asymmetry– Some got rich, some did not

Increases in Agricultural Productivity
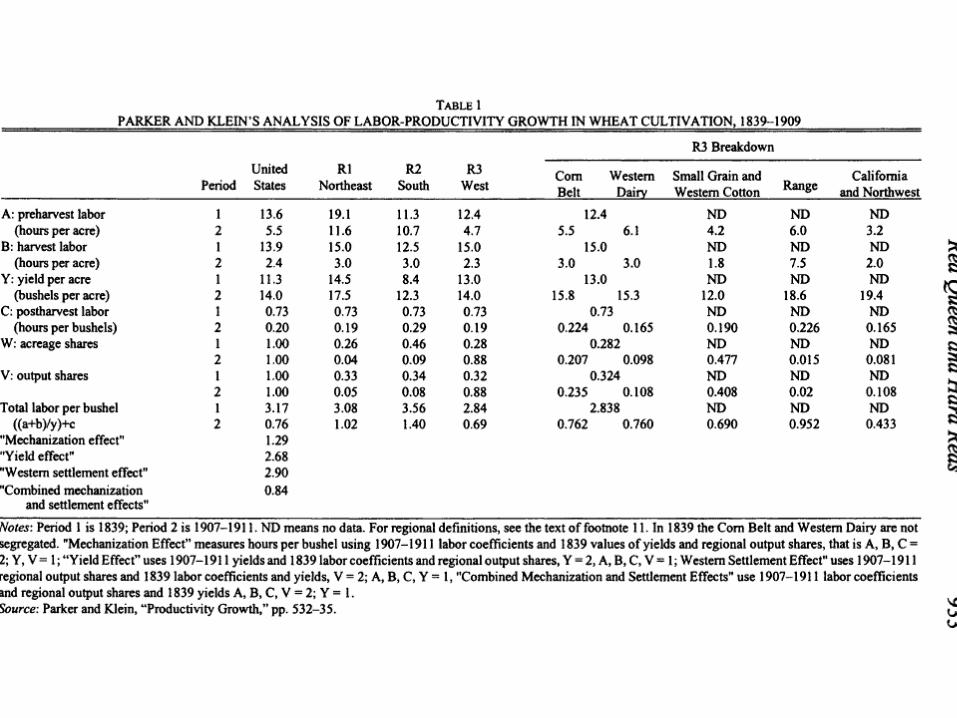
• Parker and Klein• Divided labor productivity into three part
– # acres plowed and harvested per worker– Yield per acre– # of bushels threshed and prepared for market
per worker
• Used this to come up with labor productivity data for three crops, oats, corn and wheat

Results
• Oats- Q/L increased 365 percent from 1840-1860 to 1900-1910
• Wheat- Q/L increased 417 percent from 1840-1860 to 1900-1910
• Corn- Q/L increased 363 percent from 1840-1860 to 1900-1910

Where did most of this increase come from?
• Assume increases acres plowed, harvested threshed came from mechanization
• Increases in yield per acre came from selective breeding and changes in location
• Find that most of increase comes from mechanization
Mechanization
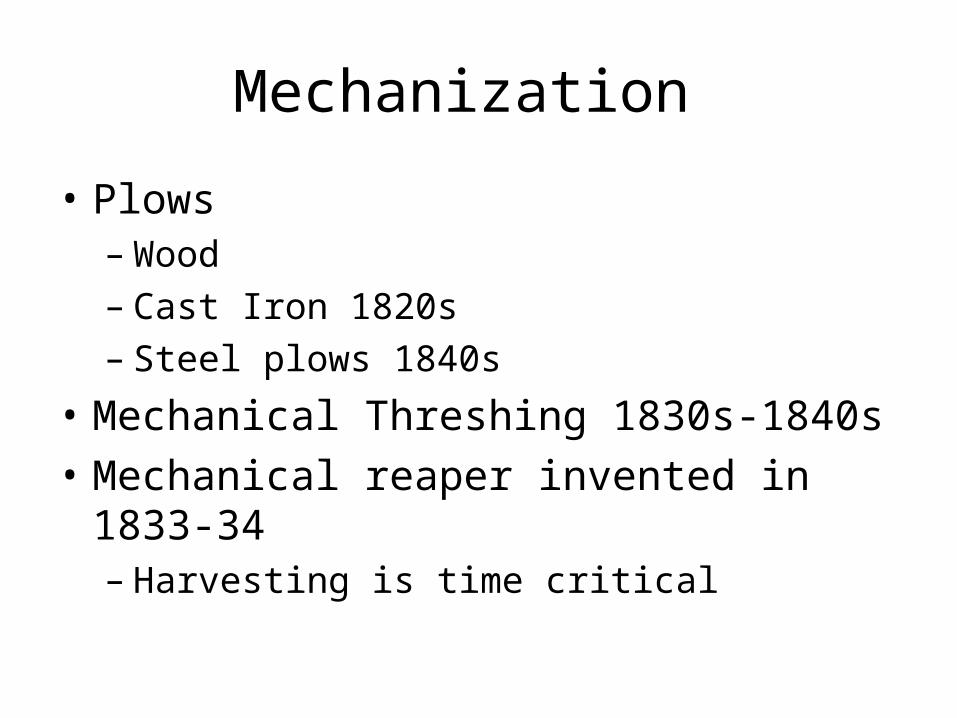
• Plows– Wood– Cast Iron 1820s– Steel plows 1840s
• Mechanical Threshing 1830s-1840s• Mechanical reaper invented in 1833-34
– Harvesting is time critical

Reaper
• By 1850 only 3,373 sold• 1845-1857 73,200 sold
– Most after 1850 (70,000)
• Why was diffusion so slow until 1850 and then speeds up?

What size farm will use Reaper
• Must be large enough (graph)• Why not increase size?
– Cost of land– Cost of labor– Lack of demand
• Suggests reapers not used earlier because wages were low and demand was low
Paul David
• Was St> actual farmsize• Did something happen in 1850 to change St or
farmsize?

Computing threshold size
• Cost of reaper was – C=(d+i)Pr
• D=depriciation• i=interest rate• Pr=price of reaper
– Benefit • B=StLsW
– St=threshold size– Ls=labor saved– W=wage
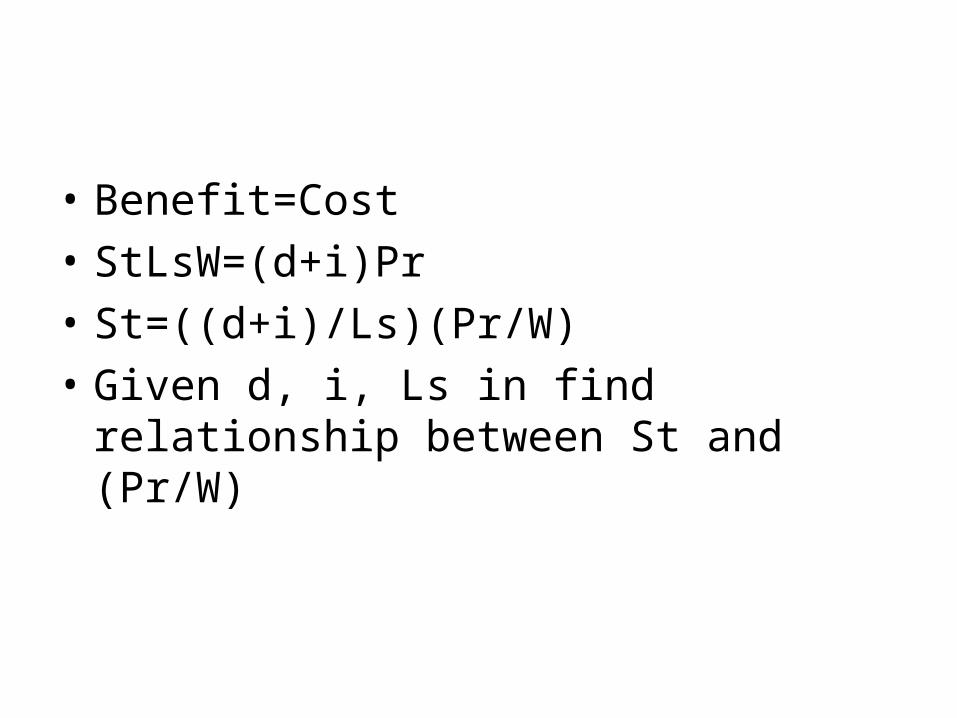
• Benefit=Cost• StLsW=(d+i)Pr• St=((d+i)/Ls)(Pr/W)• Given d, i, Ls in find relationship between St
and (Pr/W)

Pr/W
Acres
73.81857
35
97.61850
46.5
In 1850 Average farm size in Illinois is 15-16 acres. Because of W increase, St fell to 35 by 1857, average farm size increase to 25-30

Increases in Demand
• Increase in farm size caused by increase in demand from Europe
• Increase use of Railroads cause reduction in transportation costs
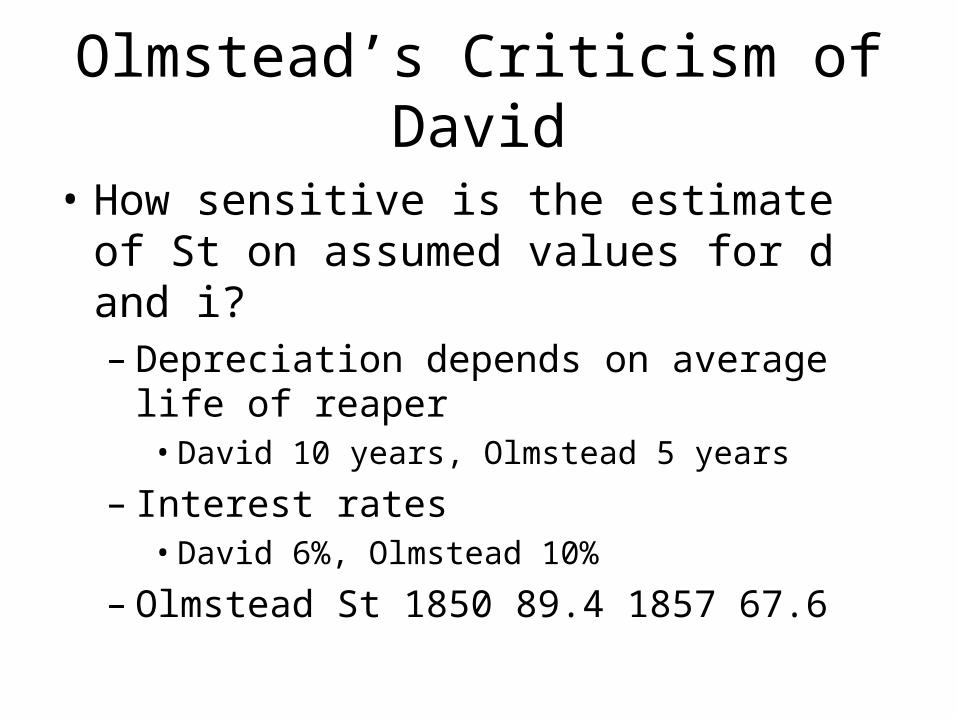
Olmstead’s Criticism of David
• How sensitive is the estimate of St on assumed values for d and i?– Depreciation depends on average life of reaper
• David 10 years, Olmstead 5 years
– Interest rates• David 6%, Olmstead 10%
– Olmstead St 1850 89.4 1857 67.6

Average farmsize Vs distribution
• Lewis Jones • Looks at distribution of farms to find number
of farms above St• Manuscript Census data• Finds if David is correct there are too few
reapers and if Olmstead is correct there are too many
Sharing
• Was it possible to share reapers?• Problems
– Common property– Opportunistic Behavior
• Who’s crop is harvested if the storm is coming?
• Evidence suggests sharing did occur• Rental market for reapers• Reapers adoption probably demand driven
Was Mechanization only important source of productivity advance?
• The Red Queen and the Hard Reds: Productivity Growth in American Wheat, 1800-1940
• Alan L. Olmstead and Paul W. Rhode • The Journal of Economic History, Vol. 62, No.
4 (Dec., 2002), pp. 929-966

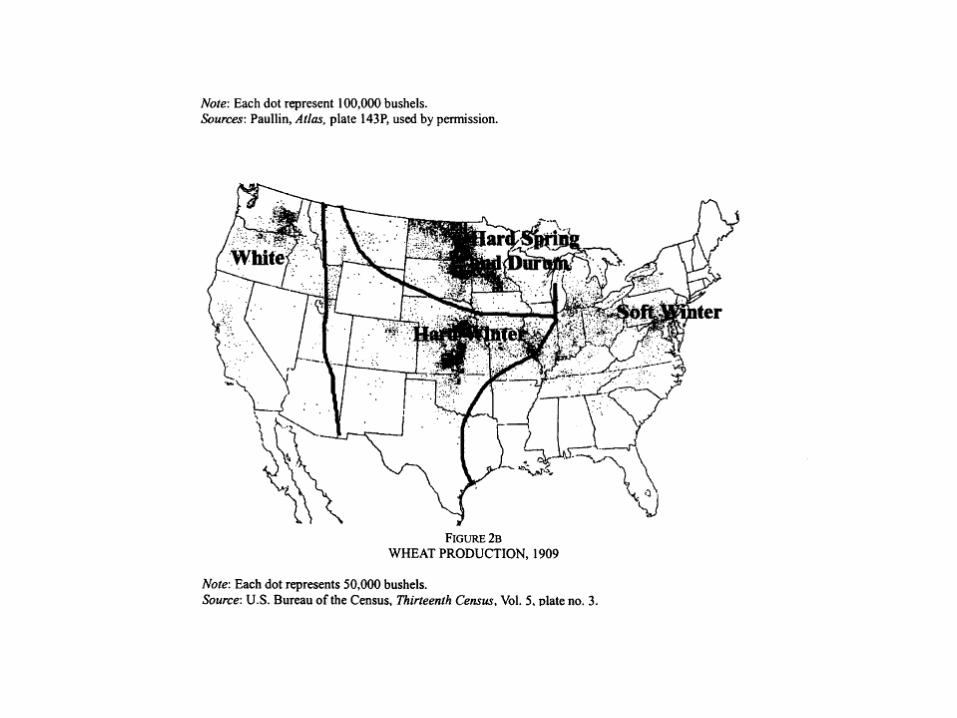
• Wheat production from 1839 to 1909 increased from 85 million to 640 million bushels
• Geographic area changed


Problem with Parker-Klein
• In 1839 not much data, so the western region is defined as anything west of Ohio
• Do not have data on hours per acres for west in 1839
• Assume no change

• Ignores role of biological changes in seeds which allowed wheat to be grown in these region
• Also ignores role of biological changes in seeds in maintaining yield – Red Queen

Climate is very different in these areas

Need new varieties of wheat
• To with stand different climate• Also to with stand disease
– Curse of the Red Queen– Rust
• Problems as early as late 1600s– Loss 10-15 % in normal year, could be as high as
30% in epidemic year– Insects like the Hessian Fly– Needed to be able to plant wheat earlier
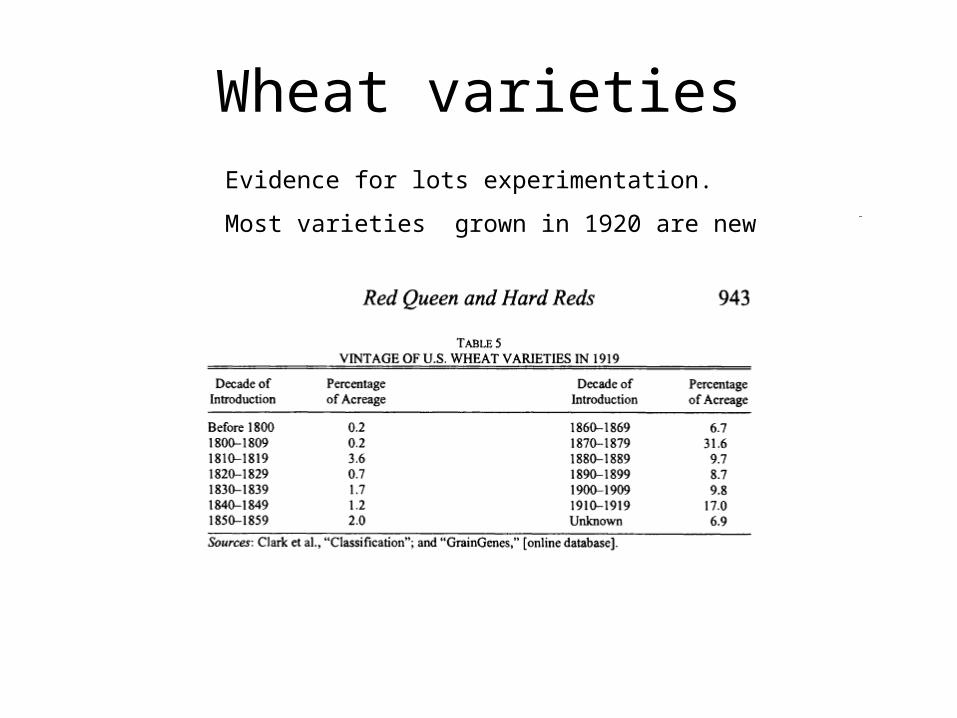
Wheat varietiesEvidence for lots experimentation.
Most varieties grown in 1920 are new
Source of New Varieties
• Seed companies• US and State Departments of Agriculture