northern brownsville transportation study - new … brownsville transportation study ... 4-1 traffic...
TRANSCRIPT

Northern Brownsville
Transportation Study
EXISTING AND FUTURE CONDITIONS
WITH RECOMMENDATIONS
FINAL REPORT
September 2012
A Member of the New York
Metropolitan Transportation Council

Northern Brownsville Transportation Study
Existing and Future Conditions
with Recommendations
PTDT09D00.G20
The preparation of this report has been financed in part through funds from the U.S.
Department of Transportation, Federal Highway Administration under the Federal Highway
Act of 1965, as amended, and the Urban Mass Transportation Act of 1964, as amended. The
New York City Department of Transportation (NYCDOT) disseminates this document in the
interest of information exchange. It reflects the views of NYCDOT, which is responsible for
the facts, and the accuracy of the data presented. The report does not necessarily reflect any
official views or policies of the Federal Transit Administration, the Federal Highway
Administration, or the State of New York. This report does not constitute a standard,
specification, or regulation.
Prepared by:
New York City Department of Transportation
Janette Sadik-Khan, Commissioner
Lori Ardito, First Deputy Commissioner
Bruce Schaller, Deputy Commissioner
Ryan Russo, Assistant Commissioner
Joseph Palmieri, Brooklyn Borough Commissioner
Naim Rasheed, Project Director
Michael Griffith, Deputy Project Director
Milorad Ubiparip, Project Manager
Carren Simpson, Highway Transportation Specialist
Ali Jafri, Highway Transportation Specialist
Hau Cho Li, City Planner
Asheque Rahman, Intern

TABLE OF CONTENTS
Page
EXECUTIVE SUMMARY ....................................................................................................... i
1.0 INTRODUCTION ........................................................................................................... 1-1
1.1 Background ................................................................................................................ 1-1
1.2 The Study Area .......................................................................................................... 1-1
1.3 Goals of the Study ...................................................................................................... 1-4
1.4 Objectives of the Study .............................................................................................. 1-4
1.5 Project Organization and Methodology ..................................................................... 1-4
2.0 DEMOGRAPHIC ANALYSIS ...................................................................................... 2-1
3.0 ZONING AND LAND USE ............................................................................................ 3-1
3.1 Zoning ......................................................................................................................... 3-1
3.2 Land Use ...................................................................................................................... 3-2
4.0 TRAFFIC AND TRANSPORTATION ......................................................................... 4-1
4.1 Introduction ................................................................................................................ 4-1
4.2 Traffic Network Volumes .......................................................................................... 4-3
4.3 Level of Service (LOS) Analysis ............................................................................... 4-8
4.4 Existing Traffic Conditions...................................................................................... 4-10
4.5 Future Traffic Conditions ........................................................................................ 4-13
4.6 Goods Movement ..................................................................................................... 4-20
5.0 PEDESTRIAN AND BICYCLE ANALYSES .............................................................. 5-1
5.1 Introduction ................................................................................................................ 5-1
5.2. Pedestrian Analysis .................................................................................................... 5-1
5.3 Bicycle Analysis ...................................................................................................... 5-10

6.0 ACCIDENTS AND SAFETY ANALYSIS .................................................................... 6-1
6.1 Introduction ................................................................................................................ 6-1
6.2 Accident History (2007-2009) ................................................................................... 6-1
7.0 PARKING ANALYSIS ................................................................................................... 7-1
7.1 Introduction ................................................................................................................ 7-1
7.2 Off-Street Parking ...................................................................................................... 7-1
7.3 On-Street Parking....................................................................................................... 7-6
8.0 PUBLIC TRANSPORTATION ..................................................................................... 8-1
8.1 Introduction ................................................................................................................ 8-1
8.2 Surface Transit (Bus Service) .................................................................................... 8-1
8.3 Subways and Commuter Railroad (LIRR) Services .................................................. 8-3
9.0 RECOMMENDATIONS ................................................................................................ 9-1
10.0 CONCLUSION ...............................................................................................................10.1

LIST OF TABLES
Table Page
2-1 Population by Area and Age Group ................................................................................... 2-1
2-2 Median Household Income by Area .................................................................................. 2-1
2-3 1990 and 2000 Journey to Work by Mode......................................................................... 2-2
4-1 Level of Service Criteria for Signalized Intersections ....................................................... 4-9
4-2 LOS Analysis for Signalized Intersections (2008 Existing Conditions) ......................... 4-11
4-3 LOS Analysis for Signalized Intersections (2018 Future Conditions) ............................ 4-18
5-1 Existing Pedestrian Volumes - Crosswalk and Corner ...................................................... 5-2
5-2 Pedestrian Level of Service Criteria for Crosswalks and Corners ..................................... 5-7
5-3 Existing Crosswalk LOS Analysis .................................................................................... 5-8
5-4 Existing Corner LOS Analysis........................................................................................... 5-9
6-1 Accident History in the Study Area (2007-2009) .............................................................. 6-2
6-2 Summary of Injuries (2007-2009) ..................................................................................... 6-4
6-3 Pedestrian Accidents (2007-2009) ..................................................................................... 6-5
6-4 Accidents by Collision Type (2007-2009) ......................................................................... 6-7
7-1 Off-Street Parking Facilities by Type, Location, Capacity and Utilization ...................... 7-4
7-2 On-Street Parking Regulations and Codes ......................................................................... 7-7
7-3 On-Street Parking Capacity and Utilization ................................................................... 7-12
8-1 Average Frequency of NYCT Bus Service ........................................................................ 8-1
9-1 Improvement Measures ...................................................................................................... 9-3
9-2 Recommendations Tracking Sheet .................................................................................. 9-17

LIST OF FIGURES Figure Page
1-1 Northern Brownsville and Utica/Weeksville Transportation Study Areas ....................... 1-2
1-2 Study Area Boundaries and Major Arterials .................................................................... 1-3
3-1 Existing Zoning ................................................................................................................. 3-1
3-2 Existing Land Use ............................................................................................................ 3-3
4-1 Traffic Count Locations ................................................................................................... 4-2
4-2 Existing Traffic Volumes - AM Peak Hour ..................................................................... 4-4
4-3 Existing Traffic Volumes - Midday Peak Hour ................................................................ 4-5
4-4 Existing Traffic Volumes - PM Peak Hour ....................................................................... 4-6
4-5 Existing Traffic Volumes - Saturday Midday Peak Hour ................................................. 4-7
4-6 Future Traffic Volumes - AM Peak Hour ....................................................................... 4-14
4-7 Future Traffic Volumes - Midday Peak Hour ................................................................. 4-15
4-8 Future Traffic Volumes - PM Peak Hour ........................................................................ 4-16
4-9 Future Traffic Volumes - Saturday Midday Peak Hour .................................................. 4-17
4-10 Local and Through Truck Routes .................................................................................... 4-20
5-1 Existing Pedestrian Volume – AM Peak Hour .................................................................. 5-3
5-2 Existing Pedestrian Volume - Midday Peak Hour ............................................................ 5-4
5-3 Existing Pedestrian Volume - PM Peak Hour ................................................................... 5-5
5-4 Existing Pedestrian Volume - Saturday Midday Peak Hour ............................................. 5-6
5-5 Existing Bicycle Routes .................................................................................................. 5-10
6-1 Accident Locations (2007-2009) ....................................................................................... 6-3
6-2 Injuries Accident Locations .............................................................................................. 6-4
6-3 Pedestrian Accident Locations (2007-2009) ..................................................................... 6-6
7-1 Off-Street Parking Facilities .............................................................................................. 7-2
7-2 On-Street Parking Regulations .......................................................................................... 7-8
7-3 Alternate Side Parking Regulations ................................................................................. 7-9
7-4 Corridors with Rush Hour Regulations ........................................................................... 7-10
7-5 On-Street Parking Capacity and Utilization ................................................................... 7-11
8-1 Local Bus Routes/Subway Routes and Stations ................................................................ 8-2
9-1 Locations for Proposed Improvements ............................................................................. 9-2
9-2 Eastern Parkway and Saratoga Avenue/Sterling Place ..................................................... 9-6
9-3 Atlantic Avenue and Rockaway Avenue .......................................................................... 9-8
9-4 Pitkin Avenue and Rockaway Avenue ............................................................................ 9-10
9-5 Eastern Parkway and Thomas Boyland Avenue - Proposed Pedestrian Plaza ................ 9-15

i
EXECUTIVE SUMMARY
1.0 Introduction
The Northern Brownsville Transportation Study was initiated at the request of Brooklyn
Community Board 16 to improve traffic operations, relieve congestion, address parking, and
improve safety for all street users (motorists, cyclists, pedestrian, and transit). The purpose
of the study was to assess the existing and future traffic conditions, identify issues and
develop effective solutions to address these issues. The study area is located in the northeast
section of Brooklyn, bounded by Atlantic Avenue to the north, Mother Gaston Avenue to the
east, Pitkin Avenue to the south, and Howard Avenue to the west. The assessment of
existing conditions includes an analysis of demographics, land use and zoning, vehicular
traffic, pedestrians and bicycles, accidents and safety, on- and off-street parking, and public
transportation.
2.0 Demographic Analysis
Completely within Community District 16, the study area overlaps the neighborhoods of
northern Brownsville and southern Ocean Hill, and includes nine census tracts. The
demographic analysis of the study area examined population trends from 1990 and 2000
Census data. During this time, the population in the study area increased 5% from 16,728 to
17,589; household size decreased slightly from 2.02 to 1.88 (person/household); and
household income increased 18% from $15,837 to $18,765. In 1990, for journey to work,
62% of the study area population used public transit (41% subway, 19% buses and 2%
railroad/ferry/taxi) and 30% used private automobiles, while 8% used other modes. In 2000,
66% of the study area population used public transit for journey to work (44% subway, 18%
buses and 4% railroad/ferry/taxi). Private automobile was used by 27%, while 7% used other
modes for journey to work.
3.0 Zoning and Land Use
A review of existing land use and zoning reveals that the predominant land use in the study
area is residential (R6). There are small pockets of commercial uses (C8-2, C4-3) in the
southern portion, and manufacturing uses (M1-1) in the northwest and eastern portions of the

ii
study area. Pitkin Avenue serves as the main commercial corridor in the study area.
Recently implemented and planned residential developments may contribute to increase
traffic in the study area, although there are limited vacant lots that would attract future
developments.
4.0 Traffic
To analyze the existing traffic conditions in the study area, basic roadway characteristics
were surveyed along with traffic controls, traffic volumes, parking, transit, and pedestrian
activity. The traffic data collection plan included Automatic traffic recorders (ATRs),
manual turning movement counts, vehicle classification counts (i.e. auto, bikes, trucks, and
buses), and pedestrian counts for specified peak periods (AM, midday, PM, and Saturday
midday). The highest volumes were observed along the Atlantic Avenue and Eastern
Parkway corridors, especially during the AM and PM peak hours; Pitkin Avenue, a
commercial corridor, was congested during the midday, PM and Saturday midday peak
hours. Level of service (LOS) analyses were conducted at 22 intersections; the existing
conditions analyses reveal that most intersections operate at an acceptable LOS A, B, C, and
up to mid-level D. However, there were eight intersections along major corridors that
experienced LOS above mid-level D, E or F at some or more lane groups during one or more
peak period. Future conditions analyses indicate that most intersections are expected to
operate at acceptable LOS, but some complex intersections and those along major corridors
are expected to operate at poorer levels of service during some peak periods. There are three
designated truck routes in the study area, although heavy truck activities were observed along
commercial corridors associated with deliveries to local stores.
5.0 Pedestrians and Bicycles
Pedestrian and bicycle activities were examined in the study area. Areas with high
pedestrian concentrations associated with bus transfer points, retail/commercial centers, and
high density residential areas along major corridors were given special attention. The
pedestrian analysis focused on crosswalks and corners. The majority of crosswalks analyzed
operated at an acceptable LOS C or better. However, there was one intersection where one
crosswalk operated at LOD E or worse during each of the peak periods analyzed.
iii
The existing conditions corner analysis showed that all corners operated at LOS A with the
exception of one corner which operated at LOS B during one peak period. There are three
on-street Class 2 bike lanes in the study area; a new on-street bike route is proposed for East
New York Avenue.
6.0 Accidents and Safety
A detailed accident analysis was conducted for the entire study area during the period from
2007-2009. After reviewing all the intersections in the study area for the most recent three
years, only one interaction (Eastern Parkway Extension and Mother Gaston Boulevard/Stone
Avenue qualifies as a “High Accident Location having five pedestrian accidents in 2007.
Only two locations had an average of ten or more accidents during the three year period:
Rockaway Avenue and Atlantic Avenue (14), and Rockaway Avenue and Mother Gaston
Blvd/Stone Avenue (11). During the three-year period there were 88 accidents involving
pedestrians and 21 cyclists of the total accidents in the study area; there were a total of 659
injuries as a result of 489 crashes in the study area.
7.0 Parking
A parking survey/inventory of on and off-street facilities was conducted during the AM,
midday, and PM peak hours to evaluate existing parking capacity and utilization. There are
32 off-street parking facilities within the study area providing a total of 1,557 parking spaces.
On weekdays, the total utilization during the midday peak ranges from 75% to 90%. The
number of on-street parking spaces is dictated by existing parking regulations; as a result, the
total number of on-street parking spaces varies by time of day. Overall the on-street parking
utilization in the study area was approximately 59% during the average weekday.
8.0 Public Transportation
The study area is served by four local bus lines (B7, B12, B14, and B60). There are no
subway stations within the study area. The A and C subway lines run two blocks north of the
study area, and the J, Z, and L trains stop at nearby Broadway Junction. The Long Island
Railroad (LIRR) passes through the study area below grade along Atlantic Avenue, but does
not stop within the study area; the nearest stop is at Broadway Junction.

iv
9.0 Recommendations
The analyses of the existing and future traffic conditions reveal that there are several
locations that can be improved by roadway and intersection restriping, signal timing changes,
provision of truck loading/unloading zones, parking restrictions and bus stop relocation.
Other actions to enhance pedestrian safety are also recommended. There is also a proposal to
create pedestrian plaza. Fourteen intersections have been identified for improvements, one
location for streetscape enhancement, one block where bus stops will be consolidated, and
truck loading and unloading zones are identified for six locations.

1-1
1.0 INTRODUCTION
1.1. Background
The New York City Department of Transportation is conducting the Northern Brownsville
Transportation Study at the request of Brooklyn Community Board 16. The study also
complements the Utica/Weeksville Transportation Study that was completed in 2005. It
builds upon the Utica/Weeksville Transportation Study in advancing transportation solutions
to improve traffic operations, relieve congestion, and addresses parking shortfall and improve
safety of all street users (motorists, cyclists, pedestrians, and transit riders).
The study area is predominantly low rise multi-family dwellings with a few high rise
buildings scattered throughout the study area. There are some commercial (local retail) and
institutional uses (schools and transit facilities) located in the study area. The area has seen
some development in housing (Hope IV) that has brought new residents and increased
demand for additional parking.
1.2 The Study Area
The study area is located in the northeast section of Brooklyn and comprises approximately
42 blocks. It is bounded by Atlantic Avenue to the north, Pitkin Avenue to the south, Mother
Gaston Boulevard to the east, and Howard Avenue to the west. There are two neighborhoods
- Brownsville (northern) and Ocean Hill (southern) - in the study area. Figure 1-1 shows the
boundaries of the study area and the Utica/Weeksville Transportation Study.
The study area street network is a regular grid with the two major diagonal corridors, Eastern
Parkway and East New York Avenue, creating a few complex multi-legged intersections.
Other major corridors in the study area are: Atlantic Avenue, Rockaway Avenue, Saratoga
Avenue, Thomas Boyland Avenue/Hopkinson Avenue, Howard Avenue and Pitkin Avenue.
Traffic congestion was observed on most of these corridors. The multi-leg intersections in
the study area are:
a) East New York/Pitkin and Howard Avenues;
b) East New York/Rockaway Avenues and Prospect Place;

1-2
Figure 1-1
Northern Brownsville and Utica/Weeksville Transportation Study Areas

1-3
c) Eastern Parkway/Rockaway Avenue/St. Marks Place and Reverend D. Brown Place;
d) Eastern Parkway/Mother Gaston Blvd and Pacific Street; and
e) Eastern Parkway/Saratoga Avenue and Sterling Place.
Figure 1-2 shows the study area boundaries and major arterials in the study area.
Figure 1-2
The Study Area Boundaries and Major Arterials

1-4
1.3 Goals of the Study
The goals of the study are to improve traffic operations and enhance safety for all street users
(motorists, bicyclists, pedestrians), while facilitating public participation in the planning
process.
1.4 Objectives of the Study
The objectives of the study are:
1) To examine the existing and future traffic conditions and identify issues;
2) To develop improvement measures to address issues and problems and enhance the safety
of all street users;
3) To facilitate public participation throughout the process.
1.5 Project Organization and Methodology
The study examined the following subjects to help identify and define problems and develop
effective traffic/safety solutions: Demographics, Land Use and Zoning, Vehicular Traffic,
Goods Movement, Pedestrians and Bicycles, Accident and Safety, On- and Off-Street
Parking, and Public Transportation. The process involved an analysis of existing and future
conditions, and the development of improvement measures with active public participation.

2-1
2.0 DEMOGRAPHIC ANALYSIS
The demographic/socioeconomic characteristics of the study area provide some insight into
the population travel demand and needs. The 1990 and 2000 Census data were used to
examine the study area demographics and to draw comparisons with the Borough of
Brooklyn and New York City as a whole.
There are nine census tracts that fall wholly or partially in the study area. Between 1990 and
2000 the study area’s population grew from 16,728 to 17,589. Table 2-1, Population by Age
Group and Area, presents the population for the study area, Brooklyn, and New York City.
Table 2-1
Population by Area and Age Group
Age
Study Area Population Brooklyn Population New York City Population
1990 % 2000 % 1990 % 2000 % 1990 % 2000 %
0-16 9,945 35 10,753 37 571,229 25 622,012 25 1,593,581 22 1,827,857 23
17-64 16,297 58 16,735 57 1,442,524 63 1,560,032 64 4,776,252 65 5,241,051 65
65+ 1,930 7 1,968 6 286,911 12 283,282 11 952,731 13 939,370 12
Total 28,172 100 29,456 100 2,300,664 100 2,465,326 100 7,322,564 100 8,008,278 100
Between 1990 and 2000, the median household income in the study area, Brooklyn and New
York City experienced double-digit growth: 18%, 25%, and 29%, respectively. Table 2-2
shows the median income in the study area, Brooklyn, and New York City.
Table 2-2
Median Household Income by Area
Census
Year Study Area
%
Change Brooklyn
%
Change New York City
%
Change
1990 $15,837 $25,684 $31,587
2000 $18,765 18 $32,135 25 $40,851 29
The 1990 journey to work data shows public transportation as the predominant travel mode
with 62% of the study area population using public transit - 41% used subway, 19% buses,
and 2% railroad/ferry/taxi. In Brooklyn and New York City the public transportation share is
59% and 55%, respectively; the subway share being 45% and 38%, respectively; the bus

2-2
share 12% and 13%, respectively; and the railroad/ferry/taxi share 3% and 5%, respectively.
Cars, trucks and vans were used by 30% of the study area population, and 32% and 33% in
Brooklyn and New York City, respectively. Other modes were used by 8% of the study area,
and 9% and 12% in Brooklyn and New York City, respectively.
The 2000 journey to work mode share is very similar to 1990 with 66% transit use (44%
subway and 18% buses) in the study area and in Brooklyn and New York City 59% and 54%,
respectively (subway 46% and 39%; bus 11% and 12%). Cars, trucks and vans were used by
27% of the study area population, and 31% and 34% in Brooklyn and New York City,
respectively. Table 2-3 shows Journey to Work by Mode share for years 1990 and 2000.
Table 2-3
1990 and 2000 Journey to Work by Mode
Number of persons using various modes
1990 New York City
Mode
Share
(%)
Brooklyn
Mode
Share
(%)
Study
Area
Mode
Share
(%)
Car, Truck or Van 1,036,654 33 283,765 32 1,224 30
Public Transportation 1,693,254 55 523,258 59 2,529 62
Bus 403,477 13 104,298 12 779 19
Subway 1,168,346 38 399,067 45 1,688 41
Railroad/Ferry/Taxi 121,431 5 19,893 3.05 62 2
Other modes 368,423 12 82,432 9 323 8
Total Trips 3,098,331 100 889,455 100 4,076 100
2000
Car, Truck or Van 1,049,396 34 274,301 31 1,117 27
Public Transportation 1,679,749 54 515,836 59 2,659 66
Bus 364,408 12 93,767 11 711 18
Subway 1,199,226 39 403,327 46 1,799 44
Railroad/Ferry/Taxi 116,115 3 18,742 2 150 4
Other modes 365,673 12 88,428 10 278 7
Total Trips 3,094,818 100 878,565 100 4,055 100

3-1
3.0 ZONING AND LAND USE
3.1 Zoning
The existing zoning and land use in the study area are shown in Figures 3.1 and 3.2. The
predominant zoning district in the study area is residential (R6) with small sections of
commercial (C8-2, C4-3) in the southern part and manufacturing (M1-1) in the northwestern and
eastern parts of the study area.
Figure 3-1
Existing Zoning

3-2
3.2 Land Use
The existing land uses in the study area include residential, commercial, institutional,
industrial, recreational facilities and vacant land. Figure 3-2 shows the existing land use in
the study area.
Residential
In conformity with zoning, the predominant land use is residential, comprising mainly of one
and two-family dwellings and multi-family walk-ups, with some ground floor retail.
A few high density multi-family buildings can be found mainly along Mother Gaston
Boulevard, Atlantic Avenue, and Thomas Boyland Avenue. The pictures below show
examples of residential development.
New two-family row housing Medium density residential
High density residential Traditional two-family residential

3-3
Figure 3-2
Existing Land Use

3-4
Commercial Activity
A majority of the commercial activity is concentrated along Pitkin Avenue and pockets along
Sterling Place, Eastern Parkway and East New York Avenue. Pitkin Avenue serves as the
main commercial retail corridor in the study area. Commercial uses along these corridors
include supermarkets, discount stores, banks, furniture stores, restaurants, clothing stores,
and dental/medical offices (see pictures below).
Manufacturing Activity
The manufacturing/industrial activity is located in very small pockets along Atlantic Avenue,
East New York Avenue, Eastern Parkway, St. Marks Avenue, and Mother Gaston Boulevard.
The manufacturing activity is confined mainly to auto-related uses (gas station and garages).
Community/Institutional Facilities
The community and institutional facilities in the study area include churches, six
public/private elementary and secondary schools, and one public library (located on Watkins
and Glenmore Avenues).
Recreational Facilities - Parks and Open Space
There are limited recreational facilities in the study area; those that exist are primarily
associated with schools or large multifamily complexes. Vacant lots accounts for
approximately 1% of the total land area. There is one small park on the western boundary of
the study area between Pacific and Dean Streets.

3-5
Recent Residential Developments
A midblock site on Hopkinson Avenue and Bristol Street, between Pitkin Avenue and East
New York Avenue that previously functioned as a parking lot (101 spaces) was recently
converted to residential use with 162 dwelling units and 25 parking spaces. The pictures
below show the previous use (parking lot) on the site and the newly constructed residential
complex.
A new development “Prospect Plaza” with 25 residential units was recently constructed on
vacant land situated on Park Place, between Saratoga Avenue and Howard Avenue.
Previous use - parking lot Newly constructed residential building
Planned Residential Development - Sterling Plaza
There are three existing high-rise residential buildings on Prospect Place between Saratoga
and Howard Avenues that are prepared for renovation which will accommodate commercial
space on the ground floor and luxury residential units above.
The pictures below show the aerial view of the existing three vacant structures to be
renovated and the previous land use at the site where “Prospect Plaza” was built.

3-6
Vacant Land for Potential Development
There is a large vacant lot located on Rockaway Avenue and Chester Street, between Pitkin
and East New York Avenues that is prime for development.

4-1
4.0 TRAFFIC AND TRANSPORTATION
4.1 Introduction
To analyze the existing traffic conditions in the study area, basic roadway characteristics
were surveyed along with traffic controls, traffic volumes, parking, transit, and pedestrian
activity. The traffic data collection plan included Automatic Traffic Recorders (ATRs),
manual turning movement counts, vehicle classification counts (i.e., auto, bikes, trucks, and
buses), and pedestrian counts for specified peak periods (AM, midday, PM, and Saturday
midday). ATRs were installed at 17 locations for one week (24/7), while manual turning
movement and vehicle classification counts were collected for 22 locations for one mid-week
day (Tuesday or Wednesday or Thursday) during the same week. Figure 4-1 shows the data
collection plan.
The study also inventoried street geometry, including block lengths, sidewalk and crosswalks
widths, traffic flow directions, traffic controls, travel time runs along the major corridors,
truck loading/unloading stations, bus routes and layovers, parking regulation and utilization.
Based on traffic data, the following peak hours were selected for level-of-service (LOS)
analysis: AM peak hour 8:00-9:00, midday peak hour 1:00-2:00, PM peak hour 5:00-6:00,
and Saturday midday peak hour 1:00-2:00.
.

4-2
Figure 4-1
Traffic Count Locations
E. NEW YORK AV
EASTERN PARKWAY
LIBERTY AVE
CH
ESTER ST
BRISTO
L ST
AM
BO
Y ST
HE
RZ
L STSA
RA
TO
GA
AV
LE
GIO
N ST
MO
NA
CO
PL
PL
EA
SA
NT
PL
GU
NT
HE
R P
L
MA
RC
ON
I PL
RA
DD
E P
L
RO
OS
EV
EL
T P
L
LO
UIS
PL
DE
WE
Y P
L
BA
NC
RO
FT
PL
PR
ES
CO
TT
PL
MO
TH
ER
GA
STO
N B
LV
D
RO
CK
AW
AY
AVH
OPK
INSO
N A
VST
RA
USS A
V
PITKIN AV
Manual Turning Movement
Pedestrian Count
Legend
N
MO
TH
ER
GA
ST
ON
BL
VD
TH
OM
AS
BO
YL
AN
D A
V
RO
CK
AW
AY
AV
RA
LP
H A
V
EAST NEW YORK AV
EASTERN PARKWAY
ST JOHNS PL
SAINT MARKS AV
BERGEN ST
ATRs
SA
RA
TO
GA
AV
HO
WA
RD
AV
UNION ST
LINCOLN PL
STERLING PL
PARK PL
PROSPECT PL
DEAN ST
PACIFIC ST
ATLANTIC AV

4-3
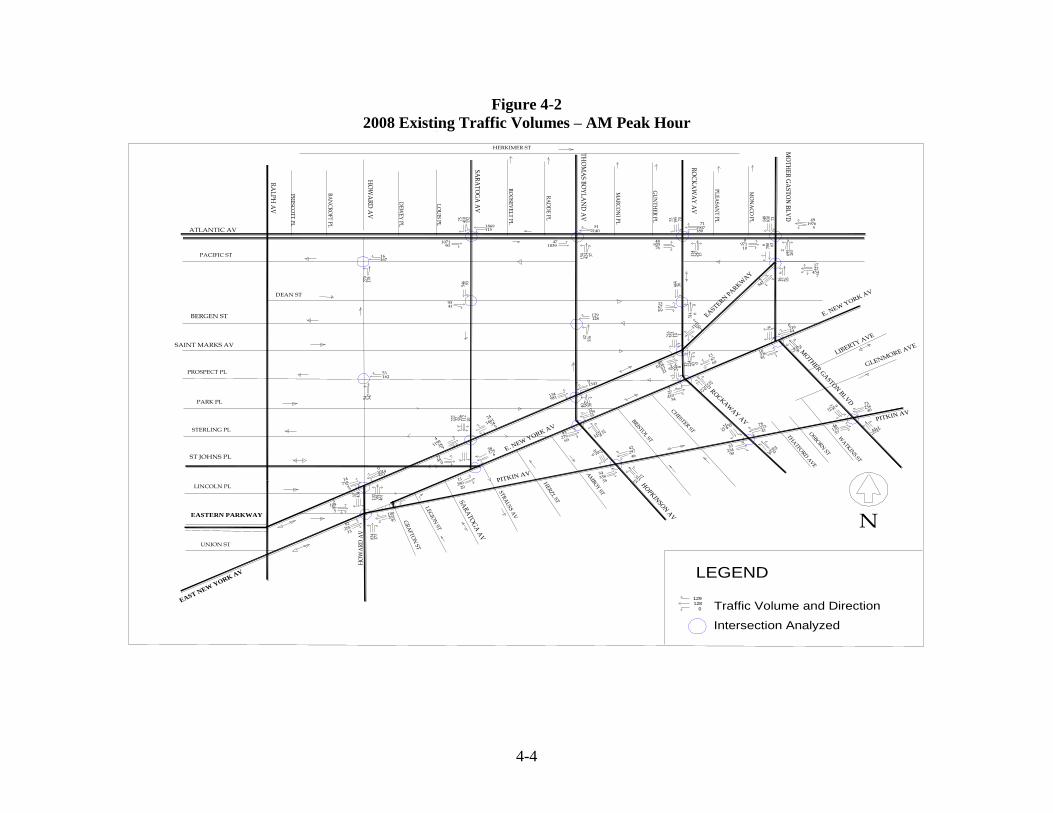
4.2 Traffic Network Volumes
The traffic network volume was prepared using the ATRs and manual turning movement
counts to create a balanced traffic network for each peak hour. Figures 4-2, 4-3, 4-4, and 4-5
show the traffic network volumes for the AM, midday, PM, and Saturday midday peak hours,
respectively.
The highest volumes were observed along the following corridors: Atlantic Avenue and
Eastern Parkway, especially during the AM and PM peak hours. Pitkin Avenue, a
commercial corridor, is most congested during the Saturday midday peak hours, as well as
during the midday and evening hours of the weekday.
4-4
Figure 4-2
2008 Existing Traffic Volumes – AM Peak Hour
0
128129
GR
AFTO
N ST
GLENMORE AVE
WA
TKIN
S ST
OSBO
RN ST
THA
TFORD
AV
E
HERKIMER ST
8
356 249
793222312
34
277
410
61
32229
382
40 38
146124
245
928
4
1199
222
10112
32 216
5871
0
17558
6
28011
20
37 434
461
130
381
52
14718
556
3108
453
01014
261100
95
173
834
25582
13
69
1367
2153
481036 22
413 43 0
11012
501
114216
221
16253
347
54
129128
4257
6
9
17102
31517
15
46
42297
35
34338
3220256
26
25233
27378
41
23433
90
28720
71
1789
33 40
73236
57
46170
64
0216787 5
33610
81
7125296
631
4
464
36
6713
69
2716 93
8425
1
17
7
22454
830
148
71
9710
10
2672
695
7806 63
5
491976
7053 195
190771
180
76
48925
247
114
15
512140
37154
424
103947
93546
4193
15275 410
1151869
107190
16716
279
178
981134
69
93279
3293222
01541
Intersection Analyzed
HO
WA
RD
AV
E. NEW YORK AV
PITKIN AV
E. NEW YORK AV
EASTERN
PA
RKW
AY
LIBERTY AVE
CHESTER ST
BRISTOL ST
AM
BOY ST
HER
ZL STSA
RA
TOG
A A
V
LEGIO
N ST
MO
NA
CO
PL
PL
EA
SAN
T P
L
GU
NT
HE
R P
L
MA
RC
ON
I PL
RA
DD
E P
L
RO
OSE
VE
LT
PL
LO
UIS P
L
DE
WE
Y P
L
BA
NC
RO
FT P
L
PR
ESC
OT
T P
L
MO
THER
GA
STON
BLV
D
RO
CKA
WA
Y A
V
HO
PKIN
SON
AV
STR
AU
SS AV
PITKIN AV
Traffic Volume and Direction
LEGEND
N
Exhibit 4-2
2008 Existing Traffic Volumes - AM Peak Hour
MO
TH
ER
GA
ST
ON
BL
VD
TH
OM
AS B
OY
LA
ND
AV
RO
CK
AW
AY
AV
RA
LP
H A
V
EAST NEW
YORK AV
EASTERN PARKWAY
ST JOHNS PL
SAINT MARKS AV
BERGEN ST
SA
RA
TO
GA
AV
HO
WA
RD
AV
UNION ST
LINCOLN PL
STERLING PL
PARK PL
PROSPECT PL
DEAN ST
PACIFIC ST
ATLANTIC AV

4-5
Figure 4-3
2008 Existing Traffic Volumes – Midday Peak Hour
12
5345
0
0
3 715
0
HERKIMER ST
GLENMORE AV
WA
TKINS ST
OSBO
RN ST
THA
TFORD AV
GR
AFTO
N ST
19
164210 259
415020221
51
294
251
52
32180
17837 38
87324
192
1111022
151 75914 130
4553
12
11625
7
18912
16
23 311
31744 235
5
22716
632
576
3340675
20691
84
94464
20140
20
32
32186
2263
50878
206
17 275
6963431
116183
216
7525
190
17
9565
23 289
6
1870
15419
14
44
42
237
31
23261
66
43234
44
34195
23184
32
20435
111
20733
76
18025
54 39
47217
67
33177
77
01776511 2
2669
132
6135192
630
6
455
36
588
22
185 55
6966
2
31
6
24224
53671 60
9001
35
2118
56350
815 53
5
391326
5039 229
113360
175
88
701015
20193 20
531302
3091 220
111156
42343
3063
11467 285
1171187
1132106
8411
168
83
103178
42
53185
1673517
1876
Intersection Analyzed
HO
WA
RD
AV
E. NEW YORK AV
PITKIN AV
E. NEW YORK AV
EASTERN
PA
RKW
AY
LIBERTY AVE
CHESTER ST
BRISTOL ST
AM
BOY ST
HER
ZL STSAR
ATO
GA
AV
LEGIO
N ST
MO
NA
CO
PL
PL
EA
SAN
T PL
GU
NT
HE
R PL
MA
RC
ON
I PL
RA
DD
E PL
RO
OSE
VE
LT
PL
LO
UIS PL
DE
WE
Y PL
BA
NC
RO
FT PL
PR
ESC
OT
T PL
MO
THER G
ASTO
N BLV
D
ROCK
AW
AY
AV
HO
PKIN
SON
AV
STR
AU
SS AV
PITKIN AV
Traffic Volume and Direction
LEGEND
N
Exhibit 4-3
2008 Existing Traffic Volumes - MD Peak Hour
MO
TH
ER
GA
ST
ON
BL
VD
TH
OM
AS B
OY
LAN
D A
V
RO
CK
AW
AY
AV
RA
LPH
AV
EAST NEW
YORK AV
EASTERN PARKWAY
ST JOHNS PL
SAINT MARKS AV
BERGEN ST
SA
RA
TO
GA
AV
HO
WA
RD
AV
UNION ST
LINCOLN PL
STERLING PL
PARK PL
PROSPECT PL
DEAN ST
PACIFIC ST
ATLANTIC AV

4-6
Figure 4-4
2008 Existing Traffic Volumes – PM Peak Hour
HERKIMER ST
108
107
0
SAR
AT
OG
A A
V
GR
AFTO
N ST
WA
TKIN
S ST
OSBO
RN ST
THA
TFORD
AVE
GLENMORE AVE
0
107108
20 400
1203115
7534437
85
45
3723
26
1477
27
21212
64
15
43246
1412
2297127546
338
1
6
41
18
5820
3
6
3
10
18056
5726077
6626
228
4317
820
32195
7
48
58252
37287
28
7920835
35
38262
910750
3
12139
19149
13
5
175362
34
73265
8 511
3
853011
47
21054
5828947
3911
21130
7
92155
3024567
9663
9
188251113
309
102
409
3124415
4133210
186
247
33
44 287
11350
4193
12278
22
33732
33
91556
25
0
4171051
81218
115361
284
142
14
53037
97136
26 627
11244
417
49
10615
44
669
15 93
293
1316
162334
1
3
338
907
743
112
98
0
29
7354 222
127165
215
78
1131518
229 2678
511444
115
42337
531543
126
659
66146
183
61 492
1511208
751525
231
124
31259 41
316
35
53324
14171
Intersection Analyzed
HO
WA
RD
AV
E. NEW YORK AV
PITKIN AV
E. NEW YORK AV
EASTER
N P
ARK
WA
Y
LIBERTY AVE
CHESTER ST
BRISTOL ST
AM
BOY
ST
HER
ZL ST
LEGIO
N ST
MO
NA
CO
PL
PL
EA
SAN
T P
L
GU
NT
HE
R P
L
MA
RC
ON
I PL
RA
DD
E P
L
RO
OSE
VE
LT
PL
LO
UIS P
L
DE
WE
Y P
L
BA
NC
RO
FT P
L
PR
ESC
OT
T P
L
MO
THER
GA
STON
BLV
D
RO
CK
AW
AY
AV
HO
PKIN
SON
AV
STR
AU
SS AV
PITKIN AV
Traffic Volume and Direction
LEGEND
N
Exhibit 4-4
2008 Existing Traffic Volumes - PM Peak Hour
MO
TH
ER
GA
ST
ON
BL
VD
TH
OM
AS B
OY
LA
ND
AV
RO
CK
AW
AY
AV
RA
LP
H A
V
EAST NEW
YORK A
V
EASTERN PARKWAY
ST JOHNS PL
SAINT MARKS AV
BERGEN ST
SA
RA
TO
GA
AV
HO
WA
RD
AV
UNION ST
LINCOLN PL
STERLING PL
PARK PL
PROSPECT PL
DEAN ST
PACIFIC ST
ATLANTIC AV

4-7
Figure 4-5
2008 Existing Traffic Volumes – Saturday Midday Peak Hour
Herkimer St
Bike lane
Bike lane
22150
70
GLANMORE AV
WA
TKINS ST
OSBO
RN ST
THA
TFORD
AV
GR
AFTO
N ST
21
11
50
9
2497 45 24
59
20936
343721432
74
386
278
30
20
150
21123 21
87543
265
811
11007
222
10112
32 216
7080
14929
20
28011
20
33 314
333
114
289
7
14
661
556
3108
289702
264128
123
123
535
27374
32
15
2671
42
815
224
11 33
727159572723
426
4
8724
32241
8791
38 383
12
1772
19658
27
57
49
284
37
31
331
66
70247
64
29180
23395
25
26141
78
21157
30
20124
58 38
87190
101
47
212
40
623712
633 17
20314
122
4957272
19240
511
44
5011
21
2411 59
7608
2
21
12
28223
54388 81
12480
43
2444
59048
917 82
2
281377
5235 236
124172
185
129
741144
208
96 18
501320
47124
249
138056
61454
4569
156
84 339
1161172
1333101
13322
113
263
916121
71
33279
2023242
3912
Intersection Analyzed
HO
WA
RD
AV
E. NEW YORK AV
PITKIN AV
E. NEW YORK AV
EASTER
N P
ARK
WA
Y
LIBERTY AVECH
ESTER ST
BRISTOL ST
AM
BOY ST
HER
ZL STSA
RA
TOG
A A
V
LEGIO
N ST
MO
NA
CO
PL
PL
EA
SAN
T P
L
GU
NT
HE
R P
L
MA
RC
ON
I PL
RA
DD
E P
L
RO
OSE
VE
LT
PL
LO
UIS P
L
DE
WE
Y P
L
BA
NC
RO
FT P
L
PR
ESC
OT
T P
L
MO
THER
GA
STON
BLV
D
RO
CK
AW
AY
AV
HO
PKIN
SON
AV
STR
AU
SS AV
PITKIN AV
Traffic Volume and Direction
LEGEND
N
Exhibit 4-5
2008 Existing Traffic Volumes - Saturday MD Peak Hour
MO
TH
ER
GA
ST
ON
BL
VD
TH
OM
AS B
OY
LA
ND
ST
RO
CK
AW
AY
AV
RA
LP
H A
V
EAST NEW
YORK A
V
EASTERN PARKWAY
ST JOHNS PL
SAINT MARKS AV
BERGEN ST
SA
RA
TO
GA
AV
HO
WA
RD
AV
UNION ST
LINCOLN PL
STERLING PL
PARK PL
PROSPECT PL
DEAN ST
PACIFIC ST
ATLANTIC AV

4-8
4.3 Level of Service (LOS) Analysis
The vehicular delay and level of service (LOS) analyses were conducted utilizing the
Highway Capacity Manual (HCM 2000) methodology for signalized intersections. Table 4-1
shows the level of service criteria for signalized intersections. Traffic flow characteristics are
measured in terms of volume-to-capacity (v/c) ratios and delays. The quality of traffic flow is
described in terms of level-of-service. LOS range from A (ideal condition) to F (congested
condition). Levels of service for signalized intersections are defined in terms of average
delay per vehicle. Delay is a measure of driver discomfort, frustration, fuel consumption, and
lost travel time.

4-9
Table 4-1
Level of Service Criteria for Signalized Intersections
Level of Service Control Delay Description of Traffic Condition
(LOS) Per Vehicle
Describes operations with very low control delay, up to 10 seconds per vehicle.
A ≤ 10.0
This level of service occurs when progression is extremely favorable and most vehicles
arrive during the green phase. Most vehicles do not stop at all. Short cycle lengths may
also contribute to low delay.
Describes operations with control delay greater than 10 and up to 20 sec. per vehicle.
B 10.1 to 20.0 This level generally occurs with good progression, short cycle lengths, or both.
More vehicles stop than with LOS A, causing higher levels of average delay.
Describes operations with control delay greater than 20 and up to 35 sec. per vehicle.
C 20.1 to 35.0 These higher delays may result from fair progression, longer cycle lengths, or both.
Individual cycle failures may begin to appear at this level. The number of vehicles
stopping is significant at this level, though many still pass through the intersection
without stopping.
Describes operations with control delay greater than 35 and up to 55 sec. per vehicle.
D 35.1 to 55.0 At level D, the influence of congestion becomes more noticeable.
Longer delays may result from some combination of unfavorable progression, long
cycle lengths, or high v/c ratios. Many vehicles stop, and the proportion of vehicles
not stopping declines. Individual cycle failures are noticeable.
Describes operations with control delay greater than 55 and up to 80 sec. per vehicle.
E 55.1 to 80.0 These high delay values generally indicate poor progression, long cycle lengths,
and high v/c ratios. Individual cycle failures are frequent occurrences.
Describes operations with control delay in excess of 80 sec. per vehicle. This level,
F > 80 considered to be unacceptable to most drivers, often occurs with oversaturation,
that is, when arrival flow rates exceed the capacity of the intersection.
It may also occur at high v/c ratios below 1.0 with many individual cycle failures.
Poor progression and long cycle lengths may also be major contributing factor to
such delay levels.
Sources: Highway Capacity Manual 2000, Transportation Research Board,
National Research Council, Washington, D.C. 2000.

4-10
4.4 Existing Traffic Condition
Capacity and level of service analysis were conducted at 22 intersections in the study area.
Table 4-2 shows the existing condition LOS, delays, and volume-to-capacity ratios for the
AM, midday, PM, and Saturday peak hours for the 22 intersections analyzed and listed
below:
1. Atlantic and Saratoga Avenues
2. Atlantic and Thomas Boyland Avenues
3. Atlantic and Rockaway Avenues
4. Atlantic Avenue and Mother Gaston Boulevard
5. Howard Avenue and Pacific Street
6. Mother Gaston Boulevard and Pacific Street
7. Saratoga Avenue and Dean Street
8. Rockaway Avenue and Dean Street
9. Thomas Boyland Avenue and Bergen Street
10. Eastern Parkway and Rockaway Avenue
11. Prospect Place and Howard Avenue
12. Prospect Place and East New York/Rockaway Avenues
13. Eastern Parkway and Sterling Place
14. East New York Avenue and Strauss Avenue/St Johns Place
15. Eastern Parkway and Howard Avenue
16. Eastern Parkway and Thomas Boyland Avenue
17. East New York and Howard/Pitkin Avenues
18. East New York and Thomas Boyland Avenues
19. East New York Avenue and Mother Gaston Boulevard
20. Pitkin and Hopkinson Avenues
21. Pitkin and Rockaway Avenues
22. Pitkin Avenue and Mother Gaston Boulevard

Lane AM MID PM MID SAT
INTERSECTION Group V/C DELAY LOS V/C DELAY LOS V/C DELAY LOS V/C DELAY LOS
EB LTR 0.19 6.10 A 0.19 6.10 A 0.25 6.40 A 0.17 5.90 A
East New York Avenue @ WB LTR 0.24 6.50 A 0.22 6.40 A 0.35 7.40 A 0.22 6.40 A
Mother Gaston Blvd NB LTR 0.76 53.20 D 0.68 50.10 D 0.74 52.20 D 0.75 53.70 D
SB LTR 0.25 40.80 D 0.24 40.70 D 0.27 41.00 D 0.61 49.20 D
EB LTR 0.40 23.10 C 0.28 21.30 C 0.44 23.70 C 0.35 22.40 C
East New York Avenue @ WB LTR 0.78 38.70 D 0.61 30.00 C 0.87 46.10 D 0.87 49.40 D
Rockaway Avenue NB LTR 0.75 35.10 D 0.62 28.70 C 0.57 27.00 C 0.63 29.00 C
SB LTR 0.47 23.80 C 0.52 25.20 C 0.52 25.30 C 0.53 25.30 C
EB LTR 0.91 51.80 D 0.56 24.10 C 1.00 63.70 E 0.72 29.40 C
East New York Avenue @ WB LTR 0.45 21.30 C 0.50 22.50 C 0.88 43.20 D 0.34 19.40 B
Thomas Boyland Avenue NB L 0.05 22.20 C 0.06 22.40 C 0.07 22.50 C 0.07 22.50 C
TR 0.67 34.90 C 0.38 27.10 C 0.61 32.80 C 0.44 28.30 C
East New York Ave @ EB LTR 0.45 17.80 B 0.32 15.70 B 0.41 17.30 B 0.45 17.80 B
Saratoga Ave./Strauss Street WB LTR 0.37 16.60 B 0.23 14.50 B 0.53 19.60 B 0.33 16.10 B
SB LTR 0.22 23.50 C 0.13 22.30 C 0.31 24.70 C 0.21 23.30 C
EB LTR 0.52 22.30 C 0.48 22.00 C 0.53 23.30 C 0.62 25.90 C
WB LTR 0.68 22.90 C 0.54 23.50 C 0.45 21.50 C 0.58 24.60 C
Pitkin Avenue @ NB L 0.35 27.50 C 0.32 27.30 C 0.31 27.70 C 0.13 23.70 C
Mother Gaston Blvd TR 0.62 31.50 C 0.43 28.20 C 0.47 29.10 C 0.52 30.30 C
SB L 0.05 22.50 C 0.12 23.60 C 0.19 25.00 C 0.13 23.80 C
TR 0.36 26.60 C 0.37 26.80 C 0.47 28.60 C 0.43 27.90 C
EB LTR 0.79 36.30 D 0.77 35.00 C 0.72 31.60 C 0.84 40.40 D
Pitkin Avenue @ WB LTR 0.73 31.00 C 0.72 30.60 C 0.80 35.50 D 0.67 27.90 C
Rockaway Avenue NB LTR 0.76 42.40 D 0.86 51.30 D 0.65 36.50 D 0.84 52.00 D
SB LTR 0.84 48.60 D 0.87 58.80 E 0.94 64.90 E 0.87 51.90 D
Pitkin Avenue @ EB LTR 0.76 33.00 C 0.58 25.00 C 0.75 32.20 C 0.74 31.80 C
Hopkinson Avenue/ WB LTR 0.68 28.60 C 0.57 24.80 C 0.75 32.40 C 0.74 31.90 C
Thomas Boyland Avenue NB LTR 0.87 52.80 D 0.49 30.30 C 0.84 47.80 D 0.75 41.70 D
SB LTR 0.33 26.80 C 0.25 25.20 C 0.42 28.60 C 0.27 25.70 C
EB LTR 0.64 52.60 D 0.41 46.70 D 0.63 46.10 D 0.41 41.00 D
EB L 0.33 40.30 D 0.13 33.20 C 0.24 37.80 D 0.28 39.40 D
TR 0.78 57.10 E 0.69 51.50 D 0.72 53.00 D 0.76 54.60 D
Pitkin Avenue / WB L 0.44 46.60 D 0.36 41.40 D 0.77 65.50 E 0.48 49.20 D
E.N.Y Avenue @ T 0.68 51.20 D 0.54 45.50 D 0.66 50.00 D 0.69 51.60 D
Howard Avenue R 0.36 41.40 D 0.31 40.40 D 0.38 42.00 D 0.44 43.30 D
NB TR 0.82 41.30 D 0.43 30.40 C 0.60 33.60 C 0.50 31.60 C
R 0.48 33.50 C 0.26 28.70 C 0.27 28.80 C 0.34 30.20 C
SB T 0.47 31.10 C 0.31 28.50 C 0.40 29.80 C 0.31 28.50 C
R 0.12 26.30 C 0.07 25.60 C 0.06 25.50 C 0.10 26.00 C
Howard Avenue @ WB TR 0.17 11.30 B 0.09 10.70 B 0.14 11.10 B 0.15 11.10 B
Pacific Street NB LT 0.31 12.20 B 0.17 11.20 B 0.24 11.70 B 0.26 11.80 B
Howard Avenue @ WB TR 0.31 15.60 B 0.16 14.20 B 0.24 14.90 B 0.16 14.20 B
Prospect Place NB LT 0.38 8.80 A 0.18 7.30 A 0.32 8.20 A 0.26 7.80 A
Rockaway Avenue @ EB LTR 0.25 15.40 B 0.16 14.60 B 0.29 15.70 B 0.14 14.50 B
Dean Street NB TR 0.58 11.40 B 0.51 11.20 B 0.42 9.90 A 0.46 10.10 B
SB LT 0.72 16.50 B 0.71 16.10 B 0.70 15.80 B 0.81 20.60 C
Saratoga Avenue @ EB TR 0.12 7.00 A 0.09 6.80 A 0.19 7.40 A 0.10 6.90 A
Dean Street SB LT 0.83 26.60 C 0.46 17.20 B 0.98 44.90 D 0.66 20.70 C
Thomas Boyland Avenue @ WB TR 0.86 39.00 D 0.30 8.70 A 0.80 33.30 C 0.59 22.60 C
Bergen Street NB LT 0.47 9.60 A 0.39 16.30 B 0.44 9.20 A 0.32 8.30 A
EB LTR 0.34 18.00 B 0.46 21.80 C 0.60 22.10 C 0.36 18.20 B
Eastern Parkway @ WB DefL 0.91 52.20 D 0.88 48.20 D 0.87 52.40 D 0.60 26.10 C
Howard Avenue TR 0.53 11.60 B 0.38 10.90 B 0.49 11.10 B 0.37 9.70 A
NB LTR 0.89 51.10 D 0.54 30.80 C 0.82 48.60 D 0.74 44.90 D
Eastern Parkway @ EB LTR 0.53 13.30 B 0.39 8.60 A 0.66 15.70 B 0.43 12.00 B
Saratoga Avenue WB LTR 0.66 15.70 B 0.37 8.50 A 0.70 17.10 B 0.42 12.00 B
SB LTR 0.96 65.60 E 0.72 41.10 D 0.94 62.60 E 0.87 53.60 D
Eastern Parkway @ EB LT 0.79 44.20 D 0.54 13.70 B 0.95 34.90 C 0.59 14.70 B
Thomas Boyland Avenue WB TR 0.55 13.50 B 0.32 10.90 B 0.51 13.00 B 0.34 11.00 B
NB LTR 0.45 35.70 D 0.25 33.00 C 0.61 40.00 D 0.25 32.90 C
EB LTR 0.67 17.90 B 0.19 10.20 B 0.81 22.10 C 0.52 14.90 B
Eastern Parkway @ WB LTR 0.65 17.20 B 0.15 10.10 B 0.66 17.70 B 0.47 14.10 B
Rockaway Avenue NB LTR 0.49 36.80 D 0.72 45.10 D 0.36 34.20 C 0.44 35.80 D
SB LTR 0.83 50.00 D 0.47 36.30 D 0.86 54.90 D 0.84 51.10 D
Pacific Street @ WB LTR 0.56 48.40 D 0.56 48.30 D 0.69 52.40 D 0.67 51.20 D
Mother Gaston Blvd/ NB LTR 0.28 5.60 A 0.24 5.30 A 0.38 8.30 A 0.21 5.10 A
Eastern Parkway NB LT 0.23 5.90 A 0.20 5.70 A 0.33 5.90 A 0.22 5.70 A
SB TR 0.31 5.80 A 0.25 5.40 A 0.30 5.70 A 0.22 5.20 A
TABLE 4-2 (Page 1 of 2)
LOS ANALYSIS FOR SIGNALIZED INTERSECTIONS
EXISTING CONDITIONS
4-11

Lane AM MID PM MID SAT
INTERSECTION Group V/C DELAY LOS V/C DELAY LOS V/C DELAY LOS V/C DELAY LOS
EB TR 0.56 23.00 C 0.61 19.10 B 0.76 27.90 C 0.69 25.90 C
Atlantic Avenue @ WB L 0.87 97.60 F 0.85 81.80 F 1.02 133.00 F 0.82 90.50 F
Saratoga Avenue T 0.47 13.30 B 0.33 8.70 A 0.31 11.50 B 0.30 11.40 B
SB LTR 0.78 44.30 D 0.73 34.80 C 0.88 51.20 D 0.72 41.60 D
EB L 0.76 70.70 E 0.75 62.20 E 0.81 76.10 E 0.64 43.80 D
Atlantic Avenue @ T 0.42 12.90 B 0.49 13.40 B 0.63 16.10 B 0.56 14.90 B
Thomas Boyland Avenue WB TR 0.77 19.30 B 0.87 22.00 C 0.53 14.20 B 0.48 13.60 B
NB LTR 0.83 46.10 D 0.44 24.10 C 0.68 40.50 D 0.61 38.60 D
EB L 0.39 59.70 E 0.55 54.60 D 0.67 75.30 E 0.54 65.80 E
TR 0.73 31.40 C 0.72 25.30 C 0.98 51.70 D 0.98 50.00 D
Atlantic Avenue @ WB L 1.02 125.50 F 0.93 88.60 F 1.04 125.20 F 1.04 132.00 F
Rockaway Avenue TR 0.82 33.30 C 0.55 21.70 C 0.55 26.80 C 0.56 26.90 C
NB LTR 0.96 71.10 E 0.89 48.80 D 0.89 57.50 E 0.81 49.60 D
SB LTR 0.98 87.30 F 0.96 71.00 E 0.98 85.20 F 0.88 65.50 E
EB TR 0.69 32.00 C 0.66 31.40 C 0.99 54.50 D 0.91 43.00 D
Atlantic Avenue @ WB TR 1.02 61.60 E 0.73 33.00 C 0.81 36.00 D 0.76 33.90 C
Eastern Parkway R 0.11 22.90 C 0.08 22.60 C 0.06 21.60 C 0.06 22.30 C
NB TR 0.47 20.80 C 0.38 19.50 B 0.61 23.40 C 0.41 20.00 B
SB LTR 0.76 28.10 C 0.46 20.90 C 0.60 23.60 C 0.52 22.00 C
LOS E or F
LOS ANALYSIS FOR SIGNALIZED INTERSECTIONS
EXISTING CONDITIONS
TABLE 4-2 (Page 2 of 2)
4-12

4-13
The existing conditions analysis revealed that most intersections operate at an acceptable
levels of service (LOS A, B, C, and up to mid-level of D), while other intersections along
major corridors (Atlantic Avenue, Eastern Parkway, Pitkin Avenue, and East New York
Avenue) operate at poorer levels of service (above mid-level D, E, or F).
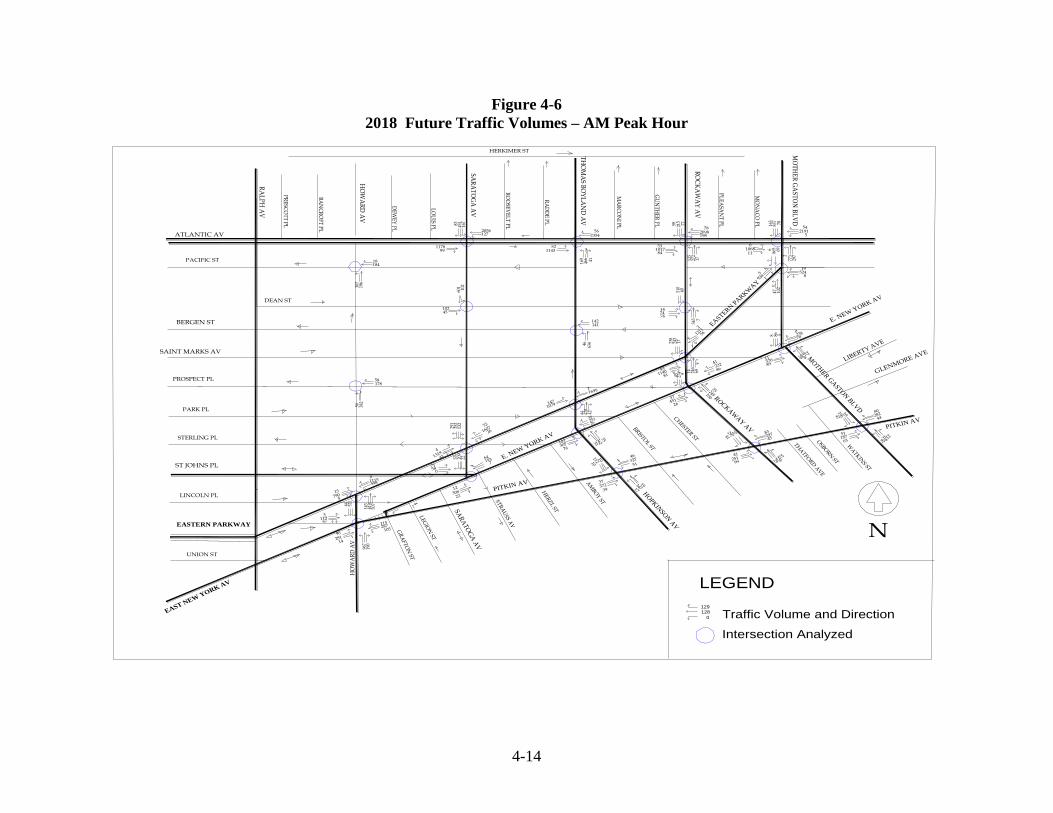
4.5 Future Traffic Conditions
The existing conditions traffic volumes were projected to year 2018 by adding 0.5 percent
per year.
The 2018 future conditions analysis revealed that most intersections would operate similar to
the existing conditions with acceptable levels of service (LOS) A, B, C, and up to mid-level
of D). The complex intersections and those along major corridors (Atlantic Avenue, Eastern
Parkway, Pitkin Avenue, and East New York Avenue) would operate at poorer levels of
service (above mid-level D, E, or F) during some peak periods.
Table 4-3 shows the future conditions LOS, delays and volume-to-capacity ratio for the AM,
midday, PM, and Saturday midday peak hours. Figures 4-6, 4-7, 4-8, and 4-9 show the 2018
future traffic volumes for the AM, midday, PM, and Saturday midday peak hours,
respectively.
4-14
Figure 4-6
2018 Future Traffic Volumes – AM Peak Hour
55 22209
0
128129
GR
AFTO
N ST
GLENMORE AVE
WA
TKIN
S ST
OSBO
RN ST
THA
TFORD
AV
E
HERKIMER ST
9
45 274
10035245
26
37451
26
35252
420
44 42
160732
26
41
4
1319
132
291
252
5871
0
19364
7
30812
22
44 521
507
143
419
8
15790
67
3119
498
01115
287115
105
190
967
28196
14
86
41232
81
531140 24
614 69
12112
56
17238
243
17858
382
59
142141
4663
4
1019112
34719
17
51
46327
39
37372
4127297
29
27256
29783
45
25141
99
31622
92
1961047 44
80282
63
51187
70
0238868 5
37011
89
7827326
734
5
510
40
7414
76
47 102
9265
18
19524
837
163
78
10680
11
2972
773
8656 69
5
542191
7758 215
209878
198
84
531017
272
125
17
562354
41169
466
114352
102
601
45102
16783 451
1272056
117899
18418
307
196
1079147
76
102307
3623533
11695
Intersection Analyzed
HO
WA
RD
AV
E. NEW YORK AV
PITKIN AV
E. NEW YORK AV
EASTERN
PA
RKW
AY
LIBERTY AVE
CHESTER ST
BRISTOL ST
AM
BOY ST
HER
ZL STSA
RA
TOG
A A
V
LEGIO
N ST
MO
NA
CO
PL
PL
EA
SAN
T P
L
GU
NT
HE
R P
L
MA
RC
ON
I PL
RA
DD
E P
L
RO
OSE
VE
LT
PL
LO
UIS P
L
DE
WE
Y P
L
BA
NC
RO
FT P
L
PR
ESC
OT
T P
L
MO
THER
GA
STON
BLV
D
ROCK
AW
AY
AV
HO
PKIN
SON
AV
STR
AU
SS AV
PITKIN AV
Traffic Volume and Direction
LEGEND
N
Exhibit 4-6
2018 Projected Traffic Volumes - AM Peak Hour
MO
TH
ER
GA
ST
ON
BL
VD
TH
OM
AS B
OY
LA
ND
AV
RO
CK
AW
AY
AV
RA
LP
H A
V
EAST NEW YORK AV
EASTERN PARKWAY
ST JOHNS PL
SAINT MARKS AV
BERGEN ST
SA
RA
TO
GA
AV
HO
WA
RD
AV
UNION ST
LINCOLN PL
STERLING PL
PARK PL
PROSPECT PL
DEAN ST
PACIFIC ST
ATLANTIC AV

4-15
Figure 4-7
2018 Future Traffic Volumes – Midday Peak Hour
P
12
5345
0
0
3 816
5
P
P
P
P
P
P
P
P
P
P
P
P
P
P
PP
P
Off-Street Parking LotP
HERKIMER ST
GLENMORE AV
WA
TKINS ST
OSBO
RN ST
THA
TFORD
AV
GR
AFTO
N ST
186328
5
6855222
56
36276
57
35198
196
41 42
96026
23
1131124
73181
143
4553
12
12827
8
20813
18
25 342
34948 259
5
24788
42
584
3670743
227100
92
103
510
22144
22
35
56205
2263
50878
206
17 275
6963431
116183
216
8327
20919
10571
25 318
7
2077
16921
15
48
46261
34
25
287
7347257
48
37215
26192
48
22439
122
22836
84
19827
59 52
52239
74
36195
85
01957112 8
29310
145
6739211
733
7
501
40
649
24
185 557667
2
7
61246
59078 66
9901
39
2328
61955
917 58
5
431459
5543 252
124666
193
97
771117
221
102 22
581432
33
100
242
122262
46377
3369
12574 313
1291306
1245117
9212
185 91
110186
46
58203
1843919
1964
Intersection Analyzed
HO
WA
RD
AV
E. NEW YORK AV
PITKIN AV
E. NEW YORK AV
EASTER
N P
ARK
WA
Y
LIBERTY AVE
CHESTER ST
BRISTOL ST
AM
BOY
ST
HER
ZL STSA
RA
TOG
A A
V
LEGIO
N ST
MO
NA
CO
PL
PL
EA
SAN
T P
L
GU
NT
HE
R P
L
MA
RC
ON
I PL
RA
DD
E P
L
RO
OSE
VE
LT
PL
LO
UIS P
L
DE
WE
Y P
L
BA
NC
RO
FT P
L
PR
ESC
OT
T P
L
MO
THER G
ASTO
N BLV
D
RO
CK
AW
AY
AV
HO
PKIN
SON
AV
STR
AU
SS AV
PITKIN AV
Manual Turning Movements
LEGEND
N
Exhibit 4-7
Future Traffic Volumes - Midday Peak Hour
MO
TH
ER
GA
ST
ON
BL
VD
TH
OM
AS B
OY
LA
ND
AV
RO
CK
AW
AY
AV
RA
LP
H A
V
EAST NEW
YORK AV
EASTERN PARKWAY
ST JOHNS PL
SAINT MARKS AV
BERGEN ST
SA
RA
TO
GA
AV
HO
WA
RD
AV
UNION ST
LINCOLN PL
STERLING PL
PARK PL
PROSPECT PL
DEAN ST
PACIFIC ST
ATLANTIC AV

4-16
Figure 4-8
2018 Future Traffic Volumes – PM Peak Hour
136
HERKIMER ST
108
107
0
SA
RA
TO
GA
AV
GR
AFT
ON
ST
WA
TKIN
S ST
OSBO
RN ST
THA
TFORD
AV
E
GLENMORE AVE
121 59209
22 440
1323127
8337841
85
49
41
25
29
341625
30
23233
7017
47271
29
131140351 372
6
20
5
11
19862
6328685
7329
251
4719
622
352158
53
6427
7
41
31631
8722739
39
42288
1012930
13153
21068
5
193398
37
8329
1
9 512
4
933311
58
2
1159
6431852
55
23143
8
105171
3326974
106
703
207276124
340
112
450
3136817
45446
205
27236
48 316
12455
4193
13321
24
37135
36
171237
0
4591156
89
240
126867
312
165
239
58341
107150
36 68
12268
459 54
11717
48
752
102
326
1418
1785
37
1
372
998
817
123
108
8059 244
139871
238
86
1241670
252 2986
561588
127
46371
581697
139
725
73161
20167 541
1661329
831677
254
34365 45
348
39
58356
15591
Intersection Analyzed
HO
WA
RD
AV
E. NEW YORK AV
PITKIN AV
E. NEW YORK AV
EASTER
N P
ARK
WA
Y
LIBERTY AVE
CH
ESTER ST
BRISTOL ST
AM
BOY
ST
HER
ZL ST
LE
GIO
N ST
MO
NA
CO
PL
PL
EA
SAN
T P
L
GU
NT
HE
R P
L
MA
RC
ON
I PL
RA
DD
E P
L
RO
OSE
VE
LT
PL
LO
UIS P
L
DE
WE
Y P
L
BA
NC
RO
FT P
L
PR
ESC
OT
T P
L
MO
THER
GA
STON
BLV
D
RO
CK
AW
AY
AV
HO
PKIN
SON
AV
ST
RA
USS A
V
PITKIN AV
Traffic Volume and Direction
LEGEND
N
MO
TH
ER
GA
ST
ON
BL
VD
TH
OM
AS B
OY
LA
ND
AV
RO
CK
AW
AY
AV
RA
LP
H A
V
EAST NEW
YORK A
V
EASTERN PARKWAY
ST JOHNS PL
SAINT MARKS AV
BERGEN ST
SA
RA
TO
GA
AV
HO
WA
RD
AV
UNION ST
LINCOLN PL
STERLING PL
PARK PL
PROSPECT PL
DEAN ST
PACIFIC ST
ATLANTIC AV
Exhibit 4-8
2018 Projected Traffic Volumes - PM Peak Hour

4-17
Figure 4-9
2018 Future Traffic Volumes – Saturday Midday Peak Hour
Herkimer St
Bike lane
Bike lane
2416577
GLANMORE AV
WA
TKINS ST
OSBO
RN ST
THA
TFORD
AV
GR
AFTO
N ST
21
11
50
9
27457 26 65230
56
7341235
81
48306
33
22
165
232
25 23
96347
34
21
11108
279
134
238
7080
16432
22
30812
22
33 314
366
125
318
8
15
727
556
3108
318772
264128
123
123
535
27374
32
107
46897
268
12 36
800170
37257
290
9626
3526
5
96100
42 421
13
1979
21664
30
63
54
312
41
34
364
73
77272
70
32198
256105
27
28745
86
23263
33
22126
26 42
96209
111
52233
44
726113
636 19
22315
134
5463299
21264
562
48
5512
23
39 65
8369
2
2331
259
59797 89
137347
268
64955
790
311515
5739 260
136579
203
142
811258
229
106
20
551452
52
136
274
151862
67499
4976
172
92 373
1281289
1466111
14624
124
289
1008133
78
36307
2223546
3
1003
Intersection Analyzed
HO
WA
RD
AV
E. NEW YORK AV
PITKIN AV
E. NEW YORK AV
EASTERN
PA
RKW
AY
LIBERTY AVE
CHESTER ST
BRISTOL ST
AM
BOY
ST
HER
ZL STSA
RA
TOG
A A
V
LEGIO
N ST
MO
NA
CO
PL
PL
EA
SAN
T P
L
GU
NT
HE
R P
L
MA
RC
ON
I PL
RA
DD
E P
L
RO
OSE
VE
LT
PL
LO
UIS P
L
DE
WE
Y P
L
BA
NC
RO
FT P
L
PR
ESC
OT
T P
L
MO
THER
GA
STON
BLV
D
ROCK
AW
AY
AV
HO
PKIN
SON
AV
STR
AU
SS AV
PITKIN AV
Traffic Volume and Direction
LEGEND
N
Exhibit 4-9
2018 Projected Traffic Volumes - Saturday Midday Peak Hour
MO
TH
ER
GA
ST
ON
BL
VD
TH
OM
AS B
OY
LA
ND
ST
RO
CK
AW
AY
AV
RA
LP
H A
V
EAST NEW YORK AV
EASTERN PARKWAY
ST JOHNS PL
SAINT MARKS AV
BERGEN ST
SA
RA
TO
GA
AV
HO
WA
RD
AV
UNION ST
LINCOLN PL
STERLING PL
PARK PL
PROSPECT PL
DEAN ST
PACIFIC ST
ATLANTIC AV

Lane AM MID PM MID SAT
INTERSECTION Group V/C DELAY LOS V/C DELAY LOS V/C DELAY LOS V/C DELAY LOS
EB LTR 0.21 6.20 A 0.21 6.20 A 0.27 6.60 A 0.18 6.00 A
East New York Avenue @ WB LTR 0.26 6.70 A 0.25 6.60 A 0.39 7.90 A 0.24 6.50 A
Mother Gaston Blvd NB LTR 0.78 54.70 D 0.75 53.20 D 0.79 54.80 D 0.78 54.80 D
SB LTR 0.29 41.40 D 0.27 41.10 D 0.29 41.10 D 0.73 54.80 D
EB LTR 0.44 23.70 C 0.30 21.70 C 0.48 24.60 C 0.39 23.00 C
East New York Avenue @ WB LTR 0.91 54.20 D 0.68 32.90 C 0.93 54.10 D 0.91 54.70 D
Rockaway Avenue NB LTR 0.86 45.30 D 0.71 32.70 C 0.65 29.80 C 0.72 33.30 C
SB LTR 0.52 25.00 C 0.58 26.60 C 0.58 26.70 C 0.59 26.90 C
EB LTR 0.95 54.00 D 0.66 27.20 C 1.01 68.30 E 0.80 33.60 C
East New York Avenue @ WB LTR 0.50 22.40 C 0.52 23.20 C 0.94 53.90 D 0.38 20.10 C
Thomas Boyland Avenue NB L 0.06 22.30 C 0.03 22.00 C 0.08 22.50 C 0.08 22.60 C
TR 0.74 37.90 D 0.42 27.90 C 0.67 35.00 C 0.48 29.20 C
East New York Ave @ EB LTR 0.50 18.70 B 0.35 16.20 B 0.46 18.10 B 0.50 18.70 B
Saratoga Ave./Strauss Street WB LTR 0.41 17.30 B 0.25 14.80 B 0.58 21.00 C 0.37 16.70 B
SB LTR 0.24 23.70 C 0.14 22.50 C 0.35 25.10 C 0.23 23.60 C
EB LTR 0.54 23.80 C 0.53 23.30 C 0.60 24.90 C 0.69 28.40 C
WB LTR 0.71 29.30 C 0.60 25.30 C 0.51 22.70 C 0.64 26.70 C
Pitkin Avenue @ NB L 0.37 28.90 C 0.37 28.90 C 0.38 30.00 C 0.15 24.20 C
Mother Gaston Blvd TR 0.62 33.30 C 0.47 29.10 C 0.52 30.40 C 0.57 31.70 C
SB L 0.06 22.80 C 0.14 23.90 C 0.23 26.00 C 0.15 24.40 C
TR 0.39 27.20 C 0.41 27.50 C 0.52 29.70 C 0.47 28.90 C
EB LTR 0.89 46.80 D 0.87 44.70 D 0.82 38.50 D 0.94 54.80 D
Pitkin Avenue @ WB LTR 0.82 36.70 D 0.80 35.90 D 0.90 47.30 D 0.74 31.10 C
Rockaway Avenue NB LTR 0.85 50.70 D 0.89 53.00 D 0.72 40.00 D 0.86 54.30 D
SB LTR 0.89 54.70 D 0.89 62.00 E 0.98 74.30 E 0.90 54.70 D
Pitkin Avenue @ EB LTR 0.84 39.40 D 0.63 26.80 C 0.83 38.10 D 0.82 37.40 D
Hopkinson Avenue/ WB LTR 0.77 33.70 C 0.63 26.90 C 0.85 41.40 D 0.84 40.30 D
Thomas Boyland Avenue NB LTR 0.89 53.80 D 0.54 31.70 C 0.87 51.40 D 0.83 48.30 D
SB LTR 0.37 27.50 C 0.28 25.70 C 0.46 29.70 C 0.30 26.20 C
EB LTR 0.69 54.80 D 0.47 48.00 D 0.70 48.50 D 0.46 41.80 D
EB L 0.39 43.50 D 0.15 34.70 C 0.28 40.20 D 0.33 42.20 D
TR 0.86 64.60 E 0.75 54.80 D 0.79 57.20 E 0.83 60.80 E
Pitkin Avenue / WB L 0.52 51.70 D 0.41 44.60 D 0.82 71.10 E 0.55 53.70 D
E.N.Y Avenue @ T 0.74 54.00 D 0.59 47.40 D 0.72 53.40 D 0.75 54.90 D
Howard Avenue R 0.39 42.20 D 0.34 41.00 D 0.42 42.90 D 0.48 44.60 D
NB TR 0.90 47.40 D 0.48 31.10 C 0.65 35.10 D 0.55 32.60 C
R 0.52 34.90 C 0.28 29.10 C 0.29 29.30 C 0.37 30.90 C
SB T 0.52 32.00 C 0.34 28.90 C 0.44 30.50 C 0.34 29.00 C
R 0.13 26.50 C 0.07 25.70 C 0.06 25.60 C 0.11 26.10 C
Howard Avenue @ WB TR 0.19 11.40 B 0.10 10.80 B 0.16 11.20 B 0.16 11.20 B
Pacific Street NB LT 0.34 12.40 B 0.19 11.30 B 0.26 11.80 B 0.29 12.00 B
Howard Avenue @ WB TR 0.34 15.90 B 0.18 14.30 B 0.27 15.10 B 0.18 14.30 B
Prospect Place NB LT 0.42 9.10 A 0.19 7.40 A 0.35 8.50 A 0.28 8.00 A
Rockaway Avenue @ EB LTR 0.28 15.60 B 0.17 14.70 B 0.32 16.00 B 0.16 14.60 B
Dean Street NB TR 0.57 12.40 B 0.56 12.10 B 0.46 10.50 B 0.47 10.70 B
SB LT 0.80 20.40 C 0.79 19.60 B 0.77 18.90 B 0.89 27.80 C
Saratoga Avenue @ EB TR 0.13 7.00 A 0.10 6.80 A 0.21 7.50 A 0.11 6.90 A
Dean Street SB LT 0.91 33.50 C 0.51 17.80 B 0.99 54.10 D 0.73 22.50 C
Thomas Boyland Avenue @ WB TR 0.95 52.30 D 0.33 9.10 A 0.88 42.10 D 0.65 24.70 C
Bergen Street NB LT 0.52 10.20 B 0.43 16.70 B 0.48 9.70 A 0.36 8.50 A
EB LTR 0.35 18.10 B 0.52 22.50 C 0.67 23.60 C 0.40 18.70 B
Eastern Parkway @ WB DefL 0.93 53.90 D 0.90 53.60 D 0.90 54.20 D 0.70 34.30 C
Howard Avenue TR 0.56 12.40 B 0.42 11.30 B 0.54 11.70 B 0.40 10.10 B
NB LTR 0.91 53.20 D 0.59 31.70 C 0.90 54.70 D 0.81 47.90 D
Eastern Parkway @ EB LTR 0.58 14.20 B 0.43 9.00 A 0.73 17.30 B 0.47 12.50 B
Saratoga Avenue WB LTR 0.74 17.80 B 0.41 8.90 A 0.80 20.20 C 0.48 12.70 B
SB LTR 1.01 77.10 E 0.79 44.80 D 1.00 75.40 E 0.96 65.90 E
Eastern Parkway @ EB LT 0.86 54.60 D 0.62 15.00 B 0.99 42.30 D 0.66 16.00 B
Thomas Boyland Avenue WB TR 0.60 14.40 B 0.36 11.20 B 0.56 13.70 B 0.37 11.40 B
NB LTR 0.49 36.40 D 0.28 33.30 C 0.67 41.70 D 0.27 33.20 C
EB LTR 0.77 20.80 C 0.20 11.10 B 0.93 30.60 C 0.59 16.00 B
Eastern Parkway @ WB LTR 0.74 19.70 B 0.16 10.70 B 0.75 20.20 C 0.53 15.10 B
Rockaway Avenue NB LTR 0.54 38.00 D 0.77 47.90 D 0.39 34.80 C 0.49 36.70 D
SB LTR 0.88 54.40 D 0.63 40.50 D 0.86 70.20 E 0.88 54.60 D
Pacific Street @ WB LTR 0.74 54.30 D 0.62 49.70 D 0.75 54.60 D 0.73 53.70 D
Mother Gaston Blvd/ NB LTR 0.31 5.80 A 0.26 5.50 A 0.45 10.00 A 0.33 5.90 A
Eastern Parkway NB LT 0.26 6.30 A 0.22 6.00 A 0.37 6.10 A 0.16 5.30 A
SB TR 0.35 6.00 A 0.28 5.60 A 0.33 5.90 A 0.24 5.30 A
TABLE 4-3 (Page 1 of 2)
LOS ANALYSIS FOR SIGNALIZED INTERSECTIONS
2018 FUTURE CONDITIONS
4-18

Lane AM MID PM MID SAT
INTERSECTION Group V/C DELAY LOS V/C DELAY LOS V/C DELAY LOS V/C DELAY LOS
EB TR 0.62 24.20 C 0.67 20.20 C 0.84 30.90 C 0.76 27.90 C
Atlantic Avenue @ WB L 0.99 108.20 F 0.93 98.30 F 1.06 141.20 F 0.90 105.00 F
Saratoga Avenue T 0.52 14.00 B 0.35 8.90 A 0.34 11.80 B 0.33 11.70 B
SB LTR 0.86 49.30 D 0.80 37.90 D 0.92 54.60 D 0.79 44.60 D
EB L 0.78 71.10 E 0.78 65.60 E 0.88 93.30 F 0.71 53.20 D
Atlantic Avenue @ T 0.52 13.50 B 0.54 14.10 B 0.69 17.50 B 0.62 15.90 B
Thomas Boyland Avenue WB TR 0.84 22.10 C 0.96 29.60 C 0.58 15.10 B 0.53 14.30 B
NB LTR 0.91 54.70 D 0.48 24.80 C 0.75 43.10 D 0.67 40.40 D
EB L 0.51 65.30 E 0.61 57.90 E 0.70 78.40 E 0.59 68.90 E
TR 0.90 39.30 D 0.79 27.50 C 1.04 65.90 E 0.99 52.00 D
Atlantic Avenue @ WB L 1.13 159.30 F 1.10 135.60 F 1.14 159.30 F 1.13 160.00 F
Rockaway Avenue TR 0.92 38.90 D 0.59 22.20 C 0.61 27.80 C 0.62 28.00 C
NB LTR 1.00 78.60 E 1.02 77.60 E 0.97 73.00 E 0.86 54.00 D
SB LTR 1.00 90.50 F 0.99 79.20 E 1.04 99.00 F 0.94 74.00 E
EB TR 0.76 34.10 C 0.73 33.30 C 0.95 54.50 D 0.98 53.40 D
Atlantic Avenue @ WB TR 1.03 64.30 E 0.80 35.60 D 0.90 40.70 D 0.83 36.90 D
Eastern Parkway R 0.12 23.00 C 0.09 22.70 C 0.07 21.60 C 0.07 22.40 C
NB TR 0.51 21.60 C 0.42 20.10 C 0.75 53.70 D 0.45 20.60 C
SB LTR 0.86 33.50 C 0.52 22.00 C 0.66 25.00 C 0.59 23.50 C
LOS E or F
LOS ANALYSIS FOR SIGNALIZED INTERSECTIONS
2018 FUTURE CONDITIONS
TABLE 4-3 (Page 2 of 2)
4-19

4-20
4.6 Goods Movement
There are three designated truck routes in the study area; a through truck route along Atlantic
Avenue and a local truck route (trucks with local origins and destinations) along East New York
Avenue and Rockaway Avenue. Exhibit 4-10 shows the truck routes in the study area. However,
heavy truck activities were observed along other corridors such as Pitkin Avenue, Thomas
Boyland Avenue, and Mother Gaston Boulevard. Trucks sometimes are observed loading and
unloading in bus stops causing buses to block an effective moving lane to pick-up and drop-off
passengers.
Exhibit 4-10
Local and Through Truck Routes
Legend Local truck route Local & Through truck route

5-1
5.0 PEDESTRIAN AND BICYCLE
5.1 Introduction
The pedestrian analysis focused on crosswalks and corners as well as general pedestrian flow
patterns. To assess pedestrian activity in the study area, pedestrian level of service (LOS)
analysis was conducted using the existing pedestrian counts.
5.2 Pedestrian Analysis
Heavy pedestrian volumes in the area can generally be associated with bus transfer points,
retail/commercial centers and high density residential areas. The corridors with the heaviest
pedestrian traffic were Pitkin Avenue, Thomas Boyland Avenue, Rockaway Avenue, and Mother
Gaston Boulevard.
Below are the locations with highest crosswalk pedestrian volumes during the weekday AM,
midday, and PM and the Saturday midday peak hours, respectively:
1. Pitkin Avenue & Thomas Boyland Avenue (443, 826, 878, 1,496)
2. Rockaway Avenue & Pitkin Avenue (523, 1,113, 968, 1,803)
3. Rockaway Avenue & East New York Avenue (44, 347, 429, 542)
4. Mother Gaston Boulevard & Pitkin Avenue (498, 374, 594, 659)
5. Atlantic Avenue & Thomas Boyland Avenue (528, 175, 466, 217)
The crosswalk and corner pedestrian volumes for the weekday and Saturday peak hours are
shown in Table 5-1 and Figures 5-1 to 5-4.

5-2
Table 5-1
Existing Pedestrian Volumes: - Crosswalk and Corner
Intersection
AM MD PM SAT
Cross
Walk
(Ped/Hr)
Corner
(Ped/Hr)
Cross
Walk
(Ped/Hr)
Corner
(Ped/Hr)
Cross
Walk
(Ped/Hr)
Corner
(Ped/Hr)
Cross
Walk
(Ped/Hr)
Corner
(Ped/Hr)
Atlantic Avenue &
Rockaway Avenue 270 73 196 32 340 53 251 58
Atlantic Avenue & Thomas
Boyland Avenue 528 58 175 42 466 46 217 66
Mother Gaston Blvd/Eastern
Parkway/Pacific Street 176 241 180 188 199 226 198 255
Rockaway Avenue & Dean
Street 192 61 118 16 177 41 206 36
Thomas Boyland Avenue &
Bergen Street 364 168 93 57 232 85 134 35
Eastern Parkway/St. Marks
Avenue/Rockaway Avenue 209 37 175 33 186 21 269 125
Mother Gaston Boulevard &
East New York Avenue 146 67 95 61 159 73 115 101
Mother Gaston Boulevard &
Pitkin Avenue 498 110 374 173 594 208 659 443
Rockaway Avenue & East
New York Avenue 442 133 347 101 429 108 542 91
Rockaway Avenue & Pitkin
Avenue 523 214 1113 473 968 473 1803 477
Pitkin Avenue & Thomas
Boyland Avenue 443 87 826 67 878 73 1496 59
E. New York Avenue & St.
John’s Pl./Strauss Avenue 270 73 196 32 340 53 132 114
E. New York Avenue/Pitkin
Avenue/Howard Avenue 220 69 215 86 381 184 388 82
Eastern Parkway & Howard
Avenue 81 50 108 43 102 34 139 33

5-3
Figure 5-1
Existing Pedestrian Volumes - AM Peak Hour
Pedestrian (Directional) Volumes
Analysis location
4284
50 87
1312
2632
1826
49
77
137 60
46
28
4 7
5368
13 14
1524
54 29
2325
13 41
10862
31 55
10627
5983
62 60
7272
43 72
55 69
102
52
3559
4284
3832
5 6
3514
24 21
256580 58
610
1418
3328
23 2659
3137
710
24 36
515
18 64
1713
46 135
629 32 77
354
2525
27 8
1310
15 24
1118
54 29
53 68
1314
1524
21 14
211
91
1325
1416
HO
WA
RD
AV
E. NEW Y
ORK AV
PITKIN AV
E. NEW Y
ORK AV
EASTER
N P
ARK
WA
Y
LIBERTY AVE
CH
ESTER ST
BRISTO
L ST
AM
BOY
ST
HER
ZL STSA
RA
TO
GA
AV
LE
GIO
N ST
MO
NA
CO
PL
PL
EA
SAN
T P
L
GU
NT
HE
R P
L
MA
RC
ON
I PL
RA
DD
E P
L
RO
OSE
VE
LT
PL
LO
UIS P
L
DE
WE
Y P
L
BA
NC
RO
FT
PL
PR
ESC
OT
T P
L
MO
TH
ER
GA
STO
N B
LVDR
OCK
AW
AY
AV
HO
PKIN
SON
AV
ST
RA
USS A
V
PITKIN AV
LEGEND
N
MO
TH
ER
GA
ST
ON
BL
VD
TH
OM
AS B
OY
LA
ND
AV
RO
CK
AW
AY
AV
RA
LP
H A
V
EAST NEW
YORK A
V
EASTERN PARKWAY
ST JOHNS PL
SAINT MARKS AV
BERGEN ST
SA
RA
TO
GA
AV
HO
WA
RD
AV
UNION ST
LINCOLN PL
STERLING PL
PARK PL
PROSPECT PL
DEAN ST
PACIFIC ST
ATLANTIC AV

5-4
Figure 5-2
Existing Pedestrian Volumes - Midday Peak Hour
3952
38 44
189
1017
2637
45
86
126 67
53
319
9 14
4644
20 10
1121
17 27
1315
8 21
231235
32 34
136129
142150
144
130
193152
100
102
63 54
46 31
3950
3952
2232
6 2
1110
32 28
334248 36
102
1630
1714
14 2399
4042
52
18 16
32
31 40
26
38 20
33 9 14
33
2127
22 12
158
27 32
88
17 27
46 44
2010
1121
24 33
42 34
98
1416
Analysis location
HO
WA
RD
AV
E. NEW Y
ORK AV
PITKIN AV
E. NEW Y
ORK AV
EASTER
N P
ARK
WA
Y
LIBERTY AVE
CH
ESTER ST
BRISTO
L ST
AM
BOY
ST
HE
RZ
L STSA
RA
TO
GA
AV
LE
GIO
N ST
MO
NA
CO
PL
PL
EA
SA
NT
PL
GU
NT
HE
R P
L
MA
RC
ON
I PL
RA
DD
E P
L
RO
OS
EV
EL
T P
L
LO
UIS
PL
DE
WE
Y P
L
BA
NC
RO
FT
PL
PR
ES
CO
TT
PL
MO
TH
ER
GA
STO
N B
LV
DRO
CK
AW
AY
AV
HO
PKIN
SON
AV
ST
RA
USS
AV
PITKIN AV
Pedestrian (Directional) Volumes
LEGEND
N
MO
TH
ER
GA
ST
ON
BL
VD
TH
OM
AS B
OY
LA
ND
AV
RO
CK
AW
AY
AV
RA
LP
H A
V
EAST NEW
YORK A
V
EASTERN PARKWAY
ST JOHNS PL
SAINT MARKS AV
BERGEN ST
SA
RA
TO
GA
AV
HO
WA
RD
AV
UNION ST
LINCOLN PL
STERLING PL
PARK PL
PROSPECT PL
DEAN ST
PACIFIC ST
ATLANTIC AV

5-5
Figure 5-3
Existing Pedestrian Volumes - PM Peak Hour
Pedestrian (Directional) Volumes
Analysis location
9565
43 69
3239
2217
3034
31
1216
157 97
108
24
24 20
5312
0
14 17
2929
37 41
2827
21 32
199262
36 42143143
99133
96 86
156153
118
127
85 110
49 72
6850
9565
4853
9 6
717
36 33
343662 55
811
2833
2719
19 14105
2248
139
30 22
69
36 51
1310
39 35
179 84 30
810
2126
18 24
1514
30 34
512
37 41
53 120
1417
2929
84 92
50 145
820
3433
HO
WA
RD
AV
E. NEW Y
ORK AV
PITKIN AV
E. NEW Y
ORK AV
EASTER
N P
ARK
WA
Y
LIBERTY AVE
CH
ESTER ST
BRISTO
L ST
AM
BOY
ST
HE
RZ
L STSA
RA
TO
GA
AV
LE
GIO
N ST
MO
NA
CO
PL
PL
EA
SAN
T P
L
GU
NT
HE
R P
L
MA
RC
ON
I PL
RA
DD
E P
L
RO
OSE
VE
LT
PL
LO
UIS P
L
DE
WE
Y P
L
BA
NC
RO
FT
PL
PR
ESC
OT
T P
L
MO
TH
ER
GA
STO
N B
LV
DRO
CK
AW
AY
AV
HO
PKIN
SON
AV
ST
RA
USS A
V
PITKIN AV
LEGEND
N
MO
TH
ER
GA
ST
ON
BL
VD
TH
OM
AS B
OY
LA
ND
AV
RO
CK
AW
AY
AV
RA
LP
H A
V
EAST NEW
YORK A
V
EASTERN PARKWAY
ST JOHNS PL
SAINT MARKS AV
BERGEN ST
SA
RA
TO
GA
AV
HO
WA
RD
AV
UNION ST
LINCOLN PL
STERLING PL
PARK PL
PROSPECT PL
DEAN ST
PACIFIC ST
ATLANTIC AV

5-6
Figure 5-4
Existing Pedestrian Volumes - Saturday Midday Peak Hour
5473
Analysis location
Pedestrian (Directional) Volumes
2743
1623
2925
413
811
1118 106
122
8326
18 9
1719
27 26
1312
8 10
2523
68 61
361382
53 52
245274
237287
222
175
332287
100
163
103
100
74 74
9487
5473
2234
7 11
1617
74 32
313910
883
35
1526
15
41 514648
127
1414
32 47
1311
50 40
211
24 24
117 35 22
65
2226
30 18
227
19 34
1010
43 45
47 73
1413
115
30 28
67 34
67
2619
HO
WA
RD
AV
E. NEW Y
ORK AV
PITKIN AV
E. NEW Y
ORK AV
EASTER
N P
ARK
WA
Y
LIBERTY AVE
CH
ESTER ST
BRISTO
L ST
AM
BO
Y ST
HE
RZ
L STSA
RA
TO
GA
AV
LE
GIO
N ST
MO
NA
CO
PL
PL
EA
SA
NT
PL
GU
NT
HE
R P
L
MA
RC
ON
I PL
RA
DD
E P
L
RO
OS
EV
EL
T P
L
LO
UIS
PL
DE
WE
Y P
L
BA
NC
RO
FT
PL
PR
ES
CO
TT
PL
MO
TH
ER
GA
STO
N B
LV
DRO
CK
AW
AY
AV
HO
PKIN
SON
AV
ST
RA
USS A
V
PITKIN AV
LEGEND
N
MO
TH
ER
GA
ST
ON
BL
VD
TH
OM
AS
BO
YL
AN
D A
V
RO
CK
AW
AY
AV
RA
LP
H A
V
EAST NEW
YORK A
V
EASTERN PARKWAY
ST JOHNS PL
SAINT MARKS AV
BERGEN ST
SA
RA
TO
GA
AV
HO
WA
RD
AV
UNION ST
LINCOLN PL
STERLING PL
PARK PL
PROSPECT PL
DEAN ST
PACIFIC ST
ATLANTIC AV

5-7
The pedestrian level of service (LOS) analysis was conducted using the methodologies of the
Highway Capacity Manual Software “HiCAP 2000 – US Customary Unit Version”. Pedestrian
level of service measures the space that pedestrians have to maneuver in corners, crosswalks,
stairwells, and walkways. Table 5-2 shows the level of service criteria for crosswalks and street
corners which is measured in terms of square feet of space per pedestrian.
Table 5-2
Pedestrian Level of Service Criteria for Crosswalks and Corners
LOS Space (ft2/p)
Flow Rate
(p/min/ft) Speed (ft/s) v/c Ratio
A >60 < or = 5 >4.25 < or = 0.21
B >40 - 60 >5 – 7 >4.17 – 4.25 >0.21 – 0.31
C >24 - 40 >7 – 10 >4.00 – 4.17 >0.31 – 0.44
D >15 – 24 >10 – 15 >3.75 – 4.00 >0.44 – 0.65
E >8 - 15 >15 – 23 >2.50 – 3.75 >0.65 – 1.0
F < or = 8 Variable < or = 2.50 variable
Crosswalk Analysis
The analysis of existing conditions for crosswalks showed that a majority of the crosswalks in
the study area operated at acceptable level of service – C or better. However, there was one
intersection that had one crosswalk operating at LOS E or worse in one or more peak periods.
The intersection of East New York Avenue and St. John’s Street/Strauss Avenue had more than
one crosswalk operating at LOS D or worse in each of the peak periods analyzed. The crosswalk
analysis results are shown in Table 5-3.
Corner Analysis
The existing conditions corner analysis showed that a majority of the locations operated at
acceptable LOS – B or better. The corner analysis results are shown in Table 5-4.

5-8
Table 5-3: Existing Crosswalk Level of Service Analysis
Intersection
Crosswalk
AM MD PM SAT MD Crosswalk Space Crosswalk Space Crosswalk Space Crosswalk Space
SF/P LOS SF/P LOS SF/P LOS SF/P LOS
Atlantic Avenue & Rockaway
Avenue
North 1277.4 A 895.2 A 1275.9 A 1168.2 A
East 199.1 A 224.7 A 255.1 A 219.3 A
South 768.2 A 650.3 A 586.8 A 1757.6 A
West 158.5 A 145.9 A 132.7 A 188.5 A
Atlantic Avenue & Thomas
Boyland Avenue
North 1640.4 A 3108.2 A 2978.4 A 3904.8 A
East 156.6 A 481.7 A 135.5 A 517.1 A
South 1352.2 A 2721.4 A 842.8 A 1091 A
West 72.9 A 491.1 A 164.8 A 227.4 A
Rockaway Avenue & Dean Street
North 817.0 A 2458.0 A 1023.0 A 3209.2 A
East 429.4 A 1061.6 A 550.8 A 502.6 A
South 1007.3 A 2769.9 A 921.0 A 962.2 A
West 486.4 A 634.0 A 560.1 A 597.3 A
Thomas Boyland Avenue & Bergen
Street
North 649.4 A 3576.2 A 1298.9 A 1298.9 A
East 503.3 A 2077.2 A 476.8 A 665.1 A
South 681.2 A 4771.2 A 1787.0 A 3576.2 A
West 230.7 A 909.3 A 638.8 A 750.7 A
Eastern Parkway/St. Marks
Avenue/Rockaway Avenue
North 2588.7 A 6097.2 A 1726.8 A 1301.7 A
East 421.3 A 730.5 A 649.2 A 245.9 A
South 2846.7 A 1308.4 A 2434.1 A 1379.8 A
West 400.5 A 449.4 A 330.7 A 375.5 A
Mother Gaston Boulevard & East
New York Avenue
North 4107.3 A 2518.9 A 2565.8 A 3523.1 A
East 1117.7 A 2983.4 A 1341.3 A 1425.4 A
South 870.1 A 2134.3 A 1747.2 A 1531.3 A
West 309.5 A 459.8 A 205.4 A 405.3 A
Mother Gaston Boulevard & Pitkin
Avenue
North 377.7 A 532.3 A 383.9 A 354 A
East 297.3 A 333.4 A 240.8 A 249.5 A
South 622.4 A 657.7 A 496.3 A 464.1 A
West 212.2 A 566.8 A 324.3 A 301.4 A
Rockaway Avenue/ East New York
Avenue/ Prospect Pl
North 1612.3 A 909.4 A 550.3 A 1186.4 A
East 828.3 A 656.5 A 522.4 A 415.7 A
South 415.1 A 565.2 A 544.1 A 414.2 A
Southwest 316.9 A 359.6 A 409.5 A 203.9 A
West 327.8 A 505.1 A 310.9 A 272.7 A
East New York Avenue & St.
John’s Place/Strauss Avenue
North 6.6 F 9.7 E 5.4 F 12.9 E
East 969.7 A 1013.8 A 737.8 A 1272.5 A
South 131.1 A 258.1 A 158.3 A 447.5 A
West 1851.1 A 1733.6 A 1853.1 A 1589.1 A
East New York Avenue/Pitkin
Avenue/Howard Avenue
North 955.3 A 1241.5 A 425.1 A 473.8 A
East 619.1 A 1107.1 A 861.9 A 735.4 A
South 421.2 A 378.3 A 224.5 A 123.1 A
Southwest 1318.1 A 815.8 A 954.9 A 905.6 A
West 2047.7 A 1221.8 A 708.7 A 1046.4 A
Rockaway Avenue & Pitkin
Avenue
North 468.6 A 258.8 A 295.7 A 95.1 A
East 276.3 A 143.9 A 199.8 A 138.3 A
South 463.1 A 169.0 A 217.2 A 61.3 B
West 232.7 A 159.1 A 116.7 A 188.7 A
Eastern Parkway & Howard
Avenue
North 2279.3 A 2653.6 A 5332.1 A 2214.1 A
East 607.3 A 378.8 A 281.2 A 395.5 A
South 2893.7 A 1064.9 A 5791.2 A 598.7 A
West 1354.4 A 1172.8 A 738.1 A 938.2 A
Mother Gaston Boulevard/ Eastern
Parkway/Pacific Street
North 421.3 A 1624.4 A 607.5 A 890.1 A
East 1353.5 A 1469.7 A 1427.6 A 1368.6 A
South 3384.5 A 1563.5 A 2173.1 A 2271.4 A
Southwest 401.4 A 594.7 A 468.9 A 509.2 A
West 1354.1 A 1087.2 A 1168.5 A 984.8 A
Pitkin Avenue & Thomas Boyland
Avenue
North 504.9 A 279.6 A 247.2 A 205.9 A
East 427.2 A 499.2 A 412.3 A 610.8 A
South 335.4 A 168.7 A 159.6 A 144.7 A
West 975.8 A 1599.7 A 921.0 A 553.6 A

5-9
Table 5-4: Existing Corner Level of Service Analysis
Intersection
Corner
AM MD PM SAT MD
Corner Space Corner Space Corner Space Corner Space
SF/P LOS SF/P LOS SF/P LOS SF/P LOS
Atlantic Avenue &
Rockaway Avenue
Northeast 575.9 A 912.6 A 705.7 A 586.7 A
Northwest 399.7 A 535.5 A 330.7 A 406.6 A
Southeast 479.2 A 867.7 A 611.6 A 793.7 A
Southwest 395.1 A 538.7 A 336.9 A 569.6 A
Atlantic Avenue & Thomas
Boyland Avenue
Northeast 408.6 A 1123.4 A 409.1 A 981.7 A
Northwest 265.1 A 1134.1 A 387.5 A 673.7 A
Southeast 536.6 A 1276.5 A 459.9 A 1099.8 A
Southwest 269.6 A 896.7 A 387.9 A 653.7 A
Rockaway Avenue & Dean
Street
Northeast 1025.6 A 2814.7 A 1303.6 A 1526.3 A
Northwest 616.2 A 1082.5 A 705.1 A 1118.0 A
Southeast 1119.8 A 2658 A 1292.1 A 1073.0 A
Southwest 187.2 A 367.8 A 258.6 A 246.1 A
Thomas Boyland Avenue &
Bergen Street
Northeast 1980.4 A 8208.3 A 2321.8 A 3001.8 A
Northwest 487.5 A 1401.5 A 1138.7 A 1288.9 A
Southeast 630.8 A 2500.9 A 737.7 A 1023.7 A
Southwest 160.9 A 861.9 A 598.4 A 861.0 A
Eastern Parkway/St. Marks
Avenue/Rockaway Avenue
Northeast 708.5 A 1309.8 A 872.1 A 352.4 A
Northwest 437.2 A 484.9 A 364.5 A 263.3 A
Southeast 974.3 A 1125.1 A 1317.3 A 491.7 A
Southwest 871.5 A 833.1 A 863.1 A 834.7 A
Mother Gaston Boulevard &
East New York Avenue
Northeast 1379.0 A 927.5 A 1038.7 A 1039.5 A
Northwest 831.0 A 795.7 A 532.0 A 889.2 A
Southeast 856.7 A 1631.3 A 1205.0 A 1417.1 A
Southwest 535.3 A 806.9 A 566.5 A 719.3 A
Mother Gaston Boulevard &
Pitkin Avenue
Northeast 636.3 A 479.2 A 393.0 A 172.6 A
Northwest 882.9 A 591.2 A 506.0 A 233.8 A
Southeast 492.2 A 316.7 A 302.9 A 209.3 A
Southwest 594.8 A 375.7 A 334.1 A 128.5 A
Rockaway Avenue & East
New York Avenue/Prospect
Place
Northeast 762.8 A 643.4 A 470.9 A 499.3 A
Northwest 423.2 A 491.7 A 364.5 A 472.8 A
Southeast 622.6 A 617.6 A 607.3 A 550.1 A
Southwest -1 272.5 A 377.5 A 291.9 A 235.9 A
Southwest - 2 180.9 A 246.1 A 191.4 A 175.2 A
East New York Avenue & St.
John’s Place/Strauss Avenue
Northeast 387.1 A 705.4 A 496.2 A 976.5 A
Northwest 88.3 A 145.5 A 109.6 A 93.8 A
Southeast 624.6 A 585.1 A 370.5 A 592.7 A
Southwest 341.9 A 460.2 A 280.6 A 185.9 A
East New York
Avenue/Pitkin
Avenue/Howard Avenue
Northeast 290.5 A 511.7 A 232.3 A 293.6 A
Northwest 2098.7 A 1836.8 A 779.6 A 1023.9 A
Southeast 1026.9 A 1185.5 A 616.9 A 652.1 A
Southwest - 1 2467.5 A 2019.1 A 1024.2 A 1849.4 A
Southwest - 2 1565.1 A 1335.1 A 853.1 A 749.1 A
Eastern Parkway & Howard
Avenue
Northeast 1260.9 A 870.5 A 787.0 A 870.0 A
Northwest 2652.4 A 2520.3 A 2187.1 A 1866.1 A
Southeast 2457.7 A 1397.7 A 2053.5 A 1228.0 A
Southwest 4875.6 A 4366.6 A 6547.9 A 53.5 B
Mother Gaston Boulevard/
Eastern Parkway/Pacific
Street
Northeast 1091.3 A 1721.1 A 1226.1 A 1468.2 A
Northwest 673.2 A 851.3 A 610.2 A 734.7 A
Southeast 1085.1 A 937.7 A 1015.3 A 957.7 A
Southwest -1 497.1 A 567.4 A 505.9 A 459.7 A
Rockaway Avenue & Pitkin
Avenue
Southwest - 2 251.2 A 309.9 A 222.1 A 204.9 A
Northeast 449.3 A 244.7 A 312.0 A 155.2 A
Northwest 389.2 A 238.0 A 235.6 A 179.6 A
Southeast 450.8 A 200.7 A 261.3 A 121.1 A
Pitkin Avenue & Thomas
Boyland Avenue
Southwest 401.5 A 179.0 A 169.3 A 126.9 A
Northeast 636.3 A 479.2 A 393.0 A 290.1 A
Northwest 882.9 A 591.2 A 506.0 A 284.7 A
Southeast 492.2 A 316.7 A 302.9 A 224.5 A

5-10
5.3 Bicycle Analysis
There are three on-street bike lanes (Class 2) in the study area. These bike lanes are located on
Pacific Street (from Howard Avenue to Thomas Boyland Avenue), Bergen Street (from Howard
Avenue to Mother Gaston Boulevard), and St. Marks Place (from Howard Avenue to Eastern
Parkway). There is also one on-street bike shared lane (Class 3) located on East New York Avenue
(from Howard Avenue to Rockaway Avenue). These shared lanes were installed in 2010, as per the
Master Plan. Figure 5-5 shows the existing bicycle routes in the study area.
Figure 5-5
Existing Bicycle Routes
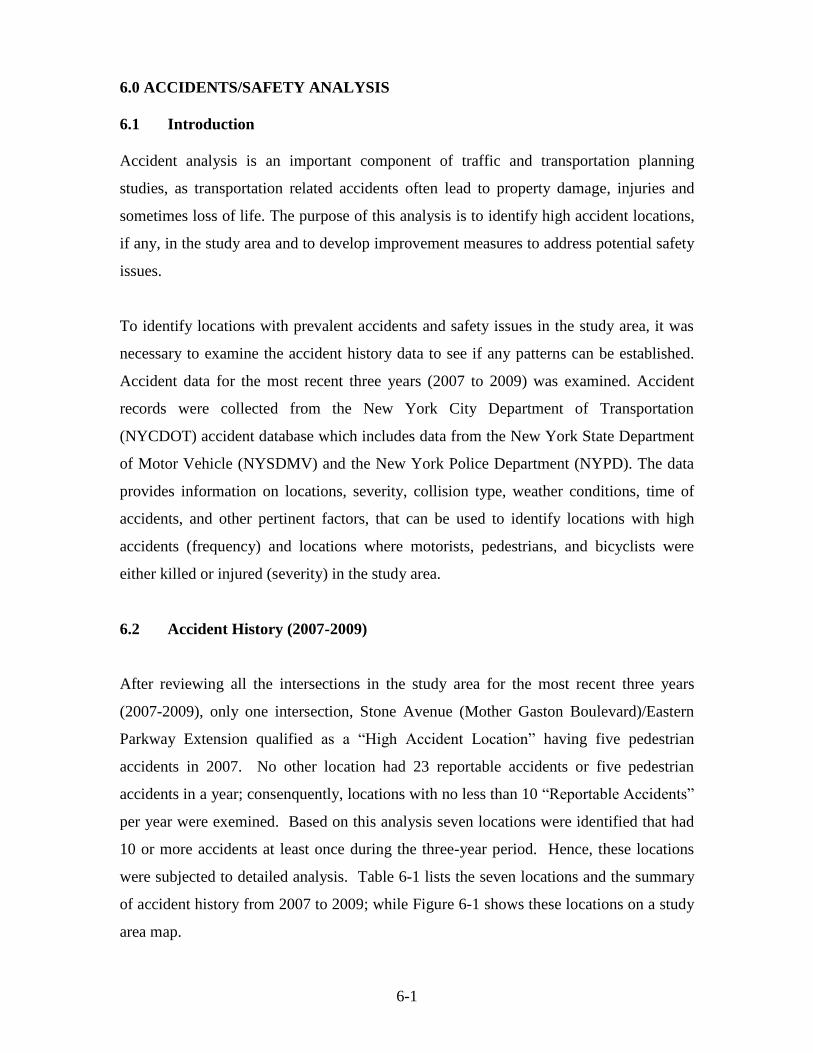
6-1
6.0 ACCIDENTS/SAFETY ANALYSIS
6.1 Introduction
Accident analysis is an important component of traffic and transportation planning
studies, as transportation related accidents often lead to property damage, injuries and
sometimes loss of life. The purpose of this analysis is to identify high accident locations,
if any, in the study area and to develop improvement measures to address potential safety
issues.
To identify locations with prevalent accidents and safety issues in the study area, it was
necessary to examine the accident history data to see if any patterns can be established.
Accident data for the most recent three years (2007 to 2009) was examined. Accident
records were collected from the New York City Department of Transportation
(NYCDOT) accident database which includes data from the New York State Department
of Motor Vehicle (NYSDMV) and the New York Police Department (NYPD). The data
provides information on locations, severity, collision type, weather conditions, time of
accidents, and other pertinent factors, that can be used to identify locations with high
accidents (frequency) and locations where motorists, pedestrians, and bicyclists were
either killed or injured (severity) in the study area.
6.2 Accident History (2007-2009)
After reviewing all the intersections in the study area for the most recent three years
(2007-2009), only one intersection, Stone Avenue (Mother Gaston Boulevard)/Eastern
Parkway Extension qualified as a “High Accident Location” having five pedestrian
accidents in 2007. No other location had 23 reportable accidents or five pedestrian
accidents in a year; consenquently, locations with no less than 10 “Reportable Accidents”
per year were exemined. Based on this analysis seven locations were identified that had
10 or more accidents at least once during the three-year period. Hence, these locations
were subjected to detailed analysis. Table 6-1 lists the seven locations and the summary
of accident history from 2007 to 2009; while Figure 6-1 shows these locations on a study
area map.

6-2
Table 6-1: Accident History in the Study Area (2007 – 2009)
Total Accidents
No. Location 2007 2008 2009 Total
1 Rockaway Avenue/Atlantic Avenue 11 8 22 41
2 Eastern Pkwy Ext./Mother Gaston Blvd/Pacific St. 10 15 9 34
3 Eastern Parkway Extension/Howard Avenue 7 11 9 27
4 Thomas Boyland Avenue/Atlantic Avenue 4 5 15 24
5 Eastern Parkway Extension/Rockaway Avenue 4 10 7 21
6 Saratoga Avenue/Sterling Place 4 10 7 21
7 Howard Avenue/St. Johns Place 1 1 18 20
The data showed that the Rockaway Avenue and Atlantic Avenue intersection had the
highest number of accidents, with a total of 41 accidents over the three-year period. Out
of seven intersections listed in the above table, three intersections show significant
increase in accidents in 2009 from 2008 and 2007. However, the most dramatic spike
occurred at the Howard Avenue/St. Johns Place intersection. Three intersections along
Eastern Parkway were among the locations with the most accidents in the study area:
Mother Gaston Boulevard/Pacific Street (34), Howard Avenue (27), and Rockaway
Avenue (21).

6-3
Figure 6-1: Accident Locations (2007-2009)
Fatalities and Injuries
Over the three-year period (2007-2009), 659 people sustained injuries as a result of 489 crashes at
all intersections in the study area. The only fatality occurred at the Atlantic Avenue and Thomas
Boyland Avenue intersection in 2009. Table 6-2 lists the intersections and number of injuries
between 2007 and 2009 and Figure 6-2 maps these locations.

6-4
Table 6-2: Summary of Injuries (2007-2009)
No. Location No. of Injuries Total Accidents
1 Rockaway Avenue/Atlantic Avenue 57 41
2 Eastern Parkway/Howard Avenue 47 27
3 Eastern Parkway Ext./Mother Gaston Blvd 39 34
4 Saratoga Avenue/Atlantic Avenue 38 22
5 Atlantic Avenue/Thomas Boyland Avenue 36 24
6 Eastern Parkway/Saratoga Avenue/Sterling Place 28 21
7 Rockaway Avenue/Eastern Pkwy Extension 28 21
Total Injuries/Total Accidents 273 190
Figure 6-2: Injuries Accident Locations (2007-2009)

6-5
Accidents Involving Pedestrians and Bicyclists
Only the intersection of Eastern Parkway and Mother Gaston Boulevard qualified as a
“High Pedestrian Accident Location” having five pedestrian accidents in 2007. However
to be conservative, an examination of intersections with at least three pedestrian accidents
per year from 2007-2009 was conducted. Seven locations in the study area met the
criteria. During the three-year period there were 88 total pedestrian and 21 total bicycle
accidents in the study area. Howard Avenue/Eastern Parkway was the only intersection
that had two bicycle accidents in 2009. Table 6-3 shows locations where at least three
pedestrian accidents occurred during the three-year period (2007-2009), while Figure 6-3
maps these locations.
Table 6-3: Pedestrian Accidents (2007-2009)
No. Location 2007 2008 2009 Total
1 Eastern Parkway Ext./Mother Gaston Blvd 5 4 2 11
2 Rockaway Avenue/Atlantic Avenue 3 2 2 7
3 Saratoga Avenue/Atlantic Avenue 1 3 2 6
4 Pitkin Avenue/Rockaway Avenue 3 1 1 5
5 Pitkin Avenue/Hopkinson Avenue 1 3 1 5
6 Pitkin Avenue/Bristol Street 3 2 0 5
7 Pitkin Avenue/Thatford Street 3 0 0 3
Total Pedestrian Accidents 19 15 8 42

6-6
Figure 6-3: Pedestrian Accident Locations (2007-2009)
Accidents by Collision Type and Driving Conditions
Based on the criteria identified above, eight intersections qualified for detailed analysis.
There are a total of 255 accidents at the eight locations over the 3-year period. An
analysis of contributing factors in relation to frequency of the 255 accidents at the eight
analyzed locations listed in Table 6-4, revealed that 34% of the accidents occurred during
night time, and 20% occurred under wet roadway conditions (2007-2009).
The distribution of accident by collision type showed that 26% were rear end, 9% left
turn and 18% right angle. The highest number of rear end accidents occurred at three
intersections: Eastern Parkway Extension/Rockaway Avenue, Eastern Parkway
Extension/Mother Gaston Boulevard, and Atlantic Avenue/Rockaway Avenue with 11
rear end accidents at each intersection. The locations with the highest frequency of left
turn collisions were Rockaway Avenue/Atlantic Avenue and Eastern Parkway/Howard
Avenue with seven left turn accidents at each intersection.

6-7
The analysis shows that 17 accidents occurred during the night and 11 occurred under
wet roadway conditions (see Table 6-4).
.
Table 6-4: Accidents by Collision Type (2007-2009)
Collision Type/Condition
Intersection/Location
Rear
End
Left
Turn
Right
Angle
Night
Accidents
Wet
Road
Eastern Pkwy/Mother Gaston Blvd 11 3 4 7 8
Eastern Pkwy/Rockaway Ave. 11 0 3 8 5
Rockaway Ave./Atlantic Ave. 11 7 6 14 6
Eastern Pkwy/Howard Ave. 8 7 12 17 11
Howard Ave./St. Johns Pl. 2 5 8 4 0
Thomas Boyland/Atlantic Aves. 5 2 9 12 3
Saratoga Ave./Sterling Pl. 8 2 0 10 4
Eastern Pkwy/Hopkinson Ave. 7 2 3 4 6
Total 63 28 45 76 43
The analysis suggests that from a traffic operation and safety point of view the following
locations should be given special attention:
1. Eastern Parkway and Saratoga Avenue/Sterling Place;
2. Eastern Parkway and Howard Avenue;
3. Eastern Parkway and St. Johns Place;
4. Eastern Parkway and Rockaway Avenue/St. Marks Avenue;
5. Eastern Parkway and Mother Gaston Boulevard/Pacific Street;
6. Atlantic Avenue and Rockaway Avenue;
7. Atlantic Avenue and Hopkinson/Thomas Boyland Avenue;
8. Atlantic Avenue and Saratoga Avenue;
9. Howard Avenue and St. Johns Place; and
10. Pitkin Avenue and Rockaway Avenue.

7-1
7.0 PARKING
7.1 Introduction
Parking plays an important role in the overall transportation system. Inadequate parking could
lead to unnecessary circulation as motorists search for parking spaces, illegally parked, and or
double parked vehicles, thus reducing roadway capacity. The study examined the study area’s
on-street and off-street parking facilities, supply and demand and identified parking shortfalls to
address future parking needs.
There are several on-street and off-street parking facilities throughout the study-area. Off-street
parking facilities are either provided for multi-unit dwellings or commercial and entertainment
establishments. On-street parking is generally permitted, except where prohibited by parking
regulations for street cleaning, bus stops, and designated curb side loading and unloading zones
for trucks.
7.2 Off-Street Parking
A parking survey/inventory was conducted during the AM, midday, PM and Saturday peak
hours, concurrently with traffic counts, to evaluate existing parking capacity and utilization.
There are 32 off-street parking facilities (mostly lots) scattered throughout the study area,
yielding a total of 1,481 available parking spaces. These facilities are adjacent to public and
private entities shown in Figure 7-1. Two of these 32 facilities are for the residents of large
apartment complexes such as those on East New York Avenue between Rockaway Avenue and
Mother Gaston Boulevard and on Atlantic Avenue between Rockaway Avenue and Hopkinson
Avenue. These two large off-street residential parking lots have a combined capacity of about
450 parking spaces. The largest residential complex in the study area, Atlantic Plaza Apartments,
has about 300 parking spaces.

7-2
Figure 7-1
Off-Street Parking Facilities
The parking lot, located on East New York Avenue between Hopkinson Avenue and Bristol
Street, is used by the Police Precinct and has 110 parking spaces combined for officers and staff.
The remaining 29 commercial/residential/public off-street parking lots are located randomly
throughout the study area. Figure 7-1 shows the locations of off-street parking lots within the
study area, while Table 7-1 lists the capacity and utilization for each parking facility. The
number of available parking spaces and utilization rates in some cases are estimated because
access to some facilities was not possible at the time of observation.

7-3
There are only two public off-street parking facilities (Laboriel-Lincan and Park by Jimmy, Inc.)
in the study area that are privately owned and operated. These two lots are located off Pitkin
Avenue, one on Rockaway Avenue and the other on Thatford Avenue, between Belmont Avenue
and Pitkin Avenue, with a combined capacity of 165 parking spaces. The survey showed that
49% of the total available off-street parking capacity was utilized during the average weekday
(Noon-4 PM). On weekdays, the total utilization along the southern section of the study area
(vicinity of Pitkin Avenue) during midday peak hours ranges from 75% to 100%. Table 7-1
shows all off-street facilities listed by type, location, capacity, and average utilization for the
midday peak hours (Noon-4 PM). The majority of off-street facilities, mainly located in the
western and northern sections of the study area, had some spare capacity, while in some parts of
the southern section of study area (along Pitkin Avenue where major commercial activities are
concentrated), demand for on-street and off-street parking regularly matches or exceeds capacity.

7-4
No. Off-Street
Parking
Facility
Type of
Parking Location of
Parking Lot
License
Capacity
Average
Daily
Occupancy
Utilization
(%) Available
Capacity
1 Dunkin Donuts Commercial Atlantic Ave. b/w Saratoga
Avenue & Roosevelt Place 10 3 30 7
2 Residential Lot Pacific St. b/w Saratoga &
Howard Avenues 12 7 58 5
3 Dean Street
Family Center Lot
Dean St. b/w Hopkinson &
Saratoga Avenues 34 30 88 4
4 Atlantic Plaza
Apartments
Residential
Complex
Lot
Dean Street b/w Rockaway
and Hopkinson Avenues 300 132 44 168
5 Residential Lot Pacific St. b/w Mother
Gaston Blvd & Rockaway
Av 10 6 60 4
6 P.S. 178 Lot Dean St. b/w Hopkinson &
Saratoga Avenues 72 60 83 12
7 Residential Lot Dean St. b/w Eastern Pkwy
Extension and Rockaway Av 15 9 60 6
8 Residential Lot Bergen St. b/w Saratoga and
Howard Avenues 36 11 31 25
9 Residential Lot Bergen St. b/w Rockaway &
Hopkinson Avenues 8 5 63 3
10
EMS
Brownsville
Station # 44
Lot Bergen Street b/w Eastern
Parkway Extension and
Rockaway Avenue 25 12 48 13
11 Brownsville
Women’s Center Lot
St. Marks Av. b/w Saratoga
& Howard Avenues 14 6 43 8
12 American
Medical Centers Lot
St. Marks Avenue between
Mother Gaston Blvd and
Eastern Parkway Extension 66 4 6 62
13 The Family Life
Center Lot
Prospect Place between
Saratoga and Howard Aves. 69 5 7 64
14
Mt. Ararat
Church/Senior
Center
Lot Prospect Pl. b/w Eastern
Parkway Extension and
Hopkinson Avenue 20 16 80 4
15 Residential Lot Park Place between Saratoga
and Howard Avenues 32 20 63 12
Table 7-1
Off-Street Parking Facilities by Type, Locations, Capacity and
Utilization (Page 1 of 2)

7-5
No. Off-Street
Parking
Facility
Type of
Parking
Location of Parking
Lot
License
Capacity
Avarege
Occupancy
Utilization
(%)
Avail.
Capacity
16 Chama Brooklyn
Child Dvlt. Center Lot
Sterling Place between
Saratoga and Howard Aves. 13 5 38 8
17 Residential Lot Eastern Parkway between
Park Place and Sterling Pl. 28 20 71 8
18 Unity Temple
Baptist Church Lot
Sterling Pl. b/w Eastern
Pkwy and E. New York Av. 50 47 94 3
19 Residential Lot Sterling Pl. b/w Howard
Ave. & Eastern Parkway 28 16 57 12
20 Residential Lot Saratoga Ave. b/w Sterling
Place & St. Johns Place 15 1 7 14
21 Holy House of
Prayer Lot
Eastern Parkway between St.
Johns Pl. & Lincoln Pl. 20 19 95 1
22 Residential Lot Howard Ave. b/w Lincoln
Place & E. New York Ave. 18 6 33 12
23 Residential Lot E. New York Ave. b/w
Saratoga Av. & Strauss St. 15 2 13 13
24 Residential Lot East New York Ave. b/w
Strauss & Amboy Streets 36 14 39 22
25 Residential Lot E. New York Ave. b/w
Amboy St. & Hopkinson Av 36 10 28 26
26 73rd Precinct Lot E. New York Ave. b/w
Hopkinson Av. & Bristol St. 110 111 122 0
27 Residential Lot Hopkinson Ave b/w. E. New
York & Pitkin Aves. 25 14 0 11
28 Residential Lot E. New York Ave. b/w
Chester St. & Rockaway Av. 23 20 87 3
29* Laboriel-Lincan Public Lot Rockaway Ave. b/w E. New
York & Pitkin Avenues 75 70 93 5
30 Howard Houses
Complex
Residential
Complex E. N. Y. Ave. b/w Rockaway
Ave. & Mother Gaston Blvd 150 66 44 84
31 P.S. 298 Lot Glenmore Ave b/w Watkins
St. and Mother Gaston Blvd 26 19 73 7
32* Park By Jimmy,
Inc. Public Lot
Thatford Ave. b/w Pitkin
Avenue & Belmont Avenue 90 36 40 54
Grand Total 1,481 722 49 759
Table 7-1
Off-Street Parking Facilities by Type, Locations, Capacity and
Utilization (Page 2 of 2)

7-6
7.3 On-Street Parking
On-street parking regulations in the study area affect on-street parking capacity and utilization,
which can vary by time of day. An inventory of the on-street parking regulation and spaces was
made. A complete list of on-street parking regulations is provided in Table 7-2 and Figure 7-2.
The most common parking restrictions in the study area are street cleaning regulations: “No
Parking 8-9:30 AM Monday and Thursday,” and “No Parking 8-9:30 AM Tuesday and Friday.”
These alternate side street cleaning regulations are in effect on Howard Avenue, Saratoga
Avenue and Hopkinson/Thomas Boyland Avenue from Pitkin Avenue to Pacific Street. The
other street cleaning regulations in the study area are as follows: “No Parking 9-10:30AM
Monday and Thursday” and “No Parking 9-10:30AM Tuesday and Friday”; “No Parking 11AM-
1PM Monday and Thursday”; and “No Parking 11AM-1PM Tuesday and Friday”; and “No
Parking 7:30-8AM Except Sunday”; and “No Parking 8-8:30AM Except Sunday”. Figure 7-3
shows alternate side parking regulations throughout the study area.

7-7
Table 7-2
On-Street Parking Regulations and Codes
Code
No.
On-Street Parking Regulation Code
No
On-Street Parking Regulation
1 No Parking Anytime 15 No Parking 8-9:30AM Monday-Thursday
2 No Standing Anytime 16 No Parking 8-9:30AM Tuesday-Friday
3 No Standing Fire Zone 17 No Parking 9-10:30AM Monday-
Thursday
4 No Standing Anytime Except Trucks
Loading/Unloading
18 No Parking 9-10:30AM Tuesday-Friday
5 1 Hour Parking 8AM-7PM Except Sunday
(limited parking)
19 No Parking 11:30AM-1PM Monday-
Thursday
6 1 Hour Parking 8:30AM-7PM Except
Sunday (limited parking)
20 No Parking 11:30AM-1PM Tuesday-
Friday
7 No Parking 7:30-8AM Except Sunday 21 No Standing Monday to Friday 7-10AM
8 No Parking 8-8:30AM except Sunday 22 No Standing Monday to Friday 4-7 PM
9 No Standing 7AM-4PM School Days 23 No Standing Anytime Except Authorized
Vehicles
10 No Parking 7AM-4PM School Days 24 2 Hour Parking 8:30AM-7PM Except
Sunday (limited parking)
11 No Standing 7AM-4PM School Days
Except School Buses
25 No Parking 7:30-8AM Monday-Thursday
12 No Parking 7AM-7PM Monday to Friday 26 No Parking 8-8:30 Tuesday-Friday
13 No Parking Tow-Away Zone 8-9AM
Tuesday-Friday
27 No Parking 7-10AM Monday to Friday
14 No Parking 8-9AM Monday-Thursday 28 No Parking 4-7PM Monday to Friday

7-8
Figure 7-2
On-Street Parking Regulations

7-9
Figure 7-3
Alternate Side Parking Regulations

7-10
Corridors with Rush Hour Regulations
There are three east/west corridors (Atlantic Avenue, Eastern Parkway, and East New York
Avenue) that have “No Parking 7-10 AM or 4-7PM,” and or “No Standing Anytime,” regulations
during rush hours to ensure the parking lane is available for traffic flow (see Figure 7-4). During
the AM peak (7-10 AM) on-street parking is prohibited in the westbound direction on the main
corridors and during the PM (4-7 PM) peak rush hours on-street parking is prohibited in the
eastbound direction.
Figure 7-4
Corridors with Rush Hour Regulations

7-11
On-Street Parking Supply and Demand
The on-street parking survey showed that 59% of the available on-street parking capacity was
utilized during the average weekday (Noon-4 PM). Of approximately 2,824 on-street parking
spaces, 1,660 were occupied when the survey was conducted. Figure 7-6 shows on-street parking
capacity and utilization for each block face during the highest midday peak hour.
Figure 7-5
On-street Parking Capacity and Utilization

7-12
Table 7-3 (Page 1of 2)
On-Street Parking Capacity and Utilization
Roadway Supply Utilization (Noon-4 PM)
Street Name Curb-
side
Legal Capacity
(#) Actual
Demand (#)
Utilized
(%)
Atlantic Avenue b/w Howard
Ave. and Mother Gaston Blvd N* 83 13 16
S* 75 41 55 Pacific St. b/w Howard Ave. &
Thomas Boyland Ave N 65 60 92
S 41 22 57 Pacific St. b/w Rockaway Ave.
and Mother Gaston Blvd N 20 17 85
S 30 5 17 Dean St. b/w Howard Avenue
and Mother Gaston Blvd N 89 64 72
S 115 50 44 Bergen St. b/w Howard Ave.
and Mother Gaston Blvd N 115 83 72
S 107 50 47 St. Marks Ave. b/w Howard
and E. New York Aves. N 104 60 58
S 101 57 56 Prospect Pl. b/w Howard and
Rockaway Avenues N 77 38 49
S 84 36 43 Parks Place b/w Howard
Avenue and Bristol Street N 61 35 57
S 68 26 38 Sterling Place b/w Howard
Avenue and Amboy Street N 54 31 57
S 37 13 35 St. Johns Place b/w Howard
Avenue and Strauss Street N 21 17 81
S 25 10 40 Lincoln Place b/w Howard
Avenue and Legion Street N No Parking N/A N/A
S 16 10 63 Pitkin Ave. b/w Howard Ave.
and Mother Gaston Blvd N 97 76 78
S 95 84 88 Eastern Pkwy b/w Howard Ave
and Mother Gaston Blvd N* 95 15 16
S* 77 36 47 E. N. York Ave. b/w Howard
Ave. and Mother Gaston Blvd N 45 21 47
S 67 59 88 Glenmore Ave. b/w Watkins St.
and Mother Gaston Blvd N 15 13 88
S 7 5 71 Howard Avenue b/w Atlantic
Avenue and Pitkin Avenue E 80 27 34
W 97 66 68 Saratoga Avenue b/w Atlantic
Avenue and Pitkin Avenue E 74 36 49
W 74 48 65 Strauss Street b/w East New
York Avenue and Pitkin E 11 8 72
W 13 13 100 Herzl Street at Pitkin Avenue E 4 2 50
W 3 3 100 Amboy St. b/w E. New York
Avenue and Pitkin Avenue E 20 20 100
W 19 17 90

7-13
Table 7-3 (Page 2 of 2)
On-Street Parking Capacity and Utilization
Roadway Supply Utilization (Noon-4 PM)
Street Name Curb-
side
Legal Capacity
(#) Actual demand
(#)
Utilized
(%)
Amboy St. b/w E. New York E 20 20 100
and Pitkin Avenues W 19 17 90 Thomas Boyland/Hopkinson Ave.
b/w Atlantic and Pitkin Aves. E 87 73 84
W 54 26 48 Bristol Street b/w East New York
Avenue and Pitkin Avenue E 28 26 93
W 14 11 79 Chester Street b/w East New York
Avenue and Pitkin Street E 30 24 80
W 31 25 81 Rockaway Avenue b/w Atlantic
Avenue and Pitkin Avenue E 70 57 81
W 53 38 72 Thatford Avenue at Pitkin
Avenue E 3 2 67
W 3 2 67 Osborne Street at Pitkin Avenue E 3 1 33
W 3 2 67 Watkins Street at Pitkin Avenue E 10 5 50
W 10 2 20 Mother Gaston Blvd b/w Atlantic
Avenue & E. New York Avenue E 16 7 44
W 32 26 81 Mother Gaston Blvd b/w E. New
York Avenue and Pitkin Avenue E 49 24 49
W 47 22 47
Total Capacity/Utilization 2,824 1,660 59
*Rush hour regulations enforced on Atlantic Avenue, East New York Avenue and on Eastern Parkway from Monday
to Friday 7-10AM on the north curb (WB) and 4-7PM on the south curb (EB).
There are number of areas, predominantly in the southern and eastern sections of the study area,
with higher utilization and shortfalls during various peak hours while in the northern and western
sections of the study area occupancy rates are significantly lower. The highest utilization
occurred on Pitkin Avenue as well as on its surrounding street blocks where intensive
commercial activities occur.

8-1
8.0 PUBLIC TRANSPORTATION
8.1 Introduction
Public transportation plays an important role in the transportation systems. The main transit
service provider in the study area is MTA - NYC Transit (NYCT). Within the study area
direct transportation options include buses and car services. To access subways or the Long
Island Railroad (LIRR) one has to travel a short distance approximately 1/4 mile outside the
study area. The study area is well served by buses.
8.2 Surface Transit (Bus Service)
There are four local bus lines (B7, B12, B14, and B60) that serve the study area. They
operate on three of the major north-south corridors (Saratoga Avenue, Thomas Boyland
Street, and Rockaway Avenue) and two major cross-town streets (East New York Avenue
and Pitkin Avenue). Figure 8-1 shows the existing buses routes in the study area, while
Table 8-1 provides headway information.
Table 8-1
Average Frequency of NYCT Bus Service (in minutes)
Headway (in minutes)
Weekday
Saturday
Sunday
Ro
ute
AM
No
on
PM
Ev
e
Nig
ht
AM
No
on
PM
Ev
e
Nig
ht
AM
No
on
PM
Ev
e
Nig
ht
B7
10
20
12
18
60
20
20
15
15
NS
30
30
20
20
60
B12
9
13
12
12
40
14
13
13
14
40
12
17
13
15
40
B14
12
12
12
12
55
15
12
11
12
60
20
15
15
20
60
B60
6
10
10
12
60
20
11
10
12
60
20
10
12
15
60
Notes: Time Periods: AM= 7-9 AM, Noon= 11 AM-1 PM, PM= 4-7 PM, Eve= 7-9 PM and Night= Midnight - 4 AM
ns = no service during time period.

8-2
Figure 8-1
Local Bus Routes/Subway Routes and Stations
The following is a brief description of each bus route and the frequency of service within the
study area:
B7 - Midwood/Flatlands and Bedford-Stuyvesant
The B7 operates between Midwood/Flatlands and Bedford-Stuyvesant in Brooklyn at all
times. In the study area, it provides service along Saratoga Avenue, East New York Avenue,
and Thomas Boyland Street. Headway varies according to demand for service. The
headway during the AM peak hour is 10 minutes and 12 minutes during the PM peak hour.
B12 – Cypress Hills and Prospect-Lefferts Garden
The B12 operates between Cypress Hills and Prospect-Lefferts Garden in Brooklyn at all
times. In the study area, it provides service along East New York Avenue between Howard
Avenue and Mother Gaston Avenue. Headway varies according to demand for service. The
headway during the AM peak hour is nine minutes and 12 minutes during the PM peak hour.

8-3
B14 - Crown Heights and Eldert Lane/Linden Boulevard
The B14 operates between Crown Heights and Eldert Lane/Linden Boulevard in Brooklyn at
all times. In the study area, it provides service along Pitkin Avenue between Howard Avenue
and Mother Gaston Avenue. Headway varies according to demand for service. The headway
during the AM and PM peak hours is 12 minutes.
B60 – Canarsie and Williamsburg
The B60 operates between Canarsie and Williamsburg in Brooklyn at all times. In the study
area, it provides service along Rockaway Avenue between Atlantic Avenue and Pitkin
Avenue. Headway varies according to demand for service. The headway during the AM peak
hour is six minutes and 12 minutes during the PM peak hour.
8.3 Subway and Commuter Railroad (LIRR) Services
Subways
There are no subway lines passing through the study area, but there are subway stations on
the periphery (about 1/4 mile) of the study area. The A and C line stops at Ralph Avenue,
Saratoga Avenue, and Broadway Junction that are just north of the study area boundaries.
The J, Z, and L trains stop at Broadway Junction; and the #3 train runs south of the study
area with two stops, Saratoga Avenue and Rutland/Sutter Avenues, in close proximity to the
study area.
Commuter Railroad (LIRR)
The Long Island Railroad (LIRR) passes throughout the study area (below grade), along
Atlantic Avenue but has no stops in the study area. The nearest station to the study area is
East New York Avenue/Atlantic Avenue, several blocks to the east of the study area.

8-4
A significant portion of study area residents (66%) use the public transportation for journey
to work compared to about one-third that use automobiles. The existing bus network
adequately addresses current demands for travel and it is anticipated that it will satisfy future
demands. Because there are no subways or commuter rail stations in the study area heavy
reliance will be on buses.
There is a proposal for bus stops consolidation along Saratoga Avenue (see
recommendations).

9-1
9.0 RECOMMENDATIONS
The analysis of the existing and future traffic conditions revealed that there are several
locations in the study area that can be improved with respect to mobility and safety of all
street users (motorists, pedestrians, cyclists) by making changes to roadway configuration,
signal timing, truck loading/unloading, bus stop location, parking restriction, signs and
markings.
The following locations are identified for improvements:
1. Saratoga Avenue and Eastern Parkway/Sterling Place (roadway restriping, signs and
markings, left turn prohibition, and installation of neckdowns);
2. Rockaway Avenue and Atlantic Avenue (removal of curbside parking, roadway
restriping, and signal timing changes);
3. Rockaway and Pitkin Avenues (removal of curbside parking and roadway restriping);
4. Eastern Parkway and St. Johns Place (neckdowns);
5. East New York Avenue and Pitkin/Hopkinson Avenues, Atlantic Avenue and
Hopkinson/Saratoga Avenues (signal timing changes);
6. Saratoga Avenue between Eastern Parkway and East New York Avenue (consolidation of
bus stops);
7. Pitkin Avenue from Howard Avenue to Mother Gaston Boulevard (installation of truck
loading/unloading zones, parking restrictions and crosswalk refurbishing);
8. Install 2 hour limited parking (10AM-7PM) at adjacent streets (approximately five
parking spaces) to Pitkin Avenue to increase parking turnovers (Figure 9-1).
9. Streetscape improvement at triangular area between Eastern Parkway, Prospect Place and
Thomas Boyland Avenue (pedestrian plaza); and
10. Various safety improvements are recommended for the following intersections: Eastern
Parkway and Mother Gaston Boulevard, Eastern Parkway and Howard Avenue, Howard
Avenue and St. Johns Place, Eastern Parkway and Rockaway Avenue/St. Marks Avenue,
Atlantic Avenue and Hopkinson Avenue, and Atlantic Avenue and Saratoga Avenue

9-2
Figure 9-1 below shows locations proposed for improvements..
Figure 9-1
Locations for Proposed Improvements
The results of the capacity analysis for 22 locations indicated that some approaches have
poor levels of service. Table 9-1 shows those approaches with LOS E and F along with
improvement measures for the various peak hours. All other approaches operate at acceptable
LOS (A, B and C) and are listed in Table 4-2. Recommended improvements follow:

V/C Delay LOS V/C Delay LOS V/C Delay LOS NB/SB EB/WB
Eastern Pkwy @ Saratoga Ave. SB LTR 0.96 65.60 E LTR 1.01 77.10 E 0.65 39.90 D
Atlantic @ Saratoga Avenues EB L 0.87 97.60 F L 0.99 108.20 F 0.77 53.40 D +5/-5 secs.
Atlantic @ T. Boyland Avenues EB L 0.76 70.70 E L 0.78 71.10 E 0.84 54.70 D -2 secs. +2 secs.
EB L 0.39 59.70 E L 0.51 65.30 E 0.33 54.80 D +2/-2 secs.
WB L 1.02 125.50 F L 1.13 159.30 F 0.94 90.70 F +2/-2 secs.
NB LTR 0.96 71.10 E LTR 1.00 78.60 E 0.48 30.80 C
SB LTR 0.98 87.30 F LTR 1.00 90.50 F 0.45 39.00 D
Atlantic Ave. @ Eastern
Pkwy/Mother Gaston Blvd WB TR 1.02 61.60 E TR 1.03 64.30 E 0.99 51.80 D -2 secs. +2 secs.
V/C Delay LOS V/C Delay LOS V/C Delay LOS NB/SB EB/WB
Pitkin @ Rockaway Avenues SB LTR 0.87 58.80 E LTR 0.89 62.00 E 0.44 27.70 C
Atlantic @ Saratoga Avenues WB L 0.85 81.80 F L 0.93 98.30 F 0.68 54.40 D +3/-3 sec.
Atlantic @ Thomas Boyland Aves EB L 0.75 62.20 F L 0.78 65.60 F 0.73 54.20 D -2 secs. +2 secs.
EB L 0.55 54.60 D L 0.61 57.90 E 0.43 43.70 D +3/-3 secs.
WB L 0.93 88.60 F L 1.10 135.60 F 0.73 53.20 D +3/-3 secs.
NB LTR 0.89 48.80 D LTR 1.02 77.60 E 0.44 23.70 C
SB LTR 0.96 71.00 E LTR 0.99 79.20 E 0.48 31.20 C
V/C Delay LOS V/C Delay LOS V/C Delay LOS NB/SB EB/WB
E. New York @ T. Boyland Aves. EB LTR 1.00 63.70 E LTR 68.3 68.3 E 0.95 51.6 D -3 secs. +3 secs.
Pitkin @ Rockaway Avenues SB LTR 0.94 64.90 E LTR 0.98 74.30 E 0.39 26.70 C
EB TR 0.72 53.00 D TR 0.79 57.20 E 0.73 51.60 D -4 secs. +2/+2 secs.
WB L 0.77 65.50 E L 0.82 71.10 E 0.67 53.50 D -4 secs. +2/+2 secs.
Eastern Pkwy @ Saratoga Avenue SB LTR 0.94 62.60 E LTR 1.00 75.40 E 0.67 40.60 D
Eastern Pkwy @ Rockaway Av. SB LTR 0.86 54.90 D L/TR 0.86 70.20 E 0.76 42.40 D
Atlantic @ Saratoga Avenues WB L 1.02 133.00 F L 1.06 141.20 F 0.55 54.20 D -5/+5 secs.
Atlantic @ T. Boyland Aves. EB L 0.81 76.10 E L 0.88 93.30 F 0.72 54.80 D -2 secs. +2 secs.
EB L 0.67 75.30 E L 0.70 78.40 E 0.42 54.40 D -4 secs. +4 secs.
WB L 1.04 125.20 F L 1.14 159.30 F 0.84 75.30 E -4 secs. +4 secs.
NB LTR 0.89 57.50 E LTR 0.97 73.00 E 0.51 34.20 C
SB LTR 0.98 85.20 F LTR 1.04 99.00 F 0.57 44.60 D
V/C Delay LOS V/C Delay LOS V/C Delay LOS NB/SB EB/WB
Atlantic @ Saratoga Avenues WB L 0.82 90.50 F L 0.90 105.00 F 0.48 53.90 D +5/-5 secs.
EB L 0.54 65.80 E L 0.59 68.90 E 0.41 54.80 D -2 secs. +4/-2 secs.
WB L 1.04 132.00 F L 1.13 160.00 F 0.83 70.70 E -2 secs. +4/-2 secs.
SB LTR 0.88 65.50 E LTR 0.94 74.00 E 0.60 44.50 D
Rem. parking/restr. 2 lanes * - Remove parking and restripe roadway to 2 moving lanes
Rem. parking/restr. 3 lanes ** - Remove parking and restripe roadway to 3 moving lanes
Poor LOS / Proposed measures
+2/-2 secs - Realocated time from one phase to the other phase for the same approach (for instance: from LTR phase to excl. left turn phase).
Footnote: Other approaches have not been impacted by improvement measures.
Atlantic @ Rockaway Avenues
Atlantic @ Rockaway Avenues
SATURDAY PEAK HOUR
Lane
Group
Future Condition Improvement Condition Proposed MeasuresIntersection Approach
AM PEAK HOUR
Atlantic @ Rockaway Avenues
Atlantic @ Rockaway Avenues
Lane
Group
Future Condition
Pitkin @ Howard/E.N.Y Avenues
Proposed MeasuresIntersection Approach
Lane
Group
Existing Condition
Lane
Group
Existing Condition
Future Condition Improvement ConditionLane
Group
Lane
Group
Existing ConditionIntersection
TABLE 9-1
IMPROVEMENT MEASURES
Intersection ApproachLane
Group
Existing Condition
Improvement Condition
Lane
Group
Future Condition
Rem. parking/restr. 2 lanes*
Proposed Measures
Improvement Condition Proposed Measures
Rem.parking/restr. 2 Lanes*
Rem. parking/restr. 2 lanes*
Rem.parking/restr. 3 lanes**
MIDDAY PEAK HOUR
PM PEAK HOUR
Rem. parking/restr. 2 lanes*
Approach
Rem. parking/restr. 2 lanes*
Rem. parking/restr. 2 lanes*
Rem. parking/restr. 2 lanes*
Rem. parking/restr. 3 lanes**
Rem. parking/restr. 3 lanes**
Rem. parking/restr. 2 lanes*
Rem. parking/restr. 2 lanes*

9-4
Saratoga Avenue and Eastern Parkway/Sterling Place
1. Extend the existing concrete medians on Eastern Parkway to crosswalk (about 60 feet
on the east side of roadway and 80 feet on the west side) to provide refuge for
pedestrian safety (see picture below).
2. Prohibit left turns from Eastern Parkway onto Sterling Place.
3. Install five neckdowns; one each on the southwest and northwest corner of Sterling
Place and Eastern Parkway, and one on the southeast corner of Saratoga Avenue at
Eastern Parkway, and the other on the northeast corner of Sterling Place at Eastern
Parkway.
4. Remove curbside parking (100 feet) and restripe three moving lanes (L, T, TR) on
Saratoga Avenue southbound approach and install “No Standing 7-10 AM and 4-7
PM” signs on both side curbs.
The aerial photo and Figure 9-2 show the proposed improvements for the intersection.

9-5
Saratoga Avenue and Eastern Parkway/Sterling Place
Proposed Conditions
For more details see Figure 9-2.

9-6
Figure 9-2
Eastern Parkway and Saratoga Avenue/Sterling Place
Existing Conditions Proposed Conditions
Sara
toga A
ve.
Eastern Parkway
34'
35'
44'
N
35'
32'
32'
32'
32'
60'
50'
30'
5'
Sterling Pl
Sterling Pl
Sara
toga A
ve
Sterling Pl
Sterling Pl
5'
80'
60'
32'
32'
32'
32'
35'
N
35'
34'
Eastern Parkway
Sara
toga A
ve.
Remove 5 parking
spaces and restripe SB
approach to provide 3
moving lanes and
install "No Standing
7-10AM & 4-7PM"
signs.
12' 11'11'
Extend raised
median 60'
Extend raised
median 80'
25'
80'80'
Install neckdown
25'
20'
No
Park
ing
8:3
0-9
AM
Mo
n-T
hu
rs
Ex
cep
t S
un
day
No
Park
ing
8:3
0-9
AM
Tu
e-F
rid
ay
Ex
cep
t S
un
day
No
Park
ing
8:3
0-9
AM
Tu
e-F
rid
ay
Ex
cep
t S
un
day
No
Park
ing
8:3
0-9
AM
Mo
n-T
hu
rs
Ex
cep
t S
un
day
No Parking 7-10 AM
Mon-Friday
No Parking 4-7 PM Mon-Friday
No Parking 9-10:30AM Tue-FridayExcept Sunday
No Parking 9-10:30
AM Mon-Thurs
Except Sunday
No Parking 8:30-9AM Tue-FridayExcept Sunday
No
Park
ing
8:3
0-9
AM
Mo
n-T
hu
rs
Ex
cep
t S
un
day
Install sign
"No L-turns"
Install neckdown
10
0'
10'
10'30'
30'
Remove 4 parking
spaces and install "No
Standing 7-10AM &
4-7PM" signs.
10
0'
30'
30'

9-7
Rockaway Avenue and Atlantic Avenue
1. Remove curbside parking for 100 feet on the northbound and southbound approaches
and restripe roadway to provide two moving lanes on each approach and install “No
Standing 7 AM to 7 PM” signs for both approaches.
2. Shift signal timing 2, 3, 4, and 2 seconds from north-southbound phase to east-
westbound phase during the AM, midday, PM, and Saturday midday peak hours,
respectively.
The aerial photo below and Figure 9-3 show the proposed improvement for the intersection.
Rockaway Avenue and Atlantic Avenue - Proposed Conditions
Bus Stop
Bus Stop

9-8
Figure 9-3
Atlantic Avenue and Rockaway Avenue
Existing Conditions Proposed Conditions
Rock
aw
ay A
ve
10'
10'
10'
10'
10'
18'
18'
10'
10'
10'
10'
10'
18'
18'
23'23'
23'23'
Atlantic Ave Atlantic Ave
12'
18'
18'
10'
10'
10'
10'
10'
18'
18'
10'
10'
10'
10'10'
Rock
aw
ay A
ve
N
Rem
ov
e 5
park
ing s
paces
and
rest
rip
e S
B a
pp
roach
to
pro
vid
e t
wo
mov
ing l
anes
and
inst
all
"N
o S
tand
ing
7A
M -
7P
M" s
igns.
11'
11'12'
Rem
ove 3
park
ing s
paces
and r
est
ripe N
B a
ppro
ach t
o
pro
vid
e t
wo m
ovin
g l
anes;
Inst
all
"N
o S
tandin
g
7A
M-7
PM
" s
igns.
No Parking 11:30AM-1PM
Mon-Thursday Except
Sunday
No Parking 11:30AM-1PM
Tue-Friday Except Sunday
No Parking 11:30AM-1PM
Tue-Friday Except Sunday
No Parking 11:30AM-1PM
Mon-Thursday Except
Sunday
No Parking 11:30AM-1PM
Tue-Friday Except Sunday
No Parking 11:30AM-1PM
Mon-Thursday Except
SundayN
BU
S S
TO
P
BU
S S
TO
P
80'
80'
BU
S S
TO
P
BU
S S
TO
P
No Parking 11:30AM-1PM
Mon-Thursday Except
Sunday
10
0'
10
0'

9-9
Rockaway Avenue and Pitkin Avenue
Remove curbside parking for 100 feet on the southbound approach and restripe two moving
lanes and install “No Standing 7 AM to 7 PM” signs. The picture below and Figure 9-4 show
the proposed improvement for the intersection.
Rockaway Avenue and Pitkin Avenue
Proposed Conditions
In the study area, a total of 22 parking spaces will be lost during 7AM-7PM to facilitate
traffic operations.
Bus Stop
Bus Stop

9-10
Figure 9-4
Pitkin Avenue and Rockaway Avenue
Existing Conditions Proposed Conditions
20'
21'21'
21'21'
Pitkin Ave
Rem
ove
4 p
ark
ing s
pace
s
and r
est
ripe
SB
appro
ach t
o
pro
vid
e t
wo m
ovin
g l
anes
and i
nst
all
"N
o S
tandin
g
7A
M -
7P
M"
signs.
Ro
ckaw
ay A
ve
20'20'
20'
20'
20'
20'
Ro
ckaw
ay A
ve
Pitkin Ave
21' 21'
10' 21'
20'
11'
Bus
Sto
p
No P
ark
ing 8
-8:3
0 A
M
Ex
cep
t S
unday
No Parking 8-8:30 AMExcept Sunday
1 HR 8:30-7 PM
Except Sunday
1 H
R 8
:30-7
PM
Ex
cep
t S
unday
1 HR 8:30-7 PM
Except Sunday
Bus
Sto
p
1 H
R 8
:30-7
PM
Ex
cep
t S
unday
1 HR 8:30-7 PMExcept Sunday
Bus S
top
Bus S
top
No P
ark
ing 8
-8:3
0 A
M
Ex
cep
t S
unday
No Parking 8-8:30 AM
Except SundayN
N
80'
80'
100'
No Parking 8-8:30 AM
Except Sunday
1 H
R 8
:30-7
PM
Ex
cep
t S
unday
No P
ark
ing 8
-8:3
0 A
M
Ex
cep
t S
unday
No Parking 8-8:30 AMExcept Sunday
1 HR 8:30-7 PM
Except Sunday
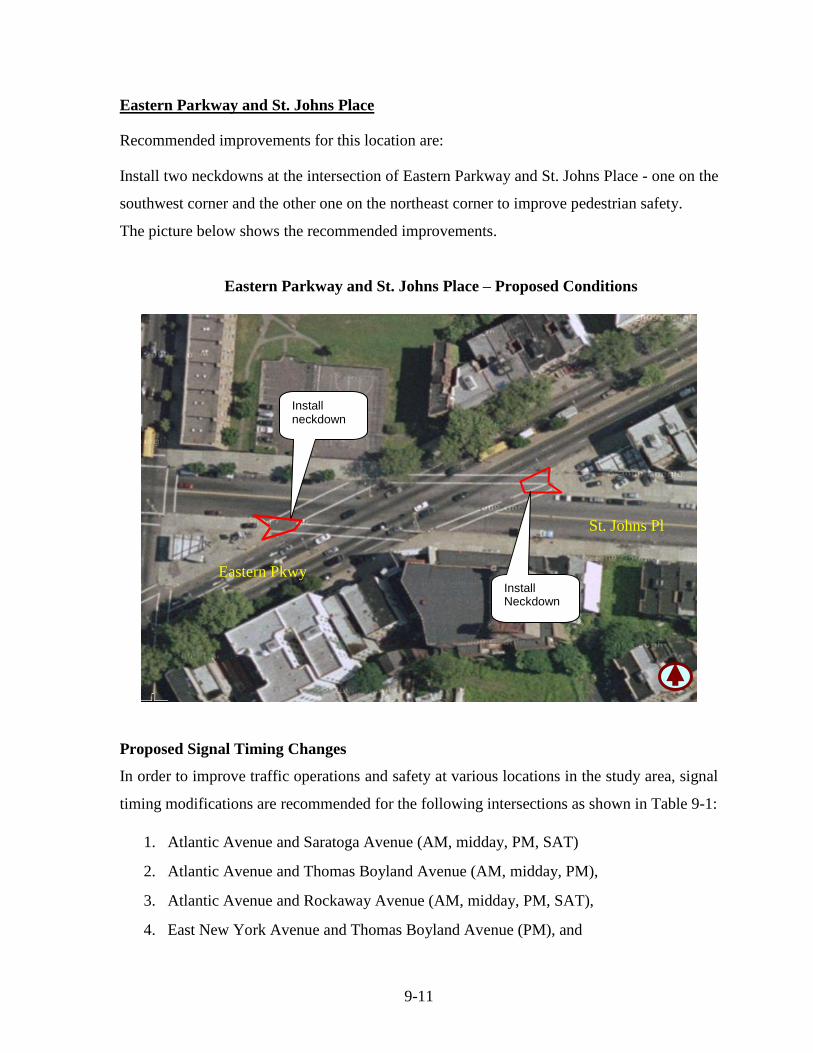
9-11
Eastern Parkway and St. Johns Place
Recommended improvements for this location are:
Install two neckdowns at the intersection of Eastern Parkway and St. Johns Place - one on the
southwest corner and the other one on the northeast corner to improve pedestrian safety.
The picture below shows the recommended improvements.
Eastern Parkway and St. Johns Place – Proposed Conditions
Proposed Signal Timing Changes
In order to improve traffic operations and safety at various locations in the study area, signal
timing modifications are recommended for the following intersections as shown in Table 9-1:
1. Atlantic Avenue and Saratoga Avenue (AM, midday, PM, SAT)
2. Atlantic Avenue and Thomas Boyland Avenue (AM, midday, PM),
3. Atlantic Avenue and Rockaway Avenue (AM, midday, PM, SAT),
4. East New York Avenue and Thomas Boyland Avenue (PM), and
Install neckdown
Install Neckdown
Eastern Pkwy
St. Johns Pl

9-12
5. Pitkin Avenue and Howard/ East New York Avenues (PM).
Proposed Loading/unloading Zones
One of the most congested corridors in the study area is Pitkin Avenue with significant
delivery activity and heavy vehicular and pedestrian traffic associated with commercial
establishments. The designation of three truck loading/unloading zones is proposed along
Pitkin Avenue (between Watkins/Osborn, Bristol/Chester, and Hertz/Strauss Streets), this
would eliminate conflicts caused by double parking and illegal truck movements for
loading/unloading activities. For each proposed loading/unloading zone, approximately three
parking spaces would be removed (60’). A total of approximately 18 parking spaces would
lost. In addition to the Pitkin Avenue loading zones, similar zones approaching or abutting
Pitkin Avenue on Hopkinson Avenue, Rockaway Avenue and Mother Gaston Boulevard are
proposed. “No Parking Except Truck Loading and Unloading from 10 AM to 4 PM Monday-
Friday” would also be installed. Figure 9-1 (on page 9-2), shows locations of the proposed
loading zones along Pitkin Avenue.
Transit Improvements
Illegal parking was observed in bus stops at the intersections of Pitkin/Hopkinson Avenues,
Pitkin/Rockaway Avenues, and Pitkin Avenue and Mother Gaston Boulevard. Strict
enforcement is recommended to minimize these violations to improve traffic and transit
operations.
Consolidation of bus stop on Saratoga Avenue between Eastern Parkway and East New York
Avenue are also recommended. Currently, there are three bus stops in close proximity
between Eastern Parkway and East New York Avenue. Combining the stops on Saratoga
Avenue/St. Johns Place and Saratoga/East New York Avenues would be more functional as
the existing bus stop at Saratoga/East New York Avenues does not have adequate storage.
The length of the block between Saratoga/East New York Avenues and Saratoga Avenue/St.
Johns Place is only approximately 45 feet, thus when the bus is in the stop it blocks the
crosswalk and compromise safety. The picture below shows the existing bus stop.

9-13
Existing B7 bus stop on Saratoga Avenue at East New York Avenue (looking southwest)
The aerial photo below shows the existing and proposed combined bus stops.
Existing and proposed bus stops
New York Avenue
Sara
tog
a A
ven
ue
St John’s Pl
Eastern Parkway
Sterling Pl
Distance on Saratoga
Avenue between St
John’s Pl and New York
Avenue is only 37 feet
long, not adequate for a
bus stop to located here.
Legend
Existing MTA bus stop (B7) locations
Combined MTA bus stop (B7) locations
The existing two bus stops
are very close to each other.
Recommended to combine
them and locate it at the
north west corner of St.
John’s Pl/Saratoga Avenue.
New bus
stop

9-14
Prospect Place Plaza at Eastern Parkway/Thomas S. Boyland Avenue
At the request of a Council Member, the New York City Department of Transportation has
designated Prospect Place between Eastern Parkway and Thomas S. Boyland Avenue as a
Restricted Use Street, adjacent to a traffic triangle, to enhance the pedestrian environment
while encouraging walking and community interactions. The proposal would allow the use of
Prospect Place as a pedestrian plaza. The plaza will meet the needs for the surrounding
community by converting a roadway into an inviting open space with decorative paving and
seating area. It will buffer pedestrians from Eastern Parkway traffic while allowing vehicular
access along the west side of the existing traffic triangle on Thomas S. Boyland Avenue,
which will remain open to traffic. Traffic volumes on the proposed closure are insignificant
and can be accommodated on adjacent streets without causing any adverse impacts. This
streetscape improvement was approved and DOT in coordination with Department of Design
and Construction (DDC) has developed final design plans for the pedestrian plaza, but has
not moved to implement because a maintenance partner has not been identified. The aerial
photo below shows the proposed triangular Prospect Place pedestrian plaza.
Eastern Parkway/Thomas Boyland Avenue and Prospect Place
Existing and Proposed Streetscape Conditions
Eastern
Parkway Prospect
Place
Thomas
Boyland
Avenue
Proposed
Pedestrian
Plaza

9-15
Figure 9-5
Prospect Place Plaza at Eastern Parkway and Thomas Boyland Avenue
Diverted traffic (AM peak)
45
54
5 25
54
5
20
15
54
5
45
54
5
45
54
5

9-16
Safety Improvements
Traffic accidents are random occurrences, most common types of accidents such as rear-end,
left-turn, and right angle occur at various locations; however, certain remedies and measures
can be applied to improve overall safety, were appropriate. Based on the safety/accident
analysis the following locations were identified for specific safety improvements
complementing the recommendations proposed to improve traffic operations and circulation:
Eastern Parkway and Mother Gaston Boulevard/Pacific Street
Apply the following measures to improve the safety at this intersection:
- Move “Stop bar” farther back about 10 feet (from its existing 3 feet) from crosswalk;
- Remove one parking space and daylight the south-east corner (westbound approach)
to improve visibility for motorists on Pacific Street; and
- Relocate pedestrian ramp on the south-west corner near to the crosswalk (a pedestrian
ramp currently exists about five feet away from the crosswalk).
Howard Avenue and St. Johns Place
Apply the following remedies to improve the safety at this intersection:
- Remove one parking space on the east curb of northbound approach and one parking
space on the south curb of eastbound receiving lane;
- Remove sight distance obstruction and improve visibility by trimming tree branches
on the north-east corner of the intersection; and
- Refurbish markings for all four crosswalks.
Atlantic Avenue and Saratoga Avenue
To improve traffic operations signal timing changes were recommended as a result of the
HCS analysis. In addition, the following remedies are proposed to enhance safety:
- Refurbish pavement markings for all crosswalks at the intersection; and
- Install advance intersection warning signs to yield to pedestrians.
See Table 9-2 for all proposed improvement measures.

No. Intersection/Area Peak Period Proposed Improvement Measures Division Status
7AM-7PM Remove curbside parking for 100' and restripe NB/SB approches to provide 2 moving lanes and install No Standing signs.Highway Design, Parking, Signs and Markings,
Borough Eng.
AM ● Shift 2 secs. of green time from the EB/WB through phase to EB/WB excl. left phase
MD ● Shift 3 secs. of green time from the EB/WB through phase to EB/WB excl. left phase
PM ● Shift 4 secs of green time from the NB/SB phase to EB/WB excl. left phase
SAT MD ● Shift 2 secs. of green time from the NB/SB phase and 2 secs. from EB/WB through phase to EB/WB excl. left phase
(adding 4 secs.)
AM, MD, PM ● Shift 2 secs. of green time from the NB/SB phase to EB/WB excl. left phase
All Time Periods Refurbish all pavement markings and crosswalks and install advance warning signs to yield pedestrins. Highway Design, Borough Eng.
AM, PM, SAT ● Shift 5 secs. of green time from the EB/WB through phase to EB/WB excl. left phase
MD ● Shift 3 secs. of green time from the EB/WB through phase to EB/WB excl. left phase
All Time Periods Remove one parking space from southeast curb and install advance warning signs to yield pedestrins; refurbish all
pavement markings and crosswalks.Signs and Markings, Parking, Borough Engineering
4Eastern Parkway @ Saratoga
Avenue @ Prospect Pl
7-10AM & 4-7PM
All Time Periods
Remove curbside parking (100') and restripe Saratoga Avenue SB approach to provide three moving lanes and install No
Standing signs; Extend raised medians (60' & 80') on Eastern Parkway to crosswalks. Install 4 neckdowns and install "No
Left-turn" signs for traffic from Eastern Parkway onto Sterling Place.
Signs and Markings, Highway Design, Borough
Engineering, SIMS
5 Pitkin @ Rockaway Avenues 7AM & 7PM Remove curbside parking for 100' and restripe SB approach to provide 2 moving lanes; install No Standing signs.Highway Design, Signs and Markings, Borough
Engineering
6Pitkin Avenue @ Howard
Avenue/E. New York Avenue PM ● Shift 4 secs. of green time from the NB/SB phase to EB/WB through (2 secs.) and excl. left turn phase (2 secs.) Signals
7East New York Avenue @ Thomas
Boyland AvenuePM ● Shift 3 secs. of green time from the NB/SB phase to EB/WB phase Signals
8Public Transportation
RecommendationsNYCT/DOT Bus Mgmt unit, Signs and Markings.
9 Proposed pedestrian plaza Highway design, Boro Eng., DDC.
12Eastern Parkway @ Mother Gaston
Blvd/ Pacific Street.
Signs and Markings, Highway Design, Boro Eng.,
SIMS
13 Eastern Parkway @ Howard Ave.Signs and Markings, Highway Design, Boro Eng.,
SIMS
14 Howard Avenue @ St Johns Place Signs and Markings, Borough Eng.
15 Eastern Parkway @ St Johns Place Highway Design, Borough Eng. SIMS
Remove two parking spaces and daylight SE/SW corners. Install neckdown on S-W corner and "slippery when wet" signs.
Create two neckdowns; one on southwest corner and other on northeast corner.
11 Proposed parking restrictions Install limited parking (2 HR from 10AM -7PM Exc. Sunday) at abutting streets to Pitkin Avenue
Prohibit two parking spaces on NB corner and EB receiving lane; remove sight distance obstructions and refurbish markings for all 4 C-walks.
Remove one parking space and daylight SE corner; Move Stop bar farther back 10', and relocate ped. ramp on the SW corner.
Table 9-2
1Atlantic Avenue @ Rockaway
AvenueSignals
Signs and Markings, Parking, Borough Engineering b/w Saratoga Avenue and Chester Street (approx. 1/2 block).
10
Consolidate bus stops on Saratoga Avenue. Prohibit double parking and illegal standing at bus stops along Pitkin Avenue and adjacent streets.
Atlantic Avenue @ Thomas
Boyland Avenue
Install truck loading/unloading and appropriate signs along Pitkin Avenue and abutting streets. Proposed truck loading/unloading
zones and signs
Signals
Recommendations Tracking Sheet
3Atlantic Avenue @ Saratoga
Avenue
Proposed pedestrian plaza at Eastern Parkway and Thomas Boyland Avenue involve redesign of existing triangle. Final design was prepared
by DDC. Meintanence partner has to be identified.
Signs and Markings, Parking, Borough Engineering
9-17

10-1
10.0 CONCLUSION
The analysis of the existing and future conditions relied on various data sources, primary
surveys, field observations and on-site meetings. The effort also relied on input from Community
Board 16, the Technical Advisory Committee and officials from other agencies. Based on the
analyses, a series of recommendations were developed, as outlined in the recommendations
section.
Improvement measures include signal timing changes, parking regulation changes, bus stop
relocation, neckdowns, and roadway restriping which would improve mobility and safety of all
street users.
The recommendations were presented to the Community Board on June 26, 2012 and were
approved for implementation.