northern corridor transport observatory report
TRANSCRIPT

THE TRANSPORT OBSERVATORY REPORT // 11th Issue | November 2017
1
Trade and Transport for Regional Integration
NORTHERN CORRIDOR TRANSPORT OBSERVATORY REPORT
11TH Issue | November 2017
THE TRANSPORT OBSERVATORY REPORT // 11th Issue | November 2017
ii
PARTNERS
DEVELOPMENT PARTNERS
NORTHERN CORRIDOR TRANSIT AND TRANSPORT COORDINATION AUTHORITY
TABLE OF CONTENTSTABLE OF CONTENTS ............................................................................................................................................. iii
LIST OF FIGURES .....................................................................................................................................................vi
LIST OF TABLES ......................................................................................................................................................vii
ABBREVIATION ....................................................................................................................................................... ix
SECTION ONE: INTRODUCTION ............................................................................................................................1
1.1 Introduction .....................................................................................................................................................1
1.2 Key Economic Indicators ..................................................................................................................................3
1.3 Northern Corridor Performance Monitoring ..................................................................................................5
1.4 Methodology .....................................................................................................................................................5
1.5 Mobile Phone Surveys ......................................................................................................................................6 1.6 Analysis and Reporting ....................................................................................................................................7
SECTION TWO: VOLUME AND CAPACITY INDICATORS ....................................................................................8
2.1 Cargo Throughput ............................................................................................................................................9
2.2 Transport Capacity by Rail ............................................................................................................................ 12
2.2.1 Standard Gauge Railway (SGR) .................................................................................................................. 13
2.3 Pipeline Transport Capacity .......................................................................................................................... 15
SECTION THREE: TRANSPORT RATES AND COSTS .......................................................................................... 18
3.1 Road Freight charges in Kenya ...................................................................................................................... 19
3.2 Annual distance covered by trucks in Kenya. .............................................................................................. 20
3.3 Road Freight charges in Burundi ................................................................................................................... 20
3.4 Road Freight charges in DRC ......................................................................................................................... 22
THE TRANSPORT OBSERVATORY REPORT // 11th Issue | November 2017
iii
TABLE OF CONTENTSTABLE OF CONTENTS ............................................................................................................................................. iii
LIST OF FIGURES .....................................................................................................................................................vi
LIST OF TABLES ......................................................................................................................................................vii
ABBREVIATION ....................................................................................................................................................... ix
SECTION ONE: INTRODUCTION ............................................................................................................................1
1.1 Introduction .....................................................................................................................................................1
1.2 Key Economic Indicators ..................................................................................................................................3
1.3 Northern Corridor Performance Monitoring ..................................................................................................5
1.4 Methodology .....................................................................................................................................................5
1.5 Mobile Phone Surveys ......................................................................................................................................6 1.6 Analysis and Reporting ....................................................................................................................................7
SECTION TWO: VOLUME AND CAPACITY INDICATORS ....................................................................................8
2.1 Cargo Throughput ............................................................................................................................................9
2.2 Transport Capacity by Rail ............................................................................................................................ 12
2.2.1 Standard Gauge Railway (SGR) .................................................................................................................. 13
2.3 Pipeline Transport Capacity .......................................................................................................................... 15
SECTION THREE: TRANSPORT RATES AND COSTS .......................................................................................... 18
3.1 Road Freight charges in Kenya ...................................................................................................................... 19
3.2 Annual distance covered by trucks in Kenya. .............................................................................................. 20
3.3 Road Freight charges in Burundi ................................................................................................................... 20
3.4 Road Freight charges in DRC ......................................................................................................................... 22
THE TRANSPORT OBSERVATORY REPORT // 11th Issue | November 2017
iv
3.5 Road Freight charges in Rwanda .................................................................................................................. 23
3.6 Road Freight charges in South Sudan ........................................................................................................... 24
3.7 Road Freight charges in Uganda ................................................................................................................... 25
SECTION FOUR: PRODUCTIVITY AND EFFICIENCY ........................................................................................ 27
4.1 Ship turnaround time .................................................................................................................................... 28
4.2 Ship Waiting Time (Hours) ............................................................................................................................. 28
4.3 Quality of transport infrastructure within the Northern Corridor Road Network ..................................... 30
4.3.1 Summary of road condition for the Northern Corridor ........................................................................... 30
a) Road conditions in Burundi ......................................................................................................................... 30
b) Road conditions in DRC .............................................................................................................................. 31
c) Road condition in Kenya ............................................................................................................................. 33
d) Road condition in Rwanda .......................................................................................................................... 34
e) Road condition in South Sudan .................................................................................................................. 35
f) Road condition in Uganda ........................................................................................................................... 35
4.4 Weighbridge Traffic ....................................................................................................................................... 36
4.5 Weight Compliance at the Weighbridge ...................................................................................................... 37
4.6 Average daily weighed traffic for Uganda Weighbridges ........................................................................... 38
4.7 Weight Compliance for Uganda Weighbridge ............................................................................................. 39
SECTION FIVE: TIME AND DELAYS ................................................................................................................... 40
5.1 Dwell time at Mombasa port ........................................................................................................................ 41
5.2 Time for customs clearance at the Document Processing Centre (DPC) ................................................... 42
5.3 Time taken at Mombasa one stop center (OSC) .......................................................................................... 43
5.4 Delay after customs release .......................................................................................................................... 45
5.5 Clearance of good to DRC ............................................................................................................................. 47
5.6 Transit Time ................................................................................................................................................... 48
5.7 Transit Time in Burundi .................................................................................................................................. 50
5.8 Transit Time in Rwanda ............................................................................................................................... 51
5.9 Transit Time in Uganda .................................................................................................................................. 53
SECTION SIX: INTRA-REGIONAL TRADE .......................................................................................................... 55
6.1 Trade between Burundi and Other NC Member States ............................................................................... 56
6.2 Trade between DRC and Other NC Member States ..................................................................................... 57
6.3 Trade between Kenya and Other NC Member States .................................................................................. 58
6.4 Trade between Rwanda and Other NC Member States .............................................................................. 60
6.5 Trade between South Sudan and Other NC Member States ....................................................................... 62
6.6 Trade between Uganda and Other Northern Corridor Member States ...................................................... 63
THE TRANSPORT OBSERVATORY REPORT // 11th Issue | November 2017
v
SECTION SEVEN: FINDINGS FROM THE GPS AND ROAD SURVEY .............................................................. 66
7.1 Stoppages for Cargo along the Northern Corridor ...................................................................................... 67
7.2 Duration for stops ......................................................................................................................................... 68
7.3 Fees Payment along the Northern Corridor ................................................................................................. 68
7.4 Monitoring One Stop Border Post ................................................................................................................. 70
SECTION EIGHT: ROAD SAFETY ........................................................................................................................ 72
8.1 Fatalities based on Type of Vehicle .............................................................................................................. 73
SECTION NINE: GREEN FREIGHT PROGRAM .................................................................................................... 76
9.1 Port Emissions ................................................................................................................................................ 77
SECTION TEN: SUMMARY OF FINDINGS AND RECOMMENDATIONS ........................................................... 79
10.1 Summary ..................................................................................................................................................... 79
10.2 Recommendations ...................................................................................................................................... 82
10.2.1 Stakeholder engagement strategy ......................................................................................................... 82
10.2.2 Road maintenance approaches ............................................................................................................... 82
10.2.3 Modernization of weighbridges ............................................................................................................... 82
10.2.4 The level of awareness on legal weight limits ....................................................................................... 82
10.2.5 Enhancing intermodal transport .............................................................................................................. 83
10.2.6 Enhancing road safety .............................................................................................................................. 83
10.2.7 Border delays ............................................................................................................................................ 83
10.2.8 Road Side Stations .................................................................................................................................... 84
10.2.9 Emissions at the Port ................................................................................................................................ 84
ANNEXES ............................................................................................................................................................. 86
ANNEXE I: Survey Questionnaire ........................................................................................................................ 92
ANNEX II: Indicator list and Definitions .............................................................................................................. 96

THE TRANSPORT OBSERVATORY REPORT // 11th Issue | November 2017
vi
LIST OF FIGURES
Figure 1: Northern Corridor Transport Infrastructure .......................................................................................2
Figure 2: Number of visitors to the Transport Observatory .............................................................................5
Figure 3: Percentage Increase in Volume by cargo Type ............................................................................... 10
Figure 4: Share of throughput per Destination .............................................................................................. 10
Figure 5: Traffic volume to the Northern Corridor Member States .............................................................. 11
Figure 6: Proportion of Cargo Volume transported by rail in tons ............................................................... 13
Figure 7: Containerized Ship Turnaround Time .............................................................................................. 28
Figure 8: Vessel waiting before berth ............................................................................................................. 29
Figure 9: Average daily weighed traffic for Kenya Weighbridges ................................................................. 36
Figure 10: Weight Compliance Level at weighbridges in Kenya ................................................................... 38
Figure 11: Weight Compliance for Uganda Weighbridges ............................................................................ 39
Figure 12: Containerized cargo dwell time at the Port Jan. to Sept. 2017 .................................................. 41
Figure 13: Dwell time comparison for Central and Northern Corridors (2017) .......................................... 42
Figure 14: Time Taken at the Document Processing Centre (DPC) ............................................................... 43
Figure 15: Time taken at One Stop Centre ..................................................................................................... 45
Figure 17: Delay after Custom Release .......................................................................................................... 46
Figure 18: Single Customs Territory clearance regime goods release at the Port ....................................... 46
Figure 19: RRA SCT release at the Port of Mombasa ................................................................................... 47
Figure 20: Transit Time from Mombasa to Malaba and Busia (hours).......................................................... 49
Figure 21: Transit Time in Burundi .................................................................................................................. 50
Figure 23: Transit time in Rwanda .................................................................................................................. 52
Figure 24: Truck Dwell Time within MAGERWA in Rwanda .......................................................................... 52
Figure 25: Transit time in Uganda using electronic cargo tracking system ................................................. 53
Figure 26: Transit time from Busia to various destinations in Uganda ......................................................... 54
Figure 27: Transit Time from Kampala ............................................................................................................ 54
Figure 28: Imports and Exports between Burundi and NC member States .................................................. 57
Figure 29: Share of Imports and exports in DRC ............................................................................................ 58
Figure 30: A Share of Kenya Exports and Imports ......................................................................................... 58
Figure 31: Total imports and exports from January to June, 2017 ............................................................... 60
Figure 32: Percentage Share of Imports and Exports .................................................................................... 62
Figure 33: Prevalence of Stoppages ............................................................................................................... 67
Figure 34: Number of stops against fee payment .......................................................................................... 68
Figure 35: Average Border crossing time ...................................................................................................... 71
Figure 36: Distribution of Fatalities based on Type of Vehicle ..................................................................... 73
Figure 37: Emissions Projections for the Port of Mombasa........................................................................... 78
THE TRANSPORT OBSERVATORY REPORT // 11th Issue | November 2017
vii
LIST OF TABLES
Table 1: Key Economic Indicators ......................................................................................................................3
Table 2: Ease of doing Business .........................................................................................................................4
Table 3: Cargo Throughput (DWT) .....................................................................................................................9
Table 4: Demand forecast for the Port of Mombasa ..................................................................................... 12
Table 5: Fact Sheet on locomotives ................................................................................................................ 12
Table 6: Railway Net tons and Net Ton-Km .................................................................................................... 13
Table 7: Railway targets .................................................................................................................................. 15
Table 8: Fuel Dispatch from Nakuru, Kisumu and Eldoret depot per country ............................................ 16
Table 9: Monthly Average Fuel dispatch ......................................................................................................... 16
Table 10: Transit volume (M3) dispatched per terminal. ............................................................................... 17
Table 11: Road Users Charges ......................................................................................................................... 19
Table 12: Transport Rates to various destinations in Kenya .......................................................................... 19
Table 13: Average Truck-Kilometre per year in Kenya ................................................................................... 20
Table 14: Road Transport Tariffs in Burundi .................................................................................................... 20
Table 15: Average Truck-Kilometre per year in Burundi ................................................................................ 21
Table 16: Transport rates in DRC ..................................................................................................................... 22
Table 17: Average of Truck Kilometre per year in DRC ................................................................................. 22
Table 18: Transport Rates to various destinations in Rwanda ....................................................................... 23
Table 19: Average truck kilometre per year in Rwanda ................................................................................ 23
Table 20: Road Freight Charges per destination in South Sudan .................................................................. 24
Table 21: Average Truck Kilometre per year in South Sudan ........................................................................ 24
Table 22: Road Freight Charges per destination in Uganda .......................................................................... 25
Table 23: Annual distance covered per truck in Uganda............................................................................... 25
Table 24 International Roughness Index ........................................................................................................ 30
Table 25: Designated Northern Corridor Roads in Burundi ........................................................................... 30
Table 26: Status of the road sections in Burundi ........................................................................................... 31
Table 27: Designated Northern Corridor Roads in DRC ................................................................................. 31
Table 28: Status of the road Sections in DRC ................................................................................................. 32
Table 29: Designated Northern Corridor Roads in Kenya .............................................................................. 33
Table 30: Road condition in Kenya ................................................................................................................. 33
Table 31: Designated Northern Corridor Roads in Rwanda ........................................................................... 34
Table 32: Condition of Road Sections in South Sudan ................................................................................... 35
Table 33: Designated Northern Corridor Roads in Uganda ........................................................................... 36
Table 34: Average Monthly daily weighbridge traffic in Uganda.................................................................. 38
Table 37: Summary of formal Trade (USD) in DRC ......................................................................................... 57
Table 38: Summary of formal Exports (USD), January 2017 to July 2017 .................................................... 58
Table 39: Summary of Formal Exports and Imports, January 2017 to September 2017 ............................. 60
Table 40: Informal trade in Rwanda ............................................................................................................... 62
Table 41: Summary of formal exports and imports, South Sudan in USD .................................................... 63
THE TRANSPORT OBSERVATORY REPORT // 11th Issue | November 2017
viii
Table 42: Uganda Formal Intra-Regional Trade (USD) ................................................................................... 64
Table 43: Informal trade in Uganda in USD .................................................................................................... 65
Table 44: Duration for Stops ........................................................................................................................... 68
Table 45: Fatalities on the Northern Corridor- October 2016- March 2017 ................................................ 74
Table 46: Causes of Accidents in Kenya along the Northern Corridor ......................................................... 74
Table 47: Road fatalities in Uganda ................................................................................................................ 75
Table 48: Summary of Port Emissions by Sources ......................................................................................... 77
Table 49: Summary of Transport Tariffs .......................................................................................................... 80
Table 50: Summary of Transit time ................................................................................................................. 81

THE TRANSPORT OBSERVATORY REPORT // 11th Issue | November 2017
ix
ABBREVIATIONS
ACPLRWA Rwanda Long Distance Truck Drivers AssociationASYCUDA Automated System for Customs DataBI BurundiCCTTFA Central Corridor Transit Transport Facilitation AgencyCFSs Container Freight StationsDGDA Direction Générale Des Douanes Et AccisesDRC Democratic Republic of Congo DWT Dead Weight TonneECTS Electronic Cargo Tracking SystemFEC Fédération des Entreprises du CongoGDP Gross Domestic ProductGPS Global Positioning SystemHSWIM High Speed Weigh-in-MotionIABT International Association of Burundi TransportersICD Inland Container DeportICT Information Communication Technology IRI International Roughness IndexKE KenyaKeNHA Kenya National Highways AuthorityKPA Kenya Ports AuthorityKPC Kenya Pipeline AuthorityKRA Kenya Revenue AuthorityKTA Kenya Transporters AssociationLPI Logistics Performance IndexKWATOS Kilindini Waterfront Automated Terminal Operations System MAGERWA Magasins Généraux du RwandaNEPAD New Partnership for Africa’s DevelopmentNC Northern CorridorNCTTA Northern Corridor Transit and Transport AgreementNCTTCA Northern Corridor Transit and Transport Coordination AuthorityOBR Office Burundais des RecettesOCC Office Congolais de Contrôle ODR Office Des RoutesOGEFREM Office de Gestion Du Fret MultimodalOSBP One Stop Border PostRECTS Regional Electronic Cargo Tracking SystemRRA Rwanda Revenue AuthorityRTDA Rwanda Transport Development AgencyRVR Rift Valley RailwaysRW RwandaSPSS Statistical Package for Social ScienceSGR Standard Gauge RailSCT Single Custom Territory SSFEBA South Sudan Federation of Employers and Business AssociationTEUs Twenty Feet Container Equivalent UnitsTMEA Trade Mark East AfricaTO Transport ObservatoryTOP Transport Observatory Portal UFFA Uganda Freight Forwarders AssociationUG UgandaUNRA Uganda National Roads AuthorityURA Uganda Revenue AuthorityURC Uganda Railways CorporationWEO World Economic Outlook
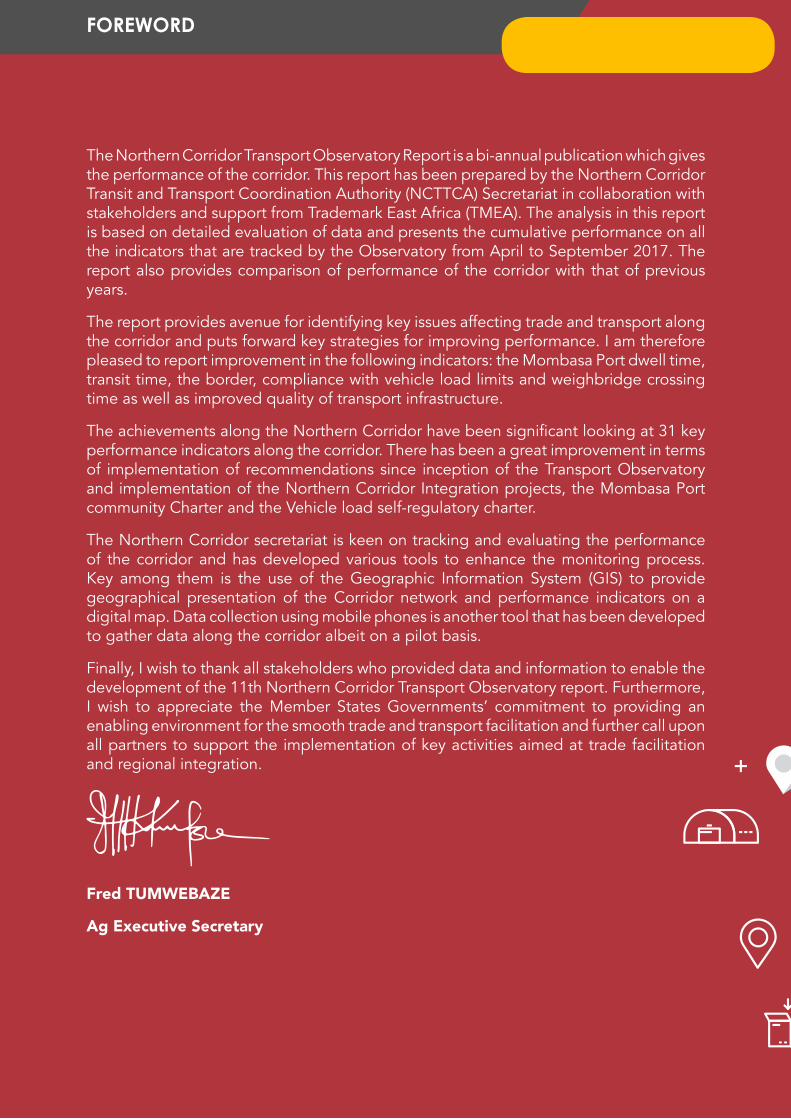
The Northern Corridor Transport Observatory Report is a bi-annual publication which gives the performance of the corridor. This report has been prepared by the Northern Corridor Transit and Transport Coordination Authority (NCTTCA) Secretariat in collaboration with stakeholders and support from Trademark East Africa (TMEA). The analysis in this report is based on detailed evaluation of data and presents the cumulative performance on all the indicators that are tracked by the Observatory from April to September 2017. The report also provides comparison of performance of the corridor with that of previous years.
The report provides avenue for identifying key issues affecting trade and transport along the corridor and puts forward key strategies for improving performance. I am therefore pleased to report improvement in the following indicators: the Mombasa Port dwell time, transit time, the border, compliance with vehicle load limits and weighbridge crossing time as well as improved quality of transport infrastructure.
The achievements along the Northern Corridor have been significant looking at 31 key performance indicators along the corridor. There has been a great improvement in terms of implementation of recommendations since inception of the Transport Observatory and implementation of the Northern Corridor Integration projects, the Mombasa Port community Charter and the Vehicle load self-regulatory charter.
The Northern Corridor secretariat is keen on tracking and evaluating the performance of the corridor and has developed various tools to enhance the monitoring process. Key among them is the use of the Geographic Information System (GIS) to provide geographical presentation of the Corridor network and performance indicators on a digital map. Data collection using mobile phones is another tool that has been developed to gather data along the corridor albeit on a pilot basis.
Finally, I wish to thank all stakeholders who provided data and information to enable the development of the 11th Northern Corridor Transport Observatory report. Furthermore, I wish to appreciate the Member States Governments’ commitment to providing an enabling environment for the smooth trade and transport facilitation and further call upon all partners to support the implementation of key activities aimed at trade facilitation and regional integration.
Fred TUMWEBAZE
Ag Executive Secretary
FOREWORD

The NCTTCA would like to sincerely thank the Council of Ministers of the Northern Corridor Member States for their continuous support to the Transport Observatory work. We would like to extend our gratitude to the Executive Committee, the various Specialized Technical Committees of the NCTTCA, the Stakeholders Forums and the Experts involved in drafting and validation of the 11th Transport Observatory performance report. Their invaluable support and contribution has enabled us to broaden the monitoring framework of the Corridor and hence improve its performance.
The successful delivery of this report would never have been made possible without the priceless contribution and support from our stakeholders who have provided informed decisions, policy guidelines and spearheaded the implementation of these key initiatives along the corridor.
The NCTTCA would like to sincerely thank Trade Mark East Africa (TMEA) for their unwavering support in funding the Transport Observatory activities. Our partnership with TMEA and all our collaborating partners both public and private has provided insights and strategic direction towards trade facilitation.
Finally, we would like to extend our sincere gratitude to all who have assisted us either in their corporate or individual capacities in provision of data. The success of developing the report primarily depends on this data and therefore, we extend our sincere gratitude to all stakeholders for their commitment to providing us with the necessary data.
We remain deeply indebted to you all,
The NCTTCA Secretariat.
ACKNOWLEDGEMENT

THE TRANSPORT OBSERVATORY REPORT // 11th Issue | November 2017
xii
The Northern Corridor is a transport network linking the port of Mombasa to the East African countries of Burundi, Democratic Republic of Congo (DRC), Kenya, Rwanda, South Sudan and Uganda. It comprises of the roads, railways, inland waterways and pipelines. The corridor ensures smooth transit of goods and individuals across the region through the port of Mombasa to and from the international market. Consequently, the landlocked countries linked to the Northern Corridor (NC) continue to import and export goods accessibly despite their lack of direct access to maritime transport. Previously, the corridor was hampered by inefficiencies; including port congestion, lengthy clearing processes, and delays along the corridor. Most of these bottlenecks are gradually being removed. Over the past two decades, transport corridors have gained particular attention with increased efforts toward regional integration in Africa and elsewhere. African Union programs such as New Partnership for Africa’s Development (NEPAD) and those implemented by the Regional Economic Communities (RECs) all place priority on enhancing interconnectivity and facilitating trade by focusing on transport corridors as microcosms of integration and spatial development on the continent.
With the objective of enhancing the Northern Corridor into a development corridor, the Northern Corridor Secretariat has continued to monitor the performance of the corridor with the view to provide evidence-based information for policy formulations geared towards reduction of the cost of doing business.
This report makes use of the northern corridor transport observatory which is a performance monitoring tool with an online platform that tracks over 31 performance indicators bi-annually. This is the 11th issue of the Transport Observatory bi-annual report covering indicators related to Volume/Capacity, Transport Rates/Costs, Transit time/delays and Efficiency/Productivity. The performance of the Corridor is measured through a range of indicators whose data is obtained from multiple sources. The main sources for the transport observatory data include Electronic data from stakeholders’ business systems; Global Positioning System (GPS) Surveys; Road Transport Surveys and secondary data from existing reports and policies and lately the mobile phones surveys.
The report established several changes in the year 2017 from a number of indicators. Firstly, it was noted that the port of Mombasa handled more cargo in 2017 (January to September) reflecting a 13% (1,442,829 tons) growth in the total volume of cargo compared to in 2016. Additionally, the inclusion of the Standard Gauge Railway (SGR) boosted the transport network along the Northern Corridor even though only the first section to Nairobi from Mombasa is complete. A comparison was made between the results and performance of the port of Mombasa and the Dar-es-Salaam port on containerised cargo dwell time. The port of Mombasa averaged between 2.9 and 4.5 days between January and September, which is a better performance than the global average of between 4 to5 days. Whereas dwell time at Dar-es-Salaam port averaged between 6.9 and 9.2 days during the same period.
The corridor transit time and delays contribute to high logistics costs. For instance, border crossing inefficiencies are critical issues for this corridor. Delays at Malaba border registered a median of 6 hours for clearing processes. Transit times have significantly reduced to all destinations with Mombasa Malaba registering an average of 3.7 days against a target of 5 days.
The road freight charges are still high at approximately US$2.23 per tonne/Km for
EXECUTIVE SUMMARY

THE TRANSPORT OBSERVATORY REPORT // 11th Issue | November 2017
xiii
containerized cargo from Mombasa to Kigali. Mombasa to Kampala is 1.79 US$ per tonne/kilometre while Mombasa to Bujumbura recorded US$3.07 per tonne/km. Also, different countries charge different freight rates even though there are common rates established for transportation.
The measures being implemented at the port of Mombasa have seen an improvement in the ship turnaround time. Within the year, there were three months when the port was able to meet the targeted 72 hours (3 days). However, it was noted that there are several factors that affect the turnaround time at the port and movement of cargo along the Northern Corridor. Poor infrastructure, delays at the weighbridges and non-compliance to weight limits by truck drivers and companies affected productivity and efficiency along the Northern Corridor.
Nonetheless, the countries connected to the Northern Corridor have embarked on improving the nodes connecting to the corridor so that they can improve the rate at which cargo moves. Kenya for instance has continued to expand nodes such as the Kisumu- Busia route and the Namanga route which offers a shorter alternative to Burundi from Nairobi through Tanzania.
Despite the many challenges that are experienced by Northern Corridor transporters, intraregional trade has continued to grow with Kenya, Uganda, Rwanda, Burundi, and DRC posting a positive deviation in their GDP. The trends indicate that traded volume among the NC countries increased in the period of January to September 2017.
The data collected from the truck drivers revealed that stoppages continued to increase the turnaround time while at the same time leading to inefficiencies along the corridor. Apart from personal reasons, border checkpoints also affected the delivery of goods to their destinations. Another impeding factor that was increasing inefficiency along the corridor was road accidents. Despite different legal and punitive measures by countries such as Kenya and Uganda, the number of accidents still increased in the year 2017 which calls for increased road safety awareness.
A new initiative that was also pursued by the NCTTCA was the green freight program which aims at improving the environmental status of the transport system. Pollution begins at the port of Mombasa and it spreads along the highway when the trucks are used to transport cargo. The green freight program gives measures geared towards a reduction in emissions along the northern corridor transport infrastructure.
We believe this information will support our stakeholders to make informed decisions and enable policymakers to identify the bottlenecks that need to be resolved to improve trade and transport facilitation along the Northern Corridor.

THE TRANSPORT OBSERVATORY REPORT // 11th Issue | November 2017
1
SECTION ONE:
INTRODUCTION1.1 Introduction
The Northern Corridor Transport Observatory report shows the Northern Corridor Trade and Transport performance. It describes the Northern Corridor transport infrastructure, volume of trade, transit time, transport cost, transport safety, contribution to the development of the region and protection of the environment.
The 11th edition of the Transport Observatory report is based on the information collected for the period of April to September 2017 and compiled by the Northern Corridor Transit and Transport Coordination Authority (NCTTCA) Secretariat.
NCTTCA was established through the Northern Corridor Transit and Transport Agreement and consists of six-member States namely; Burundi, Democratic Republic of Congo (DRC), Kenya, Rwanda, South Sudan and Uganda. The corridor links the landlocked countries of Burundi, DRC, Rwanda, South Sudan and Uganda to the seaport of Mombasa-Kenya.
Figure 1: Northern Corridor Transport Infrastructure

THE TRANSPORT OBSERVATORY REPORT // 11th Issue | November 2017
2
Figure 1: Northern Corridor Transport Infrastructure
Northern Corridor
LAPPSETCorridor
Central Corridor
ETHIOPIA
DR CONGO
SOM
ALI
A
The NCTTCA was established with a primary objective of facilitating trade and transport in the Region. One of the key objectives of the revised Northern Corridor Agreement, the NCTTA-2007, is to transform the Northern Corridor into a development corridor.
This transformation is highly dependent on efficient trade and transport system, which includes the regulatory agencies adopting measures for improved controls while at the same time facilitating trade and contributing to the reduction of the cost of doing business along the Northern Corridor.
The improvement in the performance of the Corridor will go a long way in realising the 2030’s Agenda for Sustainable Development and in achieving various sustainable goals and targets such as the need to provide access to safe, affordable, accessible and sustainable transport systems for all, improving road safety by 2030 and the target to halve the number of deaths and injuries from road traffic accidents by 2020.
The Northern Corridor Secretariat also intends to contribute to the achievement of the Sustainable Development Goals (SDGs) aimed at developing quality, reliable, sustainable and resilient infrastructure. This includes; developing regional and trans-border infrastructure, and support economic development and human well-being with a focus on affordable and equitable access for all. It also includes enhancing global progress in reducing greenhouse gas emissions (SDG 13).
The report highlights key performance areas in relation to Mombasa Port Community Charter which commits both private and public sectors towards enhancing efficiency of the Port of

THE TRANSPORT OBSERVATORY REPORT // 11th Issue | November 2017
3
Mombasa and the Corridor. All data used in this report and charts as well as additional information not featured in this report can be downloaded from the Northern Corridor Transport Observatory website; http: top.ttcanc.org or www.kandalakaskazini.or.ke
1.2 Key Economic Indicators
The Northern Corridor development is expected to have a great impact on the countries relying on the Northern Corridor for their transport needs such as Kenya, Uganda, Rwanda, Burundi, DRC and South Sudan. Among the indicators to measure this development includes; Gross Domestic Product (GDP), general infrastructure improvement, faster and efficient methods of clearance of the goods and the general wellbeing of the people in the aforementioned countries. This improvement can only be noticed if the countries have access to more international markets through exports, faster movement of goods to the interior markets, increased local investment as well as promoting bilateral and multilateral trade in the region.
The Northern Corridor economic outlook provides mixed results according to the key economic indicators. The World Bank International Logistics Performance Index (LPI) gives an aggregate measure of logistics sector performance by combining data on six core performance areas that is, Customs, infrastructure, international shipment, logistics quality and competence, tracking& tracing and timeliness. In 2016, the sub-Saharan Africa registered an overall performance index of 2.47 while Kenya, Uganda, Rwanda, Burundi and DRC recorded, 3.33, 3.04, 2.99, 2.51 and 2.38 respectively. Logistics performance index: Overall (1=low to 5=high)
Table 1 presents a summary of key economic indicators and projections for the Northern Corridor Member states. Improvements in border administration, transport and communication infrastructure could increase global GDP by US$2.6 trillion, or 4.7 percent1. Similarly, this region; GDP is expected to expand if efforts are geared toward improvements in the aforementioned areas.
Table 1: Key Economic Indicators
Country 2016 2017 2018
GDP Growth (%)
Population
(Million)
GDP Growth
(%)
Population
(Million)
GDP Growth
(%)
Population
(Million)
Burundi -1.04 9.65 0.00 9.88 0.15 10.12
Democratic Republic of Congo 2.40 84.13 2.78 86.65 2.99 89.25
Kenya 5.85 45.45 5.02 46.73 5.47 48.03
Rwanda 5.93 11.53 6.16 11.83 6.82 12.13
South Sudan -13.83 12.50 -6.26 13.14 -3.41 13.81
Uganda 2.32 36.56 4.44 37.67 5.24 38.82
Source: International Monetary Fund, World Economic Outlook Database, October 2017.
1 World Economic Forum 2 013. Enabling Trade-Valuing Growth Opportunities
THE TRANSPORT OBSERVATORY REPORT // 11th Issue | November 2017
4
Transport infrastructure and services have a bigger role in meeting the demand of the growing population of the Northern Corridor region which is projected to grow to a total of 212 Million people by 2018. With aspiration for mobility, and the strong association between transport and economic growth, the region is expected to develop to meet this growing demand whose population will hit 244 million people by 2022 and will radically change socio-economic makeup and fuel new demands for products and services in the region.
From Table 1 above, it can be noted that the region expects a positive population increase in 2018 and subsequent years as well. The increasing population shall definitely imply an increase in the market for goods and services hence the need for a wider variety of goods and services to sustain this population. Unfortunately, the increasing population rate does not match the GDP growth rate in the region. In fact, a country like South Sudan is projected to post a negative GDP growth rate due to insecurity which should be addressed to improve cross-border business with other Northern Corridor countries.
On a positive note, however, Burundi is expected to post a positive growth in its GDP though still way below what its compatriots in the East African region are posting. Uganda, Kenya, Rwanda, and DRC expect to post a positive growth in GDP ranging from 2% to around 7%. These countries can attribute the positive growth to stable political environment and ease of doing business, as well as continued Foreign Direct Investment as well stable local enterprises.
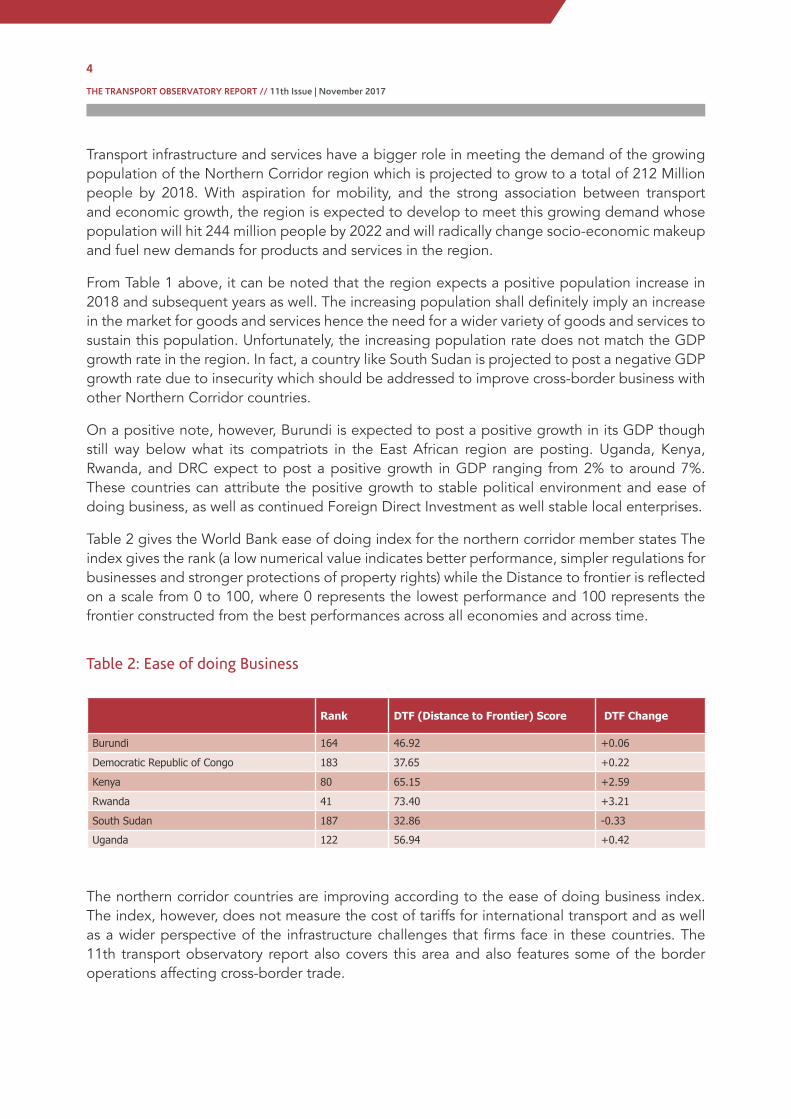
Table 2 gives the World Bank ease of doing index for the northern corridor member states The index gives the rank (a low numerical value indicates better performance, simpler regulations for businesses and stronger protections of property rights) while the Distance to frontier is reflected on a scale from 0 to 100, where 0 represents the lowest performance and 100 represents the frontier constructed from the best performances across all economies and across time.
Table 2: Ease of doing Business
Rank DTF (Distance to Frontier) Score DTF Change
Burundi 164 46.92 +0.06
Democratic Republic of Congo 183 37.65 +0.22
Kenya 80 65.15 +2.59
Rwanda 41 73.40 +3.21
South Sudan 187 32.86 -0.33
Uganda 122 56.94 +0.42
The northern corridor countries are improving according to the ease of doing business index. The index, however, does not measure the cost of tariffs for international transport and as well as a wider perspective of the infrastructure challenges that firms face in these countries. The 11th transport observatory report also covers this area and also features some of the border operations affecting cross-border trade.
THE TRANSPORT OBSERVATORY REPORT // 11th Issue | November 2017
5
1.3 Northern Corridor Performance Monitoring
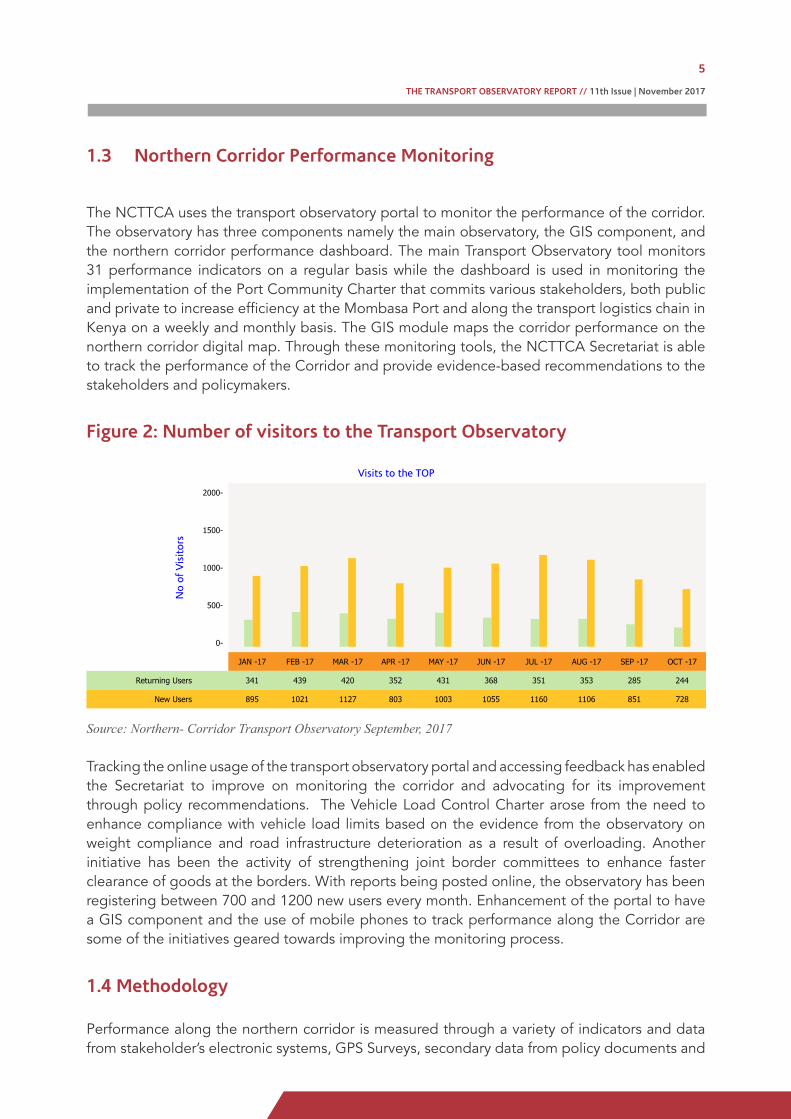
The NCTTCA uses the transport observatory portal to monitor the performance of the corridor. The observatory has three components namely the main observatory, the GIS component, and the northern corridor performance dashboard. The main Transport Observatory tool monitors 31 performance indicators on a regular basis while the dashboard is used in monitoring the implementation of the Port Community Charter that commits various stakeholders, both public and private to increase efficiency at the Mombasa Port and along the transport logistics chain in Kenya on a weekly and monthly basis. The GIS module maps the corridor performance on the northern corridor digital map. Through these monitoring tools, the NCTTCA Secretariat is able to track the performance of the Corridor and provide evidence-based recommendations to the stakeholders and policymakers.
Figure 2: Number of visitors to the Transport Observatory
Visits to the TOP
No
of V
isit
ors
2000-
1500-
1000-
500-
0-
JAN -17 FEB -17 MAR -17 APR -17 MAY -17 JUN -17 JUL -17 AUG -17 SEP -17 OCT -17
Returning Users 341 439 420 352 431 368 351 353 285 244
New Users 895 1021 1127 803 1003 1055 1160 1106 851 728
Source: Northern- Corridor Transport Observatory September, 2017
Tracking the online usage of the transport observatory portal and accessing feedback has enabled the Secretariat to improve on monitoring the corridor and advocating for its improvement through policy recommendations. The Vehicle Load Control Charter arose from the need to enhance compliance with vehicle load limits based on the evidence from the observatory on weight compliance and road infrastructure deterioration as a result of overloading. Another initiative has been the activity of strengthening joint border committees to enhance faster clearance of goods at the borders. With reports being posted online, the observatory has been registering between 700 and 1200 new users every month. Enhancement of the portal to have a GIS component and the use of mobile phones to track performance along the Corridor are some of the initiatives geared towards improving the monitoring process.
1.4 Methodology
Performance along the northern corridor is measured through a variety of indicators and data from stakeholder’s electronic systems, GPS Surveys, secondary data from policy documents and
THE TRANSPORT OBSERVATORY REPORT // 11th Issue | November 2017
6
reports, road based survey questionnaires from transporters in addition to interviews through country consultative missions. For this report, data was collected through GPS survey, road transport surveys, field visits, stakeholder’s business systems and mobile phone surveys. Data collection and analysis process is as outlined below:
Data collection Phase Analysis/synthesis
Review of relevant documentationAnalysis of survey responses and results from data collection
Defining conclusions and recommendation
Surveys
GPS surveys
Road Transport Survey
Border Post surveys
Mobile phones surveys
Presentation of Results
Presentation of results for the different indicator categories:
Volume and capacity
Transport rates/costs
Transit time/delays
Efficiency and productivity
Intra-regional trade
Road safety
Field/country visits Validation of the 11th report
Source:GPS surveys
The road transport Survey questionnaire was administered alongside the GPS kits to willing drivers. The driver fills in stop reasons, fees, among other information. The GPS kits are attached to the truck to capture geocodes and timestamps for all the stops from which stop locations, transit time and delays at various nodes are extracted. Initial preparations involve recording and geo zoning to map possible stop locations.
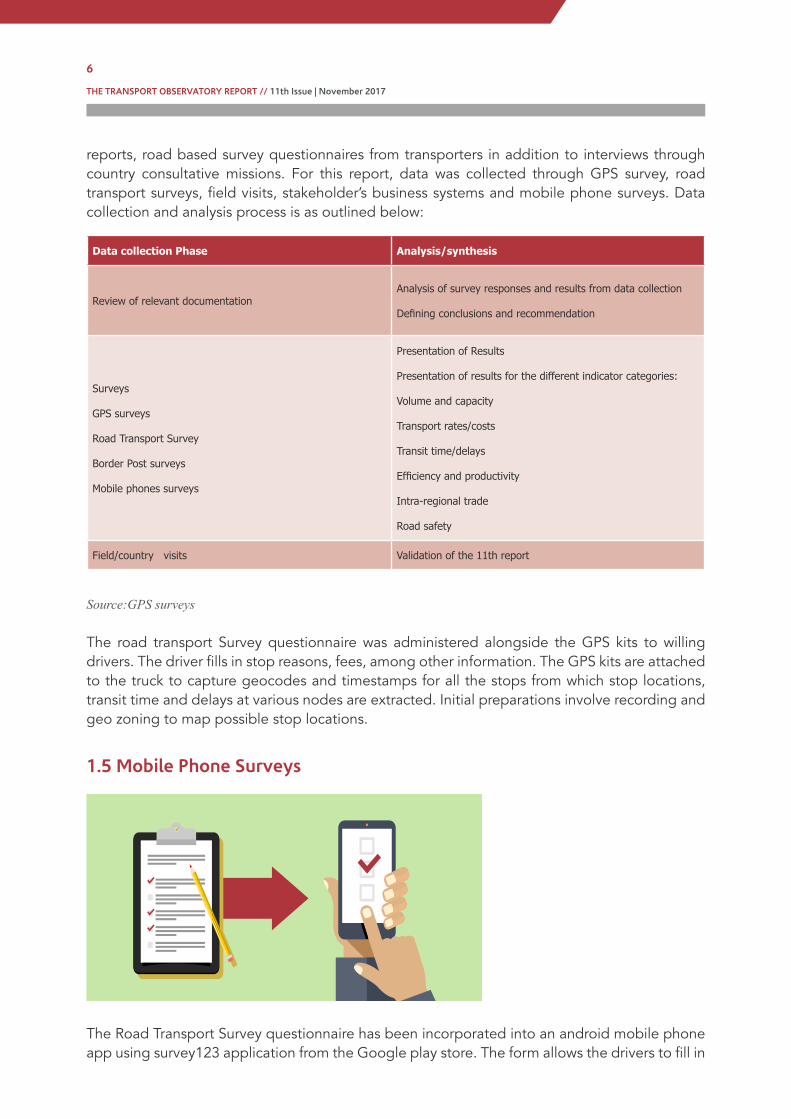
1.5 Mobile Phone Surveys
The Road Transport Survey questionnaire has been incorporated into an android mobile phone app using survey123 application from the Google play store. The form allows the drivers to fill in
THE TRANSPORT OBSERVATORY REPORT // 11th Issue | November 2017
7
the information from the start point of the journey, at every stoppage point and on reaching the destination. The information is relayed directly to the configured servers where it is accessed, consolidated and analyzed.
1.6 Analysis and Reporting
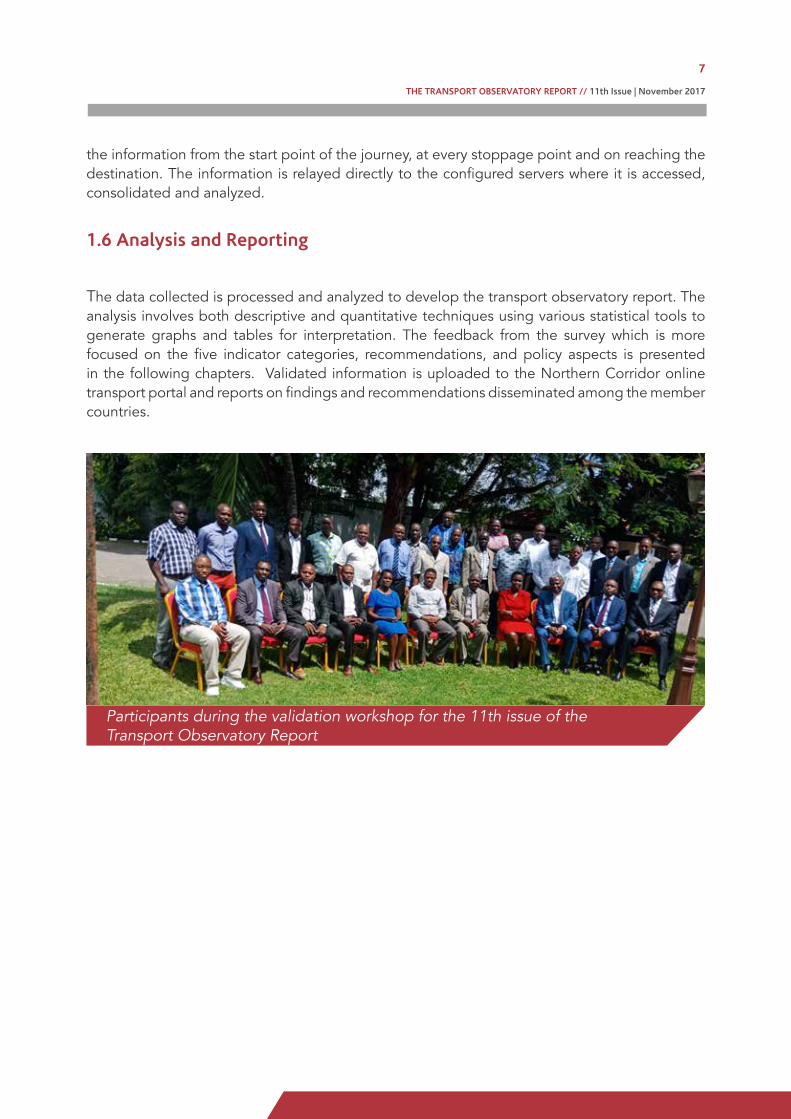
The data collected is processed and analyzed to develop the transport observatory report. The analysis involves both descriptive and quantitative techniques using various statistical tools to generate graphs and tables for interpretation. The feedback from the survey which is more focused on the five indicator categories, recommendations, and policy aspects is presented in the following chapters. Validated information is uploaded to the Northern Corridor online transport portal and reports on findings and recommendations disseminated among the member countries.
Participants during the validation workshop for the 11th issue of the Transport Observatory Report

THE TRANSPORT OBSERVATORY REPORT // 11th Issue | November 2017
8
SECTION TWO:
VOLUME AND CAPACITY INDICATORS
Mombasa port is the major trade gateway to East and Central Africa. It is one of the biggest service ports in Africa and it forms part of the Northern Corridor with connections by rail, pipeline and the road network.
This section gives the performance of the Mombasa Port in terms of volume related indicators for the periods between January and September 2017 and where possible a comparison is made with Dar-es-Salaam Port.

THE TRANSPORT OBSERVATORY REPORT // 11th Issue | November 2017
9
SECTION TWO:
VOLUME AND CAPACITY INDICATORS
Mombasa port is the major trade gateway to East and Central Africa. It is one of the biggest service ports in Africa and it forms part of the Northern Corridor with connections by rail, pipeline and the road network.
This section gives the performance of the Mombasa Port in terms of volume related indicators for the periods between January and September 2017 and where possible a comparison is made with Dar-es-Salaam Port.
2.1 Cargo Throughput
The port of Mombasa handles more than 27 Million DWT. The table below shows figures for cargo throughput for the Port of Mombasa for the period January to September for the year 2016 and year 2017.
Table 3: Cargo Throughput (DWT)
Type of Cargo 2016 2017 Volume Change Growth %
% Share of Total
Throughput 2016
% Share of Total
Throughput 2017
Non - Container
Dry Bulk 5,408,457 6,380,331 971,875 18.0 26.3 28.0
Liquid Bulk 5,862,057 6,168,315 306,258 5.2 28.5 27.1
Conventional 1,464,346 1,629,042 164,696 11.2 7.1 7.2
Sub- Total 12,734,860 14,177,688 1,442,829 11.3 61.9 62.3
Containerized 7,831,296 8,578,760 747,464 9.5 38.1 37.7
TOTAL 20,566,156 22,756,448 2,190,293 10.6 100.0 100.0
IMPORT/EXPORT
Imports 17,441,818 19,259,046 1,817,228 10.4 84.8 84.6
Exports 2,732,223 2,820,189 87,966 3.2 13.3 12.4
Transshipment 392,115 622,920 230,807 58.9 1.9 2.7
Re-stows - 54,293 0 0.0 0.0 0.2
TOTAL 20,566,156 22,756,448 2,190,293 10.6 100.0 100.0
Source: KPA, September, 2017
Between January and September 2017, the port handled a total of 22,756,448 tons of cargo compared to 20,566,156 tons registered over the same period in 2016 an increase of 2,190,293 tons or 10.6 per cent. Export traffic increased slightly by 87,966 tons or 3.2 percent to post 2,820,189 tons during the same period from 2,732,223 tons handled in corresponding period of 2016. The marginal increase was mainly supported by Coffee which increased by 37.7 percent and Tea by 3.6 percent.
The highest component of the imports was driven by containerized cargo which represent 37.7 % share of the total Port throughput during the period under review. During the period January – September 2017, the port performance records indicates growth in container traffic registering 887,412 TEUs in 2017 against 804,036 TEUs recorded in 2016. This translates to an increase of 83,376 TEUs or 10.4 percent. KPA forecast the containerized Traffic Demand cargo to grow to 1,142 Million TEUS in 2017 and 1,469 TEUs by 2022.
The rise in imports was mainly driven by the increase in dry bulk commodities, posting a major increase of 18.0 percent in the period under review. This was attributed to importation of wheat and fertilizers in bulk as well as maize imports to cover the shortages due to poor harvests in the country and the region occasioned by the prolonged drought during last season.

THE TRANSPORT OBSERVATORY REPORT // 11th Issue | November 2017
10
The illustration below shows the percentage increase in volume by cargo type for the period January to September, 2017 as compared with the same period in the year 2016.
Figure 3: Percentage Increase in Volume by cargo Type
Containerized Conventional Cargo
9.5% 11.2%
Liquid Bulk Dry Bulk
5.5% 18%
Figure 4 below gives the share throughput of the port based on the destination/market during the period January to September 2017. From the figure, domestic market/Kenya accounted for 69% while transit and transshipment accounted for 28% and 3% respectively. It should be noted that the volumes for Kenya Transit and transshipment increased by 10.2%, 8.5%, and 58.9% when compared to the same period in 2016.
Figure 4: Share of throughput per Destination
KENYA TRANSIT TRANSHIPMENT 15,646,198 6,487,330 622,921
VALUE (%)
69%
28%
3%

THE TRANSPORT OBSERVATORY REPORT // 11th Issue | November 2017
11
Transit traffic
The figure below gives the volume to the Northern Corridor Member States. The volume to Uganda and South Sudan increased by 513,057 DWT and 8,265 DWT over the period under review. Traffic volumes to DRC, Burundi, and Rwanda decreased by 27,294 DWT, 19,332 DWT and 17,659 DWT respectively. Other countries that use the port of Mombasa with a notable increase in transit traffic are Tanzania which registered an increase of 31.9% from 141,983 DWT to 187,292 DWT over the same period and Ethiopia which showed a rise from 4,150 DWT to 12,448 DWT representing a 200% increment.
Figure 5: Traffic volume to the Northern Corridor Member States
DW
T
6,000,000- 10.5% Increase
9.3% Decrease 11.5%
Decrease
1.7% Decrease 54.8%
Decrease
5,000,000-
4,000,000-
3,000,000-
2,000,000-
1,000,000-
0
UGANDA D.R.C RWANDA SOUTH SUDAN BURUNDI
Jan - Sep 2016 4,865, 145 294, 229 153, 873 478, 800 35,262
Jan - Sep 2017 5, 378, 202 266, 935 136, 214 487, 065 15,931
Source: KPA, January – September, 2016/2017
Cargo Traffic Demand Forecast (DWT)
The outlook for the remainder of the year appears to suggest slightly improved conditions in both import and export volumes. This is as a result of a modest cargo pick-up in seasonal trade observed towards the end of the year. The table below gives the throughput forecast for the Port of Mombasa.

THE TRANSPORT OBSERVATORY REPORT // 11th Issue | November 2017
12
Table 4: Demand forecast for the Port of Mombasa
Forecast DWT ’000’
Year 2017 2018 2019 2020 2021 2022
Total Demand Forecast 29,276 30,755 32,891 35,140 37,663 40,465
Transshipment 824 642 686 734 786 942
Total Demand with Transshipment (Base Scenario) 30,100 31,397 33,577 35,874 38,449 41,407
Total Demand with Transshipment (High Scenario) 30,803 32,658 34,947 37,359 41,736 45,676
Source: KRC, January – September, 2017
2.2 Transport Capacity by Rail
This indicator analyses the total number of locomotives and wagons against the proportion of total cargo carried by rail.
Kenya has a rail network of 2,778 Km. The railway line connects the Port of Mombasa to Nairobi, Nakuru and Kenya-Uganda border at Malaba. A branch route leaves the main railway line at Nakuru and extends to Kisumu on Lake Victoria. Uganda, on the other hand, has a network of 1,226 Km of which less than 50% is currently operational. According to the annual sector performance report FY 2016/2017, the Kampala -Malaba line handles 585,220 net tons of freight per annum which is about 7% of the total freight on the Northern Corridor of approximately 14.5 million tons per annum.
Table 5: Fact Sheet on locomotives
Average Locos Operating August, 2015 August, 2017
Mainline locos 39.9 35.2
Total light/shunting locos 10.4 5.4
Wagons fleet (fit and stopped but repairable) 2,578 2,818
Ballast 25 27
Wagons available for service 1,517 1,474
Source: KRC, August,2015/2017

THE TRANSPORT OBSERVATORY REPORT // 11th Issue | November 2017
13
Table 6: Railway Net tons and Net Ton-Km
Indicator 2015/2016 2016/2017 % change
Net ton-Km (‘000000’) 1186 1091 -8%
Net tons (‘000’)
Kenya 1429 1365 -4%-
Transit 547 411 -24.9%
Source: RVR-FY 2015/2016, 2016/2017
There has been a drop in Net Ton-Km; there was a negative growth of 8% and 4 % respectively. The net-tones to Kenya and Uganda decreased by 4 and 24.9% respectively
The design Capacity at average commercial speed of 55kph is 6 million tons. This cannot be achieved due to poor infrastructure conditions resulting to Temporary Speed Restrictions (TSRs).
The meter gauge requires a lot of investment which requires support from the government. Other operational challenges as a result of the termination of the Rift Valley railway (RVR) concession agreement is the issue of access fee when crossing the border and the complexities of operations in the event that the different operators will be managing the line. There was also a lot of deferred maintenance of the Meter Gauge Rolling Stock and Permanent Way.
Figure 6: Proportion of Cargo Volume transported by rail in tons
Cargo volume transported by rail
200 -
Net
Ton
s ‘0
00 150-
100-
50-
0-
JAN -17 FEB -17 MAR -17 APR -17 MAY -17 JUN -17 JUL -17 AUG -17
Total 137.448 149.761 110.534 174.481 144.37 146.9694 145.43 69.835
Transit 33.638 42.73 - 53.107 37.82 33.724 23.975 4.498
Source: KRC, January – August, 2017
Figure 6 shows proportion of traffic net volume of cargo moved by rail for the period January to August 2017 for both transit and local in tons. It can be noted that there is a drop in the freight service on the meter gauge railway line.
There is need to promote railway transport over road transport for bulk goods and materials. The average cost for freight and passenger is approximately USD 0.03 and USD 0.1per per ton-Km and passenger Km respectively.

THE TRANSPORT OBSERVATORY REPORT // 11th Issue | November 2017
14
2.2.1 Standard Gauge Railway (SGR)
The SGR line is designed to carry 22 million tons a year of cargo or a projected 40% of Mombasa Port throughput by 2035. The freight terminals will be located at the Mombasa port and the Inland Container Depots at Embakasi in Nairobi. Construction of the 609 Km-long SGR line from Mombasa to Nairobi began in October 2013 and it is completed.
The Standard gauge railway (SGR), with the first phase from Mombasa to Nairobi complete, will present an opportunity for an increase in trade and uptake of cargo by the railway. Plans are underway for the Standard Gauge railway to have railway sidings. The existing meter gauge railway should be revitalized to provide connections for transportation and delivery of cargo beyond the SGR terminals. The tariff for the meter gauge has not been published and is based on negotiations. On the contrast, available sources indicate that the SGR will be charging US$500 for a 20ft container and US $700 for a 40ft container from Mombasa to Nairobi.
SGR freight services were expected to start in November however, the SGR train has been operating on a trial basis by ferrying maize imports by the Kenya government from Mombasa to Nairobi.
Wagon: 1620 were ordered, currently 920 supplied
• 56 locomotives, • 5 passengers
• 8 for shunting • 43 for haulage/freight service
Phase IIA of the railway is ongoing with the tunneling of 3,162 m long Ngong tunnel. Phase IIB is in the process of securing funds.
It is expected that by 2019, SGR will be moving 22 million tons per year with an intermediate target of 7.2 million tons by mid-2018. This is pegged on the acquisition of additional wagons and to achieve this target, additional 359 wagons will be required with additional 54 locomotives.

THE TRANSPORT OBSERVATORY REPORT // 11th Issue | November 2017
15
It is recommended that Piggyback wagons be included in the rolling stock for the SGR. This will lead to efficient utilization of wagons, other than the wagons making empty return journeys, they can be loaded with trucks which are making their return journeys empty or loaded.
Table 7: Railway targets
2017 2018 2019 2022
SGR - 7.2 Million 22 Million
MGR 1.45 Million 1.48 Million 1.5 Million 3 Million
Source: KRC September, 2017
Among the targets stipulated in the 2013 Mombasa Port Community Charter was to ensure efficient cargo off-take from the port of Mombasa to 40 percent by rail. The target will be achieved by 2019 if the projected port throughput of 40.5 Million DWT is realized.
2.3 Pipeline Transport Capacity One of the Northern Corridor initiatives is to promote multimodal sustainable transport systems that encompass maritime, railways, road, pipeline and inland waterways transport. Pipeline development is one of the regional projects spearheaded by the Northern Corridor Integration Projects (NCIP). The pipeline will also enhance safety and protect the environment since transportation of oil via a pipeline is the safest, fastest and most environmentally friendly channel. The existing pipeline infrastructure currently consists of 1,342 kilometers of multiproduct pipeline and associated facilities between Mombasa, Nairobi, Nakuru, Eldoret and Kisumu from where landlocked countries of Uganda, Rwanda, Burundi South Sudan and Eastern DR Congo access fuel supplies. One of the provisions of the Mombasa port community charter is tracking the volume of cargo leaving the port terminal via rail, road, and pipeline.
The volume to the landlocked countries had gone down; however, the Kenya Pipeline Company has continued to recover the lost export market share whose demand is projected to be 6.8 billion liters by 2020 and 24.5 billion liters by the year 2044 as a result of increased competition and operational changes.
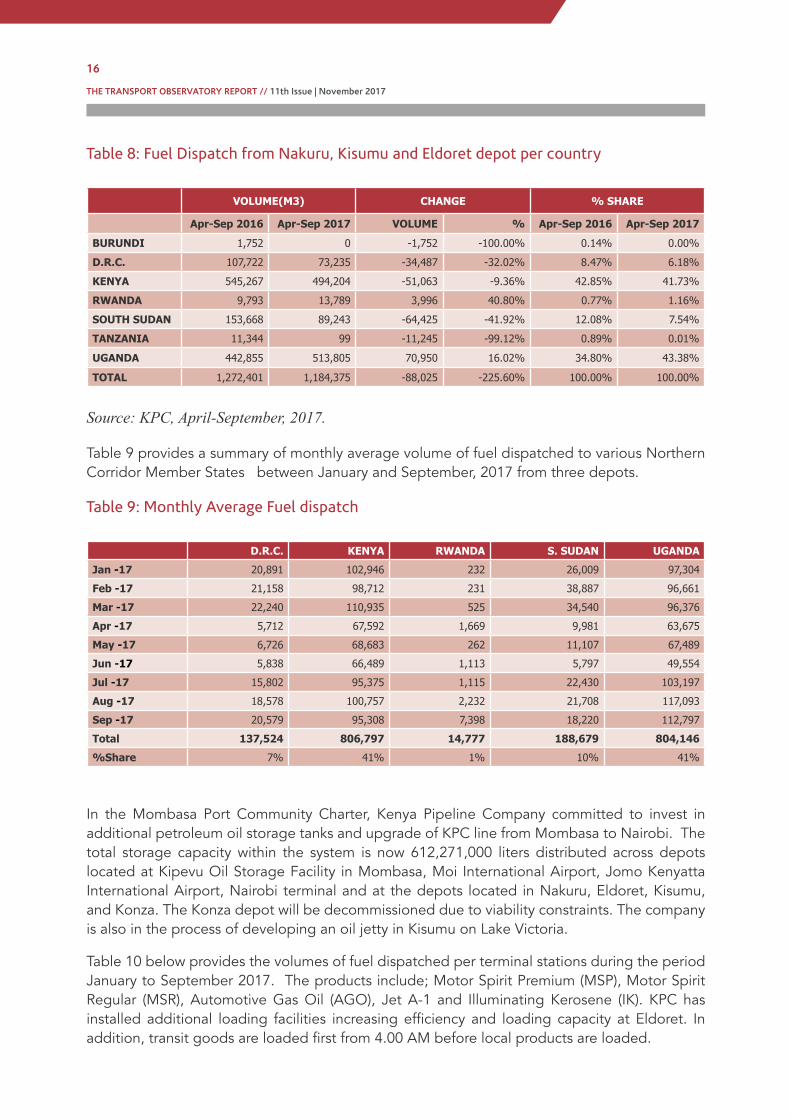
Table 8 below gives the fuel dispatch from three Depots i.e. Eldoret, Kisumu and Nakuru from where refined products are trucked to various destinations. Other depots include; Embakasi Aviation, Nairobi Terminal, Moi Airport, Kipevu Oil Storage Facility, Konza and Kenya Petroleum Refineries depot. Comparing the period between April and September for the year 2016 and year 2017, the volume to Burundi, South Sudan and Tanzania declined by 100%, 41.92%, and 99.12 % respectively. The volume to Uganda increased by 16% from 442,855 M3 to 513,805 M3.
THE TRANSPORT OBSERVATORY REPORT // 11th Issue | November 2017
16
Table 8: Fuel Dispatch from Nakuru, Kisumu and Eldoret depot per country
VOLUME(M3) CHANGE % SHARE
Apr-Sep 2016 Apr-Sep 2017 VOLUME % Apr-Sep 2016 Apr-Sep 2017
BURUNDI 1,752 0 -1,752 -100.00% 0.14% 0.00%
D.R.C. 107,722 73,235 -34,487 -32.02% 8.47% 6.18%
KENYA 545,267 494,204 -51,063 -9.36% 42.85% 41.73%
RWANDA 9,793 13,789 3,996 40.80% 0.77% 1.16%
SOUTH SUDAN 153,668 89,243 -64,425 -41.92% 12.08% 7.54%
TANZANIA 11,344 99 -11,245 -99.12% 0.89% 0.01%
UGANDA 442,855 513,805 70,950 16.02% 34.80% 43.38%
TOTAL 1,272,401 1,184,375 -88,025 -225.60% 100.00% 100.00%
Source: KPC, April-September, 2017.
Table 9 provides a summary of monthly average volume of fuel dispatched to various Northern Corridor Member States between January and September, 2017 from three depots.
Table 9: Monthly Average Fuel dispatch
D.R.C. KENYA RWANDA S. SUDAN UGANDA
Jan -17 20,891 102,946 232 26,009 97,304
Feb -17 21,158 98,712 231 38,887 96,661
Mar -17 22,240 110,935 525 34,540 96,376
Apr -17 5,712 67,592 1,669 9,981 63,675
May -17 6,726 68,683 262 11,107 67,489
Jun -17 5,838 66,489 1,113 5,797 49,554
Jul -17 15,802 95,375 1,115 22,430 103,197
Aug -17 18,578 100,757 2,232 21,708 117,093
Sep -17 20,579 95,308 7,398 18,220 112,797
Total 137,524 806,797 14,777 188,679 804,146
%Share 7% 41% 1% 10% 41%
In the Mombasa Port Community Charter, Kenya Pipeline Company committed to invest in additional petroleum oil storage tanks and upgrade of KPC line from Mombasa to Nairobi. The total storage capacity within the system is now 612,271,000 liters distributed across depots located at Kipevu Oil Storage Facility in Mombasa, Moi International Airport, Jomo Kenyatta International Airport, Nairobi terminal and at the depots located in Nakuru, Eldoret, Kisumu, and Konza. The Konza depot will be decommissioned due to viability constraints. The company is also in the process of developing an oil jetty in Kisumu on Lake Victoria.
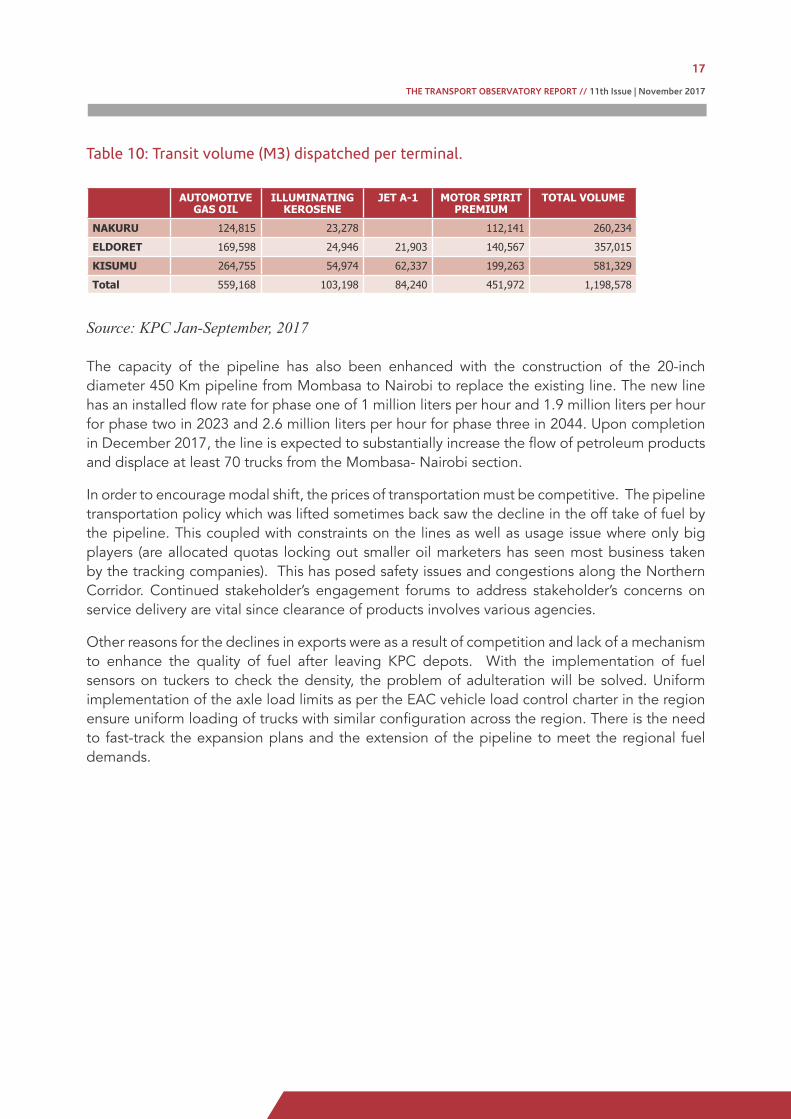
Table 10 below provides the volumes of fuel dispatched per terminal stations during the period January to September 2017. The products include; Motor Spirit Premium (MSP), Motor Spirit Regular (MSR), Automotive Gas Oil (AGO), Jet A-1 and Illuminating Kerosene (IK). KPC has installed additional loading facilities increasing efficiency and loading capacity at Eldoret. In addition, transit goods are loaded first from 4.00 AM before local products are loaded.
THE TRANSPORT OBSERVATORY REPORT // 11th Issue | November 2017
17
Table 10: Transit volume (M3) dispatched per terminal.
AUTOMOTIVE GAS OIL
ILLUMINATING KEROSENE
JET A-1 MOTOR SPIRIT PREMIUM
TOTAL VOLUME
NAKURU 124,815 23,278 112,141 260,234
ELDORET 169,598 24,946 21,903 140,567 357,015
KISUMU 264,755 54,974 62,337 199,263 581,329
Total 559,168 103,198 84,240 451,972 1,198,578
Source: KPC Jan-September, 2017
The capacity of the pipeline has also been enhanced with the construction of the 20-inch diameter 450 Km pipeline from Mombasa to Nairobi to replace the existing line. The new line has an installed flow rate for phase one of 1 million liters per hour and 1.9 million liters per hour for phase two in 2023 and 2.6 million liters per hour for phase three in 2044. Upon completion in December 2017, the line is expected to substantially increase the flow of petroleum products and displace at least 70 trucks from the Mombasa- Nairobi section.
In order to encourage modal shift, the prices of transportation must be competitive. The pipeline transportation policy which was lifted sometimes back saw the decline in the off take of fuel by the pipeline. This coupled with constraints on the lines as well as usage issue where only big players (are allocated quotas locking out smaller oil marketers has seen most business taken by the tracking companies). This has posed safety issues and congestions along the Northern Corridor. Continued stakeholder’s engagement forums to address stakeholder’s concerns on service delivery are vital since clearance of products involves various agencies.
Other reasons for the declines in exports were as a result of competition and lack of a mechanism to enhance the quality of fuel after leaving KPC depots. With the implementation of fuel sensors on tuckers to check the density, the problem of adulteration will be solved. Uniform implementation of the axle load limits as per the EAC vehicle load control charter in the region ensure uniform loading of trucks with similar configuration across the region. There is the need to fast-track the expansion plans and the extension of the pipeline to meet the regional fuel demands.

THE TRANSPORT OBSERVATORY REPORT // 11th Issue | November 2017
18
SECTION THREE:
TRANSPORT RATES AND COSTSTransport cost includes charges such as for trucking, sea freight, and associated administration cost. Transport costs shape not only the volume of trade but also the modal choice. Reliability and a reduction in delivery uncertainty are important for trade along the Northern Corridor. By comparing the freight costs of alternative transport modes to the journey times, researchers have been able to come up with measures of the value of time saved in transit. For instance, delays at borders along the Northern Corridor have been estimated to cost $250 per day for a truck company. Moreover, distribution and transportation costs along the Northern Corridor have been more than 35 or 40 percent of final product costs. It is estimated that the total indirect (hidden) costs per day for delays are approximated at $384.4 for a loaded truck along the Northern Corridor. Road condition also plays a vital role in transport rates and costs. This report featured average rates charged by transporters across the region. Transporters also pay road user charges as shown in the table below. The charges are paid at the border points on different routes along the Northern Corridor or on links between the Northern Corridor and the Central Corridor.

THE TRANSPORT OBSERVATORY REPORT // 11th Issue | November 2017
19
SECTION THREE:
TRANSPORT RATES AND COSTSTransport cost includes charges such as for trucking, sea freight, and associated administration cost. Transport costs shape not only the volume of trade but also the modal choice. Reliability and a reduction in delivery uncertainty are important for trade along the Northern Corridor. By comparing the freight costs of alternative transport modes to the journey times, researchers have been able to come up with measures of the value of time saved in transit. For instance, delays at borders along the Northern Corridor have been estimated to cost $250 per day for a truck company. Moreover, distribution and transportation costs along the Northern Corridor have been more than 35 or 40 percent of final product costs. It is estimated that the total indirect (hidden) costs per day for delays are approximated at $384.4 for a loaded truck along the Northern Corridor. Road condition also plays a vital role in transport rates and costs. This report featured average rates charged by transporters across the region. Transporters also pay road user charges as shown in the table below. The charges are paid at the border points on different routes along the Northern Corridor or on links between the Northern Corridor and the Central Corridor.
Table 11: Road Users Charges
Burundi DRC Kenya Rwanda South Sudan Uganda Tanzania
$152 $300 up to $400 $10/100 Km $152 $ 500 $10/100 Km $152
Remarks Not Uniform Flat rate Every entry into South Sudan attracts a 500 USD.
3.1 Road Freight charges in Kenya
Table 12 gives a comparison of road freight charges in Kenya to different destinations along the Corridor in US dollars for the period March 2017 to September 2017.
Table 12: Transport Rates to various destinations in Kenya
From To Distance (Km)
Road User Charges
Rates Per container
(USD)
Average cost per Km/Container
Mombasa Nairobi 481 - 777 1.62
Mombasa Kampala 1,170 50 2100 1.79
Mombasa Kigali 1682 222 3750 2.23
Mombasa Bujumbura 1,957 374 6000 3.07
Mombasa Goma 1840 274 - 682 5750 3.13
Mombasa Juba 1,662 - 5000 3.01
Nairobi Mombasa 481 - 485 1.01
Nairobi Kampala 688 50 1800 2.62
Nairobi Kigali 1,201 202 3000 2.50
Kampala Mombasa 1,170 - 900 0.77
Kampala Nairobi 688 - 800 1.16
Source: Road Transport Survey September, 2017
From Mombasa to Nairobi the average transport charge on average is USD 777 for containerized cargo. For clinker whose destination is mostly Athi-river, the average rate is USD 25.2 per ton. The average transport cost from Mombasa to Kampala is USD 2000. However, larger companies serving to cooperate clients charge up to USD 2,700. Road user charges only apply and they are paid to the countries where the trucks not registered. For instance, Kenyan registered trucks would pay road user charges based on harmonized COMESA road user charges of $10 per 100Km for transit trucks. Kenya registered trucks travelling from Malaba to Kampala a distance approximately 250km pay a Road User Charge of US $50 for the return journey to and from Kampala. From Mombasa to Bujumbura, Goma, the transport rates per kilometre are higher with the road user charges taking about 8.1% and 11% of the total cost of transport.

THE TRANSPORT OBSERVATORY REPORT // 11th Issue | November 2017
20
3.2 Annual distance covered by trucks in Kenya.
The Mombasa port community charter provides the target of 120,000 Km as the annual distance trucks have to achieve as a benchmark to international standards.
The number of return trips is mainly influenced by distance to respective destinations. Nairobi-Mombasa route which has the shortest distance has not achieved this target. Nevertheless, it should be noted that containerized cargo makes between 7 and 8 round trips per month while, while clinker cargo makes 10-11 trips to Nairobi. Port/border post procedures and documentation are the biggest hindrances to high turnaround time while non-availability of cargo was ranked the second contributor.
Table 13: Average Truck-Kilometre per year in Kenya
From To Distance Mar-2017 Sep 2017 Sep 2017
Km Round Trips Round Trips Truck Km per Year
Mombasa Nairobi 481 10 7.5 86,580
Mombasa Kampala 1169 3 3 84,168
Mombasa Kigali 1,682 3 2 80,736
Mombasa Bujumbura 1957 2 1.2 56,362
Mombasa Goma 1,840 2 2 88,320
Mombasa Juba 1662 2 2 79,776
Source: Road Transport Survey September, 2017
3.3 Road Freight charges in Burundi
Table 14 summarizes transport charges per container to and from Bujumbura in USD for 20-foot containers as at September 2017.
Table 14: Road Transport Tariffs in Burundi
From To Distance (Km) Road User
Charges (USD)Rates Per Ton(USD)
Average cost per Km/Tonne
Mombasa Bujumbura 1957 - 160 0.08
Nairobi Bujumbura 1,476 - 140 0.09
Juba Bujumbura 1441 - - -
Kigali Bujumbura 275 - - -
Kampala Bujumbura 788 - 100 0.13
Goma Bujumbura 431 - 80 0.19
Bujumbura Goma 431 - 60 0.14
Bujumbura Kampala 788 - 80 0.10
Bujumbura Kigali 275 - 40 0.15
Bujumbura Juba 1,441 - - -

THE TRANSPORT OBSERVATORY REPORT // 11th Issue | November 2017
21
From To Distance (Km) Road User Charges (USD)
Rates Per Ton(USD)
Average cost per Km/Tonne
Bujumbura Nairobi 1476 - 120 0.08
Bujumbura Mombasa 1,957 - 140 0.07
Source : Association of Burundi Transporters, September 2017
Most transporters in Burundi charge per tonne of the load being transported. Majority of goods to Burundi go through the Central Corridor. In 2016, about 10.6 percent of imported goods came through the Port of Mombasa via the Northern Corridor. Some of the reasons hampering transporters has been the longer traditional route from Mombasa through Kampala and Kigali which is longer than Dar-es-lam to Bujumbura. The route also attracts more road user charges and has multiple border stations which sometimes cause major delays.
Bujumbura – Kigali – Kampala – Nairobi – Mombasa has a road user charge USD 432 while
Bujumbura – Arusha – Mombasa: USD 182
Nairobi – Arusha – Singida – Bujumbura: USD 194
The Taita-Taveta and Namanga road through Tanzania is in good condition and has been noted to be a shorter route to access Mombasa and Nairobi. It is expected that when transporters start using such alternative routes then the rate is likely to go down.
Uniform implementation of the EAC vehicle load control act especially the use of single and double tyres and sensitization of transporter will enhance the use of this alternative route.
Table 15: Average Truck-Kilometre per year in Burundi
From To (Km) Mar-2017 Sep 2017 Sep 2017
Round Trip Round Trip Truck Km per Year
Bujumbura Goma 431 2 2 20,688
Bujumbura Kampala 788 2 2 37,824
Bujumbura Kigali 275 3 - -
Bujumbura Juba 1441 0 - -
Source : Association of Burundi Transporters, September 2017
The number of road trips made during the period under review has remained low and fairly constant. There was no trip made from Bujumbura to Juba. The Truck kilometers per annum remained low between 20,000 Km and 38,000Km

THE TRANSPORT OBSERVATORY REPORT // 11th Issue | November 2017
22
3.4 Road Freight charges in DRC
Table 16 provides charges incurred for both 20-foot and 40-foot containers for imports and exports from Goma to various destinations along the Northern Corridor. The tariff includes port charges, clearing fees, road toll fees paid per respective destination. Imports from Mombasa attract higher freight charges than other destinations due to the distance. Imports from Mombasa attract higher rate of $1.77 per kilometer.
Table 16: Transport rates in DRC
From To Distance (Km) Rates Per
container(USD)Average cost per Km/Container
Mombasa Goma 1840 3250 1.77
Nairobi Goma 1,357 1,680 1.24
Juba Goma 1322 - -
Kigali Goma 156 - -
Kampala Goma 669 1060 1.58
Bujumbura Goma 431 - -
Goma Bujumbura 431 - -
Goma Kampala 669 1,120 1.67
Goma Kigali 156 - 0.00
Goma Juba 1,322 - 0.00
Goma Nairobi 1357 1680 1.24
Goma Mombasa 1,840 1,820 0.99
Source: FEC, September 2017
Freight charges in DRC vary depending on the state of the infrastructure especially for the seasonal roads, furthermore the charges may be affected by the fees charged by the numerous agencies along the transit route to destination.
Table 17: Average of Truck Kilometre per year in DRC
From To (Km) Mar-2017 Sep 2017 Truck Km per Annum
Goma Bujumbura 431 - - 0
Goma Kampala 669 2 2 32,112
Goma Kigali 156 - - 0
Goma Juba 1,322 - - 0
Goma Nairobi 1,357 1 1 32,568
Goma Mombasa 1,840 1 1 44,160
Source: FEC, September 2017

THE TRANSPORT OBSERVATORY REPORT // 11th Issue | November 2017
23
Table 17 above provides a summary of the average number of round trips and truck kilometer per annum made by transporters from Goma to other destinations. The number of round trips has remained constant for the last 12 months. With little return cargo guaranteed, there are minimal round trips made between March and September 2017.
3.5 Road Freight charges in Rwanda
The table 18 below provides freight charges for a 20/40-foot container in Rwanda.
Table 18: Transport Rates to various destinations in Rwanda
From To Distance
(Km)Rates Per container (USD)
Average cost per Km/Container
Mombasa Kigali 1,682 4,300 2.56
Nairobi Kigali 1,201 3,200 2.66
Juba Kigali 1,166 - 0.00
Bujumbura Kigali 275 1,800 6.55
Kampala Kigali 513 2,000 3.90
Goma Kigali 156 1,000 6.41
Kigali Goma 156 1,000 6.41
Kigali Kampala 513 1,600 3.12
Kigali Bujumbura 275 1,800 6.55
Kigali Juba 1,166 7,500 6.43
Kigali Nairobi 1,201 2,000 1.67
Kigali Mombasa 1,682 3,000 1.78
Source: ACPLRWA
Table 19 provides a summary of the average number of round trips and truck kilometers made per annum made by transporters from Kigali to other destinations. The results indicate reduced activity between Kigali and Goma for the last six months given that the number of round trips has reduced by 67%. Kigali Nairobi and Kigali-Mombasa have registered average truck-kilometer of over 100,000Km.
Table 19: Average truck kilometre per year in Rwanda
From To (Km) Mar-2017 Sep 2017 Truck Km per Year
Kigali Goma 156 10 6 22,464
Kigali Kampala 513 7 7 86,184
Kigali Bujumbura 275 - 2 13,200
Kigali Juba 1,166 1.5 1 27,984
Kigali Nairobi 1,201 4 4 115,296
Kigali Mombasa 1,682 2.5 2.5 100,920

THE TRANSPORT OBSERVATORY REPORT // 11th Issue | November 2017
24
3.6 Road Freight charges in South Sudan
Table 20 provides a summary of rates charged by transporters in South Sudan. Goma-Juba route covering a distance of 1,322 Km was the most expensive whereas Mombasa to Juba covering a distance of 1,662 Km was the least expensive during the period under review. However, most of the business seems to take place between Juba and Kampala with average monthly round trips of 4. Nonetheless, truck utilization is still low with only 62,688 Km covered in a year for each truck as shown in the table below.
Table 20: Road Freight Charges per destination in South Sudan
From To Distance (Km)
Rates Per container(USD)
Average cost per Km/Container
Mombasa Juba 1,662 5,000 3.01
Nairobi Juba 1,145 5,000 4.37
Kampala Juba 653 2,500 3.83
Bujumbura Juba 1,441 4,500 3.12
Kigali Juba 1,166 4,000 3.43
Goma Juba 1,322 7,000 5.30
Juba Goma 1,322 7,000 5.30
Juba Kigali 1,166 4,000 3.43
Juba Bujumbura 1,441 4,500 3.12
Juba Kampala 653 2,500 3.83
Juba Nairobi 1,145 5,000 4.37
Juba Mombasa 1,662 5,500 3.31
Source: B&S group of companies, September 2017
Table 21: Average Truck Kilometre per year in South Sudan
From To (Km) Sep 2017 Truck Km per
Year
Juba Goma 1,322 1 31,728
Juba Kigali 1,166 1 27,984
Juba Bujumbura 1,441 1 34,584
Juba Kampala 653 4 62,688
Juba Nairobi 1,145 2 54,960
Juba Mombasa 1,662 1 39,888
Source: B&S group of companies, September 2017

THE TRANSPORT OBSERVATORY REPORT // 11th Issue | November 2017
25
3.7 Road Freight charges in Uganda Freight charges in Uganda are presented in the table 22 irrespective of the container type. Comparing March and September 2017, the rates have significantly increased. Kampala-Goma route is still the most expensive. The route attracts a road user charge of between 200 and 300 USD. Boosting intraregional trade to guarantee return cargo will play a significant role in reducing transport costs.
Table 22: Road Freight Charges per destination in Uganda
From To Distance (Km) Rates Per container(USD) Average cost per
Km/Container
March, 2017
September, 2017
Mombasa Kampala 1,169 2,200 2,200 1.88
Nairobi Kampala 688 1,400 1,500 2.18
Juba Kampala 653 - 900 1.38
Bujumbura Kampala 788 450 1,200 1.52
Kigali Kampala 513 800 1,000 1.95
Goma Kampala 669 550 1,200 1.79
Kampala Goma 669 3000 3,500 5.23
Kampala Kigali 513 1,650 1,600 3.12
Kampala Juba 653 1941 2,000 3.06
Kampala Nairobi 688 600 900 1.31
Kampala Mombasa 1,169 800 900 0.77
Kampala Bujumbura 788 4,600 3,000 3.81
Source: UNTA, September 2017
Table 23 provides a summary of the average number of round trips made by transporters from Kampala to other destinations. From the data, the target for average truck kilometres is achieved for the Kampala Mombasa route with an annual truck Km of 126,252 Km for container trucks. Fuel tankers take up 4 to 5 trips due to clearance under single customs territory.
Table 23: Annual distance covered per truck in Uganda
From To (Km) Mar-17 Sep-17 Truck Km per Year
Kampala Bujumbura 788 - 3.5 66,192
Kampala Juba 653 3 3.5 54852
Kampala Goma 669 3 3 48,168
Kampala Kigali 513 - 4.5 55,404
Kampala Nairobi 688 5 5 82,560
Kampala Mombasa 1169 5 4.5 126,252
Source: UNTA, September 2017

THE TRANSPORT OBSERVATORY REPORT // 11th Issue | November 2017
26
Key areas to focus on in reducing transport cost and truck turnaround times
Reducing Transport Costs
Insecurity in some parts of the Corridor and high insurance costs; fresh insurance cover needed given that South Sudan is not under COMESA Yellow Card Insurance Scheme
Eliminate the requirement to have both local and COMESA Yellow Card Insurance Scheme in some jurisdictions
VISA requirement between some Member states with fee ranging between $50 and $100 within the Northern corridor is against article 43 of the Northern Corridor Agreement which calls for abolishing VISA fees
Transit goods license $400 per year follows the calendar year. Transit goods license should be charged pro-rata. This should be followed up with the EAC Secretariat.
What It Takes To Achieve 120,00Km Per Annum
• Reduced truck around time at the port
• Reduced time at the weigh bridges
• Reduced clearance time at the border crossing
• Reduced delivery time at the consignee premises
• Reduced unnecessary stops by the drivers
• Availability of cargo for loading without having to wait.
• Improve road transport infrastructure by upgrading Northern Corridor roads to bitumen standards.
SECTION FOUR:
PRODUCTIVITY AND EFFICIENCY Efficiency and productivity indicators give a basic guideline on how well the corridor performs operationally. The objective of productivity measurement is to give the current performance in the transport logistics chain against desirable productivity measures as provided by the best practice. Being efficient entails reducing the number of wasted inputs, thus it is imperative to make investments to develop trading capacities such as ports and roads improvements, improved efficiency in customs administration and adoption of e-services use. Efficiency gains in the transportation sector will also be discussed given that it is a key driver of the competitiveness and growth of an economy. KPA, KRA, KenTrade have implemented various initiatives as stipulated in the Mombasa port community charter to address capacity and efficiency constraints at the port towards transforming the Port into a high performing service port. These include automation of the port and customs operations, implementation of the National Single Window Clearance System to facilitate the cargo clearance system through the port, construction of a second container terminal among others. This section attempts to discuss the performance of key productivity and efficiency indicators, identify the factors responsible for the efficiency improvements and provide insights into policy approaches that could enhance performance in the future. The indicators covered include, Vessel turnaround time, ship waiting time, quality of transport infrastructure and compliance at weighbridges
THE TRANSPORT OBSERVATORY REPORT // 11th Issue | November 2017
27
SECTION FOUR:
PRODUCTIVITY AND EFFICIENCY Efficiency and productivity indicators give a basic guideline on how well the corridor performs operationally. The objective of productivity measurement is to give the current performance in the transport logistics chain against desirable productivity measures as provided by the best practice. Being efficient entails reducing the number of wasted inputs, thus it is imperative to make investments to develop trading capacities such as ports and roads improvements, improved efficiency in customs administration and adoption of e-services use. Efficiency gains in the transportation sector will also be discussed given that it is a key driver of the competitiveness and growth of an economy. KPA, KRA, KenTrade have implemented various initiatives as stipulated in the Mombasa port community charter to address capacity and efficiency constraints at the port towards transforming the Port into a high performing service port. These include automation of the port and customs operations, implementation of the National Single Window Clearance System to facilitate the cargo clearance system through the port, construction of a second container terminal among others. This section attempts to discuss the performance of key productivity and efficiency indicators, identify the factors responsible for the efficiency improvements and provide insights into policy approaches that could enhance performance in the future. The indicators covered include, Vessel turnaround time, ship waiting time, quality of transport infrastructure and compliance at weighbridges

THE TRANSPORT OBSERVATORY REPORT // 11th Issue | November 2017
28
4.1 Ship turnaround time
This indicator is measured from the time the vessel arrives at the Port area (Fairway Buoy) to the time it leaves the port area.
The Ship turnaround time involves ship Service Time and Waiting Time. The Mombasa port community charter has set 72 hours (3 days) as the target for this indicator. This is an intermediate target with the ultimate goal being to achieve 24 hours benchmark. Figure 7 gives performance for ship turnaround from January to September, 2017.
Figure 7: Containerized Ship Turnaround Time
Ships Turnaround Time
Hrs
150-
100-
50-
0-
JAN - 17 FEB - 17 MAR - 17 APR - 17 MAY - 17 JUN - 17 JUL - 17 AUG - 17 SEP - 17
Turnaround Time 76.39 96.17 78.39 68.45 101.61 102.91 80.08 71.85 70.52
Target 72 72 72 72 72 72 72 72 72
Source: KPA, January to September 2017 From the figure above, ship turnaround target was achieved in April, August and September 2017. This is a tremendous improvement from the 92 hours which was registered in 2014 before establishment of the Mombasa Port community charter which commits stakeholders towards enhancing efficiency.
The second container terminal made average gross moves of 481.7 per day, handling 202,661 TEUs. In the same period 120 vessels called with a monthly average of 22,518 TEUs. Between the month of August and September 2017 there has been a slight improvement of the performance of berth 20, this is due to the installation of new harbour cranes that have helped in improving the efficiency of the berth. With regard to berth 21, during the period under review 555.3 gross moves per day was recorded.
4.2 Ship Waiting Time (Hours) This time is measured from the time the vessel arrives at the fairway buoy to the time of its first berth. This is a subset of the vessel turnaround time.
Arrival of the Vessel First BerthWaiting Time
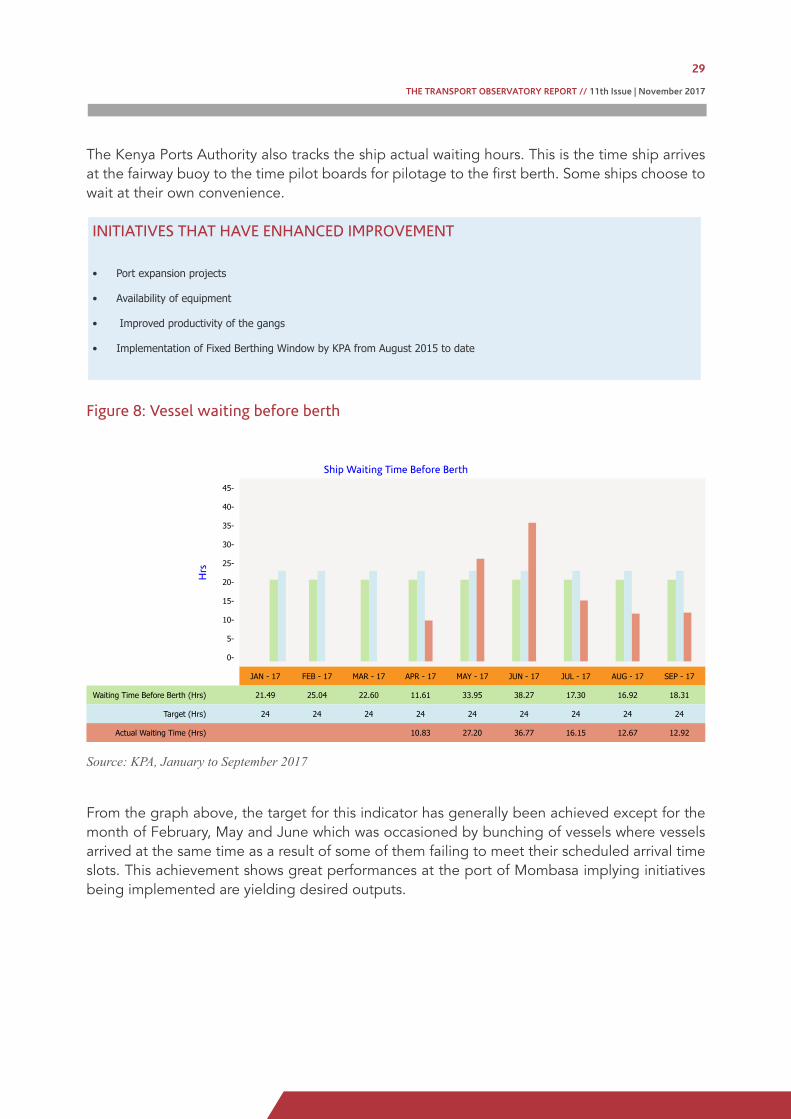
THE TRANSPORT OBSERVATORY REPORT // 11th Issue | November 2017
29
The Kenya Ports Authority also tracks the ship actual waiting hours. This is the time ship arrives at the fairway buoy to the time pilot boards for pilotage to the first berth. Some ships choose to wait at their own convenience.
INITIATIVES THAT HAVE ENHANCED IMPROVEMENT
• Port expansion projects
• Availability of equipment
• Improved productivity of the gangs
• Implementation of Fixed Berthing Window by KPA from August 2015 to date
Figure 8: Vessel waiting before berth
Ship Waiting Time Before Berth
Hrs
45-
40-
35-
30-
25-
20-
15-
10-
5-
0-
JAN - 17 FEB - 17 MAR - 17 APR - 17 MAY - 17 JUN - 17 JUL - 17 AUG - 17 SEP - 17
Waiting Time Before Berth (Hrs) 21.49 25.04 22.60 11.61 33.95 38.27 17.30 16.92 18.31
Target (Hrs) 24 24 24 24 24 24 24 24 24
Actual Waiting Time (Hrs) 10.83 27.20 36.77 16.15 12.67 12.92
Source: KPA, January to September 2017
From the graph above, the target for this indicator has generally been achieved except for the month of February, May and June which was occasioned by bunching of vessels where vessels arrived at the same time as a result of some of them failing to meet their scheduled arrival time slots. This achievement shows great performances at the port of Mombasa implying initiatives being implemented are yielding desired outputs.

THE TRANSPORT OBSERVATORY REPORT // 11th Issue | November 2017
30
4.3 Quality of transport infrastructure within the Northern Corridor Road Network
Through the Northern Corridor Transit and Transport Agreement, Member States have designated various routes to promote domestic and international trade and movement of people. These routes are high density routes moving people and mostly traders in the region. Other than forming the core network for integration, the Northern Corridor has served as an enabler of trade and economic growth for the region.
Efficient transport network with quality infrastructure increases the potential of any economic system by unlocking unrealized economic potential and facilitating private sector investment. This section gives the quality of road infrastructure in terms of the International Roughness Index (IRI) and also providing planned projects along the Corridor that will spur additional upstream or downstream development. The scale for IRI is given as IRI Scale used was between 1 and 8.
Table 24 International Roughness Index
IRI Scale Road Condition description
1 to 1.5 Excellent
1.6 to 3 V. Good
3.1 to 4 Good
4.1 to 6 Fair
6.1 to 8 Poor
4.3.1 Summary of road condition for the Northern Corridor
a) Road conditions in Burundi
Table 25 shows designated road section for the Northern Corridor in Burundi. ..
Table 25: Designated Northern Corridor Roads in Burundi
From Designated Northern Corridor Roads in Burundi To
Kanyaru Haut Kayanza-Bujumbura Gatumba
Gasenyi Kirundo-Ngozi Bujumbura
Ruhwa Rugombo-Bujumbura Gatumba
Kanyaru Bas Ngozi Gitega
Source: NCTTA, 2007
Majority of the Road Sections in Burundi are paved and in a good state as shown in the table 26 below. From a total of 567.5 Km that were reported, 418.3Km are in very good state, 20 Km is in good state, 72.4 Km is in fair state and 56.9 Km of the route is in poor state.

THE TRANSPORT OBSERVATORY REPORT // 11th Issue | November 2017
31
Table 26: Status of the road sections in Burundi
Section from Section to Length (Km) Roughness IRI
Gasenyi Gashoho 68.379 2 V. Good
Gashoho Ngozi 40.357 5 Fair
Ngozi Kayanza 32 5 Fair
Kanyaru Haut Kayanza 22.105 7 Poor
Kayanza Bugarama 59.169 3 V. Good
Bugarama Bujumbura 35.005 3 V. Good
Bujumbura Gatumba 23 2 V. Good
Ruhwa Nyamitanga 50.712 2 V. Good
Nyamitaanga Gihanga 10.1 8 Poor
Gihanga Bujumbura 20 4 Good
Kanyaru bas Ngozi 24.7 8 Poor
Ngozi Gitega 80 2 V. Good
Gitega Bujumbura 102 3 V. Good
Source : Office des Routes, Septembre 2017
b) Road conditions in DRC The following are designated Northern Corridor routes in DRC.
Table 27: Designated Northern Corridor Roads in DRC
From By way of To
Aru Bunia Kisangani or Isiro
Mahagi Bunia Kisangani or Isiro
Kasindi Beni Kisangani or Bunia
Ishasha Rutshuru Goma Town
Bunagana Goma Goma Town
Bukavu Kindu Kisangani
Kiliba Uvira Kalundu
Kavimvira Uvira Kalundu
Kamanyora Bukavu Kalundu
Source: NCTTA, 2007
Table 28 below gives the current status of various subsections. From the reported figures, about 1,562 Km of the road condition in DRC is in a good state, which translates to about 40.5% of the reported road sections.

THE TRANSPORT OBSERVATORY REPORT // 11th Issue | November 2017
32
Table 28: Status of the road Sections in DRC
ROUTE Length (Km)
Condition
Good Fair Poor
1. BUKAVU-KINDU-KISANGANI SECTION
BUKAVU -BURHALE 55 32 21 2
BURHALE - SHABUNDA - LUBILE 363 135 85 143
LUBILE - KALIMA - MALI 117 98 19
MALI – KINDU 36 25 11
MALI – LUBUTU 318 176 93 49
LUBUTU - KISANGANI 297 105 94 98
LUBUTU - OSOKARI - WALIKALE 219 169 30 20
WALIKALE – HOMBO 107 107
HOMBO – MITI 93 40 53
MITI - BUKAVU (compris dans Kavumu - Bukavu) PM
2. BUKAVU-UVIRA SECTION
BUKAVU - KAMANYOLA 55 53 2
KAMANYOLA - UVIRA 86 66 15 5
UVIRA - KAMVIVIRA - FRONT BURUNDI 10 10
3. KISANGANI - BENI -KASINDI SECTION
KISANGANI - NIANIA - KOMANDA 650 644 6
KOMANDA – LUNA 65 65
LUNA – BENI 60 60
BENI – KASINDI 80 38 18 24
4. KOMANDA - BUNIA - MAHAGI SECTION
KOMANDA – BUNIA 71 19 52
BUNIA - MAHAGI - GOLI - FR OUGANDA 190 94 96
5. KISANGANI - ISIRO - ARU SECTION
KISANGANI – NIANIA PM
NIANIA – ISIRO 232 38 108 86
ISIRO - WATSA – ARU 422 105 147 170
6. BENI - BUTEMBO - GOMA - BUKAVU
BENI – NDOLUMA 132 48 44 40
NDOLUMA - RUTSHURU - GOMA 199 194 5
GOMA -SAKE- MINOVA 58 22 26 10
MINOVA - KAVUMU - BUKAVU 152 52 32 68
RUTSHURU - BUNAGANA 27 0 27 0
RUTSHURU - ISHASHA 63 42 21 0
Source: Office De Routes, DR Congo, September, 2017
In DRC 1,498 Km are under rehabilitation and 107 Km under modernization.

THE TRANSPORT OBSERVATORY REPORT // 11th Issue | November 2017
33
c) Road condition in Kenya The table below provides status on road conditions in Kenya measured by International Roughness Index. The port of Mombasa serves as the starting point for the Corridor. The transit section in Kenya covers a total network of 1,184 Km as shown table 29.
Table 29: Designated Northern Corridor Roads in Kenya
From To Distance
Mombasa Nairobi 481 Km
Nairobi Malaba 452 Km
Mau Summit Busia 251 Km
Source: NCTTA, 2007
Table 30 gives the current status of the road infrastructure along the northern corridor. It includes information on vital links from the northern corridor to the Tanzanian border through Athi river to Namanga and Voi to Taita Taveta.
Table 30: Road condition in Kenya
Route Road Section Length (Km) IRI Condition
Mombasa – Malaba
Mombasa -Kwa Jomvu (A109) 11.3 8 Poor
Kwa Jomvu - Mariakani (A109) 30 8 Poor
Magongo (A109L) Road [Old Mombasa Road] 4 6 Fair
Mariakani - Maji Ya Chumvi 13 4 Good
Maji ya Chumvi - Bachuma Gate 53 2 Very Good
Bachuma Gate – Voi 54.1 8 Poor
Voi - Mtito Andei 95.1 6 Fair
Mtito Andei - Sultan Hamud 132.7 3 Good
Sultan Hamud - Machakos Turnoff 80 2.5 Good
Machakos Turnof - Athi River 25 3 Good
Athi River – JKIA 15 2.5 Good
JKIA - Likoni Road Junction 5.7 2.5 Good
Southern Bypass 29 1.5 Excellent
Likoni Road junction - James Gichuru 15 2.5 Good
James Gichuru – Rironi 26 6 Fair
Rironi - Mai Mahiu 20 3 Good
Mai Mahiu - Naivasha 38 3 Good
Rironi – Gilgil 89 3 Good
Gilgil - Mau Summit 90 3 Good
Mau Summit - Timboroa 38.8 3 Good
Timboroa - Eldoret 80 2 Very Good
Eldoret – Webuye 60 2 Very Good
Webuye – Malaba 57.8 2 Very Good

THE TRANSPORT OBSERVATORY REPORT // 11th Issue | November 2017
34
Route Road Section Length (Km) IRI Condition
Mau Summit - Kisian 150.1 2 Very Good
Kisian – Busia 101 8 Poor
Isebania - Ahero - Kakamega - Kitale - Lokichar - Nadapal
Isebania – Kisii 80 6 Fair
Kisii – Ahero 85 5 Fair
Ahero - Kisumu 17 2 Very Good
Kisumu - Mamboleo Junction 4 8 Poor
Mamboleo Junction - Kakamega 47 6 Fair
Kakamega - Webuye 40 8 Poor
Webuye - Laseru 58.4 3 Good
Laseru - Kitale 60 3 Good
Kitale – Morpus 68.5 4 Fair
Morpus - Lokichar 147 8 Poor
Lokichar - Loichangamatak 50 8 Poor
Loichangamatak - Lodwar 50 8 Poor
Lodwar - Lokitaung 80 8 Poor
Lokitaung - Kalobeiyei 80 8 Poor
Kalobeiyei - Nadapal 80 8 Poor
Voi- Mwatate 45 2 Very Good
Mwatate - Taveta 99 2 Very Good
Athi River - Namanga 137 3 Good
Source: Kenya National Highways Authority (KeNHA) Sep 2017 Most of the road sections along the Northern Corridor in Kenya which are in poor condition are undergoing rehabilitation. KeNHA is adopting proper maintenance approaches/strategies to ensure that the Corridor meets the international standards. Most of the sections are under performance based maintenance contracts and are adopting a 5-year rolling plan that will be used to address maintenance of the Corridor. The Corridor is also divided into two sections with management that has a budget for maintenance. It is recommended that new roads be resealed after 6 years to prolong their lifespan.
d) Road condition in Rwanda The table 31 below shows designated routes in Rwanda.
Table 31: Designated Northern Corridor Roads in Rwanda From By way of To
Kagitumba Kigali-Butare Akanyaru Haut
Kagitumba Kigali-Butare Cyangugu
Kagitumba Kigali- Akanyaru Haut
Gatuna Kigali-Butare Cyangugu
Gatuna Kigali-Butare Gisenyi
Cyangugu Bugarama
Cyanika Ruhengeri Isenyi
Source: NCTTA, 2007
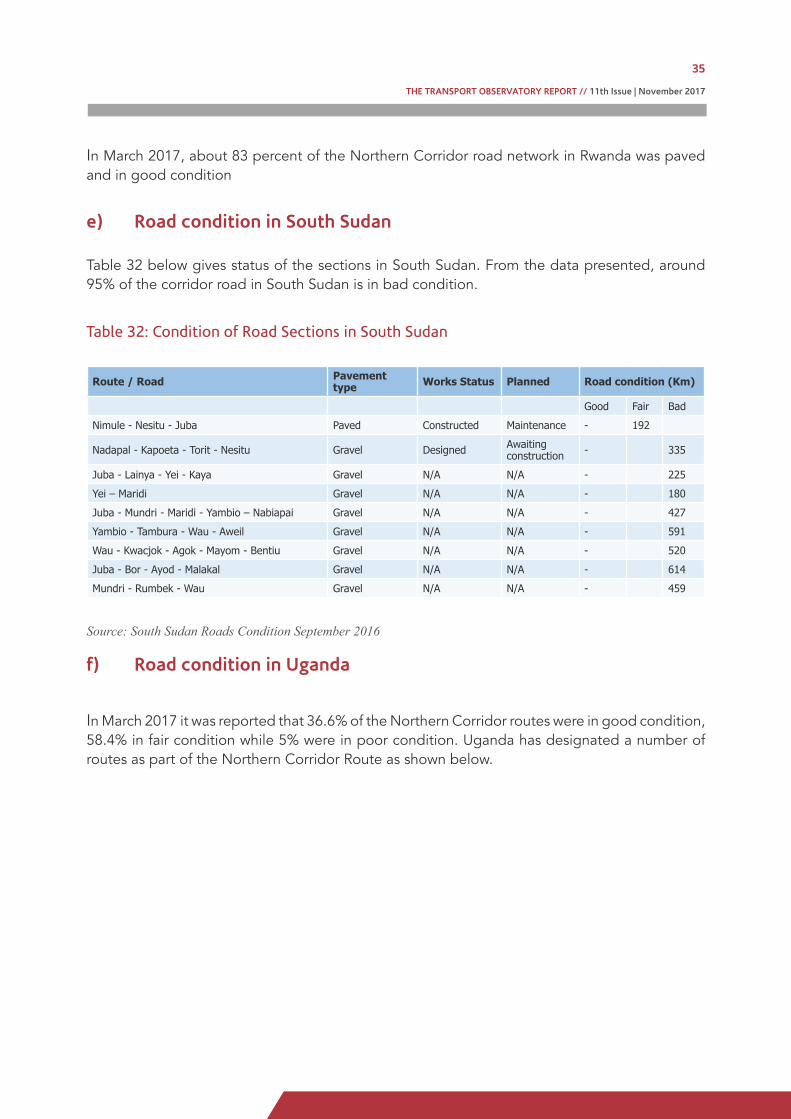
THE TRANSPORT OBSERVATORY REPORT // 11th Issue | November 2017
35
In March 2017, about 83 percent of the Northern Corridor road network in Rwanda was paved and in good condition
e) Road condition in South Sudan Table 32 below gives status of the sections in South Sudan. From the data presented, around 95% of the corridor road in South Sudan is in bad condition.
Table 32: Condition of Road Sections in South Sudan
Route / Road Pavement
type Works Status Planned Road condition (Km)
Good Fair Bad
Nimule - Nesitu - Juba Paved Constructed Maintenance - 192
Nadapal - Kapoeta - Torit - Nesitu Gravel Designed Awaiting construction - 335
Juba - Lainya - Yei - Kaya Gravel N/A N/A - 225
Yei – Maridi Gravel N/A N/A - 180
Juba - Mundri - Maridi - Yambio – Nabiapai Gravel N/A N/A - 427
Yambio - Tambura - Wau - Aweil Gravel N/A N/A - 591
Wau - Kwacjok - Agok - Mayom - Bentiu Gravel N/A N/A - 520
Juba - Bor - Ayod - Malakal Gravel N/A N/A - 614
Mundri - Rumbek - Wau Gravel N/A N/A - 459
Source: South Sudan Roads Condition September 2016
f) Road condition in Uganda
In March 2017 it was reported that 36.6% of the Northern Corridor routes were in good condition, 58.4% in fair condition while 5% were in poor condition. Uganda has designated a number of routes as part of the Northern Corridor Route as shown below.

THE TRANSPORT OBSERVATORY REPORT // 11th Issue | November 2017
36
Table 33: Designated Northern Corridor Roads in Uganda
From By way of To
Malaba Jinja-Kampala-Masaka- Kabale
Malaba Jinja-Kampala Ishasha River
Malaba Jinja-Kampala Mpondwe
Malaba Tororo Goli
Malaba Tororo Arua
Busia Jinja-Kampala-Masaka-Kabale Katuna
Busia Jinja-Kampala Ishasha River
Busia Tororo Arua
Busia Tororo Goli
Kasese Ishaka-Ntungamo Kagitumba
Kasese Mpondwe
Kasese Ishasha River
Source: NCTTA, 2007
4.4 Weighbridge Traffic This Indicator measures the average number of trucks weighed per day at a particular weighbridge along the Northern Corridor.
The road transport (trucking) is dominant transport mode for moving freight accounting for over 95% of goods moving along the Corridor. This is evident from the number of trucks crossing the weighbridges and accessing the port. Trucks operating on corridors are subject to various other check points and controls that affect their utilization and costs. With the increasing number of trucks on the Corridor, measures should be put in place to expand the Corridor and remove bottlenecks at the nodes.
Figure 9: Average daily weighed traffic for Kenya Weighbridges
Daily Traffic
No
of T
ruck
s
12000-
10000-
8000-
6000-
4000-
2000-
0-
JAN - 17 MAR - 17 MAY - 17 JUL - 17 SEP - 17
Mariakani Athi River Busia Gilgil Webuye
Source: KeNHA, Jan to September 2017

THE TRANSPORT OBSERVATORY REPORT // 11th Issue | November 2017
37
There are 5 weighbridges along the Northern Corridor in Kenya. These are Mariakani, Athi-river, Gilgil, Webuye, and Busia. All these weighbridges are High-Speed Weigh-in-motion except the one at Busia.
Figure 9 above gives the trend of monthly average traffic volumes for the three-month period (from January to September 2017. Athi-river weighbridge records the highest number of vehicles weighed followed by Gilgil and Mariakani. The higher traffic weighed at Athi-river is due to cargo that originates from Namanga route, Nairobi, and its environs. The Kenya National Highway Authority has improved the facilities at these weighbridges and installed weighing scales on either side of the road to minimize delays.
4.5 Weight Compliance at the Weighbridge
The indicator measures the percentage of trucks that comply with the gross vehicle weight and the vehicle axle load limits before and after re-distribution of cargo as stipulated in the EAC Vehicle Load Control Act.
Members of the EAC are implementing the East African Community Vehicle Load Control Act though there are variations to the extent of implementation. South Sudan is yet to adjust and enforce the regional vehicle load limits. Rwanda is in the process of procuring fixed weighbridges.
From the figure below the weighbridges in Kenya recorded a steady performance in terms of compliance levels of over 90 percent performance except for Busia weighbridge. Low compliance at the Busia weighbridge could be attributed to the fact that most of the cargo through Busia are exports originating from Kenya and the Busia weighbridge offers the first opportunity for the loaded trucks to be weighed.
Mariakani and Athi-river weighbridges register higher compliance levels given the level of awareness by transport association in Kenya and transport Saccos in Nairobi. Furthermore, a good proportion of trucks carry containers which are weighed prior to shipment at the port of loading. KeNHA is in the process of modernizing the weighbridges by having all weighbridges high speed weigh in motion and on either side of the road at busy sections. It is also in the process of procuring Virtual weighbridges which will be remotely monitored without interfering with the smooth flow of traffic along the Corridor. SACCOs for local transporters are being formed as one of the channels to promote voluntary compliance to Vehicle Load Limits in Kenya.

THE TRANSPORT OBSERVATORY REPORT // 11th Issue | November 2017
38
Figure 10: Weight Compliance Level at weighbridges in Kenya
Weight Compliance
%
100-
90-
80-
70-
60-
50-
40-
30-
20-
10-
0-
JAN - 17 MAR - 17 MAY - 17 JUL - 17 SEP - 17
Mariakani Athi River Busia Gilgil Webuye
KeNHA, Kenya October 2016 to March 2017
4.6 Average daily weighed traffic for Uganda Weighbridges Uganda has eight Fixed Slow Speed Weigh in Motion weighbridges located at Busitema, Lukaya, Mbarara, Mubende, Mbale, Luwero, Magamaga and Ibanda. The table below gives the average daily traffic at Luwero and Magamaga and Mubende weighbridges. Four Portable weighbridges operated by UNRA are based at Moroto, Lira, and Luwero- Gulu road.
Table 34: Average Monthly daily weighbridge traffic in Uganda
Weighbridge Month Daily Average
LUWERO Jan 406
Feb 201
Mar 268
Apr 339
May 365
Jun 339
Jul 359
Aug 390
Magamaga Feb 152
Mar 339
Apr 443
Mubende Jan 343
Source: UNRA, September, 2017
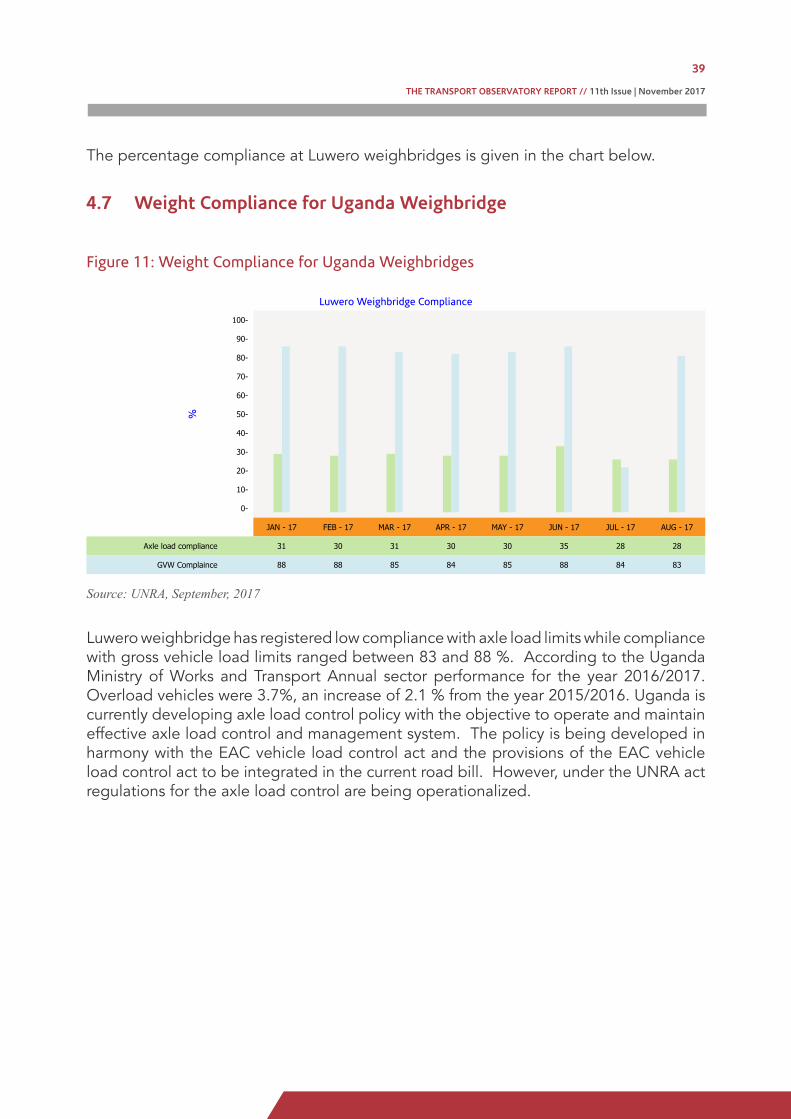
THE TRANSPORT OBSERVATORY REPORT // 11th Issue | November 2017
39
The percentage compliance at Luwero weighbridges is given in the chart below.
4.7 Weight Compliance for Uganda Weighbridge
Figure 11: Weight Compliance for Uganda Weighbridges
Luwero Weighbridge Compliance
%
100-
90-
80-
70-
60-
50-
40-
30-
20-
10-
0-
JAN - 17 FEB - 17 MAR - 17 APR - 17 MAY - 17 JUN - 17 JUL - 17 AUG - 17
Axle load compliance 31 30 31 30 30 35 28 28
GVW Complaince 88 88 85 84 85 88 84 83
Source: UNRA, September, 2017
Luwero weighbridge has registered low compliance with axle load limits while compliance with gross vehicle load limits ranged between 83 and 88 %. According to the Uganda Ministry of Works and Transport Annual sector performance for the year 2016/2017. Overload vehicles were 3.7%, an increase of 2.1 % from the year 2015/2016. Uganda is currently developing axle load control policy with the objective to operate and maintain effective axle load control and management system. The policy is being developed in harmony with the EAC vehicle load control act and the provisions of the EAC vehicle load control act to be integrated in the current road bill. However, under the UNRA act regulations for the axle load control are being operationalized.
THE TRANSPORT OBSERVATORY REPORT // 11th Issue | November 2017
40
SECTION FIVE:
TIME AND DELAYS Moving freight from one point to another along the Corridor may be prone to delays as a result of infrastructure bottlenecks, compounded by regulatory problems issues such as police roadblocks or customs checkpoints. It has been estimated that about 40% of the total logistics costs are indirect costs that arise from delays that include additional and inventory demurrage costs. For instance, Delays at borders along the Northern Corridor were estimated at a cost of $250 for a trucking company.
The scope of this section includes measuring the time from departure to arrival of goods at the port, particular node, and town or land border station. It also analyses and presents some key findings on time-related indicators up to when the goods are under Customs control.
The data on transit time and delays within the Northern Corridor are obtained from electronic data sources including customs business systems, Regional Electronic Cargo Tracking System (RECTS) and the Mobile Phones Surveys.
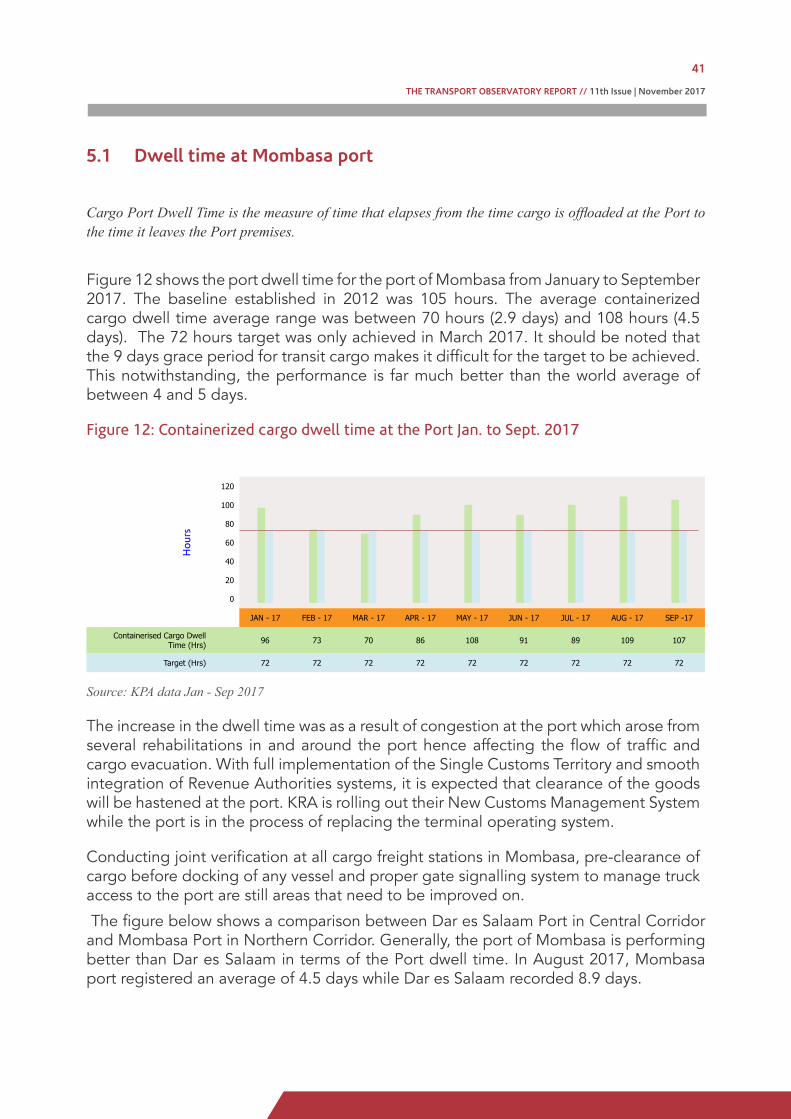
THE TRANSPORT OBSERVATORY REPORT // 11th Issue | November 2017
41
SECTION FIVE:
TIME AND DELAYS Moving freight from one point to another along the Corridor may be prone to delays as a result of infrastructure bottlenecks, compounded by regulatory problems issues such as police roadblocks or customs checkpoints. It has been estimated that about 40% of the total logistics costs are indirect costs that arise from delays that include additional and inventory demurrage costs. For instance, Delays at borders along the Northern Corridor were estimated at a cost of $250 for a trucking company.
The scope of this section includes measuring the time from departure to arrival of goods at the port, particular node, and town or land border station. It also analyses and presents some key findings on time-related indicators up to when the goods are under Customs control.
The data on transit time and delays within the Northern Corridor are obtained from electronic data sources including customs business systems, Regional Electronic Cargo Tracking System (RECTS) and the Mobile Phones Surveys.
5.1 Dwell time at Mombasa port
Cargo Port Dwell Time is the measure of time that elapses from the time cargo is offloaded at the Port to the time it leaves the Port premises.
Figure 12 shows the port dwell time for the port of Mombasa from January to September 2017. The baseline established in 2012 was 105 hours. The average containerized cargo dwell time average range was between 70 hours (2.9 days) and 108 hours (4.5 days). The 72 hours target was only achieved in March 2017. It should be noted that the 9 days grace period for transit cargo makes it difficult for the target to be achieved. This notwithstanding, the performance is far much better than the world average of between 4 and 5 days.
Figure 12: Containerized cargo dwell time at the Port Jan. to Sept. 2017
Hou
rs
120
100
80
60
40
20
0
JAN - 17 FEB - 17 MAR - 17 APR - 17 MAY - 17 JUN - 17 JUL - 17 AUG - 17 SEP -17
Containerised Cargo Dwell Time (Hrs) 96 73 70 86 108 91 89 109 107
Target (Hrs) 72 72 72 72 72 72 72 72 72
Source: KPA data Jan - Sep 2017
The increase in the dwell time was as a result of congestion at the port which arose from several rehabilitations in and around the port hence affecting the flow of traffic and cargo evacuation. With full implementation of the Single Customs Territory and smooth integration of Revenue Authorities systems, it is expected that clearance of the goods will be hastened at the port. KRA is rolling out their New Customs Management System while the port is in the process of replacing the terminal operating system.
Conducting joint verification at all cargo freight stations in Mombasa, pre-clearance of cargo before docking of any vessel and proper gate signalling system to manage truck access to the port are still areas that need to be improved on.
The figure below shows a comparison between Dar es Salaam Port in Central Corridor and Mombasa Port in Northern Corridor. Generally, the port of Mombasa is performing better than Dar es Salaam in terms of the Port dwell time. In August 2017, Mombasa port registered an average of 4.5 days while Dar es Salaam recorded 8.9 days.

THE TRANSPORT OBSERVATORY REPORT // 11th Issue | November 2017
42
Figure 13: Dwell time comparison for Central and Northern Corridors (2017)
Dwell time comparison between Mombasa and Dar es salaam ports
Day
s
10
8
6
4
2
0
JAN - 17 FEB - 17 MAR - 17 APR - 17 MAY - 17 JUN - 17 JUL - 17 AUG - 17
Dar s salaam Port 8.1 8.1 9.2 7.8 6.9 8.4 7.3 8.9
Mombasa Port 4.0 3.1 2.9 3.6 4.5 3.8 3.7 4.5
Source: KPA and Central Corridor Transport Observatory, 2017
5.2 Time for customs clearance at the Document Processing Centre (DPC) This refers to the time taken by Customs to pass an entry lodged by a clearing agent. This time contributes to the total port dwell time.The data shows a gradual improvement in performance from January to September 2017. The 2-hour target was achieved in the month of September which registered 2.74 hours. There are various intervening processes at the DPC namely:
- Manifest submitted electronically by Ships Agent to DPC in Nairobi- Manifest is accepted in DPC and a manifest number generated (accepting involves
ensuring all BL are accounted for on the manifest) any queries directed to Ships Agent for clarification before acceptance
- Clearing Agent submits declaration electronically to SIMBA - DPC proceeds with Clearance process SIMBA- Lodgement of import declaration, assessment of duty payable.
Actors Processes
Simba (system)
Clearance Agent
KRA – Clearance Officer
Registration of declaration
Allocation to Clearance officer
Payment Authorized
Documentary checks
Documentary release from DPC
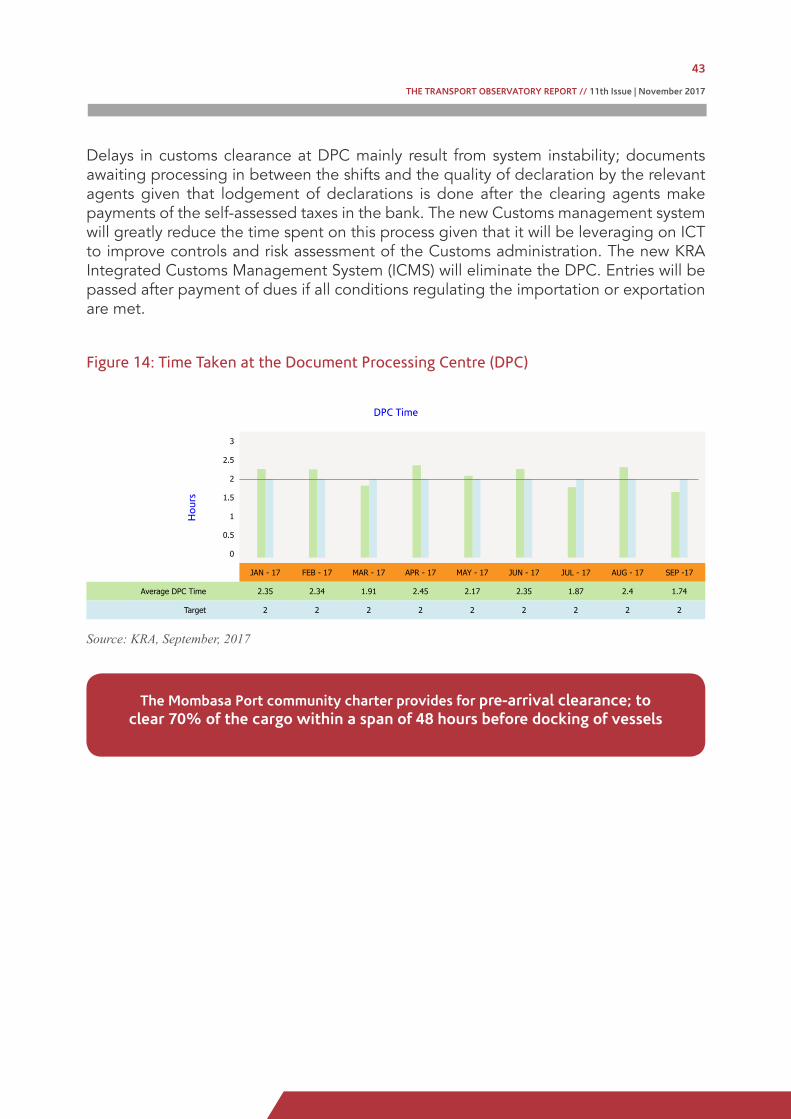
THE TRANSPORT OBSERVATORY REPORT // 11th Issue | November 2017
43
Delays in customs clearance at DPC mainly result from system instability; documents awaiting processing in between the shifts and the quality of declaration by the relevant agents given that lodgement of declarations is done after the clearing agents make payments of the self-assessed taxes in the bank. The new Customs management system will greatly reduce the time spent on this process given that it will be leveraging on ICT to improve controls and risk assessment of the Customs administration. The new KRA Integrated Customs Management System (ICMS) will eliminate the DPC. Entries will be passed after payment of dues if all conditions regulating the importation or exportation are met.
Figure 14: Time Taken at the Document Processing Centre (DPC)
DPC Time
Hou
rs
3
2.5
2
1.5
1
0.5
0
JAN - 17 FEB - 17 MAR - 17 APR - 17 MAY - 17 JUN - 17 JUL - 17 AUG - 17 SEP -17
Average DPC Time 2.35 2.34 1.91 2.45 2.17 2.35 1.87 2.4 1.74
Target 2 2 2 2 2 2 2 2 2
Source: KRA, September, 2017
The Mombasa Port community charter provides for pre-arrival clearance; to
clear 70% of the cargo within a span of 48 hours before docking of vessels
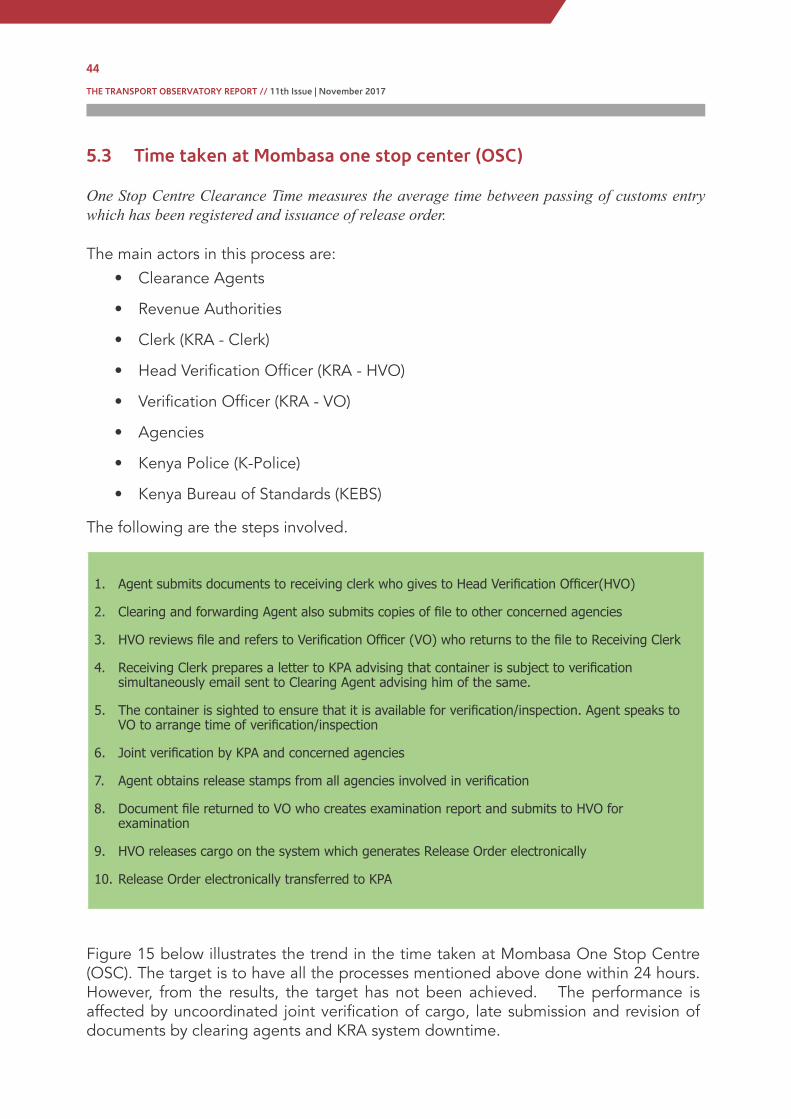
THE TRANSPORT OBSERVATORY REPORT // 11th Issue | November 2017
44
5.3 Time taken at Mombasa one stop center (OSC)
One Stop Centre Clearance Time measures the average time between passing of customs entry which has been registered and issuance of release order.
The main actors in this process are:• Clearance Agents
• Revenue Authorities
• Clerk (KRA - Clerk)
• Head Verification Officer (KRA - HVO)
• Verification Officer (KRA - VO)
• Agencies
• Kenya Police (K-Police)
• Kenya Bureau of Standards (KEBS)
The following are the steps involved.
1. Agent submits documents to receiving clerk who gives to Head Verification Officer(HVO)
2. Clearing and forwarding Agent also submits copies of file to other concerned agencies
3. HVO reviews file and refers to Verification Officer (VO) who returns to the file to Receiving Clerk
4. Receiving Clerk prepares a letter to KPA advising that container is subject to verification simultaneously email sent to Clearing Agent advising him of the same.
5. The container is sighted to ensure that it is available for verification/inspection. Agent speaks to VO to arrange time of verification/inspection
6. Joint verification by KPA and concerned agencies
7. Agent obtains release stamps from all agencies involved in verification
8. Document file returned to VO who creates examination report and submits to HVO for examination
9. HVO releases cargo on the system which generates Release Order electronically
10. Release Order electronically transferred to KPA
Figure 15 below illustrates the trend in the time taken at Mombasa One Stop Centre (OSC). The target is to have all the processes mentioned above done within 24 hours. However, from the results, the target has not been achieved. The performance is affected by uncoordinated joint verification of cargo, late submission and revision of documents by clearing agents and KRA system downtime.
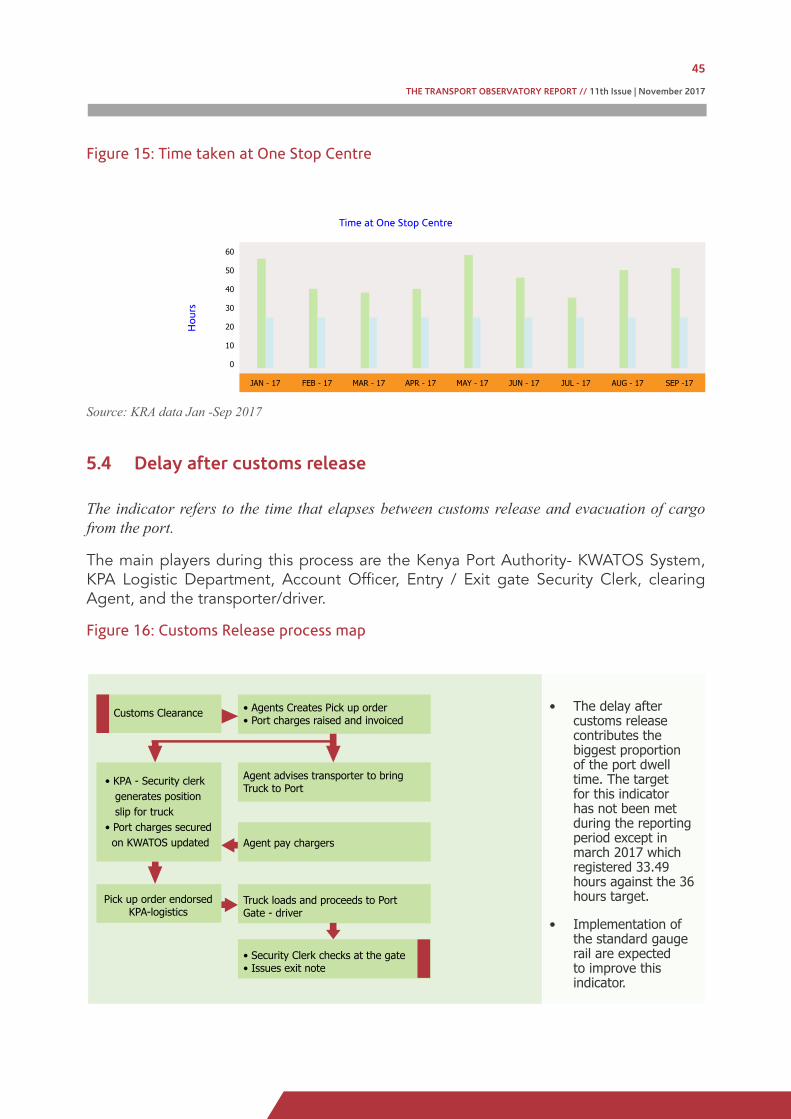
THE TRANSPORT OBSERVATORY REPORT // 11th Issue | November 2017
45
Figure 15: Time taken at One Stop Centre
Time at One Stop Centre
Hou
rs
60
50
40
30
20
10
0
JAN - 17 FEB - 17 MAR - 17 APR - 17 MAY - 17 JUN - 17 JUL - 17 AUG - 17 SEP -17
Source: KRA data Jan -Sep 2017
5.4 Delay after customs release
The indicator refers to the time that elapses between customs release and evacuation of cargo from the port.
The main players during this process are the Kenya Port Authority- KWATOS System, KPA Logistic Department, Account Officer, Entry / Exit gate Security Clerk, clearing Agent, and the transporter/driver.
Figure 16: Customs Release process map
Customs Clearance
Pick up order endorsed KPA-logistics
• KPA - Security clerk generates position slip for truck• Port charges secured on KWATOS updated
• Agents Creates Pick up order• Port charges raised and invoiced
Agent advises transporter to bring Truck to Port
Agent pay chargers
Truck loads and proceeds to Port Gate - driver
• Security Clerk checks at the gate • Issues exit note
• The delay after customs release contributes the biggest proportion of the port dwell time. The target for this indicator has not been met during the reporting period except in march 2017 which registered 33.49 hours against the 36 hours target.
• Implementation of the standard gauge rail are expected to improve this indicator.

THE TRANSPORT OBSERVATORY REPORT // 11th Issue | November 2017
46
This calls for critically reviewing the gate clearing system and cargo pick up processes to ensure faster evacuation. Transporters need to speed up cargo removal from the Port as one of the ways of attaining the set target. The ongoing improvements of road infrastructure around the port by increasing multiple lanes for evacuation will go a long way in decongesting the port.
Figure 17: Delay after Custom Release
Time after Custom Release
Hou
rs
60
50
40
30
20
10
0
JAN - 17 FEB - 17 MAR - 17 APR - 17 MAY - 17 JUN - 17 JUL - 17 AUG - 17 SEP -17
Average Time after Release 47.90 34.91 33.59 44.17 49.53 40.95 41.08 46.31 50.75
Target 36.00 36.00 36.00 36.00 36.00 36.00 36.00 36.00 36.00
Source: KRA data Jan -Sep 2017
For goods cleared under Single Customs Territory an agent lodges an entry into the home country system ASYCUDA for Rwanda and Uganda. Rwanda has a Single window system (Rwanda Electronic Single Window) which allows all the border agencies to interface with ASYCUDA when a consignment is dealt with at Mombasa. Seals are applied and the other agencies conduct their procedures at the Traders premise in Rwanda. The official RRA release cannot be issued until the agencies have completed their tasks.
Figure 18: Single Customs Territory clearance regime goods release at the Port
RRA officers Verification/Assessment
Payment of Taxes
RRA officers Verification/Assessment
• KRA officer CAMIS which updates ASYCUDA
• KRA Officer Creates C2 (Movement Record)
KRA Officer Creates C2
(Movement Record)
Consignment Leaves the Port
VO authorizes release on system VO
issues Exit Note
Figure 19 gives the time duration between payment of tax to release and issuance of exit note January to June 2017. On average, it takes about 54.5 hours from payment of
Agent lodges entry in ASSYCUDA
RRA officers V e r i f i c a t i o n /Assessment
VO authorizes release on system VO issues Exit Note
KRA officer CAMIS which updates ASYCUDA
KRA Officer Creates C2 (Movement Record)
Payment of Taxes
KRA Officer Creates C2 (Movement Record)
Consignment Leaves the Port

THE TRANSPORT OBSERVATORY REPORT // 11th Issue | November 2017
47
This calls for critically reviewing the gate clearing system and cargo pick up processes to ensure faster evacuation. Transporters need to speed up cargo removal from the Port as one of the ways of attaining the set target. The ongoing improvements of road infrastructure around the port by increasing multiple lanes for evacuation will go a long way in decongesting the port.
Figure 17: Delay after Custom Release
Time after Custom Release
Hou
rs
60
50
40
30
20
10
0
JAN - 17 FEB - 17 MAR - 17 APR - 17 MAY - 17 JUN - 17 JUL - 17 AUG - 17 SEP -17
Average Time after Release 47.90 34.91 33.59 44.17 49.53 40.95 41.08 46.31 50.75
Target 36.00 36.00 36.00 36.00 36.00 36.00 36.00 36.00 36.00
Source: KRA data Jan -Sep 2017
For goods cleared under Single Customs Territory an agent lodges an entry into the home country system ASYCUDA for Rwanda and Uganda. Rwanda has a Single window system (Rwanda Electronic Single Window) which allows all the border agencies to interface with ASYCUDA when a consignment is dealt with at Mombasa. Seals are applied and the other agencies conduct their procedures at the Traders premise in Rwanda. The official RRA release cannot be issued until the agencies have completed their tasks.
Figure 18: Single Customs Territory clearance regime goods release at the Port
RRA officers Verification/Assessment
Payment of Taxes
RRA officers Verification/Assessment
• KRA officer CAMIS which updates ASYCUDA
• KRA Officer Creates C2 (Movement Record)
KRA Officer Creates C2
(Movement Record)
Consignment Leaves the Port
VO authorizes release on system VO
issues Exit Note
Figure 19 gives the time duration between payment of tax to release and issuance of exit note January to June 2017. On average, it takes about 54.5 hours from payment of
Agent lodges entry in ASSYCUDA
RRA officers V e r i f i c a t i o n /Assessment
VO authorizes release on system VO issues Exit Note
KRA officer CAMIS which updates ASYCUDA
KRA Officer Creates C2 (Movement Record)
Payment of Taxes
KRA Officer Creates C2 (Movement Record)
Consignment Leaves the Port
tax to release, 170.6 hours from release to the issuance of exit note. Overall, it takes an average of 218.2 hours (9 days) hours for a trader in Rwanda to complete clearance of goods under Single Customs Territory for release from Mombasa Port.
Figure 19: RRA SCT release at the Port of Mombasa
Payment to Exit 218.2
Release to Exit 170.6
Payment to Release 54.5
|
0.0|
50.0|
100.0|
150.0|
200.0|
250.0
Hours
Source: RRA-Jan-June, 2017
Goods cleared under Single Customs Territory take almost the same time as the grace period for the port. Meaningful gains are realised at the border crossing where there is no time wasted in clearance.
5.5 Clearance of good to DRC
The following steps are applied in clearance of goods destined to DRC
1. Agent applies to OGEFREM for certificate of destination showing, point of departure from Kenya, Point of entry to DRC and point of destination in DRC
2. OGEFREM checks consignment on FERI system
3. Agent pays fee
4. OGEFREM Issues Certificate
5. Truck moves under transit conditions Through Uganda to the border
6. Agent creates declaration on Sydonia and Pays Duties and taxes
7. Sydonia updated and risk assigned (G B Y R)
8. Red/Yellow declarations assigned to Officer in Charge
9. DRC Verification Officer sights vehicle, checks seals and markings and Issues Exit note to permit transit inland
10. Goods move under convoy to internal destination (Customs Controlled warehouses)
11. Inspections carried out at Customs controlled Warehouse
From the data obtained on 134 records during the period April-September 2018, the median time duration between registration of a declaration upon arrival of goods at the borders in DRC and release was 58.76 hours.
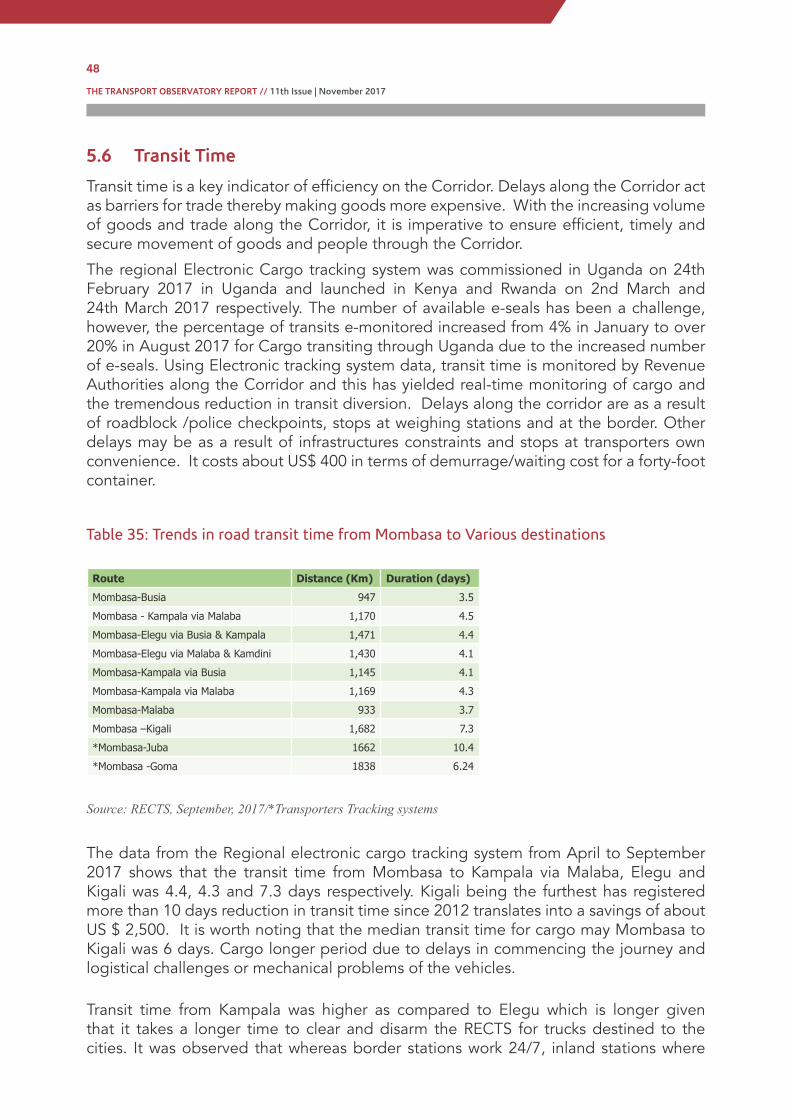
THE TRANSPORT OBSERVATORY REPORT // 11th Issue | November 2017
48
5.6 Transit Time
Transit time is a key indicator of efficiency on the Corridor. Delays along the Corridor act as barriers for trade thereby making goods more expensive. With the increasing volume of goods and trade along the Corridor, it is imperative to ensure efficient, timely and secure movement of goods and people through the Corridor.
The regional Electronic Cargo tracking system was commissioned in Uganda on 24th February 2017 in Uganda and launched in Kenya and Rwanda on 2nd March and 24th March 2017 respectively. The number of available e-seals has been a challenge, however, the percentage of transits e-monitored increased from 4% in January to over 20% in August 2017 for Cargo transiting through Uganda due to the increased number of e-seals. Using Electronic tracking system data, transit time is monitored by Revenue Authorities along the Corridor and this has yielded real-time monitoring of cargo and the tremendous reduction in transit diversion. Delays along the corridor are as a result of roadblock /police checkpoints, stops at weighing stations and at the border. Other delays may be as a result of infrastructures constraints and stops at transporters own convenience. It costs about US$ 400 in terms of demurrage/waiting cost for a forty-foot container.
Table 35: Trends in road transit time from Mombasa to Various destinations
Route Distance (Km) Duration (days)
Mombasa-Busia 947 3.5
Mombasa - Kampala via Malaba 1,170 4.5
Mombasa-Elegu via Busia & Kampala 1,471 4.4
Mombasa-Elegu via Malaba & Kamdini 1,430 4.1
Mombasa-Kampala via Busia 1,145 4.1
Mombasa-Kampala via Malaba 1,169 4.3
Mombasa-Malaba 933 3.7
Mombasa –Kigali 1,682 7.3
*Mombasa-Juba 1662 10.4
*Mombasa -Goma 1838 6.24
Source: RECTS, September, 2017/*Transporters Tracking systems
The data from the Regional electronic cargo tracking system from April to September 2017 shows that the transit time from Mombasa to Kampala via Malaba, Elegu and Kigali was 4.4, 4.3 and 7.3 days respectively. Kigali being the furthest has registered more than 10 days reduction in transit time since 2012 translates into a savings of about US $ 2,500. It is worth noting that the median transit time for cargo may Mombasa to Kigali was 6 days. Cargo longer period due to delays in commencing the journey and logistical challenges or mechanical problems of the vehicles.
Transit time from Kampala was higher as compared to Elegu which is longer given that it takes a longer time to clear and disarm the RECTS for trucks destined to the cities. It was observed that whereas border stations work 24/7, inland stations where

THE TRANSPORT OBSERVATORY REPORT // 11th Issue | November 2017
49
cargo is deposited pending clearance do not operate 24/7. Furthermore, most cargo destined to Elegu/Nimule are motor vehicle units that move much faster.
a) Transit Time in Kenya
Transit time using KRA SIMBA system data measures the period from the time a release order is issued by customs at the Port of Mombasa to the time the export certificate is generated by KRA after the cargo crosses the Kenya- Uganda border points of Malaba and Busia. The distance from Mombasa to Malaba is 933 kilometers and 947 kilometers to Busia.
Figure 20 shows the transit time between Mombasa to Malaba and Mombasa to Busia.
Figure 20: Transit Time from Mombasa to Malaba and Busia (hours)
Average Transit Time in Kenya - Mombasa - Malaba
Hou
rs
120-
100-
80-
60-
40-
20-
0-
APR - 17 MAY - 17 JUN - 17 JUL - 17 AUG - 17 SEP - 17
Mombasa - Malaba (933 km) 66.35 73.44 92.09 98.22 97.2 101.95
Target 72 72 72 72 72 72
Mombasa - Busia (947 km) 76.37 79.47 83.23 95.56 85.38 89.87
Source: KRA (RECTS), April 2017 to Sep 2017
The target transit time for cargo from Mombasa to Malaba and Busia border point is 72 hours. Busia and Malaba are 947 and 933 Km from Mombasa respectively. The trend shows a slight increment in transit time over time.
The figure indicates that transit increased from 66.4 hours in April to 102 hours in September for trucks transiting through Malaba. Similarly, there was an increment of about 13.5 hours from 76.4 hours recorded in April and 89.9 hours registered in September for transiting well through Busia.
The target for the transit time has not been achieved as a result of delays, infrastructure, bottlenecks around the port causing congestion, delays within transporters facilities and high frequency of stoppages along the route due to personal reasons. The section between Kisian and Busia is also in a poor state. However, there are planned works whereby a contractor is mobilizing for construction interchanges at Kericho and Ahero Junctions.

THE TRANSPORT OBSERVATORY REPORT // 11th Issue | November 2017
50
Kisian - Busia is under periodic maintenance with the design for rehabilitation financed by the Government of Kenya ongoing. The construction works ongoing for Machakos Turn-off - Athi River is 21% complete at the time of reporting. Rehabilitation of Mombasa - Kwa Jomvu is at 2% once completed will see an improvement in transit time. The 32 Km Eldoret town bypass which is under Construction and the planned duelling of sections along the corridor will ultimately reduce the cost of doing business along the corridor.
5.7 Transit Time in Burundi
This transit time is obtained from the time a T1 is generated to the time of arrival of goods. This section captures transit time from Kanyaru- Haut, and Gasenyi to Bujumbura and Gatumba. Gasenyi and Kanyaru- Haut is at the border with Rwanda while Gatumba is at the border with DRC.
Figure 21: Transit Time in Burundi
Transit Time
Hou
rs
70-
60-
50-
40-
30-
20-
10-
0-
APR - 17 MAY - 17 JUN - 17 JUL - 17 AUG - 17 SEP - 17
Kanyaru Haut - Bujumbura (119 Km) 21.97 30.71 34.17 65.36 31.85 26.33
Gasenvi - Gatumba 31.90 30.03 31.73 39.06 30.41 34.64
Kanyaru Haut - Gatumba (138 Km) 30.47 24.83 35.33 31.49 27.13 30.21
Gasenyi - Bunjumbura 40.98 41.42 37.87 39.53 42.13 39.19
Source: OB, April 2017 to Sep 2017
The average transit time for the Kanyaru- Haut to Bujumbura for the whole period was 36 hours, while Gasenyi to Gatumba was 32.6 hours. There are delays in receipt of trucks into the customs areas at destination and retirement of transit bonds. The transit times are high given the short distances. These delays are somewhat attributed to the fact that customs data has delays before the records are updated when the trucklong after the truck has completed its journey and arrived at the destination customs area. The figure below gives a comparison between the same period in 2016 and 2017.

THE TRANSPORT OBSERVATORY REPORT // 11th Issue | November 2017
51
Figure 22: Transit time in Burundi from Kanyaru Haut
Transit Time
Hou
rs
70-
60-
50-
40-
30-
20-
10-
0-
2016 2017
APR MAY JUN JUL AUG SEPT APR MAY JUN JUL AUG SEPT
Kanyaru Haut - Kayanza (24 Km) 3 4 11 5 6 2 5 13 12 22 9 23
Kanyaru Haut - Gatumba (138 Km) 19 24 31 25 24 28 30 25 35 31 27 30
Kanyaru Haut - Bunjumbura (118) 31 26 33 28 27 38 22 31 34 65 32 30.21
Source: OBR, 2016- 2017
Transit time to Bujumbura increased during the month of July as a result of stops by drivers along the roads and checks.
5.8 Transit Time in Rwanda Through the Northern Corridor Transport Observatory, Transit time between the following sections was monitored: Gatuna to Akanyaru Haut (238 Km), Gatuna to Magerwa (81Km), and Gatuna to Nemba (150Km). Figure 34 shows the average time taken from Gatuna to the respective destinations over the period April to September 2017. There has been a gradual increment in transit time from April 2017 to September 2017. Gatuna to Magerwa takes longer time than Gatuna to Nemba despite the shorter distance. This is attributed to delay due to restrictions on trucks to pass through the city at particular hours of the day. On average, transit times have increased from 34.7 hours to 38.6 hours between Gatuna an Akanyaru, 23.3 hours to 27.9 hours between Gatuna and Nemba and from 28.5 hours to 35.9 hours between Gatuna and Magerwa when comparing the periods between October 2016 to March 2017 and April to September 2017.
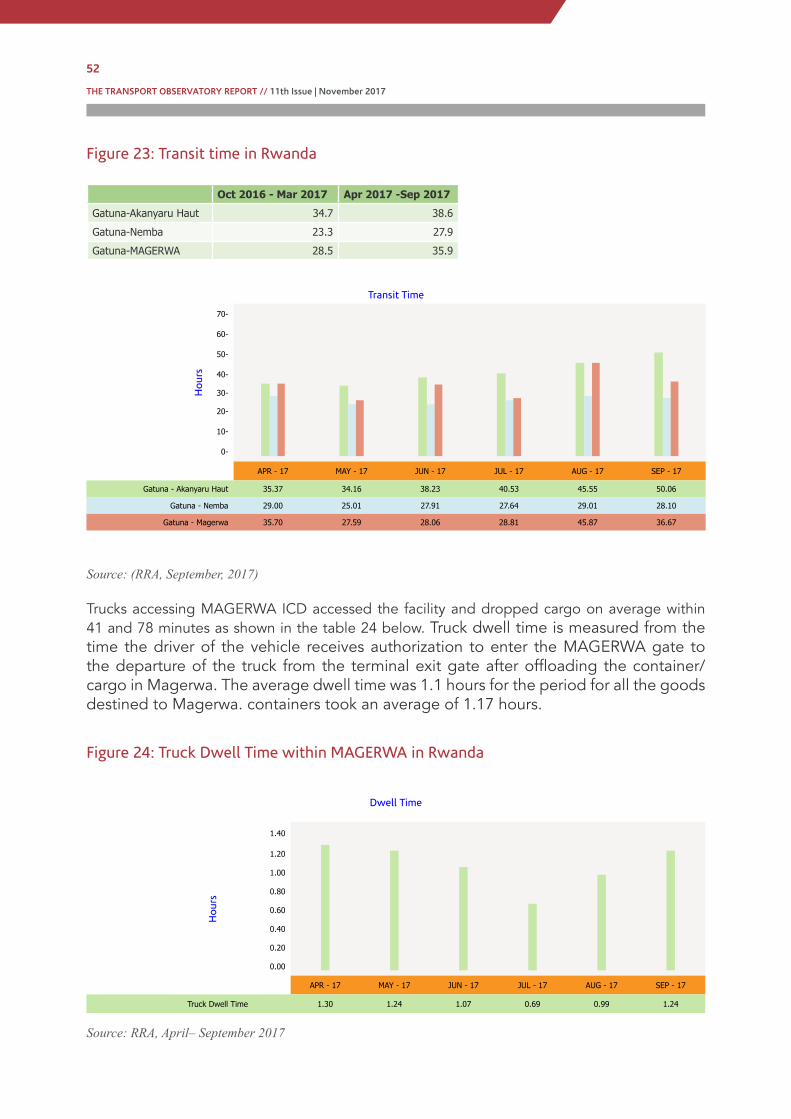
THE TRANSPORT OBSERVATORY REPORT // 11th Issue | November 2017
52
Figure 23: Transit time in Rwanda
Oct 2016 - Mar 2017 Apr 2017 -Sep 2017
Gatuna-Akanyaru Haut 34.7 38.6
Gatuna-Nemba 23.3 27.9
Gatuna-MAGERWA 28.5 35.9
Transit Time
Hou
rs
70-
60-
50-
40-
30-
20-
10-
0-
APR - 17 MAY - 17 JUN - 17 JUL - 17 AUG - 17 SEP - 17
Gatuna - Akanyaru Haut 35.37 34.16 38.23 40.53 45.55 50.06
Gatuna - Nemba 29.00 25.01 27.91 27.64 29.01 28.10
Gatuna - Magerwa 35.70 27.59 28.06 28.81 45.87 36.67
Source: (RRA, September, 2017)
Trucks accessing MAGERWA ICD accessed the facility and dropped cargo on average within 41 and 78 minutes as shown in the table 24 below. Truck dwell time is measured from the time the driver of the vehicle receives authorization to enter the MAGERWA gate to the departure of the truck from the terminal exit gate after offloading the container/cargo in Magerwa. The average dwell time was 1.1 hours for the period for all the goods destined to Magerwa. containers took an average of 1.17 hours.
Figure 24: Truck Dwell Time within MAGERWA in Rwanda
Dwell Time
Hou
rs
1.40
1.20
1.00
0.80
0.60
0.40
0.20
0.00
APR - 17 MAY - 17 JUN - 17 JUL - 17 AUG - 17 SEP - 17
Truck Dwell Time 1.30 1.24 1.07 0.69 0.99 1.24
Source: RRA, April– September 2017

THE TRANSPORT OBSERVATORY REPORT // 11th Issue | November 2017
53
5.9 Transit Time in Uganda
Figure 25 below shows the transit times in Uganda using the Regional electronic cargo tracking system. About 20% goods to Uganda are tracked using RECTS. All the destinations from Malaba have seen an improvement in transit times. However, it should be noted that it takes shorter time from Malaba to Goli which is 243 Km longer than Malaba-Kampala. This is because of the high traffic congestion along the Malaba – Kampala road as compared to Malaba – Goli road and delays associated with acknowledgment of receipt of cargo and clearance at the final destination. It takes longer for the RECTS gadgets to be disarmed at Kampala when a truck has already arrived.
Figure 25: Transit time in Uganda using electronic cargo tracking system
Transit Time
Hou
rs
70-
60-
50-
40-
30-
20-
10-
0-
APR -17 MAY -17 JUN -17 JUL -17 AUG -17 SEPT -17
Malaba - Elugu (497 Km) 48.14 54.99 32.63 39.12 30.04 24.74
Malaba - Goli (497 km) 25.00 33.39 27.69 27.10 25.71 26.14
Malaba - Mpondwe (678 Km) 51.52 61.25 65.29 39.88 38.44 35.44
Malaba - Kampala (236 Km) 69.79 37.14 31.15 36.07 30.18 27.64
Source: URA, customs R ECTS data
Busia offers an alternative entry and exit route for goods in Uganda. From the figure below, the transit time from Busia to Vura, Kampala and Katuna have been increasing. However, the period between August and September, the trend has reversed with Busia to Vura declining from 68.57 hours to 52.17 hours, Busia to Kampala improved from 47.7 hours to 33 hours while Busia-Katuna improved from 52.5 hours to 40 hours. The road infrastructure from Busia to Kampala and other destinations is in good condition.

THE TRANSPORT OBSERVATORY REPORT // 11th Issue | November 2017
54
Figure 26: Transit time from Busia to various destinations in Uganda
Transit TimeH
ours
70-
60-
50-
40-
30-
20-
10-
0-
APR -17 MAY -17 JUN -17 JUL -17 AUG -17 SEPT -17
Busia - Vura (621 Km) 42.00 51.09 59.21 58.66 68.57 52.17
Busia - Kampala (198 Km) 28.64 27.02 28.52 51.41 47.7 33.03
Busia - Katuna (630 km) 40.24 39.08 42.65 35.76 52.54 40.00
Source: URA, customs R ECTS data
From the figure 27, the transit time for exports from Kampala have remained stable for the period except for Kampala to Mpondwe which registered higher transit times during the month of August 2017.
Figure 27: Transit Time from Kampala
Transit Time
Hou
rs
70-
60-
50-
40-
30-
20-
10-
0-
APR -17 MAY -17 JUN -17 JUL -17 AUG -17 SEPT -17
Kampala - Elugu (457 Km) 36.05 33.98 36.43 34.70 34.90 33.39
Kampala - Goli (465 km) 26.21 37.52 31.97 35.25 32.56 33.25
Kampala - Mpondwe (442 Km) 59.48 48.95 41.17 48.75 64.17 54.75
Kampala - Oraba (581Km) 21.20 33.07 28.66 33.83 40.48 36.26
Kampala - Vurra (510 Km) 32.14 43.66 43.69 47.38 35.29 52.07
Source: URA, customs R ECTS data
SECTION SIX:
INTRA-REGIONAL TRADEThis chapter takes a close look at the recent trends, focusing on intra-regional trade in the Northern Corridor region. It presents aggregate statistics for the individual member states for the period of January to October 2017. The data was obtained from countries’ own trade data. In cases where there were gaps, mirror statistics were used. Statistics on international trade in goods between the Member States provide essential information for integration and trade facilitation policies.

THE TRANSPORT OBSERVATORY REPORT // 11th Issue | November 2017
55
SECTION SIX:
INTRA-REGIONAL TRADEThis chapter takes a close look at the recent trends, focusing on intra-regional trade in the Northern Corridor region. It presents aggregate statistics for the individual member states for the period of January to October 2017. The data was obtained from countries’ own trade data. In cases where there were gaps, mirror statistics were used. Statistics on international trade in goods between the Member States provide essential information for integration and trade facilitation policies.

THE TRANSPORT OBSERVATORY REPORT // 11th Issue | November 2017
56
6.1 Trade between Burundi and Other NC Member States
Table 36: Summary of Formal Trade (USD) in Burundi
Exports to
Month DRC KENYA RWANDA UGANDA
Jan -17 2,496,250 18,309 478,622 105,240
Feb -17 2,860,645 171,603 74,736 32,006
Mar -17 2,157,232 51,804 126,577 36,611
Apr -17 2,761,416 69,859 265,780 22,920
May -17 2,140,897 158,639 105,010 371,000
Jun -17 2,270,694 151,188 145,938 121,892
Jul -17 1,770,958 248,628 182,873 117,131
Aug -17 2,614,634 722,328 280,483 131,202
Sep -17 2,580,032 152,974 135,382 288,658
Total 21,652,758 21,652,758 1,795,401 1,226,660
Imports From
DRC KENYA RWANDA UGANDA
Jan -17 76,598 2,858,219 791,682 2,614,749
Feb -17 73,381 4,738,663 786,190 3,319,933
Mar -17 75,239 3,129,488 323,746 4,631,193
Apr -17 58,229 3,587,918 289,291 4,679,065
May -17 75,196 3,098,905 432,019 3,487,958
Jun -17 68,028 3,424,281 742,213 3,803,190
Jul -17 159,587 3,617,112 715,579 3,675,182
Aug -17 143,327 4,878,334 908,579 3,932,142
Sep -17 43,597 3,202,373 736,464 3,590,427
Total 773,182 32,535,293 5,725,763 33,733,839
Source: Burundi Bureau of Statistics. Jan-June 2017: 1 dollar = 1654.6 Francs Burundian as the exchange rate in 2017
Table 36 shows the values for intraregional trade between Burundi and other NC member states. There is little or no trade between Burundi and South Sudan. From the results, Burundi exports more to DRC and imports more from Uganda. In 2016, the total value of trade goods in the Northern Corridor region stood at 161.3 Million dollars. The half-year result shows the total value of goods traded for both exports and imports at USD 64.4 Million. From the figure below, it can be observed that there is a decrease in imports from Kenya

THE TRANSPORT OBSERVATORY REPORT // 11th Issue | November 2017
57
Figure 28: Imports and Exports between Burundi and NC member States
Trade between Burundi and NC Member States
USD
20000000 -
20000000 -
10000000 -
0-
EXPORTS IMPORTS
Source: Burundi Bureau of Statistics. Jan-June 2017
6.2 Trade between DRC and Other NC Member States
Table 37: Summary of formal Trade (USD) in DRC
Exports to:
Country Name BURUNDI KENYA RWANDA UGANDA
Jan -17 76,598 35,041 511,726 206184.69
Feb -17 73,381 240,069 525,103 493238.73
Mar -17 75,239 221,036 689,362 614272.02
Apr -17 58,229 56,153 666,207 381982.1
May -17 75,196 298,118 629,366 428141.22
Jun -17 68,028 166,393 713,377 340342.5
TOTAL 426,671 1,016,810 3,735,141 2,464,161
Imports from:
Jan -17 2,496,250 13,322,259 18,472,885 12,793,837
Feb -17 2,860,645 15,834,739 18,423,306 13,698,013
Mar -17 2,157,232 19,046,014 22,465,313 18,259,263
Apr -17 2,761,416 12,687,782 21,018,977 16,826,806
May -17 2,140,897 17,129,635 26,326,243 17,892,938
Jun -17 2,270,694 15,041,890 24,920,119 16,093,460
TOTAL 14,687,134 93,062,319 131,626,843 95,564,317
Source: Northern Corridor Transport Observatory Compilation
From the table 37, it can be noted that DRC is a net importer. Exports comprise only 2% of the total trade volume. Imports, on the other hand, make up 98% (USD 334, 940, 614) of the total volume traded in 2017. Most of the exports are minerals which are destined outside the region. Imports in this year comprised mostly food products as well as industrial products. Some the imported products include Aluminium strips, Cigarette paper rolls, artificial filaments Cables, acetic acid, cloths, plastics, vegetables, cigarette papers, diesel Generators, vegetable fats and oils, tobacco, Salt, among others.
The biggest imports and exports are between Rwanda and DRC.

THE TRANSPORT OBSERVATORY REPORT // 11th Issue | November 2017
58
Figure 29: Share of Imports and exports in DRC
Exports: Jan-Jun 2017 Imports: Jan-Jun 2017
Imports and Exports to NC
98%
2%
VALUE (%)
7,642,783 334,940,614
6.3 Trade between Kenya and Other NC Member States Kenya is still the leading exporter in the NC region trading in various products such as tobacco, machinery, and transportation equipment, petroleum products, oils, motor vehicles, iron and steel, agricultural products, paper and paper products, pharmaceuticals, fertilizer, construction materials among others. 49.85% of exports to the NC region goes to Uganda. 93.9% percent of imports originate from Uganda.
Figure 30: A Share of Kenya Exports and Imports
Share of Exports and Imports (%)
Uganda
Rwanda
Burundi
|
0.0|
10.0|
20.0|
30.0|
40.0|
50.0|
60.0|
70.0|
80.0|
90.0|
100.0
Imports Exports

THE TRANSPORT OBSERVATORY REPORT // 11th Issue | November 2017
59
Table 38: Summary of formal Exports (USD), January 2017 to July 2017
EXPORTS DESTINATION
BURUNDI DRC RWANDA SOUTH SUDAN UGANDA
Jan -17 6,060,181 13,322,259 11,172,471 16,180,674 52,240,971
Feb -17 5,605,459 15,834,739 12,327,269 11,527,183 55,084,969
Mar -17 5,552,332 19,046,014 13,910,454 17,497,329 56,474,578
Apr -17 5,374,049 12,687,782 13,445,961 14,608,953 46,307,929
May -17 10,907,375 17,129,635 14,354,535 13,242,439 46,345,351
Jun -17 6,777,232 15,041,890 13,761,645 19,552,556 47,362,379
Jul -17 5,939,956 16,095,411 18,073,411 16,844,930 52,152,746
Aug -17 6,373,305 12,673,368 13,561,723 7,172,253 43,306,322
TOTAL 52,589,889 121,831,098 110,607,469 116,626,319 399,275,245
IMPORTS ORIGIN
BURUNDI DRC RWANDA SOUTH SUDAN UGANDA
Jan -17 6,497 35,041 389,270 33,830 21,164,126
Feb -17 30,932 240,069 659,904 2,829 22,575,905
Mar -17 198,070 221,036 617,285 4,213 22,426,879
Apr -17 3,957 56,153 611,518 465 15,062,411
May -17 22,075 298,118 851,590 61,648 35,147,969
Jun -17 40,301 166,393 3,485,704 16,095 34,015,722
Jul -17 44,130 458,674 3,616,859 9,634 26,456,650
Aug -17 3,718 460,169 669,189 10,732 28,182,957
TOTAL 349,680 1,935,654 10,901,319 139,446 205,032,619
Source: Kenya National Bureau of Statistics
There are few imports from South Sudan. Comparing the performance between 2016 and 2017 from January to June, exports reduced from USD 608,736,595 to USD 623,759,748 while imports increased from USD 82,453,445 to USD 158,446,006. Imports from Uganda almost doubled from USD 77,610,885 to USD 150,393,013.

THE TRANSPORT OBSERVATORY REPORT // 11th Issue | November 2017
60
Figure 31: Total imports and exports from January to June, 2017
Total Imports and Exports for Half Year
USD
3500000000-
3000000000-
2500000000-
2000000000-
1500000000-
1000000000-
500000000-
0-
Exports Imports
JAN-JUN -17 JAN-JUN -17 JAN-JUN -16 JAN-JUN -16
Burundi 40,276,628 36,191,841 301,832 421,917
DRC 93,062,319 95,690,271 1,016,810 603,119
Rwanda 78,972,335 85,667,542 6,615,271 3,782,962
South Sudan 92,609,136 97,751,847 119,081 34,562
Uganda 303,816,177 308,458,247 150,393,013 77,610,885
6.4 Trade between Rwanda and Other NC Member States Table 39 shows the value of commodities exported and imported between Rwanda and other Northern Corridor Members States. Commodities mostly traded in included beverages and tobacco, crude materials, mineral fuels, lubricants, animals and vegetable oils, fats & waxes, chemicals, manufactured goods, machinery, and transport equipment. Top exports include Food and live animals, beverages and tobacco, Crude materials, except fuels.
FORMAL TRADE
Table 39: Summary of Formal Exports and Imports, January 2017 to September 2017 EXPORTS to:
EXPORTS (USD) BURUNDI DRC KENYA SOUTH SUDAN UGANDA
Jan -17 2,357,131 18,472,885 9,978,108 40,898 633,606
Feb -17 1,740,752 18,423,306 7,830,668 54,746 2,188,501
Mar -17 671,357 22,465,313 7,891,000 266,924 2,096,920
Apr -17 401,155 21,018,977 8,228,455 33,980 3,794,805
May -17 1,051,333 26,326,243 13,410,426 39,905 3,604,211
Jun -17 4,306,626 24,920,119 10,950,668 61,355 2,571,345
Jul -17 1,768,935 22,558,025 7,427,927 20,443 3,122,826
Aug -17 2,136,309 25,136,162 5,858,233 61,369 2,582,539
Sep -17 1,795,289 24,319,580 7,994,913 1,996,502 20,427
TOTAL 16,228,887 203,640,611 79,570,398 2,576,122 20,615,181

THE TRANSPORT OBSERVATORY REPORT // 11th Issue | November 2017
61
IMPORTS From:
IMPORTS (USD) BURUNDI DRC KENYA SOUTH SUDAN UGANDA
Jan -17 252,082 511,726 8,758,837 - 11,651,744
Feb -17 168,963 525,103 8,718,928 - 13,353,407
Mar -17 254,669 689,362 9,519,164 - 16,078,023
Apr -17 179,777 666,207 8,393,778 - 11,770,762
May -17 100,054 629,366 13,356,378 - 13,635,168
Jun -17 101,093 713,377 10,369,683 - 15,256,355
Jul -17 104,437 480,474 11,204,995 - 15,308,954
Aug -17 82,546 818,762 9,788,870 - 16,923,912
Sep -17 246,238 669,760 11,682,567 - 14,463,588
TOTAL 1,489,860 5,704,137 91,793,199 0 128,441,913
Balance of Trade 14,739,027 197,936,474 -12,222,801 2,576,122 -107,826,733
Source: National Bank of Rwanda
Between January and September 2017, the deficit in the balance of formal trade in goods was US$ 12.22 million and US$107.86 with Kenya and Uganda respectively. Comparing the performance with 2016, similar period, the value of domestic imports increased by 4 percent while exports decreased by 36.5 %.
Informal trade in Rwanda
The Average monthly cross border informal trade exports were about US$8.24 million while imports were approximately US$ 2 Million. The table below provides a summary from April to September 2017. 81.4 % of exports went to DRC while 65.2 % of imports were from Uganda. Uganda still remains the highest source of imports for Rwanda according to the data collected while DRC remained the greatest export destination for goods produced in Rwanda for the period of April to September 2017.

THE TRANSPORT OBSERVATORY REPORT // 11th Issue | November 2017
62
Table 40: Informal trade in Rwanda
EXPORTS to:
EXPORTS BURUNDI DRC UGANDA
Apr -17 336,759 6,339,711 1,669,398
May -17 430,040 6,015,774 1,415,445
Jun -17 362,407 6,769,464 936,761
Jul -17 339,905 6,835,369 1,138,858
Aug -17 336,460 6,743,840 786,075
Sep -17 331,459 7,559,662 1,090,909
TOTAL 2,137,030 40,263,820 7,037,446
IMPORTS from:
IMPORTS BURUNDI DRC UGANDA
Apr -17 324,876 396,524 1,090,641
May -17 415,256 480,021 1,202,551
Jun -17 292,778 325,249 1,198,852
Jul -17 365,782 276,018 1,227,947
Aug -17 322,379 273,756 1,349,848
Sep -17 382,771 288,536 1,706,628
TOTAL 2,103,842 2,040,103 7,776,468
Source: National bank of Rwanda
Figure 32: Percentage Share of Imports and Exports
EXPORTS EXPORTS EXPORTS
IMPORTS IMPORTS IMPORTS
BURUNDI
4%
18%
DRC
81%
17%
UGANDA
14%
65%
6.5 Trade between South Sudan and Other NC Member States Table 41 provides a summary of intra-regional trade between South Sudan, Uganda, Rwanda and Kenya. South Sudan is a net importer with a negative balance of trade with all the NC member states. This situation has been aggravated by the political instability that is often witnessed in the country making it impossible for the other NC member states to trade openly with the country. Removing Non-tariff barriers and enhancing

THE TRANSPORT OBSERVATORY REPORT // 11th Issue | November 2017
63
competitiveness coupled with political stability should spur growth and development.
Table 41: Summary of formal exports and imports, South Sudan in USD
EXPORTS KENYA RWANDA UGANDA
Jan -17 33,830 - 252,891
Feb -17 2,829 - 311,209
Mar -17 4,213 - 1,761,286
Apr -17 465 - 559,440
May -17 61,648 - 498,778
Jun -17 16,095 - 373,331
Jul -17 9,634 - 246,919
Aug -17 10,732 - 296,800
TOTAL 139,446 - 4,300,654
IMPORTS KENYA RWANDA UGANDA
Jan -17 16,180,674 40,898 27,369,894
Feb -17 11,527,183 54,746 30,465,836
Mar -17 17,497,329 266,924 34,495,065
Apr -17 14,608,953 33,980 35,012,055
May -17 13,242,439 39,905 27,250,615
Jun -17 19,552,556 61,355 19,882,897
Jul -17 16,844,930 20,443 20,379,674
Aug -17 7,172,253 61,369 36,260,916
TOTAL 116,626,319 579,620 231,116,953
Balance of Trade (116,486,873) (579,620) (226,816,298)
6.6 Trade between Uganda and Other Northern Corridor Member States
Uganda exports agricultural products mostly coffee while others include gold, oil re-exports, fish, metals, electricity, plastic products, cement etc. On average, the total amount in value per month for exports grew by 63% from US$ 37,602,604 to US$ 102,861,332 in the period between January and July 2017. Imports from the region declined from an average of US$ 79,686,729 to US$ 41,612,127 per month translating to a 48% decline over the same period.
Table 43 below provides a summary of formal intraregional trade volumes between Uganda and the other Northern Corridor Member States.
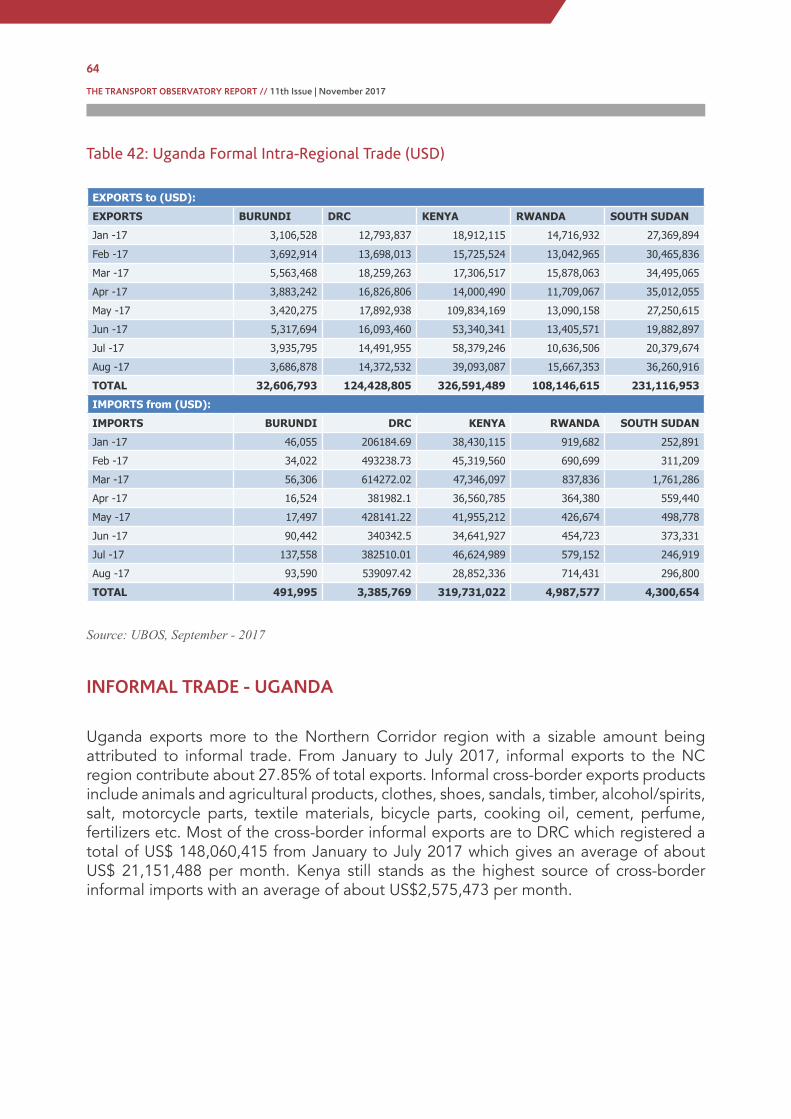
THE TRANSPORT OBSERVATORY REPORT // 11th Issue | November 2017
64
Table 42: Uganda Formal Intra-Regional Trade (USD)
EXPORTS to (USD):
EXPORTS BURUNDI DRC KENYA RWANDA SOUTH SUDAN
Jan -17 3,106,528 12,793,837 18,912,115 14,716,932 27,369,894
Feb -17 3,692,914 13,698,013 15,725,524 13,042,965 30,465,836
Mar -17 5,563,468 18,259,263 17,306,517 15,878,063 34,495,065
Apr -17 3,883,242 16,826,806 14,000,490 11,709,067 35,012,055
May -17 3,420,275 17,892,938 109,834,169 13,090,158 27,250,615
Jun -17 5,317,694 16,093,460 53,340,341 13,405,571 19,882,897
Jul -17 3,935,795 14,491,955 58,379,246 10,636,506 20,379,674
Aug -17 3,686,878 14,372,532 39,093,087 15,667,353 36,260,916
TOTAL 32,606,793 124,428,805 326,591,489 108,146,615 231,116,953
IMPORTS from (USD):
IMPORTS BURUNDI DRC KENYA RWANDA SOUTH SUDAN
Jan -17 46,055 206184.69 38,430,115 919,682 252,891
Feb -17 34,022 493238.73 45,319,560 690,699 311,209
Mar -17 56,306 614272.02 47,346,097 837,836 1,761,286
Apr -17 16,524 381982.1 36,560,785 364,380 559,440
May -17 17,497 428141.22 41,955,212 426,674 498,778
Jun -17 90,442 340342.5 34,641,927 454,723 373,331
Jul -17 137,558 382510.01 46,624,989 579,152 246,919
Aug -17 93,590 539097.42 28,852,336 714,431 296,800
TOTAL 491,995 3,385,769 319,731,022 4,987,577 4,300,654
Source: UBOS, September - 2017
INFORMAL TRADE - UGANDA
Uganda exports more to the Northern Corridor region with a sizable amount being attributed to informal trade. From January to July 2017, informal exports to the NC region contribute about 27.85% of total exports. Informal cross-border exports products include animals and agricultural products, clothes, shoes, sandals, timber, alcohol/spirits, salt, motorcycle parts, textile materials, bicycle parts, cooking oil, cement, perfume, fertilizers etc. Most of the cross-border informal exports are to DRC which registered a total of US$ 148,060,415 from January to July 2017 which gives an average of about US$ 21,151,488 per month. Kenya still stands as the highest source of cross-border informal imports with an average of about US$2,575,473 per month.
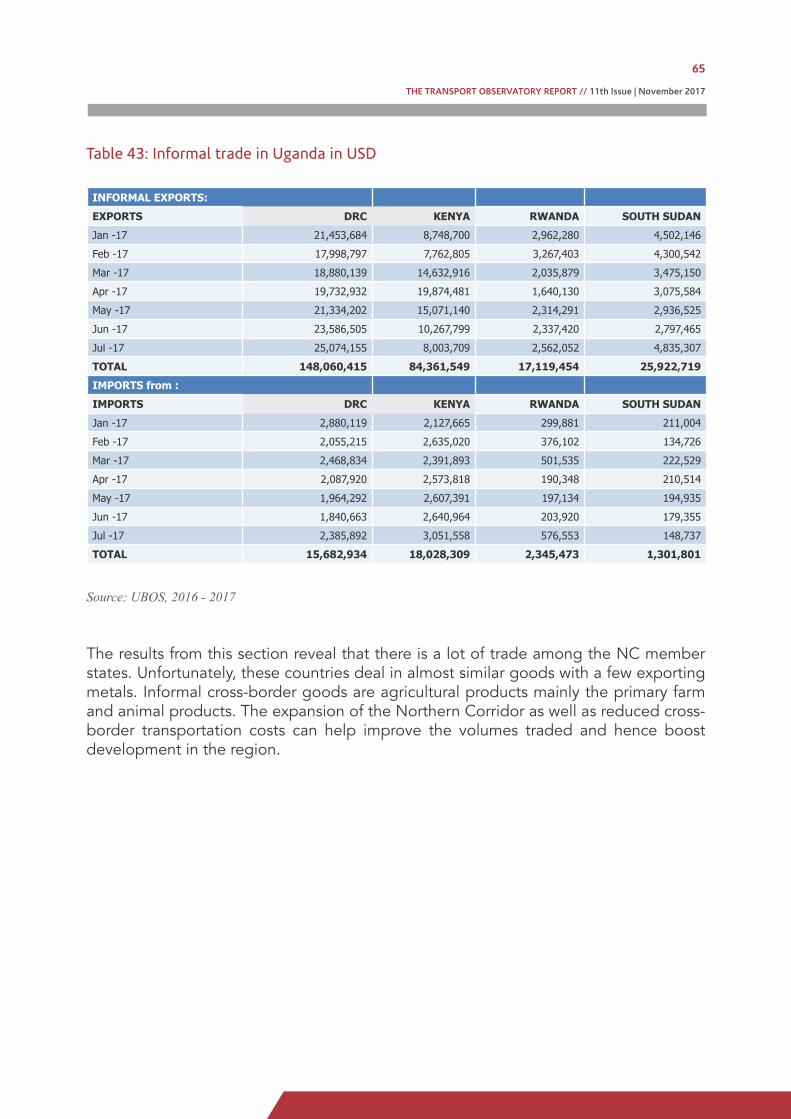
THE TRANSPORT OBSERVATORY REPORT // 11th Issue | November 2017
65
Table 43: Informal trade in Uganda in USD
INFORMAL EXPORTS:
EXPORTS DRC KENYA RWANDA SOUTH SUDAN
Jan -17 21,453,684 8,748,700 2,962,280 4,502,146
Feb -17 17,998,797 7,762,805 3,267,403 4,300,542
Mar -17 18,880,139 14,632,916 2,035,879 3,475,150
Apr -17 19,732,932 19,874,481 1,640,130 3,075,584
May -17 21,334,202 15,071,140 2,314,291 2,936,525
Jun -17 23,586,505 10,267,799 2,337,420 2,797,465
Jul -17 25,074,155 8,003,709 2,562,052 4,835,307
TOTAL 148,060,415 84,361,549 17,119,454 25,922,719
IMPORTS from :
IMPORTS DRC KENYA RWANDA SOUTH SUDAN
Jan -17 2,880,119 2,127,665 299,881 211,004
Feb -17 2,055,215 2,635,020 376,102 134,726
Mar -17 2,468,834 2,391,893 501,535 222,529
Apr -17 2,087,920 2,573,818 190,348 210,514
May -17 1,964,292 2,607,391 197,134 194,935
Jun -17 1,840,663 2,640,964 203,920 179,355
Jul -17 2,385,892 3,051,558 576,553 148,737
TOTAL 15,682,934 18,028,309 2,345,473 1,301,801
Source: UBOS, 2016 - 2017
The results from this section reveal that there is a lot of trade among the NC member states. Unfortunately, these countries deal in almost similar goods with a few exporting metals. Informal cross-border goods are agricultural products mainly the primary farm and animal products. The expansion of the Northern Corridor as well as reduced cross-border transportation costs can help improve the volumes traded and hence boost development in the region.
THE TRANSPORT OBSERVATORY REPORT // 11th Issue | November 2017
66
SECTION SEVEN:
FINDINGS FROM THE GPS AND ROAD SURVEY The NCTTCA Secretariat conducts road transport surveys to gather information relating to operations and efficiency of the transit route from transporters and truck drivers. Previously, data was collected using hardcopy questionnaires that were administered by the Northern Corridor field supervisor. The questions range from cargo origin and destination, vehicle registration and type, type of cargo, duration and reasons for stoppages. In addition, GPS Kits are provided to truck drivers when they are about to start their journey from Mombasa to different destinations and are collected on return. The system has had various challenges including loss of data. The Secretariat, therefore, piloted the use of mobile phones to determine the stop locations and the reasons 23 drivers participated in the pilot program that made a total of 102 trips both inbound and outbound i.e. from Mombasa to other destinations and back.

THE TRANSPORT OBSERVATORY REPORT // 11th Issue | November 2017
67
SECTION SEVEN:
FINDINGS FROM THE GPS AND ROAD SURVEY The NCTTCA Secretariat conducts road transport surveys to gather information relating to operations and efficiency of the transit route from transporters and truck drivers. Previously, data was collected using hardcopy questionnaires that were administered by the Northern Corridor field supervisor. The questions range from cargo origin and destination, vehicle registration and type, type of cargo, duration and reasons for stoppages. In addition, GPS Kits are provided to truck drivers when they are about to start their journey from Mombasa to different destinations and are collected on return. The system has had various challenges including loss of data. The Secretariat, therefore, piloted the use of mobile phones to determine the stop locations and the reasons 23 drivers participated in the pilot program that made a total of 102 trips both inbound and outbound i.e. from Mombasa to other destinations and back.
7.1 Stoppages for Cargo along the Northern Corridor Stoppages along the Corridor are major causes of inefficiency in the Corridor. Stoppages and other delays occasion high administrative and operation cost for moving goods along the Corridor and is a hindrance to trade in the region. The stoppages also lead to inefficient utilization of trucks. There are so many reasons for stoppages. The figure below gives a summary of stop reasons along the corridor. Out of a total of 841 stops, 34% were for rest/meals followed by 14% weighbridge stops and stops as a result of the road condition at 13%. Police checks, vehicle breakdowns, and company checkpoints contributed to the least stops at 2% each.
Figure 33: Prevalence of Stoppages
Stoppages
Police/Other Security Checks
Vehicle Breakdowns
Company Check Points
Personal Reasons
Fueling
Others
Border Post Procedures
Custom Checks
Road Condition
Weighbridges
Rest/Meals
|
0|
5|
10|
15|
20|
25|
30|
35|
40
%
Source: NCTTCA; Mobile phone pilot survey, 2017
Some of the other reasons for stops that drivers specified were mostly checking the vehicle, Car wash, checking clutch performance, checking tyres, pumping fuel from reserve tank to the main tank and tightening the cargo.

THE TRANSPORT OBSERVATORY REPORT // 11th Issue | November 2017
68
7.2 Duration for stops
Table 44: Duration for Stops
Stop Reason Median
Duration (hrs.)
Min duration (Hrs.)
Max duration
(Hrs.)
Border Post Procedures 6 0.22 124.97
Customs Checks 1.78 0.02 129
Others 1.79 0.2 116.55
Personal Reasons 0.82 0.03 73.12
Police/Other Security Checks 0.29 0.07 2
Rest/Meals 6.23 0.12 177.8
Road Condition 0.32 0.05 24
Vehicle Breakdowns 5.13 0.45 80.03
Weighbridges 0.3 0.02 120.77
Rest and meals take most of the time for stops along the corridor with a median of 6.23 hours. This is followed by border post procedures at 6 hours and vehicle breakdowns 5.13 hours. These many unnecessary stops translate into inefficiency due to delays that translate into the cost side of doing business within the Northern Corridor. The Northern Corridor Secretariat in conjunction with Member States in implementing the Roadside stations with amenities and wellness centres. This will ultimately reduce the delays along the corridor caused by unnecessary stops.
7.3 Fees Payment along the Northern Corridor Out of the 841 stops made, 237 involved some form of payment. The figure below gives incidents of payments along the Corridor. Parking fees form the largest component of the payments along the Corridor. Most of the parking (19%) occurred at Malaba border. The parking fee ranges between US$ 2.75 to US$5.50 at Malaba border.
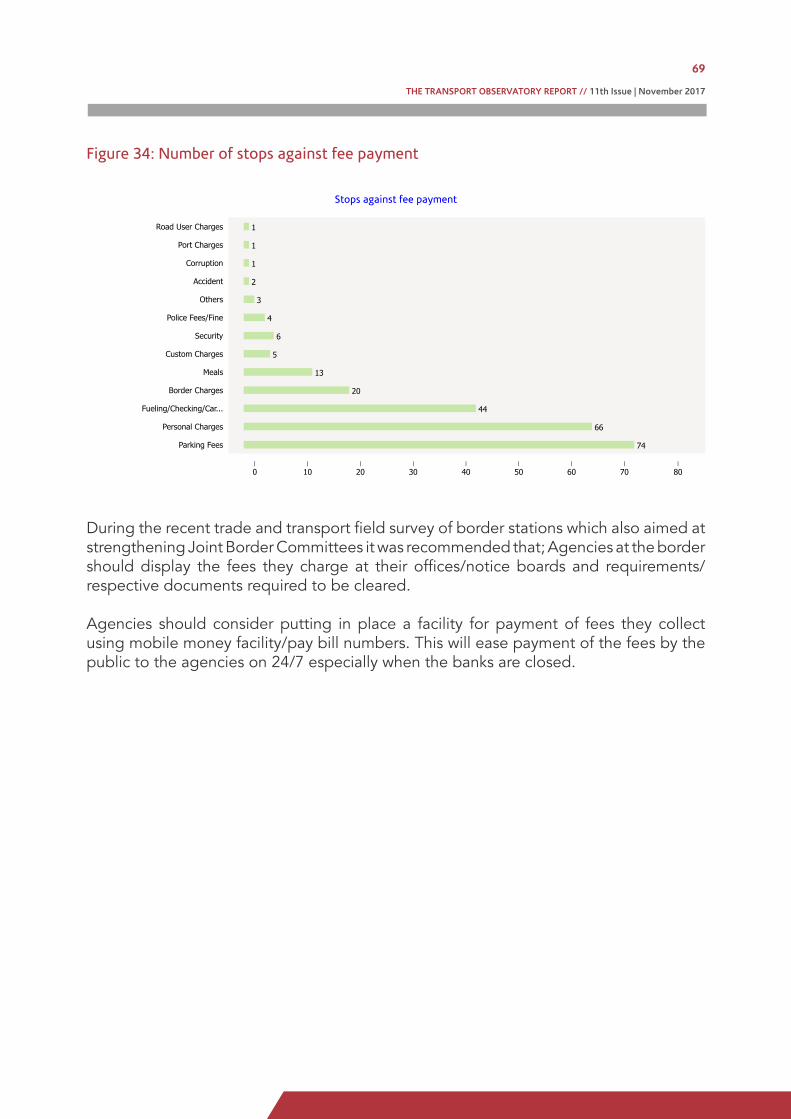
THE TRANSPORT OBSERVATORY REPORT // 11th Issue | November 2017
69
Figure 34: Number of stops against fee payment
Stops against fee payment
Road User Charges 1
Port Charges 1
Corruption 1
Accident 2
Others 3
Police Fees/Fine 4
Security 6
Custom Charges 5
Meals 13
Border Charges 20
Fueling/Checking/Car... 44
Personal Charges 66
Parking Fees 74
|
0|
10|
20|
30|
40|
50|
60|
70|
80
During the recent trade and transport field survey of border stations which also aimed at strengthening Joint Border Committees it was recommended that; Agencies at the border should display the fees they charge at their offices/notice boards and requirements/respective documents required to be cleared.
Agencies should consider putting in place a facility for payment of fees they collect using mobile money facility/pay bill numbers. This will ease payment of the fees by the public to the agencies on 24/7 especially when the banks are closed.
THE TRANSPORT OBSERVATORY REPORT // 11th Issue | November 2017
70
7.4 Monitoring One Stop Border Post
In 2016, the East African community enacted the East African Community One-Stop Border Posts Act. The objective of the Act is to provide for the establishment and implementation of One-Stop Border Posts in the community in order to facilitate trade through the efficient movement of goods and people.
To simplify and expedite border controls, Partner States are required to implement one border stop processing arrangements by establishing and designating control zones at their respective border posts. These control zones are supposed to be arranged so that, for each direction of travel, border controls shall be carried out in the State of arrival to reduce the number of stops by combining border control activities at a single location.
The Secretariat is now monitoring the implementation of One-Stop Border Post and their performance. These border posts are, Busia, Malaba, Gasenyi -Nemba, Ruhwa, Kanyaru-Akanyaru, Kagitumba-Mirama Hills, Gatuna-Katuna, Elegu, Katuna-Gatuna, Rubavu-Goma.
Most of the border posts are not fully developed while the rest are under construction. Busia, Malaba, Nemba-Gasenyi, Mirama hills are functioning. Elegu, Katuna-Gatuna, Rubavu-Goma are under construction. In September, the Secretariat visited the Malaba Border post and Elegu - Nimule border post to strengthen the joint border committees.
The sequence of events may differ from one border post to another but the general procedure is as follows:
1. The driver remits the documents to the agent.
2. The agent submits the declaration to customs with supporting documents.
3. Customs declaration process (Start time and end time).
4. Additional customs and other border agencies checks (Start Time and end time).
5. The release of the truck by the Customs once all formalities are completed.
The figure below gives the border crossing time at Malaba. The crossing time is given by Total Border time = Queuing + (Exit process + entry Process)
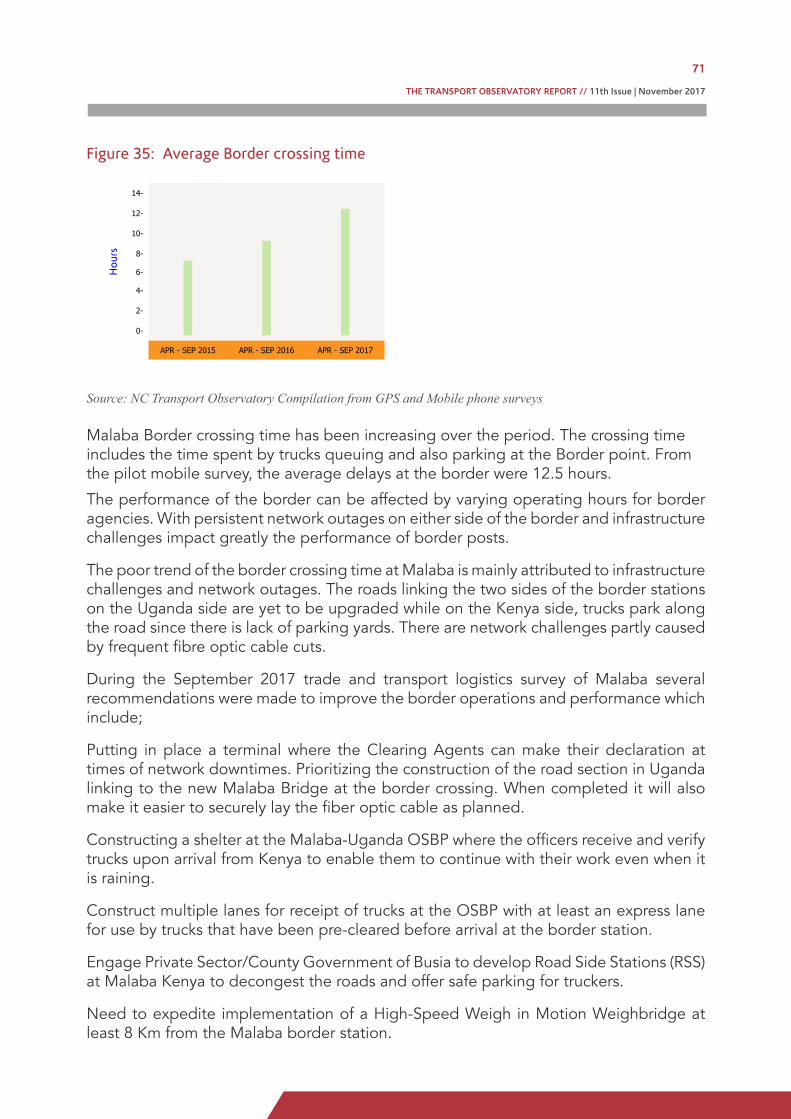
THE TRANSPORT OBSERVATORY REPORT // 11th Issue | November 2017
71
Figure 35: Average Border crossing time
Hou
rs
14-
12-
10-
8-
6-
4-
2-
0-
APR - SEP 2015 APR - SEP 2016 APR - SEP 2017
Source: NC Transport Observatory Compilation from GPS and Mobile phone surveys Malaba Border crossing time has been increasing over the period. The crossing time includes the time spent by trucks queuing and also parking at the Border point. From the pilot mobile survey, the average delays at the border were 12.5 hours.
The performance of the border can be affected by varying operating hours for border agencies. With persistent network outages on either side of the border and infrastructure challenges impact greatly the performance of border posts.
The poor trend of the border crossing time at Malaba is mainly attributed to infrastructure challenges and network outages. The roads linking the two sides of the border stations on the Uganda side are yet to be upgraded while on the Kenya side, trucks park along the road since there is lack of parking yards. There are network challenges partly caused by frequent fibre optic cable cuts.
During the September 2017 trade and transport logistics survey of Malaba several recommendations were made to improve the border operations and performance which include;
Putting in place a terminal where the Clearing Agents can make their declaration at times of network downtimes. Prioritizing the construction of the road section in Uganda linking to the new Malaba Bridge at the border crossing. When completed it will also make it easier to securely lay the fiber optic cable as planned.
Constructing a shelter at the Malaba-Uganda OSBP where the officers receive and verify trucks upon arrival from Kenya to enable them to continue with their work even when it is raining.
Construct multiple lanes for receipt of trucks at the OSBP with at least an express lane for use by trucks that have been pre-cleared before arrival at the border station.
Engage Private Sector/County Government of Busia to develop Road Side Stations (RSS) at Malaba Kenya to decongest the roads and offer safe parking for truckers.
Need to expedite implementation of a High-Speed Weigh in Motion Weighbridge at least 8 Km from the Malaba border station.

THE TRANSPORT OBSERVATORY REPORT // 11th Issue | November 2017
72
SECTION EIGHT:
ROAD SAFETY The Northern Corridor Secretariat in discharging its mandate is supposed to ensure expanded and modernized transport infrastructure and services as well as improvement in safety in all transport modes. The goal is to have a transportation system that is safe and secure. Some of the activities earmarked for the achievement of this goal on the road network include promoting voluntary compliance to vehicle load limits for all Member States, enhancing the functioning of Authorities responsible for transport safety in Northern Corridor Member States, developing data management system on safety and security in all transport modes. The secretariat is also advocating for the establishment of parking facilities with wellness centers.
Road accidents have adverse effects on the economic development of the NC region. These include loss of lives and goods that would have otherwise contributed GDP growth of the different NC countries. Other secondary effects include the amount of money spent by the victims in hospitals and the losses incurred by truck companies. The figure below shows fatalities along the Northern Corridor route in Kenya

THE TRANSPORT OBSERVATORY REPORT // 11th Issue | November 2017
73
SECTION EIGHT:
ROAD SAFETY The Northern Corridor Secretariat in discharging its mandate is supposed to ensure expanded and modernized transport infrastructure and services as well as improvement in safety in all transport modes. The goal is to have a transportation system that is safe and secure. Some of the activities earmarked for the achievement of this goal on the road network include promoting voluntary compliance to vehicle load limits for all Member States, enhancing the functioning of Authorities responsible for transport safety in Northern Corridor Member States, developing data management system on safety and security in all transport modes. The secretariat is also advocating for the establishment of parking facilities with wellness centers.
Road accidents have adverse effects on the economic development of the NC region. These include loss of lives and goods that would have otherwise contributed GDP growth of the different NC countries. Other secondary effects include the amount of money spent by the victims in hospitals and the losses incurred by truck companies. The figure below shows fatalities along the Northern Corridor route in Kenya
8.1 Fatalities based on Type of Vehicle
Figure 36 shows the distribution of fatalities based on the type of vehicles plying the Northern Corridor. Between April 2017 and September 2017, most of the fatalities were attributed to accidents caused by privately owned vehicles (30%) followed by Public Service vehicles (23%) and commercial vehicles (21%).
Comparing the period between October 2016 to March 2017 and the period April September 2017, fatalities from commercial vehicles reduced from 328 to 286 which is an average of 48 fatalities per month. Motorcycle fatalities reduced from 282 to 183 during the period.
Figure 36: Distribution of Fatalities based on Type of Vehicle
Apr17-Sep 17
Fata
litie
s
Tri Cycle 3 6
3%
Pedal Cycle 3 5
3%
Government 17 33
1%
Unknown (Hit & Run)
143 195
11%
Motor Cycle 183 252
14%
Commercial 286 328
21%
PSV 314 266
23%
Private 406 373
30%
Oct 2016 - Mar 2017 Apr 2017 - Sep 2017
Source: National Transport and Safety Authority
Table 45 shows the frequency of fatalities on different sections on the Northern Corridor in Kenya. 59.6 percent of all the repeat accidents happened on the following points: Mombasa - Nairobi had the highest frequency with most of the repeat accidents happening at Kambu, Mlolongo Area, Lukenya Area, Near Airport, Bridge 39 Area, Ndara Area, Near Standard Group,Small World, Kenani, Everest Area, Maanzoni Area, Near Green Park Area, Vista Area, Green Park Area, Emali Town, Holy Ghost High School, Konza City, Near Kiima Junction, Near River Side Hotel, Kima Junction, and Kyulu Area. Most of the Accidents near Gilgil and Nakuru occurred at Soysambu Area, Near Railway Fly Over, Kikopey Area, Mbaruk, Near State House, Kikopey, a climbing lane near St. Mary hospital.
Most of the accidents (20) happened at Soysambu.

THE TRANSPORT OBSERVATORY REPORT // 11th Issue | November 2017
74
Table 45: Fatalities on the Northern Corridor- October 2016- March 2017
ROAD/SECTIONS FATALITIES
Mombasa – Nairobi 129
Gilgil – Nakuru 29
Nakuru – Eldoret 19
Nairobi – Naivasha 18
Mombasa Road 16
Waiyaki Way 18
Nakuru – Nairobi 15
Bungoma – Malaba 6
Eldoret – Malaba 6
Eldoret – Nakuru 5
Uhuru Highway 3
Eldoret – Webuye 2
Gilgil – Naivasha 2
Source: National Transport and Safety Authority
Some of the causes for most of the accidents are not traced while some of the accidents are caused by losing control, overtaking at risky points on the highway such as corners, hills, failing to keep to near side or proper traffic lane, misjudging clearance and error of judgment as shown in the table below. Information provided by the NTSA shows that there are several factors that cause road accidents. Also, most of the accidents occur between 1700 Hrs and 2000 Hrs as a result of poor visibility and rush hour especially in cities along the Corridor.
Table 46: Causes of Accidents in Kenya along the Northern Corridor
Cause Percentage
Cause not traced 20%
Losing control 18%
Overtaking improperly 13%
Failing to keep to near side or proper traffic lane 7%
Misjudging clearance 6%
Excessive speed 6%
Walking or standing in road 4%
Crossing road not masked by stationary vehicle 4%
Error of judgement 3%
Swerving 2%
Tyres failure 2%
Other apparent error of judgement 2%
Source: National Transport and Safety Authority
The following table 47 gives the status of the Road safety as per the Uganda ministry of works and Transport annual performance report.

THE TRANSPORT OBSERVATORY REPORT // 11th Issue | November 2017
75
Table 47: Road fatalities in Uganda
Description June 2012 June 2013 June 2014 June 2015 June 2016 June 2017
Total fatalities (Road Deaths) 3,343 3,124 2,937 2,845 3,224 3,503
Fatalities per 10000 vehicles 45 36 30 26 26 26
Total Registered Vehicles 739,036 865,823 974,714 1,102,021 1,222,964 1,355,090
Source: Transport annual performance report.
Road safety policy that was approved in 2014 provided for the amendment of the road safety act to be more punitive on road offenders. Unfortunately, the number of fatalities has remained steady and has been increasing from 2014 to the time of reporting.
THE TRANSPORT OBSERVATORY REPORT // 11th Issue | November 2017
76
SECTION NINE:
GREEN FREIGHT PROGRAMThe NCTTCA is committed to address social and economic dimensions in the transport logistics chain including Environmental and Social Health issues. The NCTTCA Executive Committee in their 42nd sitting adopted the Northern Corridor Green Freight Program. The Program falls under Article (3d) of the Northern Corridor Transit and Transport Agreement which aims at ensuring environmental sustainability.
The Northern Corridor Green Freight Programme has been conceptualized to address environmental issues in transport logistics. This is in line with the global and continental initiatives such as the 2015 Paris Climate Agreement, Agenda 2063 of the African Union, and the 2030 Agenda for Sustainable Development Goals (SDGs).
THE TRANSPORT OBSERVATORY REPORT // 11th Issue | November 2017
77
SECTION NINE:
GREEN FREIGHT PROGRAMThe NCTTCA is committed to address social and economic dimensions in the transport logistics chain including Environmental and Social Health issues. The NCTTCA Executive Committee in their 42nd sitting adopted the Northern Corridor Green Freight Program. The Program falls under Article (3d) of the Northern Corridor Transit and Transport Agreement which aims at ensuring environmental sustainability.
The Northern Corridor Green Freight Programme has been conceptualized to address environmental issues in transport logistics. This is in line with the global and continental initiatives such as the 2015 Paris Climate Agreement, Agenda 2063 of the African Union, and the 2030 Agenda for Sustainable Development Goals (SDGs).
The Northern Corridor has developed the green freight program with the aim of reducing environmental and climate impact while increasing safety and efficiency. The ultimate goal is to reduce emissions by a) raising awareness of pollutant impacts and mitigation strategies such as improved quality of fuel, vehicles, and infrastructure. b) Advocating for the shift of traffic to more sustainable freight transport systems and modes. c) Streamlining transport activities by actions such as optimizing routes, consolidating loads and reducing empty runs. d) Identifying areas of action and overcoming barriers to enhancing capacity and mobilizing support. e) Improving scientific understanding of climate pollutant impacts and mitigation strategies and promoting best practices and showcasing successful efforts. It is worth noting that most of the Northern Corridor Member States recently adopted low sulphur fuels (50 pm diesel standards). Member states have also adopted the program with the Republic of Uganda in the process of reviewing the National Transport Policy and Strategy to incorporate green logistics. The objective is to improve efficiency and safety of transport in order to facilitate economic and social development, through creation and maintenance of an integrated and sustainable Transport system.
The Northern Corridor secretariat in the Green freight program with support from UNEP and in partnership with KPA and KMA undertook an Emissions Baseline Inventory for the Port of Mombasa. The main objective of the baseline was to quantify emissions from operations at the port of Mombasa as a baseline for mitigation and drafting an Action Plan to reduce Particulate Matter and |Black Carbon emissions from the Port. Data collection and meetings with key stakeholders took place between April and June 2017.
9.1 Port Emissions
The Baseline Emissions Inventory (BEI) focused on the estimation of the magnitude of emissions from the various sources, linked to emissions from the port.
Pollutants attributed to fuel combustion such as sulphur dioxide (SO2), particulate matter, and oxides of nitrogen (NOX), were investigated.
Total emissions at the Port were estimated through emissions factors from the following sources: -Emissions from the ship on manoeuvring, Emission by the ship at the port and on anchorage, Emissions by equipment at the port of Mombasa, Vehicles and trucks accessing the port of Mombasa, Rail locomotives accessing the port of Mombasa, Electricity usage at the port of Mombasa,
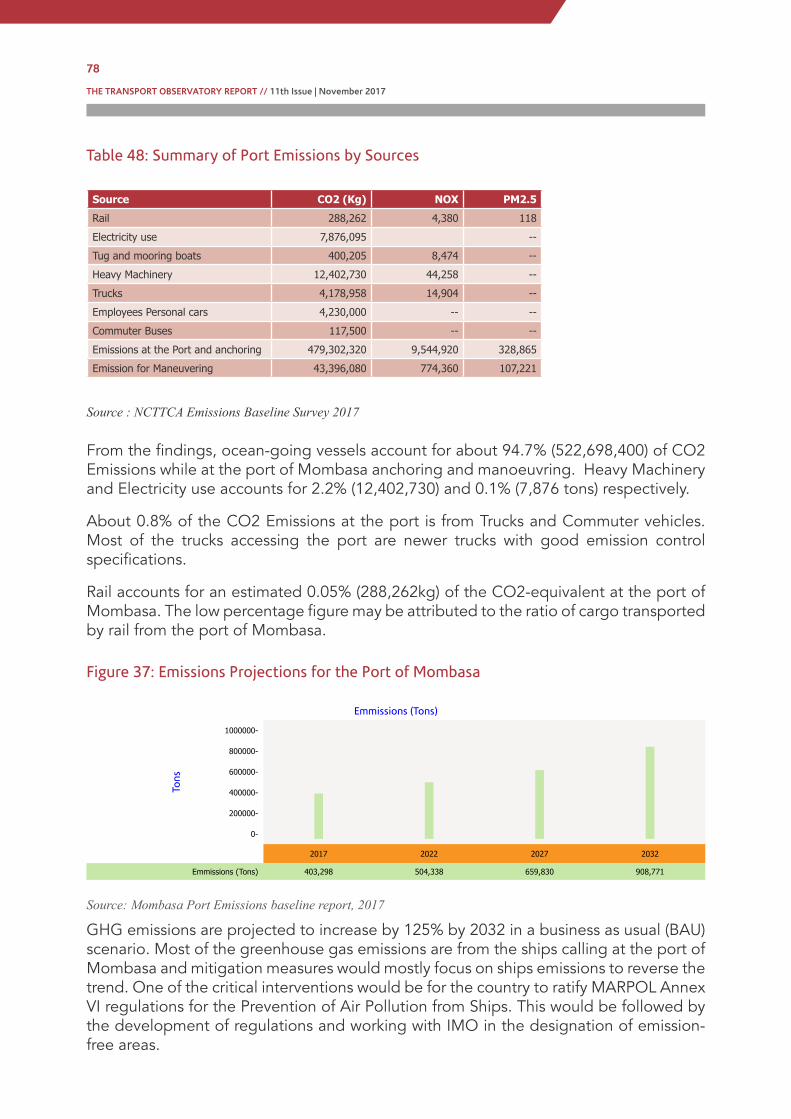
THE TRANSPORT OBSERVATORY REPORT // 11th Issue | November 2017
78
Table 48: Summary of Port Emissions by Sources
Source CO2 (Kg) NOX PM2.5
Rail 288,262 4,380 118
Electricity use 7,876,095 --
Tug and mooring boats 400,205 8,474 --
Heavy Machinery 12,402,730 44,258 --
Trucks 4,178,958 14,904 --
Employees Personal cars 4,230,000 -- --
Commuter Buses 117,500 -- --
Emissions at the Port and anchoring 479,302,320 9,544,920 328,865
Emission for Maneuvering 43,396,080 774,360 107,221
Source : NCTTCA Emissions Baseline Survey 2017
From the findings, ocean-going vessels account for about 94.7% (522,698,400) of CO2 Emissions while at the port of Mombasa anchoring and manoeuvring. Heavy Machinery and Electricity use accounts for 2.2% (12,402,730) and 0.1% (7,876 tons) respectively.
About 0.8% of the CO2 Emissions at the port is from Trucks and Commuter vehicles. Most of the trucks accessing the port are newer trucks with good emission control specifications.
Rail accounts for an estimated 0.05% (288,262kg) of the CO2-equivalent at the port of Mombasa. The low percentage figure may be attributed to the ratio of cargo transported by rail from the port of Mombasa.
Figure 37: Emissions Projections for the Port of Mombasa
Emmissions (Tons)
Tons
1000000-
800000-
600000-
400000-
200000-
0-
2017 2022 2027 2032
Emmissions (Tons) 403,298 504,338 659,830 908,771
Source: Mombasa Port Emissions baseline report, 2017
GHG emissions are projected to increase by 125% by 2032 in a business as usual (BAU) scenario. Most of the greenhouse gas emissions are from the ships calling at the port of Mombasa and mitigation measures would mostly focus on ships emissions to reverse the trend. One of the critical interventions would be for the country to ratify MARPOL Annex VI regulations for the Prevention of Air Pollution from Ships. This would be followed by the development of regulations and working with IMO in the designation of emission-free areas.
SECTION TEN:
SUMMARY OF FINDINGS AND RECOMMENDATIONS
10.1 Summary
The report established several improvements and changes in the year 2017 from a number of indicators. Firstly, it was noted that the port of Mombasa handled more cargo in 2017 (January to September) reflecting a 13% (1,442,829) growth in the total volume of cargo compared to 2016. Additionally, the inclusion of the Standard Gauge Railway boosted the transport network along the Northern Corridor even though it is only the first phase from Mombasa to Nairobi that is complete.
A comparison was made between the performance of the port of Mombasa and the port of Dar-es-salaam. The port of Mombasa cargo dwell time averaged between 2.9 and 4.5 days between January and September, which is a better performance than the global average of between 4 to5 days
The port of Mombasa is performing better than Dar es Salaam in terms of the Port dwell time. In August, 2017, Mombasa port registered an average of 4.5 days while Dar es Salaam recorded 8.9 days.
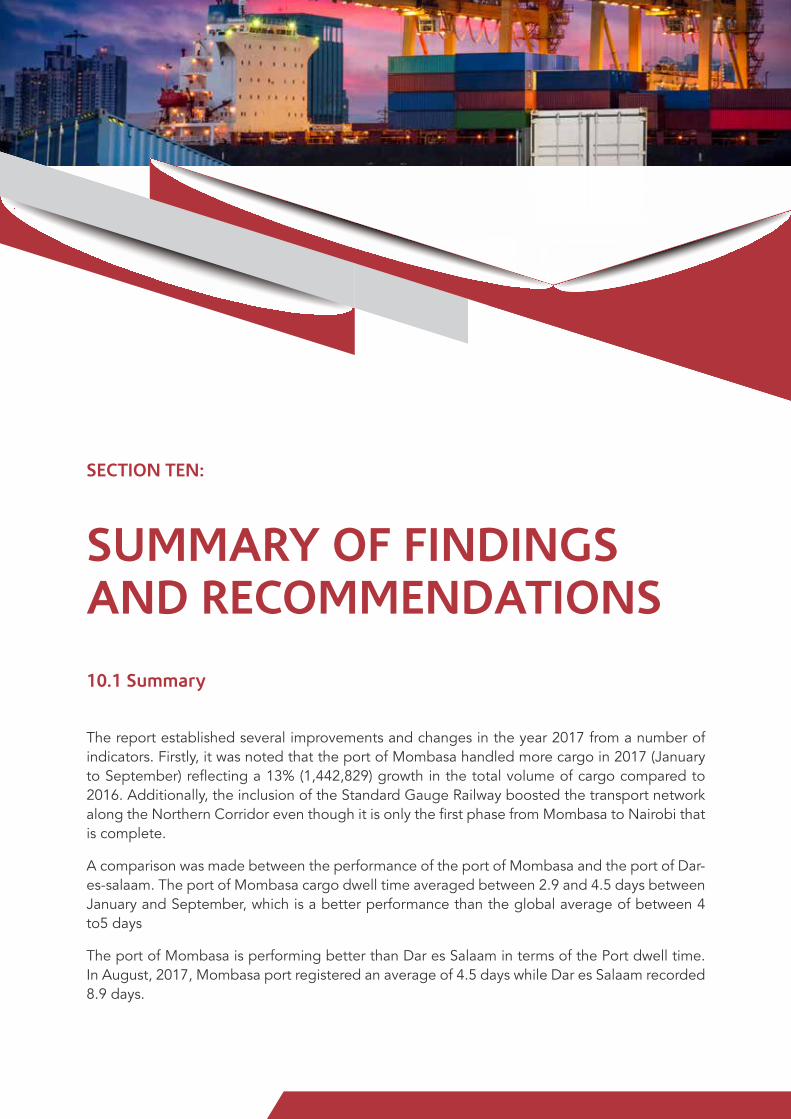
THE TRANSPORT OBSERVATORY REPORT // 11th Issue | November 2017
79
SECTION TEN:
SUMMARY OF FINDINGS AND RECOMMENDATIONS
10.1 Summary
The report established several improvements and changes in the year 2017 from a number of indicators. Firstly, it was noted that the port of Mombasa handled more cargo in 2017 (January to September) reflecting a 13% (1,442,829) growth in the total volume of cargo compared to 2016. Additionally, the inclusion of the Standard Gauge Railway boosted the transport network along the Northern Corridor even though it is only the first phase from Mombasa to Nairobi that is complete.
A comparison was made between the performance of the port of Mombasa and the port of Dar-es-salaam. The port of Mombasa cargo dwell time averaged between 2.9 and 4.5 days between January and September, which is a better performance than the global average of between 4 to5 days
The port of Mombasa is performing better than Dar es Salaam in terms of the Port dwell time. In August, 2017, Mombasa port registered an average of 4.5 days while Dar es Salaam recorded 8.9 days.
THE TRANSPORT OBSERVATORY REPORT // 11th Issue | November 2017
80
The road freight charges are still high at approximately US$2.23 per Km for containerized cargo between Mombasa and Kigali. Mombasa to Kampala is 1.79 US$ per container per kilometre while Mombasa to Bujumbura recorded US$3.07 per container per kilometre. Also, different countries charge different freight charges even though there are common rates established for Transport. Transport rates from Bujumbura are charged per ton with rates ranging from 0.07 USD per ton per kilometre to 0.15 USD per ton per kilometre. The table below gives the summary from the most expensive to the least expensive route per container.
Table 49: Summary of Transport Tariffs
From To Distance(Km) Average cost per Km/Container
Kigali Bujumbura 275 6.55
Kigali Juba 1,166 6.43
Kigali Goma 156 6.41
Juba Goma 1322 5.3
Kampala Goma 669 5.23
Juba Nairobi 1145 4.37
Juba Kampala 653 3.83
Kampala Bujumbura 788 3.81
Juba Kigali 1,166 3.43
Juba Mombasa 1,662 3.31
Mombasa Goma 1840 3.13
Kigali Kampala 513 3.12
Juba Bujumbura 1441 3.12
Kampala Kigali 513 3.12
Mombasa Bujumbura 1,957 3.07
Kampala Juba 653 3.06
Mombasa Juba 1,662 3.01
Nairobi Kampala 688 2.62
Nairobi Kigali 1,201 2.5
Mombasa Kigali 1,682 2.23
Mombasa Kampala 1,170 1.79
Kigali Mombasa 1,682 1.78
Goma Kampala 669 1.67
Kigali Nairobi 1,201 1.67
Mombasa Nairobi 481 1.62
Kampala Nairobi 688 1.31
Goma Nairobi 1,357 1.24
Nairobi Mombasa 481 1.01
Goma Mombasa 1,840 0.99
Kampala Mombasa 1,169 0.77
The distance and the volumes of traffic have an impact on the rates of transport. For the case of distance the average fixed costs are higher for shorter distances like the case for Kigali to Bujumbura/Goma. On the other hand were supply of trucks is high as well as the volumes of cargo transported between a particular road section competition drives the transport rates down such as the transport rates for Mombasa to Nairobi. Other

THE TRANSPORT OBSERVATORY REPORT // 11th Issue | November 2017
81
factors that affect the rates are transport infrastructure, security and opportunity for a transporter to get return cargo.
The measures being implemented at the port of Mombasa have seen an improvement in the ship turnaround time. Within the year, there were three months when the port was able to meet the targeted 72 hours (3 days). However, it was noted that there are several factors that affect the turnaround time of trucks which include the movement of the cargo along the Northern Corridor. Poor infrastructure, delays at the weighbridges and non-compliance to weight limits by truck drivers and companies affected productivity and efficiency along the Northern Corridor. Countries served by the Northern Corridor have embarked on improving the nodes connecting to the Corridor so that they can improve the rate at which cargo moves. Kenya for instance, has continued to upgrade its transit routes such as the Kisumu- Busia route and the Namanga route. The Taita Taveta route through Tanzania is also in good condition and offers a shorter and alternative route to Bujumbura from Mombasa.
Despite the many challenges that are experienced by Northern Corridor transporters, intra-regional trade has continued to grow with Kenya, Uganda, Rwanda, Burundi, and DRC posting a positive deviation in their GDP. The trends indicate that traded volume among the NC countries increased in the period January to September 2017.
The indicators on transit time and delays have been featured at length given that delays along the Corridor is one of the factors contribute to high logistics costs. For instance, border crossing inefficiencies are a critical issue for this Corridor. Delays at Malaba border registered a median of 6 hours for clearing processes. Transit times have significantly reduced to all destinations with Mombasa to Malaba registering an average of 3.7 days against a target of 5 days. The figure below gives the summary of transit time from RECTS
Table 50: Summary of Transit time
Route Distance(Km) Average Duration(days)
Mombasa-Busia 947 3.5
Mombasa - Kampala via Malaba 1,170 4.5
Mombasa-Elegu via Busia & Kampala 1,471 4.4
Mombasa-Elegu via Malaba & Kamdini 1430 4.1
Mombasa-Kampala via Busia 1145 4.1
Mombasa-Kampala via Malaba 1,169 4.3
Mombasa-Malaba 933 3.7
Mombasa –Kigali 1,682 7.3
*Mombasa-Juba 1662 10.4
*Mombasa -Goma 1838 6.24
A new initiative that is being pursued by the NCTTCA was the green freight program which aimed at improving the environmental status of the transport system. Pollution begins at the port of Mombasa and it goes on along the highway by the trucks used to
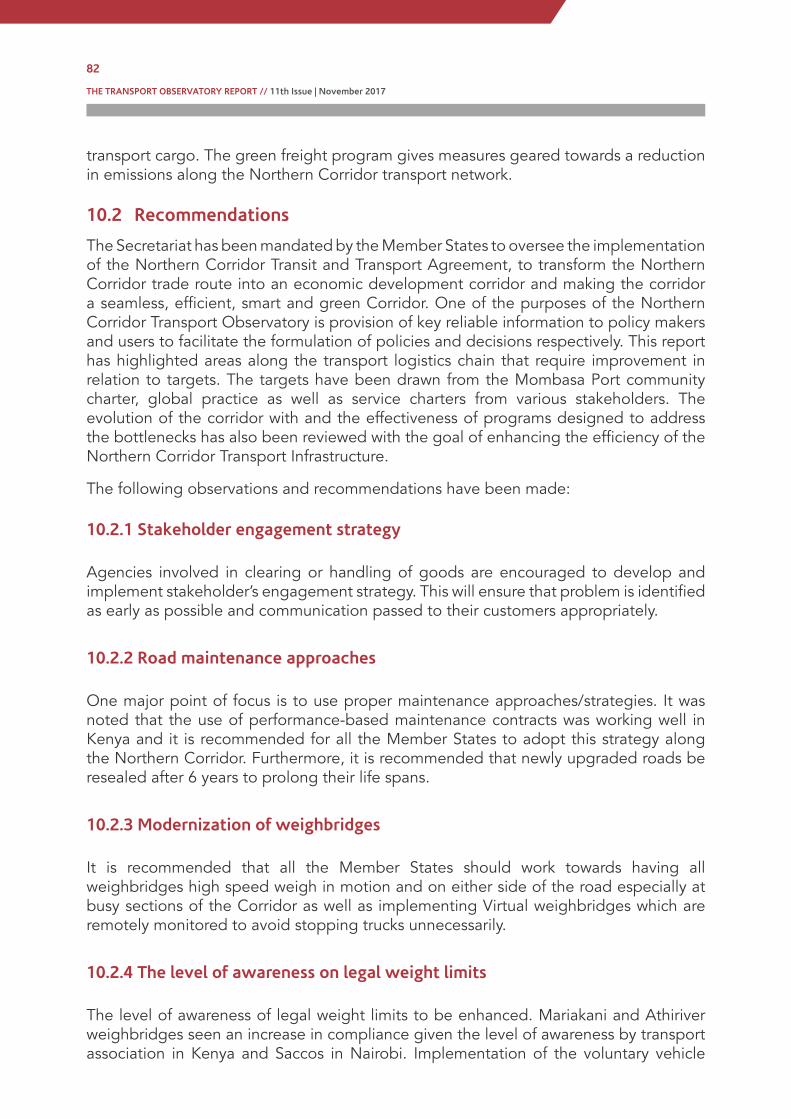
THE TRANSPORT OBSERVATORY REPORT // 11th Issue | November 2017
82
transport cargo. The green freight program gives measures geared towards a reduction in emissions along the Northern Corridor transport network.
10.2 Recommendations
The Secretariat has been mandated by the Member States to oversee the implementation of the Northern Corridor Transit and Transport Agreement, to transform the Northern Corridor trade route into an economic development corridor and making the corridor a seamless, efficient, smart and green Corridor. One of the purposes of the Northern Corridor Transport Observatory is provision of key reliable information to policy makers and users to facilitate the formulation of policies and decisions respectively. This report has highlighted areas along the transport logistics chain that require improvement in relation to targets. The targets have been drawn from the Mombasa Port community charter, global practice as well as service charters from various stakeholders. The evolution of the corridor with and the effectiveness of programs designed to address the bottlenecks has also been reviewed with the goal of enhancing the efficiency of the Northern Corridor Transport Infrastructure.
The following observations and recommendations have been made:
10.2.1 Stakeholder engagement strategy Agencies involved in clearing or handling of goods are encouraged to develop and implement stakeholder’s engagement strategy. This will ensure that problem is identified as early as possible and communication passed to their customers appropriately.
10.2.2 Road maintenance approaches One major point of focus is to use proper maintenance approaches/strategies. It was noted that the use of performance-based maintenance contracts was working well in Kenya and it is recommended for all the Member States to adopt this strategy along the Northern Corridor. Furthermore, it is recommended that newly upgraded roads be resealed after 6 years to prolong their life spans.
10.2.3 Modernization of weighbridges It is recommended that all the Member States should work towards having all weighbridges high speed weigh in motion and on either side of the road especially at busy sections of the Corridor as well as implementing Virtual weighbridges which are remotely monitored to avoid stopping trucks unnecessarily.
10.2.4 The level of awareness on legal weight limits The level of awareness of legal weight limits to be enhanced. Mariakani and Athiriver weighbridges seen an increase in compliance given the level of awareness by transport association in Kenya and Saccos in Nairobi. Implementation of the voluntary vehicle
THE TRANSPORT OBSERVATORY REPORT // 11th Issue | November 2017
83
load control charter should be fast-tracked and awareness campaigns extended along the Corridor to cover all the Member States.
10.2.5 Enhancing intermodal transport The pipeline transportation policy which was lifted sometimes back so the decline in the offtake of fuel by the pipeline. This coupled with constraints on the lines as well as ullage issue where only big players are allocated quotas locking out smaller oil marketers have seen most business taken by the tracking companies. This has posed safety issues and congestions along the Northern Corridor.
Stakeholders should be sensitized on the operations of the SGR and the procedures for handling and clearance of cargo by the SGR for transhipment in Nairobi to support smooth intermodal transport interchange. Integration of the SGR and the Meter Gauge railway to provide seamless transportation and connections beyond Nairobi.
Piggyback wagons should be included on the rolling stock for the SGR to enhance intermodal transport of goods and enhance further efficient utilization of the SGR in transportation of cargo and empty containers/trucks along the corridor.
10.2.6 Enhancing road safety Development of harmonized road safety strategy in the region- this should also involve the development of road crash database. Need for sharing of experience across the agencies involved in road safety matters. Roll out the driver training program and sensitization to reduce accidents along the corridor.
10.2.7 Border delays Only goods under Single Customs Territory cross the borders faster. Clearance procedures for other goods are still taking longer. To enhance quick response towards addressing operational challenges at the border stations, the NCTTCA Secretariat should support the Member States in the formation of Cross Joint Border Committees at the key border stations where they do not exist.
It is recommended that efforts should be made to explore opening another border station between Uganda and Kenya preferably located between Busia and shores of Lake Victoria to ease flow of goods between the two countries. The capacity of Malaba and Busia border station which handle goods heading towards the transit route through Kampala is becoming over stretched. Furthermore, there is need to upgrade the border stations of Lwakhakha, Suam River and Amudat and the road networl leading to these border stations.
Regional Customs Transit Bond should be used for all goods whose taxes are not paid to minimize fresh declarations and bonding of goods at border stations which contributes greatly to the border crossing time and delays. Furthermore, Member States should recognize the RCTG bond executed by forwarders in the other Member States. n

THE TRANSPORT OBSERVATORY REPORT // 11th Issue | November 2017
84
10.2.8 Road Side Stations Fast-tracking implementation of the roadside stations with amenities would minimize unnecessary multiple stops. It will also reduce the driver fatigue which is also a major course of accidents along the corridor.
10.2.9 Emissions at the Port
Based on the report of the Emissions Inventory Baseline for the port of Mombasa, the action plan for the mitigation measures implemented. The following are the proposed action areas:
a) Installation of shore power sources to enables vessels to turn off engines while docked and connect to shore Electricity sources – cold ironing.
b) Advocacy for cleaner alternative fuels that meet or exceed Emissions Control Area requirements set by the Port.
c) Regulating of Vessels Speed Reduction (VSR) close to the port of Mombasa to reduce the intensity of emissions.
d) Initiatives establishing incentives targeting the vessels/ships that meet the required standards.
e) Establishing an efficient emissions data management system and database for the port of Mombasa.
f) Advocacy for the use of alternative cleaner fuels for heavy machines used in operations at the port of Mombasa.
g) Shifting from the excessive use of diesel operated machines to electric machines to cut down on emissions.
h) Developing an inventory of all Heavy-Duty Diesel Operated machines and devise measures to minimize the use of aged machinery in operations.
i) Coordination with key stakeholders and relevant departments to identify and explore potential emission reduction projects and seek funding supports.
j) Reviewing the baseline emission inventory, identify specific activities and sources; and investigate further the emissions reduction targets for the port of Mombasa.
k) Enforcing Green Driving at the port of Mombasa through efficiency campaign focused on truck driving habits and operations. Green Driving enforced at the port of Mombasa through efficiency campaign.
l) Cutting down trucks congestions at the Port reducing turn/wait times within and at the entry points at the port of Mombasa.
m) Taking administrative measures to reduce idling by Trucks accessing the Port to pick cargo. Administrative measures are taken to reduce idling by Trucks accessing the Port to pick cargo.

THE TRANSPORT OBSERVATORY REPORT // 11th Issue | November 2017
85
n) Requesting from KTA and other logistics sectors list of truck operators in their drayage Truck Registry that accesses the Port of Mombasa for emissions related data updates. List of truck operators in their drayage Truck Registry that accesses the Port of Mombasa updated.
o) Improving on the current rail Infrastructure to ensure latest clean technologies and operations are utilized at the Port of Mombasa.
p) Enforcing regulations to reduce locomotive idling at the Port to cut down on unnecessary emissions while picking cargo.
q) Transitioning locomotive engines to the latest technology, such as hybrids with electric options and capabilities.
r) Establishing a program for reducing emissions through shipper, logistics, and carrier participation.
s) Developing a comprehensive Clean Air Strategy with public support and data-driven to reduce multi-sector emissions at the port of Mombasa with clearly set performance targets. Engaging the Port Community to constitute a formalized path for community dialogue and engagement for tackling emissions issues at the port of Mombasa.

THE TRANSPORT OBSERVATORY REPORT // 11th Issue | November 2017
86
ANNEXES
THE TRANSPORT OBSERVATORY REPORT // 11th Issue | November 2017
87
ANNEXES
ANNEXE I: Survey Questionnaire
THE NORTHERN CORRIDOR TRANSIT AND TRANSPORT COORDINATION AUTHORITY
ROAD SURVEYGPS DATA COLLECTION FORM
(INBOUND/OUTBOUND)
CODE DESTINATION
DATE ISSUED

THE TRANSPORT OBSERVATORY REPORT // 11th Issue | November 2017
88
WHAT IS THE NCTTCA?
The Northern Corridor comprises of the transport infrastructure, facilities and services in East and Central Africa linked to the Maritime Port of Mombasa. These primary transport network and facilities link the Port of Mombasa in Kenya to the Great Lakes countries of Uganda, Rwanda, Burundi and the Democratic Republic of Congo.
The five countries are signatories to the Northern Corridor Transit Agreement (NCTA), whose main objective is to enhance and ensure seamless movement of trade and traffic across the region. The Transit Transport Coordination Authority of the Northern Corridor (NCTTCA), whose Secretariat is based in Mombasa, Kenya, was established to oversee the implementation of the NCTA provisions and to safeguard the interests of the member States and corridor users.
The programmes and activities of the NCTTCA includes encouraging cost effective services by the major transport service providers through private investments, monitoring inefficiencies along the Northern Corridor and providing policy guidelines to improve the same, provide an efficient mechanism for exchanging information and monitoring the performance of the corridor as well as monitoring regional transport and trade Implementation Projects.
ABOUT THE TRANSPORT OBSERVATORY PROJECT
The NCTTCA Transport Observatory seeks to establish a practical method of monitoring transit traffic by using existing computerized data and by undertaking surveys of this kind from time to time to validate the findings and the indicators yielded from the computerized data.
The scope of work includes identifying total time delays from all causes and time delays disaggregated by cause, location, date, and time of day, to define parameters and reports to capture direction of travel, “nationality” of vehicle, and type of cargo and to setup a database for analysing and disseminating this information.
WHAT ARE THE OBJECTIVES OF THE ROAD SURVEY?
The objective is to collect enough data and information to identify the route causes of delays for transit traffic on the Northern Corridor and also to understand the associated costs. This will enable the NCTTCA to develop indicators to monitor the performance of the Corridor and to analyze the effects of the implementation of various policies of the NCTTCA member states with a view of providing guidance and recommendation for improvement of the same.

THE TRANSPORT OBSERVATORY REPORT // 11th Issue | November 2017
89
I. DRIVER DETAILS (Optional)
1. Driver’s Details. . . . . . . . . . . . . . . . . . . . . . . . . . . . . . . . . . . . . . . . . . . . . Age. . . . . . . . . . . . . . . . . . . . . .
II. VEHICLE DETAILS
1. Vehicle Registration Number (Prime mover) . . . . . . . . . . . . . . . . . . . . . . . . . . . . . . . . . . . . . . . . . . . . . . 2. Vehicle Registration Number (Trailer(s) end) . . . . . . . . . . . . . . . . . . . . . . . . . . . . . . . . . . . . . . . . . . . . . 5. Country of Registration: …………………..………………………………………………….
6. Vehicle Type (tick one below):
[ ] Truck-Trailer [ ] Semi-Trailer [ ] Rigid Truck
7. Vehicle Make: ……………………………………. …………………………………………..
8. Vehicle Model: ………………………...............................................................................
9. No. of Axles on Vehicle (tick one below):
[ ] 2 axles [ ] 3 axles [ ] 4 axles [ ] 5 axles [ ] 6 axles [ ] 7 axles
III. CARGO LOADING DETAILS
LOADING LOCATION ...........................................................................
1. Loading Permit Received on Date (dd/mm/yyyy) . . . . . . . . . . . . . . . . . . Time(hh:mm). . . . . . . . . . . . . 2. Loading Date (dd/mm/yyyy) . . . . . . . . . . . . . . . . . . . . . . . . . . . . . . . . . . . Time(hh:mm). . . . . . . . . . . . .

THE TRANSPORT OBSERVATORY REPORT // 11th Issue | November 2017
90
IV. CARGO DETAILS
1. Cargo Form (tick one below)[ ] Container [ ] Loose Cargo [ ] Tanker2. Weight of goods carried. . . . . . . . . . . . . . . . . . . . . . . . . . . . . . . . . . . . . . . . . . . . . . . . . . . . . . . . . . . . . . . 3. Container Numbers. . . . . . . . . . . . . . . . . . . . . . . . . . . . . . . . . . . . . . . . . . . . . . . . . . . . . . . . . . . . . . . . . . . 4. Kind of goods carried (please tick appropriate ones from the table below):
[ ] Tea
[ ] Coffee
[ ] Hides and Skins
[ ] Tobacco Leaf
[ ] Beans and other Legumes
[ ] Fish
[ ] Sesame
[ ] Cocoa
[ ] Pepper
[ ] Vanilla
[ ] Fruits
[ ] Live animals
[ ] Ground/Cashew Nuts
[ ] Timber
[ ] Minerals
[ ] Cotton
[ ] Grains (Maize, Rice, Wheat, etc.)
[ ] Sugar
[ ] Tyres & Tubes
[ ] Vehicle Spares
[ ] Electronics
[ ] Cigarettes
[ ] Used Clothes
[ ] Cooking Oil
[ ] Cosmetics
[ ] Building materials
[ ] Machinery
[ ] Motor Vehicles
[ ] Footwear
[ ] Flour
[ ] Pulp and Paper
[ ] Books and other printed materials
[ ] Iron and Steel
[ ] Medical and Pharmaceutical products
[ ] Petroleum Products and related materials
[ ] Dry Cells
[ ] Foodstuff and Beverages
[ ] Utensils
[ ] Fabrics and Garments
[ ] Personal and Household Items
[ ] Safety Matches
[ ] Others (SPECIFY)............................

THE TRANSPORT OBSERVATORY REPORT // 11th Issue | November 2017
91
V. OUTBOUND (LEAVING MOMBASA)
1. Departure Date (dd/mm/yyyy) . . . . . . . . . . . . . . . . . . . . . Time . . . . . . . . . . . . . . . . . . . . 2. Arrival at Destination Date (dd/mm/yyyy)............................Time......................................
STOP NO.
DATE (dd/mm/yyyy)
STOP LOCATION STOP DETAILS
FEES/ PAYMENT S MADE
Name of place Stop reason code
Fee amount
Specify currency e.g
Kshs, Ushs, US D, RWF
Service fees paid for code
1
2
3
4
5
6
7
8
9
10
11
12
13
14
15
STOP REASON CODESD01 Police/other security checksD02 Customs checksD03 WeighbridgesD04 Road ConditionD05 Company check pointsD06 Border Post ProceduresD07 InsecurityD08 Personal ReasonsD09 Vehicle BreakdownsD10 Inland Terminal Procedures andD11 Rest /mealsD12 Others
SERVICE FEES PAID FOR CODESS01 Police Fees / FineS02 Customs chargesS03 Weighbridge chargesS04 Port chargesS05 Border chargesS06 Repair chargesS07 Personal chargesS08 Vehicle BreakdownsS09 Other charges (Specify)

THE TRANSPORT OBSERVATORY REPORT // 11th Issue | November 2017
92
V. OUT BOUND CONTINUED.......
STOP NO.
DATE (dd/mm/yyyy)
STOP LOCATION STOP DETAILS FEES/ PAYMENT S MADE
Name of place Stop reason code Fee amount
(Specify currency e.g Kshs, Ushs,
US D, RWF)
Service fees paid for code
16
17
18
19
20
21
22
23
24
25
26
27
28
29
30
STOP REASON CODESD01 Police/other security checksD02 Customs checksD03 WeighbridgesD04 Road ConditionD05 Company check pointsD06 Border Post ProceduresD07 InsecurityD08 Personal ReasonsD09 Vehicle BreakdownsD10 Inland Terminal Procedures andD11 Rest/mealsD12 Others
SERVICE FEES PAID FOR CODESS01 Police Fees / FineS02 Customs chargesS03 Weighbridge chargesS04 Port chargesS05 Border chargesS06 Repair chargesS07 Personal chargesS08 Vehicle BreakdownsS09 Other charges(specify)

THE TRANSPORT OBSERVATORY REPORT // 11th Issue | November 2017
93
VI. INBOUND (RETURN JOURNEY TO MOMBASA)
CARGO DETAILS
1. Cargo Form (tick one below)[ ] Container [ ] Loose Cargo [ ] Tanker2. Weight of goods carried. . . . . . . . . . . . . . . . . . . . . . . . . . . . . . . . . . . . . . . . . . . . . . . . . . . . . . 3. Container Numbers. . . . . . . . . . . . . . . . . . . . . . . . . . . . . . . . . . . . . . . . . . . . . . . . . . . . . . . . . . 4. Kind of goods carried (please tick appropriate ones from the table below):
[ ] Tea
[ ] Coffee
[ ] Hides and Skins
[ ] Tobacco Leaf
[ ] Beans and other Legumes
[ ] Fish
[ ] Sesame
[ ] Cocoa
[ ] Pepper
[ ] Vanilla
[ ] Fruits
[ ] Live animals
[ ] Ground/Cashew Nuts
[ ] Timber
[ ] Minerals
[ ] Cotton
[ ] Grains (Maize, Rice, Wheat, etc.)
[ ] Sugar
[ ] Tyres & Tubes
[ ] Vehicle Spares
[ ] Electronics
[ ] Cigarettes
[ ] Used Clothes
[ ] Cooking Oil
[ ] Cosmetics
[ ] Building materials
[ ] Machinery
[ ] Motor Vehicles
[ ] Footwear
[ ] Flour
[ ] Pulp and Paper
[ ] Books and other printed materials
[ ] Iron and Steel
[ ] Medical and Pharmaceutical products
[ ] Petroleum Products and related materials
[ ] Dry Cells
[ ] Foodstuff and Beverages
[ ] Utensils
[ ] Fabrics and Garments
[ ] Personal and Household Items
[ ] Safety Matches
[ ] Others (SPECIFY)............................
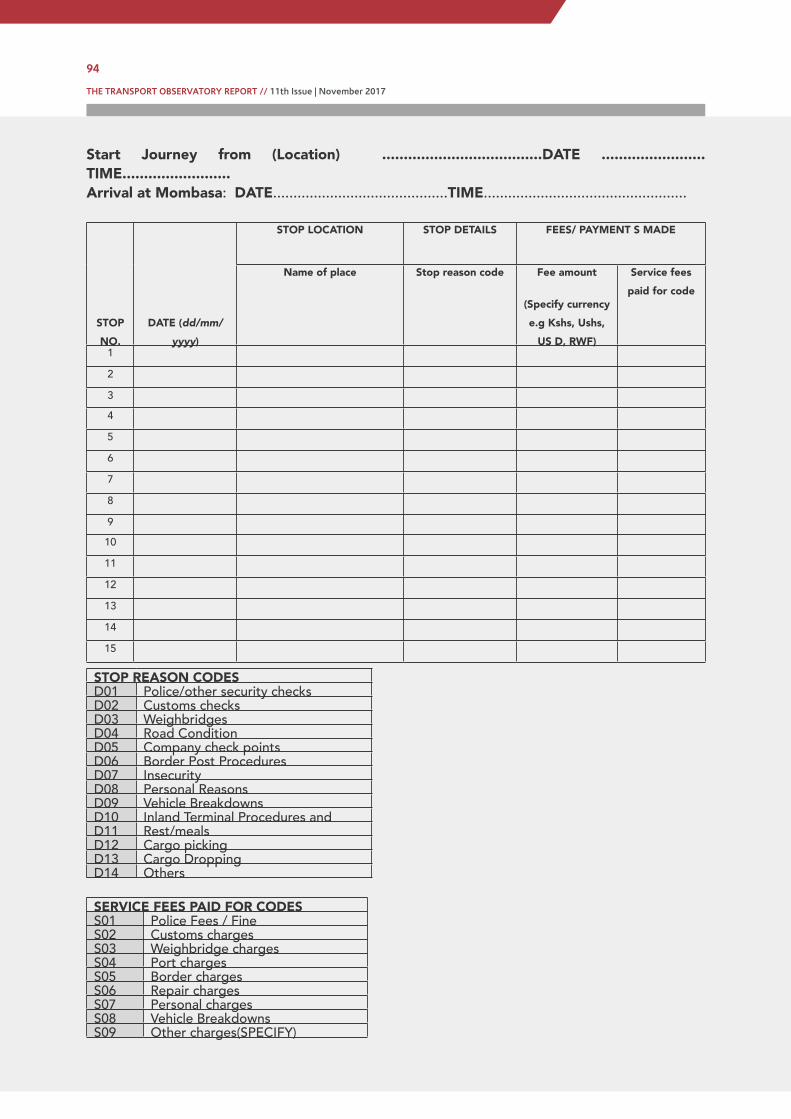
THE TRANSPORT OBSERVATORY REPORT // 11th Issue | November 2017
94
Start Journey from (Location) .....................................DATE ........................TIME.........................Arrival at Mombasa: DATE...........................................TIME..................................................
STOP NO.
DATE (dd/mm/yyyy)
STOP LOCATION STOP DETAILS FEES/ PAYMENT S MADE
Name of place Stop reason code Fee amount
(Specify currency e.g Kshs, Ushs,
US D, RWF)
Service fees paid for code
1
2
3
4
5
6
7
8
9
10
11
12
13
14
15
STOP REASON CODESD01 Police/other security checksD02 Customs checksD03 WeighbridgesD04 Road ConditionD05 Company check pointsD06 Border Post ProceduresD07 InsecurityD08 Personal ReasonsD09 Vehicle BreakdownsD10 Inland Terminal Procedures andD11 Rest/mealsD12 Cargo pickingD13 Cargo DroppingD14 Others
SERVICE FEES PAID FOR CODESS01 Police Fees / FineS02 Customs chargesS03 Weighbridge chargesS04 Port chargesS05 Border chargesS06 Repair chargesS07 Personal chargesS08 Vehicle BreakdownsS09 Other charges(SPECIFY)

THE TRANSPORT OBSERVATORY REPORT // 11th Issue | November 2017
95
VI. INBOUND CONTINUE.......
STOP NO.
DATE (dd/mm/yyyy)
STOP LOCATION STOP DETAILS FEES/ PAYMENT S MADE
Name of place Stop reason code Fee amount
(Specify currency e.g Kshs, Ushs,
US D, RWF)
Service fees paid for code
16
17
18
19
20
21
22
23
24
25
26
27
28
29
30
STOP REASON CODESD01 Police/other security checksD02 Customs checksD03 WeighbridgesD04 Road ConditionD05 Company check pointsD06 Border Post ProceduresD07 InsecurityD08 Personal ReasonsD09 Vehicle BreakdownsD10 Inland Terminal Procedures andD11 Rest/mealsD12 Cargo pickingD13 Cargo DroppingD14 Others
SERVICE FEES PAID FOR CODESS01 Police Fees / FineS02 Customs chargesS03 Weighbridge chargesS04 Port chargesS05 Border chargesS06 Repair chargesS07 Personal chargesS08 Vehicle BreakdownsS09 Other charges(SPECIFY)
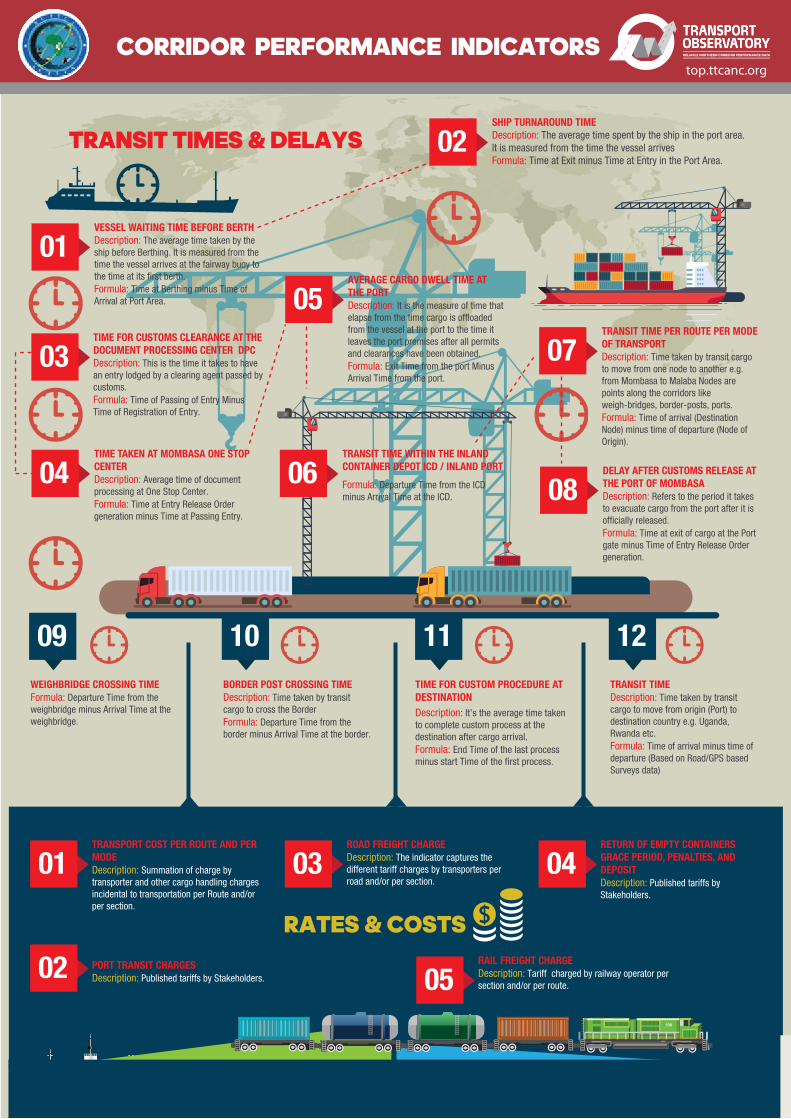
THE TRANSPORT OBSERVATORY REPORT // 11th Issue | November 2017
96CORRIDOR PERFORMANCE INDICATORS
TRANSIT TIMES & DELAYS
01VESSEL WAITING TIME BEFORE BERTHDescription: The average time taken by the ship before Berthing. It is measured from the time the vessel arrives at the fairway buoy to the time at its first berth.Formula: Time at Berthing minus Time of Arrival at Port Area.
03TIME FOR CUSTOMS CLEARANCE AT THE DOCUMENT PROCESSING CENTER �DPC�Description: This is the time it takes to have an entry lodged by a clearing agent passed by customs.Formula: Time of Passing of Entry Minus Time of Registration of Entry.
07TRANSIT TIME PER ROUTE PER MODEOF TRANSPORTDescription: Time taken by transit cargo to move from one node to another e.g. from Mombasa to Malaba Nodes are points along the corridors like weigh-bridges, border-posts, ports.Formula: Time of arrival (Destination Node) minus time of departure (Node of Origin).
04TIME TAKEN AT MOMBASA ONE STOP CENTERDescription: Average time of document processing at One Stop Center.Formula: Time at Entry Release Order generation minus Time at Passing Entry.
08DELAY AFTER CUSTOMS RELEASE AT THE PORT OF MOMBASADescription: Refers to the period it takes to evacuate cargo from the port after it is officially released.Formula: Time at exit of cargo at the Port gate minus Time of Entry Release Order generation.
02SHIP TURNAROUND TIMEDescription: The average time spent by the ship in the port area. It is measured from the time the vessel arrives Formula: Time at Exit minus Time at Entry in the Port Area.
05AVERAGE CARGO DWELL TIME AT THE PORTDescription: It is the measure of time that elapse from the time cargo is offloaded from the vessel at the port to the time it leaves the port premises after all permits and clearances have been obtained.Formula: Exit Time from the port Minus Arrival Time from the port.
TRANSIT TIME WITHIN THE INLANDCONTAINER DEPOT�ICD�/ INLAND PORT
Formula: Departure Time from the ICD minus Arrival Time at the ICD.
09WEIGHBRIDGE CROSSING TIMEFormula: Departure Time from the weighbridge minus Arrival Time at the weighbridge.
10BORDER POST CROSSING TIMEDescription: Time taken by transit cargo to cross the BorderFormula: Departure Time from the border minus Arrival Time at the border.
11TIME FOR CUSTOM PROCEDURE ATDESTINATIONDescription: It’s the average time taken to complete custom process at the destination after cargo arrival.Formula: End Time of the last process minus start Time of the first process.
12TRANSIT TIMEDescription: Time taken by transit cargo to move from origin (Port) to destination country e.g. Uganda, Rwanda etc.Formula: Time of arrival minus time of departure (Based on Road/GPS based Surveys data)
06
RATES & COSTS
01TRANSPORT COST PER ROUTE AND PER MODEDescription: Summation of charge by transporter and other cargo handling charges incidental to transportation per Route and/or per section.
02 PORT TRANSIT CHARGESDescription: Published tariffs by Stakeholders. 05
RAIL FREIGHT CHARGEDescription: Tariff� charged by railway operator persection and/or per route.
03ROAD FREIGHT CHARGEDescription: The indicator captures the different tariff�charges by transporters per road and/or per section.
04RETURN OF EMPTY CONTAINERS �GRACE PERIOD, PENALTIES, AND DEPOSIT�Description: Published tariffs by Stakeholders.
01MOMBASA PORT TOTAL CARGO THROUGHPUT VS TRANSIT TRAFFIC Description: Mombasa Port Total Cargo throughput = Summation of weight ofall cargo transported through the Port;Transit Traffic = Summation of weight all cargo transported through the Port destined to other countries. (It includes imports to and exports from other countries). Transit Traffic is part of the total Cargo throughput of the Mombasa port
02VOLUME PER COUNTRY OF DESTINATIONDescription: Summation of weight of all cargo (imports/exports) handled bythe Port per country of destination/origin.
03RATE OF CONTAINERIZATION OF TRANSIT TRAFFIC AT THE PORT OF MOMBASADescription: Total weight of containerized transit cargo divided by Total weight of all transit cargo.
04EVOLUTION OF LICENSED FLEET OF TRUCKS PER COUNTRYDescription: Summation of registered (Licensed) vehicles used for international/ transit cargo transportation per year and per country.
01CORRIDOR EMISSIONSDescription: Considers only road transport emissions along the corridor such as Particulate Matter (PM), black carbon emissions and Oxides of nitrogen (NOX) and CO2 emission in grams per ton-km.
02PORT EMISSIONSDescription: Total emissions at the port as summation of: -a) Emissions from the ship on maneuveringb) Emission by the ship at the port and on anchoragec) Emissions by equipment at the port of Mombasad) Vehicles and trucks accessing the port of Mombasae) Rail locomotives accessing the port of Mombasaf) Electricity usage at the port of Mombasa
01VALUE AND VOLUME OF TRADE BETWEEN THE NORTHERN CORRIDOR MEMBER STATESDescription: - Formal trade between the northern corridor member states- Informal trade between the northern corridor member states
05AVERAGE ANNUAL DISTANCE PER TRUCK IN KM PER YEAR Description: Average distance traveled per truck per year.
PRODUCTIVITY AND EFFICIENCY
VOLUME & CAPACITY
01NUMBER OF CHECK POINTS PER COUNTRYPER ROUTE
Description: Summation of checkpoints (weighbridge, police, customs, Road Toll), by country, by route.
02VOLUME OF CONTAINERIZED AND GENERAL CARGO HANDLED PER DAY/MONTH/QUARTERLY AT THE PORT OF MOMBASA
Description: Summation of volume of Containerized Cargo Handled per day/month/year; Summation of volume of General Cargo Handled per day/month/year.
03RATE OF FRAUD OR DECLARED DAMAGE FOR GOODS INTRANSIT
Description: Number of Fraud or Declared Damage cases divide by total Fraud or Declared Damage cases at a node.
Formula:Number of Fraud or Declared Damage cases____________________Total of Fraud or Declared Damage cases at a node
04WEIGHT COMPLIANCEDescription: The percentage of trucks that comply with the axle load limits before and after re-distribution.
Formula:Total compliant trucks in a weighbridge X 100_____________________________Total trucks tra�c in a weighbridge
05NUMBER OF ACCIDENTS PER ROUTEDescription: Summation of the number of Accidents, Injuries and Fatalities by Category and Sub Category.
WEIGHBRIDGE TRAFFICDescription: Average number of trucks passing a weighbridge in a day
07GROSS MOVES PER SHIP PER HOUR AT THE PORT OF MOMBASA
INTRAREGIONAL TRADE
Provides emissions levels for CO, VOC, NOX, PM, black carbon and
CO2 along the northern corridor with the objective to undertake measures
geared towards cutting down emissions levels
EMISSIONS INDICATORS
06TRANSPORT CAPACITY BY RAIL �LOCOMOTIVE AND WAGONS�Description: Total number of operational locomotives and wagons Proportion of total cargo carried by railway.
top.ttcanc.org
06
CORRIDOR PERFORMANCE INDICATORS
TRANSIT TIMES & DELAYS
01VESSEL WAITING TIME BEFORE BERTHDescription: The average time taken by the ship before Berthing. It is measured from the time the vessel arrives at the fairway buoy to the time at its first berth.Formula: Time at Berthing minus Time of Arrival at Port Area.
03TIME FOR CUSTOMS CLEARANCE AT THE DOCUMENT PROCESSING CENTER �DPC�Description: This is the time it takes to have an entry lodged by a clearing agent passed by customs.Formula: Time of Passing of Entry Minus Time of Registration of Entry.
07TRANSIT TIME PER ROUTE PER MODEOF TRANSPORTDescription: Time taken by transit cargo to move from one node to another e.g. from Mombasa to Malaba Nodes are points along the corridors like weigh-bridges, border-posts, ports.Formula: Time of arrival (Destination Node) minus time of departure (Node of Origin).
04TIME TAKEN AT MOMBASA ONE STOP CENTERDescription: Average time of document processing at One Stop Center.Formula: Time at Entry Release Order generation minus Time at Passing Entry.
08DELAY AFTER CUSTOMS RELEASE AT THE PORT OF MOMBASADescription: Refers to the period it takes to evacuate cargo from the port after it is officially released.Formula: Time at exit of cargo at the Port gate minus Time of Entry Release Order generation.
02SHIP TURNAROUND TIMEDescription: The average time spent by the ship in the port area. It is measured from the time the vessel arrives Formula: Time at Exit minus Time at Entry in the Port Area.
05AVERAGE CARGO DWELL TIME AT THE PORTDescription: It is the measure of time that elapse from the time cargo is offloaded from the vessel at the port to the time it leaves the port premises after all permits and clearances have been obtained.Formula: Exit Time from the port Minus Arrival Time from the port.
TRANSIT TIME WITHIN THE INLANDCONTAINER DEPOT�ICD�/ INLAND PORT
Formula: Departure Time from the ICD minus Arrival Time at the ICD.
09WEIGHBRIDGE CROSSING TIMEFormula: Departure Time from the weighbridge minus Arrival Time at the weighbridge.
10BORDER POST CROSSING TIMEDescription: Time taken by transit cargo to cross the BorderFormula: Departure Time from the border minus Arrival Time at the border.
11TIME FOR CUSTOM PROCEDURE ATDESTINATIONDescription: It’s the average time taken to complete custom process at the destination after cargo arrival.Formula: End Time of the last process minus start Time of the first process.
12TRANSIT TIMEDescription: Time taken by transit cargo to move from origin (Port) to destination country e.g. Uganda, Rwanda etc.Formula: Time of arrival minus time of departure (Based on Road/GPS based Surveys data)
06
RATES & COSTS
01TRANSPORT COST PER ROUTE AND PER MODEDescription: Summation of charge by transporter and other cargo handling charges incidental to transportation per Route and/or per section.
02 PORT TRANSIT CHARGESDescription: Published tariffs by Stakeholders. 05
RAIL FREIGHT CHARGEDescription: Tariff� charged by railway operator persection and/or per route.
03ROAD FREIGHT CHARGEDescription: The indicator captures the different tariff�charges by transporters per road and/or per section.
04RETURN OF EMPTY CONTAINERS �GRACE PERIOD, PENALTIES, AND DEPOSIT�Description: Published tariffs by Stakeholders.
01MOMBASA PORT TOTAL CARGO THROUGHPUT VS TRANSIT TRAFFIC Description: Mombasa Port Total Cargo throughput = Summation of weight ofall cargo transported through the Port;Transit Traffic = Summation of weight all cargo transported through the Port destined to other countries. (It includes imports to and exports from other countries). Transit Traffic is part of the total Cargo throughput of the Mombasa port
02VOLUME PER COUNTRY OF DESTINATIONDescription: Summation of weight of all cargo (imports/exports) handled bythe Port per country of destination/origin.
03RATE OF CONTAINERIZATION OF TRANSIT TRAFFIC AT THE PORT OF MOMBASADescription: Total weight of containerized transit cargo divided by Total weight of all transit cargo.
04EVOLUTION OF LICENSED FLEET OF TRUCKS PER COUNTRYDescription: Summation of registered (Licensed) vehicles used for international/ transit cargo transportation per year and per country.
01CORRIDOR EMISSIONSDescription: Considers only road transport emissions along the corridor such as Particulate Matter (PM), black carbon emissions and Oxides of nitrogen (NOX) and CO2 emission in grams per ton-km.
02PORT EMISSIONSDescription: Total emissions at the port as summation of: -a) Emissions from the ship on maneuveringb) Emission by the ship at the port and on anchoragec) Emissions by equipment at the port of Mombasad) Vehicles and trucks accessing the port of Mombasae) Rail locomotives accessing the port of Mombasaf) Electricity usage at the port of Mombasa
01VALUE AND VOLUME OF TRADE BETWEEN THE NORTHERN CORRIDOR MEMBER STATESDescription: - Formal trade between the northern corridor member states- Informal trade between the northern corridor member states
05AVERAGE ANNUAL DISTANCE PER TRUCK IN KM PER YEAR Description: Average distance traveled per truck per year.
PRODUCTIVITY AND EFFICIENCY
VOLUME & CAPACITY
01NUMBER OF CHECK POINTS PER COUNTRYPER ROUTE
Description: Summation of checkpoints (weighbridge, police, customs, Road Toll), by country, by route.
02VOLUME OF CONTAINERIZED AND GENERAL CARGO HANDLED PER DAY/MONTH/QUARTERLY AT THE PORT OF MOMBASA
Description: Summation of volume of Containerized Cargo Handled per day/month/year; Summation of volume of General Cargo Handled per day/month/year.
03RATE OF FRAUD OR DECLARED DAMAGE FOR GOODS INTRANSIT
Description: Number of Fraud or Declared Damage cases divide by total Fraud or Declared Damage cases at a node.
Formula:Number of Fraud or Declared Damage cases____________________Total of Fraud or Declared Damage cases at a node
04WEIGHT COMPLIANCEDescription: The percentage of trucks that comply with the axle load limits before and after re-distribution.
Formula:Total compliant trucks in a weighbridge X 100_____________________________Total trucks tra�c in a weighbridge
05NUMBER OF ACCIDENTS PER ROUTEDescription: Summation of the number of Accidents, Injuries and Fatalities by Category and Sub Category.
WEIGHBRIDGE TRAFFICDescription: Average number of trucks passing a weighbridge in a day
07GROSS MOVES PER SHIP PER HOUR AT THE PORT OF MOMBASA
INTRAREGIONAL TRADE
Provides emissions levels for CO, VOC, NOX, PM, black carbon and
CO2 along the northern corridor with the objective to undertake measures
geared towards cutting down emissions levels
EMISSIONS INDICATORS
06TRANSPORT CAPACITY BY RAIL �LOCOMOTIVE AND WAGONS�Description: Total number of operational locomotives and wagons Proportion of total cargo carried by railway.
top.ttcanc.org
06

THE TRANSPORT OBSERVATORY REPORT // 11th Issue | November 2017
97CORRIDOR PERFORMANCE INDICATORS
TRANSIT TIMES & DELAYS
01VESSEL WAITING TIME BEFORE BERTHDescription: The average time taken by the ship before Berthing. It is measured from the time the vessel arrives at the fairway buoy to the time at its first berth.Formula: Time at Berthing minus Time of Arrival at Port Area.
03TIME FOR CUSTOMS CLEARANCE AT THE DOCUMENT PROCESSING CENTER �DPC�Description: This is the time it takes to have an entry lodged by a clearing agent passed by customs.Formula: Time of Passing of Entry Minus Time of Registration of Entry.
07TRANSIT TIME PER ROUTE PER MODEOF TRANSPORTDescription: Time taken by transit cargo to move from one node to another e.g. from Mombasa to Malaba Nodes are points along the corridors like weigh-bridges, border-posts, ports.Formula: Time of arrival (Destination Node) minus time of departure (Node of Origin).
04TIME TAKEN AT MOMBASA ONE STOP CENTERDescription: Average time of document processing at One Stop Center.Formula: Time at Entry Release Order generation minus Time at Passing Entry.
08DELAY AFTER CUSTOMS RELEASE AT THE PORT OF MOMBASADescription: Refers to the period it takes to evacuate cargo from the port after it is officially released.Formula: Time at exit of cargo at the Port gate minus Time of Entry Release Order generation.
02SHIP TURNAROUND TIMEDescription: The average time spent by the ship in the port area. It is measured from the time the vessel arrives Formula: Time at Exit minus Time at Entry in the Port Area.
05AVERAGE CARGO DWELL TIME AT THE PORTDescription: It is the measure of time that elapse from the time cargo is offloaded from the vessel at the port to the time it leaves the port premises after all permits and clearances have been obtained.Formula: Exit Time from the port Minus Arrival Time from the port.
TRANSIT TIME WITHIN THE INLANDCONTAINER DEPOT�ICD�/ INLAND PORT
Formula: Departure Time from the ICD minus Arrival Time at the ICD.
09WEIGHBRIDGE CROSSING TIMEFormula: Departure Time from the weighbridge minus Arrival Time at the weighbridge.
10BORDER POST CROSSING TIMEDescription: Time taken by transit cargo to cross the BorderFormula: Departure Time from the border minus Arrival Time at the border.
11TIME FOR CUSTOM PROCEDURE ATDESTINATIONDescription: It’s the average time taken to complete custom process at the destination after cargo arrival.Formula: End Time of the last process minus start Time of the first process.
12TRANSIT TIMEDescription: Time taken by transit cargo to move from origin (Port) to destination country e.g. Uganda, Rwanda etc.Formula: Time of arrival minus time of departure (Based on Road/GPS based Surveys data)
06
RATES & COSTS
01TRANSPORT COST PER ROUTE AND PER MODEDescription: Summation of charge by transporter and other cargo handling charges incidental to transportation per Route and/or per section.
02 PORT TRANSIT CHARGESDescription: Published tariffs by Stakeholders. 05
RAIL FREIGHT CHARGEDescription: Tariff� charged by railway operator persection and/or per route.
03ROAD FREIGHT CHARGEDescription: The indicator captures the different tariff�charges by transporters per road and/or per section.
04RETURN OF EMPTY CONTAINERS �GRACE PERIOD, PENALTIES, AND DEPOSIT�Description: Published tariffs by Stakeholders.
01MOMBASA PORT TOTAL CARGO THROUGHPUT VS TRANSIT TRAFFIC Description: Mombasa Port Total Cargo throughput = Summation of weight ofall cargo transported through the Port;Transit Traffic = Summation of weight all cargo transported through the Port destined to other countries. (It includes imports to and exports from other countries). Transit Traffic is part of the total Cargo throughput of the Mombasa port
02VOLUME PER COUNTRY OF DESTINATIONDescription: Summation of weight of all cargo (imports/exports) handled bythe Port per country of destination/origin.
03RATE OF CONTAINERIZATION OF TRANSIT TRAFFIC AT THE PORT OF MOMBASADescription: Total weight of containerized transit cargo divided by Total weight of all transit cargo.
04EVOLUTION OF LICENSED FLEET OF TRUCKS PER COUNTRYDescription: Summation of registered (Licensed) vehicles used for international/ transit cargo transportation per year and per country.
01CORRIDOR EMISSIONSDescription: Considers only road transport emissions along the corridor such as Particulate Matter (PM), black carbon emissions and Oxides of nitrogen (NOX) and CO2 emission in grams per ton-km.
02PORT EMISSIONSDescription: Total emissions at the port as summation of: -a) Emissions from the ship on maneuveringb) Emission by the ship at the port and on anchoragec) Emissions by equipment at the port of Mombasad) Vehicles and trucks accessing the port of Mombasae) Rail locomotives accessing the port of Mombasaf) Electricity usage at the port of Mombasa
01VALUE AND VOLUME OF TRADE BETWEEN THE NORTHERN CORRIDOR MEMBER STATESDescription: - Formal trade between the northern corridor member states- Informal trade between the northern corridor member states
05AVERAGE ANNUAL DISTANCE PER TRUCK IN KM PER YEAR Description: Average distance traveled per truck per year.
PRODUCTIVITY AND EFFICIENCY
VOLUME & CAPACITY
01NUMBER OF CHECK POINTS PER COUNTRYPER ROUTE
Description: Summation of checkpoints (weighbridge, police, customs, Road Toll), by country, by route.
02VOLUME OF CONTAINERIZED AND GENERAL CARGO HANDLED PER DAY/MONTH/QUARTERLY AT THE PORT OF MOMBASA
Description: Summation of volume of Containerized Cargo Handled per day/month/year; Summation of volume of General Cargo Handled per day/month/year.
03RATE OF FRAUD OR DECLARED DAMAGE FOR GOODS INTRANSIT
Description: Number of Fraud or Declared Damage cases divide by total Fraud or Declared Damage cases at a node.
Formula:Number of Fraud or Declared Damage cases____________________Total of Fraud or Declared Damage cases at a node
04WEIGHT COMPLIANCEDescription: The percentage of trucks that comply with the axle load limits before and after re-distribution.
Formula:Total compliant trucks in a weighbridge X 100_____________________________Total trucks tra�c in a weighbridge
05NUMBER OF ACCIDENTS PER ROUTEDescription: Summation of the number of Accidents, Injuries and Fatalities by Category and Sub Category.
WEIGHBRIDGE TRAFFICDescription: Average number of trucks passing a weighbridge in a day
07GROSS MOVES PER SHIP PER HOUR AT THE PORT OF MOMBASA
INTRAREGIONAL TRADE
Provides emissions levels for CO, VOC, NOX, PM, black carbon and
CO2 along the northern corridor with the objective to undertake measures
geared towards cutting down emissions levels
EMISSIONS INDICATORS
06TRANSPORT CAPACITY BY RAIL �LOCOMOTIVE AND WAGONS�Description: Total number of operational locomotives and wagons Proportion of total cargo carried by railway.
top.ttcanc.org
06
CORRIDOR PERFORMANCE INDICATORS
TRANSIT TIMES & DELAYS
01VESSEL WAITING TIME BEFORE BERTHDescription: The average time taken by the ship before Berthing. It is measured from the time the vessel arrives at the fairway buoy to the time at its first berth.Formula: Time at Berthing minus Time of Arrival at Port Area.
03TIME FOR CUSTOMS CLEARANCE AT THE DOCUMENT PROCESSING CENTER �DPC�Description: This is the time it takes to have an entry lodged by a clearing agent passed by customs.Formula: Time of Passing of Entry Minus Time of Registration of Entry.
07TRANSIT TIME PER ROUTE PER MODEOF TRANSPORTDescription: Time taken by transit cargo to move from one node to another e.g. from Mombasa to Malaba Nodes are points along the corridors like weigh-bridges, border-posts, ports.Formula: Time of arrival (Destination Node) minus time of departure (Node of Origin).
04TIME TAKEN AT MOMBASA ONE STOP CENTERDescription: Average time of document processing at One Stop Center.Formula: Time at Entry Release Order generation minus Time at Passing Entry.
08DELAY AFTER CUSTOMS RELEASE AT THE PORT OF MOMBASADescription: Refers to the period it takes to evacuate cargo from the port after it is officially released.Formula: Time at exit of cargo at the Port gate minus Time of Entry Release Order generation.
02SHIP TURNAROUND TIMEDescription: The average time spent by the ship in the port area. It is measured from the time the vessel arrives Formula: Time at Exit minus Time at Entry in the Port Area.
05AVERAGE CARGO DWELL TIME AT THE PORTDescription: It is the measure of time that elapse from the time cargo is offloaded from the vessel at the port to the time it leaves the port premises after all permits and clearances have been obtained.Formula: Exit Time from the port Minus Arrival Time from the port.
TRANSIT TIME WITHIN THE INLANDCONTAINER DEPOT�ICD�/ INLAND PORT
Formula: Departure Time from the ICD minus Arrival Time at the ICD.
09WEIGHBRIDGE CROSSING TIMEFormula: Departure Time from the weighbridge minus Arrival Time at the weighbridge.
10BORDER POST CROSSING TIMEDescription: Time taken by transit cargo to cross the BorderFormula: Departure Time from the border minus Arrival Time at the border.
11TIME FOR CUSTOM PROCEDURE ATDESTINATIONDescription: It’s the average time taken to complete custom process at the destination after cargo arrival.Formula: End Time of the last process minus start Time of the first process.
12TRANSIT TIMEDescription: Time taken by transit cargo to move from origin (Port) to destination country e.g. Uganda, Rwanda etc.Formula: Time of arrival minus time of departure (Based on Road/GPS based Surveys data)
06
RATES & COSTS
01TRANSPORT COST PER ROUTE AND PER MODEDescription: Summation of charge by transporter and other cargo handling charges incidental to transportation per Route and/or per section.
02 PORT TRANSIT CHARGESDescription: Published tariffs by Stakeholders. 05
RAIL FREIGHT CHARGEDescription: Tariff� charged by railway operator persection and/or per route.
03ROAD FREIGHT CHARGEDescription: The indicator captures the different tariff�charges by transporters per road and/or per section.
04RETURN OF EMPTY CONTAINERS �GRACE PERIOD, PENALTIES, AND DEPOSIT�Description: Published tariffs by Stakeholders.
01MOMBASA PORT TOTAL CARGO THROUGHPUT VS TRANSIT TRAFFIC Description: Mombasa Port Total Cargo throughput = Summation of weight ofall cargo transported through the Port;Transit Traffic = Summation of weight all cargo transported through the Port destined to other countries. (It includes imports to and exports from other countries). Transit Traffic is part of the total Cargo throughput of the Mombasa port
02VOLUME PER COUNTRY OF DESTINATIONDescription: Summation of weight of all cargo (imports/exports) handled bythe Port per country of destination/origin.
03RATE OF CONTAINERIZATION OF TRANSIT TRAFFIC AT THE PORT OF MOMBASADescription: Total weight of containerized transit cargo divided by Total weight of all transit cargo.
04EVOLUTION OF LICENSED FLEET OF TRUCKS PER COUNTRYDescription: Summation of registered (Licensed) vehicles used for international/ transit cargo transportation per year and per country.
01CORRIDOR EMISSIONSDescription: Considers only road transport emissions along the corridor such as Particulate Matter (PM), black carbon emissions and Oxides of nitrogen (NOX) and CO2 emission in grams per ton-km.
02PORT EMISSIONSDescription: Total emissions at the port as summation of: -a) Emissions from the ship on maneuveringb) Emission by the ship at the port and on anchoragec) Emissions by equipment at the port of Mombasad) Vehicles and trucks accessing the port of Mombasae) Rail locomotives accessing the port of Mombasaf) Electricity usage at the port of Mombasa
01VALUE AND VOLUME OF TRADE BETWEEN THE NORTHERN CORRIDOR MEMBER STATESDescription: - Formal trade between the northern corridor member states- Informal trade between the northern corridor member states
05AVERAGE ANNUAL DISTANCE PER TRUCK IN KM PER YEAR Description: Average distance traveled per truck per year.
PRODUCTIVITY AND EFFICIENCY
VOLUME & CAPACITY
01NUMBER OF CHECK POINTS PER COUNTRYPER ROUTE
Description: Summation of checkpoints (weighbridge, police, customs, Road Toll), by country, by route.
02VOLUME OF CONTAINERIZED AND GENERAL CARGO HANDLED PER DAY/MONTH/QUARTERLY AT THE PORT OF MOMBASA
Description: Summation of volume of Containerized Cargo Handled per day/month/year; Summation of volume of General Cargo Handled per day/month/year.
03RATE OF FRAUD OR DECLARED DAMAGE FOR GOODS INTRANSIT
Description: Number of Fraud or Declared Damage cases divide by total Fraud or Declared Damage cases at a node.
Formula:Number of Fraud or Declared Damage cases____________________Total of Fraud or Declared Damage cases at a node
04WEIGHT COMPLIANCEDescription: The percentage of trucks that comply with the axle load limits before and after re-distribution.
Formula:Total compliant trucks in a weighbridge X 100_____________________________Total trucks tra�c in a weighbridge
05NUMBER OF ACCIDENTS PER ROUTEDescription: Summation of the number of Accidents, Injuries and Fatalities by Category and Sub Category.
WEIGHBRIDGE TRAFFICDescription: Average number of trucks passing a weighbridge in a day
07GROSS MOVES PER SHIP PER HOUR AT THE PORT OF MOMBASA
INTRAREGIONAL TRADE
Provides emissions levels for CO, VOC, NOX, PM, black carbon and
CO2 along the northern corridor with the objective to undertake measures
geared towards cutting down emissions levels
EMISSIONS INDICATORS
06TRANSPORT CAPACITY BY RAIL �LOCOMOTIVE AND WAGONS�Description: Total number of operational locomotives and wagons Proportion of total cargo carried by railway.
top.ttcanc.org
06

THE TRANSPORT OBSERVATORY REPORT // 11th Issue | November 2017
98
Trade and Transport for Regional Integration
NORTHERN CORRIDOR TRANSPORT OBSERVATORY REPORT
11TH Issue | November 2017