northern michigan rail ridership feasibility and cost …
TRANSCRIPT
NORTHERN MICHIGAN RAIL
RIDERSHIP FEASIBILITY AND
COST ESTIMATE STUDY
PREPARED FOR:
The Groundwork Center For Resilient Communities
Grant Fiduciary: Bay Area Transportation Authority
PREPARED BY:
Transportation Economics & Management Systems, Inc.
OCTOBER 2018 FINAL REPORT

This page intentionally left blank
NORTHERN MICHIGAN RAIL RIDERSHIP FEASIBILITY AND COST ESTIMATE STUDY
Introduction October 2018 Page i
About the Groundwork Center for Resilient Communities
The Groundwork Center for Resilient Communities works with people to build a thriving local farm and
food economy; to make Michigan towns and villages stronger, more walkable, bike-able, and transit-
friendly; and to develop local, clean energy. They seek to achieve on-the-ground results in northwest
Michigan and leverage them to support other communities and improvements to state policy. All of this
is designed to strengthen the local economy, protect the environment, and build community.
Re-establishing passenger rail service between Ann Arbor, Petoskey, and Traverse City—homes to
growing technology industries—will link the growing northwest with population centers in the
southeast and universities along the way. Civic and business leaders believe this effort will help our state
attract the next generation workforce that wants to live and thrive in Michigan without depending on a
car.
Groundwork believes that bringing passenger rail service back to northern Michigan is possible in less
than a decade with a focused campaign of public engagement, technical analysis, and support from
community, state and federal agencies.
For More Information Groundwork center
148 E. Front Street, Suite 301
Traverse City, MI 49684-5725
(231) 941-6584

NORTHERN MICHIGAN RAIL RIDERSHIP FEASIBILITY AND COST ESTIMATE STUDY
Introduction October 2018 Page ii
This page intentionally left blank
NORTHERN MICHIGAN RAIL RIDERSHIP FEASIBILITY AND COST ESTIMATE STUDY
Introduction October 2018 Page iii
Acknowledgements
This study was prepared by Transportation Economics & Management Systems, Inc. (TEMS) and managed by the Groundwork Center. The Bay Area Transportation Authority served as the grant fiduciary for the study. Funding for this project comes from a Federal Transit Administration Service Delivery and New Technology Grant, the Michigan Department of Transportation, and local matches provided by the following organizations:
Petoskey Downtown Management Board,
Petoskey Area Visitors Bureau,
City of Traverse City,
Traverse City Tourism,
City of Alma,
Washtenaw County. Financial support for the Ann Arbor to Traverse City passenger rail project comes from the Rotary Charities of Traverse City, The Les and Anne Biederman Foundation, the National Association of REALTORS and the Traverse Area Association of REALTORS. Their financial contribution made this project possible. Project steering committee members include:
Eric Lingaur, Bay Area Transportation Authority
James Bruckbauer, Groundwork Center for Resilient Communities
John Langdon, Michigan Association of Railroad Passengers
Jeffrey Martin, Michigan Department of Transportation

NORTHERN MICHIGAN RAIL RIDERSHIP FEASIBILITY AND COST ESTIMATE STUDY
Introduction October 2018 Page iv
This page intentionally left blank
This
NORTHERN MICHIGAN RAIL RIDERSHIP FEASIBILITY AND COST ESTIMATE STUDY
Table of Contents October 2018 Page v
Table of Contents
ABOUT THE GROUNDWORK CENTER FOR RESILIENT COMMUNITIES III
ACKNOWLEDGEMENTS V
TABLE OF CONTENTS VII
CHAPTER 1 PROJECT OVERVIEW 1-1
1.1 INTRODUCTION 1-1
1.2 PURPOSE AND OBJECTIVE 1-2
1.3 PROJECT SCOPE 1-3
1.4 PROJECT METHODOLOGY 1-3
1.4.1 STUDY PROCESS 1-5
1.5 FREIGHT RAILROAD PRINCIPLES 1-6
1.6 ORGANIZATION OF THE REPORT 1-7
CHAPTER 2 SERVICE AND OPERATING PLAN 2-1
2.1 INTRODUCTION 2-1
2.2 PROPOSED APPROACH TO DEVELOPMENT OF RAIL SERVICE 2-3
2.3 TRAIN TECHNOLOGY OPTIONS 2-8
2.3.1 ROLLING STOCK AND OPERATIONAL ASSUMPTIONS 2-11
2.3.2 TRAIN TECHNOLOGY OPERATING CHARACTERISTICS 2-12
2.4 TRAIN SCHEDULE DEVELOPMENT 2-13
2.4.1 PETOSKEY TO CADILLAC DIRECT 2-14
2.4.2 TRAVERSE CITY TO CADILLAC 2-15
2.4.3 PETOSKEY TO TRAVERSE CITY TO CADILLAC 2-17
2.4.4 CADILLAC TO DETROIT 2-18
2.5 TRACK SPEED ANALYSIS BY SEGMENT 2-20
2.6 COMPARATIVE RUNNING TIMES SUMMARY 2-22
2.7 PRO-FORMA TRAIN SCHEDULE DEVELOPMENT 2-23
CHAPTER 3 MARKET AND TRANSPORTATION DATABASES & RIDERSHIP FORECASTS 3-1
3.1 ZONE SYSTEM 3-1
3.2 SOCIOECONOMIC DATABASE DEVELOPMENT 3-5
3.2.1 DATA COLLECTION AND ANALYSIS 3-5
NORTHERN MICHIGAN RAIL RIDERSHIP FEASIBILITY AND COST ESTIMATE STUDY
Table of Contents October 2018 Page vi
3.2.1.1 Regional Demographics and Growth 3-7
3.3 BASE TRANSPORTATION DATABASE DEVELOPMENT 3-9
3.3.1 BASE TRANSPORTATION NETWORKS 3-9
3.3.2 TRIP DATABASE 3-14
3.3.3 VISITORS 3-16
3.4 TRAVEL DEMAND FORECAST 3-19
3.4.1 PASSENGER RAIL SERVICE SCENARIOS 3-19
3.4.2 THE TRAVEL DEMAND FORECAST RESULTS 3-20
3.4.2.1 Total Demand 3-20
3.4.2.2 Ridership Forecasts 3-21
3.4.2.3 REVENUE FORECASTS 3-22
3.4.2.4 MARKET SHARES 3-24
CHAPTER 4 OPERATING COSTS 4-1
4.1 OPERATING AND MAINTENANCE COST METHODOLOGY 4-1
4.1.1 VARIABLE COSTS 4-3
4.1.1.1 Train Equipment Maintenance 4-3
4.1.1.2 Train and Engine Crew Costs 4-4
4.1.1.3 Fuel and Energy 4-4
4.1.1.4 Onboard Services (OBS) 4-5
4.1.1.5 Insurance Costs 4-6
4.1.2 FIXED ROUTE COSTS 4-6
4.1.2.1 Track and Right-of-Way Costs 4-6
4.1.2.2 Station Operations 4-10
4.1.2.3 System Overhead Costs 4-10
4.1.3 OPERATING COST BREAKDOWN 4-11
CHAPTER 5 CAPITAL COSTS 5-1
5.1 INTRODUCTION 5-1
5.2 INFRASTRUCTURE COST BUILDUP 5-2
5.2.1 TRACK AND RAIL UPGRADES 5-3
5.2.2 BRIDGES 5-7
5.2.3 TRAIN CONTROL SYSTEMS 5-7
5.2.3 CROSSINGS 5-10
5.2.4 PLACEHOLDER INFRASTRUCTURE COSTS 5-12
CHAPTER 6 FINANCIAL AND ECONOMIC RESULTS 6-1
6.1 INTRODUCTION 6-1
NORTHERN MICHIGAN RAIL RIDERSHIP FEASIBILITY AND COST ESTIMATE STUDY
Table of Contents October 2018 Page vii
6.2 IMPLEMENTATION PHASING OPTIONS 6-3
6.2.1 60-MPH STARTUP AND FULL BUILD OPTIONS 6-3
6.2.2 90-AND-110 MPH FULL BUILD OPTIONS 6-6
6.3 ECONOMIC RESULTS 6-7
6.3.3 KEY ASSUMPTIONS 6-8
6.3.3.1 Ridership and Revenue Forecasts 6-8
6.3.3.2 Capital Costs 6-8
6.3.3.3 Operating Expenses 6-9
6.3.3.4 User Benefits 6-9
6.4 ECONOMIC RESULTS 6-11
CHAPTER 7 CONCLUSIONS AND NEXT STEPS 7-1
7.1 CONCLUSIONS 7-1
7.2 NEXT STEPS 7-2
APPENDIX 1 RIGHTTRACK™ BUSINESS PLANNING SOFTWARE A-1

NORTHERN MICHIGAN RAIL RIDERSHIP FEASIBILITY AND COST ESTIMATE STUDY
Table of Contents October 2018 Page viii
This page intentionally left blank
NORTHERN MICHIGAN RAIL RIDERSHIP FEASIBILITY AND COST ESTIMATE STUDY
Chapter 1: Project Overview October 2018 Page 1-1
Chapter 1 Project Overview
S U M M A R Y
Chapter 1 of this report sets out the background and purpose of the Ann Arbor to Traverse City (A2TC)
Passenger Rail Line project, including outlining the study’s goal, the scope, and the methodologies used
1.1 Introduction
This study provides a pre-feasibility level understanding about the potential for operating passenger rail
service between the southeast region of Michigan including Detroit and Ann Arbor, and the northwestern
tourism-oriented region of Michigan including Traverse City and Petoskey. The opportunity for developing
such a service is supported by the fact that the State of Michigan already owns nearly all of the needed
rail tracks. Re-establishing passenger rail service between Detroit, Ann Arbor, Petoskey and Traverse City
– will link the tourist centers of the northwest to major existing population centers in the southeast of
Michigan. According to a 2009 Grand Valley study, urban downtowns with once-a-day train service
boosted their economies up to $45,000,000 annually. In addition to boosting regular social and business
travel, the rail service will help support the rapidly growing tourism industry, as well as effectively serving
the 90,000 students who live along the proposed rail corridor. This initiative will integrate Michigan
providing rail service across the state.
Since the early 1980’s, the Michigan Department of Transportation (MDOT) and its associated
Metropolitan Planning Organizations (MPOs) have been primarily focused on development of passenger
rail systems in Southern Michigan. However, when the public outreach was conducted for the 2011 State
Rail Plan, the most common requested new rail connection was to Traverse City from either Grand Rapids
or Detroit. MDOT concluded that Michigan's passenger rail system should include a Traverse City to
southern Michigan connection. Each map at each public outreach forum included connecting Traverse City
to the southern part of the state in some fashion. The southern connection points varied between Grand
Rapids and the Ann Arbor area depending on where the forum was held. The maps, discussion and
comments, however, were consistent across forums regarding a Traverse City to southern Michigan
passenger rail connection. Such a rail service could connect the major cities of Detroit and Ann Arbor with
the major tourist destinations of Traverse City and Petoskey, while at the same time it would also support
the economic development objectives of communities along the way, such as Owosso, Alma, Mt. Pleasant
and Cadillac, many of which are also home to large student populations.
NORTHERN MICHIGAN RAIL RIDERSHIP FEASIBILITY AND COST ESTIMATE STUDY
Chapter 1: Project Overview October 2018 Page 1-2
Over the past 20 years there have been many changes in the travel environment including:
The changing demographic and socioeconomic factors that have occurred reflecting greater
mobility and a more widely distributed population.
Increasing household incomes that are increasing discretionary tourism travel.
Changing travel conditions for auto use due to more congestion on the interstate highway system
and higher energy (gasoline) prices that make auto travel more time consuming and expensive.
Air Deregulation has significantly reduced the amount of air service for trips under 300 miles, and
reduced quality of service, due to the use of smaller aircraft in the corridor, making rail service
more competitive in this distance range.
The development of more cost effective rail technology due to improved locomotive
performance and efficiency, as well as the introduction of modern communication systems.
As a result, rail travel has become increasingly competitive, and for example Amtrak has seen a significant
rise in its ridership since the year 2000 across the Midwest with Chicago-Detroit ridership increasing by 57
percent by 2011 with very little change in the actual rail service provided. This increasing public
propensity to use rail suggests the need to review the potential for rail service across Michigan including
the ability to expand service to include northern Michigan as well.
1.2 Purpose and Objective
The goal of the study is to provide Groundwork and its associated organizations and stakeholders with a
basic understanding of:
The background history supporting the proposed development of the proposed Detroit/Ann
Arbor to Traverse City/Petoskey A2TC rail corridor.
Potential route and technology options for the corridor.
The market for intercity travel in the current travel environment.
The capital and operating costs of train service.
The financial and economic benefits that would be derived from implementing the system.
This study will assess the travel market and need for passenger rail development in the corridor; the
choice of route and technology options for developing the corridor; resulting capital costs; operation and
maintenance costs; ridership and revenue; operating ratios and benefit-cost analysis; and funding and
financing opportunities. A Business Plan will be prepared that identifies the potential for rail service.
NORTHERN MICHIGAN RAIL RIDERSHIP FEASIBILITY AND COST ESTIMATE STUDY
Chapter 1: Project Overview October 2018 Page 1-3
1.3 Project Scope
The study approach uses TEMS RightTrack™ Business Planning System to provide a fully documented
analysis of the corridor opportunity. The approach identifies existing and future markets, potential routes
and capital costs, technology and operating costs, financial and economic returns and input to stakeholder
and community benefits. Specifically, key deliverables include:
A comprehensive intercity travel market analysis for the base and forecast years.
An assessment of potential routes and stations.
A review of potential train technology for 79, 90 & 110-mph operations and potential operating
schedules and costs on different routes and for different stopping patterns.
Both a financial and economic analysis of options and their ability to meet United States
Department of Transportation (USDOT) Federal Railroad Administration (FRA) funding
requirements.
A high-level estimate of community benefits to provide input to the stakeholder and community
groups to identify the project pros and cons.
Preparation of a conceptual level pre-feasibility report for use in assessing the project viability
and its ability to achieve fundability.
1.4 Project Methodology
To ensure all of the FRA criteria and factors are fully evaluated, the study team has used a business plan
approach. As specified by the FRA, the selection of an appropriate rail option is “market driven.” The
difference in the selection of one rail option over another is heavily dependent on the potential ridership
and revenue. A set of reasonable alternatives have been developed for evaluation based on the potential
of each option to improve market access, raise train speed, or to reduce cost. These alternatives provide a
full range of trade-off options for configuring the rail system to best meet Michigan’s need.
To ensure that market potential is properly measured, the TEMS Business Plan Approach carries out a
very detailed and comprehensive market analysis. The output of this market analysis is then used to
determine the right rail technology and engineering infrastructure for the corridors.
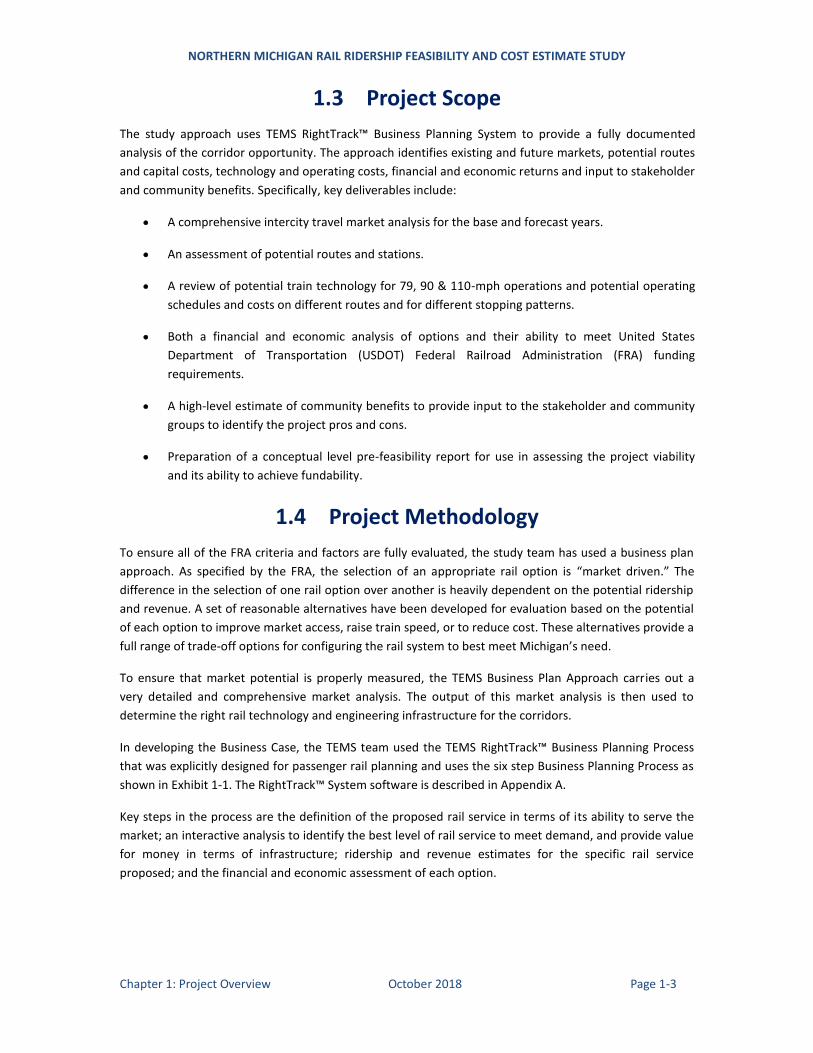
In developing the Business Case, the TEMS team used the TEMS RightTrack™ Business Planning Process
that was explicitly designed for passenger rail planning and uses the six step Business Planning Process as
shown in Exhibit 1-1. The RightTrack™ System software is described in Appendix A.
Key steps in the process are the definition of the proposed rail service in terms of its ability to serve the
market; an interactive analysis to identify the best level of rail service to meet demand, and provide value
for money in terms of infrastructure; ridership and revenue estimates for the specific rail service
proposed; and the financial and economic assessment of each option.
NORTHERN MICHIGAN RAIL RIDERSHIP FEASIBILITY AND COST ESTIMATE STUDY
Chapter 1: Project Overview October 2018 Page 1-4
Exhibit 1-1: Six Step Business Planning Process
NORTHERN MICHIGAN RAIL RIDERSHIP FEASIBILITY AND COST ESTIMATE STUDY
Chapter 1: Project Overview October 2018 Page 1-5
1.4.1 Study Process The Business Planning Process is designed to provide a rapid evaluation of routes, technologies,
infrastructure improvements, different operating patterns and plans to show what impact this will have
on ridership and revenues, and financial and economic results.
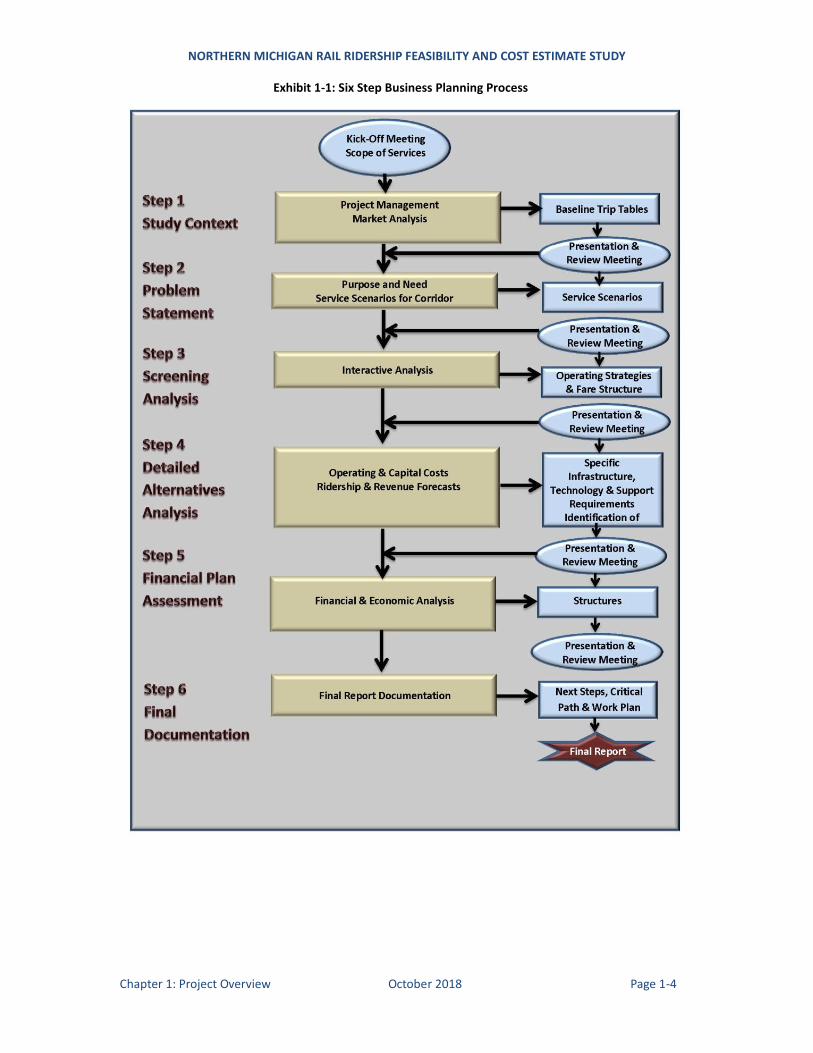
The current study entailed an interactive and quantitative evaluation, with regular feedback and
adjustments between track/technology assessments and operating plan/demand assessments. It
culminated in a financial and economic assessment of alternatives. Exhibit 1-2 illustrates the process that
led up to the financial and economic analysis.
The study investigated the interaction between alignments and technologies to identify optimum trade-
offs between capital investments in track, bridges and signal requirements, and other infrastructure
improvements, and operating speed. The engineering assessment included GOOGLE©
map and/or ground
inspections of significant portions of track and potential alignments. TRACKMAN™ was used to catalog the
base track infrastructure and improvements. LOCOMOTION™ was used to simulate various train
technologies on the track at different levels of investment, using operating characteristics (train
acceleration, curving and tilt capabilities, etc.) that were developed during the technology assessment.
The study identified the infrastructure costs (on an itemized segment basis) necessary to achieve high
levels of performance for the train technology options evaluated.
Exhibit 1-2: Interactive Analysis Process
A comprehensive travel demand model was developed using the latest socioeconomic data, traffic
volumes (air, bus, auto, and rail) and updated network data (e.g., gas prices) to test likely ridership
response to service improvements over time. The ridership and revenue demand estimates, developed
using the COMPASS™ demand modeling system, are sensitive to trip purpose, service frequencies, travel
times, fares, fuel prices, congestion and other trip attributes.
NORTHERN MICHIGAN RAIL RIDERSHIP FEASIBILITY AND COST ESTIMATE STUDY
Chapter 1: Project Overview October 2018 Page 1-6
A detailed operating plan was developed and refined, applying train technologies and infrastructure
improvements to evaluate travel times at different levels of infrastructure investment. Train frequencies
were tested and refined to support and complement the ridership demand forecasts, match supply and
demand, and to estimate operating costs.
Financial and economic results were analyzed for each option over a 30-year horizon using criteria
recommended by USDOT FRA Cost Benefit guidelines, and the U.S. Office of Management and Budget
(OMB) Social Discount Rates. The analysis provided a summary of capital costs, revenues, and operating
costs for the life of the project, and developed the operating ratio and cost benefit ratio for each option.
1.5 Freight Railroad Principles
It is in the interest of passenger rail feasibility that any shared use of freight rail corridors or tracks along
the A2TC rail corridor respect the need for continued safe and economical rail freight operations. At a
minimum, it is intended that the freight railroads need to be able to operate their trains as effectively as
they could if passenger service did not exist. Beyond this, it is desirable to actually create benefits for
freight rail service if possible while developing the infrastructure needed to support passenger services.
Freight railroads such as the Great Lakes Central Railroad (GLC) must retain their ability not only to handle
current traffic, but also to expand their own franchises for future traffic growth.
At present the passenger proposals laid out here are still un-negotiated, un-funded and at a pre-feasibility
level. This report makes certain assumptions regarding the need for capacity enhancements along rail
lines that would be utilized for providing passenger service. However, the required detailed capacity
analysis for shared track segments has yet to be done. As a result, the work is not yet at a detailed enough
level to fully satisfy the needs of the freight railroads. It is understood that in potential future detailed
engineering and environmental studies, the required capacity work will be performed. These engineering
and operation studies will address the details of integrating the proposed passenger operations with
freight operations, and will be subject to close negotiations with the railroad. As a result, the final
infrastructure need will not be known until these studies and railroad negotiations are completed. This
report only suggests a starting point for the capacity analysis process and negotiations. These will need to
be done if and when the A2TC corridor moves forward into the environmental study phase.
In the meantime, this report contains preliminary data which is subject to review, verification and
approval by the GLC and also by the Canadian National Railroad (CN) for the section of track around the
Durand freight yard and south of Durand. Although the GLC has been very supportive of passenger
service along the line1, as of the date of this report, this formal review process has not taken place.
Findings are not to be construed as a commitment on the part of MDOT, GLC or CN to operate additional
service.
1See Great Lake Central Railroad website: http://www.glcrailroad.com/passenger.php retrieved on April 16, 2018.
NORTHERN MICHIGAN RAIL RIDERSHIP FEASIBILITY AND COST ESTIMATE STUDY
Chapter 1: Project Overview October 2018 Page 1-7
1.6 Organization of the Report
1. Chapter 1 – Project Overview: Chapter 1 lays out the overall approach for implementing the
proposed A2TC Rail Line (Detroit – Traverse City/Petoskey) over the next 25 years. Chapter 1 of
this report also sets out the background and purpose of the A2TC rail corridor, including goals for
the project, the project scope, and the methodologies used. In addition, a discussion of the
Freight Principles impacting the project, particularly regarding the sharing of track with Passenger
Rail, are included at the end of this chapter.
2. Chapter 2 – Service and Operating Plan: This chapter discusses the development of the Service
and Operating Plan and includes a discussion of the track infrastructure and train technology
options. This chapter also describes the operating plan, station stopping patterns, frequencies,
train times and train schedules for each route and technology option.
3. Chapter 3 – Market and Transportation Databases & Ridership Forecasts: The ridership and
revenue forecasts for this study were developed using the COMPASS™ Travel Demand Model. The
COMPASS™ Multimodal Demand Forecasting Model is a flexible demand forecasting tool used to
compare and evaluate alternative passenger rail network and service scenarios. It is particularly
useful in assessing the introduction or expansion of public transportation modes such as
passenger rail, air, or new bus service into markets. This chapter first presents the zone system
and describes the socioeconomic data, transportation network data, origin-destination data and
stated preference data that were used in development of the forecasts. It then presents the
analysis of Total Travel Demand and forecasted rail modal shares, resulting in the ridership and
revenue forecasts.
4. Chapter 4 – Operating Costs: Operating costs were calculated for each year the system is planned
to be operational using operating cost drivers such as passenger volumes, train miles, and
operating hours.
5. Chapter 5 – Capital Costs: This chapter discusses the development of the Prioritized Capital Plan
and includes a discussion of the capital cost methodology and the capital costs for the A2TC Rail
Line including breakdowns by unit costs. The unit capital costs for estimating infrastructure,
equipment, and maintenance facility capital costs for each route and technology option are also
described.
6. Chapter 6 – Financial and Economic Analysis: This chapter presents a detailed financial analysis
for the A2TC corridor, including key financial measures such as Operating Surplus and Operating
Ratio. A detailed Economic Analysis was also carried out using the Cost Benefit criteria set out by
the 1997 FRA Commercial Feasibility Study2 including key economic measures such as Consumer
Surplus and Benefit/Cost Ratio which are presented in this chapter.
7. Chapter 7 – Conclusions and Next Steps: This chapter outlines the key findings of the study, and
the next steps that should be taken to move the A2TC Rail Line project forward.
2High-Speed Ground Transportation for America: Commercial Feasibility Study Report To Congress: https://www.fra.dot.gov/eLib/details/L02519

NORTHERN MICHIGAN RAIL RIDERSHIP FEASIBILITY AND COST ESTIMATE STUDY
Chapter 1: Project Overview October 2018 Page 1-8
This page intentionally left blank
NORTHERN MICHIGAN RAIL RIDERSHIP FEASIBILITY AND COST ESTIMATE STUDY
Chapter 2: Service and Operating Plan October 2018 Page 2-1
Chapter 2 Service and Operating Plan
S U M M A R Y
This chapter discusses the development of the Service and Operating Plan including identifying the route
and technology options that should be considered for the A2TC study. This chapter also describes the
operating plan, station stopping patterns, frequencies, train times and train schedules for each route and
technology option.
2.1 Introduction
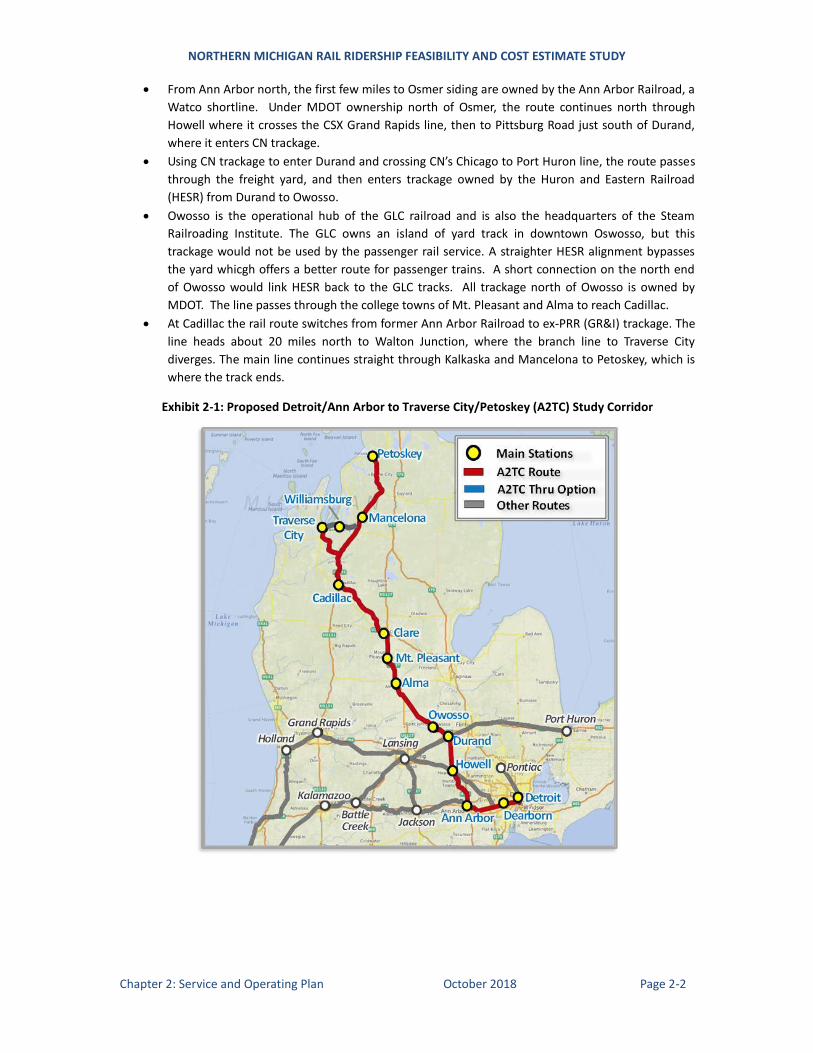
The A2TC Corridor, shown in Exhibit 2-1, follows the existing rail line north from Ann Arbor to Traverse
City and Petoskey. As shown, the proposed passenger train service may include two optional route
extensions:
By constructing a track connection in Ann Arbor, the service may be continued east to add the
Dearborn and Detroit New Center stations to the route.
The existing rail line extends beyond Traverse City to Williamsburg where a major casino and
resort are located. As shown in Exhibit 2-1, it may be further extended east to Kalkaska for
developing a “Run Through” option. This would allow trains to run directly from Traverse City
through to Petoskey.
In terms of rail stations, the proposed rail service would stop in the following locations:
Detroit, Dearborn and Ann Arbor to serve the large population centers of southern Michigan
Howell, Durand and Owosso would also serve the Lansing and Flint markets
Alma, Mount Pleasant and Clare serve university student markets and also link to Bay City,
Midland and Saginaw
Cadillac, Traverse City, Mancelona and Petoskey are key tourist destination in northern Michigan,
and can be linked by shuttle bus to destinations even farther north, such as Mackinac Island and
the Upper Peninsula.
The rail corridor north of Ann Arbor is currently operated by Great Lakes Central (GLC) and most of it is in
Michigan DOT (MDOT) ownership:
With an optional route extension to Detroit as shown in Exhibit 2-1, the route would begin at the
Detroit New Center station and would follow the existing Detroit-Chicago line used by Amtrak to
Ann Arbor. At Ann Arbor, a new connection would cross the Huron River and link to the former
Ann Arbor rail line heading north.
If the route were not extended to Detroit, a new station would be needed along the Ann Arbor
Railroad tracks and the route could not connect directly with the existing Amtrak service. This
station has been assumed to be located south of the Huron River, for example it could be adjacent
to the University of Michigan sports stadium in Ann Arbor.
NORTHERN MICHIGAN RAIL RIDERSHIP FEASIBILITY AND COST ESTIMATE STUDY
Chapter 2: Service and Operating Plan October 2018 Page 2-2
From Ann Arbor north, the first few miles to Osmer siding are owned by the Ann Arbor Railroad, a
Watco shortline. Under MDOT ownership north of Osmer, the route continues north through
Howell where it crosses the CSX Grand Rapids line, then to Pittsburg Road just south of Durand,
where it enters CN trackage.
Using CN trackage to enter Durand and crossing CN’s Chicago to Port Huron line, the route passes
through the freight yard, and then enters trackage owned by the Huron and Eastern Railroad
(HESR) from Durand to Owosso.
Owosso is the operational hub of the GLC railroad and is also the headquarters of the Steam
Railroading Institute. The GLC owns an island of yard track in downtown Oswosso, but this
trackage would not be used by the passenger rail service. A straighter HESR alignment bypasses
the yard whicgh offers a better route for passenger trains. A short connection on the north end
of Owosso would link HESR back to the GLC tracks. All trackage north of Owosso is owned by
MDOT. The line passes through the college towns of Mt. Pleasant and Alma to reach Cadillac.
At Cadillac the rail route switches from former Ann Arbor Railroad to ex-PRR (GR&I) trackage. The
line heads about 20 miles north to Walton Junction, where the branch line to Traverse City
diverges. The main line continues straight through Kalkaska and Mancelona to Petoskey, which is
where the track ends.
Exhibit 2-1: Proposed Detroit/Ann Arbor to Traverse City/Petoskey (A2TC) Study Corridor
NORTHERN MICHIGAN RAIL RIDERSHIP FEASIBILITY AND COST ESTIMATE STUDY
Chapter 2: Service and Operating Plan October 2018 Page 2-3
2.2 Proposed Approach to Development of Rail Service
Passenger trains are already operating over the central portion of the corridor today, mostly between
Owosso and Alma at up to 25-mph. Current excursion service is typically organized as a short distance,
same-day, out-and-back activity which may offer a brief stopover for allowing passengers to get off the
train. For example, the North Pole Express runs in late autumn from Owosso to Ashley and back, allowing
passengers to experience the Village of Ashley’s Country Christmas. In the spring, summer and fall,
excursion trains run intermittently to Cadillac and occasionally as far north as Petoskey.
Currently, passenger trains cannot operate to Traverse City at all because of track conditions on the last
few miles into Traverse City. At Petoskey, the rail line ends in an industrial area south of town which does
not provide an attractive anchor for a passenger rail service. In addition, excursions north of Cadillac
must be diesel-powered, since steam powered trains cannot cross the Manistee River Bridge. For these
reasons very few excursion trains have been running north of Cadillac.
The proposed approach for implementing passenger service along the A2TC corridor will focus first on the
expansion of excursion service, especially on the north end of the line, but will also seek to expand the
range of excursion services south to Ann Arbor as well. This would extend the range of passenger train
service so that it can operate anywhere in the A2TC corridor. At first excursion trains would operate at 25-
mph, but since the existing tracks are able to support operations at up to 60-mph, this opens the
possibility of transitioning the existing excursion service to a chartered train business model. Target
markets for this service may include corporate groups on weekend retreats to the Grand Traverse Resort
& Spa and Turtle Creek Casino & Hotel in Traverse City, University sponsored trains for student travel to
football games, and other kinds of special events trains that could be operated as excursion trains on
irregular schedules.
Once the charter train capability has been firmly established then it should be possible to set up some
trial runs to test the market for regularly scheduled service. This could be finally followed by the
implementation of regular scheduled service on a basis that makes commercial sense.
25-mph Excursion Service – The initial objective is to expand the range of existing excursion services to
cover the whole GLC railroad north of Owosso.
The first priority is clearly to fix the existing tracks into downtown Traverse City, where there is a
large market for excursion services due to the high visitor counts during the summer months. An
excursion train would provide an added attraction to boost the already strong tourism base of the
Traverse City area.
After this, there is also a need to fix the tracks into downtown Petoskey. If Petoskey wants to
share in the excursion train bonanza, it must revitalize its rail connection to downtown and
establish an attractive rail station.
Other locations along the rail lines north of Cadillac could also become attractive destinations for
excursion trains. For example, Fife Lake offers a swimming area on the beach right beside the
train. In the winter, Boyne Falls offers skiing opportunities. A careful analysis of the business
opportunity is needed to consider a variety of ways for structuring potential excursion services, so
as to maximize their market potential. Offering periodic train service to different destinations is
one way of keeping the service concept “fresh” and for encouraging repeat ridership.
NORTHERN MICHIGAN RAIL RIDERSHIP FEASIBILITY AND COST ESTIMATE STUDY
Chapter 2: Service and Operating Plan October 2018 Page 2-4
While repairs to the Manistee River Bridge would support freight shippers north of Cadillac, these
repairs could also allow steam powered excursions to both Traverse City and Petoskey. Once a
diesel excursion capability is established, the ability to run steam on occasion to the north end of
the line would provide an added draw. This potential boost in the tourism potential would
provide yet another added incentive to expedite this bridge repair.
60-mph Excursion Service – Raising the speed of excursion trains by extending their operating range
would enable the launch of a charter train business. This would represent a major expansion of the
passenger capabilities of the A2TC corridor. Not only would service need to be extended south to Ann
Arbor, but it is also likely that upgrading the track from Traverse City to Williamsburg would be a part of a
60-mph investment package. A Williamsburg extension would not only enable direct service to the
casino, but would also serve the Grand Traverse Resort & Spa and Turtle Creek Casino & Hotel which is
linked to the casino by a shuttle bus service.
Initially 60-mph trains could head north from Owosso, but it is likely that the real market will lie farther
south. For example, the University of Michigan stadium in Ann Arbor would be a strong attractor for
special sporting events trains. However, extending rail service to the stadium will require dealing with a
number of institutional issues. Extending 60-mph excursion service south to Ann Arbor will require:
Track Access and/or Additional Insurance: o The right to operate passenger trains south of Osmer siding into downtown Ann Arbor
needs to be secured. As suggested by the WALLY line plan, one way for MDOT to secure these rights would be by purchasing the track south of Osmer to the proposed freight interchange at Ellsworth Road. If MDOT does not purchase the track then it must continue to work with the Ann Arbor Railroad to secure the necessary operating rights.
o GLC and the Steam Railroading Institute can operate passenger trains over HESR tracks from Owosso to the north end of Durand yard. However, every time GLC runs a train, MDOT has to pay HESR for the use of the track. By purchasing those tracks, MDOT could avoid the cost of these payments.
o GLC and the Steam Railroading Institute cannot operate passenger train over CN tracks through Durand to Pittsburg Road because they do not meet the CN’s minimum Insurance Requirements. The A2TC passenger operator has to meet these requirements if it wants to bring passenger trains across the CN tracks through Durand. Watco’s Ann Arbor Railroad would likely impose similar Insurance requirements if MDOT does not purchase the tracks south of Osmer siding.
Infrastructure Improvements:
o The frequency of ultrasonic inspection of the rails will have to be boosted from every five years to once a year for 60-mph passenger train speeds on FRA Class 3 track.
o Existing active grade crossings along the line will need to be upgraded for advance activation to provide a constant warning time capability.
o Track conditions have to be improved to permit passenger service on the line extension to Williamsburg. Also, track conditions limit passenger trains to 25-mph north of Kalkaska to Petoskey. This will prevent 60-mph service to Petoskey until the tracks have been repaired. Trains could run only at a slower speed of 25-mph.
o Stations, boarding platforms and parking facilities will need to be built and/or secured at each identified excursion train destination, for example at the University of Michigan stadium.
NORTHERN MICHIGAN RAIL RIDERSHIP FEASIBILITY AND COST ESTIMATE STUDY
Chapter 2: Service and Operating Plan October 2018 Page 2-5
Once the whole rail line is open to 60-mph excursion trains, the market for scheduled service could be
tested by opening (from time to time) some excursion train seating to public ticket sales. At this point in
time passenger operations would still be irregular, but overnight rail excursions3 have been operated in
the past. If an organization has chartered a train, then by adding cars it might be possible to allow some
public ticket sales on the train as well. The quality of onboard service, as well as ride quality, on time
performance, accessibility of stations, adequate parking, and of course the way the service is advertised
and promoted are all critical to the success of the service. All of these could be tested in the market trials.
60-mph Scheduled Service – Starting a scheduled service will likely require the installation of a Positive
Train Control (PTC) system. Scheduled service carries with it a higher degree of commercial risk than does
charter or excursion operation, and as well it puts the railroad into a position of taking on a public service
obligation. For this reason it is likely that some degree of public support (subsidy) will be needed for
starting a scheduled service. This study suggests that the market is already well enough developed to
support at least one daily scheduled round trip at 60-mph. As will be detailed in Section 6.2.1, the
required level of subsidy would be in line which the level of support that MDOT is providing to other
Michigan passenger trains.
Direct service to the large Detroit market and integration with the Amtrak Chicago-Detroit line is likely to
be a key requirement for the success of the scheduled service. So, a track connection needs to be
provided in Ann Arbor to enable direct service to Detroit. The train station at the University of Michigan
stadium would still remain in use for special event trains.
90 and 110-mph Scheduled Service – For raising train speeds higher than 60-mph, the first limiting factor
is likely to be the capability of the trains themselves. While the MiTrain passenger cars might possibly be
able to run faster than 60-mph, freight locomotives such as those used by GLC likely cannot.
Therefore to run faster than 60-mph the first need is to replace freight locomotives with dedicated
passenger locomotives which are geared for operation at higher speeds. For attaining 110-mph
capability, the railcars must also be upgraded. The ideal 110-mph train would consist of tilting, single
level railcars that can go around curves faster, coupled with High Speed Diesel locomotives like the
Siemens Sprinter. The older trains could remain in use as special event trains and/or be cascaded to other
services, such as to the WALLY line.
Once faster train equipment has been deployed then the tracks can be upgraded one segment at a time.
Typically, a track upgrade above 60-mph would entail rail welding or rail replacement, along with new ties
and ballast. Curve spirals would be adjusted to provide smooth transitions, and all public crossings would
have active protection installed if they could not be closed.
As well, enhancements to the Positive Train Control (PTC) system would need to be made. Either broken
rail protection would be provided or in the alternative, a higher level of rail line inspection may be
proposed as an equivalent safeguard, as required for speeds greater than 60-mph. This would be added
as an enhancement to the PTC system covering all the areas that require it.
For speeds exceeding 90-mph, all public and private crossings would be protected, and an even greater
effort would be made for permanently closing such crossings. Once this is done, train speeds could be
raised to the appropriate target speed for the specific segment of track that has been improved. Over
3See: http://cincinnatirailway.com/CinciRailway/annual-trip-to-petoskey-michigan/
NORTHERN MICHIGAN RAIL RIDERSHIP FEASIBILITY AND COST ESTIMATE STUDY
Chapter 2: Service and Operating Plan October 2018 Page 2-6
time the entire line would be upgraded to 110-mph capability (as geometry permits) which is the planned
full build condition for the rail line.
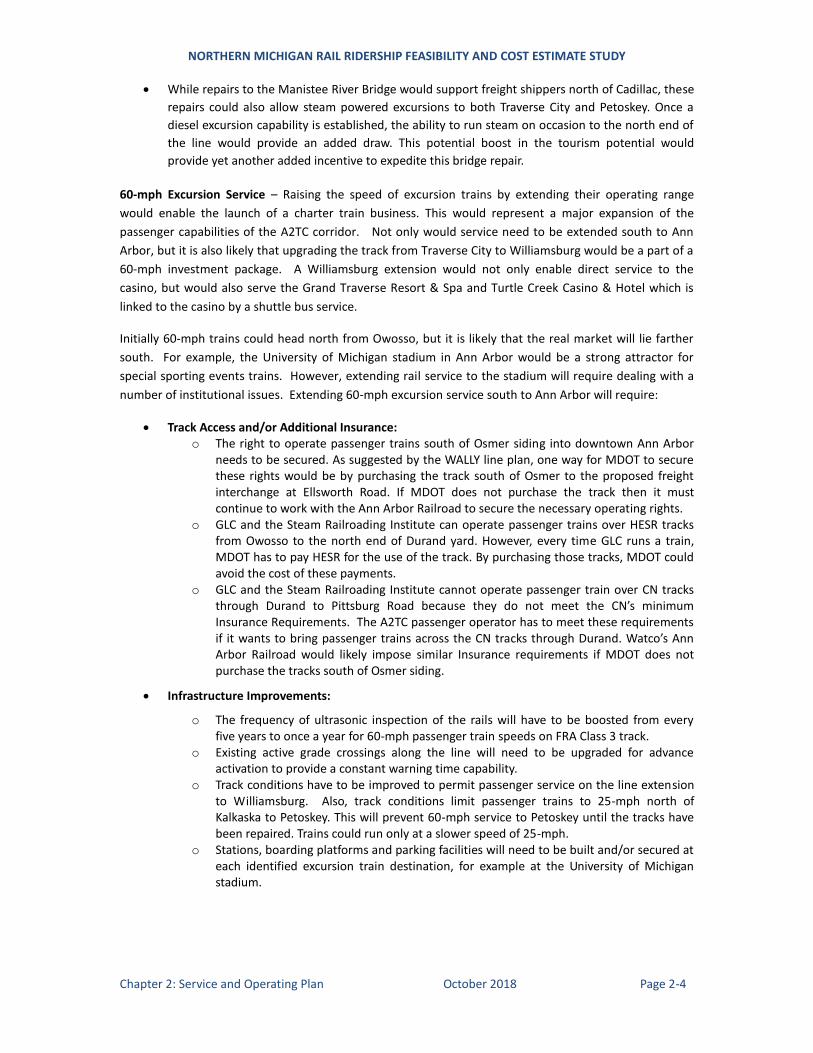
Exhibit 2-2 shows how TEMS’ TRACKMAN™ software has been used to electronically catalog the A2TC
track infrastructure and proposed improvements (Exhibit 2-2), thus providing a detailed track database.
The TRACKMAN™ database captures relevant data on the locations of all stations, grades, curves, speed
limits, highway grade crossings, overhead and under grade bridges, side tracks and rail spurs. Based on
this detailed infrastructure database, a full range of technology and train service options can be assessed
using the LOCOMOTION™ train performance calculator as described in the next section of this report.
Exhibit 2-2: Base Track Infrastructure for the Howell Area as Shown in TRACKMAN™
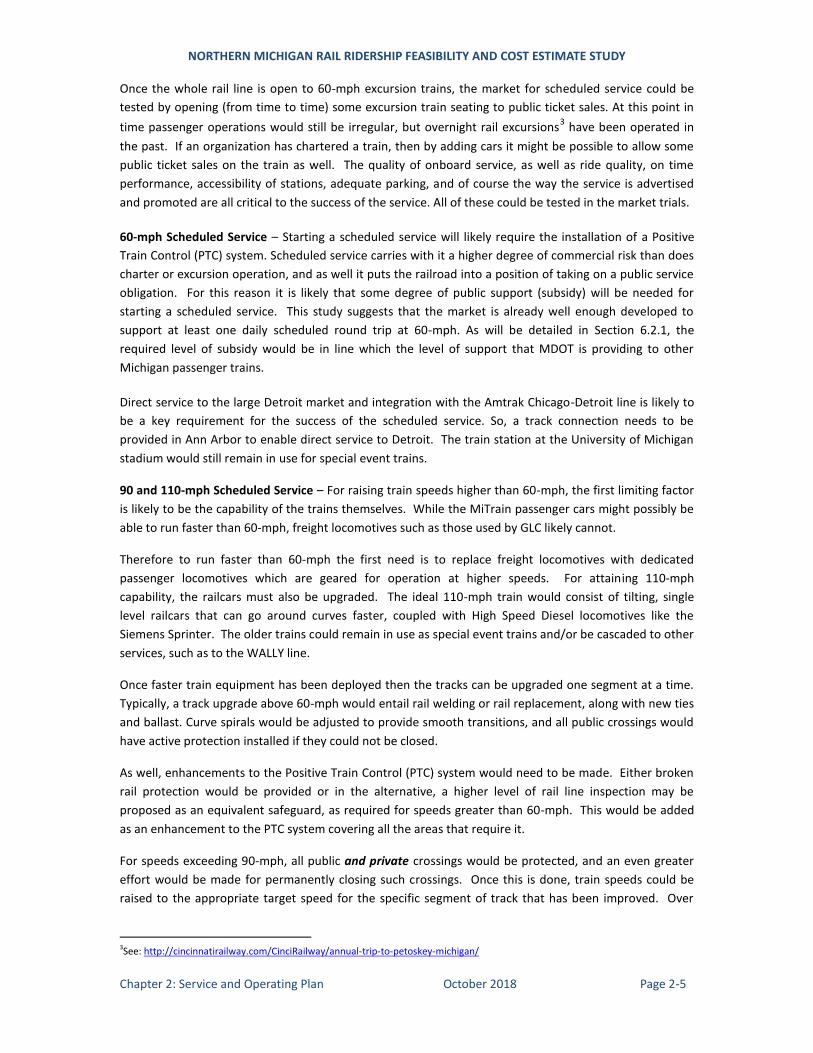
On the south end of the rail corridor, the option to extend service from Ann Arbor though to Detroit
requires the construction of a new curving bridge spanning the Huron River in Ann Arbor, as shown in
Exhibit 2-3. This is certainly the preferred option from an operational perspective since it provides a direct
movement from the A2TC corridor towards Detroit. As a short term alternative a former freight
connection to the existing Amtrak/NS line may be restored, but using this for passenger trains would
require a time consuming reverse move from the GLC (former Ann Arbor) line onto the Amtrak line.
Exhibit 2-3: Ann Arbor Connection towards Detroit
NORTHERN MICHIGAN RAIL RIDERSHIP FEASIBILITY AND COST ESTIMATE STUDY
Chapter 2: Service and Operating Plan October 2018 Page 2-7
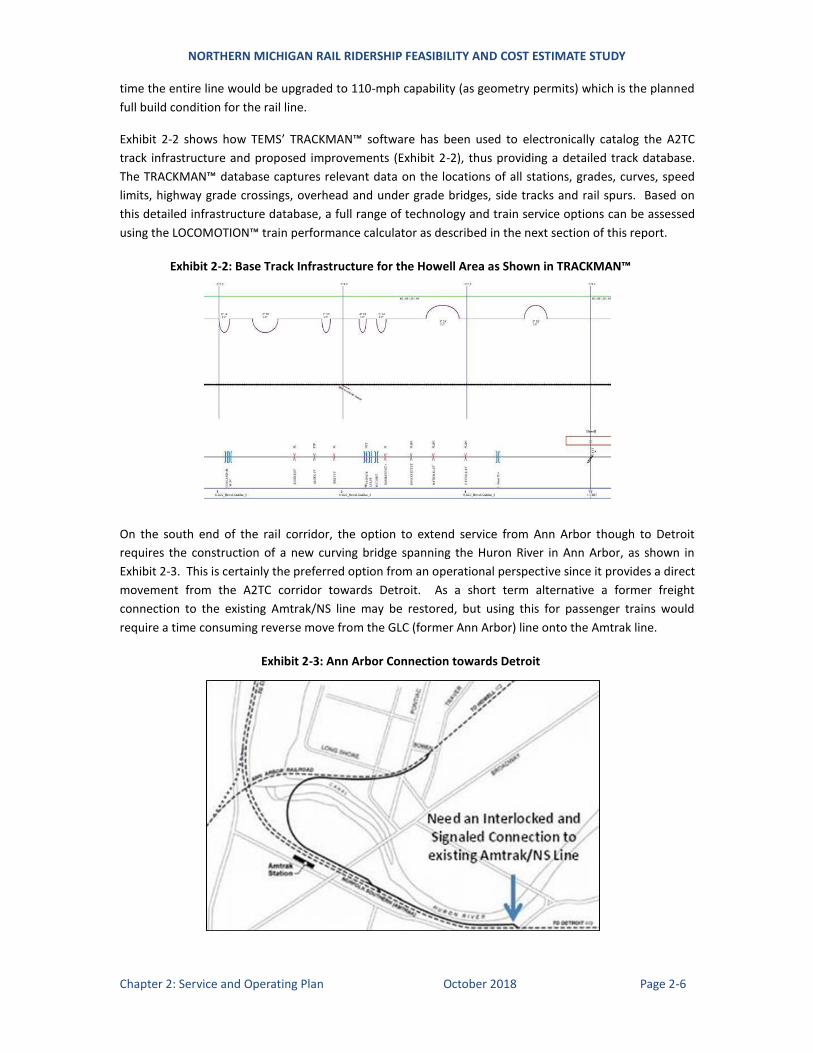
On the north end of the rail corridor, an option exists for extending service beyond Traverse City to
Williamsburg on existing tracks. The service can possibly be further extended over a new rail alignment (in
existing rights of way) beyond Williamsburg connecting to Petoskey, as shown in Exhibit 2-4. A route
extension at least as far as Williamsburg over existing rail seems desirable for linking to the casino and
Grand Traverse resort. Therefore this study will preserve the ability to extend rail service at least to
Williamsburg, and even for extending a run-through service from Traverse City directly to Petoskey.
Exhibit 2-4: North End Option for Williamsburg Extension
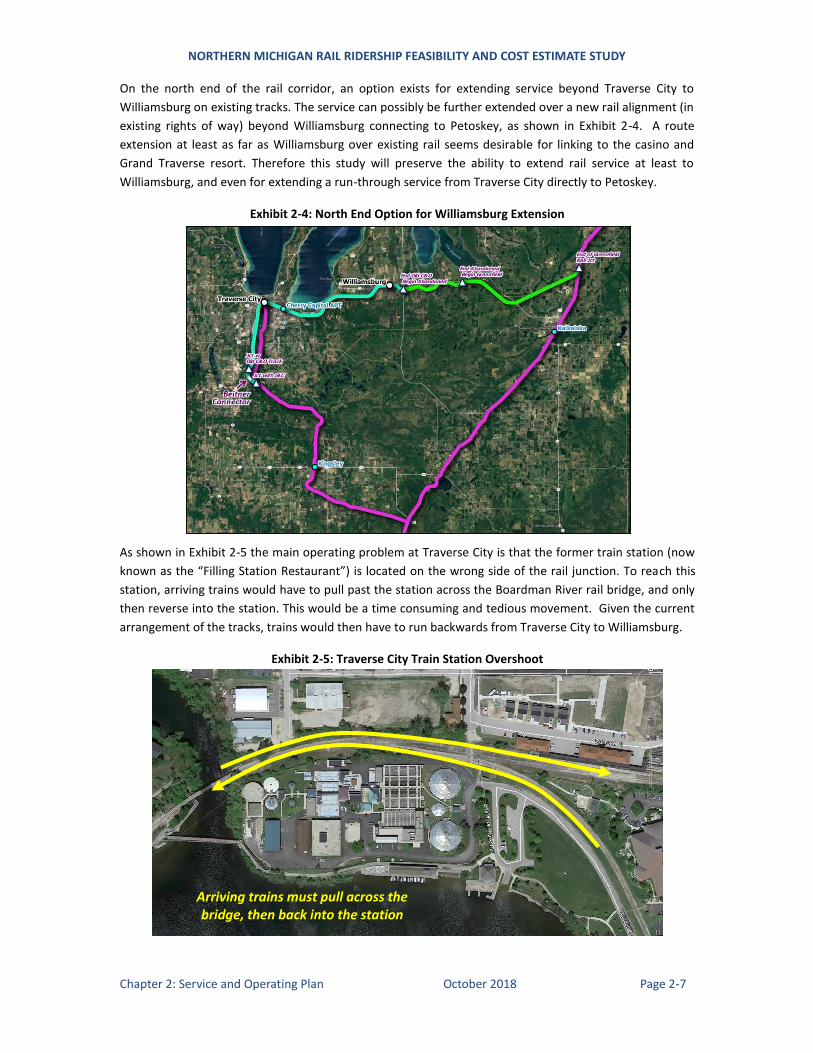
As shown in Exhibit 2-5 the main operating problem at Traverse City is that the former train station (now
known as the “Filling Station Restaurant”) is located on the wrong side of the rail junction. To reach this
station, arriving trains would have to pull past the station across the Boardman River rail bridge, and only
then reverse into the station. This would be a time consuming and tedious movement. Given the current
arrangement of the tracks, trains would then have to run backwards from Traverse City to Williamsburg.
Exhibit 2-5: Traverse City Train Station Overshoot
Arriving trains must pull across the bridge, then back into the station
NORTHERN MICHIGAN RAIL RIDERSHIP FEASIBILITY AND COST ESTIMATE STUDY
Chapter 2: Service and Operating Plan October 2018 Page 2-8
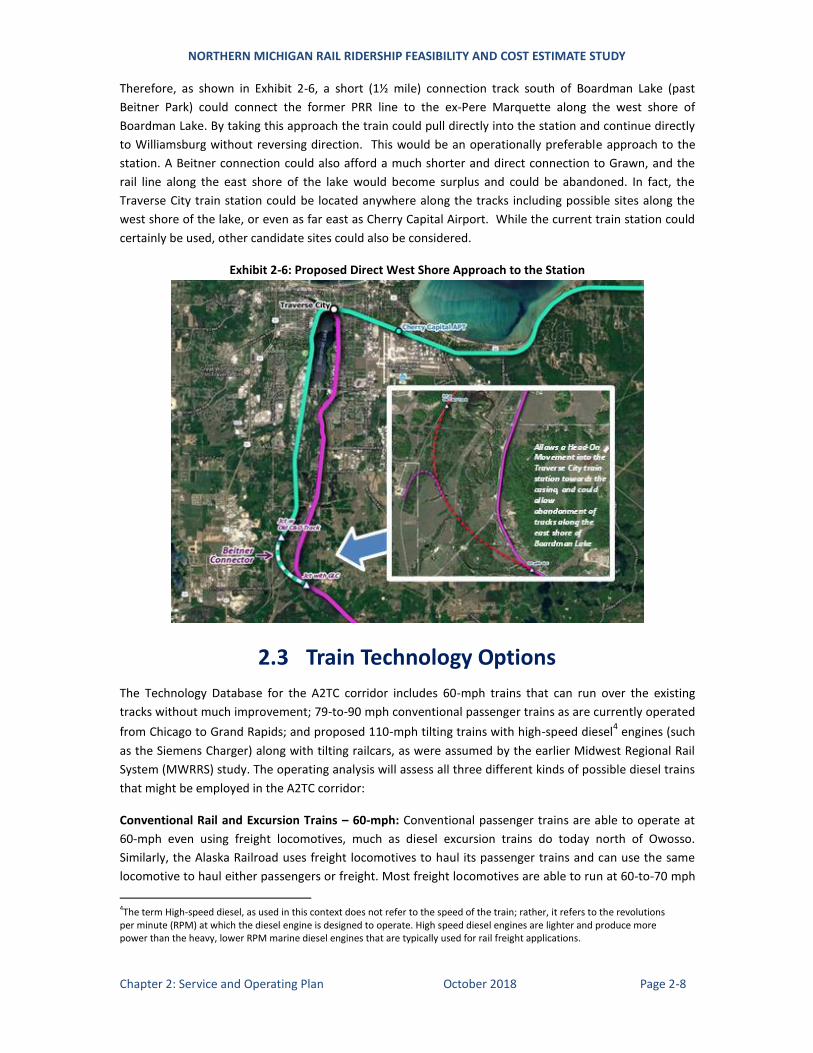
Therefore, as shown in Exhibit 2-6, a short (1½ mile) connection track south of Boardman Lake (past
Beitner Park) could connect the former PRR line to the ex-Pere Marquette along the west shore of
Boardman Lake. By taking this approach the train could pull directly into the station and continue directly
to Williamsburg without reversing direction. This would be an operationally preferable approach to the
station. A Beitner connection could also afford a much shorter and direct connection to Grawn, and the
rail line along the east shore of the lake would become surplus and could be abandoned. In fact, the
Traverse City train station could be located anywhere along the tracks including possible sites along the
west shore of the lake, or even as far east as Cherry Capital Airport. While the current train station could
certainly be used, other candidate sites could also be considered.
Exhibit 2-6: Proposed Direct West Shore Approach to the Station
2.3 Train Technology Options
The Technology Database for the A2TC corridor includes 60-mph trains that can run over the existing
tracks without much improvement; 79-to-90 mph conventional passenger trains as are currently operated
from Chicago to Grand Rapids; and proposed 110-mph tilting trains with high-speed diesel4 engines (such
as the Siemens Charger) along with tilting railcars, as were assumed by the earlier Midwest Regional Rail
System (MWRRS) study. The operating analysis will assess all three different kinds of possible diesel trains
that might be employed in the A2TC corridor:
Conventional Rail and Excursion Trains – 60-mph: Conventional passenger trains are able to operate at
60-mph even using freight locomotives, much as diesel excursion trains do today north of Owosso.
Similarly, the Alaska Railroad uses freight locomotives to haul its passenger trains and can use the same
locomotive to haul either passengers or freight. Most freight locomotives are able to run at 60-to-70 mph
4The term High-speed diesel, as used in this context does not refer to the speed of the train; rather, it refers to the revolutions per minute (RPM) at which the diesel engine is designed to operate. High speed diesel engines are lighter and produce more power than the heavy, lower RPM marine diesel engines that are typically used for rail freight applications.
NORTHERN MICHIGAN RAIL RIDERSHIP FEASIBILITY AND COST ESTIMATE STUDY
Chapter 2: Service and Operating Plan October 2018 Page 2-9
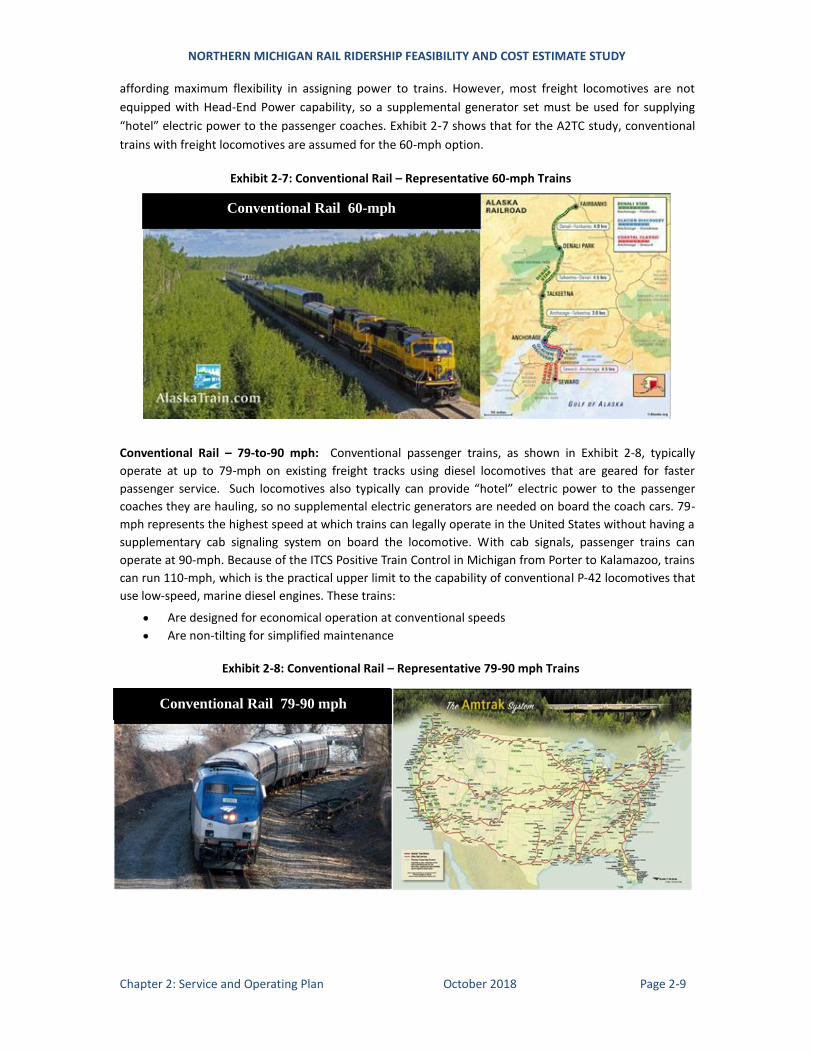
affording maximum flexibility in assigning power to trains. However, most freight locomotives are not
equipped with Head-End Power capability, so a supplemental generator set must be used for supplying
“hotel” electric power to the passenger coaches. Exhibit 2-7 shows that for the A2TC study, conventional
trains with freight locomotives are assumed for the 60-mph option.
Exhibit 2-7: Conventional Rail – Representative 60-mph Trains
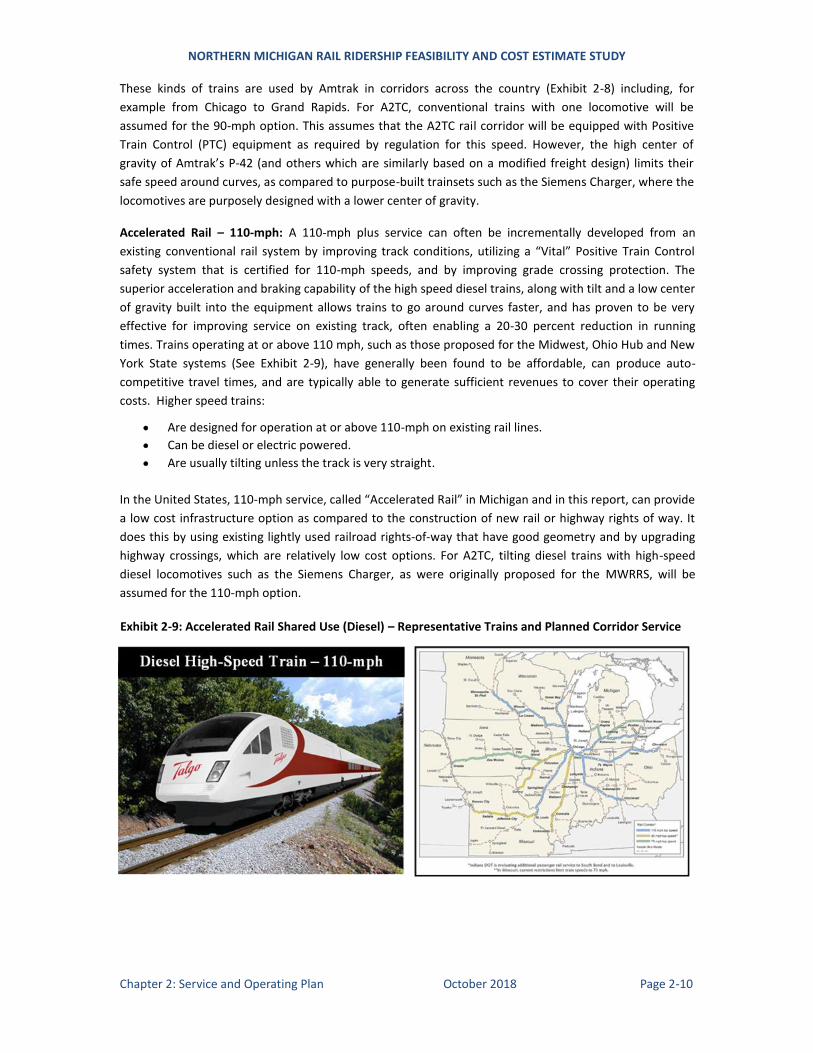
Conventional Rail – 79-to-90 mph: Conventional passenger trains, as shown in Exhibit 2-8, typically
operate at up to 79-mph on existing freight tracks using diesel locomotives that are geared for faster
passenger service. Such locomotives also typically can provide “hotel” electric power to the passenger
coaches they are hauling, so no supplemental electric generators are needed on board the coach cars. 79-
mph represents the highest speed at which trains can legally operate in the United States without having a
supplementary cab signaling system on board the locomotive. With cab signals, passenger trains can
operate at 90-mph. Because of the ITCS Positive Train Control in Michigan from Porter to Kalamazoo, trains
can run 110-mph, which is the practical upper limit to the capability of conventional P-42 locomotives that
use low-speed, marine diesel engines. These trains:
Are designed for economical operation at conventional speeds
Are non-tilting for simplified maintenance
Exhibit 2-8: Conventional Rail – Representative 79-90 mph Trains
Conventional Rail 60-mph
Conventional Rail 79-90 mph
NORTHERN MICHIGAN RAIL RIDERSHIP FEASIBILITY AND COST ESTIMATE STUDY
Chapter 2: Service and Operating Plan October 2018 Page 2-10
These kinds of trains are used by Amtrak in corridors across the country (Exhibit 2-8) including, for
example from Chicago to Grand Rapids. For A2TC, conventional trains with one locomotive will be
assumed for the 90-mph option. This assumes that the A2TC rail corridor will be equipped with Positive
Train Control (PTC) equipment as required by regulation for this speed. However, the high center of
gravity of Amtrak’s P-42 (and others which are similarly based on a modified freight design) limits their
safe speed around curves, as compared to purpose-built trainsets such as the Siemens Charger, where the
locomotives are purposely designed with a lower center of gravity.
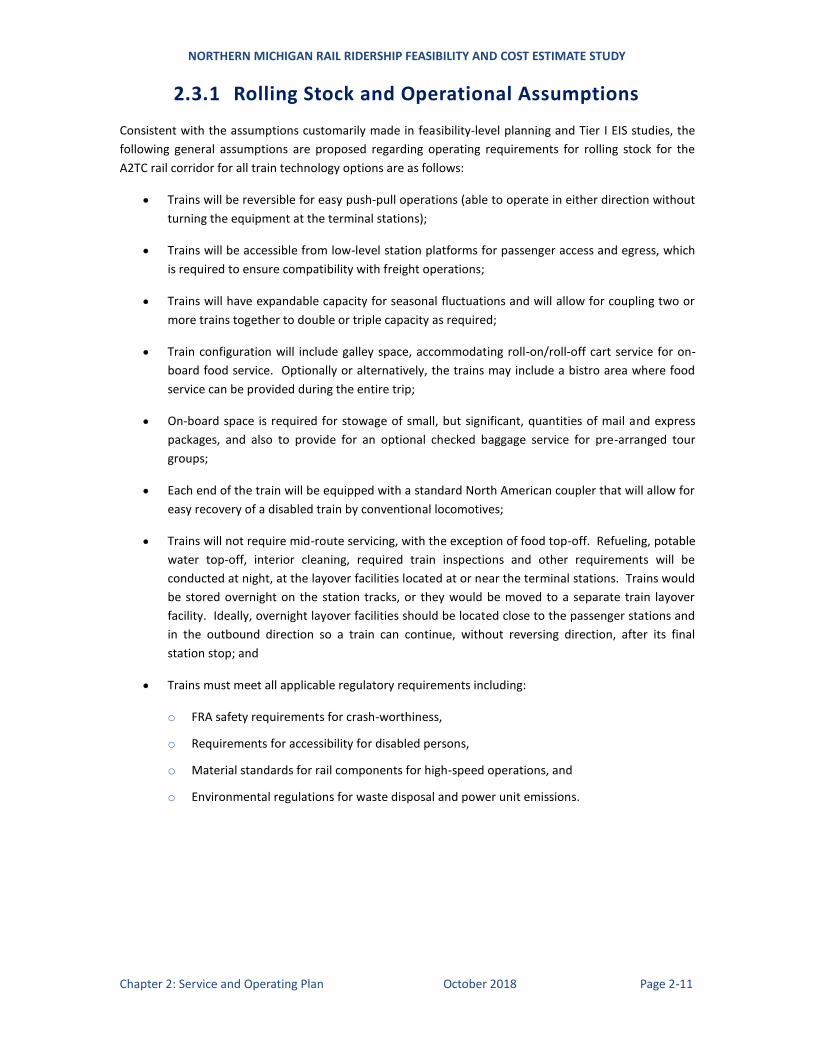
Accelerated Rail – 110-mph: A 110-mph plus service can often be incrementally developed from an
existing conventional rail system by improving track conditions, utilizing a “Vital” Positive Train Control
safety system that is certified for 110-mph speeds, and by improving grade crossing protection. The
superior acceleration and braking capability of the high speed diesel trains, along with tilt and a low center
of gravity built into the equipment allows trains to go around curves faster, and has proven to be very
effective for improving service on existing track, often enabling a 20-30 percent reduction in running
times. Trains operating at or above 110 mph, such as those proposed for the Midwest, Ohio Hub and New
York State systems (See Exhibit 2-9), have generally been found to be affordable, can produce auto-
competitive travel times, and are typically able to generate sufficient revenues to cover their operating
costs. Higher speed trains:
Are designed for operation at or above 110-mph on existing rail lines.
Can be diesel or electric powered.
Are usually tilting unless the track is very straight.
In the United States, 110-mph service, called “Accelerated Rail” in Michigan and in this report, can provide
a low cost infrastructure option as compared to the construction of new rail or highway rights of way. It
does this by using existing lightly used railroad rights-of-way that have good geometry and by upgrading
highway crossings, which are relatively low cost options. For A2TC, tilting diesel trains with high-speed
diesel locomotives such as the Siemens Charger, as were originally proposed for the MWRRS, will be
assumed for the 110-mph option.
Exhibit 2-9: Accelerated Rail Shared Use (Diesel) – Representative Trains and Planned Corridor Service
NORTHERN MICHIGAN RAIL RIDERSHIP FEASIBILITY AND COST ESTIMATE STUDY
Chapter 2: Service and Operating Plan October 2018 Page 2-11
2.3.1 Rolling Stock and Operational Assumptions
Consistent with the assumptions customarily made in feasibility-level planning and Tier I EIS studies, the
following general assumptions are proposed regarding operating requirements for rolling stock for the
A2TC rail corridor for all train technology options are as follows:
Trains will be reversible for easy push-pull operations (able to operate in either direction without
turning the equipment at the terminal stations);
Trains will be accessible from low-level station platforms for passenger access and egress, which
is required to ensure compatibility with freight operations;
Trains will have expandable capacity for seasonal fluctuations and will allow for coupling two or
more trains together to double or triple capacity as required;
Train configuration will include galley space, accommodating roll-on/roll-off cart service for on-
board food service. Optionally or alternatively, the trains may include a bistro area where food
service can be provided during the entire trip;
On-board space is required for stowage of small, but significant, quantities of mail and express
packages, and also to provide for an optional checked baggage service for pre-arranged tour
groups;
Each end of the train will be equipped with a standard North American coupler that will allow for
easy recovery of a disabled train by conventional locomotives;
Trains will not require mid-route servicing, with the exception of food top-off. Refueling, potable
water top-off, interior cleaning, required train inspections and other requirements will be
conducted at night, at the layover facilities located at or near the terminal stations. Trains would
be stored overnight on the station tracks, or they would be moved to a separate train layover
facility. Ideally, overnight layover facilities should be located close to the passenger stations and
in the outbound direction so a train can continue, without reversing direction, after its final
station stop; and
Trains must meet all applicable regulatory requirements including:
o FRA safety requirements for crash-worthiness,
o Requirements for accessibility for disabled persons,
o Material standards for rail components for high-speed operations, and
o Environmental regulations for waste disposal and power unit emissions.
NORTHERN MICHIGAN RAIL RIDERSHIP FEASIBILITY AND COST ESTIMATE STUDY
Chapter 2: Service and Operating Plan October 2018 Page 2-12
2.3.2 Train Technology Operating Characteristics
For understanding the capabilities of different rail technologies, two main criteria need to be considered –
type of propulsion and source of power:
Type of Propulsion: Trains can be either locomotive-hauled or self-propelled. Self-propelled
equipment has each individual railcar powered whereas conventional coaches rely on a separate
locomotive to provide the power.
Source of Power: Trains can be either diesel or electrically-powered. Diesel or electric power can
be used with either the locomotive hauled or self-propelled equipment options. Turbine power
has also been considered for high-speed trains, and the Rohr Turboliners in fact operated in
Michigan at one time. However, due to high fuel prices turbine power does not offer any clear
advantage over diesel at this time.
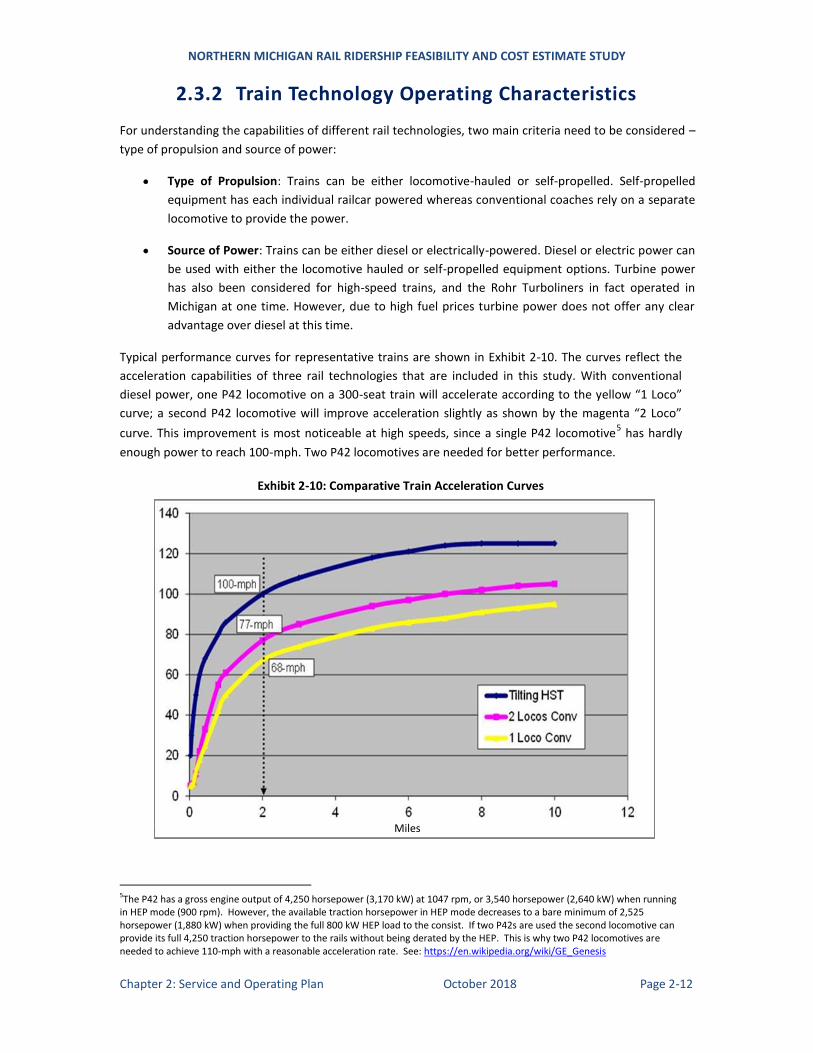
Typical performance curves for representative trains are shown in Exhibit 2-10. The curves reflect the
acceleration capabilities of three rail technologies that are included in this study. With conventional
diesel power, one P42 locomotive on a 300-seat train will accelerate according to the yellow “1 Loco”
curve; a second P42 locomotive will improve acceleration slightly as shown by the magenta “2 Loco”
curve. This improvement is most noticeable at high speeds, since a single P42 locomotive5 has hardly
enough power to reach 100-mph. Two P42 locomotives are needed for better performance.
Exhibit 2-10: Comparative Train Acceleration Curves
5The P42 has a gross engine output of 4,250 horsepower (3,170 kW) at 1047 rpm, or 3,540 horsepower (2,640 kW) when running in HEP mode (900 rpm). However, the available traction horsepower in HEP mode decreases to a bare minimum of 2,525 horsepower (1,880 kW) when providing the full 800 kW HEP load to the consist. If two P42s are used the second locomotive can provide its full 4,250 traction horsepower to the rails without being derated by the HEP. This is why two P42 locomotives are needed to achieve 110-mph with a reasonable acceleration rate. See: https://en.wikipedia.org/wiki/GE_Genesis
Miles
NORTHERN MICHIGAN RAIL RIDERSHIP FEASIBILITY AND COST ESTIMATE STUDY
Chapter 2: Service and Operating Plan October 2018 Page 2-13
However, purpose-built Diesel Trains, such as a Talgo T21 pulled by a Siemens Sprinter, can offer
considerably improved performance over conventional diesel trains that are based on freight-derived
designs. While conventional diesel trains with one locomotive can barely achieve 100-mph, and with two
locomotives are just able to achieve a maximum of 110-mph; purpose-built high-speed diesel trains have
enough power to easily reach 125-mph to 135-mph and can accelerate much faster than a conventional
diesel train. A single Siemens Sprinter can easily handle a 300-seat passenger train.
Up to about 80-mph the acceleration capability of a high-speed diesel is very similar to that of an
electric train. This is why the Maryland Commuter (MARC) service recently ordered Siemens Charger
diesel locomotives to power its trains on the Northeast Corridor6, which have until now been powered
by electric locomotives. A High Speed diesel train could even reach 130-mph or better speeds on a fully
grade separated corridor. However, it should be apparent from the above performance chart that the
capability of the high-speed diesel train, as a purpose-built passenger train, goes considerably beyond
what a conventional Amtrak train can do. Based on the acceleration curves shown in Exhibit 2-10:
Train timetables can be developed from simulated train running times and can be used to
calculate rolling stock requirements. Train frequencies and the required train seating capacity
are determined via an interactive process using the demand forecast COMPASS™ Model.
The results taken from LOCOMOTION™ will be slightly faster than actual times, since they are
based on optimized performance of trains under ideal conditions. While it is assumed that
passenger trains will have dispatching priority over freight, practical schedules still need to
allow 5-10 percent slack time in case of any kind of operating problem, including the possibility
of freight or commuter train interference, depending on the degree of track sharing with
freight. Since freight traffic on the A2TC corridor is very light, a 5 percent slack time allowance
will be added to the train running times.
2.4 Train Schedule Development
Given the development of the route options and the range of technology, operating plans can be
developed for the range of alternatives. TEMS uses an Interactive Analysis (Exhibit 1-2) that simulates the
train times on the route and technology, then develops train schedules and operating plans that include
train stopping patterns, slack time for freight train interaction and can assess train loads between each
station. The LOCOMOTION™ program reflects the different train operating characteristics (train
acceleration, curving and tilt capabilities, etc.) that are associated with the different types of train
technologies assumed as they interact with the capabilities of the rail infrastructure. In the speed profiles,
the red line shows the speed limit, and the black line shows the simulated speed actually obtained by the
train at that point.
The following subsections give the results of the LOCOMOTION™ analysis broken down by top speed and
route segment. The Traverse City branch splits from the Petoskey line at Walton Junction; however from a
train operating perspective, the nearest major station is Cadillac, approximately 20 miles south. Since no
trains are planned to stop at Walton Junction, it’s more convenient to locate the segment break at Cadillac
rather than Walton Junction. This means there will be a small overlapping segment shown in the speed
profiles, just north of Cadillac.
6MARC replacing electric locomotive fleet with high-speed diesels, August 12, 2015, see: https://www.railwayage.com/passenger/commuterregional/marc-replacing-electric-locomotive-fleet-with-high-speed-diesels/
NORTHERN MICHIGAN RAIL RIDERSHIP FEASIBILITY AND COST ESTIMATE STUDY
Chapter 2: Service and Operating Plan October 2018 Page 2-14
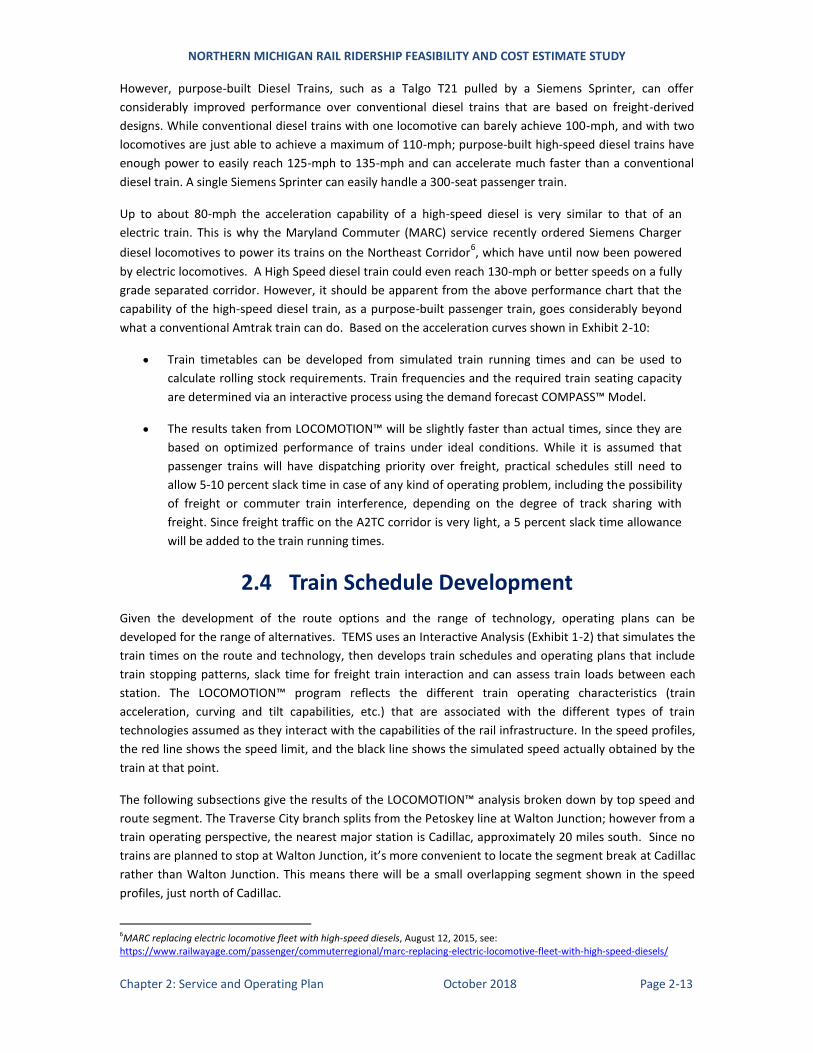
2.4.1 Petoskey to Cadillac Direct Exhibit 2-11 shows the speed profile for Petoskey to Cadillac direct service for the 60-mph service option;
Exhibit 2-12 shows the same territory using a 90-mph conventional Amtrak-style train, and Exhibit 2-13
shows the result for a tilting diesel train using Siemens Charger locomotives and a top speed of 110-mph.
Exhibit 2-11: Petoskey to Cadillac Direct at 60-mph: 1:46:30 Unimpeded Running Time
Exhibit 2-12: Petoskey to Cadillac Direct at 90-mph: 1:36:21 Unimpeded Running Time
NORTHERN MICHIGAN RAIL RIDERSHIP FEASIBILITY AND COST ESTIMATE STUDY
Chapter 2: Service and Operating Plan October 2018 Page 2-15
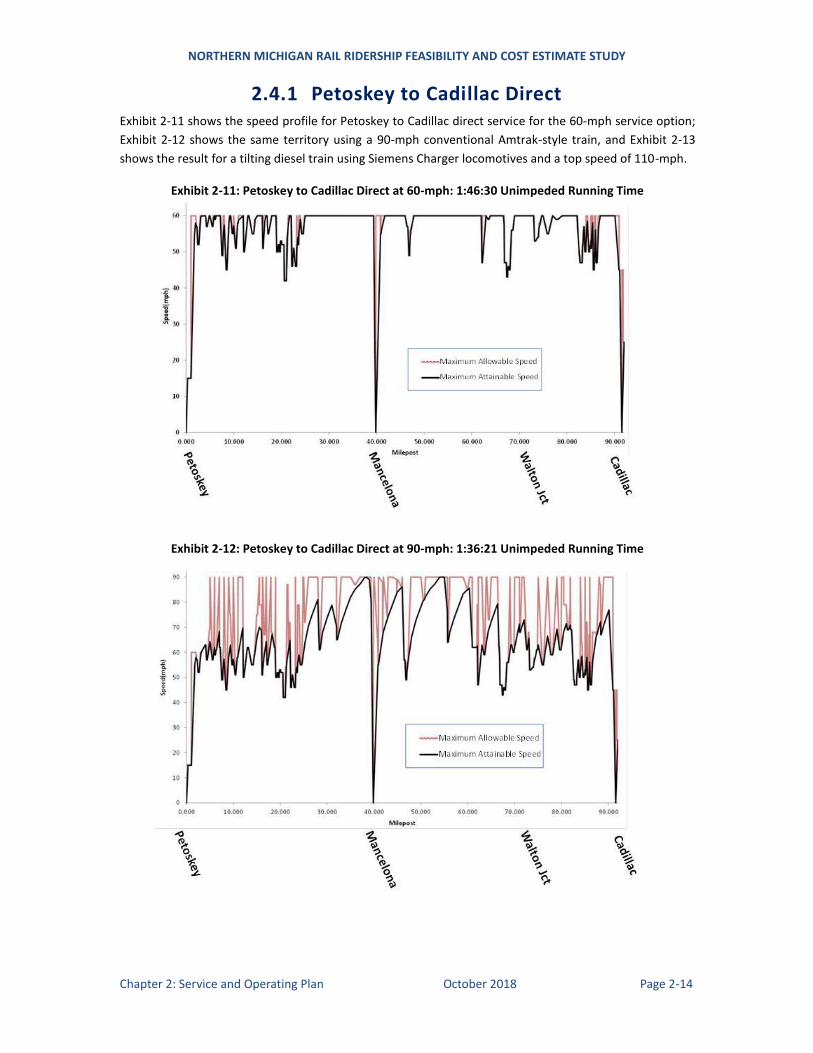
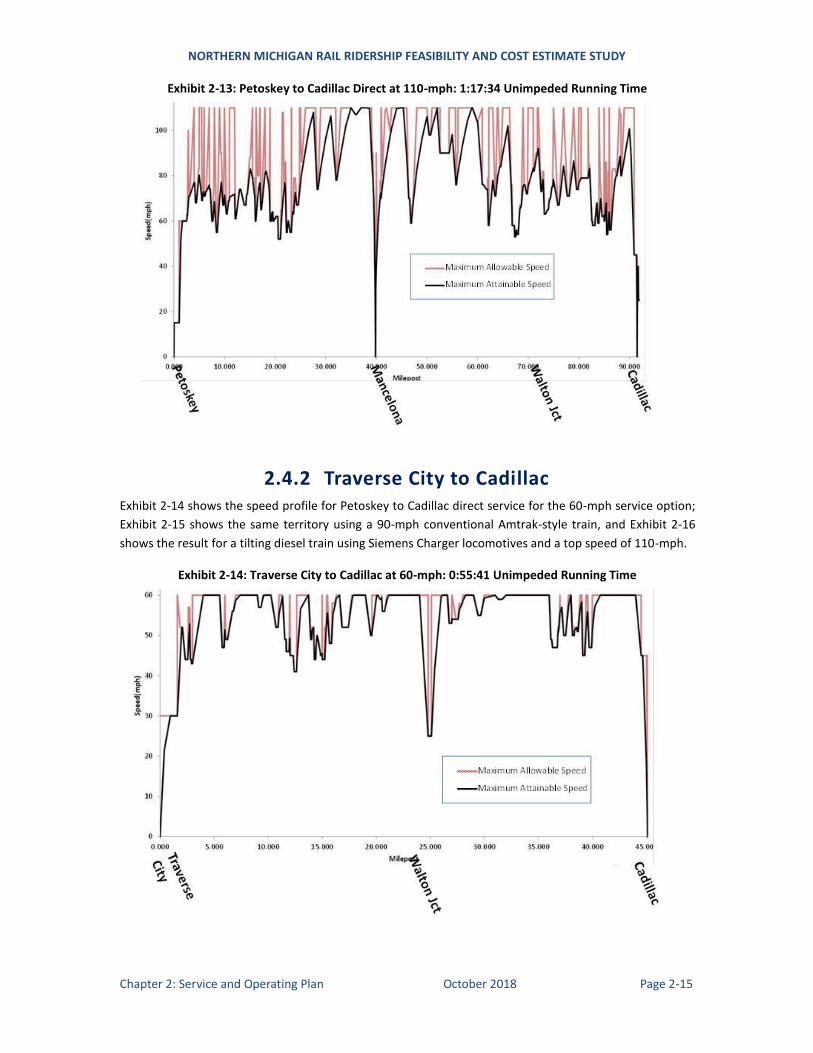
Exhibit 2-13: Petoskey to Cadillac Direct at 110-mph: 1:17:34 Unimpeded Running Time
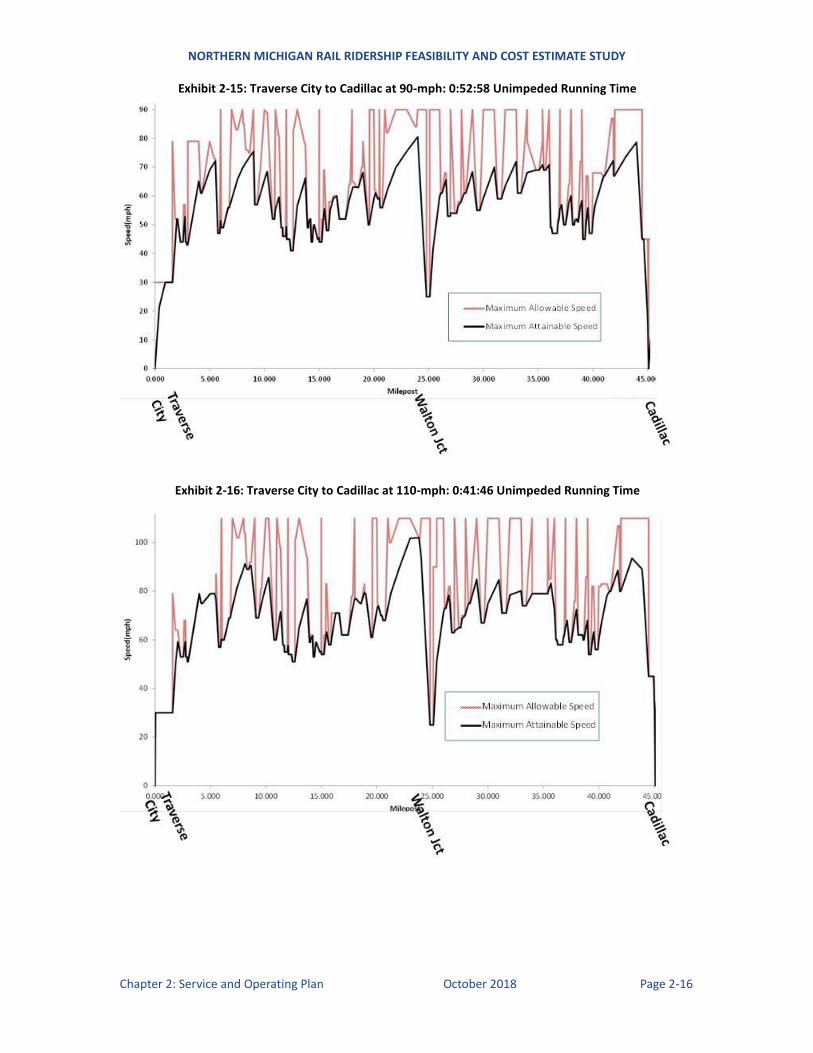
2.4.2 Traverse City to Cadillac Exhibit 2-14 shows the speed profile for Petoskey to Cadillac direct service for the 60-mph service option;
Exhibit 2-15 shows the same territory using a 90-mph conventional Amtrak-style train, and Exhibit 2-16
shows the result for a tilting diesel train using Siemens Charger locomotives and a top speed of 110-mph.
Exhibit 2-14: Traverse City to Cadillac at 60-mph: 0:55:41 Unimpeded Running Time
NORTHERN MICHIGAN RAIL RIDERSHIP FEASIBILITY AND COST ESTIMATE STUDY
Chapter 2: Service and Operating Plan October 2018 Page 2-16
Exhibit 2-15: Traverse City to Cadillac at 90-mph: 0:52:58 Unimpeded Running Time
Exhibit 2-16: Traverse City to Cadillac at 110-mph: 0:41:46 Unimpeded Running Time
NORTHERN MICHIGAN RAIL RIDERSHIP FEASIBILITY AND COST ESTIMATE STUDY
Chapter 2: Service and Operating Plan October 2018 Page 2-17
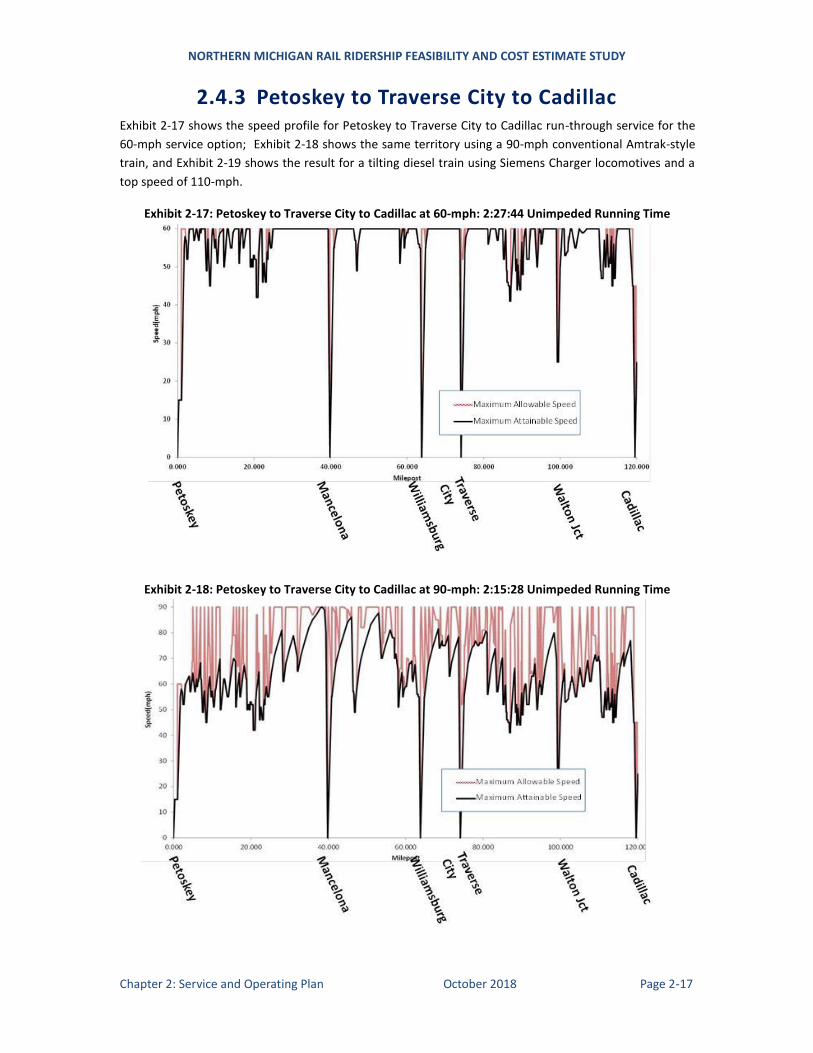
2.4.3 Petoskey to Traverse City to Cadillac Exhibit 2-17 shows the speed profile for Petoskey to Traverse City to Cadillac run-through service for the
60-mph service option; Exhibit 2-18 shows the same territory using a 90-mph conventional Amtrak-style
train, and Exhibit 2-19 shows the result for a tilting diesel train using Siemens Charger locomotives and a
top speed of 110-mph.
Exhibit 2-17: Petoskey to Traverse City to Cadillac at 60-mph: 2:27:44 Unimpeded Running Time
Exhibit 2-18: Petoskey to Traverse City to Cadillac at 90-mph: 2:15:28 Unimpeded Running Time
NORTHERN MICHIGAN RAIL RIDERSHIP FEASIBILITY AND COST ESTIMATE STUDY
Chapter 2: Service and Operating Plan October 2018 Page 2-18
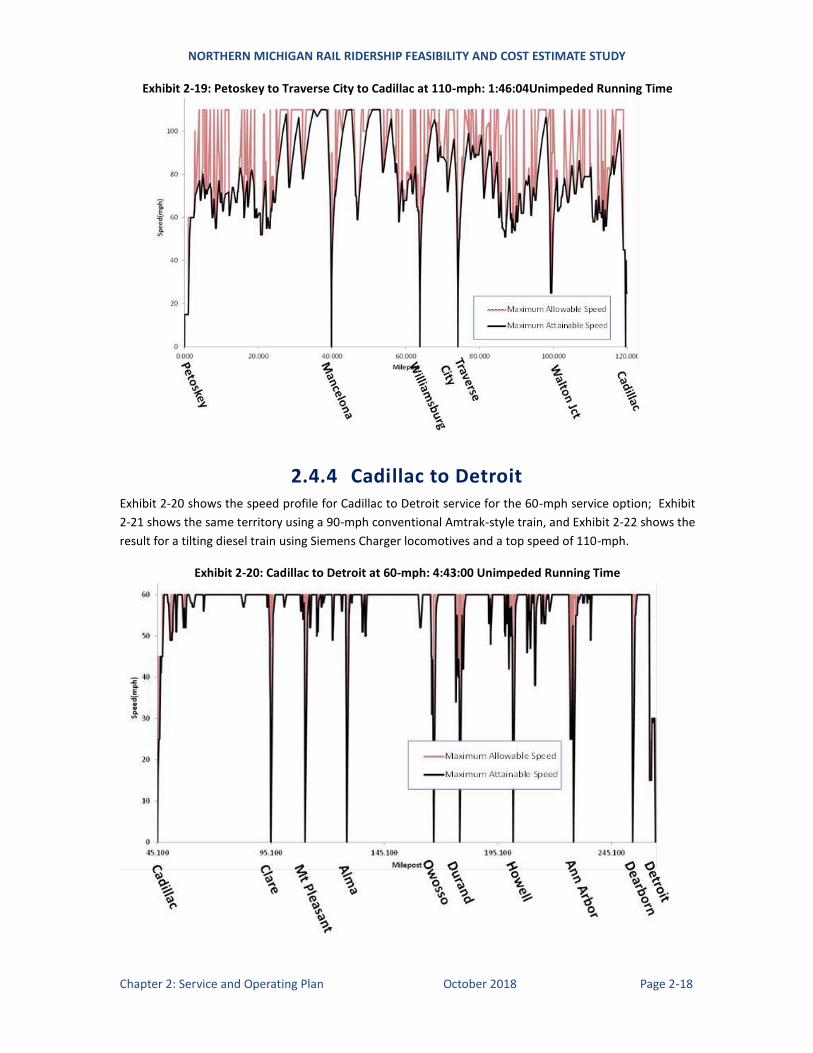
Exhibit 2-19: Petoskey to Traverse City to Cadillac at 110-mph: 1:46:04Unimpeded Running Time
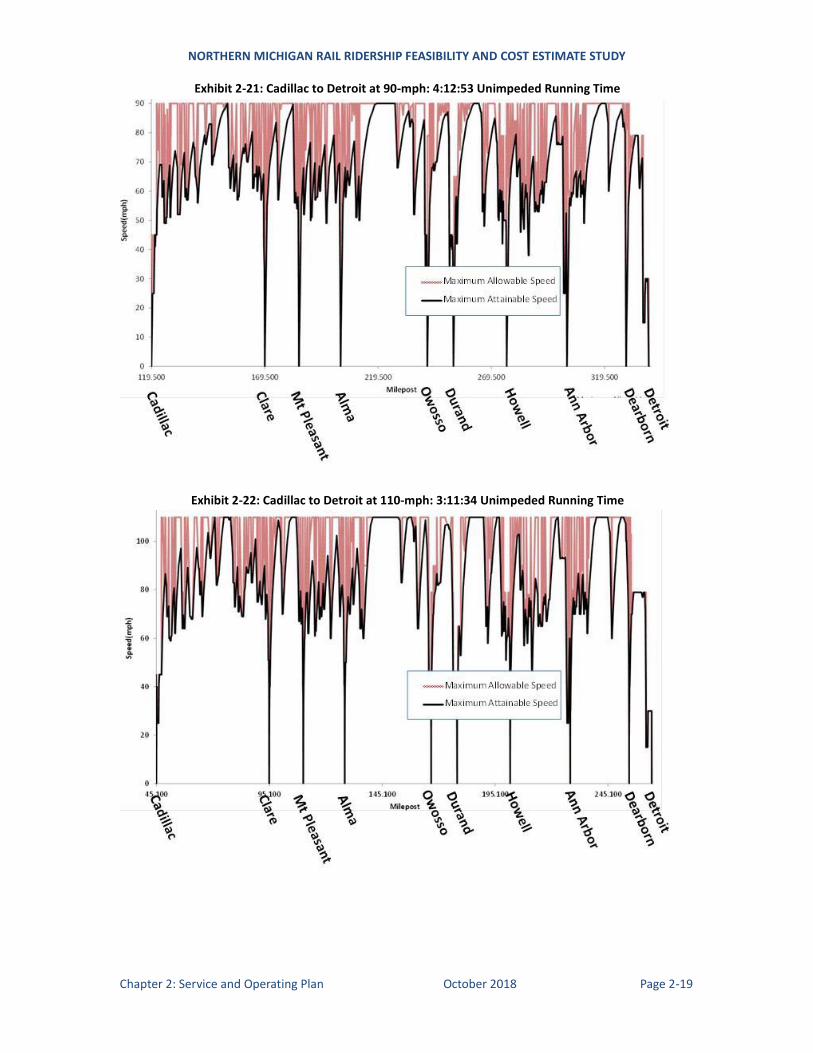
2.4.4 Cadillac to Detroit Exhibit 2-20 shows the speed profile for Cadillac to Detroit service for the 60-mph service option; Exhibit
2-21 shows the same territory using a 90-mph conventional Amtrak-style train, and Exhibit 2-22 shows the
result for a tilting diesel train using Siemens Charger locomotives and a top speed of 110-mph.
Exhibit 2-20: Cadillac to Detroit at 60-mph: 4:43:00 Unimpeded Running Time
NORTHERN MICHIGAN RAIL RIDERSHIP FEASIBILITY AND COST ESTIMATE STUDY
Chapter 2: Service and Operating Plan October 2018 Page 2-19
Exhibit 2-21: Cadillac to Detroit at 90-mph: 4:12:53 Unimpeded Running Time
Exhibit 2-22: Cadillac to Detroit at 110-mph: 3:11:34 Unimpeded Running Time
NORTHERN MICHIGAN RAIL RIDERSHIP FEASIBILITY AND COST ESTIMATE STUDY
Chapter 2: Service and Operating Plan October 2018 Page 2-20
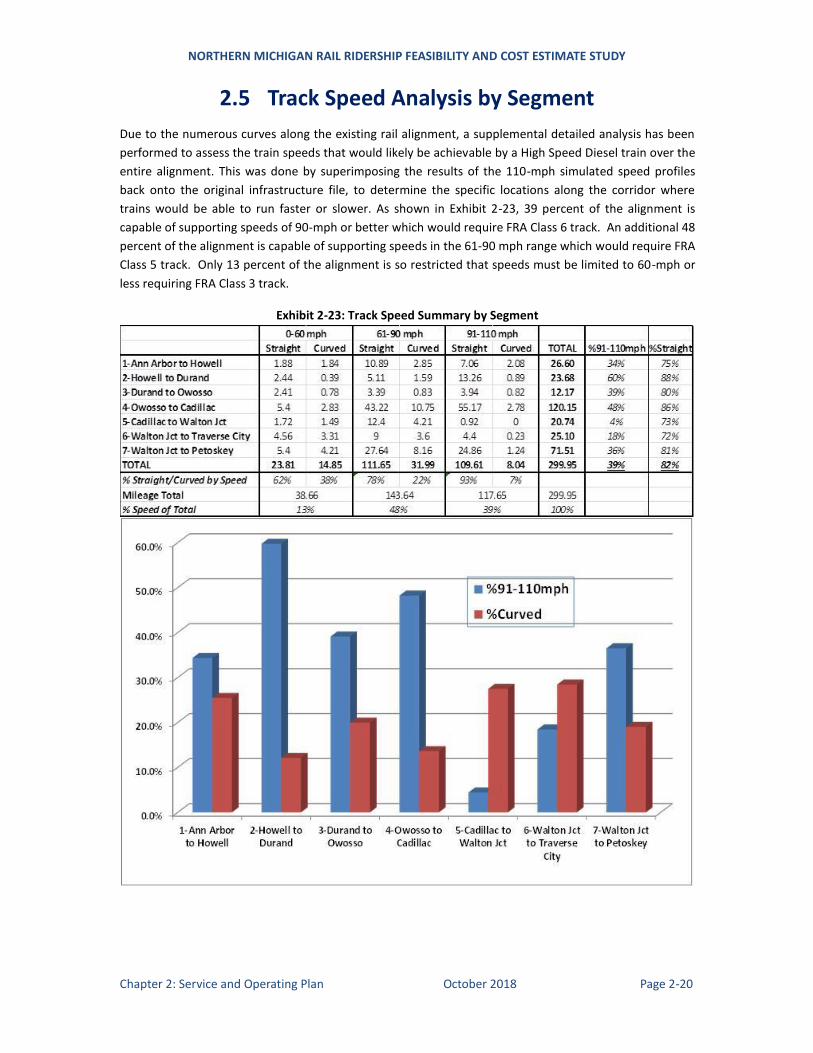
2.5 Track Speed Analysis by Segment
Due to the numerous curves along the existing rail alignment, a supplemental detailed analysis has been
performed to assess the train speeds that would likely be achievable by a High Speed Diesel train over the
entire alignment. This was done by superimposing the results of the 110-mph simulated speed profiles
back onto the original infrastructure file, to determine the specific locations along the corridor where
trains would be able to run faster or slower. As shown in Exhibit 2-23, 39 percent of the alignment is
capable of supporting speeds of 90-mph or better which would require FRA Class 6 track. An additional 48
percent of the alignment is capable of supporting speeds in the 61-90 mph range which would require FRA
Class 5 track. Only 13 percent of the alignment is so restricted that speeds must be limited to 60-mph or
less requiring FRA Class 3 track.
Exhibit 2-23: Track Speed Summary by Segment
NORTHERN MICHIGAN RAIL RIDERSHIP FEASIBILITY AND COST ESTIMATE STUDY
Chapter 2: Service and Operating Plan October 2018 Page 2-21
82 percent of the overall alignment is on straight track and 18 percent is on curves. However, the curves
are disproportionately allocated to the slower speed segments. 91-110 mph FRA Class 6 sections only
include 7 percent curved track, whereas 38 percent of the 0-60 mph FRA Class 3 track is curvy.
The Howell to Durand and Owosso to Cadillac segments of line include significant stretches where high
speed running is possible. By comparison, north of Cadillac to Walton Junction and Traverse City, curves
and other restrictions will limit train speeds. Exhibit 2-16 shows that most of the alignment north of
Cadillac to Traverse City can only support speeds in the 60-79 mph range. Farther north, Exhibit 2-16
shows some sections of track north of Walton Junction towards Petoskey that could support higher
speeds and be upgraded to Class 6 standards.
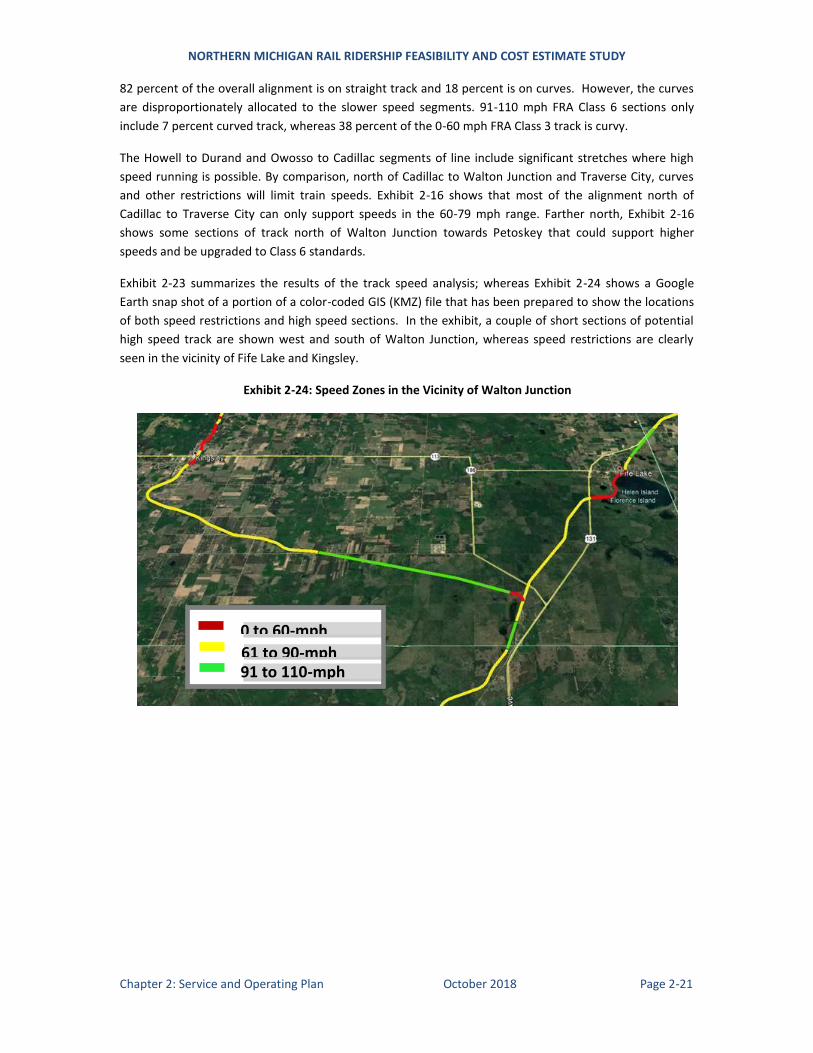
Exhibit 2-23 summarizes the results of the track speed analysis; whereas Exhibit 2-24 shows a Google
Earth snap shot of a portion of a color-coded GIS (KMZ) file that has been prepared to show the locations
of both speed restrictions and high speed sections. In the exhibit, a couple of short sections of potential
high speed track are shown west and south of Walton Junction, whereas speed restrictions are clearly
seen in the vicinity of Fife Lake and Kingsley.
Exhibit 2-24: Speed Zones in the Vicinity of Walton Junction
91 to 110-mph
0 to 60-mph
61 to 90-mph
NORTHERN MICHIGAN RAIL RIDERSHIP FEASIBILITY AND COST ESTIMATE STUDY
Chapter 2: Service and Operating Plan October 2018 Page 2-22
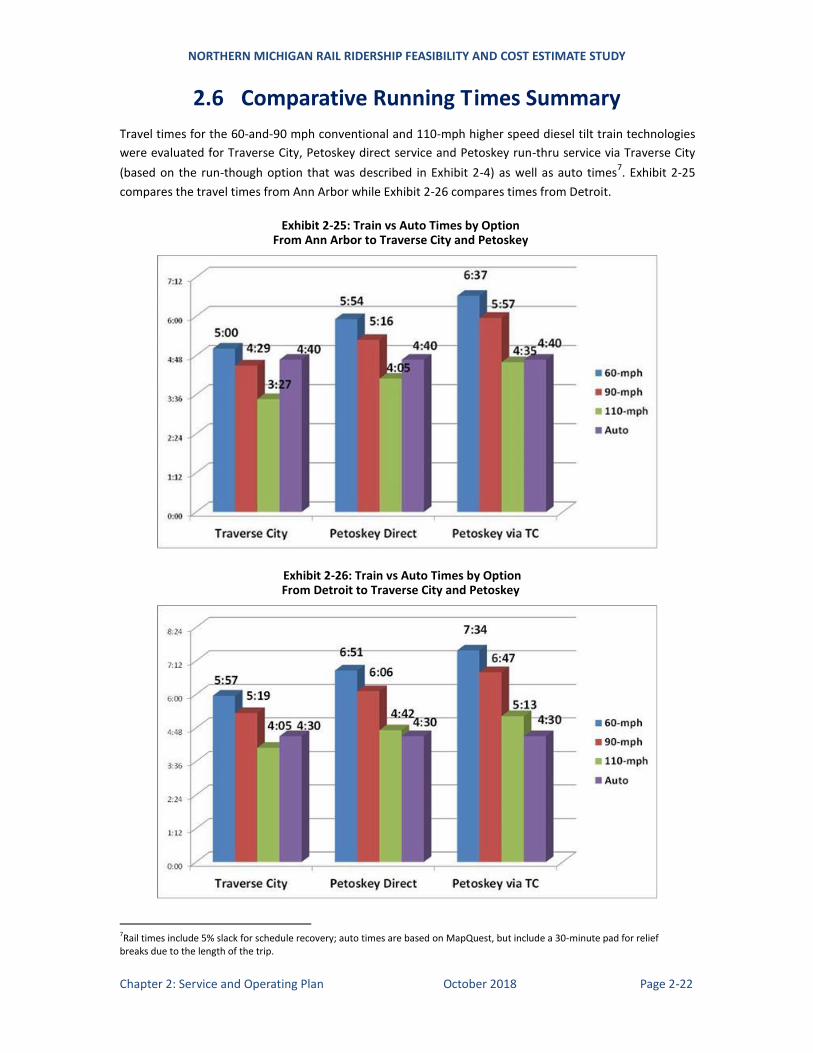
2.6 Comparative Running Times Summary
Travel times for the 60-and-90 mph conventional and 110-mph higher speed diesel tilt train technologies
were evaluated for Traverse City, Petoskey direct service and Petoskey run-thru service via Traverse City
(based on the run-though option that was described in Exhibit 2-4) as well as auto times7. Exhibit 2-25
compares the travel times from Ann Arbor while Exhibit 2-26 compares times from Detroit.
Exhibit 2-25: Train vs Auto Times by Option From Ann Arbor to Traverse City and Petoskey
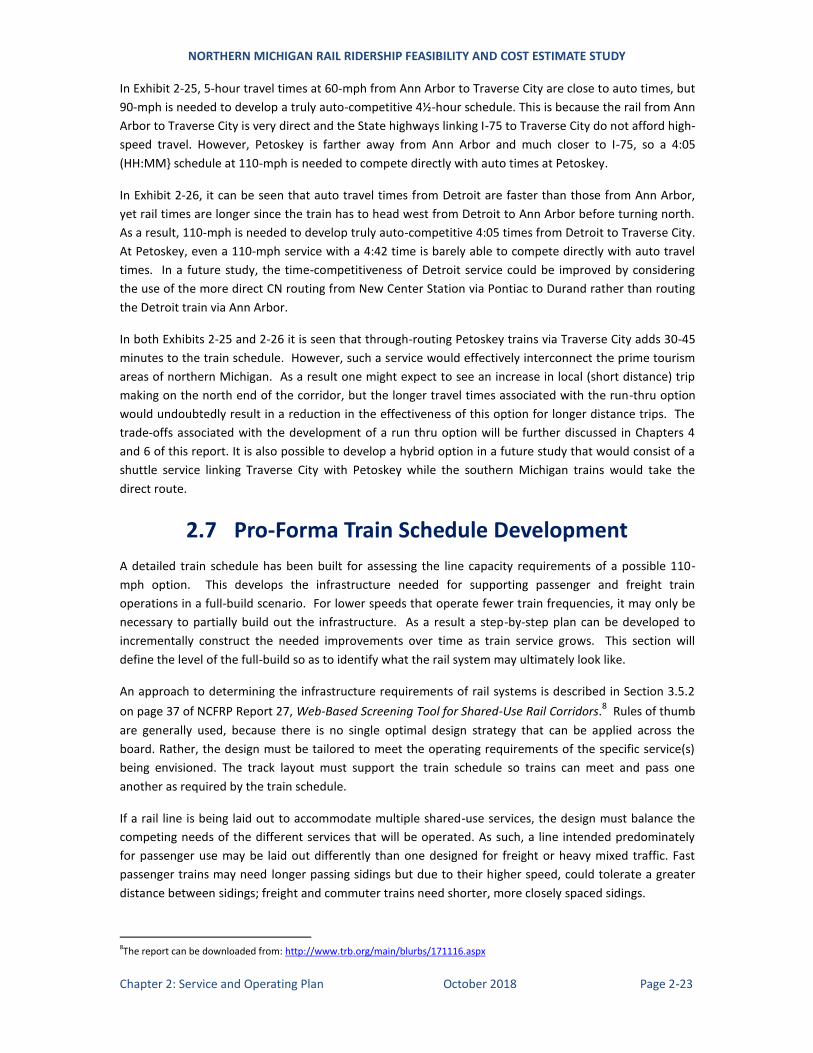
Exhibit 2-26: Train vs Auto Times by Option From Detroit to Traverse City and Petoskey
7Rail times include 5% slack for schedule recovery; auto times are based on MapQuest, but include a 30-minute pad for relief breaks due to the length of the trip.
NORTHERN MICHIGAN RAIL RIDERSHIP FEASIBILITY AND COST ESTIMATE STUDY
Chapter 2: Service and Operating Plan October 2018 Page 2-23
In Exhibit 2-25, 5-hour travel times at 60-mph from Ann Arbor to Traverse City are close to auto times, but
90-mph is needed to develop a truly auto-competitive 4½-hour schedule. This is because the rail from Ann
Arbor to Traverse City is very direct and the State highways linking I-75 to Traverse City do not afford high-
speed travel. However, Petoskey is farther away from Ann Arbor and much closer to I-75, so a 4:05
(HH:MM} schedule at 110-mph is needed to compete directly with auto times at Petoskey.
In Exhibit 2-26, it can be seen that auto travel times from Detroit are faster than those from Ann Arbor,
yet rail times are longer since the train has to head west from Detroit to Ann Arbor before turning north.
As a result, 110-mph is needed to develop truly auto-competitive 4:05 times from Detroit to Traverse City.
At Petoskey, even a 110-mph service with a 4:42 time is barely able to compete directly with auto travel
times. In a future study, the time-competitiveness of Detroit service could be improved by considering
the use of the more direct CN routing from New Center Station via Pontiac to Durand rather than routing
the Detroit train via Ann Arbor.
In both Exhibits 2-25 and 2-26 it is seen that through-routing Petoskey trains via Traverse City adds 30-45
minutes to the train schedule. However, such a service would effectively interconnect the prime tourism
areas of northern Michigan. As a result one might expect to see an increase in local (short distance) trip
making on the north end of the corridor, but the longer travel times associated with the run-thru option
would undoubtedly result in a reduction in the effectiveness of this option for longer distance trips. The
trade-offs associated with the development of a run thru option will be further discussed in Chapters 4
and 6 of this report. It is also possible to develop a hybrid option in a future study that would consist of a
shuttle service linking Traverse City with Petoskey while the southern Michigan trains would take the
direct route.
2.7 Pro-Forma Train Schedule Development
A detailed train schedule has been built for assessing the line capacity requirements of a possible 110-
mph option. This develops the infrastructure needed for supporting passenger and freight train
operations in a full-build scenario. For lower speeds that operate fewer train frequencies, it may only be
necessary to partially build out the infrastructure. As a result a step-by-step plan can be developed to
incrementally construct the needed improvements over time as train service grows. This section will
define the level of the full-build so as to identify what the rail system may ultimately look like.
An approach to determining the infrastructure requirements of rail systems is described in Section 3.5.2
on page 37 of NCFRP Report 27, Web-Based Screening Tool for Shared-Use Rail Corridors.8 Rules of thumb
are generally used, because there is no single optimal design strategy that can be applied across the
board. Rather, the design must be tailored to meet the operating requirements of the specific service(s)
being envisioned. The track layout must support the train schedule so trains can meet and pass one
another as required by the train schedule.
If a rail line is being laid out to accommodate multiple shared-use services, the design must balance the
competing needs of the different services that will be operated. As such, a line intended predominately
for passenger use may be laid out differently than one designed for freight or heavy mixed traffic. Fast
passenger trains may need longer passing sidings but due to their higher speed, could tolerate a greater
distance between sidings; freight and commuter trains need shorter, more closely spaced sidings.
8The report can be downloaded from: http://www.trb.org/main/blurbs/171116.aspx
NORTHERN MICHIGAN RAIL RIDERSHIP FEASIBILITY AND COST ESTIMATE STUDY
Chapter 2: Service and Operating Plan October 2018 Page 2-24
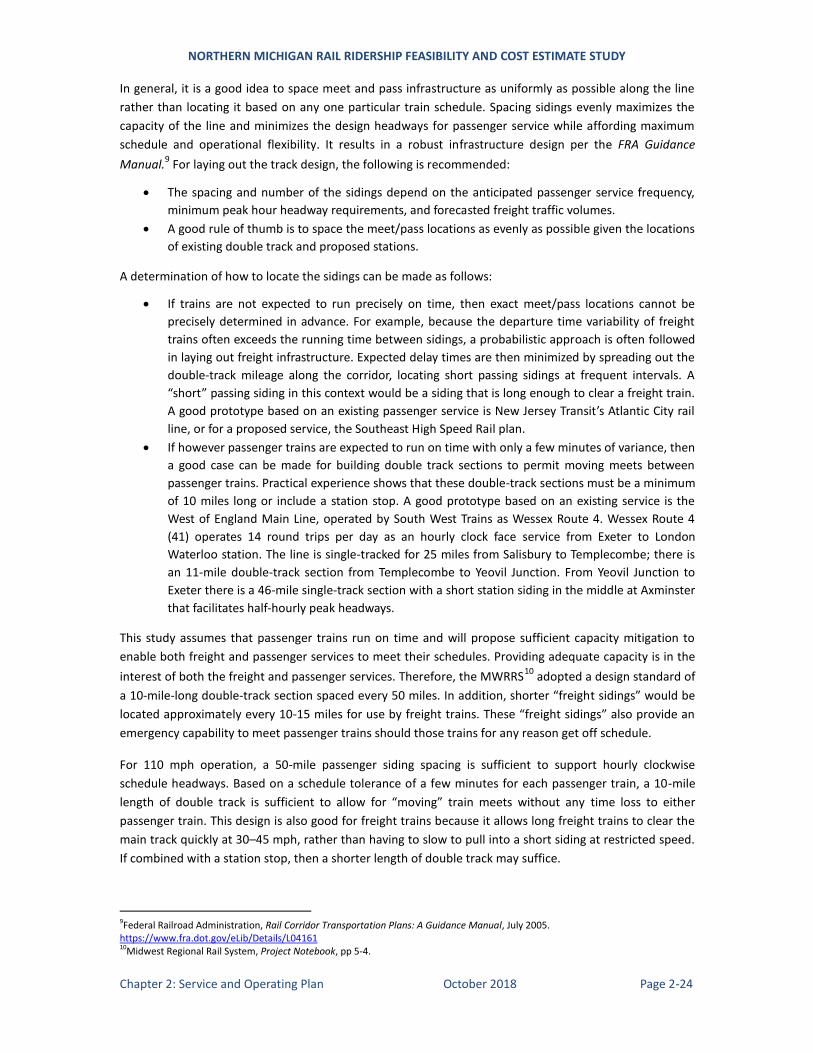
In general, it is a good idea to space meet and pass infrastructure as uniformly as possible along the line
rather than locating it based on any one particular train schedule. Spacing sidings evenly maximizes the
capacity of the line and minimizes the design headways for passenger service while affording maximum
schedule and operational flexibility. It results in a robust infrastructure design per the FRA Guidance
Manual.9 For laying out the track design, the following is recommended:
The spacing and number of the sidings depend on the anticipated passenger service frequency,
minimum peak hour headway requirements, and forecasted freight traffic volumes.
A good rule of thumb is to space the meet/pass locations as evenly as possible given the locations
of existing double track and proposed stations.
A determination of how to locate the sidings can be made as follows:
If trains are not expected to run precisely on time, then exact meet/pass locations cannot be
precisely determined in advance. For example, because the departure time variability of freight
trains often exceeds the running time between sidings, a probabilistic approach is often followed
in laying out freight infrastructure. Expected delay times are then minimized by spreading out the
double-track mileage along the corridor, locating short passing sidings at frequent intervals. A
“short” passing siding in this context would be a siding that is long enough to clear a freight train.
A good prototype based on an existing passenger service is New Jersey Transit’s Atlantic City rail
line, or for a proposed service, the Southeast High Speed Rail plan.
If however passenger trains are expected to run on time with only a few minutes of variance, then
a good case can be made for building double track sections to permit moving meets between
passenger trains. Practical experience shows that these double-track sections must be a minimum
of 10 miles long or include a station stop. A good prototype based on an existing service is the
West of England Main Line, operated by South West Trains as Wessex Route 4. Wessex Route 4
(41) operates 14 round trips per day as an hourly clock face service from Exeter to London
Waterloo station. The line is single-tracked for 25 miles from Salisbury to Templecombe; there is
an 11-mile double-track section from Templecombe to Yeovil Junction. From Yeovil Junction to
Exeter there is a 46-mile single-track section with a short station siding in the middle at Axminster
that facilitates half-hourly peak headways.
This study assumes that passenger trains run on time and will propose sufficient capacity mitigation to
enable both freight and passenger services to meet their schedules. Providing adequate capacity is in the
interest of both the freight and passenger services. Therefore, the MWRRS10
adopted a design standard of
a 10-mile-long double-track section spaced every 50 miles. In addition, shorter “freight sidings” would be
located approximately every 10-15 miles for use by freight trains. These “freight sidings” also provide an
emergency capability to meet passenger trains should those trains for any reason get off schedule.
For 110 mph operation, a 50-mile passenger siding spacing is sufficient to support hourly clockwise
schedule headways. Based on a schedule tolerance of a few minutes for each passenger train, a 10-mile
length of double track is sufficient to allow for “moving” train meets without any time loss to either
passenger train. This design is also good for freight trains because it allows long freight trains to clear the
main track quickly at 30–45 mph, rather than having to slow to pull into a short siding at restricted speed.
If combined with a station stop, then a shorter length of double track may suffice.
9Federal Railroad Administration, Rail Corridor Transportation Plans: A Guidance Manual, July 2005. https://www.fra.dot.gov/eLib/Details/L04161 10Midwest Regional Rail System, Project Notebook, pp 5-4.
NORTHERN MICHIGAN RAIL RIDERSHIP FEASIBILITY AND COST ESTIMATE STUDY
Chapter 2: Service and Operating Plan October 2018 Page 2-25
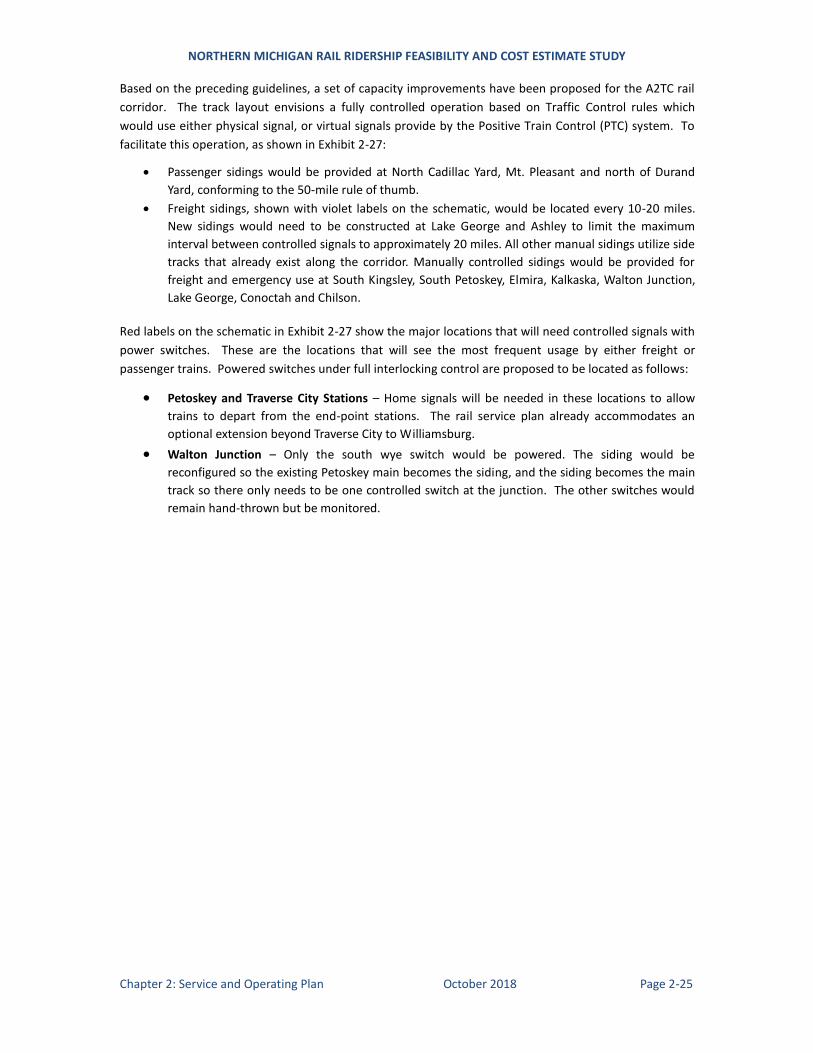
Based on the preceding guidelines, a set of capacity improvements have been proposed for the A2TC rail
corridor. The track layout envisions a fully controlled operation based on Traffic Control rules which
would use either physical signal, or virtual signals provide by the Positive Train Control (PTC) system. To
facilitate this operation, as shown in Exhibit 2-27:
Passenger sidings would be provided at North Cadillac Yard, Mt. Pleasant and north of Durand
Yard, conforming to the 50-mile rule of thumb.
Freight sidings, shown with violet labels on the schematic, would be located every 10-20 miles.
New sidings would need to be constructed at Lake George and Ashley to limit the maximum
interval between controlled signals to approximately 20 miles. All other manual sidings utilize side
tracks that already exist along the corridor. Manually controlled sidings would be provided for
freight and emergency use at South Kingsley, South Petoskey, Elmira, Kalkaska, Walton Junction,
Lake George, Conoctah and Chilson.
Red labels on the schematic in Exhibit 2-27 show the major locations that will need controlled signals with
power switches. These are the locations that will see the most frequent usage by either freight or
passenger trains. Powered switches under full interlocking control are proposed to be located as follows:
Petoskey and Traverse City Stations – Home signals will be needed in these locations to allow
trains to depart from the end-point stations. The rail service plan already accommodates an
optional extension beyond Traverse City to Williamsburg.
Walton Junction – Only the south wye switch would be powered. The siding would be
reconfigured so the existing Petoskey main becomes the siding, and the siding becomes the main
track so there only needs to be one controlled switch at the junction. The other switches would
remain hand-thrown but be monitored.
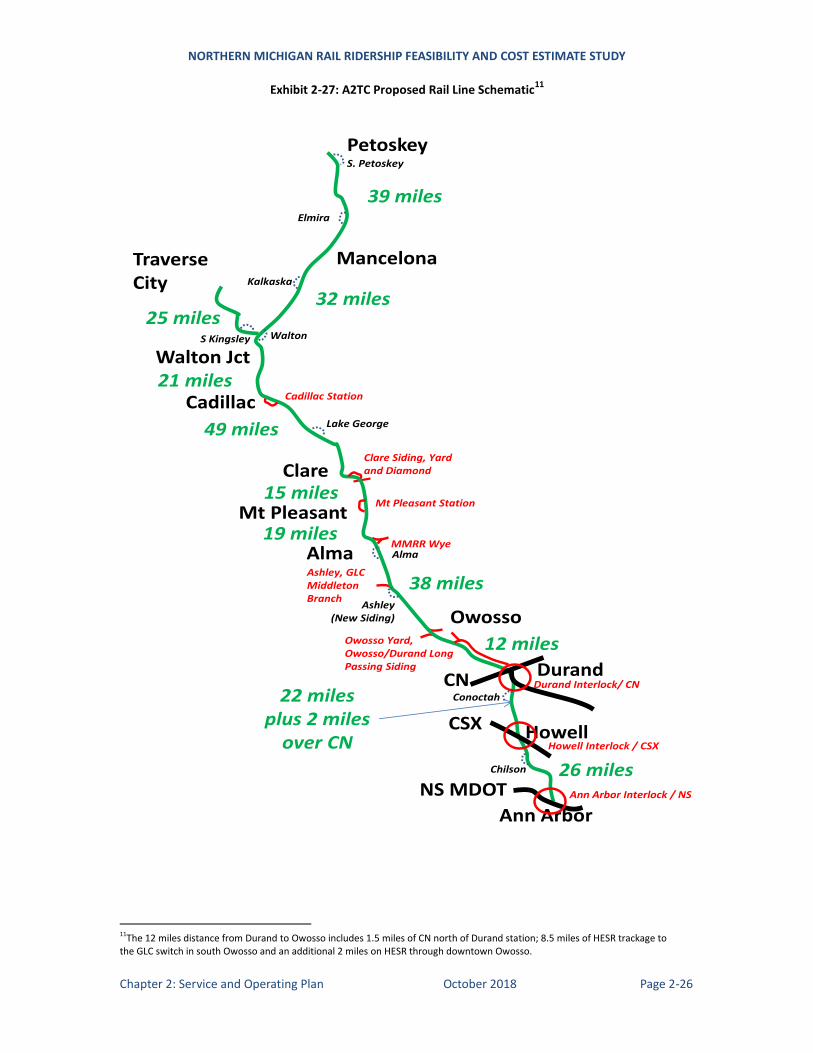
NORTHERN MICHIGAN RAIL RIDERSHIP FEASIBILITY AND COST ESTIMATE STUDY
Chapter 2: Service and Operating Plan October 2018 Page 2-26
Exhibit 2-27: A2TC Proposed Rail Line Schematic11
Petoskey
Traverse City
Walton Jct
Cadillac
Clare
Mt Pleasant
Alma
Owosso
Durand
Howell
Ann Arbor
NS MDOT
CSX
CN
26 miles
22 miles plus 2 miles
over CN
12 miles
19 miles
38 miles
15 miles
49 miles
21 miles
25 miles32 miles
Mancelona
39 miles
S. Petoskey
Elmira
Kalkaska
S Kingsley
Cadillac Station
Lake George
Walton
Clare Siding, Yard and Diamond
Mt Pleasant Station
MMRR Wye
Ashley, GLC Middleton Branch
Owosso Yard, Owosso/Durand Long Passing Siding
Durand Interlock/ CN
Howell Interlock / CSX
Ann Arbor Interlock / NS
Chilson
Ashley (New Siding)
Alma
Conoctah
11The 12 miles distance from Durand to Owosso includes 1.5 miles of CN north of Durand station; 8.5 miles of HESR trackage to the GLC switch in south Owosso and an additional 2 miles on HESR through downtown Owosso.
NORTHERN MICHIGAN RAIL RIDERSHIP FEASIBILITY AND COST ESTIMATE STUDY
Chapter 2: Service and Operating Plan October 2018 Page 2-27
North Cadillac Yard and Siding - An existing passing siding would be extended to match the
length of the yard, and power switches would be provided to provide a passenger train meeting
point here, and to allow freight trains access to both ends of the yard and siding. North Cadillac
(the former GR&I facility) would become the primary freight yard, and the passenger station may
also be located here. Passenger meets would be scheduled to occur at this station.
Cadillac Junction - A head on connection would be provided from the former GR&I to the former
AA to allow direct movement north and south from Petoskey and Traverse City. A single powered
switch would allow a direct movement north or alternatively west towards the former AA yard
and Boon branch. The west leg of the wye track would join the main line outside of the
interlocking limits and would remain hand-thrown but be monitored.
Clare Siding, Yards and Diamond - Clare is an important staging point for GLC freight. Both ends
of the existing Clare passing siding including the north access to Clare yard, which comes off the
passing siding, would be powered and interlocked. The crossing diamond at Clare also requires
signal protection which would be provided by including both tracks in the scope of the PTC
system.
Mt Pleasant Siding - Since Mt. Pleasant is located at the approximate mid-point of the corridor,
this is likely the first improvement that will need to be constructed. This siding would likely be
needed even for a 60-mph service with a single daily round trip. The existing Mt Pleasant siding
could be extended farther south to provide double platform capability and a passenger train
meet point at the Mt Pleasant train station. Switches at both ends of this siding would be
powered and interlocked.
Alma Junction - Signals and power switches would be provided for both ends of the Mid-
Michigan railroad connection.
Ashley Junction - Signals and power switches would be provided for the GLC Middleton Branch
and for new passing siding south of the junction.
North and South Owosso, Junction Switches to the Freight Yards - The main passenger would
utilize the HESR line through Owosso to bypass the freight yard area. This would require the
restoration of a former connection track between the two lines on the north side of Owosso.
Power switches and signals would be provided on both the north and south ends of Owosso to
the GLC freight yard area.
North Durand Double Tracking - It is anticipated that a double track area will extend north from
the Durand freight yard far enough to provide an effective passenger train meeting location north
of Durand. Some sections of this double track could potentially utilize portions of the former AA
abandoned roadbed which runs parallel to the HESR line in this area. Further analysis and
discussion is needed to determine how far north from Durand yard this double track segment
needs to extend. The entrance and exits to this double track area will both be provided with
signals and power switches.
Durand Yard - An existing track along the east side of the yard provides a bypass to the Durand
freight yard. This track would be interlocked and signaled through the yard. Power switches will
be provided at both ends of the freight yard and also would connect the junction with the HESR
line to Saginaw. This provides full control through the area of the freight yard and down to the CN
diamond crossing.
Durand Diamond to Pittsburg Road - This territory in the future is likely to be equipped with I-
ETMS PTC coverage. This area would likely need to be dual equipped so GLC freight trains that will
more likely use the passenger systems’ PTC system can also operate through the area. The
requirements for PTC in this area need further discussion with CN, GLC and MDOT.
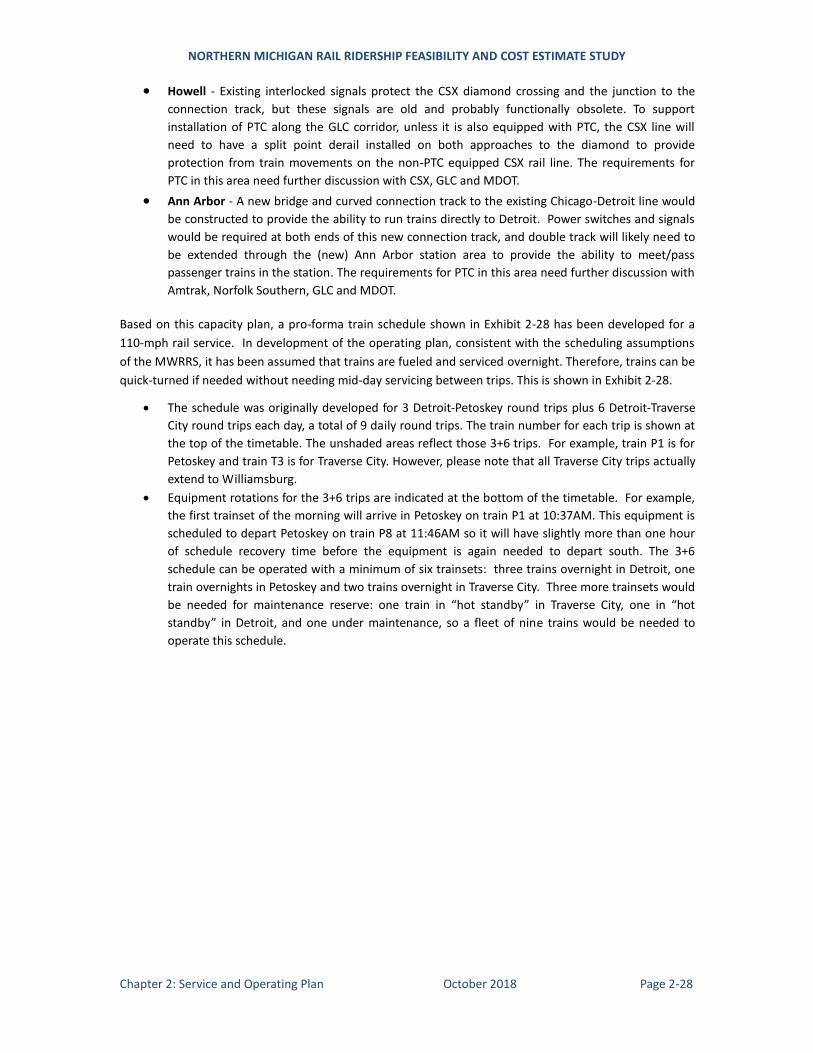
NORTHERN MICHIGAN RAIL RIDERSHIP FEASIBILITY AND COST ESTIMATE STUDY
Chapter 2: Service and Operating Plan October 2018 Page 2-28
Howell - Existing interlocked signals protect the CSX diamond crossing and the junction to the
connection track, but these signals are old and probably functionally obsolete. To support
installation of PTC along the GLC corridor, unless it is also equipped with PTC, the CSX line will
need to have a split point derail installed on both approaches to the diamond to provide
protection from train movements on the non-PTC equipped CSX rail line. The requirements for
PTC in this area need further discussion with CSX, GLC and MDOT.
Ann Arbor - A new bridge and curved connection track to the existing Chicago-Detroit line would
be constructed to provide the ability to run trains directly to Detroit. Power switches and signals
would be required at both ends of this new connection track, and double track will likely need to
be extended through the (new) Ann Arbor station area to provide the ability to meet/pass
passenger trains in the station. The requirements for PTC in this area need further discussion with
Amtrak, Norfolk Southern, GLC and MDOT.
Based on this capacity plan, a pro-forma train schedule shown in Exhibit 2-28 has been developed for a
110-mph rail service. In development of the operating plan, consistent with the scheduling assumptions
of the MWRRS, it has been assumed that trains are fueled and serviced overnight. Therefore, trains can be
quick-turned if needed without needing mid-day servicing between trips. This is shown in Exhibit 2-28.
The schedule was originally developed for 3 Detroit-Petoskey round trips plus 6 Detroit-Traverse
City round trips each day, a total of 9 daily round trips. The train number for each trip is shown at
the top of the timetable. The unshaded areas reflect those 3+6 trips. For example, train P1 is for
Petoskey and train T3 is for Traverse City. However, please note that all Traverse City trips actually
extend to Williamsburg.
Equipment rotations for the 3+6 trips are indicated at the bottom of the timetable. For example,
the first trainset of the morning will arrive in Petoskey on train P1 at 10:37AM. This equipment is
scheduled to depart Petoskey on train P8 at 11:46AM so it will have slightly more than one hour
of schedule recovery time before the equipment is again needed to depart south. The 3+6
schedule can be operated with a minimum of six trainsets: three trains overnight in Detroit, one
train overnights in Petoskey and two trains overnight in Traverse City. Three more trainsets would
be needed for maintenance reserve: one train in “hot standby” in Traverse City, one in “hot
standby” in Detroit, and one under maintenance, so a fleet of nine trains would be needed to
operate this schedule.
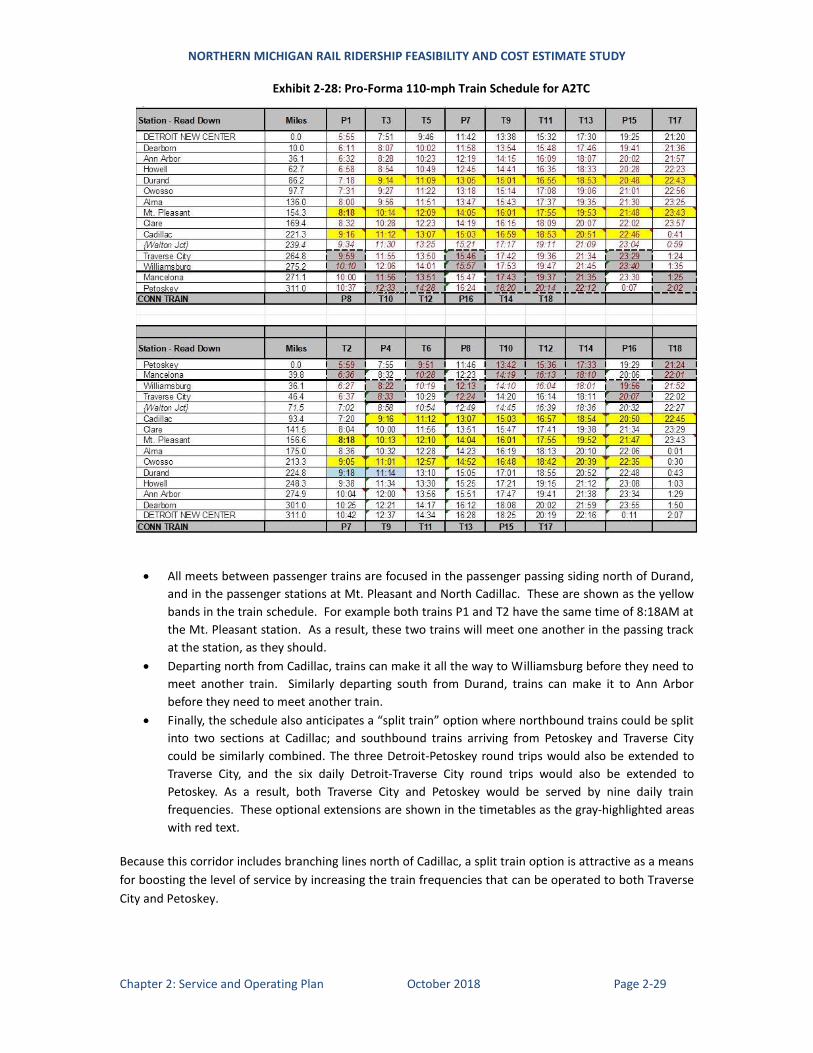
NORTHERN MICHIGAN RAIL RIDERSHIP FEASIBILITY AND COST ESTIMATE STUDY
Chapter 2: Service and Operating Plan October 2018 Page 2-29
Exhibit 2-28: Pro-Forma 110-mph Train Schedule for A2TC
All meets between passenger trains are focused in the passenger passing siding north of Durand,
and in the passenger stations at Mt. Pleasant and North Cadillac. These are shown as the yellow
bands in the train schedule. For example both trains P1 and T2 have the same time of 8:18AM at
the Mt. Pleasant station. As a result, these two trains will meet one another in the passing track
at the station, as they should.
Departing north from Cadillac, trains can make it all the way to Williamsburg before they need to
meet another train. Similarly departing south from Durand, trains can make it to Ann Arbor
before they need to meet another train.
Finally, the schedule also anticipates a “split train” option where northbound trains could be split
into two sections at Cadillac; and southbound trains arriving from Petoskey and Traverse City
could be similarly combined. The three Detroit-Petoskey round trips would also be extended to
Traverse City, and the six daily Detroit-Traverse City round trips would also be extended to
Petoskey. As a result, both Traverse City and Petoskey would be served by nine daily train
frequencies. These optional extensions are shown in the timetables as the gray-highlighted areas
with red text.
Because this corridor includes branching lines north of Cadillac, a split train option is attractive as a means
for boosting the level of service by increasing the train frequencies that can be operated to both Traverse
City and Petoskey.
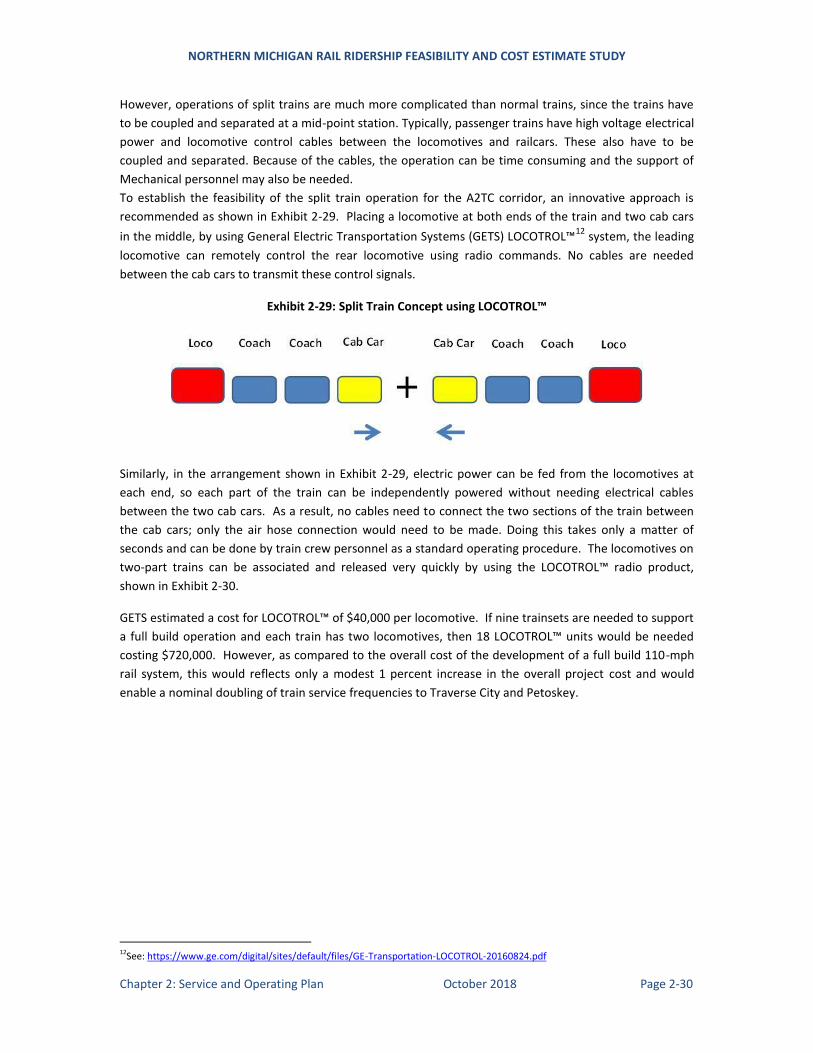
NORTHERN MICHIGAN RAIL RIDERSHIP FEASIBILITY AND COST ESTIMATE STUDY
Chapter 2: Service and Operating Plan October 2018 Page 2-30
However, operations of split trains are much more complicated than normal trains, since the trains have
to be coupled and separated at a mid-point station. Typically, passenger trains have high voltage electrical
power and locomotive control cables between the locomotives and railcars. These also have to be
coupled and separated. Because of the cables, the operation can be time consuming and the support of
Mechanical personnel may also be needed.
To establish the feasibility of the split train operation for the A2TC corridor, an innovative approach is
recommended as shown in Exhibit 2-29. Placing a locomotive at both ends of the train and two cab cars
in the middle, by using General Electric Transportation Systems (GETS) LOCOTROL™12
system, the leading
locomotive can remotely control the rear locomotive using radio commands. No cables are needed
between the cab cars to transmit these control signals.
Exhibit 2-29: Split Train Concept using LOCOTROL™
Similarly, in the arrangement shown in Exhibit 2-29, electric power can be fed from the locomotives at
each end, so each part of the train can be independently powered without needing electrical cables
between the two cab cars. As a result, no cables need to connect the two sections of the train between
the cab cars; only the air hose connection would need to be made. Doing this takes only a matter of
seconds and can be done by train crew personnel as a standard operating procedure. The locomotives on
two-part trains can be associated and released very quickly by using the LOCOTROL™ radio product,
shown in Exhibit 2-30.
GETS estimated a cost for LOCOTROL™ of $40,000 per locomotive. If nine trainsets are needed to support
a full build operation and each train has two locomotives, then 18 LOCOTROL™ units would be needed
costing $720,000. However, as compared to the overall cost of the development of a full build 110-mph
rail system, this would reflects only a modest 1 percent increase in the overall project cost and would
enable a nominal doubling of train service frequencies to Traverse City and Petoskey.
12See: https://www.ge.com/digital/sites/default/files/GE-Transportation-LOCOTROL-20160824.pdf
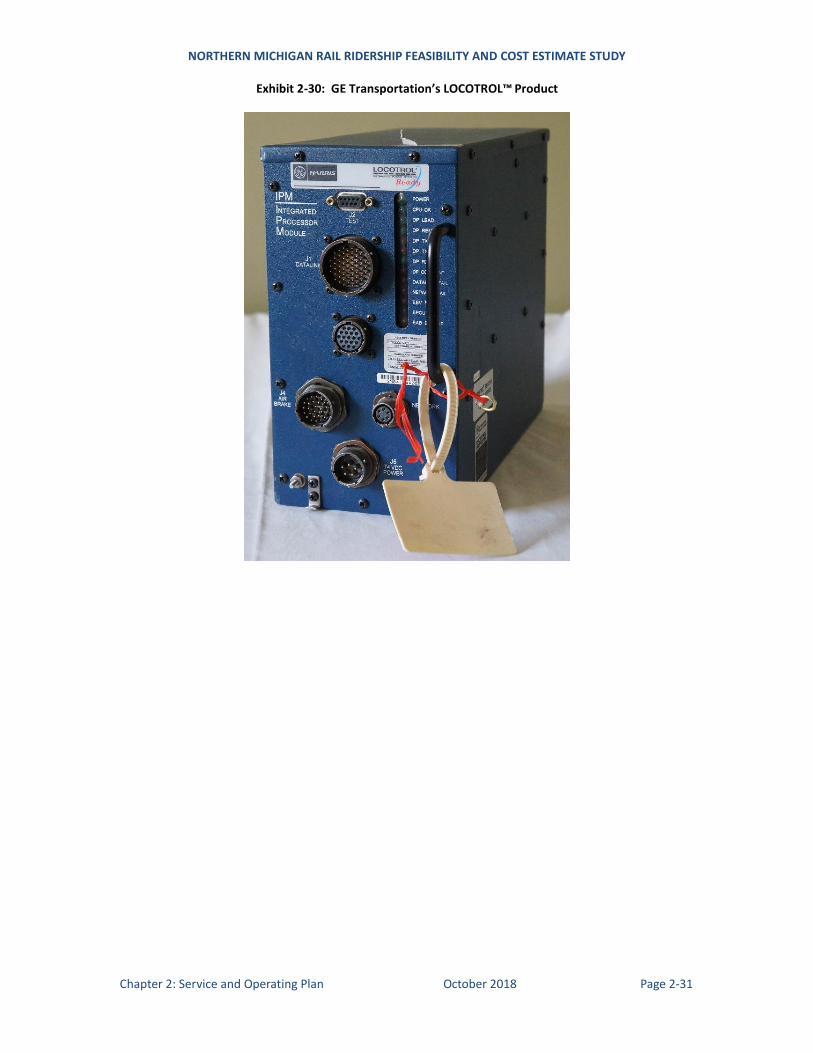
NORTHERN MICHIGAN RAIL RIDERSHIP FEASIBILITY AND COST ESTIMATE STUDY
Chapter 2: Service and Operating Plan October 2018 Page 2-31
Exhibit 2-30: GE Transportation’s LOCOTROL™ Product

NORTHERN MICHIGAN RAIL RIDERSHIP FEASIBILITY AND COST ESTIMATE STUDY
Chapter 2: Service and Operating Plan October 2018 Page 2-32
This page intentionally left blank
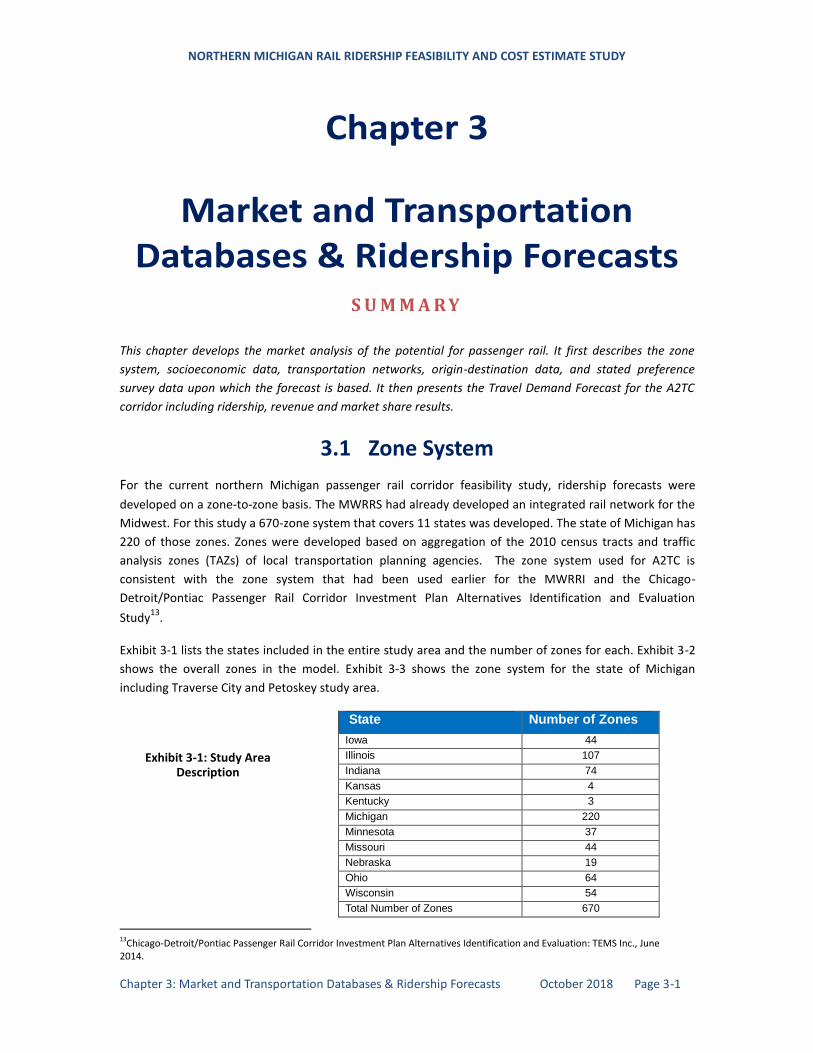
NORTHERN MICHIGAN RAIL RIDERSHIP FEASIBILITY AND COST ESTIMATE STUDY
Chapter 3: Market and Transportation Databases & Ridership Forecasts October 2018 Page 3-1
Chapter 3
Market and Transportation Databases & Ridership Forecasts
S U M M A R Y
This chapter develops the market analysis of the potential for passenger rail. It first describes the zone
system, socioeconomic data, transportation networks, origin-destination data, and stated preference
survey data upon which the forecast is based. It then presents the Travel Demand Forecast for the A2TC
corridor including ridership, revenue and market share results.
3.1 Zone System
For the current northern Michigan passenger rail corridor feasibility study, ridership forecasts were
developed on a zone-to-zone basis. The MWRRS had already developed an integrated rail network for the
Midwest. For this study a 670-zone system that covers 11 states was developed. The state of Michigan has
220 of those zones. Zones were developed based on aggregation of the 2010 census tracts and traffic
analysis zones (TAZs) of local transportation planning agencies. The zone system used for A2TC is
consistent with the zone system that had been used earlier for the MWRRI and the Chicago-
Detroit/Pontiac Passenger Rail Corridor Investment Plan Alternatives Identification and Evaluation
Study13
.
Exhibit 3-1 lists the states included in the entire study area and the number of zones for each. Exhibit 3-2
shows the overall zones in the model. Exhibit 3-3 shows the zone system for the state of Michigan
including Traverse City and Petoskey study area.
State Number of Zones
Iowa 44
Illinois 107
Indiana 74
Kansas 4
Kentucky 3
Michigan 220
Minnesota 37
Missouri 44
Nebraska 19
Ohio 64
Wisconsin 54
Total Number of Zones 670
13Chicago-Detroit/Pontiac Passenger Rail Corridor Investment Plan Alternatives Identification and Evaluation: TEMS Inc., June 2014.
Exhibit 3-1: Study Area Description
NORTHERN MICHIGAN RAIL RIDERSHIP FEASIBILITY AND COST ESTIMATE STUDY
Chapter 3: Market and Transportation Databases & Ridership Forecasts October 2018 Page 3-2
This page intentionally left blank
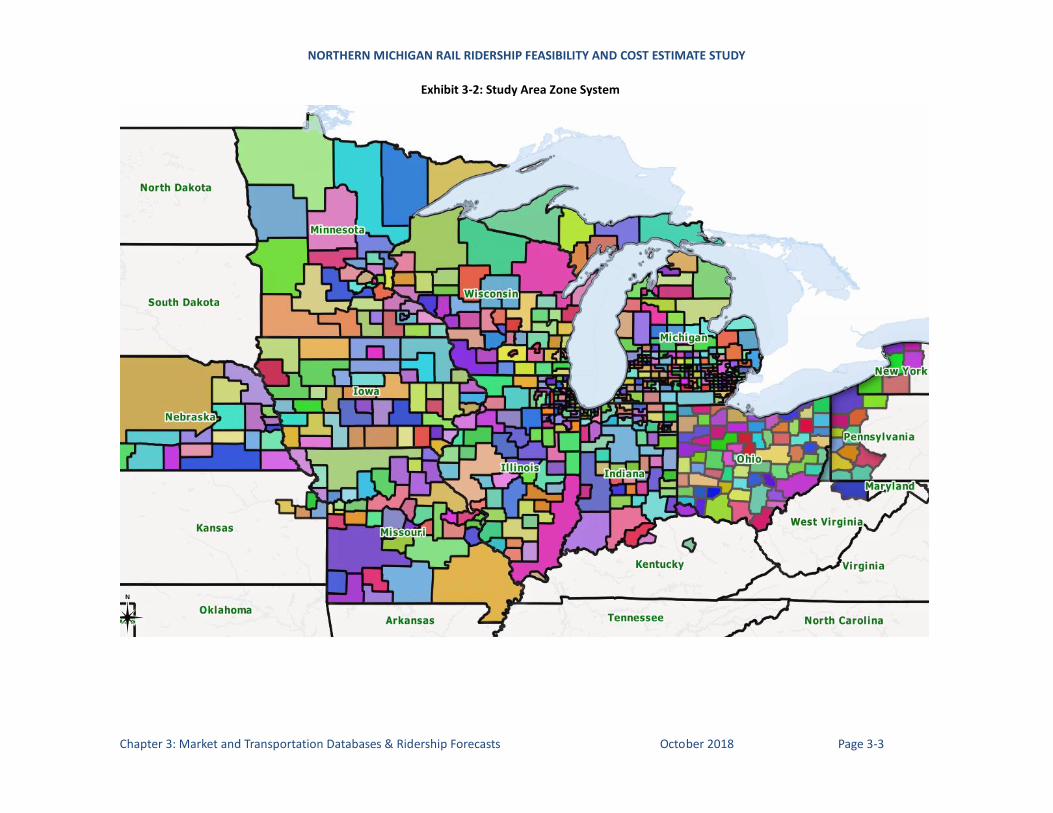
NORTHERN MICHIGAN RAIL RIDERSHIP FEASIBILITY AND COST ESTIMATE STUDY
Chapter 3: Market and Transportation Databases & Ridership Forecasts October 2018 Page 3-3
Exhibit 3-2: Study Area Zone System
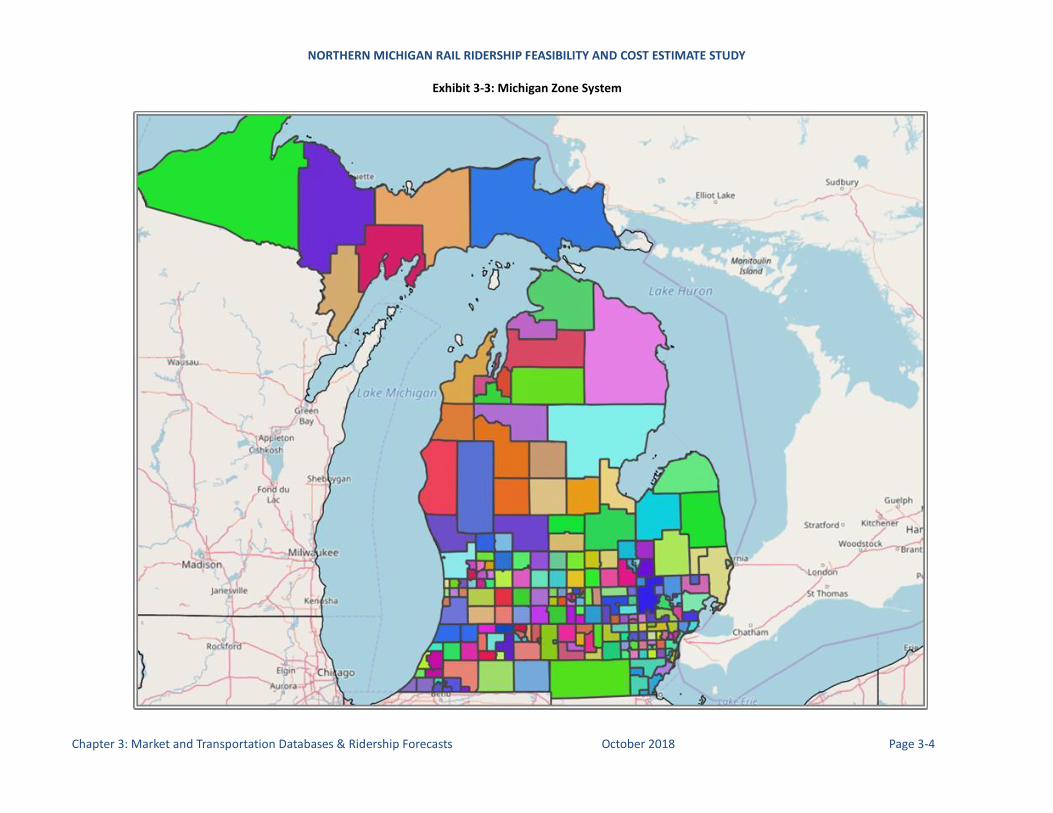
NORTHERN MICHIGAN RAIL RIDERSHIP FEASIBILITY AND COST ESTIMATE STUDY
Chapter 3: Market and Transportation Databases & Ridership Forecasts October 2018 Page 3-4
Exhibit 3-3: Michigan Zone System
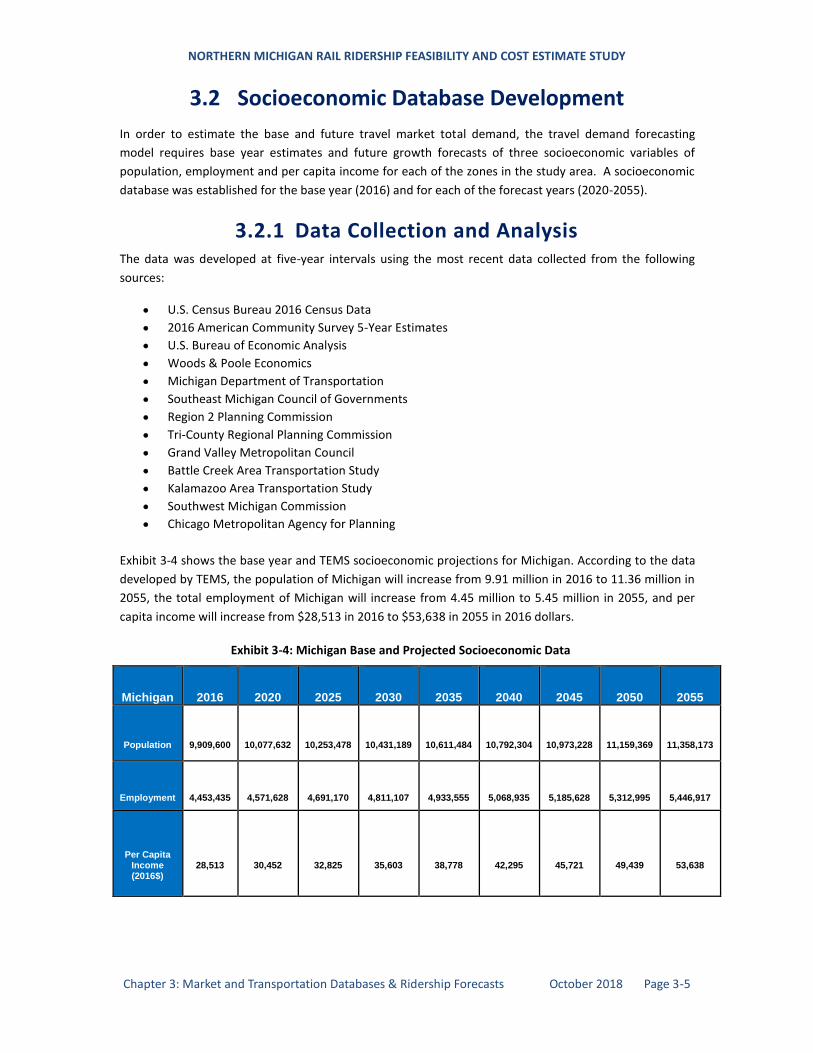
NORTHERN MICHIGAN RAIL RIDERSHIP FEASIBILITY AND COST ESTIMATE STUDY
Chapter 3: Market and Transportation Databases & Ridership Forecasts October 2018 Page 3-5
3.2 Socioeconomic Database Development
In order to estimate the base and future travel market total demand, the travel demand forecasting
model requires base year estimates and future growth forecasts of three socioeconomic variables of
population, employment and per capita income for each of the zones in the study area. A socioeconomic
database was established for the base year (2016) and for each of the forecast years (2020-2055).
3.2.1 Data Collection and Analysis The data was developed at five-year intervals using the most recent data collected from the following
sources:
U.S. Census Bureau 2016 Census Data
2016 American Community Survey 5-Year Estimates
U.S. Bureau of Economic Analysis
Woods & Poole Economics
Michigan Department of Transportation
Southeast Michigan Council of Governments
Region 2 Planning Commission
Tri-County Regional Planning Commission
Grand Valley Metropolitan Council
Battle Creek Area Transportation Study
Kalamazoo Area Transportation Study
Southwest Michigan Commission
Chicago Metropolitan Agency for Planning
Exhibit 3-4 shows the base year and TEMS socioeconomic projections for Michigan. According to the data
developed by TEMS, the population of Michigan will increase from 9.91 million in 2016 to 11.36 million in
2055, the total employment of Michigan will increase from 4.45 million to 5.45 million in 2055, and per
capita income will increase from $28,513 in 2016 to $53,638 in 2055 in 2016 dollars.
Exhibit 3-4: Michigan Base and Projected Socioeconomic Data
Michigan 2016 2020 2025 2030 2035 2040 2045 2050 2055
Population 9,909,600 10,077,632 10,253,478 10,431,189 10,611,484 10,792,304 10,973,228 11,159,369 11,358,173
Employment 4,453,435 4,571,628 4,691,170 4,811,107 4,933,555 5,068,935 5,185,628 5,312,995 5,446,917
Per Capita Income (2016$)
28,513 30,452 32,825 35,603 38,778 42,295 45,721 49,439 53,638
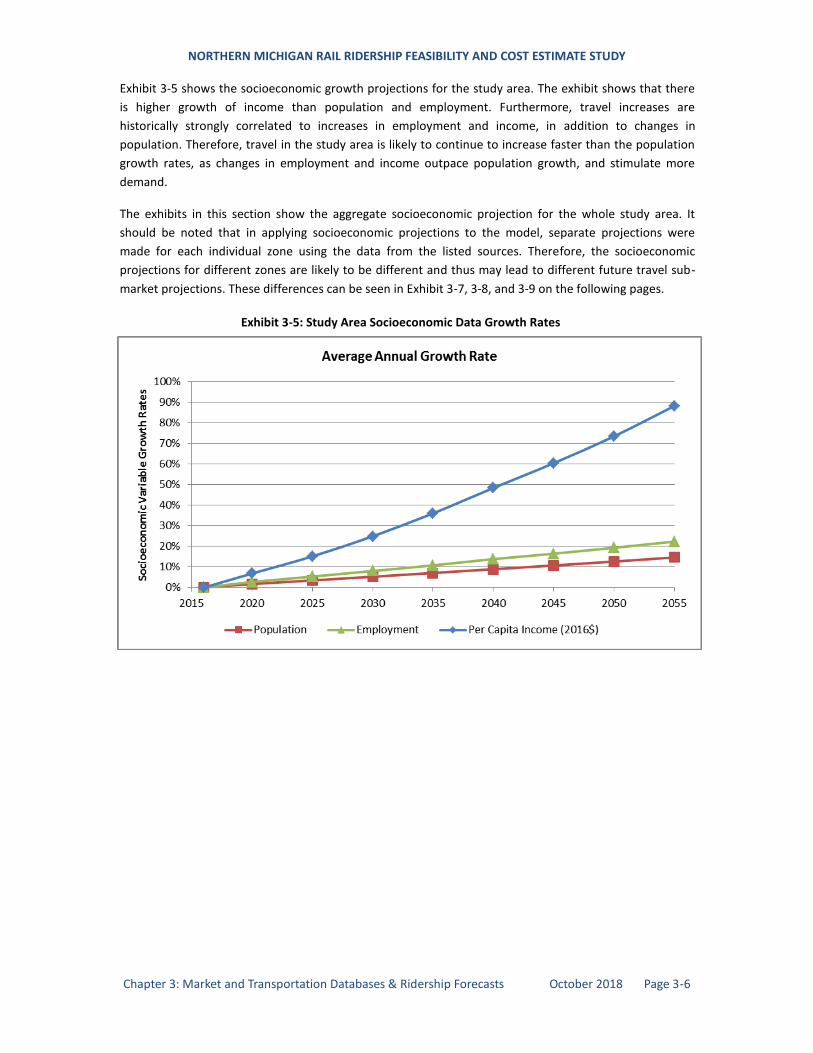
NORTHERN MICHIGAN RAIL RIDERSHIP FEASIBILITY AND COST ESTIMATE STUDY
Chapter 3: Market and Transportation Databases & Ridership Forecasts October 2018 Page 3-6
Exhibit 3-5 shows the socioeconomic growth projections for the study area. The exhibit shows that there
is higher growth of income than population and employment. Furthermore, travel increases are
historically strongly correlated to increases in employment and income, in addition to changes in
population. Therefore, travel in the study area is likely to continue to increase faster than the population
growth rates, as changes in employment and income outpace population growth, and stimulate more
demand.
The exhibits in this section show the aggregate socioeconomic projection for the whole study area. It
should be noted that in applying socioeconomic projections to the model, separate projections were
made for each individual zone using the data from the listed sources. Therefore, the socioeconomic
projections for different zones are likely to be different and thus may lead to different future travel sub-
market projections. These differences can be seen in Exhibit 3-7, 3-8, and 3-9 on the following pages.
Exhibit 3-5: Study Area Socioeconomic Data Growth Rates
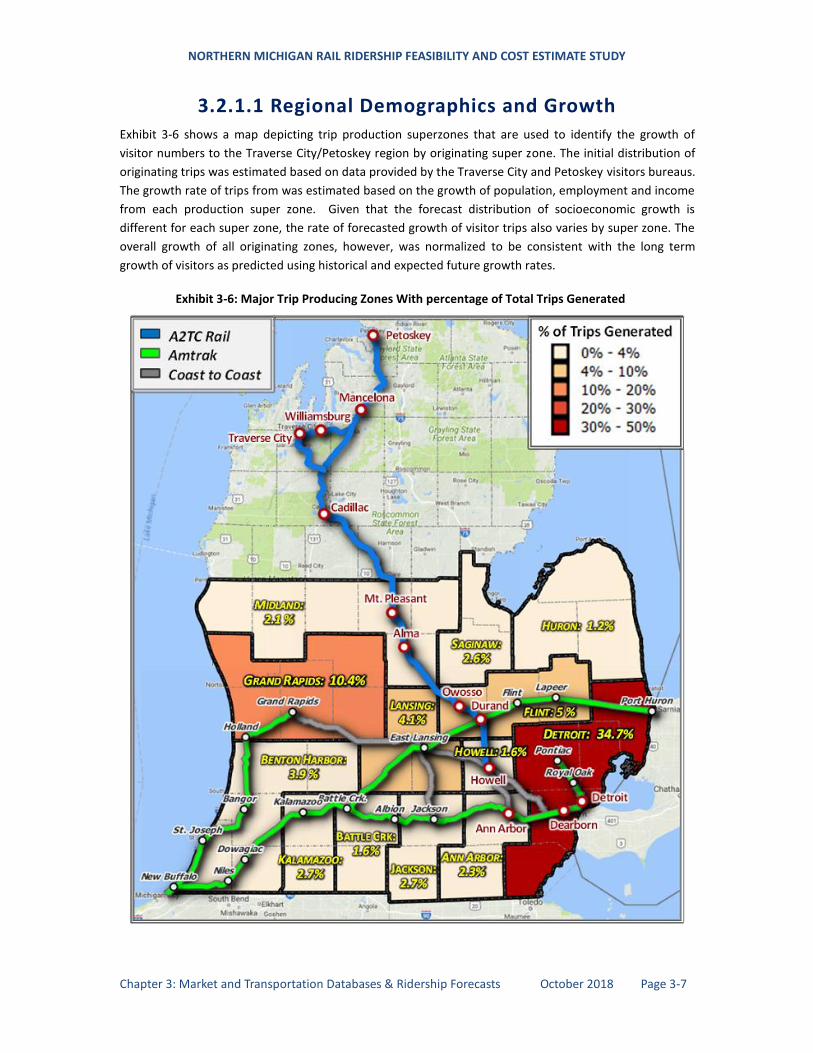
NORTHERN MICHIGAN RAIL RIDERSHIP FEASIBILITY AND COST ESTIMATE STUDY
Chapter 3: Market and Transportation Databases & Ridership Forecasts October 2018 Page 3-7
3.2.1.1 Regional Demographics and Growth Exhibit 3-6 shows a map depicting trip production superzones that are used to identify the growth of
visitor numbers to the Traverse City/Petoskey region by originating super zone. The initial distribution of
originating trips was estimated based on data provided by the Traverse City and Petoskey visitors bureaus.
The growth rate of trips from was estimated based on the growth of population, employment and income
from each production super zone. Given that the forecast distribution of socioeconomic growth is
different for each super zone, the rate of forecasted growth of visitor trips also varies by super zone. The
overall growth of all originating zones, however, was normalized to be consistent with the long term
growth of visitors as predicted using historical and expected future growth rates.
Exhibit 3-6: Major Trip Producing Zones With percentage of Total Trips Generated
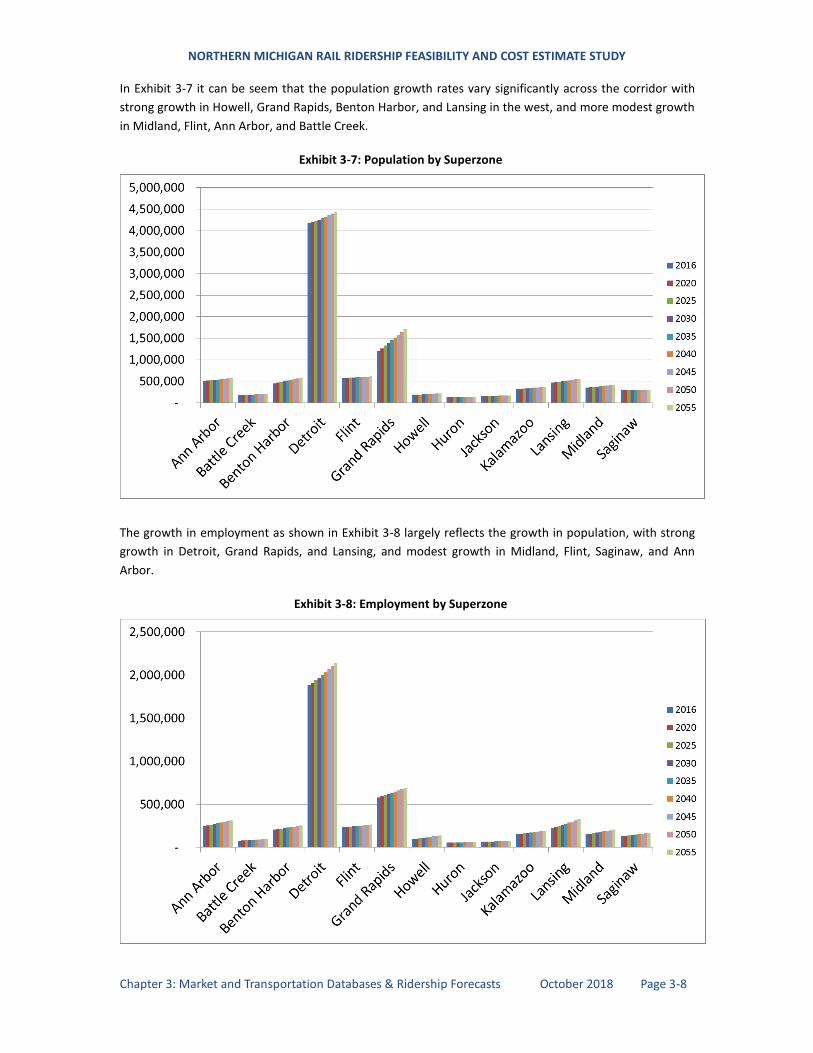
NORTHERN MICHIGAN RAIL RIDERSHIP FEASIBILITY AND COST ESTIMATE STUDY
Chapter 3: Market and Transportation Databases & Ridership Forecasts October 2018 Page 3-8
In Exhibit 3-7 it can be seem that the population growth rates vary significantly across the corridor with
strong growth in Howell, Grand Rapids, Benton Harbor, and Lansing in the west, and more modest growth
in Midland, Flint, Ann Arbor, and Battle Creek.
Exhibit 3-7: Population by Superzone
The growth in employment as shown in Exhibit 3-8 largely reflects the growth in population, with strong
growth in Detroit, Grand Rapids, and Lansing, and modest growth in Midland, Flint, Saginaw, and Ann
Arbor.
Exhibit 3-8: Employment by Superzone
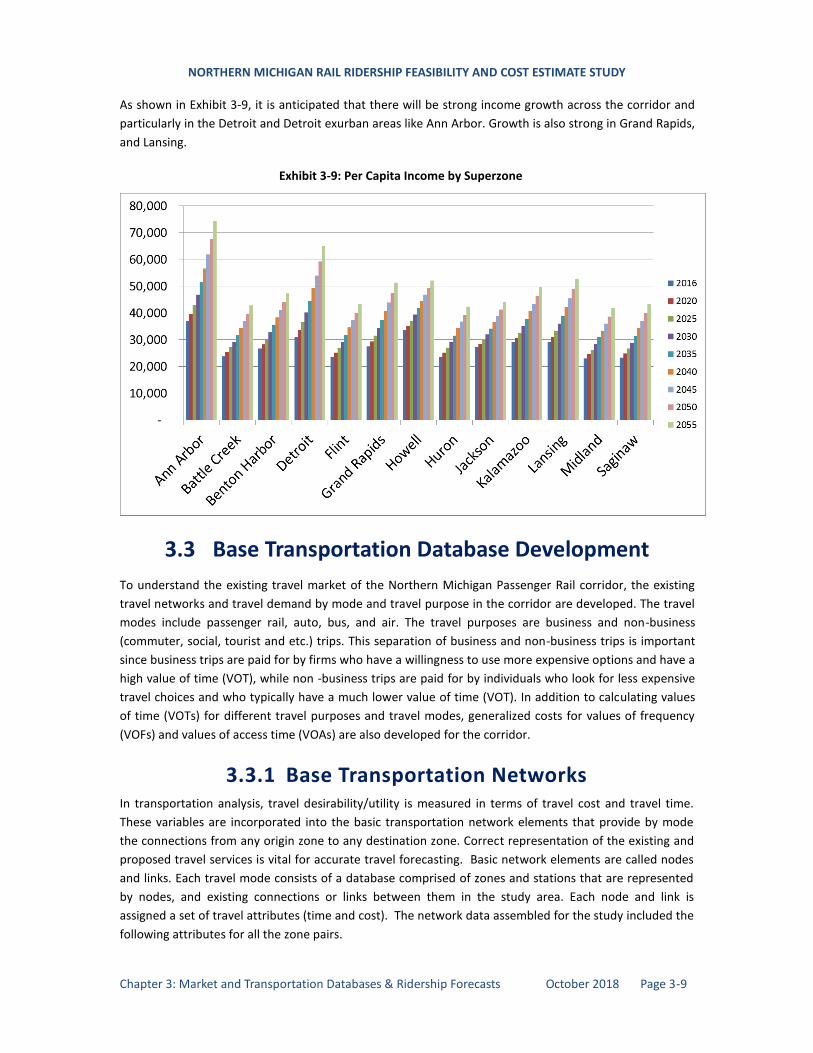
NORTHERN MICHIGAN RAIL RIDERSHIP FEASIBILITY AND COST ESTIMATE STUDY
Chapter 3: Market and Transportation Databases & Ridership Forecasts October 2018 Page 3-9
As shown in Exhibit 3-9, it is anticipated that there will be strong income growth across the corridor and
particularly in the Detroit and Detroit exurban areas like Ann Arbor. Growth is also strong in Grand Rapids,
and Lansing.
Exhibit 3-9: Per Capita Income by Superzone
3.3 Base Transportation Database Development
To understand the existing travel market of the Northern Michigan Passenger Rail corridor, the existing
travel networks and travel demand by mode and travel purpose in the corridor are developed. The travel
modes include passenger rail, auto, bus, and air. The travel purposes are business and non-business
(commuter, social, tourist and etc.) trips. This separation of business and non-business trips is important
since business trips are paid for by firms who have a willingness to use more expensive options and have a
high value of time (VOT), while non -business trips are paid for by individuals who look for less expensive
travel choices and who typically have a much lower value of time (VOT). In addition to calculating values
of time (VOTs) for different travel purposes and travel modes, generalized costs for values of frequency
(VOFs) and values of access time (VOAs) are also developed for the corridor.
3.3.1 Base Transportation Networks In transportation analysis, travel desirability/utility is measured in terms of travel cost and travel time.
These variables are incorporated into the basic transportation network elements that provide by mode
the connections from any origin zone to any destination zone. Correct representation of the existing and
proposed travel services is vital for accurate travel forecasting. Basic network elements are called nodes
and links. Each travel mode consists of a database comprised of zones and stations that are represented
by nodes, and existing connections or links between them in the study area. Each node and link is
assigned a set of travel attributes (time and cost). The network data assembled for the study included the
following attributes for all the zone pairs.
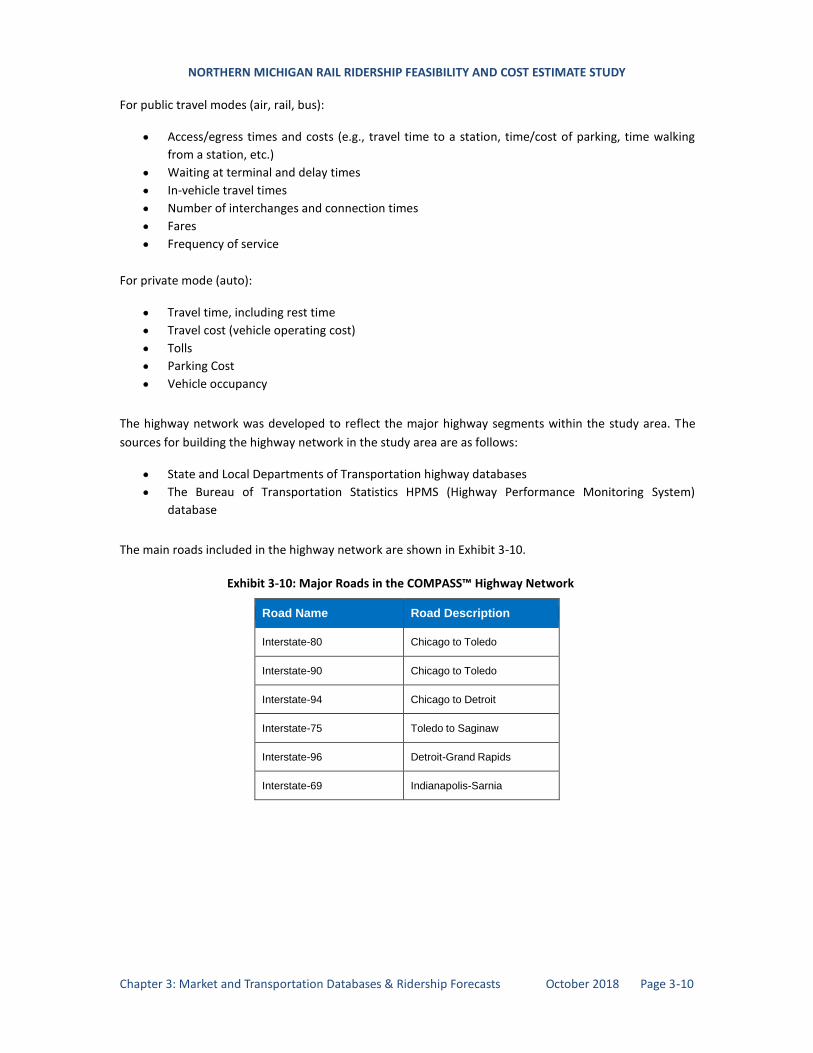
NORTHERN MICHIGAN RAIL RIDERSHIP FEASIBILITY AND COST ESTIMATE STUDY
Chapter 3: Market and Transportation Databases & Ridership Forecasts October 2018 Page 3-10
For public travel modes (air, rail, bus):
Access/egress times and costs (e.g., travel time to a station, time/cost of parking, time walking
from a station, etc.)
Waiting at terminal and delay times
In-vehicle travel times
Number of interchanges and connection times
Fares
Frequency of service
For private mode (auto):
Travel time, including rest time
Travel cost (vehicle operating cost)
Tolls
Parking Cost
Vehicle occupancy
The highway network was developed to reflect the major highway segments within the study area. The
sources for building the highway network in the study area are as follows:
State and Local Departments of Transportation highway databases
The Bureau of Transportation Statistics HPMS (Highway Performance Monitoring System)
database
The main roads included in the highway network are shown in Exhibit 3-10.
Exhibit 3-10: Major Roads in the COMPASS™ Highway Network
Road Name Road Description
Interstate-80
Chicago to Toledo
Interstate-90
Chicago to Toledo
Interstate-94
Chicago to Detroit
Interstate-75
Toledo to Saginaw
Interstate-96
Detroit-Grand Rapids
Interstate-69
Indianapolis-Sarnia
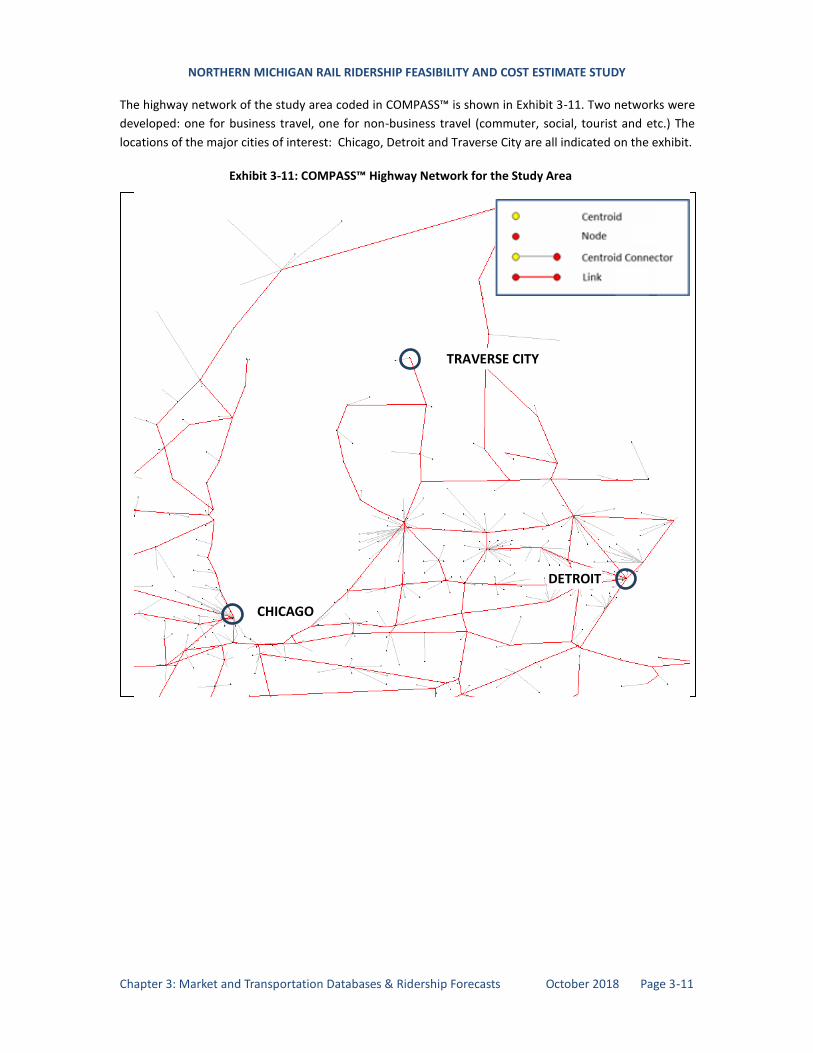
NORTHERN MICHIGAN RAIL RIDERSHIP FEASIBILITY AND COST ESTIMATE STUDY
Chapter 3: Market and Transportation Databases & Ridership Forecasts October 2018 Page 3-11
The highway network of the study area coded in COMPASS™ is shown in Exhibit 3-11. Two networks were
developed: one for business travel, one for non-business travel (commuter, social, tourist and etc.) The
locations of the major cities of interest: Chicago, Detroit and Traverse City are all indicated on the exhibit.
Exhibit 3-11: COMPASS™ Highway Network for the Study Area
CHICAGO
DETROIT
TRAVERSE CITY
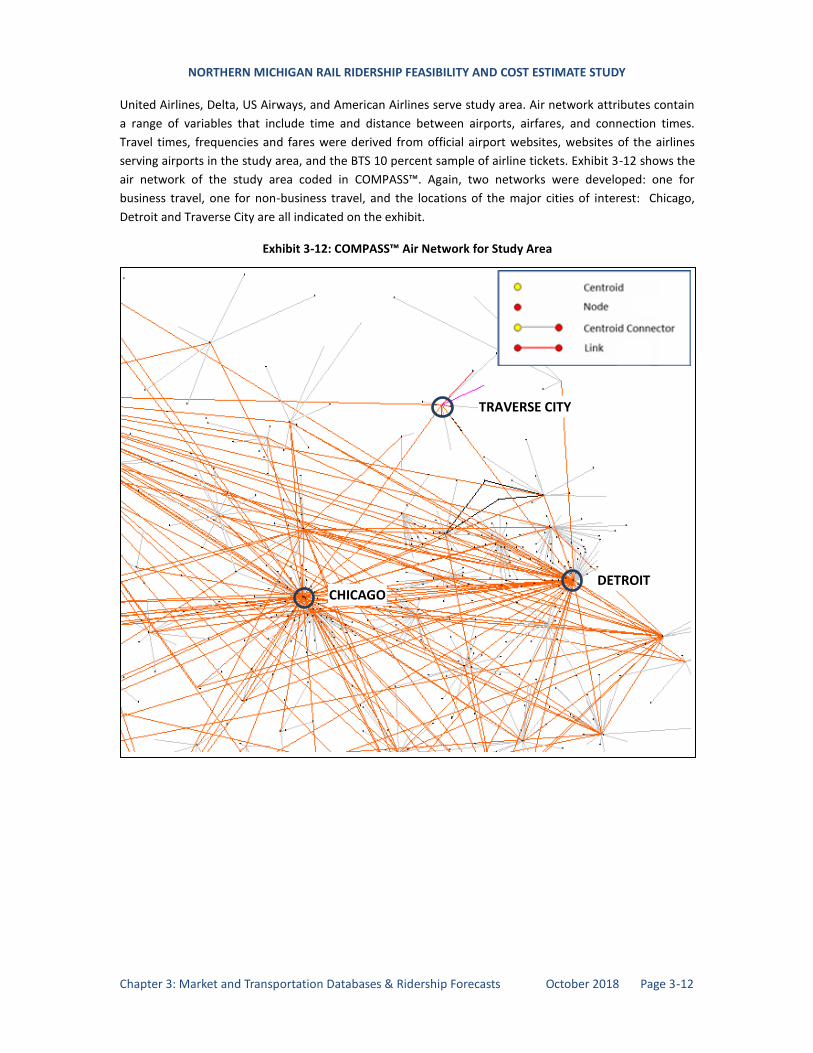
NORTHERN MICHIGAN RAIL RIDERSHIP FEASIBILITY AND COST ESTIMATE STUDY
Chapter 3: Market and Transportation Databases & Ridership Forecasts October 2018 Page 3-12
United Airlines, Delta, US Airways, and American Airlines serve study area. Air network attributes contain
a range of variables that include time and distance between airports, airfares, and connection times.
Travel times, frequencies and fares were derived from official airport websites, websites of the airlines
serving airports in the study area, and the BTS 10 percent sample of airline tickets. Exhibit 3-12 shows the
air network of the study area coded in COMPASS™. Again, two networks were developed: one for
business travel, one for non-business travel, and the locations of the major cities of interest: Chicago,
Detroit and Traverse City are all indicated on the exhibit.
Exhibit 3-12: COMPASS™ Air Network for Study Area
CHICAGO DETROIT
TRAVERSE CITY
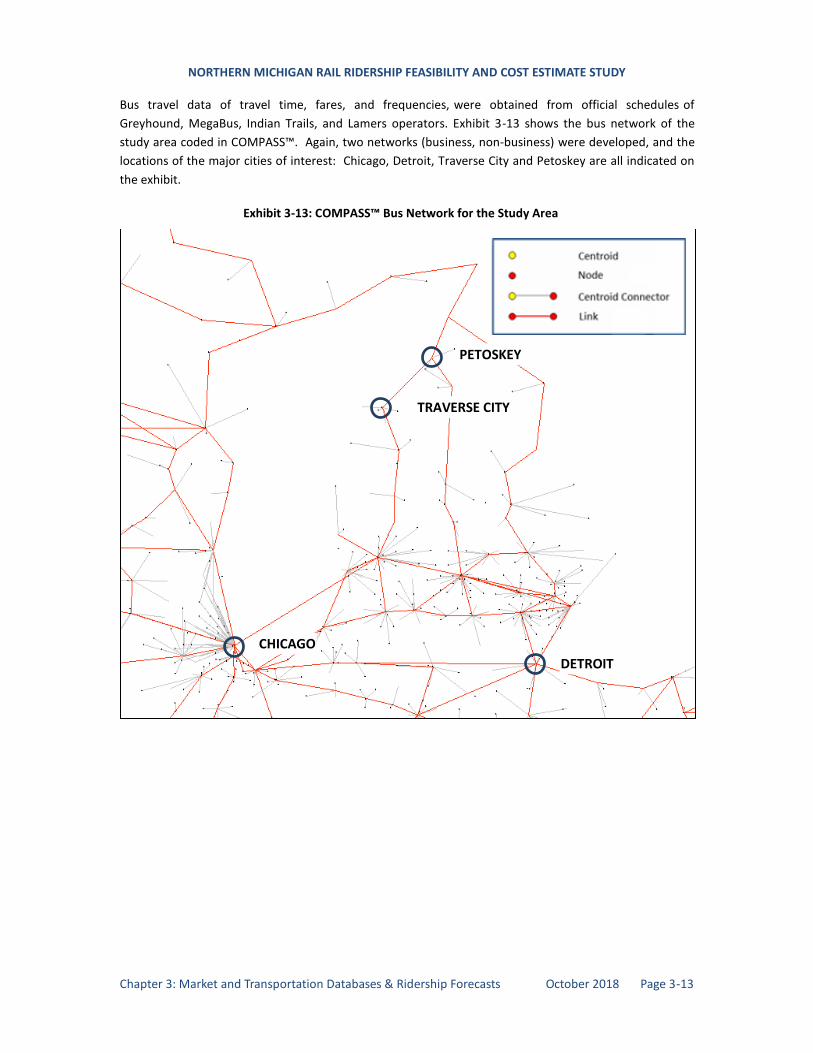
NORTHERN MICHIGAN RAIL RIDERSHIP FEASIBILITY AND COST ESTIMATE STUDY
Chapter 3: Market and Transportation Databases & Ridership Forecasts October 2018 Page 3-13
Bus travel data of travel time, fares, and frequencies, were obtained from official schedules of
Greyhound, MegaBus, Indian Trails, and Lamers operators. Exhibit 3-13 shows the bus network of the
study area coded in COMPASS™. Again, two networks (business, non-business) were developed, and the
locations of the major cities of interest: Chicago, Detroit, Traverse City and Petoskey are all indicated on
the exhibit.
Exhibit 3-13: COMPASS™ Bus Network for the Study Area
CHICAGO
DETROIT
PETOSKEY
TRAVERSE CITY
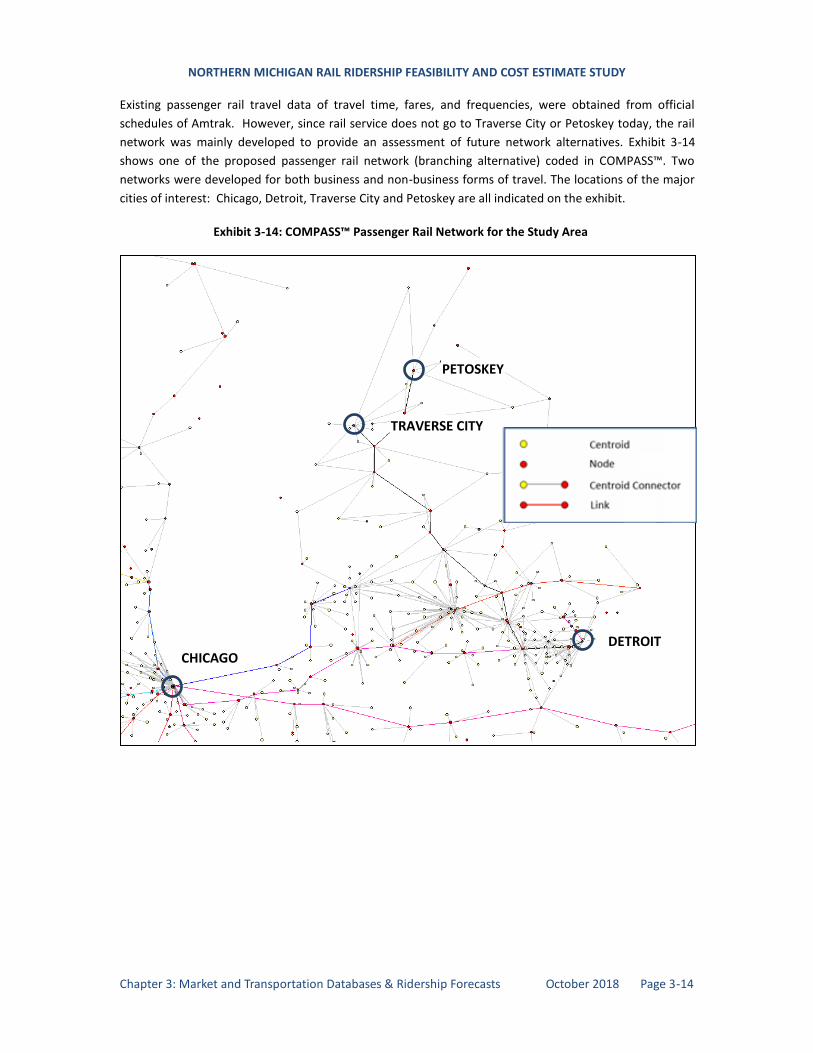
NORTHERN MICHIGAN RAIL RIDERSHIP FEASIBILITY AND COST ESTIMATE STUDY
Chapter 3: Market and Transportation Databases & Ridership Forecasts October 2018 Page 3-14
Existing passenger rail travel data of travel time, fares, and frequencies, were obtained from official
schedules of Amtrak. However, since rail service does not go to Traverse City or Petoskey today, the rail
network was mainly developed to provide an assessment of future network alternatives. Exhibit 3-14
shows one of the proposed passenger rail network (branching alternative) coded in COMPASS™. Two
networks were developed for both business and non-business forms of travel. The locations of the major
cities of interest: Chicago, Detroit, Traverse City and Petoskey are all indicated on the exhibit.
Exhibit 3-14: COMPASS™ Passenger Rail Network for the Study Area
CHICAGO DETROIT
PETOSKEY
TRAVERSE CITY
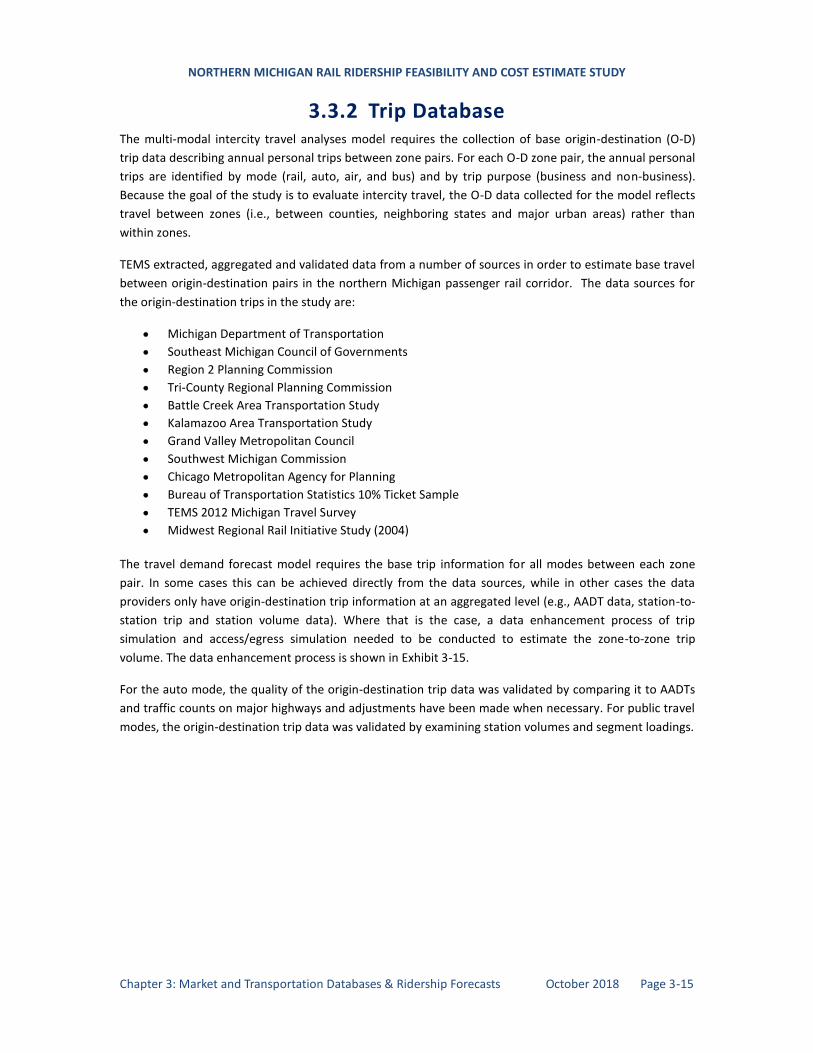
NORTHERN MICHIGAN RAIL RIDERSHIP FEASIBILITY AND COST ESTIMATE STUDY
Chapter 3: Market and Transportation Databases & Ridership Forecasts October 2018 Page 3-15
3.3.2 Trip Database The multi-modal intercity travel analyses model requires the collection of base origin-destination (O-D)
trip data describing annual personal trips between zone pairs. For each O-D zone pair, the annual personal
trips are identified by mode (rail, auto, air, and bus) and by trip purpose (business and non-business).
Because the goal of the study is to evaluate intercity travel, the O-D data collected for the model reflects
travel between zones (i.e., between counties, neighboring states and major urban areas) rather than
within zones.
TEMS extracted, aggregated and validated data from a number of sources in order to estimate base travel
between origin-destination pairs in the northern Michigan passenger rail corridor. The data sources for
the origin-destination trips in the study are:
Michigan Department of Transportation
Southeast Michigan Council of Governments
Region 2 Planning Commission
Tri-County Regional Planning Commission
Battle Creek Area Transportation Study
Kalamazoo Area Transportation Study
Grand Valley Metropolitan Council
Southwest Michigan Commission
Chicago Metropolitan Agency for Planning
Bureau of Transportation Statistics 10% Ticket Sample
TEMS 2012 Michigan Travel Survey
Midwest Regional Rail Initiative Study (2004)
The travel demand forecast model requires the base trip information for all modes between each zone
pair. In some cases this can be achieved directly from the data sources, while in other cases the data
providers only have origin-destination trip information at an aggregated level (e.g., AADT data, station-to-
station trip and station volume data). Where that is the case, a data enhancement process of trip
simulation and access/egress simulation needed to be conducted to estimate the zone-to-zone trip
volume. The data enhancement process is shown in Exhibit 3-15.
For the auto mode, the quality of the origin-destination trip data was validated by comparing it to AADTs
and traffic counts on major highways and adjustments have been made when necessary. For public travel
modes, the origin-destination trip data was validated by examining station volumes and segment loadings.
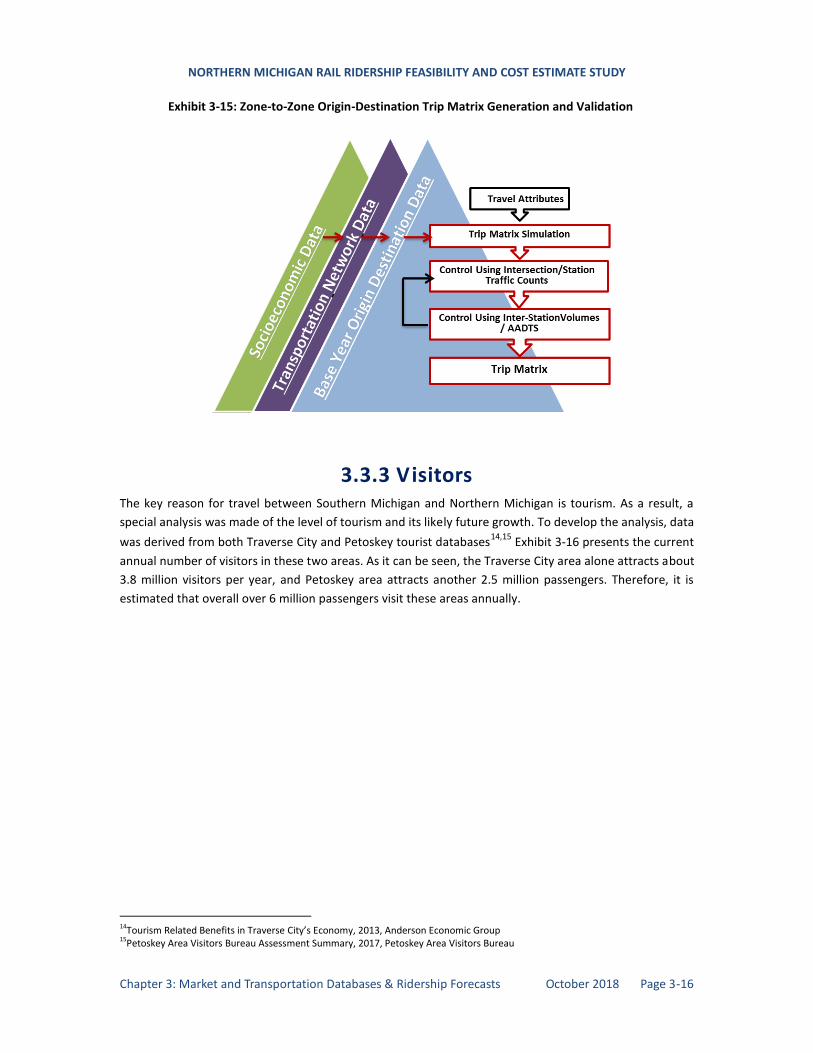
NORTHERN MICHIGAN RAIL RIDERSHIP FEASIBILITY AND COST ESTIMATE STUDY
Chapter 3: Market and Transportation Databases & Ridership Forecasts October 2018 Page 3-16
Exhibit 3-15: Zone-to-Zone Origin-Destination Trip Matrix Generation and Validation
3.3.3 Visitors The key reason for travel between Southern Michigan and Northern Michigan is tourism. As a result, a
special analysis was made of the level of tourism and its likely future growth. To develop the analysis, data
was derived from both Traverse City and Petoskey tourist databases14,15
Exhibit 3-16 presents the current
annual number of visitors in these two areas. As it can be seen, the Traverse City area alone attracts about
3.8 million visitors per year, and Petoskey area attracts another 2.5 million passengers. Therefore, it is
estimated that overall over 6 million passengers visit these areas annually.
14Tourism Related Benefits in Traverse City’s Economy, 2013, Anderson Economic Group 15Petoskey Area Visitors Bureau Assessment Summary, 2017, Petoskey Area Visitors Bureau
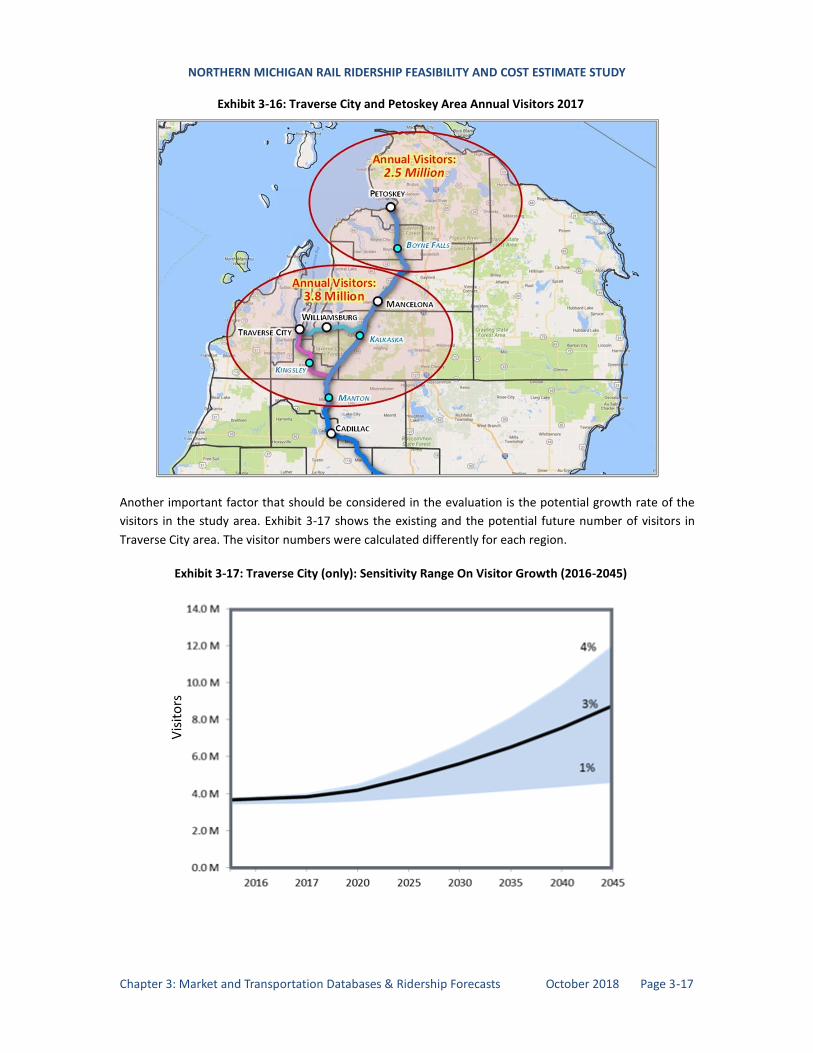
NORTHERN MICHIGAN RAIL RIDERSHIP FEASIBILITY AND COST ESTIMATE STUDY
Chapter 3: Market and Transportation Databases & Ridership Forecasts October 2018 Page 3-17
Exhibit 3-16: Traverse City and Petoskey Area Annual Visitors 2017
Another important factor that should be considered in the evaluation is the potential growth rate of the
visitors in the study area. Exhibit 3-17 shows the existing and the potential future number of visitors in
Traverse City area. The visitor numbers were calculated differently for each region.
Exhibit 3-17: Traverse City (only): Sensitivity Range On Visitor Growth (2016-2045)
Vis
ito
rs
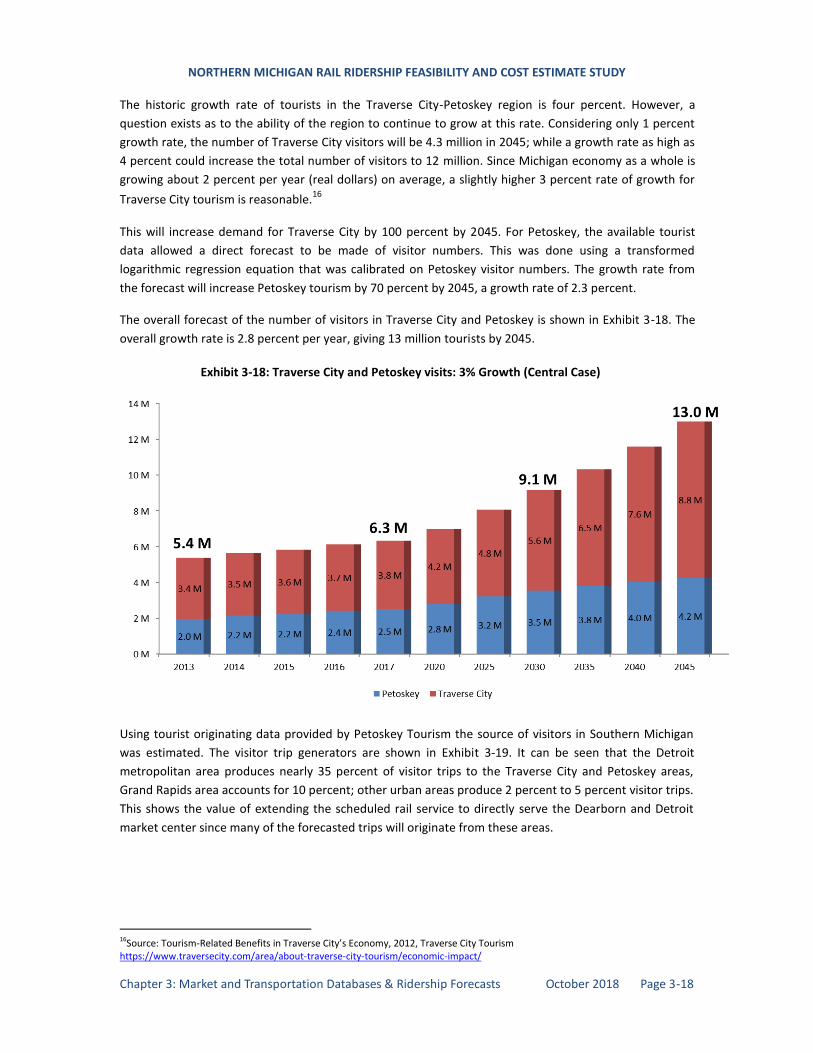
NORTHERN MICHIGAN RAIL RIDERSHIP FEASIBILITY AND COST ESTIMATE STUDY
Chapter 3: Market and Transportation Databases & Ridership Forecasts October 2018 Page 3-18
The historic growth rate of tourists in the Traverse City-Petoskey region is four percent. However, a
question exists as to the ability of the region to continue to grow at this rate. Considering only 1 percent
growth rate, the number of Traverse City visitors will be 4.3 million in 2045; while a growth rate as high as
4 percent could increase the total number of visitors to 12 million. Since Michigan economy as a whole is
growing about 2 percent per year (real dollars) on average, a slightly higher 3 percent rate of growth for
Traverse City tourism is reasonable.16
This will increase demand for Traverse City by 100 percent by 2045. For Petoskey, the available tourist
data allowed a direct forecast to be made of visitor numbers. This was done using a transformed
logarithmic regression equation that was calibrated on Petoskey visitor numbers. The growth rate from
the forecast will increase Petoskey tourism by 70 percent by 2045, a growth rate of 2.3 percent.
The overall forecast of the number of visitors in Traverse City and Petoskey is shown in Exhibit 3-18. The
overall growth rate is 2.8 percent per year, giving 13 million tourists by 2045.
Exhibit 3-18: Traverse City and Petoskey visits: 3% Growth (Central Case)
Using tourist originating data provided by Petoskey Tourism the source of visitors in Southern Michigan
was estimated. The visitor trip generators are shown in Exhibit 3-19. It can be seen that the Detroit
metropolitan area produces nearly 35 percent of visitor trips to the Traverse City and Petoskey areas,
Grand Rapids area accounts for 10 percent; other urban areas produce 2 percent to 5 percent visitor trips.
This shows the value of extending the scheduled rail service to directly serve the Dearborn and Detroit
market center since many of the forecasted trips will originate from these areas.
16Source: Tourism-Related Benefits in Traverse City’s Economy, 2012, Traverse City Tourism https://www.traversecity.com/area/about-traverse-city-tourism/economic-impact/
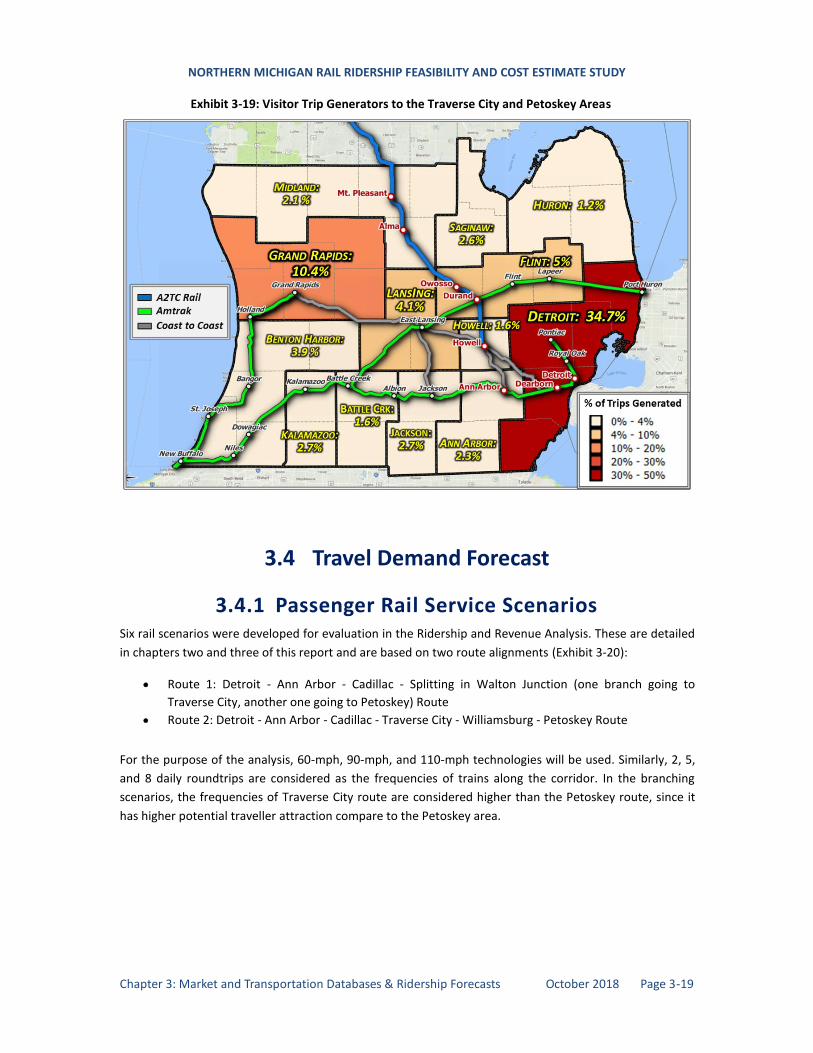
NORTHERN MICHIGAN RAIL RIDERSHIP FEASIBILITY AND COST ESTIMATE STUDY
Chapter 3: Market and Transportation Databases & Ridership Forecasts October 2018 Page 3-19
Exhibit 3-19: Visitor Trip Generators to the Traverse City and Petoskey Areas
3.4 Travel Demand Forecast
3.4.1 Passenger Rail Service Scenarios Six rail scenarios were developed for evaluation in the Ridership and Revenue Analysis. These are detailed
in chapters two and three of this report and are based on two route alignments (Exhibit 3-20):
Route 1: Detroit - Ann Arbor - Cadillac - Splitting in Walton Junction (one branch going to
Traverse City, another one going to Petoskey) Route
Route 2: Detroit - Ann Arbor - Cadillac - Traverse City - Williamsburg - Petoskey Route
For the purpose of the analysis, 60-mph, 90-mph, and 110-mph technologies will be used. Similarly, 2, 5,
and 8 daily roundtrips are considered as the frequencies of trains along the corridor. In the branching
scenarios, the frequencies of Traverse City route are considered higher than the Petoskey route, since it
has higher potential traveller attraction compare to the Petoskey area.
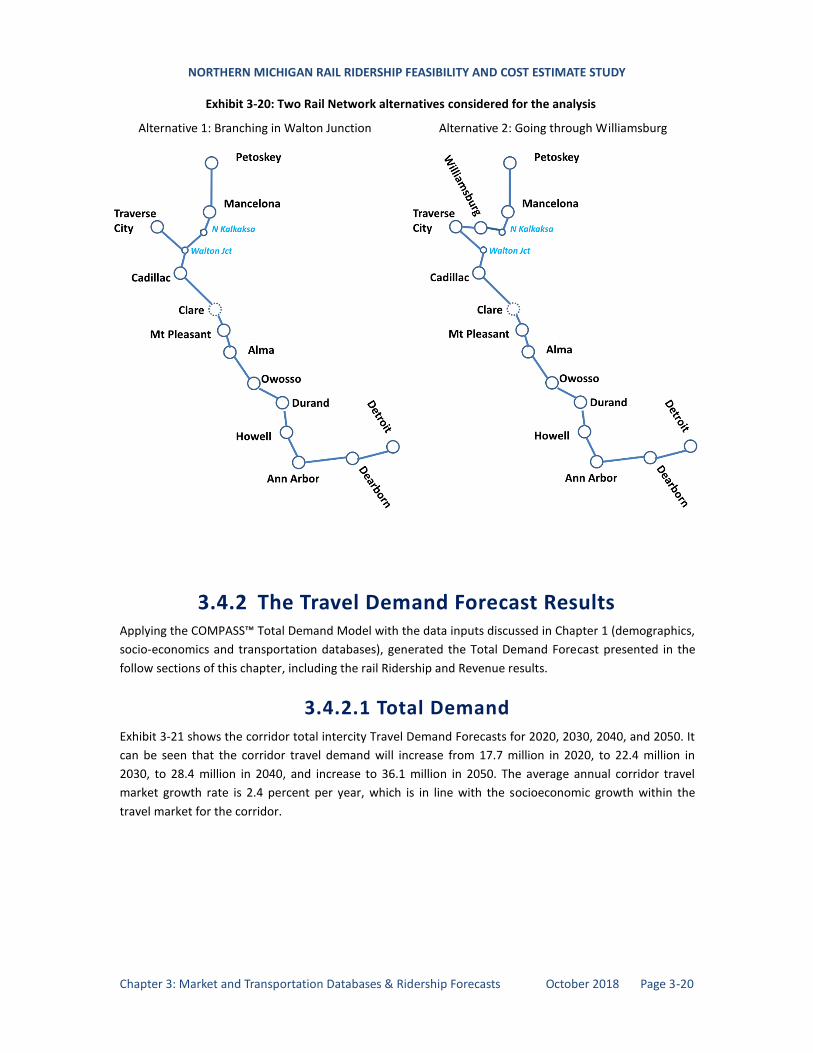
NORTHERN MICHIGAN RAIL RIDERSHIP FEASIBILITY AND COST ESTIMATE STUDY
Chapter 3: Market and Transportation Databases & Ridership Forecasts October 2018 Page 3-20
Exhibit 3-20: Two Rail Network alternatives considered for the analysis
Alternative 1: Branching in Walton Junction
Alternative 2: Going through Williamsburg
3.4.2 The Travel Demand Forecast Results Applying the COMPASS™ Total Demand Model with the data inputs discussed in Chapter 1 (demographics,
socio-economics and transportation databases), generated the Total Demand Forecast presented in the
follow sections of this chapter, including the rail Ridership and Revenue results.
3.4.2.1 Total Demand Exhibit 3-21 shows the corridor total intercity Travel Demand Forecasts for 2020, 2030, 2040, and 2050. It
can be seen that the corridor travel demand will increase from 17.7 million in 2020, to 22.4 million in
2030, to 28.4 million in 2040, and increase to 36.1 million in 2050. The average annual corridor travel
market growth rate is 2.4 percent per year, which is in line with the socioeconomic growth within the
travel market for the corridor.
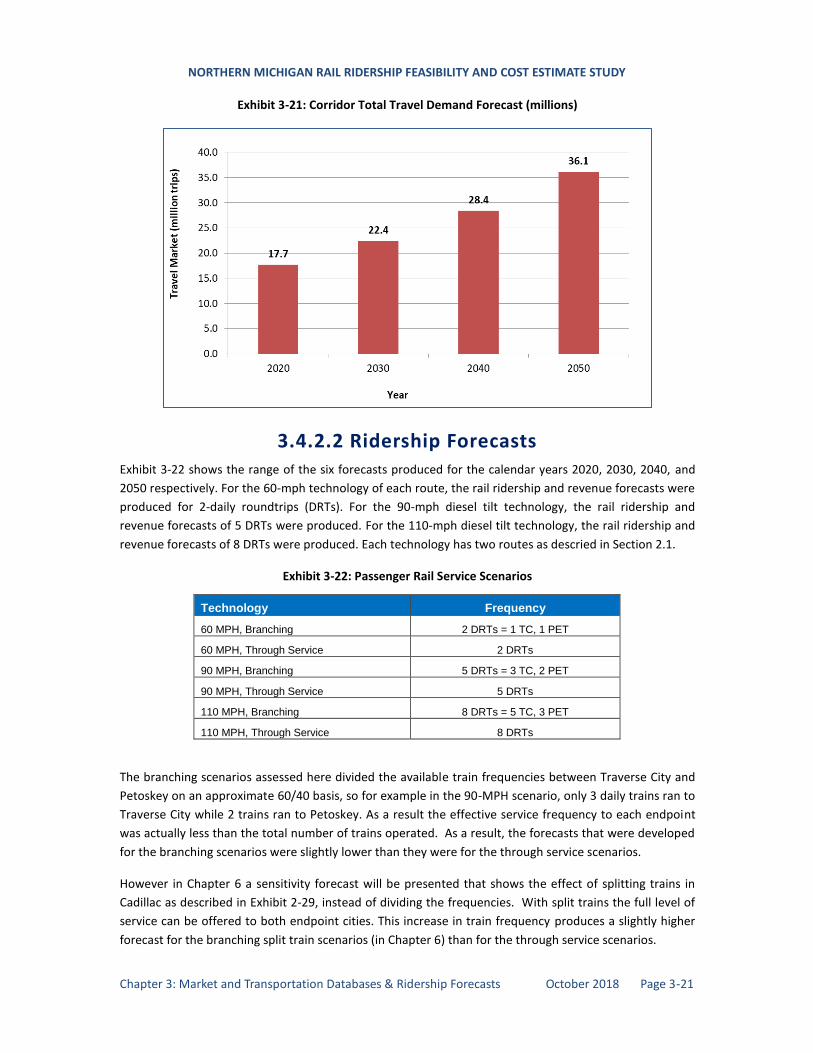
NORTHERN MICHIGAN RAIL RIDERSHIP FEASIBILITY AND COST ESTIMATE STUDY
Chapter 3: Market and Transportation Databases & Ridership Forecasts October 2018 Page 3-21
Exhibit 3-21: Corridor Total Travel Demand Forecast (millions)
3.4.2.2 Ridership Forecasts Exhibit 3-22 shows the range of the six forecasts produced for the calendar years 2020, 2030, 2040, and
2050 respectively. For the 60-mph technology of each route, the rail ridership and revenue forecasts were
produced for 2-daily roundtrips (DRTs). For the 90-mph diesel tilt technology, the rail ridership and
revenue forecasts of 5 DRTs were produced. For the 110-mph diesel tilt technology, the rail ridership and
revenue forecasts of 8 DRTs were produced. Each technology has two routes as descried in Section 2.1.
Exhibit 3-22: Passenger Rail Service Scenarios
Technology Frequency
60 MPH, Branching 2 DRTs = 1 TC, 1 PET
60 MPH, Through Service 2 DRTs
90 MPH, Branching 5 DRTs = 3 TC, 2 PET
90 MPH, Through Service 5 DRTs
110 MPH, Branching 8 DRTs = 5 TC, 3 PET
110 MPH, Through Service 8 DRTs
The branching scenarios assessed here divided the available train frequencies between Traverse City and
Petoskey on an approximate 60/40 basis, so for example in the 90-MPH scenario, only 3 daily trains ran to
Traverse City while 2 trains ran to Petoskey. As a result the effective service frequency to each endpoint
was actually less than the total number of trains operated. As a result, the forecasts that were developed
for the branching scenarios were slightly lower than they were for the through service scenarios.
However in Chapter 6 a sensitivity forecast will be presented that shows the effect of splitting trains in
Cadillac as described in Exhibit 2-29, instead of dividing the frequencies. With split trains the full level of
service can be offered to both endpoint cities. This increase in train frequency produces a slightly higher
forecast for the branching split train scenarios (in Chapter 6) than for the through service scenarios.
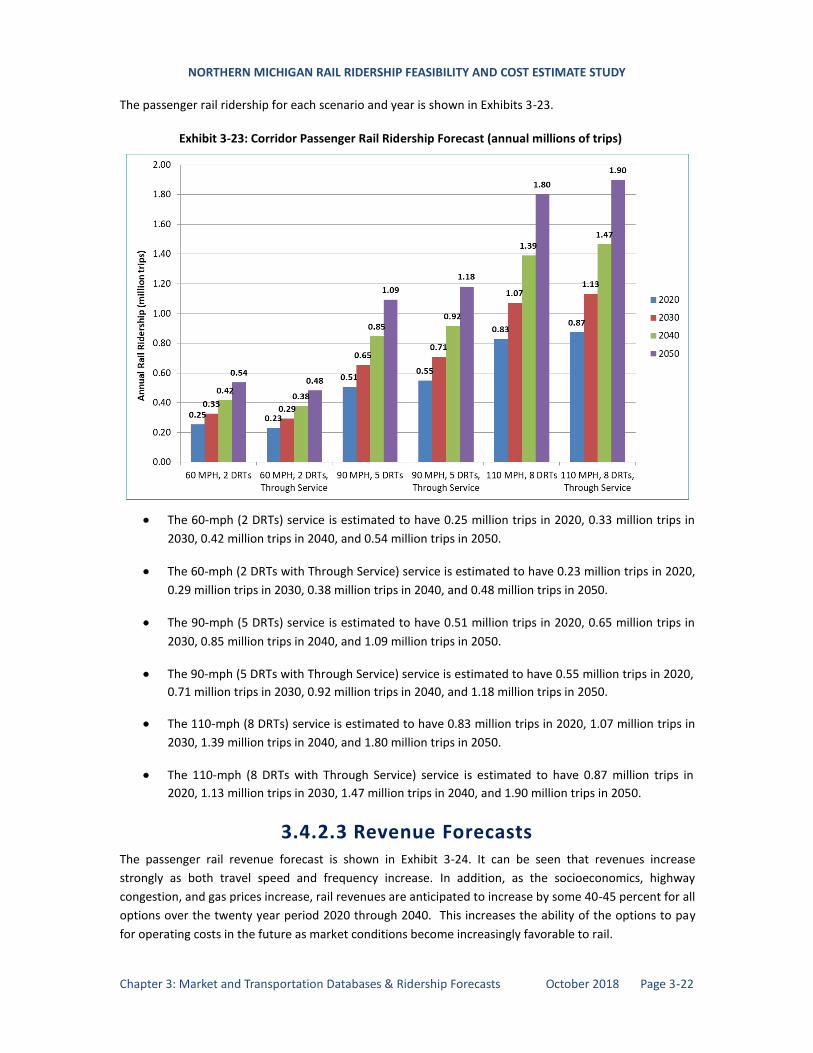
NORTHERN MICHIGAN RAIL RIDERSHIP FEASIBILITY AND COST ESTIMATE STUDY
Chapter 3: Market and Transportation Databases & Ridership Forecasts October 2018 Page 3-22
The passenger rail ridership for each scenario and year is shown in Exhibits 3-23.
Exhibit 3-23: Corridor Passenger Rail Ridership Forecast (annual millions of trips)
The 60-mph (2 DRTs) service is estimated to have 0.25 million trips in 2020, 0.33 million trips in
2030, 0.42 million trips in 2040, and 0.54 million trips in 2050.
The 60-mph (2 DRTs with Through Service) service is estimated to have 0.23 million trips in 2020,
0.29 million trips in 2030, 0.38 million trips in 2040, and 0.48 million trips in 2050.
The 90-mph (5 DRTs) service is estimated to have 0.51 million trips in 2020, 0.65 million trips in
2030, 0.85 million trips in 2040, and 1.09 million trips in 2050.
The 90-mph (5 DRTs with Through Service) service is estimated to have 0.55 million trips in 2020,
0.71 million trips in 2030, 0.92 million trips in 2040, and 1.18 million trips in 2050.
The 110-mph (8 DRTs) service is estimated to have 0.83 million trips in 2020, 1.07 million trips in
2030, 1.39 million trips in 2040, and 1.80 million trips in 2050.
The 110-mph (8 DRTs with Through Service) service is estimated to have 0.87 million trips in
2020, 1.13 million trips in 2030, 1.47 million trips in 2040, and 1.90 million trips in 2050.
3.4.2.3 Revenue Forecasts The passenger rail revenue forecast is shown in Exhibit 3-24. It can be seen that revenues increase
strongly as both travel speed and frequency increase. In addition, as the socioeconomics, highway
congestion, and gas prices increase, rail revenues are anticipated to increase by some 40-45 percent for all
options over the twenty year period 2020 through 2040. This increases the ability of the options to pay
for operating costs in the future as market conditions become increasingly favorable to rail.
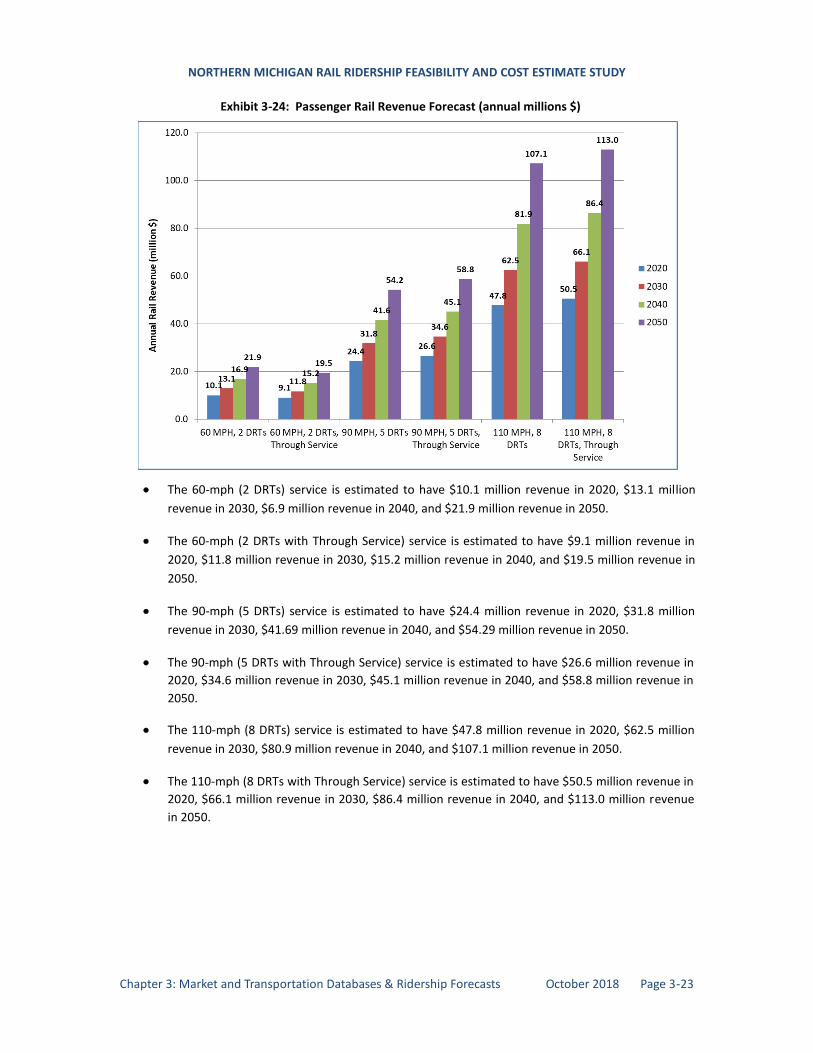
NORTHERN MICHIGAN RAIL RIDERSHIP FEASIBILITY AND COST ESTIMATE STUDY
Chapter 3: Market and Transportation Databases & Ridership Forecasts October 2018 Page 3-23
Exhibit 3-24: Passenger Rail Revenue Forecast (annual millions $)
The 60-mph (2 DRTs) service is estimated to have $10.1 million revenue in 2020, $13.1 million
revenue in 2030, $6.9 million revenue in 2040, and $21.9 million revenue in 2050.
The 60-mph (2 DRTs with Through Service) service is estimated to have $9.1 million revenue in
2020, $11.8 million revenue in 2030, $15.2 million revenue in 2040, and $19.5 million revenue in
2050.
The 90-mph (5 DRTs) service is estimated to have $24.4 million revenue in 2020, $31.8 million
revenue in 2030, $41.69 million revenue in 2040, and $54.29 million revenue in 2050.
The 90-mph (5 DRTs with Through Service) service is estimated to have $26.6 million revenue in
2020, $34.6 million revenue in 2030, $45.1 million revenue in 2040, and $58.8 million revenue in
2050.
The 110-mph (8 DRTs) service is estimated to have $47.8 million revenue in 2020, $62.5 million
revenue in 2030, $80.9 million revenue in 2040, and $107.1 million revenue in 2050.
The 110-mph (8 DRTs with Through Service) service is estimated to have $50.5 million revenue in
2020, $66.1 million revenue in 2030, $86.4 million revenue in 2040, and $113.0 million revenue
in 2050.
NORTHERN MICHIGAN RAIL RIDERSHIP FEASIBILITY AND COST ESTIMATE STUDY
Chapter 3: Market and Transportation Databases & Ridership Forecasts October 2018 Page 3-24
3.4.2.4 Market Shares The passenger rail market shares are shown in Exhibit 3-25.
The 60-mph (2 DRTs) service is estimated to have 1.49 percent market share
The 60-mph (2 DRTs with Through Service) service is estimated to have 1.18 percent market
share
The 90-mph (5 DRTs) service is estimated to have 3.03 percent market share
The 90-mph (5 DRTs with Through Service) service is estimated to have 3.28 percent market
share
The 110-mph (8 DRTs) service is estimated to have 4.99 percent market share
The 110-mph (8 DRTs with Through Service) service is estimated to have 5.26 percent market
share.
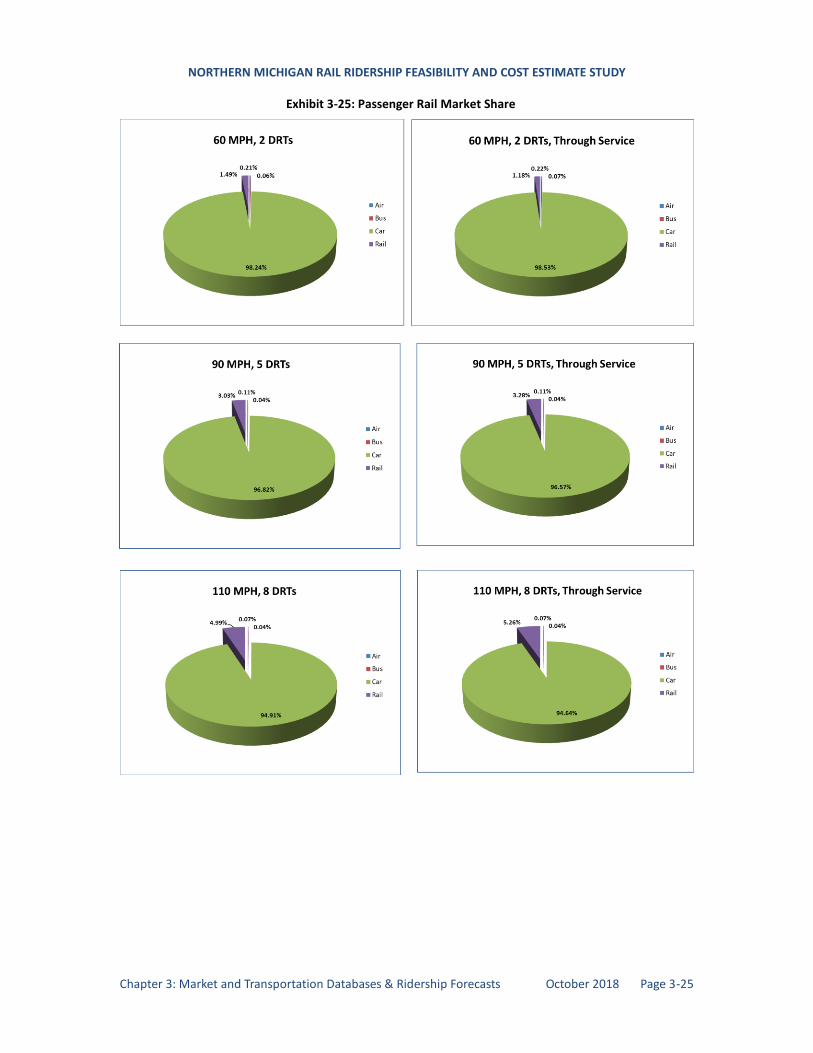
NORTHERN MICHIGAN RAIL RIDERSHIP FEASIBILITY AND COST ESTIMATE STUDY
Chapter 3: Market and Transportation Databases & Ridership Forecasts October 2018 Page 3-25
Exhibit 3-25: Passenger Rail Market Share
NORTHERN MICHIGAN RAIL RIDERSHIP FEASIBILITY AND COST ESTIMATE STUDY
Chapter 3: Market and Transportation Databases & Ridership Forecasts October 2018 Page 3-26
This page intentionally left blank
NORTHERN MICHIGAN RAIL RIDERSHIP FEASIBILITY AND COST ESTIMATE STUDY
Chapter 4: Operating Costs October 2018 Page 4-1
Chapter 4 Operating Costs
S U M M A R Y
Operating costs were calculated for each year the system is planned to be operational using operating cost
drivers such as passenger volumes, train miles, and operating hours. As in the case of the Midwest
Regional Rail Initiative (MWRRI) and Ohio Hub studies, the aim is to develop an affordable set of options
that provide good service at a reasonable cost.
4.1 Operating and Maintenance Cost Methodology
This section describes the build-up of the unit operating costs that have been used in conjunction with the
operating plans, to project the total operating cost of each corridor option. A costing framework originally
developed for the Midwest Regional Rail System (MWRRS) was adapted for use in this study. However, it
has also been validated against current Amtrak Passenger Rail Investment and Improvement Act of 2008
Costs (PRIIA) costs as part of the Coast-to-Coast study. PRIIA costs differ from standard MWRRS costs
since PRIIA costs tend to include a larger share of allocated fixed (or overhead) costs than what the
MWRRS methodology called for. However, in all other respects the PRIIA and MWRRS costing framework
have been demonstrated to produce comparable results. Detail on this comparison can be found in the
Coast-to-Coast study.
Following the MWRRS methodology17
, nine specific cost areas have been identified. As shown in Exhibit
4-1, variable train-mile driven costs include equipment maintenance, energy and fuel, and train and
onboard service (OBS) crews. Passenger miles drive insurance liability, while ridership influences
marketing, and sales. Fixed costs include administrative costs, station costs, and track and right-of-way
maintenance costs. Signals, communications and power supply are included in track and right-of-way
costs.
This framework enables the direct development of costs based on directly-controllable and route-specific
factors, and allows sensitivity analyses to be performed on the impact of specific cost drivers. It also
enables direct and explicit treatment of overhead cost allocations, to ensure that costs which do not
belong to a corridor are not inappropriately allocated to the corridor, as would be inherent in a simple
average cost-per-train mile approach. It also allows benchmarking and direct comparability of Michigan
A2TC corridor costs with those developed by other high-speed rail studies across the nation, including
those with which the proposed corridor route would connect.
17Follow the links under “Midwest Regional Rail Initiative (MWRRI)” at http://www.dot.state.mn.us/planning/railplan/studies.html
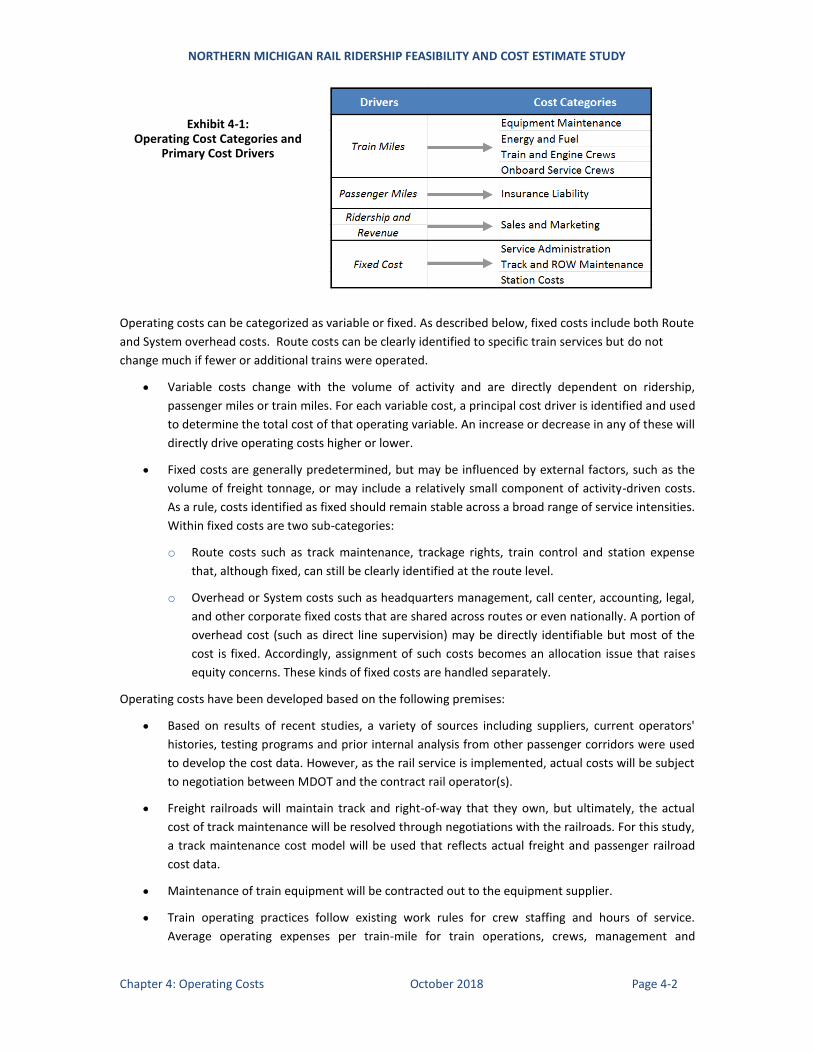
NORTHERN MICHIGAN RAIL RIDERSHIP FEASIBILITY AND COST ESTIMATE STUDY
Chapter 4: Operating Costs October 2018 Page 4-2
Exhibit 4-1: Operating Cost Categories and
Primary Cost Drivers
Operating costs can be categorized as variable or fixed. As described below, fixed costs include both Route
and System overhead costs. Route costs can be clearly identified to specific train services but do not
change much if fewer or additional trains were operated.
Variable costs change with the volume of activity and are directly dependent on ridership,
passenger miles or train miles. For each variable cost, a principal cost driver is identified and used
to determine the total cost of that operating variable. An increase or decrease in any of these will
directly drive operating costs higher or lower.
Fixed costs are generally predetermined, but may be influenced by external factors, such as the
volume of freight tonnage, or may include a relatively small component of activity-driven costs.
As a rule, costs identified as fixed should remain stable across a broad range of service intensities.
Within fixed costs are two sub-categories:
o Route costs such as track maintenance, trackage rights, train control and station expense
that, although fixed, can still be clearly identified at the route level.
o Overhead or System costs such as headquarters management, call center, accounting, legal,
and other corporate fixed costs that are shared across routes or even nationally. A portion of
overhead cost (such as direct line supervision) may be directly identifiable but most of the
cost is fixed. Accordingly, assignment of such costs becomes an allocation issue that raises
equity concerns. These kinds of fixed costs are handled separately.
Operating costs have been developed based on the following premises:
Based on results of recent studies, a variety of sources including suppliers, current operators'
histories, testing programs and prior internal analysis from other passenger corridors were used
to develop the cost data. However, as the rail service is implemented, actual costs will be subject
to negotiation between MDOT and the contract rail operator(s).
Freight railroads will maintain track and right-of-way that they own, but ultimately, the actual
cost of track maintenance will be resolved through negotiations with the railroads. For this study,
a track maintenance cost model will be used that reflects actual freight and passenger railroad
cost data.
Maintenance of train equipment will be contracted out to the equipment supplier.
Train operating practices follow existing work rules for crew staffing and hours of service.
Average operating expenses per train-mile for train operations, crews, management and
NORTHERN MICHIGAN RAIL RIDERSHIP FEASIBILITY AND COST ESTIMATE STUDY
Chapter 4: Operating Costs October 2018 Page 4-3
supervision were estimated through a bottoms-up staffing approach based on typical passenger
rail organizational needs.
The MWRRS costing framework was originally developed in conjunction with nine states that comprised
the MWRRS steering committee and with Amtrak. In addition, freight railroads, equipment manufacturers
and others provided input to the development of the costs. However, the costing framework has been
validated with recent operating experience based on publicly available data from other sources,
particularly the Midwest 403B Service trains Northern New England Passenger Rail Authority’s (NNEPRA)
Downeaster costs and data on Illinois operations that was provided by Amtrak. It has been updated and
brought to a 2017 costing basis.
The original concept for the MWRRS was for development of a new service based on operating methods
directly modeled after state-of-the-art European rail operating practice. Along with anticipated economies
of scale, modern train technology could reduce operating costs when compared to existing Amtrak
practice. In the original 2000 MWRRS Plan, European equipment costs were measured at 40 percent of
Amtrak’s costs. However, in the final MWRRS plan that was released in 2004, train-operating costs were
significantly increased to a level that is more consistent with Amtrak’s current cost structure. However,
adopting an Amtrak cost structure for financial planning does not suggest that Amtrak would actually be
selected for the corridor operation. Rather, this selection increases the flexibility for choosing an operator
without excluding Amtrak, because multiple operators and vendors will be able to meet the broader
performance parameters provided by this conservative approach.
4.1.1 Variable Costs Variable costs include those that directly depend on the number of train-miles operated or passenger-
miles carried. They include train equipment maintenance, certain host railroad costs, train crew cost, fuel
and energy, onboard service, and insurance costs.
4.1.1.1 Train Equipment Maintenance Equipment maintenance costs include all costs for spare parts, labor and materials needed to keep
equipment safe and reliable. The costs include periodical overhauls in addition to running maintenance. It
also assumes that facilities for servicing and maintaining equipment are designed specifically to
accommodate the selected train technology. This arrangement supports more efficient and cost-effective
maintenance practices. Acquiring a large fleet of trains with identical features and components, allows for
substantial savings in parts inventory and other economies of scale. In particular, commonality of rolling
stock and other equipment will standardize maintenance training, enhance efficiencies and foster broad
expertise in train and system repair.
The MWRRS study developed a cost of $9.87 per train mile for a 300-seat train in 2002. This cost was
increased to $13.35 per train mile in 2017. The 79-mph conventional Amtrak train benchmarked at a
higher cost of $16.22 due primarily to a lack of economies of scale associated with typical lighter density
Amtrak corridors. For this study:
The 60-mph corridor options are only running one or two round-trips daily, so the higher $16.22
cost will be assumed for these options.
The lower $13.35 cost will be assumed for the higher frequency 90-mph and 110-mph options
because of better economies of scale and better equipment utilization in these options, both of
which tends toward lower average equipment unit costs.
NORTHERN MICHIGAN RAIL RIDERSHIP FEASIBILITY AND COST ESTIMATE STUDY
Chapter 4: Operating Costs October 2018 Page 4-4
4.1.1.2 Train and Engine Crew Costs The train operating crew incurs crew costs. Following Amtrak staffing policies, the operating crew would
consist of an engineer, a conductor and an assistant conductor and is subject to federal hours of service
regulations. Costs for the crew include salary, fringe benefits, training, overtime and additional pay for
split shifts and high mileage runs. An overtime allowance is included as well as scheduled time-off,
unscheduled absences and time required for operating, safety and passenger handling training. Fringe
benefits include health and welfare, Federal Insurance Contributions Act (FICA) and pensions. The cost of
employee injury claims under Federal Employers Liability Act (FELA) is also treated as a fringe benefit for
this analysis. The overall fringe benefit rate was calculated as 55 percent. In addition, an allowance was
built in for spare/reserve crews on the extra board. Costing of train crews was based on Amtrak’s 1999
labor agreement as assessed by the MWRRS study, adjusted for inflation to 2017.
Crew costs depend upon the level of train crew utilization, which is largely influenced by the structure of
crew bases and any prior agreements on staffing locations. Train frequency strongly influences the
amount of held-away-from-home-terminal time, which occurs if train crews have to stay overnight in a
hotel away from their home base. Since a broad range of service frequencies and speeds have been
evaluated here, a parametric approach was needed to develop a system average per train mile rate for
crew costs. Such an average rate necessarily involves some approximation, but to avoid having to
reconfigure a detailed crew-staffing plan whenever the train schedules change, an average rate is
appropriate for a Feasibility study. A more specific and detailed level of assessment would be appropriate
for a Tier 2 EIS. For this study:
A value of $5.17 per train mile was assumed for the higher frequency 90-mph and 110-mph
options. This reflects improved crew utilization due to higher train speeds and more train
frequencies. This is a moderate level of crew cost that still includes the need for some away from
home layover.
The low frequency 60-mph round-trip scenarios cost $6.93 per train mile. With trains operating
less frequently there is less opportunity to return crews to their home base on the same day,
leading to more split shifts and overnight layovers.
4.1.1.3 Fuel and Energy An average consumption rate of 2.42 gallons/mile was estimated for a representative 110-mph 300-seat
train, based upon nominal usage rates of all three technologies considered in Phase 3 of the MWRRS
Study. While fuel prices were $3.60 a gallon in late 2012 for diesel fuel according to Energy Information
Administration (EIA)18
, by 2014 they had fallen to approximately $3/gallon, and the EIA price forecast has
been lowered. Subsequently they have started to rise again. For the 90-mph and 110-mph trains, a fuel
cost of $8.70 per train mile is being assumed rising to $12.20 per mile by 2040, consistent with the latest
EIA forecasts that were used for preparation of the ridership forecasts. The slower 60-mph train will burn
less fuel, so a cost of $6.96 per train mile is being assumed rising to $9.76 per mile for an equivalent-sized
300-seat train. Obviously these rising fuel costs will have a corresponding favorable impact on the
ridership forecast as well. Energy costs are adjusted each year in line with the relevant Energy
Information Administration forecasts.
18EIA diesel retail price in 2012 excluding the taxes http://www.eia.gov/petroleum/gasdiesel/
NORTHERN MICHIGAN RAIL RIDERSHIP FEASIBILITY AND COST ESTIMATE STUDY
Chapter 4: Operating Costs October 2018 Page 4-5
4.1.1.4 Onboard Services (OBS) Onboard service (OBS) costs are those expenses for providing food service onboard the trains. OBS adds
costs in three different areas: equipment, labor and cost of goods sold. Equipment capital and operating
cost is built into the cost of the trains and is not attributed to food catering specifically. Small 200-seat
trains cannot afford a dedicated dining or bistro car. Instead, if food service were to be offered, an OBS
employee or food service vendor would move through the train with a trolley cart, offering food and
beverages for sale to the passengers.
The goal of OBS franchising should be to ensure a reasonable profit for the provider of on-board services,
while maintaining a reasonable and affordable price structure for passengers. In previous studies, it has
been found that the key to attaining OBS profitability is selling enough products to recover the train mile
related labor costs. For example, if small 200-seat trains were used, given the assumed OBS cost structure,
even with a trolley cart service the OBS operator will be challenged to attain profitability. However, the
expanded customer base on larger 300-seat trains can provide a slight positive operating margin for OBS
service.
Because the trolley cart has been shown to double OBS revenues, it can result in profitable OBS
operations in situations where a bistro-only service would be hard-pressed to sell enough food to recover
its costs. While only a limited menu can be offered from a cart, the ready availability of food and
beverages at the customer’s seat is a proven strategy for increasing sales. Many customers appreciate the
convenience of a trolley cart service and are willing to purchase food items that are brought directly to
them. While some customers prefer stretching their legs and walking to a bistro car, other customers will
not bother to make the trip.
The cost of goods sold is estimated as 50 percent of OBS revenue, based on Amtrak’s route profitability
reports. Labor costs, including costs for commissary support and OBS supervision, have been estimated at:
An intermediate value of $2.69 per train mile was assumed for the high frequency 90-mph and
110-mph diesel options. This is a moderate level of crew cost that includes the need for some
away from home layover.
The low frequency 60-mph scenarios cost $3.85 per train mile. With trains operating less
frequently there is less opportunity to return crews to their home base on the same day, leading
to more split shifts and overnight layovers.
These costs are generally consistent with Amtrak’s level of wages and staffing approach for conventional
bistro car services. However, this study recommends that an experienced food service vendor provide
food services and use a trolley cart approach. A key technical requirement for providing trolley service is
to ensure the doors and vestibules between cars are designed to allow a cart to easily pass through. Since
trolley service is a standard feature on most European railways, most European rolling stock is designed to
accommodate the carts. Although convenient passageways often have not been provided on U.S.
equipment, the ability to support trolley carts is an important equipment design requirement for the
planned service.
NORTHERN MICHIGAN RAIL RIDERSHIP FEASIBILITY AND COST ESTIMATE STUDY
Chapter 4: Operating Costs October 2018 Page 4-6
4.1.1.5 Insurance Costs Liability costs were estimated at 1.47¢ per passenger-mile, the same rate that was assumed in the earlier
MWRRS study brought to 2017. Federal Employees Liability Act (FELA) costs are not included in this
category but are applied as an overhead to labor costs.
The Amtrak Reform and Accountability Act of 1997 (§161) originally provided for a limit of $200 Million on
passenger liability claims. In 2015, that limit was raised to $295 Million19
. Amtrak carries that level of
excess liability insurance, which allows Amtrak to fully indemnify the freight railroads in the event of a rail
accident. However, a General Accounting Office (GAO) review20
concluded that this liability cap applies to
commuter railroads as well as to Amtrak. If the GAO’s interpretation is correct, the liability cap may also
apply to other passenger rail operators as well. It is recommended that Michigan DOT seek legal advice on
this matter to determine whether the Great Lakes Central (GLC) or any other qualified operator would be
similarly protected under this law.
The GLC has advised that Canadian National is requiring a minimum of $200 million of liability coverage
before they will permit passenger operations over their tracks through Durand. Currently, GLC and the
Steam Railroading Institute only carry $25 million in liability coverage for their current excursion service,
so passenger trains cannot move south of Durand over the CN trackage. To be able to operate south of
Durand, GLC and the Steam Railroading Institute will need to purchase additional insurance that will fully
indemnify CN in case of an accident. Raising these limits would likely double their annual premium from
$500,000 per year up to $1,000,000 per year21
resulting in a cost increase of about $500,000 per year.
For validating this number, a start-up regularly scheduled passenger service at 60-mph has been
forecasted to generate 46.9 million passenger miles for year, in 2020 for a single round trip. At a 1.47¢ per
passenger-mile rate this generates an insurance cost of $689,792 each year for the new service. If GLC and
the Steam Railroading Institute were chosen to operate the scheduled service, this allocation for
insurance cost seems to be adequate for covering at least GLC’s incremental costs for purchasing the
additional insurance. Other potential operators are assumed to bring their own insurance and may offer
some economies of scale based on other lines that these entities may be operating. More specific costs
could likely be developed in conjunction with prospective operators including the Steam Railroading
Institute and GLC, as part of a more detailed, future feasibility study.
4.1.2 Fixed Route Costs This cost category includes those costs that, while largely independent of the number of train-miles
operated, can still be directly associated to the operation of specific routes. It includes such costs as track
maintenance, which varies by train technology, and station operations.
4.1.2.1 Track and Right-of-Way Costs Currently, it is industry practice for passenger train operators providing service on freight-owned rights-of-
way to pay for track access, dispatching and track maintenance. Rates for all these activities are ultimately
based upon a determination of the appropriate costs that result from negotiations between the parties.
The purpose here is to provide estimates based on the best available information; however, as the project
19See: https://www.nbcnews.com/news/us-news/amtrak-derailment-liabilities-capped-200-million-due-1997-law-n831071 20See: http://www.gao.gov/highlights/d04240high.pdf 21The North South “WALLY” line Commuter Rail Study estimated the cost of a $200 Million insurance policy as $1,030,000 per year. Additional casualty and insurance costs brought the total to $1,303,500 per year.
NORTHERN MICHIGAN RAIL RIDERSHIP FEASIBILITY AND COST ESTIMATE STUDY
Chapter 4: Operating Costs October 2018 Page 4-7
moves forward, additional study and discussions with the railroads and MDOT will be needed to further
refine these costs.
The costing basis assumed in this report is that of incremental or avoidable costs22
for shared tracks. The
passenger operator, however, must take full cost responsibility for maintaining any tracks that it must add
to the corridor either for its own use, or for mitigating delays to freight trains. The following cost
components are included within the Track and Right-of-Way category:
Track Maintenance Costs. Costs for track maintenance were estimated based on Zeta-Tech's
January 2004 draft technical monograph Estimating Maintenance Costs for Mixed High-Speed
Passenger and Freight Rail Corridors23
. Zeta-Tech costs have been adjusted for inflation to 2017.
However, Zeta-Tech's costs are conceptual and subject to negotiation with the freight railroads.
Dispatching Costs and Out-of-Pocket Reimbursement. Passenger service must also reimburse a
freight railroad's added costs for dispatching its line, providing employee efficiency tests and for
performing other services on behalf of the passenger operator. If the passenger operator does
not contract a freight railroad to provide these services, it must provide them itself. As a result,
costs for train dispatching and control are incurred on dedicated as well as shared tracks and are
now shown under a separate "Operations and Dispatch" cost category.
Costs for Access to Track and Right-of-Way. Access fees, particularly train mile fees incurred as
an operating expense, are specifically excluded from this calculation since the vast majority of the
corridor mileage is in public ownership and the passenger operator is paying for additional track
maintenance. Any access fees would have to be calculated and negotiated on a route-specific
and railroad-specific basis. Such a calculation would have to consider the value of the
infrastructure improvements made to the corridor for balancing up-front capital with ongoing
operating payments.24
Exhibit 4-2 shows the conceptual relationship between track maintenance cost and total tonnage that was
calibrated from the 2004 Zeta-Tech study. It shows a strong relationship between tonnage, FRA track class
(4 through 6, corresponding to a 79-mph to 110-mph track speed) and maintenance cost.
At low tonnage, the cost differential for maintaining a higher track class is not very large, but as tonnage
grows, so too does the added cost. For shared track, if freight needs only Class 4 track, the passenger
service would have to pay the difference, called the “maintenance increment”, which for a 25 MGT line as
shown in Exhibit 4-2, would come to about $22,000 per mile per year, including capital costs, in 2002
dollars25
. The required payment to reimburse a freight railroad for its added cost would be less for lower
freight tonnage, more for higher freight tonnage.
Exhibit 4-2 also shows the total track maintenance cost per mile as a function of traffic density, it also
breaks out the operating versus total cost, showing that capital (the difference between total and
operating cost) is a significant share of the total cost. For track maintenance:
22Avoidable costs are those that are eliminated or saved if an activity is discontinued. The term incremental is used to reference the change in costs that results from a management action that increases volume, whereas avoidable defines the change in costs that results from a management action that reduces volume. 23Zeta-Tech, a subsidiary of Harsco (a supplier of track maintenance machinery) is a rail consulting firm who specializes in development of track maintenance strategies, costs and related engineering economics. See a summary of this report athttp://onlinepubs.trb.org/onlinepubs/trnews/trnews255rpo.pdf. The full report is available upon request from the FRA. 24For 110-mph service, the level of infrastructure improvements to the corridor called for in this study should provide enough capacity to allow superior on-time performance for both freight and passenger operations 25 Calculated as $38,446 - $31,887 + ($2.440 – $1.810) * 25 = $22,309 per year. Note that the yellow highlighted cells in the table correspond to the three lines shown on the graph.
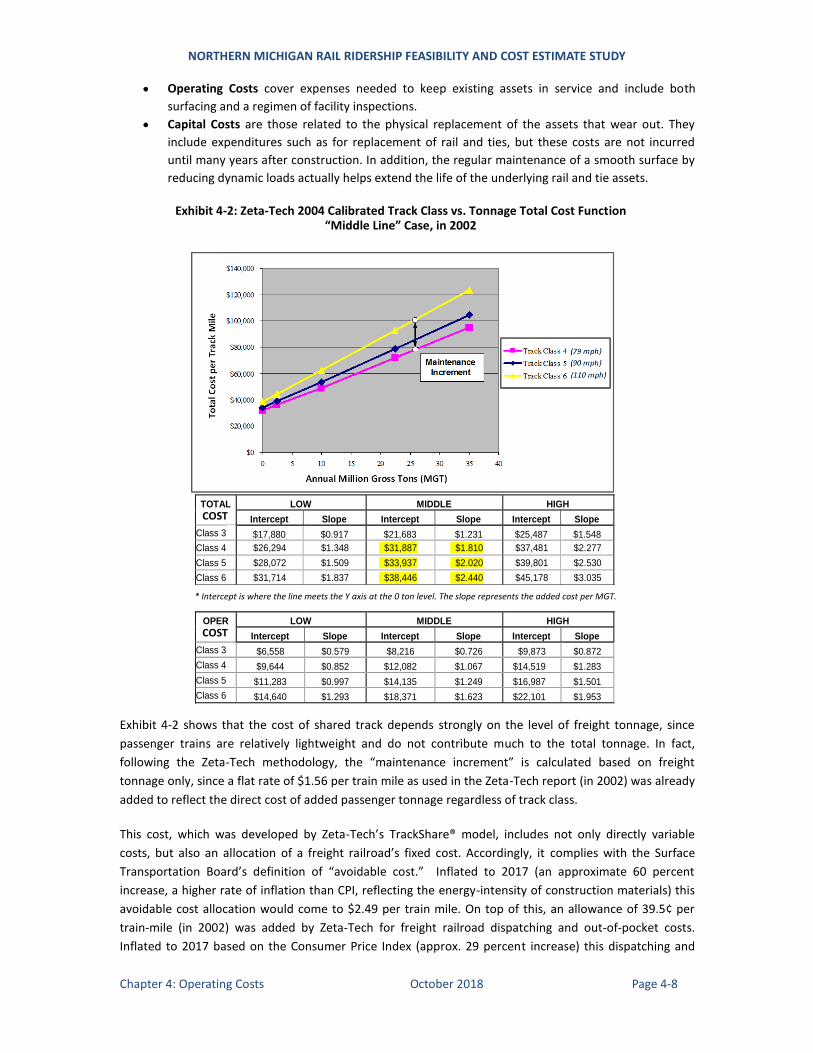
NORTHERN MICHIGAN RAIL RIDERSHIP FEASIBILITY AND COST ESTIMATE STUDY
Chapter 4: Operating Costs October 2018 Page 4-8
Operating Costs cover expenses needed to keep existing assets in service and include both
surfacing and a regimen of facility inspections.
Capital Costs are those related to the physical replacement of the assets that wear out. They
include expenditures such as for replacement of rail and ties, but these costs are not incurred
until many years after construction. In addition, the regular maintenance of a smooth surface by
reducing dynamic loads actually helps extend the life of the underlying rail and tie assets.
Exhibit 4-2: Zeta-Tech 2004 Calibrated Track Class vs. Tonnage Total Cost Function “Middle Line” Case, in 2002
Exhibit 4-2 shows that the cost of shared track depends strongly on the level of freight tonnage, since
passenger trains are relatively lightweight and do not contribute much to the total tonnage. In fact,
following the Zeta-Tech methodology, the “maintenance increment” is calculated based on freight
tonnage only, since a flat rate of $1.56 per train mile as used in the Zeta-Tech report (in 2002) was already
added to reflect the direct cost of added passenger tonnage regardless of track class.
This cost, which was developed by Zeta-Tech’s TrackShare® model, includes not only directly variable
costs, but also an allocation of a freight railroad’s fixed cost. Accordingly, it complies with the Surface
Transportation Board’s definition of “avoidable cost.” Inflated to 2017 (an approximate 60 percent
increase, a higher rate of inflation than CPI, reflecting the energy-intensity of construction materials) this
avoidable cost allocation would come to $2.49 per train mile. On top of this, an allowance of 39.5¢ per
train-mile (in 2002) was added by Zeta-Tech for freight railroad dispatching and out-of-pocket costs.
Inflated to 2017 based on the Consumer Price Index (approx. 29 percent increase) this dispatching and
TOTAL LOW MIDDLE HIGH
Intercept Slope Intercept Slope Intercept Slope
Class 31 $17,880 $0.917 $21,683 $1.231 $25,487 $1.548
Class 4 $26,294 $1.348 $31,887 $1.810 $37,481 $2.277
Class 5 $28,072 $1.509 $33,937 $2.020 $39,801 $2.530
Class 6 $31,714 $1.837 $38,446 $2.440 $45,178 $3.035
OPER LOW MIDDLE HIGH
Intercept Slope Intercept Slope Intercept Slope
Class 3 $6,558 $0.579 $8,216 $0.726 $9,873 $0.872
Class 4 $9,644 $0.852 $12,082 $1.067 $14,519 $1.283
Class 5 $11,283 $0.997 $14,135 $1.249 $16,987 $1.501
Class 6 $14,640 $1.293 $18,371 $1.623 $22,101 $1.953
1 The Class 3 estimate was constructed by applying 41/53 ratio, from Appendix of Zeta-Tech model that was attached to Amtrak’s letter of
Nov. 12, 2002. However, on November 11, 2003 Zeta-Tech recommended we use a value of $18,000 per mile for the total cost of Class 3
track, including Communications & Signals cost. Applying a 68% ratio to Class 4 costs equivalently scaled other values.
* Intercept is where the line meets the Y axis at the 0 ton level. The slope represents the added cost per MGT.
COST
COST
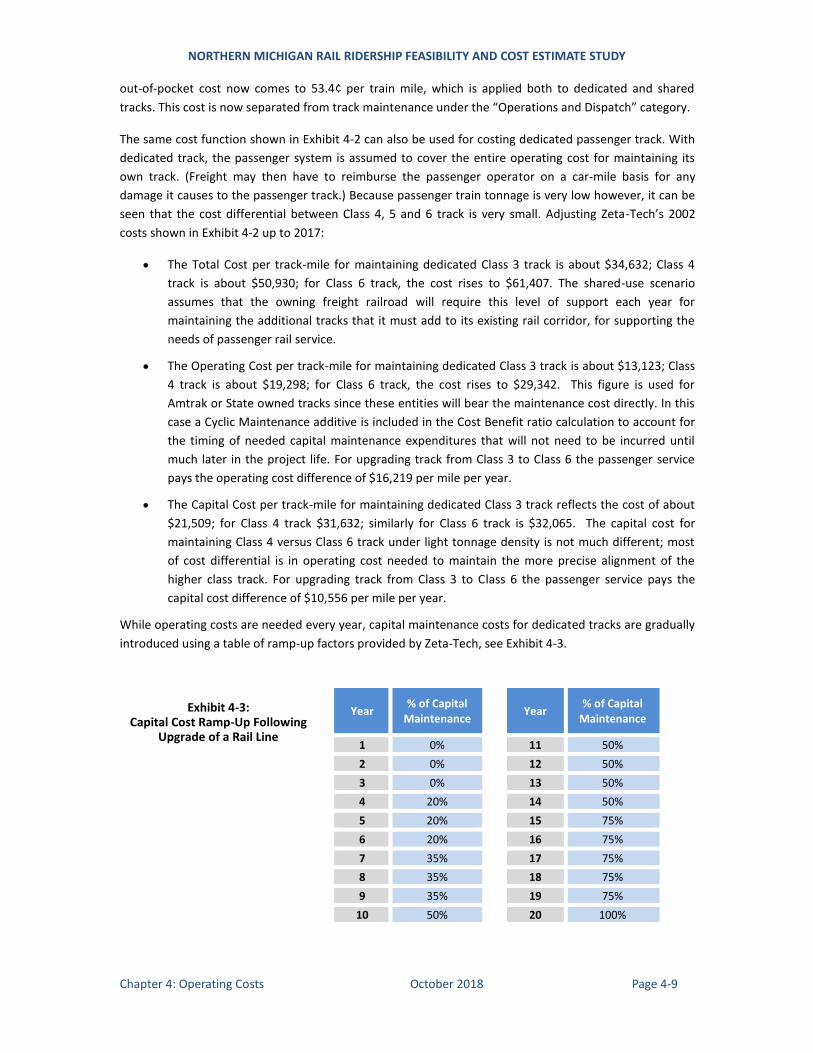
NORTHERN MICHIGAN RAIL RIDERSHIP FEASIBILITY AND COST ESTIMATE STUDY
Chapter 4: Operating Costs October 2018 Page 4-9
out-of-pocket cost now comes to 53.4¢ per train mile, which is applied both to dedicated and shared
tracks. This cost is now separated from track maintenance under the “Operations and Dispatch” category.
The same cost function shown in Exhibit 4-2 can also be used for costing dedicated passenger track. With
dedicated track, the passenger system is assumed to cover the entire operating cost for maintaining its
own track. (Freight may then have to reimburse the passenger operator on a car-mile basis for any
damage it causes to the passenger track.) Because passenger train tonnage is very low however, it can be
seen that the cost differential between Class 4, 5 and 6 track is very small. Adjusting Zeta-Tech’s 2002
costs shown in Exhibit 4-2 up to 2017:
The Total Cost per track-mile for maintaining dedicated Class 3 track is about $34,632; Class 4
track is about $50,930; for Class 6 track, the cost rises to $61,407. The shared-use scenario
assumes that the owning freight railroad will require this level of support each year for
maintaining the additional tracks that it must add to its existing rail corridor, for supporting the
needs of passenger rail service.
The Operating Cost per track-mile for maintaining dedicated Class 3 track is about $13,123; Class
4 track is about $19,298; for Class 6 track, the cost rises to $29,342. This figure is used for
Amtrak or State owned tracks since these entities will bear the maintenance cost directly. In this
case a Cyclic Maintenance additive is included in the Cost Benefit ratio calculation to account for
the timing of needed capital maintenance expenditures that will not need to be incurred until
much later in the project life. For upgrading track from Class 3 to Class 6 the passenger service
pays the operating cost difference of $16,219 per mile per year.
The Capital Cost per track-mile for maintaining dedicated Class 3 track reflects the cost of about
$21,509; for Class 4 track $31,632; similarly for Class 6 track is $32,065. The capital cost for
maintaining Class 4 versus Class 6 track under light tonnage density is not much different; most
of cost differential is in operating cost needed to maintain the more precise alignment of the
higher class track. For upgrading track from Class 3 to Class 6 the passenger service pays the
capital cost difference of $10,556 per mile per year.
While operating costs are needed every year, capital maintenance costs for dedicated tracks are gradually
introduced using a table of ramp-up factors provided by Zeta-Tech, see Exhibit 4-3.
Exhibit 4-3: Capital Cost Ramp-Up Following
Upgrade of a Rail Line
Year
% of Capital Maintenance
Year
% of Capital Maintenance
1 0% 11 50%
2 0% 12 50%
3 0% 13 50%
4 20% 14 50%
5 20% 15 75%
6 20% 16 75%
7 35% 17 75%
8 35% 18 75%
9 35% 19 75%
10 50% 20 100%
Year
% of Capital Maintenance
Year
% of Capital Maintenance
1 0% 11 50%
2 0% 12 50%
3 0% 13 50%
4 20% 14 50%
5 20% 15 75%
6 20% 16 75%
7 35% 17 75%
8 35% 18 75%
9 35% 19 75%
10 50% 20 100%
NORTHERN MICHIGAN RAIL RIDERSHIP FEASIBILITY AND COST ESTIMATE STUDY
Chapter 4: Operating Costs October 2018 Page 4-10
A fully normalized capital maintenance level is not reached until 20 years after completion of the rail
construction program. This is used for calculating “Cyclic Maintenance” in the Benefit Cost Analysis. But
because Cyclic Maintenance is not an Operating Cost under generally accepted accounting principles
(GAAP) accounting methodology, it is not normally included in the Operating Ratio calculation.
4.1.2.2 Station Operations A simplified fare structure, heavy reliance upon electronic ticketing and avoidance of a reservation system
will minimize station personnel requirements. As originally assumed by the MWRRS study, station costs
include personnel, ticket machines and station operating expenses, updated for inflation.
Staffed stations will be assumed at major stations. All stations will be assumed open for two
shifts. The cost for the staffed stations includes eight positions at each new location, costing
$788,250 per year, as well as the cost of utilities, ticket machines, cleaning and basic facility
maintenance.
The cost for unstaffed stations covers the cost of utilities, ticket machines, cleaning and basic
facility maintenance, costing $84,770 per year. (These costs are also included in the staffed
station cost.) Volunteer personnel such as Traveler's Aid, if desired could staff these stations.
Since three of the proposed stations already exist, it is assumed that the system would add 11 unstaffed
stations at a cost of $932,470 per year. Consistent with modern approaches it is assumed that the local
communities would staff the station using Traveler’s Aid or local tourism volunteers. Any additional
station services would be provided by the local communities.
4.1.2.3 System Overhead Costs The category of System Overhead largely consists of Service Administration or management overheads,
covering such needs as the corporate procurement, human resources, accounting, finance and
information technology functions as well as call center administration. A stand-alone administrative
organization appropriate for the operation of a corridor system was developed for the MWRRS and later
refined for the Ohio Hub studies. This organizational structure, which was developed with Amtrak’s input
and had a fixed cost of $8.9 Million plus $1.43 per train-mile (in 2002) for added staff requirements as the
system grew. Inflated to 2017, this became $12.1 Million plus $1.93 per train mile. However, the Sales
and Marketing category also has a substantial fixed cost component for advertising and call center
expense, adding another $3.1 Million per year fixed cost, plus variable call center expenses of 74.5¢ per
rider, all in 2017 dollars26
. Finally, credit card (1.8 percent of revenue) and travel agency commissions (1
percent) are all variable. In addition, the system operator was allowed a 10 percent markup on certain
direct costs as an allowance for operator profit.
Therefore, the overall financial model for a stand-alone organization therefore has $15.2 Million ($12.1 +
$3.1 Million) annually in fixed cost for administrative, sales and marketing expenses. Since this service is
costed on an incremental basis the $15.2 Million in fixed administrative, sales and marketing expenses can
be ignored since the rail operator would incur these costs regardless of whether the new service is added
26In the MWRRS cost model, call center costs were built up directly from ridership, assuming 40 percent of all riders call for information, and that the average information call will take 5 minutes for each round trip. Call center costs, therefore, are variable by rider and not by train-mile. Assuming some flexibility for assigning personnel to accommodate peaks in volume and a 20 percent staffing contingency, variable costs came to 57¢ per rider. These were inflated to 66¢ per rider in $2008 and now 74.5¢ per rider in 2017.
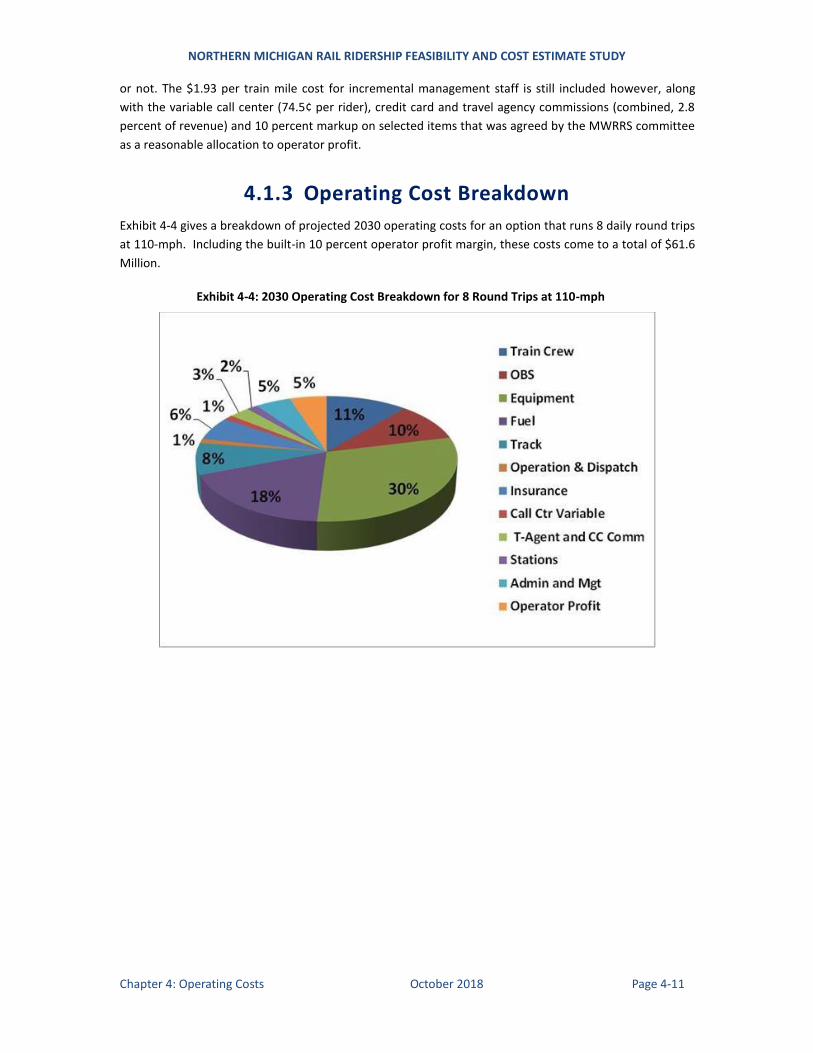
NORTHERN MICHIGAN RAIL RIDERSHIP FEASIBILITY AND COST ESTIMATE STUDY
Chapter 4: Operating Costs October 2018 Page 4-11
or not. The $1.93 per train mile cost for incremental management staff is still included however, along
with the variable call center (74.5¢ per rider), credit card and travel agency commissions (combined, 2.8
percent of revenue) and 10 percent markup on selected items that was agreed by the MWRRS committee
as a reasonable allocation to operator profit.
4.1.3 Operating Cost Breakdown
Exhibit 4-4 gives a breakdown of projected 2030 operating costs for an option that runs 8 daily round trips
at 110-mph. Including the built-in 10 percent operator profit margin, these costs come to a total of $61.6
Million.
Exhibit 4-4: 2030 Operating Cost Breakdown for 8 Round Trips at 110-mph

NORTHERN MICHIGAN RAIL RIDERSHIP FEASIBILITY AND COST ESTIMATE STUDY
Chapter 4: Operating Costs October 2018 Page 4-12
This page intentionally left blank
NORTHERN MICHIGAN RAIL RIDERSHIP FEASIBILITY AND COST ESTIMATE STUDY
Chapter 5: Capital Costs October 2018 Page 5-1
Chapter 5 Capital Costs
S U M M A R Y
This chapter estimates Capital Costs for the 110-mph and includes a discussion of the Capital Cost
methodology and possible phasing and cost sensitivities. These costs are consistent with the 110-mph
operating plan and train running times that were used as the input to the evaluation process. The unit
capital costs for estimating infrastructure, equipment, and maintenance facility capital costs are also
described to develop planning level costs.
5.1 Introduction
While the ultimate objective for this study is to develop a 110-mph option, an incremental build out
strategy for reaching that speed is very important. As such, this chapter will also discuss the likely cost
implications for 60-mph and 90-mph services based on currently available data.
For a 110-mph option, much of the current infrastructure would be completely replaced, so the cost can
be estimated based on well-known unit cost factors without much regard to existing conditions. But the
lower speed 60-mph and 90-mph options will likely rely much more on reusing existing rail infrastructure.
One of the challenges in developing cost estimates for slower speeds is the current weakness of the
existing conditions assessment, particularly in regard to rail weight, condition and defect history.
As a result, costs for 60 and 90-mph options can be estimated based on certain assumptions, but more
work will be needed the future to confirm these assumptions. The better the data upon which the
estimate is based, the tighter can be the error range of the estimate. This will require a careful field
verification of existing conditions which is beyond the scope and funding available in the current study.
Another factor in the study is that some short segments of the corridor are not under public ownership. It
has been suggested that certain segments of rail line may be purchased by a public entity such as
Michigan Department of Transportation (MDOT) under terms similar to what Norfolk Southern agreed for
its recent conveyance of the Dearborn to Kalamazoo rail line for the accelerated rail program. This would
enable the proposed 110-mph services to be operated over MDOT tracks without violating any freight
railroad principles. However, the final capital plan and capital costs for shared segments as well as the
possibility of track and/or right-of-way conveyance will need to be worked out in negotiations with the
freight railroads. Because of this, it is possible that some costs could vary from these preliminary
estimates.
In the meantime, this report contains preliminary data which is subject to review, verification and
approval by both the Great Lakes Central (GLC) and the Canadian National Railroad (CN). As of the date of
this report, this review process has not taken place. Findings are not to be construed as a commitment on
the part of either GLC or CN to operate additional service.
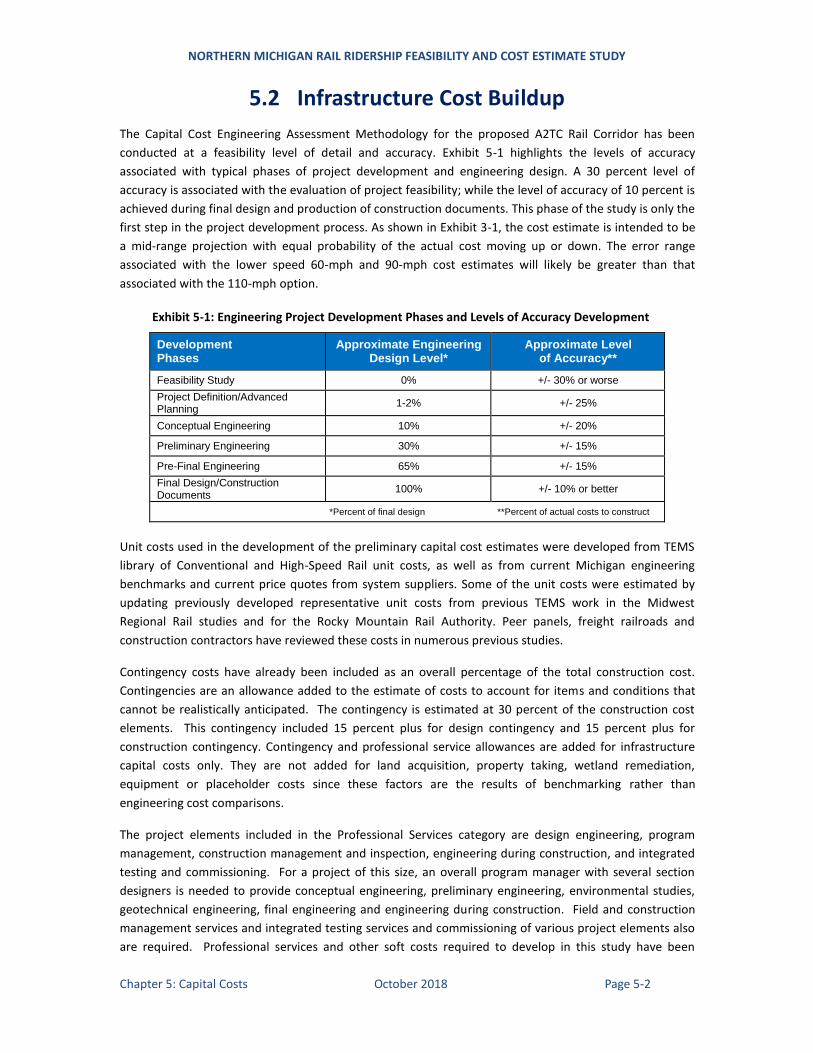
NORTHERN MICHIGAN RAIL RIDERSHIP FEASIBILITY AND COST ESTIMATE STUDY
Chapter 5: Capital Costs October 2018 Page 5-2
5.2 Infrastructure Cost Buildup
The Capital Cost Engineering Assessment Methodology for the proposed A2TC Rail Corridor has been
conducted at a feasibility level of detail and accuracy. Exhibit 5-1 highlights the levels of accuracy
associated with typical phases of project development and engineering design. A 30 percent level of
accuracy is associated with the evaluation of project feasibility; while the level of accuracy of 10 percent is
achieved during final design and production of construction documents. This phase of the study is only the
first step in the project development process. As shown in Exhibit 3-1, the cost estimate is intended to be
a mid-range projection with equal probability of the actual cost moving up or down. The error range
associated with the lower speed 60-mph and 90-mph cost estimates will likely be greater than that
associated with the 110-mph option.
Exhibit 5-1: Engineering Project Development Phases and Levels of Accuracy Development
Development Phases
Approximate Engineering Design Level*
Approximate Level of Accuracy**
Feasibility Study 0% +/- 30% or worse
Project Definition/Advanced Planning
1-2% +/- 25%
Conceptual Engineering 10% +/- 20%
Preliminary Engineering 30% +/- 15%
Pre-Final Engineering 65% +/- 15%
Final Design/Construction Documents
100% +/- 10% or better
*Percent of final design **Percent of actual costs to construct
Unit costs used in the development of the preliminary capital cost estimates were developed from TEMS
library of Conventional and High-Speed Rail unit costs, as well as from current Michigan engineering
benchmarks and current price quotes from system suppliers. Some of the unit costs were estimated by
updating previously developed representative unit costs from previous TEMS work in the Midwest
Regional Rail studies and for the Rocky Mountain Rail Authority. Peer panels, freight railroads and
construction contractors have reviewed these costs in numerous previous studies.
Contingency costs have already been included as an overall percentage of the total construction cost.
Contingencies are an allowance added to the estimate of costs to account for items and conditions that
cannot be realistically anticipated. The contingency is estimated at 30 percent of the construction cost
elements. This contingency included 15 percent plus for design contingency and 15 percent plus for
construction contingency. Contingency and professional service allowances are added for infrastructure
capital costs only. They are not added for land acquisition, property taking, wetland remediation,
equipment or placeholder costs since these factors are the results of benchmarking rather than
engineering cost comparisons.
The project elements included in the Professional Services category are design engineering, program
management, construction management and inspection, engineering during construction, and integrated
testing and commissioning. For a project of this size, an overall program manager with several section
designers is needed to provide conceptual engineering, preliminary engineering, environmental studies,
geotechnical engineering, final engineering and engineering during construction. Field and construction
management services and integrated testing services and commissioning of various project elements also
are required. Professional services and other soft costs required to develop in this study have been
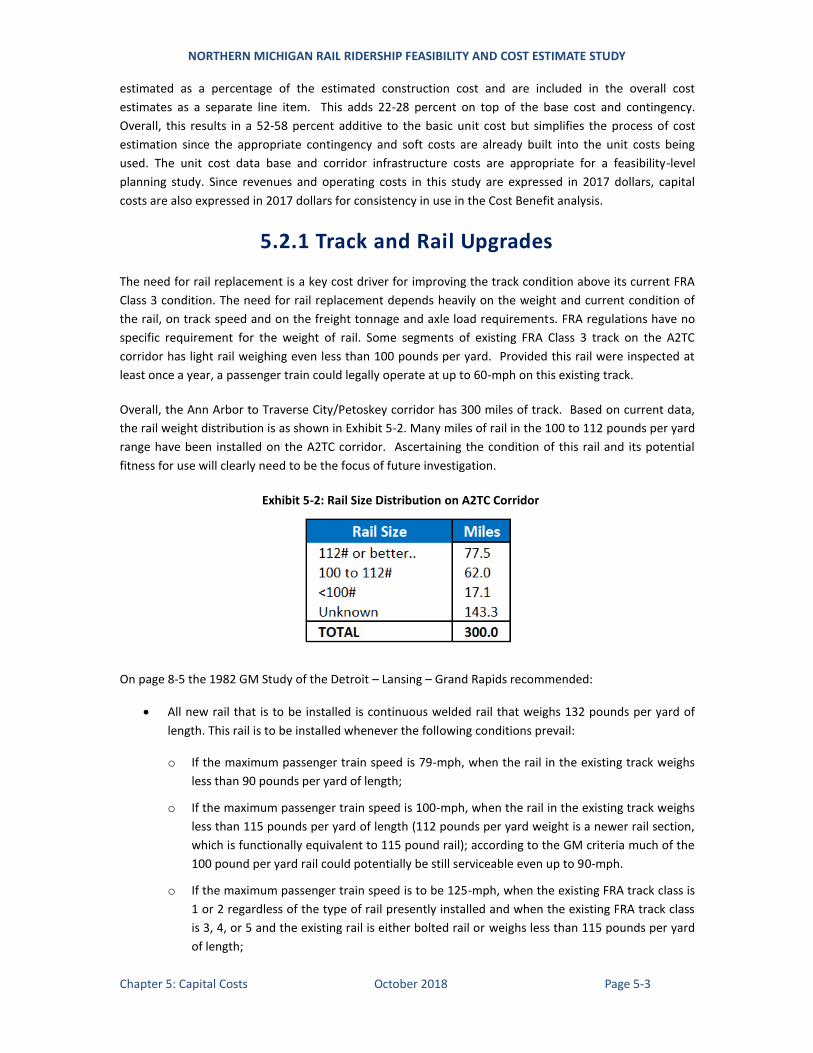
NORTHERN MICHIGAN RAIL RIDERSHIP FEASIBILITY AND COST ESTIMATE STUDY
Chapter 5: Capital Costs October 2018 Page 5-3
estimated as a percentage of the estimated construction cost and are included in the overall cost
estimates as a separate line item. This adds 22-28 percent on top of the base cost and contingency.
Overall, this results in a 52-58 percent additive to the basic unit cost but simplifies the process of cost
estimation since the appropriate contingency and soft costs are already built into the unit costs being
used. The unit cost data base and corridor infrastructure costs are appropriate for a feasibility-level
planning study. Since revenues and operating costs in this study are expressed in 2017 dollars, capital
costs are also expressed in 2017 dollars for consistency in use in the Cost Benefit analysis.
5.2.1 Track and Rail Upgrades
The need for rail replacement is a key cost driver for improving the track condition above its current FRA
Class 3 condition. The need for rail replacement depends heavily on the weight and current condition of
the rail, on track speed and on the freight tonnage and axle load requirements. FRA regulations have no
specific requirement for the weight of rail. Some segments of existing FRA Class 3 track on the A2TC
corridor has light rail weighing even less than 100 pounds per yard. Provided this rail were inspected at
least once a year, a passenger train could legally operate at up to 60-mph on this existing track.
Overall, the Ann Arbor to Traverse City/Petoskey corridor has 300 miles of track. Based on current data,
the rail weight distribution is as shown in Exhibit 5-2. Many miles of rail in the 100 to 112 pounds per yard
range have been installed on the A2TC corridor. Ascertaining the condition of this rail and its potential
fitness for use will clearly need to be the focus of future investigation.
Exhibit 5-2: Rail Size Distribution on A2TC Corridor
On page 8-5 the 1982 GM Study of the Detroit – Lansing – Grand Rapids recommended:
All new rail that is to be installed is continuous welded rail that weighs 132 pounds per yard of
length. This rail is to be installed whenever the following conditions prevail:
o If the maximum passenger train speed is 79-mph, when the rail in the existing track weighs
less than 90 pounds per yard of length;
o If the maximum passenger train speed is 100-mph, when the rail in the existing track weighs
less than 115 pounds per yard of length (112 pounds per yard weight is a newer rail section,
which is functionally equivalent to 115 pound rail); according to the GM criteria much of the
100 pound per yard rail could potentially be still serviceable even up to 90-mph.
o If the maximum passenger train speed is to be 125-mph, when the existing FRA track class is
1 or 2 regardless of the type of rail presently installed and when the existing FRA track class
is 3, 4, or 5 and the existing rail is either bolted rail or weighs less than 115 pounds per yard
of length;
NORTHERN MICHIGAN RAIL RIDERSHIP FEASIBILITY AND COST ESTIMATE STUDY
Chapter 5: Capital Costs October 2018 Page 5-4
The GM criteria are silent on rail requirements at 60-mph. However when R. L. Banks in 2008 assessed
the WALLY line, they applied a slightly more stringent criterion for rail replacement than GM did. At 79-
mph or less, GM defined the replacement threshold as 90 pounds per yard or less, but R. L. Banks defined
it as 100 pounds per yard or less. As such the need for replacing the 100 pound rail could be considered a
“disputable matter” from an Engineering point of view since it is quite possible, based on further detailed
analysis that much of this rail could still be found to be in a serviceable condition, especially for light
tonnage applications.
However, freight requirements also have a strong influence on the rail replacement decision. Freight
trains need strong infrastructure for an ever-increasing share of heavy axle load cars. Since the Howell to
Ann Arbor link is the highest density segment of the GLC, it seems likely that R. L. Banks took this into
account when they suggested using 100 pounds per yard as the condemning limit for their WALLY line
study. In fact, since the time of that study, nearly all light weight rail between Ann Arbor and Howell has
already been replaced with the heavier 112 pound per yard rail section.
In fact, MDOT advised the study team that it plans to replace all rail south of Cadillac to support economic
development along the corridor, which is resulting in growth in its freight business. Already, MDOT has
funded a $2 million shipment of 15 miles of welded rail for strengthening curves. However, it is clear that
the need for this rail replacement is clearly driven by freight rather than by passenger requirements.
As a result, a more sophisticated, detailed assessment is needed to develop a more nuanced approach to
rail replacement. This can be developed in the next phase of work. For example: it might prove feasible
to retain existing 100 pound rail on the light density trackage north of Cadillac, and maybe even to
cascade serviceable 100 pound rail from the south to the north end of the line. This way, new rail could be
applied to the high tonnage freight territory on the south end of the line, while salvaged materials could
be reused for reducing the rehabilitation costs for the north end of the line.
As the GM criteria suggested, track speed is also an important consideration that drives the need for rail
replacement. As shown in Exhibit 2-23:
13 percent of the A2TC rail line will remain at 60-mph or less. Rail replacement is technically not
needed at this low passenger speed, except for supporting the requirements of freight trains.
48 percent of the A2TC rail line would operate at speeds in the 60 to 90-mph range. In this range
any rail less than 100 pounds per yard should be changed out. However, some 100-pound rail
might remain serviceable, except for supporting the requirements of freight trains.
Only 39 percent of the A2TC alignment is capable of supporting speeds exceeding 90-mph. North
of Cadillac to Traverse City, only 12 percent of the miles exceed 90-mph. High speed track should
have 112 pound or better welded rail. Any serviceable 100 pound rail removed from high speed
segments might conceivably be cascaded to the north end of the line. This requires further
analysis.
It is clear that rail investment should first target areas of light rail less than 100 pounds per yard, curves,
and areas of high freight train density and potential zones of high speed operation. Beyond this, a
detailed engineering assessment is needed for accurately determining the requirement for replacing the
rail. In the next phase of work, a more detailed assessment should seek to optimize the infrastructure
investment strategy for the whole line, balancing the needs of freight and passenger service. Such an
assessment should be supported by a field data collection effort to inventory and accurately assess all the
current rail weights and conditions along the line.
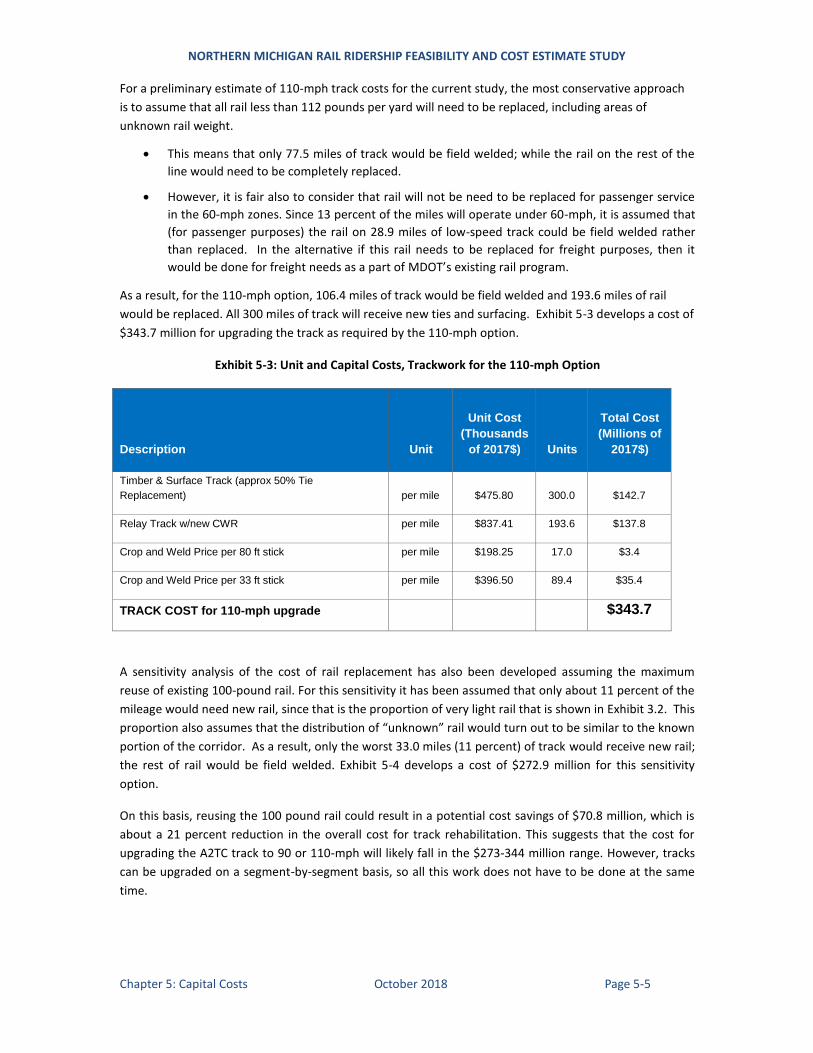
NORTHERN MICHIGAN RAIL RIDERSHIP FEASIBILITY AND COST ESTIMATE STUDY
Chapter 5: Capital Costs October 2018 Page 5-5
For a preliminary estimate of 110-mph track costs for the current study, the most conservative approach
is to assume that all rail less than 112 pounds per yard will need to be replaced, including areas of
unknown rail weight.
This means that only 77.5 miles of track would be field welded; while the rail on the rest of the
line would need to be completely replaced.
However, it is fair also to consider that rail will not be need to be replaced for passenger service
in the 60-mph zones. Since 13 percent of the miles will operate under 60-mph, it is assumed that
(for passenger purposes) the rail on 28.9 miles of low-speed track could be field welded rather
than replaced. In the alternative if this rail needs to be replaced for freight purposes, then it
would be done for freight needs as a part of MDOT’s existing rail program.
As a result, for the 110-mph option, 106.4 miles of track would be field welded and 193.6 miles of rail
would be replaced. All 300 miles of track will receive new ties and surfacing. Exhibit 5-3 develops a cost of
$343.7 million for upgrading the track as required by the 110-mph option.
Exhibit 5-3: Unit and Capital Costs, Trackwork for the 110-mph Option
Description Unit
Unit Cost
(Thousands
of 2017$) Units
Total Cost
(Millions of
2017$)
Timber & Surface Track (approx 50% Tie
Replacement) per mile $475.80 300.0 $142.7
Relay Track w/new CWR per mile $837.41 193.6 $137.8
Crop and Weld Price per 80 ft stick per mile $198.25 17.0 $3.4
Crop and Weld Price per 33 ft stick per mile $396.50 89.4 $35.4
TRACK COST for 110-mph upgrade $343.7
A sensitivity analysis of the cost of rail replacement has also been developed assuming the maximum
reuse of existing 100-pound rail. For this sensitivity it has been assumed that only about 11 percent of the
mileage would need new rail, since that is the proportion of very light rail that is shown in Exhibit 3.2. This
proportion also assumes that the distribution of “unknown” rail would turn out to be similar to the known
portion of the corridor. As a result, only the worst 33.0 miles (11 percent) of track would receive new rail;
the rest of rail would be field welded. Exhibit 5-4 develops a cost of $272.9 million for this sensitivity
option.
On this basis, reusing the 100 pound rail could result in a potential cost savings of $70.8 million, which is
about a 21 percent reduction in the overall cost for track rehabilitation. This suggests that the cost for
upgrading the A2TC track to 90 or 110-mph will likely fall in the $273-344 million range. However, tracks
can be upgraded on a segment-by-segment basis, so all this work does not have to be done at the same
time.
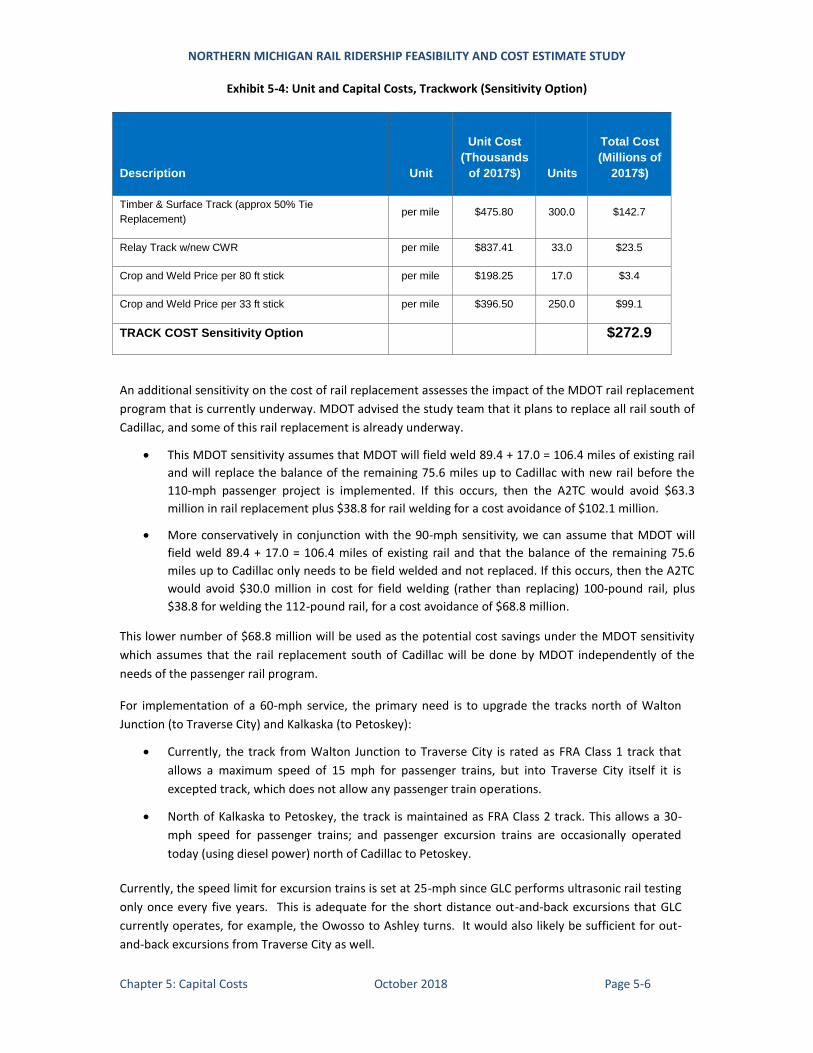
NORTHERN MICHIGAN RAIL RIDERSHIP FEASIBILITY AND COST ESTIMATE STUDY
Chapter 5: Capital Costs October 2018 Page 5-6
Exhibit 5-4: Unit and Capital Costs, Trackwork (Sensitivity Option)
Description Unit
Unit Cost
(Thousands
of 2017$) Units
Total Cost
(Millions of
2017$)
Timber & Surface Track (approx 50% Tie
Replacement) per mile $475.80 300.0 $142.7
Relay Track w/new CWR per mile $837.41 33.0 $23.5
Crop and Weld Price per 80 ft stick per mile $198.25 17.0 $3.4
Crop and Weld Price per 33 ft stick per mile $396.50 250.0 $99.1
TRACK COST Sensitivity Option $272.9
An additional sensitivity on the cost of rail replacement assesses the impact of the MDOT rail replacement
program that is currently underway. MDOT advised the study team that it plans to replace all rail south of
Cadillac, and some of this rail replacement is already underway.
This MDOT sensitivity assumes that MDOT will field weld 89.4 + 17.0 = 106.4 miles of existing rail
and will replace the balance of the remaining 75.6 miles up to Cadillac with new rail before the
110-mph passenger project is implemented. If this occurs, then the A2TC would avoid $63.3
million in rail replacement plus $38.8 for rail welding for a cost avoidance of $102.1 million.
More conservatively in conjunction with the 90-mph sensitivity, we can assume that MDOT will
field weld 89.4 + 17.0 = 106.4 miles of existing rail and that the balance of the remaining 75.6
miles up to Cadillac only needs to be field welded and not replaced. If this occurs, then the A2TC
would avoid $30.0 million in cost for field welding (rather than replacing) 100-pound rail, plus
$38.8 for welding the 112-pound rail, for a cost avoidance of $68.8 million.
This lower number of $68.8 million will be used as the potential cost savings under the MDOT sensitivity
which assumes that the rail replacement south of Cadillac will be done by MDOT independently of the
needs of the passenger rail program.
For implementation of a 60-mph service, the primary need is to upgrade the tracks north of Walton
Junction (to Traverse City) and Kalkaska (to Petoskey):
Currently, the track from Walton Junction to Traverse City is rated as FRA Class 1 track that
allows a maximum speed of 15 mph for passenger trains, but into Traverse City itself it is
excepted track, which does not allow any passenger train operations.
North of Kalkaska to Petoskey, the track is maintained as FRA Class 2 track. This allows a 30-
mph speed for passenger trains; and passenger excursion trains are occasionally operated
today (using diesel power) north of Cadillac to Petoskey.
Currently, the speed limit for excursion trains is set at 25-mph since GLC performs ultrasonic rail testing
only once every five years. This is adequate for the short distance out-and-back excursions that GLC
currently operates, for example, the Owosso to Ashley turns. It would also likely be sufficient for out-
and-back excursions from Traverse City as well.
NORTHERN MICHIGAN RAIL RIDERSHIP FEASIBILITY AND COST ESTIMATE STUDY
Chapter 5: Capital Costs October 2018 Page 5-7
If it were desired however, to start running charter excursions, as for example, from Ann Arbor to
Traverse City or Williamsburg, then to raise passenger train speeds above 25-mph on the existing Class
3 track, the rail would need to be tested every year. As a result, the need for track upgrades for
supporting excursion trains may be different than what is needed for supporting regularly scheduled
trains:
For Excursion Trains to Traverse City: If charters from Ann Arbor are going to be part of the
excursion plan, then the track should be brought up to FRA Class 3 to match the rest of the line
for permitting a 60-mph top speed, and this would also require that GLC shorten the rail
inspection intervals. For short distance out-and-back excursions an upgrade to FRA Class 2
would suffice. These issues require further analysis.
For Scheduled Trains to Traverse City: For the long term, development of the Beitner
Connection track (see Exhibit 2-6) south of Traverse City should be considered. The need for
the track connection hinges on the need for future extension of rail service beyond Traverse
City to Williamsburg. This also requires further analysis.
The cost for a 60-mph track upgrade to Traverse City has been estimated as $11.9 million assuming the
existing rail is used. Obviously, it would be best to change the rail and upgrade the track at the same
time, so as to avoid spike-killing the crossties.
The $11.9 million cost assumes a timber and surfacing program at $475.80 per mile, without any rail
replacement for the 25 miles from Walton Jct to Traverse City. The cost for the track upgrade to
Petoskey has similarly been estimated as $23.8 million, based on 50 miles from Kalkaska to Petoskey
In summary, track costs have been tentatively estimated as $343.7 for 110-mph; $272.9 for 90-mph (at
the low end of the sensitivity range) and $35.7 million for 60-mph.
5.2.2 Bridges An inventory of bridges has been developed for the A2TC corridor. Most of the bridges along the line are
in good condition; but 17 bridges along the line have been identified that need repairs. Only one, the
Manistee River bridge north of Cadillac has a weight restriction, but all 17 bridges have speed restrictions
that need to be eliminated for the 90 and 110-mph passenger services. Repairing the bridges, particularly
the Manistee River Bridge, will also have a substantial freight benefit which should be quantified as a
potential offset to the bridge repair cost.
Michigan DOT has provided a cost of $44.7 million for repairing all the bridges along the line. It will be
assumed that the 60-mph option will accept the current speed restrictions and can continue to use the
bridges as they are, at least in the short term. In conclusion, bridge upgrade costs have been tentatively
estimated as $44.7 million for 90 and 110-mph; and zero for the 60-mph option.
5.2.3 Train Control Systems Capital cost estimates for this study include costs to upgrade the train control and signal systems. Modern
signal systems rely on digital communication systems for data transmission using radio, fiber optic cables
or a combination or the two. Alstom has provided a verbal non-binding budgetary-level cost estimate for a
modern ITCS Positive Train Control (PTC) system for the A2TC corridor. This system would differ from
traditional signal systems since it would use GPS rather than track circuits to precisely determine the
position and velocity of each train. Using GPS the position of each train can be determined to within a few
feet, overcoming the coarseness of track circuit-based positioning which may only be accurate to a few
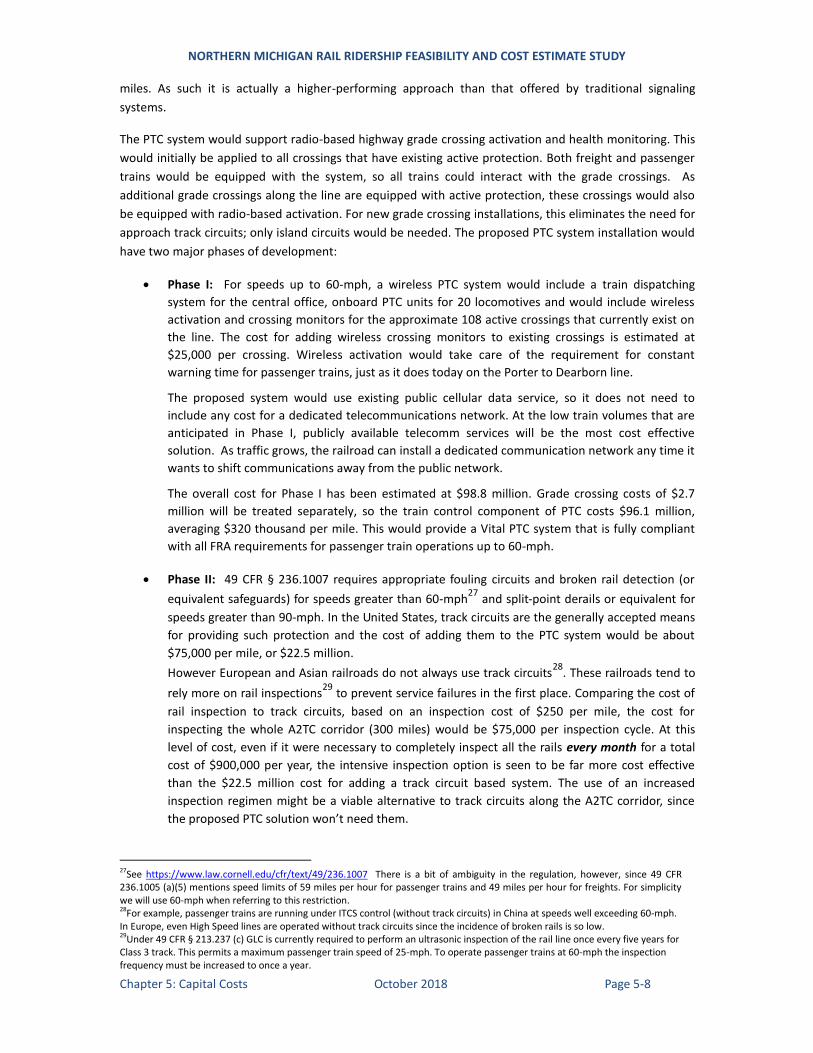
NORTHERN MICHIGAN RAIL RIDERSHIP FEASIBILITY AND COST ESTIMATE STUDY
Chapter 5: Capital Costs October 2018 Page 5-8
miles. As such it is actually a higher-performing approach than that offered by traditional signaling
systems.
The PTC system would support radio-based highway grade crossing activation and health monitoring. This
would initially be applied to all crossings that have existing active protection. Both freight and passenger
trains would be equipped with the system, so all trains could interact with the grade crossings. As
additional grade crossings along the line are equipped with active protection, these crossings would also
be equipped with radio-based activation. For new grade crossing installations, this eliminates the need for
approach track circuits; only island circuits would be needed. The proposed PTC system installation would
have two major phases of development:
Phase I: For speeds up to 60-mph, a wireless PTC system would include a train dispatching
system for the central office, onboard PTC units for 20 locomotives and would include wireless
activation and crossing monitors for the approximate 108 active crossings that currently exist on
the line. The cost for adding wireless crossing monitors to existing crossings is estimated at
$25,000 per crossing. Wireless activation would take care of the requirement for constant
warning time for passenger trains, just as it does today on the Porter to Dearborn line.
The proposed system would use existing public cellular data service, so it does not need to
include any cost for a dedicated telecommunications network. At the low train volumes that are
anticipated in Phase I, publicly available telecomm services will be the most cost effective
solution. As traffic grows, the railroad can install a dedicated communication network any time it
wants to shift communications away from the public network.
The overall cost for Phase I has been estimated at $98.8 million. Grade crossing costs of $2.7
million will be treated separately, so the train control component of PTC costs $96.1 million,
averaging $320 thousand per mile. This would provide a Vital PTC system that is fully compliant
with all FRA requirements for passenger train operations up to 60-mph.
Phase II: 49 CFR § 236.1007 requires appropriate fouling circuits and broken rail detection (or
equivalent safeguards) for speeds greater than 60-mph27
and split-point derails or equivalent for
speeds greater than 90-mph. In the United States, track circuits are the generally accepted means
for providing such protection and the cost of adding them to the PTC system would be about
$75,000 per mile, or $22.5 million.
However European and Asian railroads do not always use track circuits28
. These railroads tend to
rely more on rail inspections29
to prevent service failures in the first place. Comparing the cost of
rail inspection to track circuits, based on an inspection cost of $250 per mile, the cost for
inspecting the whole A2TC corridor (300 miles) would be $75,000 per inspection cycle. At this
level of cost, even if it were necessary to completely inspect all the rails every month for a total
cost of $900,000 per year, the intensive inspection option is seen to be far more cost effective
than the $22.5 million cost for adding a track circuit based system. The use of an increased
inspection regimen might be a viable alternative to track circuits along the A2TC corridor, since
the proposed PTC solution won’t need them.
27See https://www.law.cornell.edu/cfr/text/49/236.1007 There is a bit of ambiguity in the regulation, however, since 49 CFR 236.1005 (a)(5) mentions speed limits of 59 miles per hour for passenger trains and 49 miles per hour for freights. For simplicity we will use 60-mph when referring to this restriction. 28For example, passenger trains are running under ITCS control (without track circuits) in China at speeds well exceeding 60-mph. In Europe, even High Speed lines are operated without track circuits since the incidence of broken rails is so low. 29Under 49 CFR § 213.237 (c) GLC is currently required to perform an ultrasonic inspection of the rail line once every five years for Class 3 track. This permits a maximum passenger train speed of 25-mph. To operate passenger trains at 60-mph the inspection frequency must be increased to once a year.
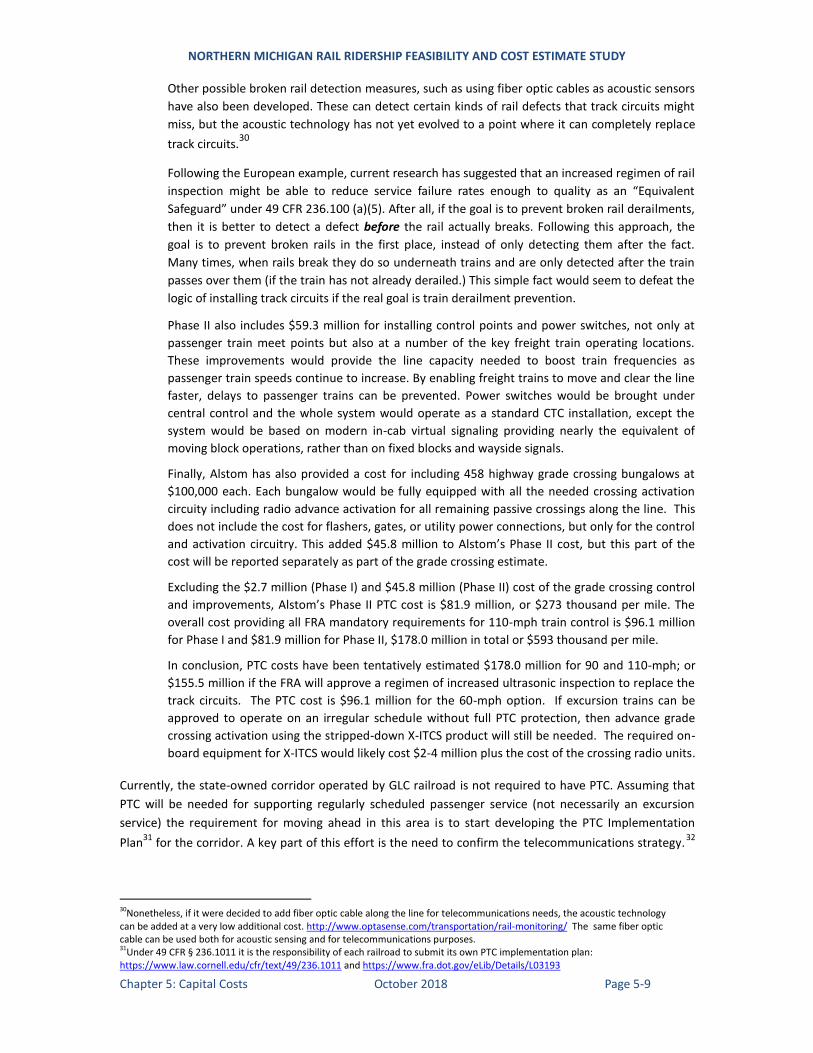
NORTHERN MICHIGAN RAIL RIDERSHIP FEASIBILITY AND COST ESTIMATE STUDY
Chapter 5: Capital Costs October 2018 Page 5-9
Other possible broken rail detection measures, such as using fiber optic cables as acoustic sensors
have also been developed. These can detect certain kinds of rail defects that track circuits might
miss, but the acoustic technology has not yet evolved to a point where it can completely replace
track circuits.30
Following the European example, current research has suggested that an increased regimen of rail
inspection might be able to reduce service failure rates enough to quality as an “Equivalent
Safeguard” under 49 CFR 236.100 (a)(5). After all, if the goal is to prevent broken rail derailments,
then it is better to detect a defect before the rail actually breaks. Following this approach, the
goal is to prevent broken rails in the first place, instead of only detecting them after the fact.
Many times, when rails break they do so underneath trains and are only detected after the train
passes over them (if the train has not already derailed.) This simple fact would seem to defeat the
logic of installing track circuits if the real goal is train derailment prevention.
Phase II also includes $59.3 million for installing control points and power switches, not only at
passenger train meet points but also at a number of the key freight train operating locations.
These improvements would provide the line capacity needed to boost train frequencies as
passenger train speeds continue to increase. By enabling freight trains to move and clear the line
faster, delays to passenger trains can be prevented. Power switches would be brought under
central control and the whole system would operate as a standard CTC installation, except the
system would be based on modern in-cab virtual signaling providing nearly the equivalent of
moving block operations, rather than on fixed blocks and wayside signals.
Finally, Alstom has also provided a cost for including 458 highway grade crossing bungalows at
$100,000 each. Each bungalow would be fully equipped with all the needed crossing activation
circuity including radio advance activation for all remaining passive crossings along the line. This
does not include the cost for flashers, gates, or utility power connections, but only for the control
and activation circuitry. This added $45.8 million to Alstom’s Phase II cost, but this part of the
cost will be reported separately as part of the grade crossing estimate.
Excluding the $2.7 million (Phase I) and $45.8 million (Phase II) cost of the grade crossing control
and improvements, Alstom’s Phase II PTC cost is $81.9 million, or $273 thousand per mile. The
overall cost providing all FRA mandatory requirements for 110-mph train control is $96.1 million
for Phase I and $81.9 million for Phase II, $178.0 million in total or $593 thousand per mile.
In conclusion, PTC costs have been tentatively estimated $178.0 million for 90 and 110-mph; or
$155.5 million if the FRA will approve a regimen of increased ultrasonic inspection to replace the
track circuits. The PTC cost is $96.1 million for the 60-mph option. If excursion trains can be
approved to operate on an irregular schedule without full PTC protection, then advance grade
crossing activation using the stripped-down X-ITCS product will still be needed. The required on-
board equipment for X-ITCS would likely cost $2-4 million plus the cost of the crossing radio units.
Currently, the state-owned corridor operated by GLC railroad is not required to have PTC. Assuming that
PTC will be needed for supporting regularly scheduled passenger service (not necessarily an excursion
service) the requirement for moving ahead in this area is to start developing the PTC Implementation
Plan31
for the corridor. A key part of this effort is the need to confirm the telecommunications strategy.32
30Nonetheless, if it were decided to add fiber optic cable along the line for telecommunications needs, the acoustic technology can be added at a very low additional cost. http://www.optasense.com/transportation/rail-monitoring/ The same fiber optic cable can be used both for acoustic sensing and for telecommunications purposes. 31Under 49 CFR § 236.1011 it is the responsibility of each railroad to submit its own PTC implementation plan: https://www.law.cornell.edu/cfr/text/49/236.1011 and https://www.fra.dot.gov/eLib/Details/L03193
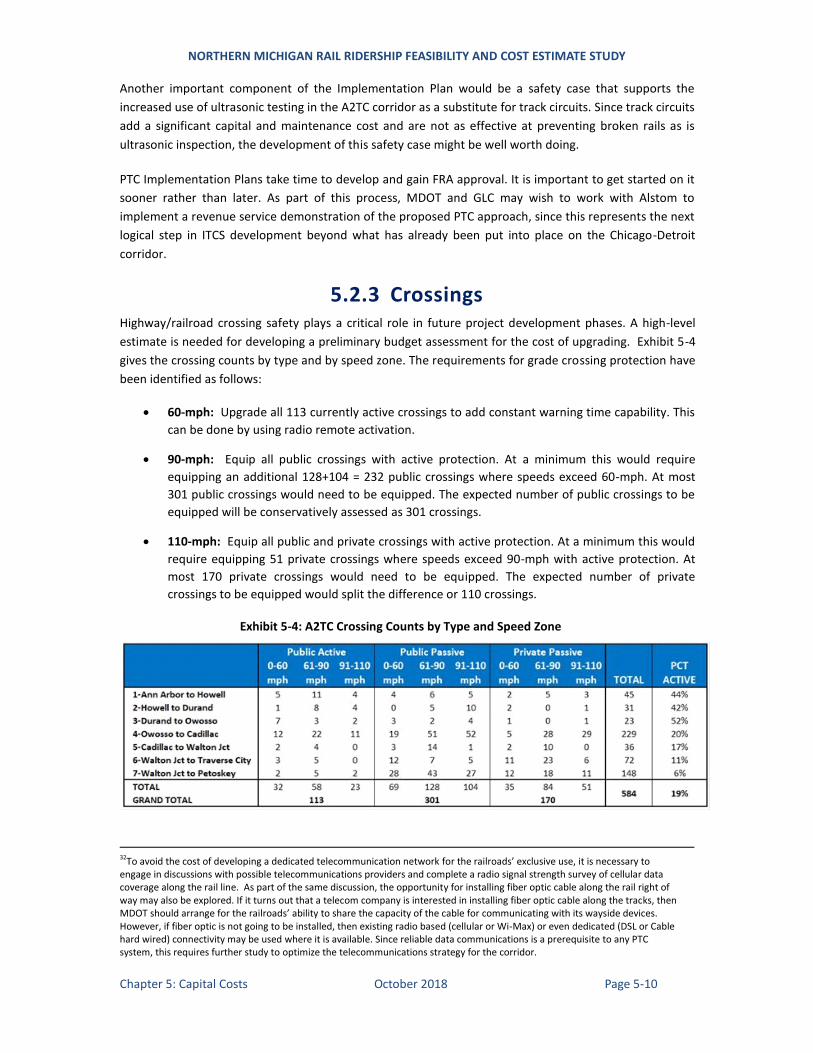
NORTHERN MICHIGAN RAIL RIDERSHIP FEASIBILITY AND COST ESTIMATE STUDY
Chapter 5: Capital Costs October 2018 Page 5-10
Another important component of the Implementation Plan would be a safety case that supports the
increased use of ultrasonic testing in the A2TC corridor as a substitute for track circuits. Since track circuits
add a significant capital and maintenance cost and are not as effective at preventing broken rails as is
ultrasonic inspection, the development of this safety case might be well worth doing.
PTC Implementation Plans take time to develop and gain FRA approval. It is important to get started on it
sooner rather than later. As part of this process, MDOT and GLC may wish to work with Alstom to
implement a revenue service demonstration of the proposed PTC approach, since this represents the next
logical step in ITCS development beyond what has already been put into place on the Chicago-Detroit
corridor.
5.2.3 Crossings Highway/railroad crossing safety plays a critical role in future project development phases. A high-level
estimate is needed for developing a preliminary budget assessment for the cost of upgrading. Exhibit 5-4
gives the crossing counts by type and by speed zone. The requirements for grade crossing protection have
been identified as follows:
60-mph: Upgrade all 113 currently active crossings to add constant warning time capability. This
can be done by using radio remote activation.
90-mph: Equip all public crossings with active protection. At a minimum this would require
equipping an additional 128+104 = 232 public crossings where speeds exceed 60-mph. At most
301 public crossings would need to be equipped. The expected number of public crossings to be
equipped will be conservatively assessed as 301 crossings.
110-mph: Equip all public and private crossings with active protection. At a minimum this would
require equipping 51 private crossings where speeds exceed 90-mph with active protection. At
most 170 private crossings would need to be equipped. The expected number of private
crossings to be equipped would split the difference or 110 crossings.
Exhibit 5-4: A2TC Crossing Counts by Type and Speed Zone
32To avoid the cost of developing a dedicated telecommunication network for the railroads’ exclusive use, it is necessary to engage in discussions with possible telecommunications providers and complete a radio signal strength survey of cellular data coverage along the rail line. As part of the same discussion, the opportunity for installing fiber optic cable along the rail right of way may also be explored. If it turns out that a telecom company is interested in installing fiber optic cable along the tracks, then MDOT should arrange for the railroads’ ability to share the capacity of the cable for communicating with its wayside devices. However, if fiber optic is not going to be installed, then existing radio based (cellular or Wi-Max) or even dedicated (DSL or Cable hard wired) connectivity may be used where it is available. Since reliable data communications is a prerequisite to any PTC system, this requires further study to optimize the telecommunications strategy for the corridor.
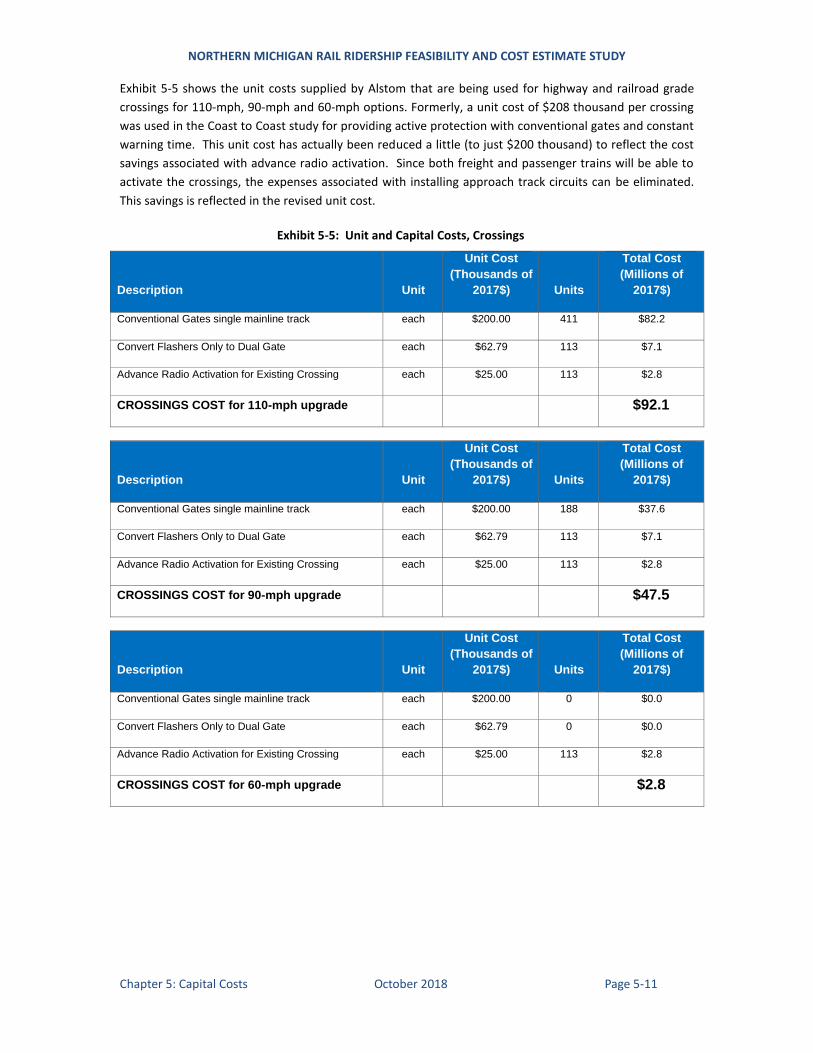
NORTHERN MICHIGAN RAIL RIDERSHIP FEASIBILITY AND COST ESTIMATE STUDY
Chapter 5: Capital Costs October 2018 Page 5-11
Exhibit 5-5 shows the unit costs supplied by Alstom that are being used for highway and railroad grade
crossings for 110-mph, 90-mph and 60-mph options. Formerly, a unit cost of $208 thousand per crossing
was used in the Coast to Coast study for providing active protection with conventional gates and constant
warning time. This unit cost has actually been reduced a little (to just $200 thousand) to reflect the cost
savings associated with advance radio activation. Since both freight and passenger trains will be able to
activate the crossings, the expenses associated with installing approach track circuits can be eliminated.
This savings is reflected in the revised unit cost.
Exhibit 5-5: Unit and Capital Costs, Crossings
Description Unit
Unit Cost
(Thousands of
2017$) Units
Total Cost
(Millions of
2017$)
Conventional Gates single mainline track each $200.00 411 $82.2
Convert Flashers Only to Dual Gate each $62.79 113 $7.1
Advance Radio Activation for Existing Crossing each $25.00 113 $2.8
CROSSINGS COST for 110-mph upgrade $92.1
Description Unit
Unit Cost
(Thousands of
2017$) Units
Total Cost
(Millions of
2017$)
Conventional Gates single mainline track each $200.00 188 $37.6
Convert Flashers Only to Dual Gate each $62.79 113 $7.1
Advance Radio Activation for Existing Crossing each $25.00 113 $2.8
CROSSINGS COST for 90-mph upgrade $47.5
Description Unit
Unit Cost
(Thousands of
2017$) Units
Total Cost
(Millions of
2017$)
Conventional Gates single mainline track each $200.00 0 $0.0
Convert Flashers Only to Dual Gate each $62.79 0 $0.0
Advance Radio Activation for Existing Crossing each $25.00 113 $2.8
CROSSINGS COST for 60-mph upgrade $2.8
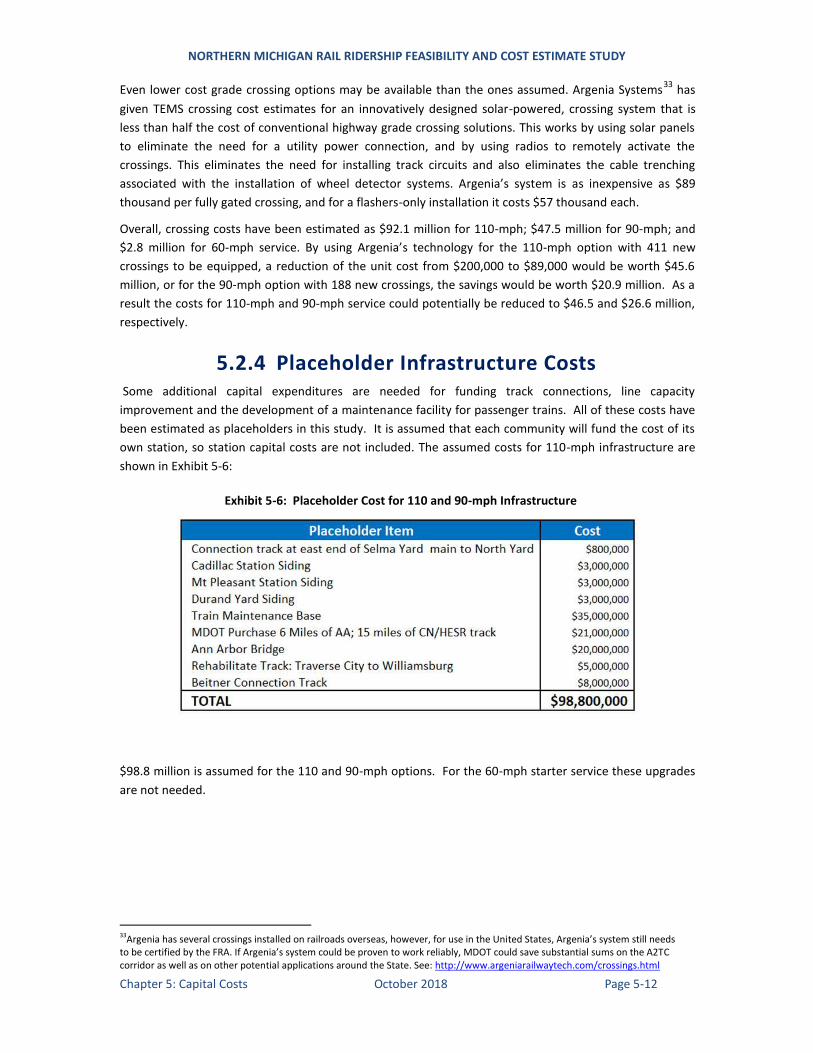
NORTHERN MICHIGAN RAIL RIDERSHIP FEASIBILITY AND COST ESTIMATE STUDY
Chapter 5: Capital Costs October 2018 Page 5-12
Even lower cost grade crossing options may be available than the ones assumed. Argenia Systems33
has
given TEMS crossing cost estimates for an innovatively designed solar-powered, crossing system that is
less than half the cost of conventional highway grade crossing solutions. This works by using solar panels
to eliminate the need for a utility power connection, and by using radios to remotely activate the
crossings. This eliminates the need for installing track circuits and also eliminates the cable trenching
associated with the installation of wheel detector systems. Argenia’s system is as inexpensive as $89
thousand per fully gated crossing, and for a flashers-only installation it costs $57 thousand each.
Overall, crossing costs have been estimated as $92.1 million for 110-mph; $47.5 million for 90-mph; and
$2.8 million for 60-mph service. By using Argenia’s technology for the 110-mph option with 411 new
crossings to be equipped, a reduction of the unit cost from $200,000 to $89,000 would be worth $45.6
million, or for the 90-mph option with 188 new crossings, the savings would be worth $20.9 million. As a
result the costs for 110-mph and 90-mph service could potentially be reduced to $46.5 and $26.6 million,
respectively.
5.2.4 Placeholder Infrastructure Costs Some additional capital expenditures are needed for funding track connections, line capacity
improvement and the development of a maintenance facility for passenger trains. All of these costs have
been estimated as placeholders in this study. It is assumed that each community will fund the cost of its
own station, so station capital costs are not included. The assumed costs for 110-mph infrastructure are
shown in Exhibit 5-6:
Exhibit 5-6: Placeholder Cost for 110 and 90-mph Infrastructure
$98.8 million is assumed for the 110 and 90-mph options. For the 60-mph starter service these upgrades
are not needed.
33Argenia has several crossings installed on railroads overseas, however, for use in the United States, Argenia’s system still needs to be certified by the FRA. If Argenia’s system could be proven to work reliably, MDOT could save substantial sums on the A2TC corridor as well as on other potential applications around the State. See: http://www.argeniarailwaytech.com/crossings.html
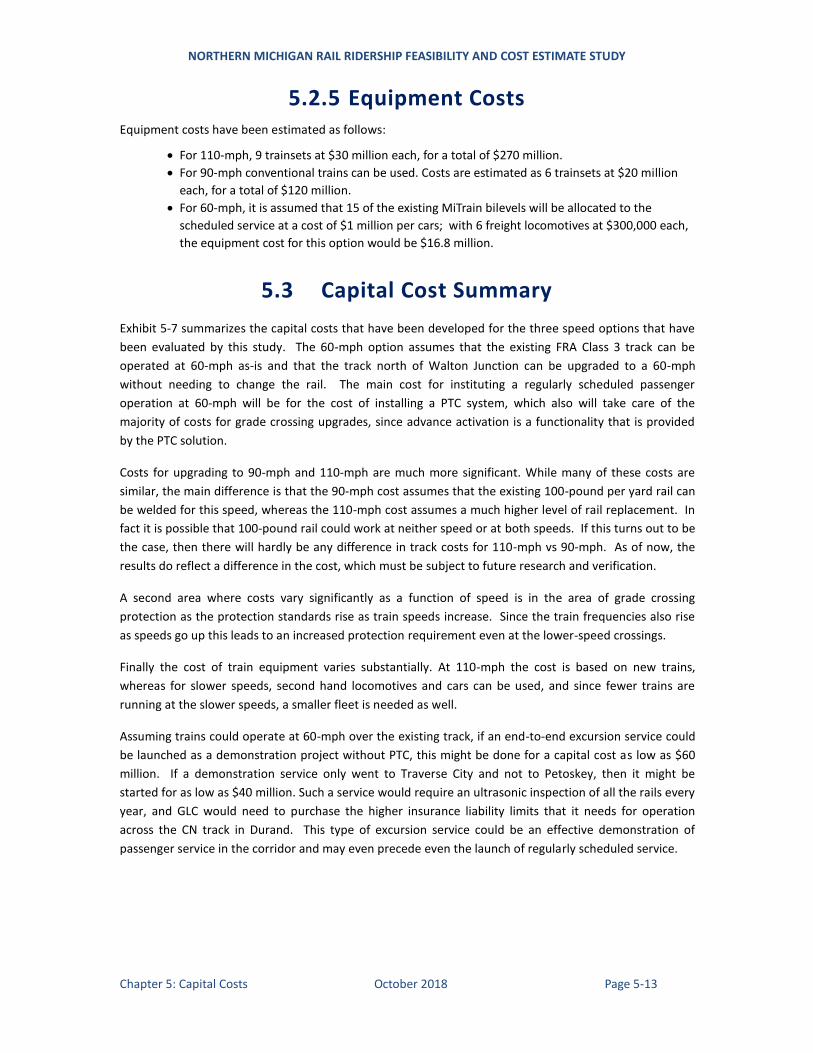
NORTHERN MICHIGAN RAIL RIDERSHIP FEASIBILITY AND COST ESTIMATE STUDY
Chapter 5: Capital Costs October 2018 Page 5-13
5.2.5 Equipment Costs Equipment costs have been estimated as follows:
For 110-mph, 9 trainsets at $30 million each, for a total of $270 million.
For 90-mph conventional trains can be used. Costs are estimated as 6 trainsets at $20 million
each, for a total of $120 million.
For 60-mph, it is assumed that 15 of the existing MiTrain bilevels will be allocated to the
scheduled service at a cost of $1 million per cars; with 6 freight locomotives at $300,000 each,
the equipment cost for this option would be $16.8 million.
5.3 Capital Cost Summary
Exhibit 5-7 summarizes the capital costs that have been developed for the three speed options that have
been evaluated by this study. The 60-mph option assumes that the existing FRA Class 3 track can be
operated at 60-mph as-is and that the track north of Walton Junction can be upgraded to a 60-mph
without needing to change the rail. The main cost for instituting a regularly scheduled passenger
operation at 60-mph will be for the cost of installing a PTC system, which also will take care of the
majority of costs for grade crossing upgrades, since advance activation is a functionality that is provided
by the PTC solution.
Costs for upgrading to 90-mph and 110-mph are much more significant. While many of these costs are
similar, the main difference is that the 90-mph cost assumes that the existing 100-pound per yard rail can
be welded for this speed, whereas the 110-mph cost assumes a much higher level of rail replacement. In
fact it is possible that 100-pound rail could work at neither speed or at both speeds. If this turns out to be
the case, then there will hardly be any difference in track costs for 110-mph vs 90-mph. As of now, the
results do reflect a difference in the cost, which must be subject to future research and verification.
A second area where costs vary significantly as a function of speed is in the area of grade crossing
protection as the protection standards rise as train speeds increase. Since the train frequencies also rise
as speeds go up this leads to an increased protection requirement even at the lower-speed crossings.
Finally the cost of train equipment varies substantially. At 110-mph the cost is based on new trains,
whereas for slower speeds, second hand locomotives and cars can be used, and since fewer trains are
running at the slower speeds, a smaller fleet is needed as well.
Assuming trains could operate at 60-mph over the existing track, if an end-to-end excursion service could
be launched as a demonstration project without PTC, this might be done for a capital cost as low as $60
million. If a demonstration service only went to Traverse City and not to Petoskey, then it might be
started for as low as $40 million. Such a service would require an ultrasonic inspection of all the rails every
year, and GLC would need to purchase the higher insurance liability limits that it needs for operation
across the CN track in Durand. This type of excursion service could be an effective demonstration of
passenger service in the corridor and may even precede even the launch of regularly scheduled service.
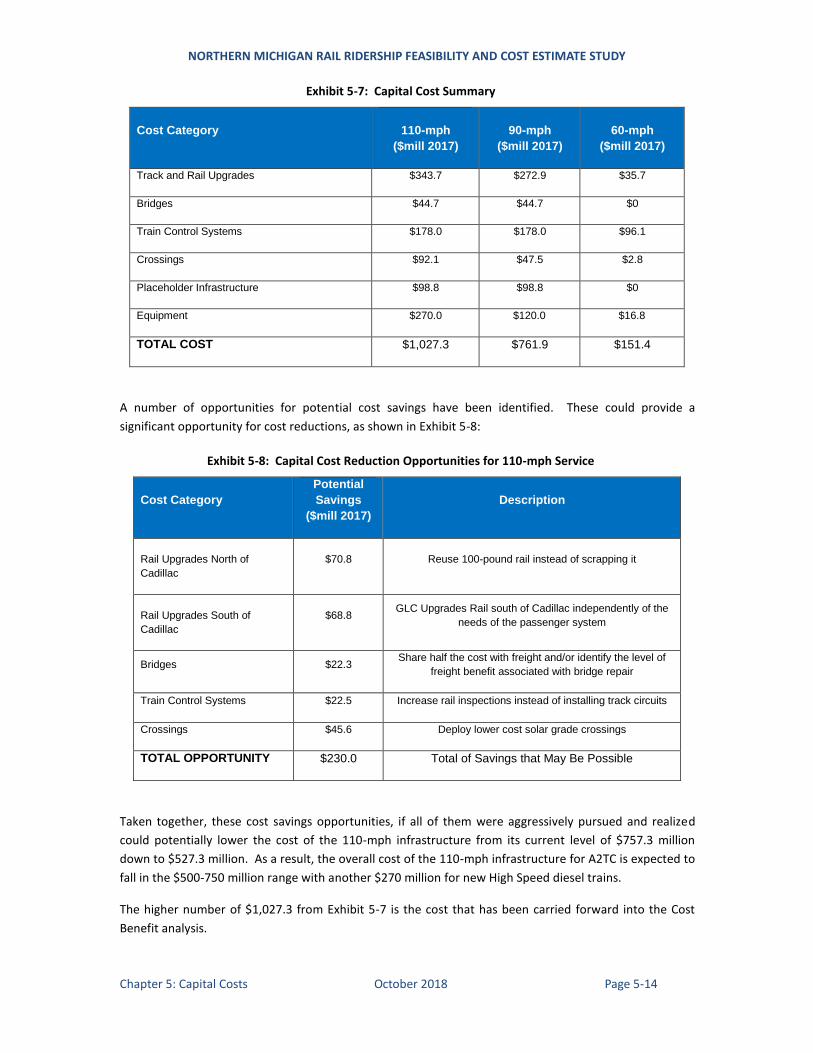
NORTHERN MICHIGAN RAIL RIDERSHIP FEASIBILITY AND COST ESTIMATE STUDY
Chapter 5: Capital Costs October 2018 Page 5-14
Exhibit 5-7: Capital Cost Summary
Cost Category
110-mph
($mill 2017)
90-mph
($mill 2017)
60-mph
($mill 2017)
Track and Rail Upgrades $343.7 $272.9 $35.7
Bridges $44.7 $44.7 $0
Train Control Systems $178.0 $178.0 $96.1
Crossings $92.1 $47.5 $2.8
Placeholder Infrastructure $98.8 $98.8 $0
Equipment $270.0 $120.0 $16.8
TOTAL COST $1,027.3 $761.9 $151.4
A number of opportunities for potential cost savings have been identified. These could provide a
significant opportunity for cost reductions, as shown in Exhibit 5-8:
Exhibit 5-8: Capital Cost Reduction Opportunities for 110-mph Service
Cost Category
Potential
Savings
($mill 2017)
Description
Rail Upgrades North of
Cadillac
$70.8 Reuse 100-pound rail instead of scrapping it
Rail Upgrades South of
Cadillac
$68.8 GLC Upgrades Rail south of Cadillac independently of the
needs of the passenger system
Bridges $22.3 Share half the cost with freight and/or identify the level of
freight benefit associated with bridge repair
Train Control Systems $22.5 Increase rail inspections instead of installing track circuits
Crossings $45.6 Deploy lower cost solar grade crossings
TOTAL OPPORTUNITY $230.0 Total of Savings that May Be Possible
Taken together, these cost savings opportunities, if all of them were aggressively pursued and realized
could potentially lower the cost of the 110-mph infrastructure from its current level of $757.3 million
down to $527.3 million. As a result, the overall cost of the 110-mph infrastructure for A2TC is expected to
fall in the $500-750 million range with another $270 million for new High Speed diesel trains.
The higher number of $1,027.3 from Exhibit 5-7 is the cost that has been carried forward into the Cost
Benefit analysis.
NORTHERN MICHIGAN RAIL RIDERSHIP FEASIBILITY AND COST ESTIMATE STUDY
Chapter 6: Financial and Economic Results October 2018 Page 6-1
Chapter 6 Financial and Economic Results
S U M M A R Y
This chapter presents a detailed financial and economic analysis for the Ann Arbor to Traverse City
Passenger Rail Line, including key financial measures such as Operating Surplus and Operating Ratio. A
detailed Economic Analysis was carried out using criteria set out by the 1997 FRA Commercial Feasibility
Study34
and including key economic measures such as NPV Surplus and Benefit/Cost Ratio at a 3 percent
discount rate which are also presented in this chapter.
6.1 Introduction
Two measures, Operating Ratio and Benefit Cost ratio will be assessed here to evaluate the economic
returns of the A2TC rail system. The financial performance of the system, reflected by the Operating Ratio,
is a key driver of the economic evaluation since it strongly influences the ability to franchise the operation
of the system to the private sector. System Revenues include the fare box revenues and revenues from
onboard sales. Operating Costs are the operating and maintenance costs associated with running the
train. The Operating Ratio is defined as Revenues/Costs.
Operating Ratios as calculated here include direct operating costs only. Operating ratio
calculations do not include capital costs, depreciation or interest.
It should be noted that freight railroads and intercity bus companies typically define it as the
reciprocal Costs/Revenues.
By this analysis, a positive operating ratio does not imply that a passenger service can fully cover its capital
costs, but having a positive cash flow does at least allow the operation to be franchised and run by the
private sector. This requirement of the FRA Commercial Feasibility Study puts passenger rail on the same
basis as other modes of transportation, such as intercity bus and air, where the private sector operates
the system but does not build or own the infrastructure it uses. Other modes do pay access fees for using
the infrastructure, which supports some cost recovery which varies by mode. For a passenger rail system,
track access costs would fall into this category. All calculations are performed using the standard financial
formula, as follows:
Financial Measure:
Operating Ratio =
34High-Speed Ground Transportation for America: Commercial Feasibility Study, Report To Congress: https://www.fra.dot.gov/eLib/details/L02519
Financial Revenues (by year or PV)
Operating Costs (by year or PV)
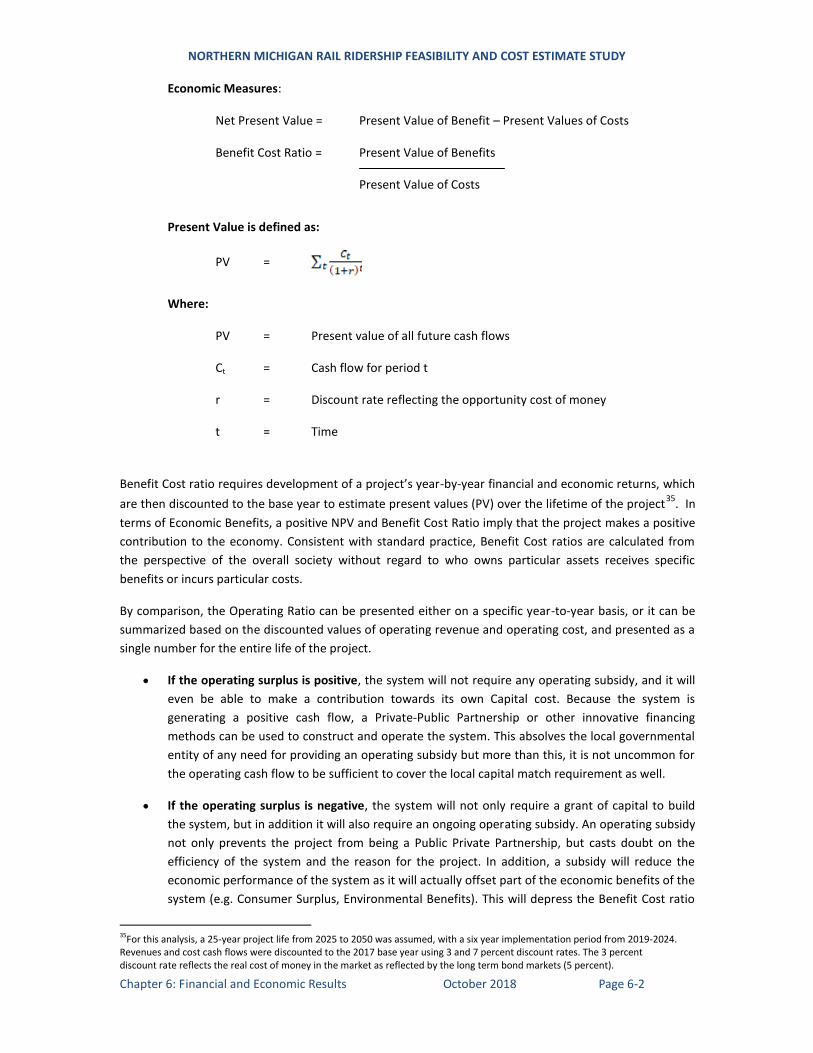
NORTHERN MICHIGAN RAIL RIDERSHIP FEASIBILITY AND COST ESTIMATE STUDY
Chapter 6: Financial and Economic Results October 2018 Page 6-2
Economic Measures:
Net Present Value = Present Value of Benefit – Present Values of Costs
Benefit Cost Ratio = Present Value of Benefits
Present Value of Costs
Present Value is defined as:
PV =
Where:
PV = Present value of all future cash flows
Ct = Cash flow for period t
r = Discount rate reflecting the opportunity cost of money
t = Time
Benefit Cost ratio requires development of a project’s year-by-year financial and economic returns, which
are then discounted to the base year to estimate present values (PV) over the lifetime of the project35
. In
terms of Economic Benefits, a positive NPV and Benefit Cost Ratio imply that the project makes a positive
contribution to the economy. Consistent with standard practice, Benefit Cost ratios are calculated from
the perspective of the overall society without regard to who owns particular assets receives specific
benefits or incurs particular costs.
By comparison, the Operating Ratio can be presented either on a specific year-to-year basis, or it can be
summarized based on the discounted values of operating revenue and operating cost, and presented as a
single number for the entire life of the project.
If the operating surplus is positive, the system will not require any operating subsidy, and it will
even be able to make a contribution towards its own Capital cost. Because the system is
generating a positive cash flow, a Private-Public Partnership or other innovative financing
methods can be used to construct and operate the system. This absolves the local governmental
entity of any need for providing an operating subsidy but more than this, it is not uncommon for
the operating cash flow to be sufficient to cover the local capital match requirement as well.
If the operating surplus is negative, the system will not only require a grant of capital to build
the system, but in addition it will also require an ongoing operating subsidy. An operating subsidy
not only prevents the project from being a Public Private Partnership, but casts doubt on the
efficiency of the system and the reason for the project. In addition, a subsidy will reduce the
economic performance of the system as it will actually offset part of the economic benefits of the
system (e.g. Consumer Surplus, Environmental Benefits). This will depress the Benefit Cost ratio
35For this analysis, a 25-year project life from 2025 to 2050 was assumed, with a six year implementation period from 2019-2024. Revenues and cost cash flows were discounted to the 2017 base year using 3 and 7 percent discount rates. The 3 percent discount rate reflects the real cost of money in the market as reflected by the long term bond markets (5 percent).
NORTHERN MICHIGAN RAIL RIDERSHIP FEASIBILITY AND COST ESTIMATE STUDY
Chapter 6: Financial and Economic Results October 2018 Page 6-3
as well. If the subsidy is not too great and the capital cost is not too high, in some cases it may
still be possible to maintain a positive Benefit Cost ratio. But the larger the subsidy and the higher
the capital cost, the harder it is to show a positive Benefit Cost ratio. It is not uncommon for slow
passenger rail systems to fail both FRA's Operating Ratio and Benefit Cost criteria.
6.2 Implementation Phasing Options
For phasing the development of the proposed system, Year 2020 financial results have been estimated for
a number of combinations of train speed and route configurations. Some options have been defined as
additional sensitivities beyond the six basic options for which ridership and revenue forecasts were
developed in Chapter 3. To estimate the ridership and revenue for these additional sensitivity options,
the forecasts for the basic options were used as the starting point and then the ridership and revenue
forecasts were adjusted based on known COMPASSTM
model elasticities (for train frequency adjustments)
and on the forecasted origin to destination trip matrix (for route truncations.) This allowed development
of financial projections for additional sensitivities beyond what were forecasted in Chapter 3.
The 60-mph option will likely be implemented first, since much of the track is already good for
60-mph, so this is the option that will require the least capital investment to get started. Not only
is this speed assessed for the full route, but also truncated versions of the route structure have
been considered. One of the conclusions of this truncation analysis is that route extensions both
east to Detroit and north to Petoskey have the potential to add significant ridership and revenue
to the system.
Therefore, it is assumed that the system will first be fully built out at the 60-mph speed, and then
equipment and route segment capabilities will be upgraded over time to eventually reach a
110-mph top speed capability.
79-to-90-mph options offer the ability to raise train speeds at an intermediate level of
investment. In this speed range, some economies in the areas of rail and grade crossings may be
possible. Due to geometric restrictions, much of the alignment may never be operable above a
90-mph speed so this level of performance may be the highest possible for some segments. This
speed was only assessed for a full build-out configuration.
110-mph options reflect the highest anticipated level of development for the corridor and entail
the purchase of new, high performance tilting diesel trains along with upgrading a number of
stretches of straight track so these trains can operate at the higher speed. However, the trains
also accelerate and brake faster, so they can save some time even on the slower stretches of
track. Overall, the time savings associated with this upgrade strategy are significant. This will lead
to strong increases in system revenue and financial performance.
6.2.1 60-mph Startup and Full Build Options Exhibit 6-1 shows Options 1 and 2: the two truncated options that have been considered for a 60-mph
starter system, along with Options 3 and 4: two “full build” options. As shown in Exhibit 6-1:
Option 1- “Starter Service” would only operate from Ann Arbor to Traverse City. If the train
does not go to the existing Amtrak line or train station, it would need its own station in Ann
Arbor. Also, scheduled service would not go north of Walton Junction to Petoskey in this
phase, avoiding the need for rebuilding the track to Petoskey.
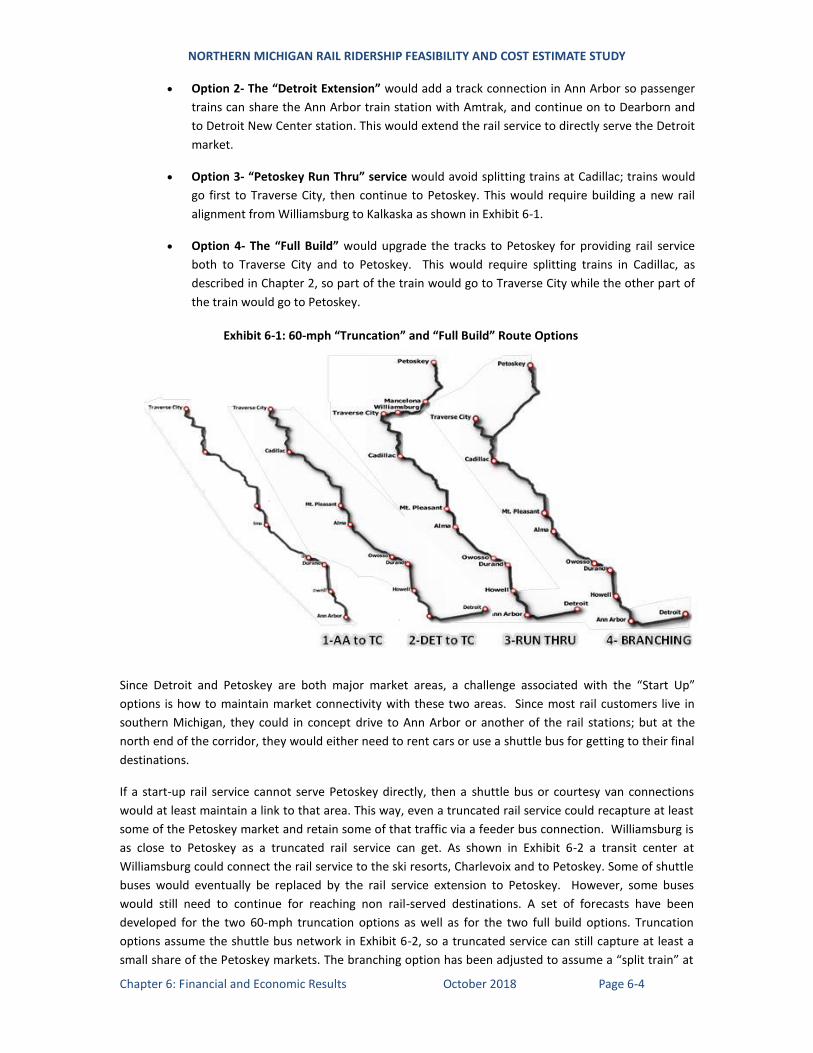
NORTHERN MICHIGAN RAIL RIDERSHIP FEASIBILITY AND COST ESTIMATE STUDY
Chapter 6: Financial and Economic Results October 2018 Page 6-4
Option 2- The “Detroit Extension” would add a track connection in Ann Arbor so passenger
trains can share the Ann Arbor train station with Amtrak, and continue on to Dearborn and
to Detroit New Center station. This would extend the rail service to directly serve the Detroit
market.
Option 3- “Petoskey Run Thru” service would avoid splitting trains at Cadillac; trains would
go first to Traverse City, then continue to Petoskey. This would require building a new rail
alignment from Williamsburg to Kalkaska as shown in Exhibit 6-1.
Option 4- The “Full Build” would upgrade the tracks to Petoskey for providing rail service
both to Traverse City and to Petoskey. This would require splitting trains in Cadillac, as
described in Chapter 2, so part of the train would go to Traverse City while the other part of
the train would go to Petoskey.
Exhibit 6-1: 60-mph “Truncation” and “Full Build” Route Options
Since Detroit and Petoskey are both major market areas, a challenge associated with the “Start Up”
options is how to maintain market connectivity with these two areas. Since most rail customers live in
southern Michigan, they could in concept drive to Ann Arbor or another of the rail stations; but at the
north end of the corridor, they would either need to rent cars or use a shuttle bus for getting to their final
destinations.
If a start-up rail service cannot serve Petoskey directly, then a shuttle bus or courtesy van connections
would at least maintain a link to that area. This way, even a truncated rail service could recapture at least
some of the Petoskey market and retain some of that traffic via a feeder bus connection. Williamsburg is
as close to Petoskey as a truncated rail service can get. As shown in Exhibit 6-2 a transit center at
Williamsburg could connect the rail service to the ski resorts, Charlevoix and to Petoskey. Some of shuttle
buses would eventually be replaced by the rail service extension to Petoskey. However, some buses
would still need to continue for reaching non rail-served destinations. A set of forecasts have been
developed for the two 60-mph truncation options as well as for the two full build options. Truncation
options assume the shuttle bus network in Exhibit 6-2, so a truncated service can still capture at least a
small share of the Petoskey markets. The branching option has been adjusted to assume a “split train” at
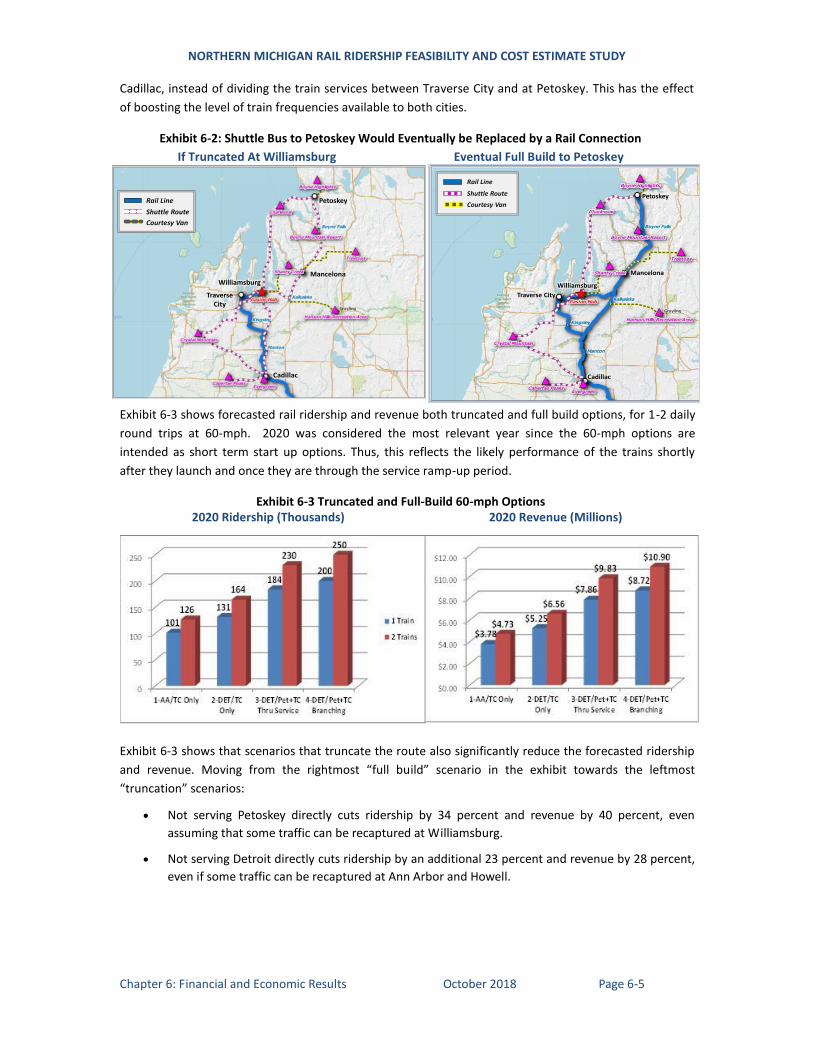
NORTHERN MICHIGAN RAIL RIDERSHIP FEASIBILITY AND COST ESTIMATE STUDY
Chapter 6: Financial and Economic Results October 2018 Page 6-5
Cadillac, instead of dividing the train services between Traverse City and at Petoskey. This has the effect
of boosting the level of train frequencies available to both cities.
Exhibit 6-2: Shuttle Bus to Petoskey Would Eventually be Replaced by a Rail Connection
If Truncated At Williamsburg Eventual Full Build to Petoskey
Exhibit 6-3 shows forecasted rail ridership and revenue both truncated and full build options, for 1-2 daily
round trips at 60-mph. 2020 was considered the most relevant year since the 60-mph options are
intended as short term start up options. Thus, this reflects the likely performance of the trains shortly
after they launch and once they are through the service ramp-up period.
Exhibit 6-3 Truncated and Full-Build 60-mph Options 2020 Ridership (Thousands) 2020 Revenue (Millions)
Exhibit 6-3 shows that scenarios that truncate the route also significantly reduce the forecasted ridership
and revenue. Moving from the rightmost “full build” scenario in the exhibit towards the leftmost
“truncation” scenarios:
Not serving Petoskey directly cuts ridership by 34 percent and revenue by 40 percent, even
assuming that some traffic can be recaptured at Williamsburg.
Not serving Detroit directly cuts ridership by an additional 23 percent and revenue by 28 percent,
even if some traffic can be recaptured at Ann Arbor and Howell.
Rail Line
Shuttle Route
Courtesy VanPetoskey
Cadillac
Traverse City
Williamsburg
Mancelona
Rail Line
Shuttle Route
Courtesy Van
Petoskey
Cadillac
Traverse City
WilliamsburgMancelona
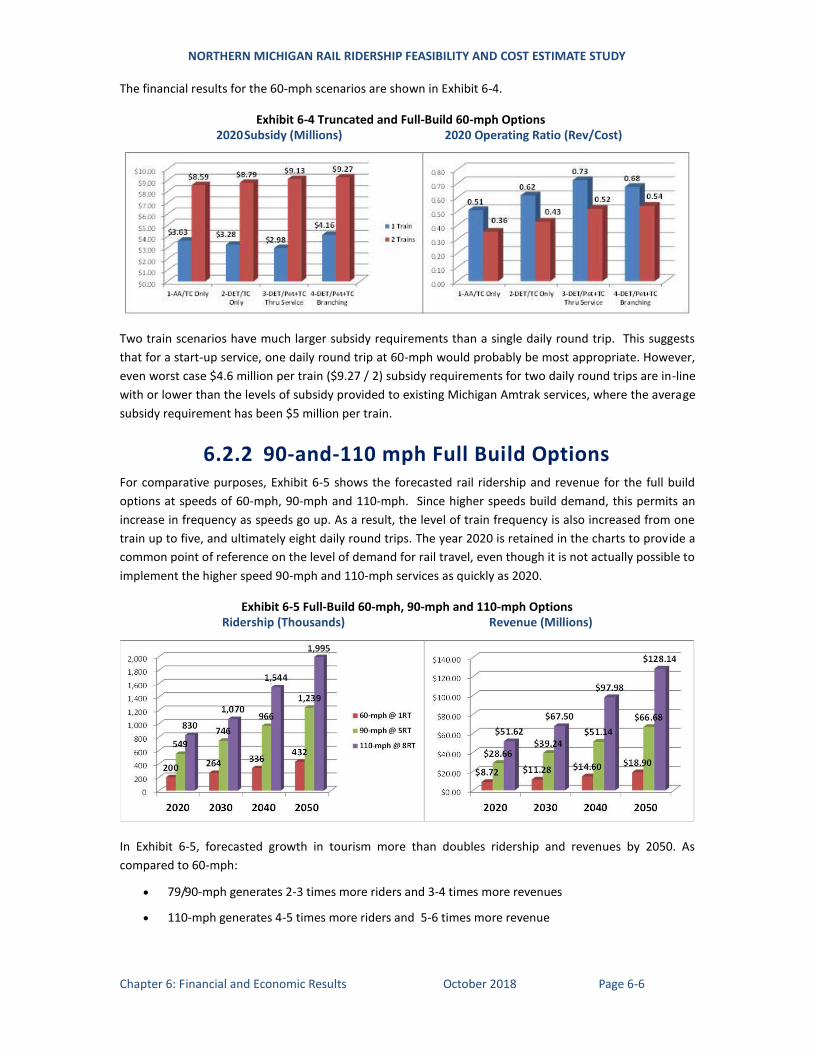
NORTHERN MICHIGAN RAIL RIDERSHIP FEASIBILITY AND COST ESTIMATE STUDY
Chapter 6: Financial and Economic Results October 2018 Page 6-6
The financial results for the 60-mph scenarios are shown in Exhibit 6-4.
Exhibit 6-4 Truncated and Full-Build 60-mph Options 2020 Subsidy (Millions) 2020 Operating Ratio (Rev/Cost)
Two train scenarios have much larger subsidy requirements than a single daily round trip. This suggests
that for a start-up service, one daily round trip at 60-mph would probably be most appropriate. However,
even worst case $4.6 million per train ($9.27 / 2) subsidy requirements for two daily round trips are in-line
with or lower than the levels of subsidy provided to existing Michigan Amtrak services, where the average
subsidy requirement has been $5 million per train.
6.2.2 90-and-110 mph Full Build Options For comparative purposes, Exhibit 6-5 shows the forecasted rail ridership and revenue for the full build
options at speeds of 60-mph, 90-mph and 110-mph. Since higher speeds build demand, this permits an
increase in frequency as speeds go up. As a result, the level of train frequency is also increased from one
train up to five, and ultimately eight daily round trips. The year 2020 is retained in the charts to provide a
common point of reference on the level of demand for rail travel, even though it is not actually possible to
implement the higher speed 90-mph and 110-mph services as quickly as 2020.
Exhibit 6-5 Full-Build 60-mph, 90-mph and 110-mph Options Ridership (Thousands) Revenue (Millions)
In Exhibit 6-5, forecasted growth in tourism more than doubles ridership and revenues by 2050. As
compared to 60-mph:
79/90-mph generates 2-3 times more riders and 3-4 times more revenues
110-mph generates 4-5 times more riders and 5-6 times more revenue
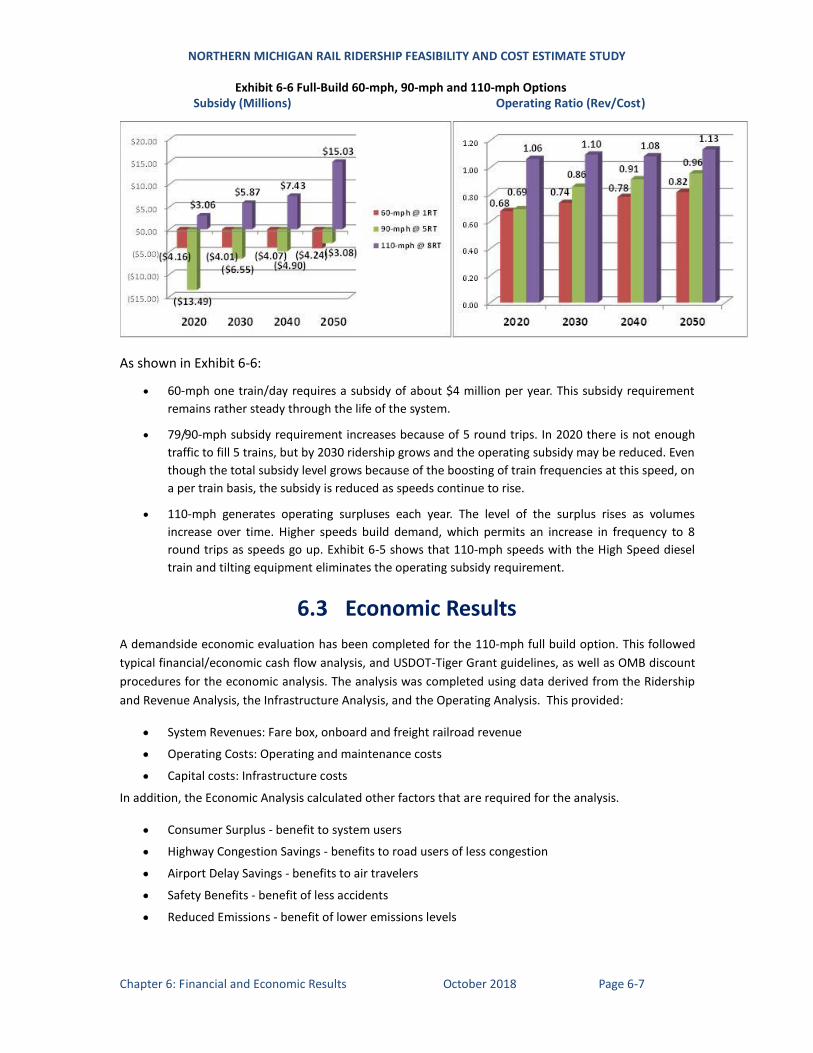
NORTHERN MICHIGAN RAIL RIDERSHIP FEASIBILITY AND COST ESTIMATE STUDY
Chapter 6: Financial and Economic Results October 2018 Page 6-7
Exhibit 6-6 Full-Build 60-mph, 90-mph and 110-mph Options Subsidy (Millions) Operating Ratio (Rev/Cost)
As shown in Exhibit 6-6:
60-mph one train/day requires a subsidy of about $4 million per year. This subsidy requirement
remains rather steady through the life of the system.
79/90-mph subsidy requirement increases because of 5 round trips. In 2020 there is not enough
traffic to fill 5 trains, but by 2030 ridership grows and the operating subsidy may be reduced. Even
though the total subsidy level grows because of the boosting of train frequencies at this speed, on
a per train basis, the subsidy is reduced as speeds continue to rise.
110-mph generates operating surpluses each year. The level of the surplus rises as volumes
increase over time. Higher speeds build demand, which permits an increase in frequency to 8
round trips as speeds go up. Exhibit 6-5 shows that 110-mph speeds with the High Speed diesel
train and tilting equipment eliminates the operating subsidy requirement.
6.3 Economic Results
A demandside economic evaluation has been completed for the 110-mph full build option. This followed
typical financial/economic cash flow analysis, and USDOT-Tiger Grant guidelines, as well as OMB discount
procedures for the economic analysis. The analysis was completed using data derived from the Ridership
and Revenue Analysis, the Infrastructure Analysis, and the Operating Analysis. This provided:
System Revenues: Fare box, onboard and freight railroad revenue
Operating Costs: Operating and maintenance costs
Capital costs: Infrastructure costs
In addition, the Economic Analysis calculated other factors that are required for the analysis.
Consumer Surplus - benefit to system users
Highway Congestion Savings - benefits to road users of less congestion
Airport Delay Savings - benefits to air travelers
Safety Benefits - benefit of less accidents
Reduced Emissions - benefit of lower emissions levels
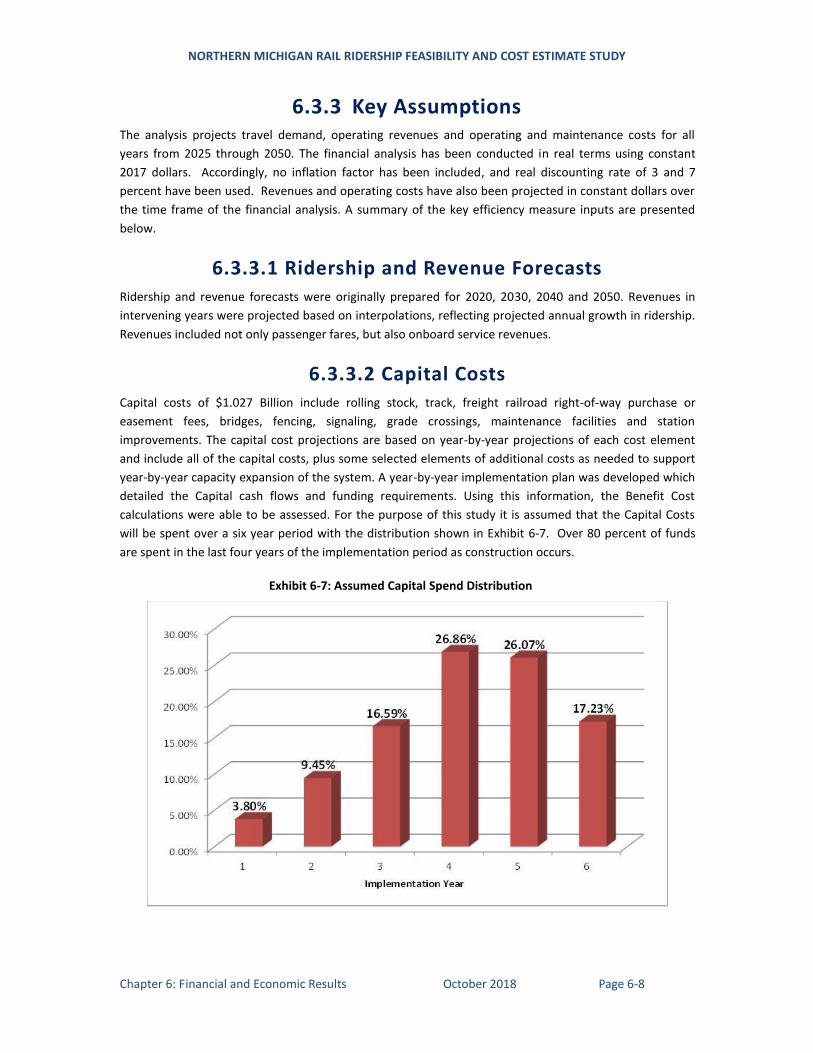
NORTHERN MICHIGAN RAIL RIDERSHIP FEASIBILITY AND COST ESTIMATE STUDY
Chapter 6: Financial and Economic Results October 2018 Page 6-8
6.3.3 Key Assumptions The analysis projects travel demand, operating revenues and operating and maintenance costs for all
years from 2025 through 2050. The financial analysis has been conducted in real terms using constant
2017 dollars. Accordingly, no inflation factor has been included, and real discounting rate of 3 and 7
percent have been used. Revenues and operating costs have also been projected in constant dollars over
the time frame of the financial analysis. A summary of the key efficiency measure inputs are presented
below.
6.3.3.1 Ridership and Revenue Forecasts Ridership and revenue forecasts were originally prepared for 2020, 2030, 2040 and 2050. Revenues in
intervening years were projected based on interpolations, reflecting projected annual growth in ridership.
Revenues included not only passenger fares, but also onboard service revenues.
6.3.3.2 Capital Costs Capital costs of $1.027 Billion include rolling stock, track, freight railroad right-of-way purchase or
easement fees, bridges, fencing, signaling, grade crossings, maintenance facilities and station
improvements. The capital cost projections are based on year-by-year projections of each cost element
and include all of the capital costs, plus some selected elements of additional costs as needed to support
year-by-year capacity expansion of the system. A year-by-year implementation plan was developed which
detailed the Capital cash flows and funding requirements. Using this information, the Benefit Cost
calculations were able to be assessed. For the purpose of this study it is assumed that the Capital Costs
will be spent over a six year period with the distribution shown in Exhibit 6-7. Over 80 percent of funds
are spent in the last four years of the implementation period as construction occurs.
Exhibit 6-7: Assumed Capital Spend Distribution
NORTHERN MICHIGAN RAIL RIDERSHIP FEASIBILITY AND COST ESTIMATE STUDY
Chapter 6: Financial and Economic Results October 2018 Page 6-9
6.3.3.3 Operating Expenses Major operating and maintenance expenses include equipment maintenance, track and right-of-way
maintenance, administration, fuel and energy, train crew and other relevant expenses. Operating
expenses were estimated in 2017 constant dollars so that they would remain comparable to revenues.
However, these costs do reflect the year-by-year increase in expense that is needed to handle the
forecasted ridership growth, in terms of not only directly variable expenses such as credit card
commissions, but also the need to add train capacity and operate either larger trains, or more train-miles
every year in order to accommodate anticipated ridership growth.
Operating costs are included as a cost, whereas system revenues are included as a benefit in the
discounting calculation over the life of the system. In this way they directly offset one another in the Net
Present Value calculation and are also reflected in the Benefit Cost calculation. It can be seen that a
system that requires an operating subsidy, e.g., where costs exceed revenues, will tend also to reflect this
in the Benefit Cost ratio. This is why slow speed options such as conventional Amtrak services often fail on
both the Operating Ratio and Benefit Cost ratio criteria.
6.3.3.4 User Benefits The analysis of user benefits for this study is based on the measurement of Generalized Cost of Travel,
which includes both time and money. Time is converted into money by the use of Values of Time. The
Values of Time (VOT) used in this study were derived from stated preference surveys conducted in the
Chicago-Detroit/Pontiac EIS and used in the COMPASS™ Multimodal Demand Model for the ridership and
revenue forecasts. These VOTs are consistent with previous academic and empirical research and other
transportation studies conducted by TEMS.
Consumer Surplus and Revenues: Benefits to users of the rail system are measured by the sum of system
revenues and consumer surplus. Consumer surplus is used to measure the demand side impact of a
transportation improvement on users of the service. It is defined as the additional benefit consumers
(users of the service) receive from the purchase of a commodity or service (travel), above the price
actually paid for that commodity or service. Consumer surpluses exist because there are always
consumers who are willing to pay a higher price than that actually charged for the commodity or service,
i.e., these consumers receive more benefit than is reflected by the system revenues alone. Revenues are
included in the measure of consumer surplus as a proxy measure for the consumer surplus forgone
because the price of rail service is not zero. This is an equity decision made by the USDOT to compensate
for the fact that highway users pay zero for use of the road system (the only exception being the use of
toll roads.) The benefits apply to existing rail travelers as well as new travelers who are induced (those
who previously did not make a trip) or diverted (those who previously used a different mode) to the new
passenger rail system.
The RENTS™ financial and economic analysis estimates passenger travel benefits (consumer surplus) by
calculating the increase in regional mobility, traffic diverted to rail, and the reduction in travel cost
measured in terms of generalized cost for existing rail users. The term generalized cost refers to the
combination of time and fares paid by users to make a trip. A reduction in generalized cost generates an
increase in the passenger rail user benefits. A transportation improvement that leads to improved
mobility reduces the generalized cost of travel, which in turn leads to an increase in consumer surplus.
Exhibit 6-8 presents a typical demand curve in which Area A represents the increase in consumer surplus
resulting from cost savings for existing rail users and Area B represents the consumer surplus resulting
from induced traffic and trips diverted to rail.
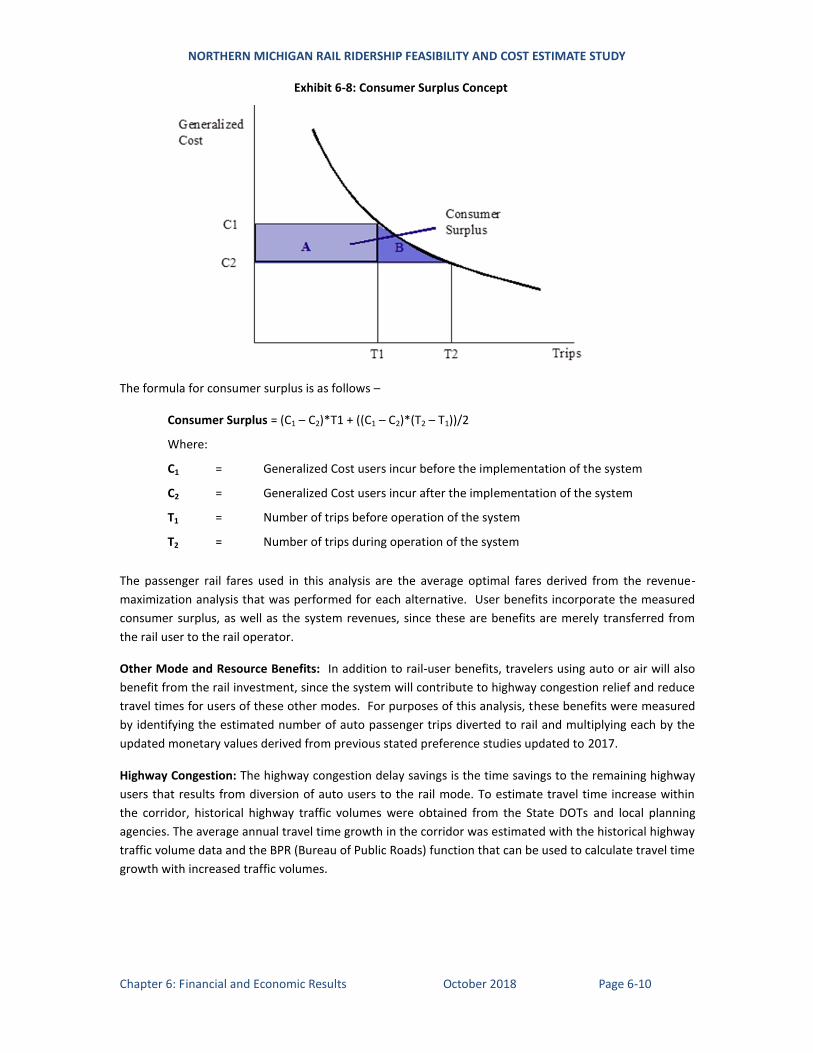
NORTHERN MICHIGAN RAIL RIDERSHIP FEASIBILITY AND COST ESTIMATE STUDY
Chapter 6: Financial and Economic Results October 2018 Page 6-10
Exhibit 6-8: Consumer Surplus Concept
The formula for consumer surplus is as follows –
Consumer Surplus = (C1 – C2)*T1 + ((C1 – C2)*(T2 – T1))/2
Where:
C1 = Generalized Cost users incur before the implementation of the system
C2 = Generalized Cost users incur after the implementation of the system
T1 = Number of trips before operation of the system
T2 = Number of trips during operation of the system
The passenger rail fares used in this analysis are the average optimal fares derived from the revenue-
maximization analysis that was performed for each alternative. User benefits incorporate the measured
consumer surplus, as well as the system revenues, since these are benefits are merely transferred from
the rail user to the rail operator.
Other Mode and Resource Benefits: In addition to rail-user benefits, travelers using auto or air will also
benefit from the rail investment, since the system will contribute to highway congestion relief and reduce
travel times for users of these other modes. For purposes of this analysis, these benefits were measured
by identifying the estimated number of auto passenger trips diverted to rail and multiplying each by the
updated monetary values derived from previous stated preference studies updated to 2017.
Highway Congestion: The highway congestion delay savings is the time savings to the remaining highway
users that results from diversion of auto users to the rail mode. To estimate travel time increase within
the corridor, historical highway traffic volumes were obtained from the State DOTs and local planning
agencies. The average annual travel time growth in the corridor was estimated with the historical highway
traffic volume data and the BPR (Bureau of Public Roads) function that can be used to calculate travel time
growth with increased traffic volumes.
NORTHERN MICHIGAN RAIL RIDERSHIP FEASIBILITY AND COST ESTIMATE STUDY
Chapter 6: Financial and Economic Results October 2018 Page 6-11
Airport Congestion Delay Savings: Airport Congestion Delay Savings would include the airport operation
delay saving and air passenger delay saving, but since the share of air travel diverted to rail is practically
nonexistent in this corridor, this benefit was not assessed. Many travelers do come into Traverse City by
air, but nearly all of them come from faraway locations that are well beyond the study area.
Auto Operating Cost (Non Business): Vehicle operating cost savings for non-business travelers have been
included in the current analysis as an additional resource benefit. This reflects the fact that social/leisure
travelers do not accurately value the full cost of driving when making trips. As a result, the consumer
surplus calculation for commuters, social, leisure and tourist travelers has not fully reflected the real cost
of operations of an automobile, but only the cost of gas. The difference between the cost of gas and the
full cost of driving reflects a real savings that should be included in a Benefit Cost analysis.
Emissions: The diversion of travelers to rail from the auto mode generates emissions savings. The
calculated emissions savings are based on changes in energy use with and without the proposed rail
service. This methodology takes into account the region of the country, air quality regulation compliance
of the counties served by the proposed rail service, the projection year, and the modes of travel used for
access/egress as well as the line-haul portion of the trip. Highway Reduced Emissions were estimated
from the vehicle miles traveled (VMT) and flight reductions derived from the ridership model, however
there were no forecasted reductions in airline flights. The assumption is that a reduction in VMT or flights
is directly proportional to the reduction in emissions. The pollutant values were taken from the latest
TIGER III Grant Benefit-Cost Analysis (BCA) Resource Guide36
.
Public Safety Benefits: Public Safety is calculated from the diverted Vehicle-Miles times the NHTSA37
fatality and injury rate per Vehicle mile and then times the values of fatality and injury from the latest
TIGER III Grant Benefit-Cost Analysis (BCA) Resource Guide.
6.4 Economic Results The results of the Cost Benefit analysis show in Exhibit 6-9 that the 110-mph rail upgrade project produces
strong economic returns which would more than meet the FRA’s funding requirements.
At a real interest rate of 3.0 percent, which approximates the government’s cost for borrowing
money; the project produces a 1.58 Benefit Cost ratio which means that the project returns $1.58
in value for every dollar spent.
At the much higher 7.0 percent interest rate, which is really a capital rationing rate, the project
produces a still healthy 1.20 Benefit Cost ratio. This reflects a heavier weighting of the up-front
capital in terms of the timing of expenditures, but the result is still producing a positive (>1.0)
result which shows that the project is still justified even at the very high real interest rate of 7.0
percent.
Over the life of the project the Operating Ratio is positive at 1.15. This means that a 110-mph rail
service would not need an operating subsidy since it could cover its own operating cost out of its
own farebox revenues.
36 http://www.dot.gov/sites/dot.dev/files/docs/TIGER_BCA_RESOURCE_GUIDE.pdf 37 http://www.nhtsa.gov/
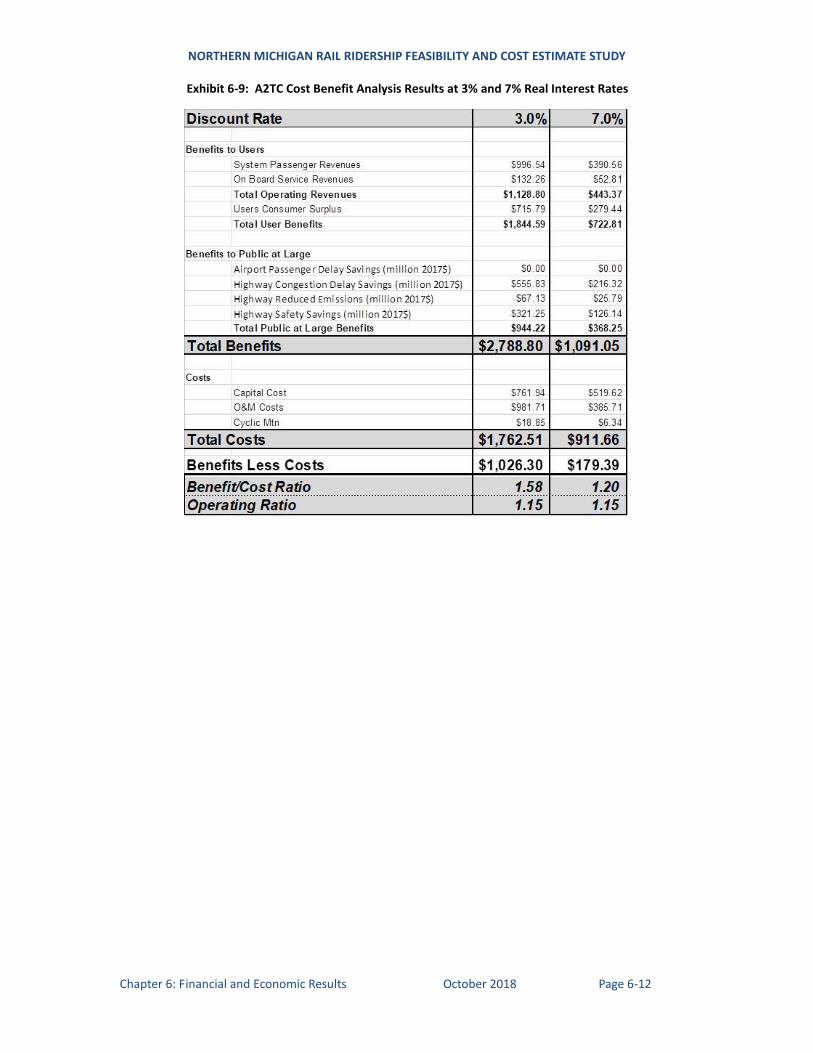
NORTHERN MICHIGAN RAIL RIDERSHIP FEASIBILITY AND COST ESTIMATE STUDY
Chapter 6: Financial and Economic Results October 2018 Page 6-12
Exhibit 6-9: A2TC Cost Benefit Analysis Results at 3% and 7% Real Interest Rates
NORTHERN MICHIGAN RAIL RIDERSHIP FEASIBILITY AND COST ESTIMATE STUDY
Chapter 7: Conclusions and Next Steps October 2018 Page 7-1
Chapter 7 Conclusions and Next Steps
S U M M A R Y
This chapter outlines the key findings of the study, and the next steps that should be taken to move the
Ann Arbor-to-Traverse City Passenger Rail Line project forward.
7.1 Conclusions
he results of the Ridership and Preliminary Financial and Economic Analyses support a
recommendation for further study. The specific study recommendations as outlined in section 7.2
aim to better understand the market and development options for the service.
Overall, the study found that the proposed service, if fully developed as proposed, could cover its
operating costs and that its economic benefits would substantially exceed its capital and operating costs.
The study finds that the proposed 110-mph option for regularly scheduled service would meet USDOT FRA
financial and economic thresholds.
Low speed options may be attractive as a means for quickly getting a service started and for testing the
market for rail service. The first of these options would be the northward expansion of the existing 25-
mph excursion train service to reach Traverse City and Petoskey; followed by a southward expansion of
excursion service which would be accompanied by an operating speed increase to 60-mph. This would
enable special and event train services including sports event trains, corporate charters, and the like
which could actually travel the whole length of the rail line. This could all be done by using GLC’s existing
excursion train equipment.
The next step beyond 60-mph excursion service would entail a transition to 60-mph regularly scheduled
service. At this point it is recommended to extend the route beyond Ann Arbor so that the train can serve
Detroit directly. At a 60-mph speed the operation of a regularly scheduled “common carrier” passenger
service will likely require an operating subsidy. However, the level of subsidy needed for the 60-mph and
90-mph options would be in line with the level of support which MDOT is providing to other Michigan
passenger train services. To eliminate the subsidies as soon as possible, it would be beneficial to
accelerate the track and bridge upgrades and purchase new High Speed Diesel trains for the line so that
110-mph capability can be reached as quickly as possible.
T
NORTHERN MICHIGAN RAIL RIDERSHIP FEASIBILITY AND COST ESTIMATE STUDY
Chapter 7: Conclusions and Next Steps October 2018 Page 7-2
7.2 Next Steps
To move the project forward as a public or public/private project TEMS would advise the completion of a
much more detailed Feasibility study. These will advance the development of the project by further
developing the marketing, train equipment and infrastructure strategies for the corridor.
The Feasibility Study should define the optimal approach to development of the rail corridor,
while developing all documentation needed for Michigan to be able to apply for all available
Federal funding.
Develop both a Service Development Plan (SDP) and a Service NEPA (Environmental Scan). A key
determination of the Feasibility Study will be the level of Environmental study that is needed to
advance the project, since the vast majority of proposed rail improvements would be developed
within the existing rail right of way.
A feasibility study should address the following issues:
A Market Assessment - Confirm and further refine the demand forecast with a view to gaining a
more complete understanding of specific trip attractors within northern Michigan –
o Seasonality and trip chaining
o The detailed characteristics of particular target markets such as student travel and
corporate groups, and how they travel.
o There would be a particular focus on the identification of niche market segments such as
excursion trains, overnight sleeper trains, corporate retreats, group travel, and
university sponsored special trains that are able and willing to pay enough so the rail
service can cover its own operating costs.
A Network Assessment - Consider additional possible service options such as –
o Expand the development of the option for extending the route beyond Traverse City at
least as far as Williamsburg
o Assess the possibility of extending a through service from Traverse City via Kalkaska to
Petoskey.
o Analyze the relationship of the proposed service with existing and developing services,
including the ability to coordinate operating schedules with the Wolverine, Blue Water
and with future planned Coast to Coast and WALLY line services.
An Institutional Assessment and Implementation Plan -
o Consider the potential for a PPP/franchise in order to attract private capital to the
project. Determine whether GLC or any other potential private operator could be in a
position to privately operate the A2TC passenger service while minimizing or even
eliminating the subsidy requirement.
o Develop a detailed Implementation Plan, outlining the short and long term actions that
might be taken to initiate service at 60 mph and over time, upgrade that service to the
level proposed at 110-mph. This includes identifying the development steps of the
corridor and aligning that with a funding plan, to allow the project to be phased in the
most effective manner.
NORTHERN MICHIGAN RAIL RIDERSHIP FEASIBILITY AND COST ESTIMATE STUDY
Chapter 7: Conclusions and Next Steps October 2018 Page 7-3
Joint Development and Local Economic Assessment -
o Complete the station location study with a particular view to optimizing the real estate
development and value capture opportunities associated with the implementation of
the rail service.
o Consider the development of a feeder bus network as appropriate and the ability to
integrate with regional transit and airports.
o Complete a supply side benefits assessment for being able to explain how the project
will impact all the communities along the line as well as the whole State of Michigan.
An Engineering and Operational Assessment - Optimize the infrastructure investment strategy
for the whole line, balancing the needs of freight and passenger service, and conduct a capacity
analysis to confirm the adequacy of the plan for handling forecasts freight and passenger traffic.
o For needed track connections, determine the best approach to Traverse City and
associated costs for developing the proposed Bietner Connection, as well as for the
proposed direct track connections at Cadillac and Ann Arbor.
o Since the cost of rail and need for rail replacement is a major driver of capital costs,
develop a Rail Strategy for the A2TC corridor. The A2TC is laid with many miles of 100
pound per yard rail which, although obsolete for heavy freight use, might still be
adequate for very light tonnage passenger use north of Cadillac. A specific assessment
should be made of the condition of 100 pound rail along the corridor to determine
whether any of it is worth field-welding in place, and in the alternative whether any of
this rail should be cascaded to replace extremely light rail on the line north of Cadillac.
o Further develop the inspection data and bridge repair strategy
o Further refine the interrelated strategies for grade crossing protection and Positive Train
Control;
o Identify environmental impacts and likely mitigation measures and costs
An Equipment Strategy - Work with MDOT to develop a detailed plan for meeting the equipment
needs of the start-up and excursion services at 60-mph, and with prospective new equipment
vendors for procuring new trains for 110-mph service.
A Financial/Economic and Funding Plan -
o Work closely with the Chicago-Detroit/Pontiac corridor, Coast-to-Coast and North-South
Commuter Rail teams to identify infrastructure and facilities that might be mutually
beneficial if the A2TC project moves forward.
o For example, by using the proposed new Huron River bridge track connection in
downtown Ann Arbor, the North-South Commuter Rail service could be redirected to
serve the Medical Center, where it could effectively integrate with both intercity rail
services as well as the proposed high-capacity corridor link, and the Coast to Coast
system could also use the bridge.
o A comprehensive benefits assessment is needed to identify benefits to freight, excursion
trains and other potential future users of the corridor such as WALLY line and Coast-to-
Coast services
NORTHERN MICHIGAN RAIL RIDERSHIP FEASIBILITY AND COST ESTIMATE STUDY
Chapter 7: Conclusions and Next Steps October 2018 Page 7-4
o Enhance the benefits assessment to reflect the fact that infrastructure investments will
be mutually supportive to all users of the rail line. While some costs may clearly be the
responsibility of one service or the other, other costs are shared.
o A collaborative approach would help facilitate a better understanding of the synergies
between the needs of different corridor users.
o Developing a single integrated Cost Benefit calculation would avoid the need for
developing allocations of shared costs, which often tend to be arbitrary.
o This offers the best prospect for accelerating the time frames for badly-needed
infrastructure improvements and would help to ensure that MDOT optimizes its return
on investment for improving the A2TC corridor.
Implement a public outreach effort with a structured approach for communicating the study
findings while engaging both the project stakeholders and the public at large.
NORTHERN MICHIGAN RAIL RIDERSHIP FEASIBILITY AND COST ESTIMATE STUDY
Appendix A: Conclusions and Next Steps October 2018 Page A-1
Appendix A RightTrack™ System Software
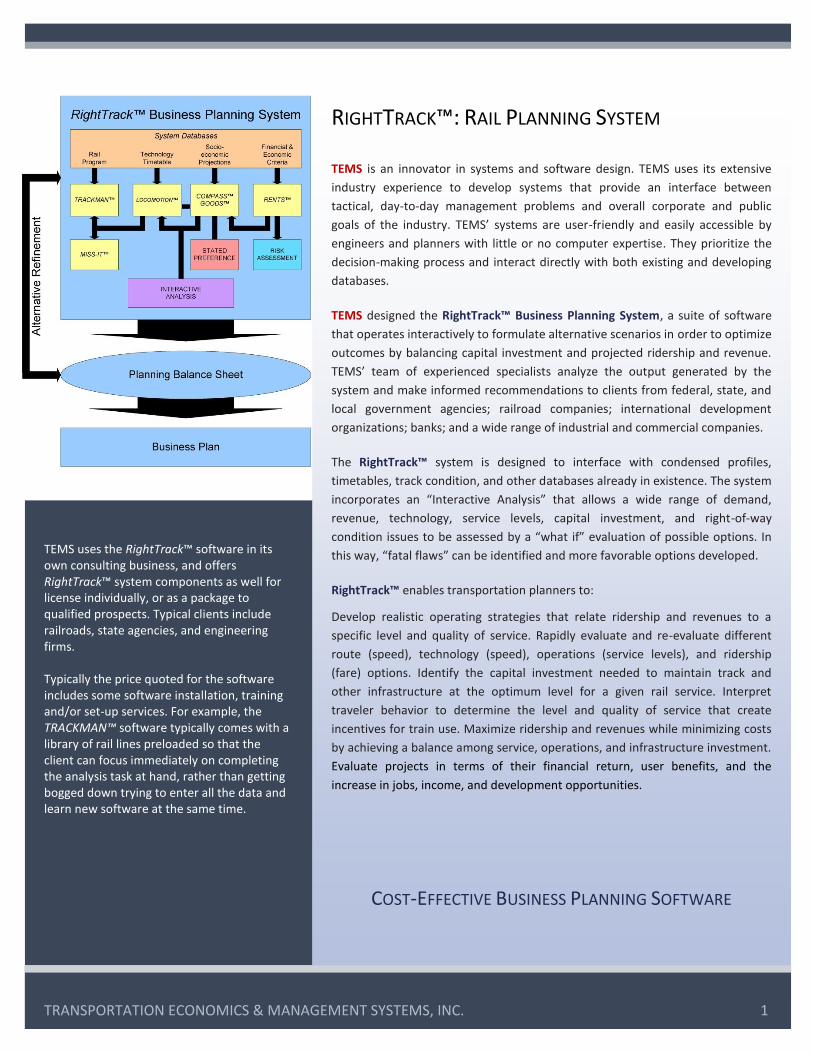
TRANSPORTATION ECONOMICS & MANAGEMENT SYSTEMS, INC. 7 TRANSPORTATION ECONOMICS & MANAGEMENT SYSTEMS, INC. 1
RIGHTTRACK™: RAIL PLANNING SYSTEM TEMS is an innovator in systems and software design. TEMS uses its extensive
industry experience to develop systems that provide an interface between
tactical, day-to-day management problems and overall corporate and public
goals of the industry. TEMS’ systems are user-friendly and easily accessible by
engineers and planners with little or no computer expertise. They prioritize the
decision-making process and interact directly with both existing and developing
databases.
TEMS designed the RightTrack™ Business Planning System, a suite of software
that operates interactively to formulate alternative scenarios in order to optimize
outcomes by balancing capital investment and projected ridership and revenue.
TEMS’ team of experienced specialists analyze the output generated by the
system and make informed recommendations to clients from federal, state, and
local government agencies; railroad companies; international development
organizations; banks; and a wide range of industrial and commercial companies.
The RightTrack™ system is designed to interface with condensed profiles,
timetables, track condition, and other databases already in existence. The system
incorporates an “Interactive Analysis” that allows a wide range of demand,
revenue, technology, service levels, capital investment, and right-of-way
condition issues to be assessed by a “what if” evaluation of possible options. In
this way, “fatal flaws” can be identified and more favorable options developed.
RightTrack™ enables transportation planners to:
Develop realistic operating strategies that relate ridership and revenues to a
specific level and quality of service. Rapidly evaluate and re-evaluate different
route (speed), technology (speed), operations (service levels), and ridership
(fare) options. Identify the capital investment needed to maintain track and
other infrastructure at the optimum level for a given rail service. Interpret
traveler behavior to determine the level and quality of service that create
incentives for train use. Maximize ridership and revenues while minimizing costs
by achieving a balance among service, operations, and infrastructure investment.
Evaluate projects in terms of their financial return, user benefits, and the
increase in jobs, income, and development opportunities.
COST-EFFECTIVE BUSINESS PLANNING SOFTWARE
TEMS uses the RightTrack™ software in its own consulting business, and offers RightTrack™ system components as well for license individually, or as a package to qualified prospects. Typical clients include railroads, state agencies, and engineering firms. Typically the price quoted for the software includes some software installation, training and/or set-up services. For example, the TRACKMAN™ software typically comes with a library of rail lines preloaded so that the client can focus immediately on completing the analysis task at hand, rather than getting bogged down trying to enter all the data and learn new software at the same time.
TRANSPORTATION ECONOMICS & MANAGEMENT SYSTEMS, INC. 1
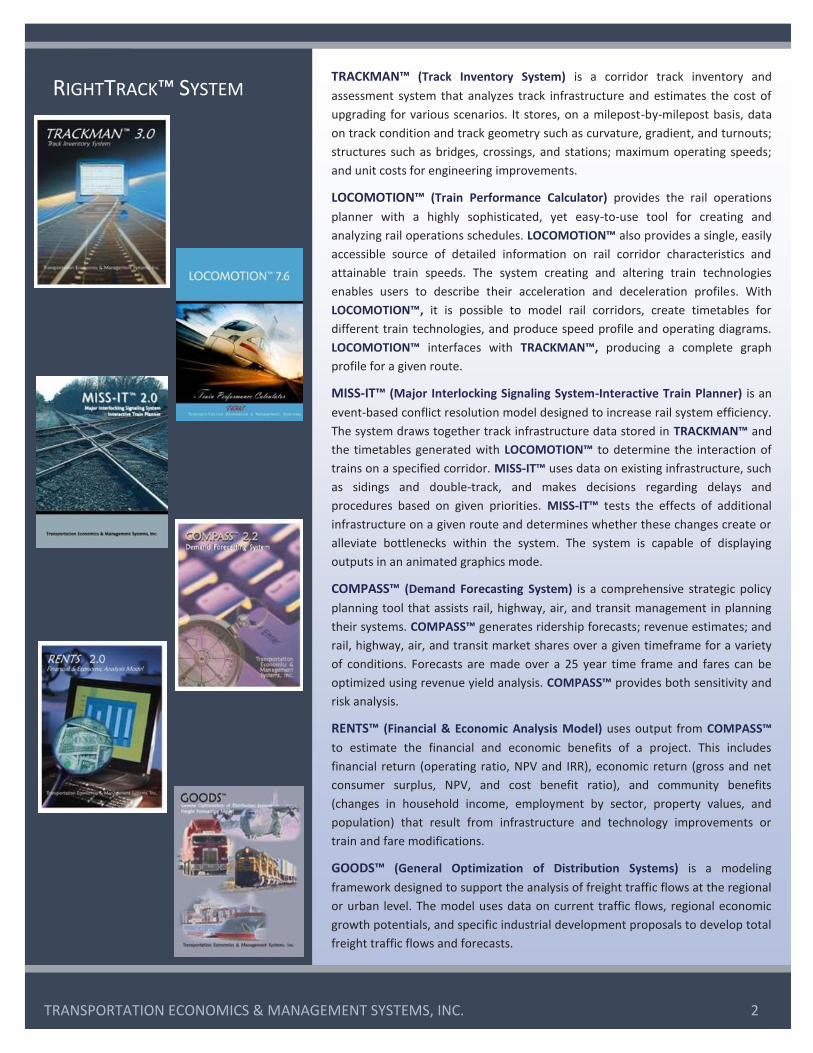
TRACKMAN™ (Track Inventory System) is a corridor track inventory and
assessment system that analyzes track infrastructure and estimates the cost of
upgrading for various scenarios. It stores, on a milepost-by-milepost basis, data
on track condition and track geometry such as curvature, gradient, and turnouts;
structures such as bridges, crossings, and stations; maximum operating speeds;
and unit costs for engineering improvements.
LOCOMOTION™ (Train Performance Calculator) provides the rail operations
planner with a highly sophisticated, yet easy-to-use tool for creating and
analyzing rail operations schedules. LOCOMOTION™ also provides a single, easily
accessible source of detailed information on rail corridor characteristics and
attainable train speeds. The system creating and altering train technologies
enables users to describe their acceleration and deceleration profiles. With
LOCOMOTION™, it is possible to model rail corridors, create timetables for
different train technologies, and produce speed profile and operating diagrams.
LOCOMOTION™ interfaces with TRACKMAN™, producing a complete graph
profile for a given route.
MISS-IT™ (Major Interlocking Signaling System-Interactive Train Planner) is an
event-based conflict resolution model designed to increase rail system efficiency.
The system draws together track infrastructure data stored in TRACKMAN™ and
the timetables generated with LOCOMOTION™ to determine the interaction of
trains on a specified corridor. MISS-IT™ uses data on existing infrastructure, such
as sidings and double-track, and makes decisions regarding delays and
procedures based on given priorities. MISS-IT™ tests the effects of additional
infrastructure on a given route and determines whether these changes create or
alleviate bottlenecks within the system. The system is capable of displaying
outputs in an animated graphics mode.
COMPASS™ (Demand Forecasting System) is a comprehensive strategic policy
planning tool that assists rail, highway, air, and transit management in planning
their systems. COMPASS™ generates ridership forecasts; revenue estimates; and
rail, highway, air, and transit market shares over a given timeframe for a variety
of conditions. Forecasts are made over a 25 year time frame and fares can be
optimized using revenue yield analysis. COMPASS™ provides both sensitivity and
risk analysis.
RENTS™ (Financial & Economic Analysis Model) uses output from COMPASS™
to estimate the financial and economic benefits of a project. This includes
financial return (operating ratio, NPV and IRR), economic return (gross and net
consumer surplus, NPV, and cost benefit ratio), and community benefits
(changes in household income, employment by sector, property values, and
population) that result from infrastructure and technology improvements or
train and fare modifications.
GOODS™ (General Optimization of Distribution Systems) is a modeling
framework designed to support the analysis of freight traffic flows at the regional
or urban level. The model uses data on current traffic flows, regional economic
growth potentials, and specific industrial development proposals to develop total
freight traffic flows and forecasts.
0
1
2
3
4
5
6
7
8
-8 -3 2 7 12 17 22
Inaccuracy (%)
Co
un
ts
normal distribution
rail (TEMS, 34)
0
1
2
3
4
5
6
7
8
-8 -3 2 7 12 17 22
Inaccuracy (%)
Co
un
ts
normal distribution
rail (TEMS, 34)
0
1
2
3
4
5
6
7
8
-8 -3 2 7 12 17 22
Inaccuracy (%)
Co
un
ts
normal distribution
rail (TEMS, 34)
TRANSPORTATION ECONOMICS & MANAGEMENT SYSTEMS, INC. 2
RIGHTTRACK™ SYSTEM