northern pikeminnow management program · pdf filenorthern pikeminnow management program...
TRANSCRIPT
Northern Pikeminnow Management Program Evaluation
Evaluate Predator Control Fisheries and Establish an Index of Predation by Northern Pikeminnow and Other Piscivorous Fishes on Juvenile Salmonids in
the Lower Columbia and Snake Rivers.
BPA Project # 1990-077-00
Report covers work performed under BPA contract #(s) 61037, BPA-7723
Report was completed under BPA contract #(s) 61037; BPA-7723
1/1/2013 - 12/31/2013
Adam J. Storch**, Christine Mallette** and Stephen Williams*
*Pacific States Marine Fisheries Commission, Portland, OR, 97202
**Oregon Department of Fish and Wildlife, Clackamas, OR 97015
Report Created 3-2014
This report was funded by the Bonneville Power Administration (BPA), U.S. Department of Energy, as part of BPA's program to protect, mitigate, and enhance fish and wildlife affected by the development and operation of
hydroelectric facilities on the Columbia River and its tributaries. The views in this report are the author's and do not necessarily represent the views of BPA.
This report should be cited as follows: Storch, A. J., C. Mallette* and S. Williams. 2013. Northern Pikeminnow Management Program Evaluation 1/1/2013 - 12/31/2013. Annual RM&E Report for BPA Project No. 1990-077-00
Run At 3/10/2014 11:21:55 AM
1
Table of Contents Table of Contents ............................................................................................................................................................. 2
1. Executive Summary ................................................................................................................................................ 2
a. Predation and Invasive Species Management RM&E ......................................................................................... 2
b. Predator Control and Management .................................................................................................................... 3
2. Introduction ............................................................................................................................................................ 4
a. Predation and Invasive Species Management RM&E (Status and Trends; Action Effectiveness) ..................... 4
b. Predator Control and Management .................................................................................................................... 4
3. Methods: Protocols, Study Designs, and Study Area .............................................................................................. 6
4. Results ...................................................................................................................................................................10
a. Predation and Invasive Species Management RM&E ........................................................................................10
b. Predator Control and Management ...................................................................................................................13
5. Synthesis of Findings: Discussion/Conclusions ....................................................................................................14
a. Predation and Invasive Species Management RM&E ........................................................................................14
b. Predator Control and Management ...................................................................................................................15
6. References .............................................................................................................................................................17
Appendix A: Use of Data & Products .............................................................................................................................21
Appendix C: List of Metrics and Indicators ...................................................................................................................37
1. Executive Summary
a. Predation and Invasive Species Management RM&E Biological evaluation of northern pikeminnow, smallmouth bass and walleye was conducted in Ice Harbor, Lower Monumental, Little Goose and Lower Granite reservoirs during 2013. Abundance index values for northern pikeminnow in these reservoirs ranged from 0.00 to 0.17, whereas estimates varied between 0.05 and 2.94 during the first year of the NPMP in 1990. Juvenile salmon were encountered in the stomach contents of northern pikeminnow only in Lower Granite Reservoir (�̂�𝑝 = 0.57). Across reservoirs, other taxa common in diet samples included sculpins (�̂�𝑝𝑚𝑚𝑚𝑚𝑚𝑚= 0.14; Family: Cottidae), sunfishes (�̂�𝑝𝑚𝑚𝑚𝑚𝑚𝑚= 0.33; Family: Centrarchidae) and lampreys (�̂�𝑝𝑚𝑚𝑚𝑚𝑚𝑚= 0.33; Family: Petromyzontidae). We were unable to calculate consumption index values – and consequently predation index values – for northern pikeminnow in all areas within reservoirs due to sample size constraints.
Smallmouth bass abundance index values generally were greatest in the mid-reservoir areas of the Snake River reservoirs sampled in both spring and summer periods. Estimates exceeded those of all previous years (1991–2012) in mid-reservoir areas of Lower Monumental Reservoir during summer and Little Goose Reservoir during both spring and summer sampling events. Smallmouth bass consumption index values for the Snake River reservoirs were similar to those observed in preceding years. Across reservoirs, the most frequently occurring taxa observed in smallmouth diet samples were sand rollers (�̂�𝑝𝑚𝑚𝑚𝑚𝑚𝑚 = 0.56; Family: Percopsidae) and sculpins (�̂�𝑝𝑚𝑚𝑚𝑚𝑚𝑚 = 0.36; Family: Cottidae). Proportions
2
of smallmouth bass diet samples containing juvenile salmon ranged from 0.08 to 0.18 across reservoirs. Although diet composition and consumption index values varied relatively little among years, predation index values calculated for smallmouth bass in mid-reservoir areas during the summer sampling period commonly were the highest calculated since monitoring began in 1991, likely an artifact of elevated abundances of smallmouth bass (i.e., abundance index values) in these areas.
As in previous years, walleye were encountered only in the mid-reservoir and tailrace areas of Lower Monumental Reservoir, where spring and summer abundance index values exceeded those calculated for 2010. Throughout the broader time series (i.e., 1999–2013) abundance index estimates varied considerably, displaying no obvious monotonic trend. Juvenile Pacific salmon generally were encountered infrequently in gut content samples of walleye in Lower Monumental Reservoir (�̂�𝑝 = 0.09) whereas minnows (Family: Cyprinidae) were encountered regularly (�̂�𝑝 = 0.64).
During 2013, we evaluated 212 and 451 northern pikeminnow diet samples collected during angling activities at The Dalles and John Day dams, respectively. Fish were the primary prey type consumed by northern pikeminnow captured at both The Dalles and John Day dams. Across months, juvenile salmon and American shad were encountered in the greatest number of northern pikeminnow diet samples (�̂�𝑝𝑚𝑚𝑚𝑚𝑚𝑚 = 0.74 and 0.84, respectively).
Increasing abundance index values for non-native piscivores in some areas of the Snake River reservoirs may be an early indication of a localized compensatory response to northern pikeminnow removal. Given the fragmented nature of these systems, we recommend monitoring efforts continue to assess localized trends in predator populations throughout the Columbia and Snake rivers to help elucidate potential net (system-wide) effects.
b. Predator Control and Management To evaluate exploitation during 2013, we tagged and released 1,125 northern pikeminnow greater than or equal to200 mm fork length (FL) throughout the lower Columbia and Snake rivers. Of these fish, 714 were greater than or equal to 250 mm FL, the size-class used to monitor trends in system-wide exploitation and predation reduction since inception of the NPMP in 1990. System-wide exploitation of northern pikeminnow during the Sport-Reward fishery was 10.8% (95% confidence interval; 6.9–14.7%). Exploitation rates were adjusted using an estimated tag loss of 1.1%. Using the model of Friesen and Ward (1999), we estimated that 2013 predation levels were 35% (range: 20–53%) lower than pre-program levels.
3

2. Introduction For each Fish and Wildlife Program Strategy briefly discuss how your project informs/supports the program sub strategies and associated management questions. The content may be reorganized into any format of your choosing.
a. Predation and Invasive Species Management RM&E (Status and Trends; Action Effectiveness)
F&W Program Strategy: Evaluate the effects of the northern pike minnow removal program and investigate strategies to reduce non-indigenous piscivorous (e.g., walleye, bass) predation on salmonids.
F&W Program Management Question: What are the distributions, population sizes, and productivity; and What are the impacts and consumption rates of major piscivorous, avian, and marine mammal predators within the Columbia River Basin?
The Columbia and Snake rivers once supported large numbers of naturally produced anadromous Pacific salmon (Oncorhynchus spp.). Declines in adult returns have been attributed to many factors, including habitat degradation and overexploitation (Nehlsen et al. 1991; Wismar et al. 1994), hydroelectric and flood control activities (Raymond 1988), and predation (Rieman et al. 1991; Collis et al. 2002). The mean annual loss of juvenile salmon to predators can be equivalent to mortality associated with dam passage (Rieman et al. 1991), which has approached 30% at a single dam (Long and Ossiander 1974). The Northern Pikeminnow Management Program (NPMP) is a set of targeted fisheries aimed at reducing predation on juvenile salmon by northern pikeminnow Ptychocheilus oregonensis in the lower Columbia and Snake rivers (Rieman and Beamesderfer 1990; Beamesderfer et al. 1996). Prior to the implementation of these fisheries, the Oregon Department of Fish and Wildlife (ODFW) quantified baseline levels of predation on juvenile salmon by select piscivorous fishes as well as northern pikeminnow population characteristics. Abundance, consumption, and predation were estimated in Columbia River reservoirs in 1990 and 1993, Snake River reservoirs in 1991, and the lower Columbia River downstream from Bonneville Dam in 1992 (Ward et al. 1995). We continue to sample northern pikeminnow populations in standardized areas, and to compare results among years when sample sizes are adequate to produce unbiased estimates (Zimmerman and Ward 1999; Zimmerman et al. 2000; Takata et al. 2007).
b. Predator Control and Management F&W Program Strategy: Predator Control Implementation
To evaluate exploitation during 2013, we tagged and released 1,125 northern pikeminnow greater than or equal to200 mm fork length (FL) throughout the lower Columbia and Snake rivers. Of these fish, 714 were greater than or equal to 250 mm FL, the size-class used to monitor trends in system-wide exploitation and predation reduction since inception of the NPMP in 1990. System-wide exploitation of northern pikeminnow during the Sport-Reward fishery was 10.8% (95% confidence interval; 6.9–14.7%). Exploitation rates were adjusted using an estimated tag loss of 1.1%. Using the model of Friesen and Ward (1999), we estimated that 2013 predation levels were 35% (range: 20–53%) lower than pre-program levels.
Location details: For each F&W Program Strategy above, insert maps, aerial photos, or pictures of where your work was conducted. Below are links to existing project or contract map options created in cbfish.org or insert your own.
4
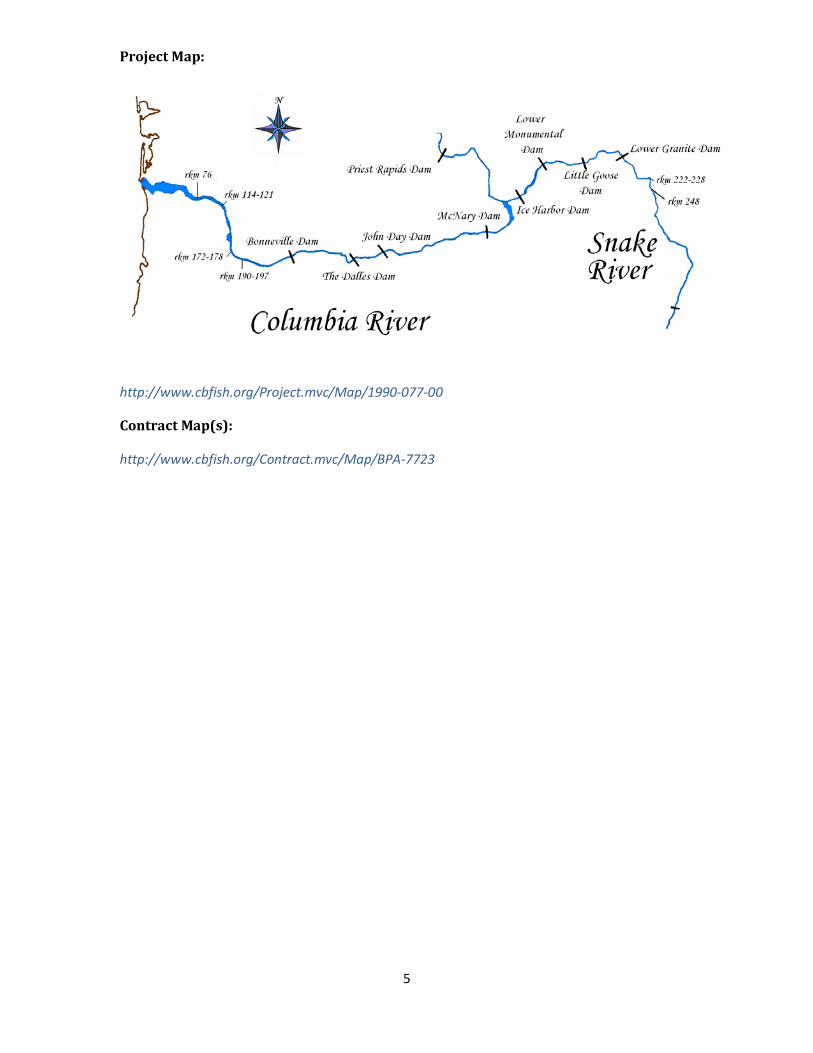
Project Map:
http://www.cbfish.org/Project.mvc/Map/1990-077-00
Contract Map(s):
http://www.cbfish.org/Contract.mvc/Map/BPA-7723
5

3. Methods: Protocols, Study Designs, and Study Area To evaluate the effects of the northern pike minnow removal program and investigate strategies to reduce non-indigenous piscivorous (e.g., walleye, bass) predation on salmonids (i.e., Predation and Invasive Species Management RM&E) in four lower Snake River reservoirs (Ice Harbor, Lower Monumental, Little Goose, and Lower Granite), we used standardized boat electrofishing techniques as described in Ward et al. (1995) and Zimmerman and Ward (1999). Early morning (0200–1200) sampling was conducted during spring (9 May–3 June) and summer (25 June–1 July) in three areas (forebay, mid-reservoir, and tailrace) of each reservoir. The areas contained 20 to 24 transects, each approximately 500 m in length, along both shores of the river. Effort at each transect consisted of a 15 minute electrofishing period with continuous output of approximately 4 amperes. During the summer season, we were unable to sample the forebay and tailrace areas Lower Monumental reservoir as well as the forebay and mid-reservoir areas of Ice Harbor because shoreline water temperatures exceeded 18°C; an environmental threshold specified in scientific collection permits.
We recorded catch and biological data for all northern pikeminnow, smallmouth bass and walleye collected during sampling. Length (FL; nearest mm) and mass (nearest 10 g) were measured for all fish greater than or equal to 200 mm FL. Scales were removed from 25 fish per 25 mm FL increment for the three species by reservoir and season. All untagged northern pikeminnow greater than or equal to 200 mm FL were sacrificed to collect digestive tracts for diet analysis. Digestive tracts were removed by securing both ends with hemostats and pulling free the connective tissue. External tissue was then removed and digestive tracts were placed in sample bags for storage. Whenever possible, we recorded sex and stage of maturity for each sacrificed fish. Stomach contents from smallmouth bass and walleye greater than or equal to 200 mm FL or were collected by gastric lavage using a modified Seaburg sampler (Seaburg 1957). Contents from the foregut of fish were flushed into a 425 µm sieve and then transferred into individual sample bags. All samples were stored on ice while in the field, and then transferred to a freezer until analysis in the laboratory.
Using the protocol described above, we also collected digestive tracts from northern pikeminnow captured during the dam angling portion of the NPMP (Dunlap et al. 2014, this report). Digestive tracts were collected from a representative subsample of catches at each dam weekly from 28 May through 21 August 2013 (generally four days per week). In addition, morphometric (length and mass), sex and maturity data were collected for each fish sampled.
In the laboratory, the contents of digestive tracts from northern pikeminnow, smallmouth bass, and walleye collected during biological evaluation and northern pikeminnow collected during the Dam-Angling fishery to quantify relative consumption of juvenile salmon. Each sample was thawed in the laboratory and the contents sorted into general prey categories (fish, crayfish, other crustaceans, mollusks, insects, and vegetation). Material was weighed (blotted wet mass) to the nearest 0.01 g according to prey category. Stomach contents were then returned to the original sample bags. To digest soft tissues, a solution of pancreatin and sodium sulfide nonahydrate (Na2O9S) – mixed at 20 g and 10 g per liter of tap water, respectively – was added to each sample. Sample bags were then sealed and placed in a desiccating oven at approximately 48°C for 24 hours. After removal from the oven, a sodium hydroxide solution (30g NaOH·1 l H2O-1) was added to samples to dissolve remaining fats. Contents of each bag were then poured into a 425 µm sieve and rinsed with tap water. The remaining bones were identified to the lowest possible taxon (Hansel et al. 1988, Frost 2000, and Parrish et al. 2006) under a dissecting microscope.
Following the methods of Ward et al. (1995), we calculated seasonal abundance index values for each predator species by multiplying catch per unit of effort (CPUE; fish·900 second electrofishing run-1) by the surface area of specific sampling locations in each reservoir. We then applied the models of Ward et al. (1995) and Ward and Zimmerman (1999) to calculate consumption index values for northern pikeminnow (CINPM) and smallmouth bass (CISMB) as follows:
CINPM = 0.0209 . T1.60 . W0.27 . (S . GW-0.61), (6)
6
And
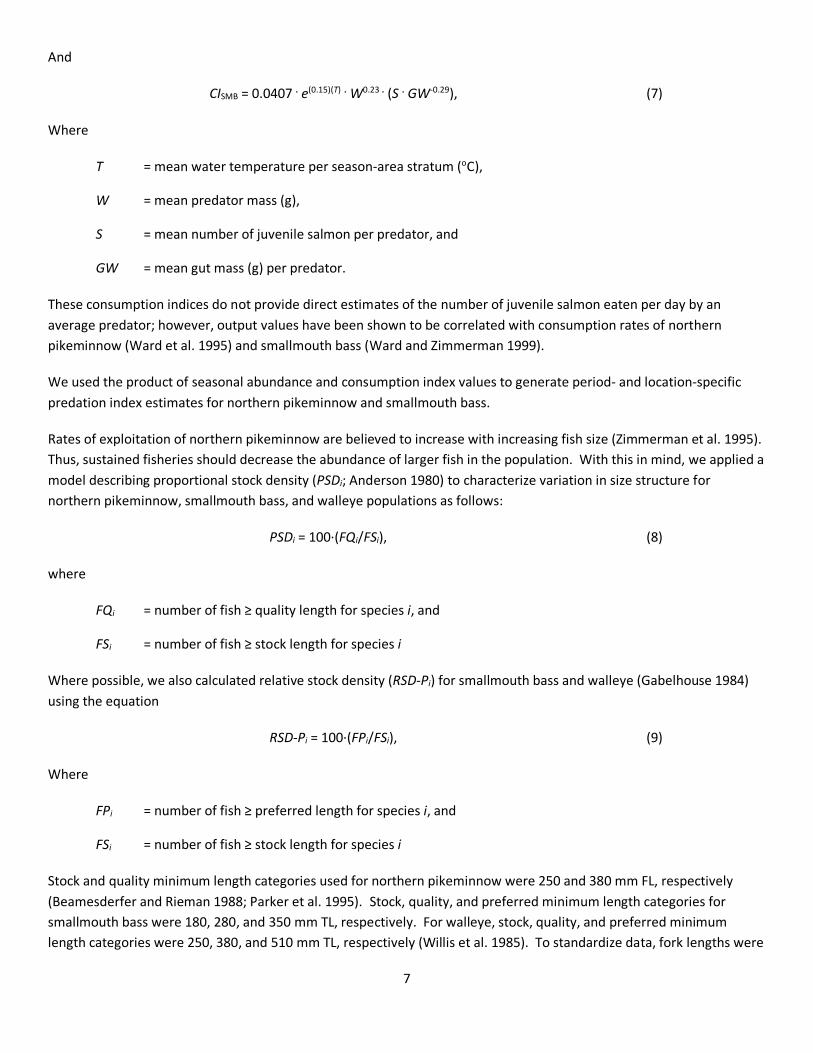
CISMB = 0.0407 . e(0.15)(T) . W0.23 . (S . GW-0.29), (7)
Where
T = mean water temperature per season-area stratum (oC),
W = mean predator mass (g),
S = mean number of juvenile salmon per predator, and
GW = mean gut mass (g) per predator.
These consumption indices do not provide direct estimates of the number of juvenile salmon eaten per day by an average predator; however, output values have been shown to be correlated with consumption rates of northern pikeminnow (Ward et al. 1995) and smallmouth bass (Ward and Zimmerman 1999).
We used the product of seasonal abundance and consumption index values to generate period- and location-specific predation index estimates for northern pikeminnow and smallmouth bass.
Rates of exploitation of northern pikeminnow are believed to increase with increasing fish size (Zimmerman et al. 1995). Thus, sustained fisheries should decrease the abundance of larger fish in the population. With this in mind, we applied a model describing proportional stock density (PSDi; Anderson 1980) to characterize variation in size structure for northern pikeminnow, smallmouth bass, and walleye populations as follows:
PSDi = 100·(FQi/FSi), (8)
where
FQi = number of fish ≥ quality length for species i, and
FSi = number of fish ≥ stock length for species i
Where possible, we also calculated relative stock density (RSD-Pi) for smallmouth bass and walleye (Gabelhouse 1984) using the equation
RSD-Pi = 100·(FPi/FSi), (9)
Where
FPi = number of fish ≥ preferred length for species i, and
FSi = number of fish ≥ stock length for species i
Stock and quality minimum length categories used for northern pikeminnow were 250 and 380 mm FL, respectively (Beamesderfer and Rieman 1988; Parker et al. 1995). Stock, quality, and preferred minimum length categories for smallmouth bass were 180, 280, and 350 mm TL, respectively. For walleye, stock, quality, and preferred minimum length categories were 250, 380, and 510 mm TL, respectively (Willis et al. 1985). To standardize data, fork lengths were
7

converted to total length using species-specific models (smallmouth bass: TLSMB = FLSMB·1.040; walleye: TLWAL = FLWAL·1.060).
Like shifts in size-structure, changes in body condition may indicate a response by remaining predators to the sustained exploitation of pikeminnow. We used relative weight (Wr; Anderson and Neumann 1996) to compare the condition of northern pikeminnow, smallmouth bass, and walleye in 2013 with previous years. Length-specific standard weights predicted by a length-mass regression model ([log10(Ws)=a′+b∙log10(L)]), for northern pikeminnow (Parker et al. 1995), smallmouth bass (Kolander et al. 1993), and walleye (Murphy et al. 1990) were used to calculate relative weight [Wr = 100∙(W/Ws)]. To account for potential sexual dimorphism, we calculated median Wr separately for male and female northern pikeminnow. Because sampling methodologies preclude diagnosis of sex for smallmouth bass and walleye in the field, we did not calculate separately median Wr for males and females. To assess temporal trends in median Wr for northern pikeminnow we applied a Mann-Kendall test (Mann 1945) wherever possible for each reservoir. To account for serial dependence, trends were evaluated using a block bootstrap technique (Davidson and Hinkley 1997; McLeod 2011). Where feasible, missing data were estimated using linear interpolation. Analyses were conducted in the R programming environment using the ‘Kendall’ (McLeod 2011) and ‘boot’ (Fox and Weisberg 2011) packages. All tests were considered significant at α = 0.05.
To assess the efficacy of predator control implementation (i.e., e.g., Predator Control and Management), we tagged northern pikeminnow and estimated exploitation rates with tag recovery data from the Sport-Reward fishery. Northern pikeminnow were collected using boat electrofishing in the Columbia River from river kilometer (rkm) 76 (near Clatskanie, Oregon) upstream to rkm 639 (Priest Rapids Dam) and in the Snake River from rkm 112 (Little Goose Dam) to rkm 248 (see map). Four, 15-minute electrofishing transects were conducted in each river mile (i.e., 1.6 rkm). Sampling occurred between 2 April and 19 June 2013 between the hours of 1800 and 0400, except in the Hanford Reach of the Columbia River (rkm 557–639), where river navigation necessitated daytime sampling.
We tagged, and subsequently released northern pikeminnow greater than or equal to 200 mm in fork length (FL) with uniquely numbered Floy FT-4 lock-on loop tags. Each loop tag was inserted through the pterygiophores just below the midpoint of the dorsal fin. Due to logistical constraints, we were unable to complete tagging activities prior to the start of the Sport-Reward and Dam Angling fisheries. All fish captured downstream of The Dalles Dam (rkm 306) were tagged prior to the start of the fisheries, whereas all tagging conducted upstream of The Dalles Dam was performed concomitant with the fisheries. To provide an annual estimate of tag loss, all loop-tagged fish were marked secondarily with a 134.2 MHz ISO passive integrated transponder (PIT) tag inserted into the dorsal sinus.
We worked in cooperation with the Washington Department of Fish and Wildlife (WDFW) to acquire tag recovery information from the Sport-Reward and Dam-Angling fisheries. The fishery occurred between 1 May and 30 September 2013 (Hone et al. 2014, this report). Participating anglers received payment for all harvested northern pikeminnow greater than or equal to230 mm (9 in) total length (TL). This size criterion for total length corresponds approximately to the minimum fork length (i.e., 200 mm) of northern pikeminnow marked during tagging operations. The payment schedule consisted of three tiers (Porter 2014, this report), and anglers were eligible for a $500 reward for each loop-tagged fish that was returned to a check station.
In addition to the Sport Reward fishery, a NPMP-administered Dam-Angling fishery (Dunlap et al. 2014, this report) was conducted between 1 May and 4 October 2013 in the powerhouse tailraces of The Dalles and John Day dams. For this effort, a team of anglers used hook and line to remove northern pikeminnow greater than or equal to 230 mm TL. Loop-tagged fish captured by the dam anglers were accounted for when estimating exploitation rates for the Sport-Reward fishery (see below).
8
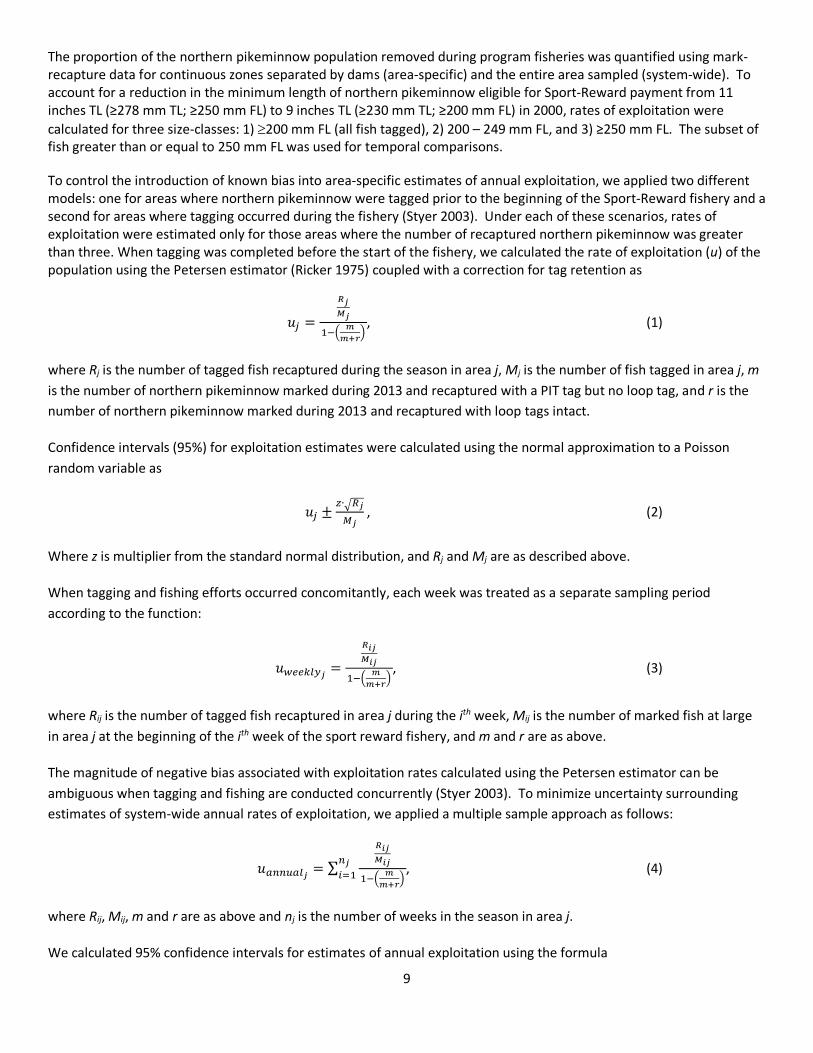
The proportion of the northern pikeminnow population removed during program fisheries was quantified using mark-recapture data for continuous zones separated by dams (area-specific) and the entire area sampled (system-wide). To account for a reduction in the minimum length of northern pikeminnow eligible for Sport-Reward payment from 11 inches TL (≥278 mm TL; ≥250 mm FL) to 9 inches TL (≥230 mm TL; ≥200 mm FL) in 2000, rates of exploitation were calculated for three size-classes: 1) ≥200 mm FL (all fish tagged), 2) 200 – 249 mm FL, and 3) ≥250 mm FL. The subset of fish greater than or equal to 250 mm FL was used for temporal comparisons.
To control the introduction of known bias into area-specific estimates of annual exploitation, we applied two different models: one for areas where northern pikeminnow were tagged prior to the beginning of the Sport-Reward fishery and a second for areas where tagging occurred during the fishery (Styer 2003). Under each of these scenarios, rates of exploitation were estimated only for those areas where the number of recaptured northern pikeminnow was greater than three. When tagging was completed before the start of the fishery, we calculated the rate of exploitation (u) of the population using the Petersen estimator (Ricker 1975) coupled with a correction for tag retention as
𝑢𝑢𝑗𝑗 =
𝑅𝑅𝑗𝑗𝑀𝑀𝑗𝑗
1−� 𝑚𝑚𝑚𝑚+𝑟𝑟�
, (1)
where Rj is the number of tagged fish recaptured during the season in area j, Mj is the number of fish tagged in area j, m is the number of northern pikeminnow marked during 2013 and recaptured with a PIT tag but no loop tag, and r is the number of northern pikeminnow marked during 2013 and recaptured with loop tags intact.
Confidence intervals (95%) for exploitation estimates were calculated using the normal approximation to a Poisson random variable as
𝑢𝑢𝑗𝑗 ±𝑧𝑧∙�𝑅𝑅𝑗𝑗𝑀𝑀𝑗𝑗
, (2)
Where z is multiplier from the standard normal distribution, and Rj and Mj are as described above.
When tagging and fishing efforts occurred concomitantly, each week was treated as a separate sampling period according to the function:
𝑢𝑢𝑤𝑤𝑤𝑤𝑤𝑤𝑤𝑤𝑤𝑤𝑤𝑤𝑗𝑗 =
𝑅𝑅𝑖𝑖𝑗𝑗𝑀𝑀𝑖𝑖𝑗𝑗
1−� 𝑚𝑚𝑚𝑚+𝑟𝑟�
, (3)
where Rij is the number of tagged fish recaptured in area j during the ith week, Mij is the number of marked fish at large in area j at the beginning of the ith week of the sport reward fishery, and m and r are as above.
The magnitude of negative bias associated with exploitation rates calculated using the Petersen estimator can be ambiguous when tagging and fishing are conducted concurrently (Styer 2003). To minimize uncertainty surrounding estimates of system-wide annual rates of exploitation, we applied a multiple sample approach as follows:
𝑢𝑢𝑚𝑚𝑎𝑎𝑎𝑎𝑎𝑎𝑚𝑚𝑤𝑤𝑗𝑗 = ∑𝑅𝑅𝑖𝑖𝑗𝑗𝑀𝑀𝑖𝑖𝑗𝑗
1−� 𝑚𝑚𝑚𝑚+𝑟𝑟�
𝑎𝑎𝑗𝑗𝑖𝑖=1 , (4)
where Rij, Mij, m and r are as above and nj is the number of weeks in the season in area j.
We calculated 95% confidence intervals for estimates of annual exploitation using the formula
9
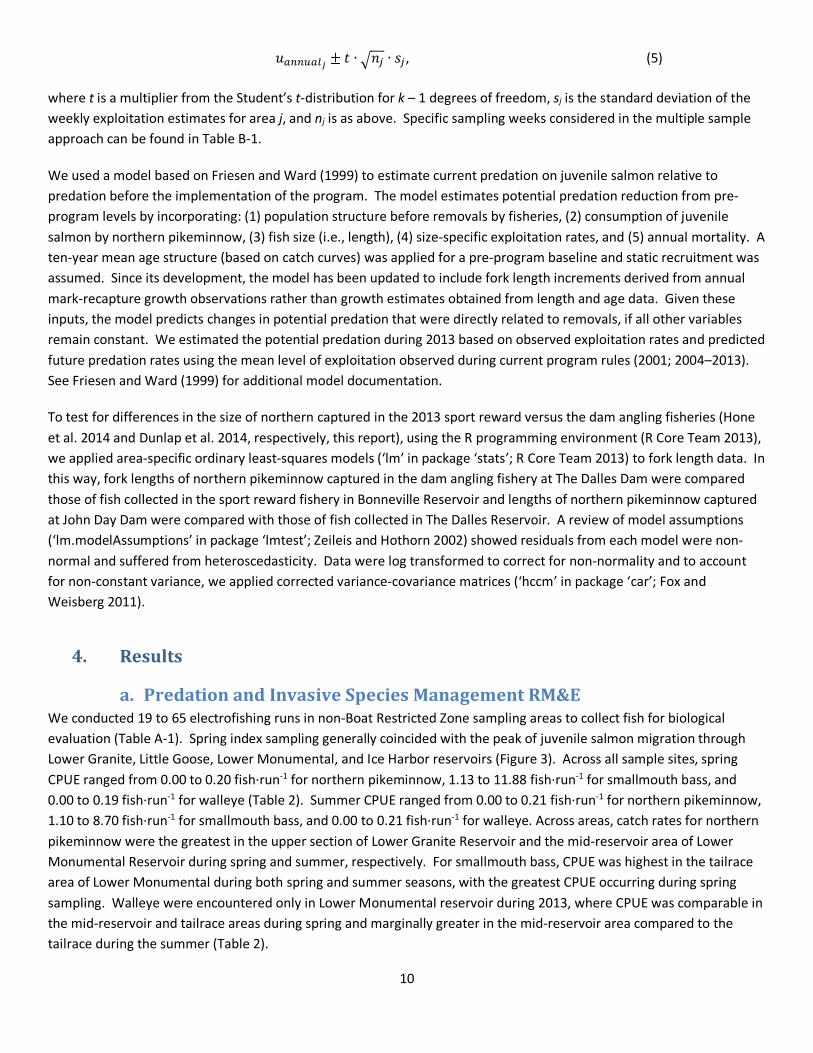
𝑢𝑢𝑚𝑚𝑎𝑎𝑎𝑎𝑎𝑎𝑚𝑚𝑤𝑤𝑗𝑗 ± 𝑡𝑡 ∙ �𝑛𝑛𝑗𝑗 ∙ 𝑠𝑠𝑗𝑗 , (5)
where t is a multiplier from the Student’s t-distribution for k – 1 degrees of freedom, sj is the standard deviation of the weekly exploitation estimates for area j, and nj is as above. Specific sampling weeks considered in the multiple sample approach can be found in Table B-1.
We used a model based on Friesen and Ward (1999) to estimate current predation on juvenile salmon relative to predation before the implementation of the program. The model estimates potential predation reduction from pre-program levels by incorporating: (1) population structure before removals by fisheries, (2) consumption of juvenile salmon by northern pikeminnow, (3) fish size (i.e., length), (4) size-specific exploitation rates, and (5) annual mortality. A ten-year mean age structure (based on catch curves) was applied for a pre-program baseline and static recruitment was assumed. Since its development, the model has been updated to include fork length increments derived from annual mark-recapture growth observations rather than growth estimates obtained from length and age data. Given these inputs, the model predicts changes in potential predation that were directly related to removals, if all other variables remain constant. We estimated the potential predation during 2013 based on observed exploitation rates and predicted future predation rates using the mean level of exploitation observed during current program rules (2001; 2004–2013). See Friesen and Ward (1999) for additional model documentation.
To test for differences in the size of northern captured in the 2013 sport reward versus the dam angling fisheries (Hone et al. 2014 and Dunlap et al. 2014, respectively, this report), using the R programming environment (R Core Team 2013), we applied area-specific ordinary least-squares models (‘lm’ in package ‘stats’; R Core Team 2013) to fork length data. In this way, fork lengths of northern pikeminnow captured in the dam angling fishery at The Dalles Dam were compared those of fish collected in the sport reward fishery in Bonneville Reservoir and lengths of northern pikeminnow captured at John Day Dam were compared with those of fish collected in The Dalles Reservoir. A review of model assumptions (‘lm.modelAssumptions’ in package ‘lmtest’; Zeileis and Hothorn 2002) showed residuals from each model were non-normal and suffered from heteroscedasticity. Data were log transformed to correct for non-normality and to account for non-constant variance, we applied corrected variance-covariance matrices (‘hccm’ in package ‘car’; Fox and Weisberg 2011).
4. Results
a. Predation and Invasive Species Management RM&E We conducted 19 to 65 electrofishing runs in non-Boat Restricted Zone sampling areas to collect fish for biological evaluation (Table A-1). Spring index sampling generally coincided with the peak of juvenile salmon migration through Lower Granite, Little Goose, Lower Monumental, and Ice Harbor reservoirs (Figure 3). Across all sample sites, spring CPUE ranged from 0.00 to 0.20 fish·run-1 for northern pikeminnow, 1.13 to 11.88 fish·run-1 for smallmouth bass, and 0.00 to 0.19 fish·run-1 for walleye (Table 2). Summer CPUE ranged from 0.00 to 0.21 fish·run-1 for northern pikeminnow, 1.10 to 8.70 fish·run-1 for smallmouth bass, and 0.00 to 0.21 fish·run-1 for walleye. Across areas, catch rates for northern pikeminnow were the greatest in the upper section of Lower Granite Reservoir and the mid-reservoir area of Lower Monumental Reservoir during spring and summer, respectively. For smallmouth bass, CPUE was highest in the tailrace area of Lower Monumental during both spring and summer seasons, with the greatest CPUE occurring during spring sampling. Walleye were encountered only in Lower Monumental reservoir during 2013, where CPUE was comparable in the mid-reservoir and tailrace areas during spring and marginally greater in the mid-reservoir area compared to the tailrace during the summer (Table 2).
10
Abundance index values calculated for northern pikeminnow in 2013 ranged from 0.00 to 0.03 in Ice Harbor Reservoir, 0.00 to 0.17 in Lower Monumental Reservoir and 0.00 to 0.01 in Little Goose Reservoir. In the upper reach of Lower Granite Reservoir, annual abundance index was estimated to be 0.10 (Table C–1). Across all sites, abundance index values continue to remain lower than those calculated in 1991 (Figure 4).
Across all areas sampled during 2013, smallmouth bass abundance index values were greatest in the mid-reservoir area of Little Goose Reservoir and lowest in the tailrace area of the same reservoir during both spring and summer. Within reservoirs and across seasons, smallmouth bass abundance index values generally were greatest at the mid-reservoir locations, exceeding all values reported since 1991 in Lower Monumental Reservoir during summer and all values reported since 1991 in Little Goose Reservoir during both seasons. In Lower Granite Reservoir, the abundance index estimate for the spring season exceeded that of summer and was the greatest observed since 1991 in that sampling area (Table C–2).
The abundance index value for walleye sampled during 2013 in the middle section of Lower Monumental Reservoir – the only lower Snake River reservoir where walleye were observed – was approximately twice that of the tailrace section during both spring and summer seasons. The greatest abundance index value (0.32) for walleye occurred in the mid-reservoir stratum of Lower Monumental Reservoir during summer. Conversely, the lowest abundance index values occurred in the tailrace area of Lower Monumental Reservoir, where spring and summer estimates were comparable (0.16 and 0.17, respectively; Table C–3).
We examined 65 northern pikeminnow digestive tracts from Ice Harbor (n=3), Lower Monumental (n=22), Little Goose (n=23) and Lower Granite (n=17) reservoirs to characterize consumption. Across reservoirs and seasons, a majority of the digestive tracts examined contained food items (range = 0.57–1.00). During the spring season, the proportion of northern pikeminnow digestive tracts containing fish exceeded that of summer (�̂�𝑝 = 0.50 and 0.06, respectively). Among reservoirs, only stomach samples collected in Lower Granite during spring contained juvenile salmon (Table 3). When prey fish could be identified, salmon were encountered in the greatest number of gut content samples in Lower Granite Reservoir (�̂�𝑝 = 0.57). In Lower Monumental and Little Goose reservoirs, members of the families Centrarchidae (�̂�𝑝 = 0.33) and Petromyzontidae (�̂�𝑝 = 0.33), respectively, were encountered in the greatest number of gut content samples (Table 4).
During the spring and summer of 2013, we collected 842 and 578 smallmouth bass diet samples, respectively; large proportions of which contained prey items (range: 0.85–0.95). Across reservoirs and seasons, relatively large proportions smallmouth bass diets samples contained fish (range = 0.29–0.77). The proportions of smallmouth bass stomach samples containing salmon generally were low (<0.14) across seasons and reservoirs, with the largest proportion occurring in Lower Granite Reservoir during summer (�̂�𝑝 = 0.13; Table 3). In Little Goose and Lower Granite reservoirs, sand rollers (Family: Percopsidae) were encountered in the greatest number of diet samples (�̂�𝑝𝑚𝑚𝑚𝑚𝑚𝑚= 0.56), followed by salmon and trout (�̂�𝑝𝑚𝑚𝑚𝑚𝑚𝑚= 0.18; Family: Salmonidae) and sculpins (�̂�𝑝𝑚𝑚𝑚𝑚𝑚𝑚= 0.18; Family: Cottidae). In Ice Harbor and Lower Monumental reservoirs, sculpins (�̂�𝑝𝑚𝑚𝑚𝑚𝑚𝑚 = 0.36) or minnows (�̂�𝑝𝑚𝑚𝑚𝑚𝑚𝑚 = 0.24; Family: Cyprinidae) were encountered most frequently in gut content samples followed by salmon (�̂�𝑝 = 0.12) in Ice Harbor Reservoir and sunfishes (�̂�𝑝 = 0.16; Family: Centrarchidae) in Lower Monumental Reservoir (Table 4).
During the spring and summer seasons of 2013, we collected 7 and 9 walleye diet samples, respectively from Lower Monumental Reservoir, all of which contained prey items (Table 3). Among seasons, approximately equivalent proportions of diet samples collected contained fish material (spring, 0.86; summer, 0.89). Members of the family Cyprinidae were encountered in a relatively large proportion of walleye diet samples collected in Lower Monumental
11

Reservoir (�̂�𝑝 = 0.64), whereas prey fishes belonging to Catostomidae and Salmonidae were observed in a disproportionately small number of samples (0.18 and 0.09, respectively; Table 4).
Where sampling occurred in 2013, we were able to evaluate (i.e., n ≥ 6) consumption and predation for northern pikeminnow only in Lower Granite Reservoir during spring. In terms of consumption, the index value calculated for the spring of 2013 in Lower Granite Reservoir is the highest for that reservoir since 1991; the inception of biological evaluation in the lower Snake River. The time series of predation estimates displays a similar trend, where the index value calculated for 2013 is the largest calculated since 1994 (5.10 and 0.86, respectively; Tables C–4 and C–5).
Where estimable, consumption index values varied relatively little among areas or seasons (range: 0.00 – 0.03). The highest consumption index value for smallmouth bass occurred during spring in the upper section of Lower Granite Reservoir (Table C–6). Among reservoirs, predation index values were greatest in mid-reservoir area of Little Goose Reservoir during spring and summer (Table C–7). The spring and summer predation index values calculated for this location are the highest to date (1.52 and 2.05, respectively). Further, despite largely consistent diet composition and consumption among years, the predation index value calculated for smallmouth bass in the mid-reservoir area of Little Goose Reservoir during the summer season is the highest reported in the lower Snake River (Table C–7). This is presumably an artifact of greater than typical abundances of smallmouth bass in that area (Table C–2).
As in 2010, we were unable to calculate PSD for northern pikeminnow or PSD and RSP-P for walleye in any of the areas sampled during 2013 due to sample size constraints (i.e., n < 20; Table C–8). For smallmouth bass, PSD varied among reservoirs sampled (mean = 19 ± 7.1%) with the largest value occurring at Ice Harbor and Lower Monumental (24%) and the smallest at Lower Granite Reservoir (9%). In contrast, RSD-P values for smallmouth bass were relatively consistent across reservoirs (mean = 3 ± 1.4%; Table C–9).
Median Wr for male northern pikeminnow ranged from 87 to 113 in Ice Harbor, Lower Monumental, Little Goose and Lower Granite reservoirs, whereas values for female northern pikeminnow ranged from 95 to 135. For smallmouth bass, median Wr values occupied a narrower range than northern pikeminnow. Since 1991, walleye have been collected only in Lower Monumental Reservoir. During 2013, the median Wr for walleye in that reservoir was 96 (Table C–10). Analyses of species-specific – and where applicable, gender-specific – Wr time series data within each reservoir identified only one significant trend. Specifically, Wr values for male northern pikeminnow in Lower Monumental Reservoir appeared to increase across years (τ = 0.4, p = 0.0410).
During 2013, 1,742 northern pikeminnow digestive tracts were collected from fish removed by the Dam-Angling fishery at The Dalles and John Day dams. The fish from which digestive tracts were removed ranged in size from 208 to 578 mm FL (mean = 345 mm; Table D–1). Of the digestive tracts collected, a subsample of 663 were examined in the laboratory (nThe Dalles = 216, nJohn Day = 447). During 2013 at both dams, large proportions (�̂�𝑝The Dalles = 0.77 and �̂�𝑝John Day = 0.78) of the digestive tracts examined contained food (Table D–2). Fish were observed in a greater proportion of diet samples than other prey types at both dams. Of fish prey encountered, across months, juvenile salmon and steelhead, American shad and lamprey at times occurred in the greatest number of diet samples. Juvenile salmon were observed in the greatest number of samples during July (�̂�𝑝 = 0.74) but were observed less frequently than lamprey during May (�̂�𝑝𝑠𝑠𝑚𝑚𝑤𝑤𝑚𝑚𝑠𝑠𝑎𝑎 = 0.39, �̂�𝑝𝑤𝑤𝑚𝑚𝑚𝑚𝑙𝑙𝑙𝑙𝑤𝑤𝑤𝑤 = 0.72) and June (�̂�𝑝𝑠𝑠𝑚𝑚𝑤𝑤𝑚𝑚𝑠𝑠𝑎𝑎 = 0.40, �̂�𝑝𝑤𝑤𝑚𝑚𝑚𝑚𝑙𝑙𝑙𝑙𝑤𝑤𝑤𝑤 = 0.55). Occurrence of lampreys in diet samples was highest in May but decreased each subsequent month. Occurrence of salmon and steelhead in diet samples increased each month from May through July. American shad were encountered in the greatest number of northern pikeminnow diets during August (�̂�𝑝 = 0.84; Table D–3).
The fork lengths of northern pikeminnow captured in the 2013 sport reward fishery in Bonneville Reservoir (mean = 292 ± 0.48–mm SE) differed significantly from those of fish captured in the dam angling fishery at The Dalles Dam (mean = 324 ± 1.64–mm SE; p < 0.0001). Similarly, the fork lengths of northern pikeminnow captured in the sport reward fishery in The Dalles Reservoir (mean = 340 ± 0.96–mm SE) were significantly smaller than those of fish captured in the dam angling fishery at John Day Dam (mean = 352 ± 1.65 mm SE; p < 0.0001).
12
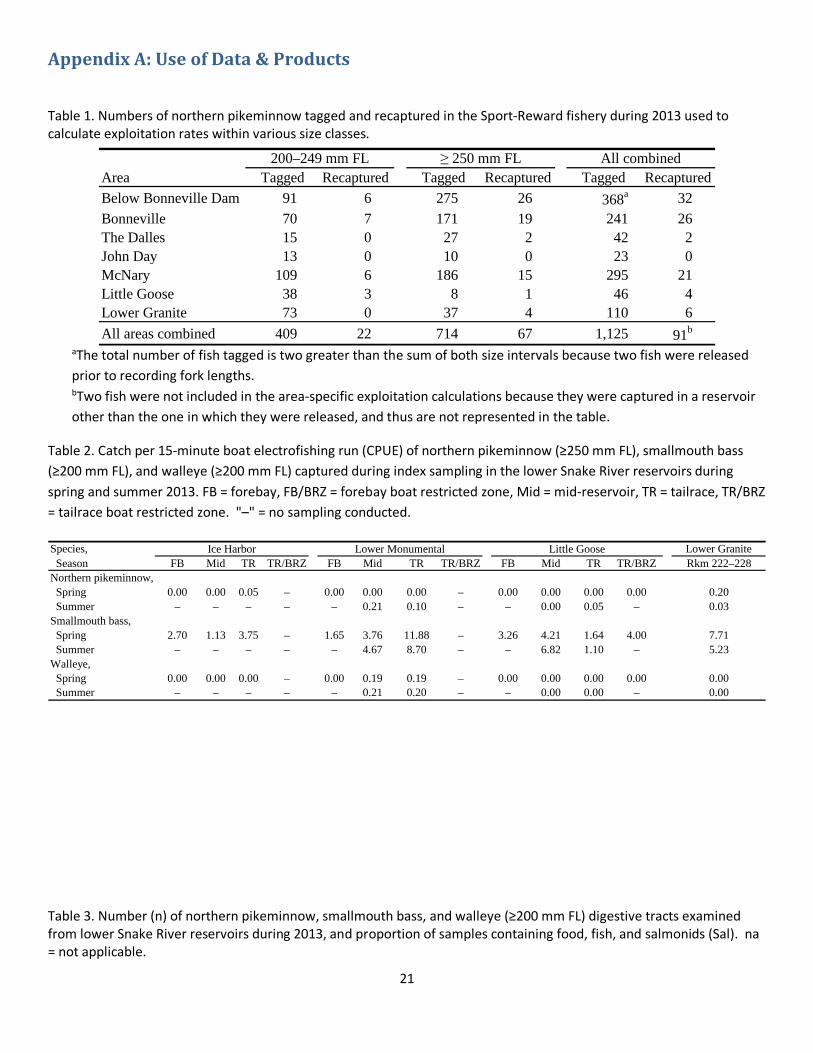
b. Predator Control and Management We tagged and released 1,125 northern pikeminnow greater than or equal to 200 mm FL throughout the lower Columbia and Snake rivers during 2013, of which 714 were greater than or equal to 250 mm FL (Table 1). A total of 166,023 northern pikeminnow greater than or equal to 200 mm FL were harvested in removal fisheries during 2013. Of this total, 162,084 fish were removed during the Sport-Reward fishery (Hone et al. 2014, this report) and 4,039 during the Dam-Angling fishery (Dunlap et al. 2014, this report). Ninety-one northern pikeminnow tagged in 2013 were recaptured during the Sport-Reward fishery and one was recovered in the dam angling fishery. Fish tagged in 2013 that were subsequently recaptured in the sport reward fishery were at large from 2 to 151 days (mean = 60 days). Seventy-four percent of Sport-Reward Fishery recaptures were greater than or equal to 250 mm FL (Table 1), whereas 58% of the total measured harvest (tagged and untagged) consisted of northern pikeminnow within this size class. The median fork length of the Sport-Reward fishery catch was 259 mm FL (J. Hone, WDFW, personal communication). One tagged northern pikeminnow (PIT tag and spaghetti tag) recaptured in the 2013 Sport-Reward fishery was captured with a PIT tag present but no loop tag; thus, exploitation was adjusted to reflect a 1.1% rate of tag loss.
System-wide exploitation of northern pikeminnow greater than or equal to 200 mm FL by the Sport-Reward fishery was 9.6% (95% confidence interval 6.1–13.2%; Tables B–1 and B–2). Tag returns were sufficient (n ≥ 4) to calculate area-specific exploitation estimates for all areas except The Dalles and John Day reservoirs. Area-specific exploitation rates ranged from 4.7 to 12.6% across the other reservoirs sampled (Table B–2). For northern pikeminnow within the 200–249 mm FL size class, the system-wide exploitation rate was 7.7% for the Sport-Reward fishery (95% confidence interval 4.2–11.1%; Table B–2). Area-specific rates of exploitation could be estimated for the Columbia River below Bonneville Dam (6.7%), and Bonneville (10.1%) and McNary (5.8%) reservoirs (Table B–2). The estimated system-wide exploitation rate (10.8%, 95% confidence interval 6.9–14.7%; Figure 1; Table B–2) for northern pikeminnow ≥250 mm FL exceeded those of the other size classes . Area-specific exploitation rates were 9.6% for the Columbia River below Bonneville Dam, 11.2% in Bonneville Reservoir, 26.5% in McNary Reservoir, and 11.4% in Lower Granite Reservoir (Table B–2).
Based on our 2013 estimate of exploitation, the model-predicted reduction in northern pikeminnow consumption of juvenile salmon relative to pre-program levels was 35% (range: 19–53%; Figure 2). Model projections based on the current fishery and population structure suggest predation on juvenile salmon by northern pikeminnow may remain relatively static through 2017.
13

5. Synthesis of Findings: Discussion/Conclusions Lessons Learned: Explain how the results of this project benefit fish and wildlife. Address each applicable sub-strategy and management question(s), provided in the Introduction for higher-level or project/program level adaptive management. If studies are incomplete, discuss preliminary findings. (Refer to the RM&E Annual Technical Reporting guidance document for more information on content to include).
a. Predation and Invasive Species Management RM&E Removals of larger individuals from northern pikeminnow populations may improve survival among migrating juvenile salmon if a compensatory response by remaining northern pikeminnow or other predatory fishes does not offset the net benefit of removal (Beamesderfer et al. 1996; Friesen and Ward 1999). Potential signs of a compensatory response by predators may be indicated by increased abundance, condition factor, consumption and predation indices, or a shift in population size structure toward larger individuals (Knutsen and Ward 1999). Sustained exploitation between 10 and 20% should bias size-structure toward smaller, less piscivorous, fish (Zimmerman et al. 1995; Vigg et al. 1991), effectively relaxing consumption of juvenile salmon by northern pikeminnow. Continued monitoring of the fisheries should provide the program with information necessary to identify any potential compensatory responses by these predatory fish populations.
The CPUE and abundance index data for 2013 are indicative of a continued and persistent decrease in the number of northern pikeminnow greater than or equal to 250 mm in the lower Snake River reservoirs since the early 1990s when the NPMP was implemented (Table C–1). This basic trend is also reflected in the total number of stock size northern pikeminnow we encounter during indexing years to calculate PSD values (Table C–8). During the last two periods of indexing in these reservoirs, we have been unable to calculate PSD for northern pikeminnow due to insufficient sample sizes (n ≤ 20). Rieman and Beamesderfer (1990) proposed that a decreasing trend in PSD may reflect the effect of the Sport-Reward fishery as evinced by the direction of change in the size structure of northern pikeminnow. Neumann and Allen (2007) suggested PSD can be high in low-density populations. Proportional stock density values can be related to lower abundance index values. Everhart and Youngs (1981) found that overexploited fish populations may show oscillating patterns of year class strength. Changes in northern pikeminnow abundance and size structure may be related to exploitation, thus continued monitoring is needed to better understand the fisheries association with the functional dynamics of the population.
The efficacy of the NPMP depends on the lack of a compensatory response by other piscivores in the Columbia Basin to the sustained removal of northern pikeminnow (Ward and Zimmerman 1999). As reported in earlier work (Poe et al. 1991; Zimmerman 1999; Naughton et al. 2004), juvenile salmon comprised a small but consistent portion of smallmouth bass diets in the Columbia River. Our observations for 2013 are consistent with these findings (Table 3), with the primary prey fish species consumed by smallmouth bass being sculpins and sand rollers (Table 4). Ward and Zimmerman (1999) suggested the first evidence of a compensatory response by smallmouth bass would likely be a shift in diet towards greater proportions of juvenile salmon. While we did not observe an increase in the proportion of smallmouth bass diets containing juvenile salmon, abundance index values for this species at several locations sampled during 2013 were among the highest we have observed since monitoring began in 1991. The elevated abundance index estimates we observed for smallmouth bass during 2013 contribute to the highest predation index we observed in the lower Snake River reservoirs. We advocate for continued monitoring of smallmouth bass abundance to aid in the characterization of potential compensatory responses.
14

Like northern pikeminnow, abundance index values for walleye were considerably lower than those estimated for smallmouth bass (c.f., Tables C–2 and C–3) in certain areas of the lower Snake River. Past studies conducted throughout the Columbia River have identified juvenile salmon as an important diet component for walleye (Poe et al. 1991; Vigg et al. 1991; Zimmerman 1999). Takata et al. (2007) found juvenile salmon most often in walleye digestive tracts from The Dalles and John Day reservoirs. Yet, in reservoirs of the Snake River sampled during 2013, juvenile salmon were encountered infrequently in diet samples (Table 4). While abundance and diet data from the current study may suggest the predatory burden imposed by walleye on juvenile salmon is minimal, it is important to note these data are constrained in both space and time. Given evidence provided by others (e.g., diet composition, population dynamics, etc.) in different areas and over varying periods, it seems possible that relatively small shifts in population structure could result in an increased predatory impact of walleye in the lower Snake River system. In light of the predatory potential of walleye on juvenile salmon, and apparent variability therein, further monitoring of population parameters and diets is necessary to assess with greater precision long-term trends.
Previous evaluations of the NPMP have not detected responses by the predator community to the sustained removal of northern pikeminnow (Ward et al. 1995; Ward and Zimmerman 1999; Zimmerman and Ward 1999). However, fishery management programs have been described as needing sustained annual sampling to effectively evaluate if a response has occurred (Beamesderfer et al. 1996). Therefore, it is critical to continue monitoring to assess the impact of the Northern Pikeminnow Management Program.
b. Predator Control and Management Our 2013 estimate of the system-wide exploitation rate (10.8 ± 3.9%, 95% CI) for the NPMP is lower than estimates reported during the past fifteen years of sampling (Figure 1). This estimate falls towards the lower end of the target range of 10–20% required to maintain reduced predation on juvenile salmon (Rieman and Beamesderfer 1990).
Recaptures of northern pikeminnow 200–249 mm FL were inadequate (n≤ 3) to calculate area-specific rates of exploitation in all but three areas during 2013 (the Columbia River below Bonneville Dam, as well as Bonneville and McNary reservoirs; Table B–2). Ricker (1975) identified differential mortality and behavioral differences between marked and unmarked fish as violations of the assumptions of the Petersen mark-recapture methodology. Although we were able to calculate a system-wide estimate of exploitation for this subset of the population, disproportionate representation of the size class among areas within the system could influence the efficacy of our evaluation (Styer 2003). Inclusion of these smaller fish in estimates of exploitation rates for all northern pikeminnow greater than or equal to 200 mm FL could reduce the estimated proportion being exploited by NPMP fishery activities. Our evaluation has documented these concerns in previous reports (Takata and Koloszar 2004; Weaver et al. 2008; Weaver et al. 2009). For this reason, we continue to recommend using exploitation rates for northern pikeminnow greater or equal to 250 mm FL when comparing among years of program fisheries.
The 2013 Dam-Angling fishery accounted for 2.4% of the total northern pikeminnow harvest, a value slightly lower than that for 2012 (3.5%; Gardner et al. 2013). Seventeen tagged northern pikeminnow were recovered by dam anglers, one of which was tagged in 2013. Northern pikeminnow collected during the 2013 Dam-Angling fishery at The Dalles and John Day dams were significantly larger than those captured in the Sport-Reward fishery in Bonneville and The Dalles reservoirs, respectively. Vigg et al. (1991) found larger northern pikeminnow consumed disproportionately more smolts than smaller fish. Given the apparent discrepancy in length distributions among Dam-Angling and sport reward fisheries, dam anglers may have a better opportunity for harvesting larger, more predacious, northern pikeminnow than sport anglers (Martinelli and Shively 1997). Additionally, dam anglers harvest fish from the boat restricted zones, which are not accessible to sport-anglers. For these reasons, we support continued angling from the dams accompanied by concurrent monitoring of diet during future Dam-Angling activities
15

16

6. References Anderson, R. O. 1980. Proportional stock density (PSD) and relative weight (Wr): interpretive indices for fish populations and communities. Pages 27–33 in S. Gloss and B. Shupp, editors. Practical fisheries management: more with less in the 1980s. New York Chapter American Fisheries Society, Bethesda, MD.
Anderson, R. O., and R. M. Neumann. 1996. Length, weight, and associated structural indices. Pages 447–482 in B. R. Murphy and D. W. Willis, editors. Fisheries Techniques, 2nd edition. American Fisheries Society, Bethesda, Maryland.
Beamesderfer, R. C., and B. E. Rieman. 1988. Size selectivity and bias in estimates of population statistics of smallmouth bass, walleye, and northern squawfish in a Columbia River reservoir. North American Journal of Fisheries Management 8:505–510.
Beamesderfer, R. C., D. L. Ward, and A. A. Nigro. 1996. Evaluation of the biological basis for a predator control program on northern squawfish (Ptychocheilus oregonensis) in the Columbia and Snake rivers. Canadian Journal of Fisheries and Aquatic Sciences 53:2898–2908.
Collis, K., D. D. Roby, D. P. Craig, S. Adamany, J. Y. Adkins, and D. E. Lyons. 2002. Colony size and diet composition of piscivorous water birds on the Lower Columbia River: Implications for losses of juvenile salmonids to avian predation. Transactions of the American Fisheries Society 131:537–550.
Davidson, A.C. and D.V. Hinkley. 1997. Bootstrap methods and their application. Cambridge University Press.
Dunlap, P. V., J. D. Hone., and E. C. Winther. 2014. Report D – Northern Pikeminnow Dam Angling on the Columbia River. Project Number 199007700. 2013 Annual report to the Bonneville Power Administration, Portland, Oregon.
Everhart, W. H., and W. D. Youngs. 1981. Principles of fishery science, 2nd edition. Cornell University Press, Ithaca, New York.
Fox J. and S. Weisberg. 2011. An {R} Companion to Applied Regression, Second Edition. Thousand Oaks CA: Sage.URL: http://socserv.socsci.mcmaster.ca/jfox/Books/Companion
Friesen, T. A., and D. L. Ward. 1999. Management of northern pikeminnow and implications for juvenile salmonid survival in the lower Columbia and Snake rivers. North American Journal of Fisheries Management 19:406–420.
Frost, C. N. 2000. A key for identifying prey fish in the Columbia River based on diagnostic bones. U.S. Geological Survey Western fisheries Research Center, Cook WA. USA 50p.
Gabelhouse, D. W., Jr. 1984. A length-categorization system to assess fish stocks. North American Journal of Fisheries Management 4:273–285.
Gardner, M., E. Tinus, M.H. Weaver, C. Mallette, and E.S. Van Dyke. 2013. System-wide predator control program, Report C, indexing and fisheries evaluation. Oregon Department of Fish and Wildlife, Contract Number 56795. 2012 Annual Report to the Bonneville Power Administration, Portland, Oregon.
Hansel, H. C., S. D. Duke, P. T. Lofty, and G. A. Gray. 1988. Use of diagnostic bones to identify and estimate original lengths of ingested prey fishes. Transactions of the American Fisheries Society 117:55–62.
17

Hone, J. D., P. V. Dunlap, and E. C. Winther. 2014. Report A – Implementation of the Northern Pikeminnow Sport-Reward Fishery in the Columbia and Snake Rivers. Project Number 199007700. 2013 Annual report to the Bonneville Power Administration, Portland, Oregon.
Knutsen, C. J., and D. L. Ward. 1999. Biological characteristics of northern pikeminnow in the Lower Columbia and Snake Rivers before and after sustained exploitation. Transactions of the American Fisheries Society 128:1008–1019.
Kolander, C. J., D. W. Willis, and B. R. Murphy. 1993. Proposed revision of the standard weights (Ws) equation for smallmouth bass. North American Journal of Fisheries Management 13:398–400.
Long, C. W., and F. J. Ossiander. 1974. Survival of coho salmon fingerlings passing through a perforated bulkhead in an empty turbine bag and through flow deflectors (with and without dentates) on the spillways of Lower Monumental Dam, Snake River, April–May 1973. Final Report (Contract DACW68-84-H-0034) to U.S. Army Corps of Engineers, Portland, Oregon.
Mann, H.B. 1945. Nonparametric tests against trend. Econometrica 12:245–259.
Martinelli, T. L., and R. S. Shively. 1997. Seasonal distribution, movements and habitat associations of northern squawfish in two lower Columbia River reservoirs. Regulated Rivers: Research and Management 6, pp 543–556, Nov–Dec 1997.
A.I. McLeod (2011). Kendall: Kendall rank correlation and Mann-Kendall trend test. R package version 2.2. http://CRAN.R-project.org/package=Kendall
Murphy, B. R., M. L. Brown, and T. A. Springer. 1990. Evaluation of the relative weight (Wr) index, with new applications to walleye. North American Journal of Fisheries Management 10:85–97.
Naughton, G. P., D. H. Bennett, and K. B. Newman. 2004. Predation on juvenile salmonids by smallmouth bass in the Lower Granite Reservoir system, Snake River. North American Journal of Fisheries Management 24:534–544.
Nehlsen, W., J. E. Williams, and J. A. Lichatowich. 1991. Pacific salmon at the crossroads: stocks at risk from California, Oregon, Idaho, and Washington. Fisheries 16:4–21.
Neumann, R. S. and M. S. Allen. 2007. Size structure. Pages 375–421 in C. S. Guy and M. L. Brown, editors. Analysis and interpretation of freshwater fisheries data. American fisheries Society, Bethesda, Maryland.
Parker, R. M., M. P. Zimmerman, and D. L. Ward. 1995. Variability in biological characteristics of northern squawfish in the lower Columbia and Snake rivers. Transactions of the American Fisheries Society 124:335–346.
Parrish, J.K., K. Haapa-aho, W. Walker, M. Stratton, J. Walsh, H. Ziel. 2006. Small-bodied and juvenile fishes of the Mid-Columbia Region including keys to diagnostic otoliths and cranial bones. Draft Version, March 2006. University of Washington, Seattle WA. USA 137p.
Poe, T. P., H. C. Hansel, S. Vigg, D. E. Palmer, and L. A. Prendergast. 1991. Feeding of predaceous fishes on out-migrating juvenile salmonids in the John Day Reservoir, Columbia River. Transactions of the American Fisheries Society 120:405–420.
18

Porter, R.G. 2014. Report B–Northern pikeminnow sport reward payments 2012. Pacific States Marine Fisheries Commission. 2013 Annual Report to the Bonneville Power Administration, Project 199007700, Portland, Oregon.
R Core Team. 2013. R: A language and environment for statistical computing. R Foundation for Statistical Computing, Vienna, Austria. URL http://www.R-project.org/.
Raymond, H. L. 1988. Effects of hydroelectric development and fisheries enhancement on spring and summer Chinook salmon and steelhead in the Columbia River basin. North American Journal of Fisheries Management 8:1–24.
Ricker, W. E. 1975. Computation and interpretation of biological statistics of fish populations. Fisheries Research Board of Canada Bulletin 191.
Rieman, B. E., and R. C. Beamesderfer. 1990. Dynamics of a northern squawfish population and the potential to reduce predation on juvenile salmonids in a Columbia River reservoir. North American Journal of Fisheries Management 10:228–241.
Rieman, B. E., R. C. Beamesderfer, S. Vigg, and T. P. Poe. 1991. Estimated loss of juvenile salmonids to predation by northern squawfish, walleyes, and smallmouth bass in John Day Reservoir, Columbia River. Transactions of the American Fisheries Society 120:448–458.
Seaburg, K. G. 1957. A stomach sampler for live fish. Progressive fish-Culturist 19:137–139.
Styer, P. 2003. Statistical consulting report to review computational methods in the northern pikeminnow management program. Report to the Oregon Department of Fish and Wildlife, Clackamas.
Takata, H. K., and J. A. Koloszar. 2004. Development of a system-wide predator control program: fisheries evaluation. Oregon Department of Fish and Wildlife, Contract Number DE-B1719-94BI24514. 2003 Annual Report to the Bonneville Power Administration, Portland, Oregon.
Takata, H. K., M. J. Reesman, G. E. Reed, L. D. Layng, and T. A. Jones. 2007. Development of a system-wide predator control program: indexing and fisheries evaluation. Oregon Department of Fish and Wildlife, Contract Number DE-B1719-94BI24514. 2006 Annual Report to the Bonneville Power Administration, Portland, Oregon.
Vigg, S., T. P. Poe, L. A. Prendergast, and H. C. Hansel. 1991. Rates of consumption of juvenile salmonids and alternative prey fish by northern squawfish, walleyes, smallmouth bass, and channel catfish in John Day Reservoir, Columbia River. Transactions of the American Fisheries Society 120:421–438.
Ward, D. L., J. H. Petersen, and J. J. Loch. 1995. Index of predation on juvenile salmonids by northern squawfish in the lower and middle Columbia River and in the lower Snake River. Transactions of the American Fisheries Society 124:321–334.
Ward, D. L., and M. P. Zimmerman. 1999. Response of smallmouth bass to sustained removals of northern pikeminnow in the lower Columbia and Snake Rivers. Transactions of the American Fisheries Society 128:1020–1035.
Weaver, M. H., H. K. Takata, M. J. Reesman, L. D. Layng, G. E. Reed, and T. A. Jones. 2008. Development of a system-wide predator control program: fisheries evaluation. Oregon Department of Fish and Wildlife,
19

Contract Number DE-B1719-94BI24514. 2007 Annual Report to the Bonneville Power Administration, Portland, Oregon.
Weaver, M. H., H. K. Takata, M. J. Reesman, and E. S. Van Dyke. 2009. Development of a system-wide predator control program: fisheries evaluation. Oregon Department of Fish and Wildlife, Contract Number DE-B1719-94BI24514. 2008 Annual Report to the Bonneville Power Administration, Portland, Oregon.
Willis, D. W., K. D. McCloskey, and D. W. Gabelhouse, Jr. 1985. Calculation of stock density indices based on adjustments for efficiency of gill-net mesh size. North American Journal of Fisheries Management 5:126–137.
Wismar, R. C., J. E. Smith, B. A. McIntosh, H. W. Li, G. H. Reeves, and J. R. Sedell. 1994. A history of resource use and disturbance in riverine basins of eastern Oregon and Washington (early 1800s–1900s). Northwest Science 68 (Special Issue):1–35.
Zeileis A. and Hothorn T. 2002. Diagnostic checking in regression relationships. R News 2(3), 7-10. URL http://CRAN.R-project.org/doc/Rnews/.
Zimmerman, M. P. 1999. Food habits of smallmouth bass, walleyes, and northern pikeminnow in the lower Columbia River Basin during outmigration of juvenile anadromous salmonids. Transactions of the American Fisheries Society 128:995–1007.
Zimmerman, M. P., C. Knutsen, D. L. Ward, and K. Anderson. 1995. Development of a system-wide predator control program: Indexing and fisheries evaluation. Oregon Department of Fish and Wildlife, Contract number DE-AI79-90BP07084. 1993 Annual Report to the Bonneville Power Administration, Portland, Oregon.
Zimmerman, M. P., and D. L. Ward. 1999. Index of predation on juvenile salmonids by northern pikeminnow in the lower Columbia River basin, 1994–1996. Transactions of the American Fisheries Society 128:995–1007.
Zimmerman, M.P., T. A. Friesen, D. L. Ward, and H. K. Takata. 2000. Development of a system-wide predator control program: indexing and fisheries evaluation. Oregon Department of Fish and Wildlife, Contract Number DE-B1719-94BI24514. 1999 Annual Report to the Bonneville Power Administration, Portland, Oregon.
20
Appendix A: Use of Data & Products
Table 1. Numbers of northern pikeminnow tagged and recaptured in the Sport-Reward fishery during 2013 used to calculate exploitation rates within various size classes.
aThe total number of fish tagged is two greater than the sum of both size intervals because two fish were released prior to recording fork lengths. bTwo fish were not included in the area-specific exploitation calculations because they were captured in a reservoir other than the one in which they were released, and thus are not represented in the table.
Table 2. Catch per 15-minute boat electrofishing run (CPUE) of northern pikeminnow (≥250 mm FL), smallmouth bass (≥200 mm FL), and walleye (≥200 mm FL) captured during index sampling in the lower Snake River reservoirs during spring and summer 2013. FB = forebay, FB/BRZ = forebay boat restricted zone, Mid = mid-reservoir, TR = tailrace, TR/BRZ = tailrace boat restricted zone. "–" = no sampling conducted.
Table 3. Number (n) of northern pikeminnow, smallmouth bass, and walleye (≥200 mm FL) digestive tracts examined from lower Snake River reservoirs during 2013, and proportion of samples containing food, fish, and salmonids (Sal). na = not applicable.
Area Tagged Recaptured Tagged Recaptured Tagged RecapturedBelow Bonneville Dam 91 6 275 26 368a 32Bonneville 70 7 171 19 241 26The Dalles 15 0 27 2 42 2John Day 13 0 10 0 23 0McNary 109 6 186 15 295 21Little Goose 38 3 8 1 46 4Lower Granite 73 0 37 4 110 6All areas combined 409 22 714 67 1,125 91b
200–249 mm FL ≥ 250 mm FL All combined
Species, Lower Granite Season FB Mid TR TR/BRZ FB Mid TR TR/BRZ FB Mid TR TR/BRZ Rkm 222–228
Spring 0.00 0.00 0.05 – 0.00 0.00 0.00 – 0.00 0.00 0.00 0.00 0.20 Summer – – – – – 0.21 0.10 – – 0.00 0.05 – 0.03
Spring 2.70 1.13 3.75 – 1.65 3.76 11.88 – 3.26 4.21 1.64 4.00 7.71 Summer – – – – – 4.67 8.70 – – 6.82 1.10 – 5.23
Spring 0.00 0.00 0.00 – 0.00 0.19 0.19 – 0.00 0.00 0.00 0.00 0.00 Summer – – – – – 0.21 0.20 – – 0.00 0.00 – 0.00
Northern pikeminnow,
Smallmouth bass,
Walleye,
Ice Harbor Lower Monumental Little Goose
21

Table 4. Proportion of diet samples containing specific prey fish families for northern pikeminnow, smallmouth bass, and walleye in the lower Snake River reservoirs in 2013. Note: multiple families were represented in the gut contents of some fish. See Table 3 for sample sizes.
Table A–1. Number of 15-minute (900 second) boat electrofishing runs conducted for biological indexing in the lower Snake River reservoirs for all sampling years. FB = forebay, Mid = mid-reservoir, TR = tailrace, TR/BRZ = tailrace BRZ and Rkm = river kilometer.
Season,Reservoir nnon-empty nempty nnon-empty nempty nnon-empty nempty
Spring,Ice Harbor 2 1 0.67 0.33 0.00 129 20 0.87 0.30 0.03 0 0 na na naLower Monumental 4 3 0.57 0.00 0.00 274 24 0.92 0.46 0.03 7 0 1.00 0.86 0.14Little Goose 5 1 0.83 0.67 0.00 120 20 0.86 0.63 0.10 0 0 na na naLower Granite 13 1 0.93 0.71 0.57 242 13 0.95 0.67 0.09 0 0 na na naAll 24 6 0.80 0.50 0.27 765 77 0.91 0.52 0.06 7 0 1.00 0.86 0.14
Summer,Lower Monumental 9 6 0.60 0.00 0.00 261 24 0.92 0.29 0.01 9 0 1.00 0.89 0.00Little Goose 14 3 0.82 0.12 0.00 125 12 0.91 0.77 0.04 0 0 na na naLower Granite 3 0 1.00 0.00 0.00 133 23 0.85 0.62 0.13 0 0 na na naAll 26 9 0.74 0.06 0.00 519 59 0.90 0.49 0.05 9 0 1.00 0.89 0.00
walleyesmallmouth bassnorthern pikeminnow
walleyeCommon name (Family) Ice Harbor Lower
Monumental Little Goose Lower Granite Ice Harbor
Lower Monumental Little Goose
Lower Granite
Lower Monumental
suckers (Catostomidae) 0.00 0.00 0.00 0.00 0.00 0.07 0.01 0.02 0.18
sunfishes (Centrarchidae) 0.00 0.33 0.00 0.07 0.00 0.16 0.05 0.02 0.00
sculpins (Cottidae) 0.00 0.00 0.00 0.14 0.36 0.19 0.18 0.01 0.00
minnows (Cyprinidae) 0.00 0.00 0.00 0.00 0.24 0.20 0.03 0.01 0.64
catfishes (Ictaluridae) 0.00 0.00 0.00 0.00 0.05 0.02 0.01 0.00 0.00
sand rollers (Percospidae) 0.00 0.00 0.00 0.00 0.05 0.13 0.52 0.56 0.00
lampreys (Petromyzontidae) 0.00 0.00 0.33 0.00 0.00 0.00 0.00 0.00 0.00
salmon and trout (Salmonidae) 0.00 0.00 0.00 0.57 0.12 0.08 0.12 0.18 0.09
unidentified 1.00 0.67 0.67 0.29 0.26 0.28 0.22 0.24 0.18
northern pikeminnow smallmouth bass
22

Table B–1. System-wide weekly exploitation rates of northern pikeminnow (≥200 mm FL) for the Sport-Reward fishery in 2013. Dashes (–) indicate: no tagging effort, no recapture effort, or no exploitation calculated.
aAdjusted for tag loss (1.1%)
Table B–2. Exploitation rates (%) of northern pikeminnow, grouped by fork length and area, in the Sport-Reward fishery. a = no exploitation rate calculated (n≤3) and dash (–) = not sampled.
Lower GraniteYear FB Mid TR TR/BRZ FB Mid TR TR/BRZ FB Mid TR TR/BRZ Rkm 222–2281991 57 58 49 18 66 61 40 16 58 55 40 17 551994 0 0 0 0 0 0 39 5 0 0 31 8 851995 0 0 0 0 0 0 38 8 0 0 32 8 891996 0 0 0 0 0 0 24 8 0 0 33 4 891999 0 0 0 0 0 0 11 3 0 0 28 1 632004 0 0 0 0 0 0 37 9 0 0 33 6 722007 37 40 40 0 40 36 37 0 40 48 40 0 962010 36 39 40 0 44 48 30 0 35 35 39 2 912013 20 24 20 0 20 45 36 0 19 31 31 1 65
Ice Harbor Lower Monumental Little Goose
Sampling Week Tagged Recaptured At-Large Exploitationa (%)04/01 - 04/06 17 – 0 –04/07 - 04/13 241 – 17 –04/14 - 04/20 80 – 258 –04/21 - 04/27 271 – 338 –04/28 - 05/04 46 5 609 0.805/05 - 05/11 22 0 650 005/12 - 05/18 183 3 672 0.505/19 - 05/25 19 5 852 0.605/26 - 06/01 0 3 866 0.306/02 - 06/08 90 6 863 0.706/09 - 06/15 110 11 947 1.206/16 - 06/22 46 11 1,045 1.106/23 - 06/29 – 8 1,080 0.706/30 - 07/06 – 4 1,072 0.407/07 - 07/13 – 7 1,068 0.707/14 - 07/20 – 6 1,061 0.607/21 - 07/27 – 2 1,055 0.207/28 - 08/03 – 7 1,053 0.708/04 - 08/10 – 1 1,046 0.108/11 - 08/17 – 2 1,045 0.208/18 - 08/24 – 3 1,043 0.308/25 - 08/31 – 2 1,040 0.209/01 - 09/07 – 2 1,038 0.209/08 - 09/14 – 2 1,036 0.209/15 - 09/21 – 0 1,034 009/22 - 09/28 – 1 1,034 0.109/29 - 10/05 – 0 1,033 0
Total 1,125 91 9.6
23

Group,Year
≥200 mm2000 9.9 12.4 a a 10.2 a 10.5 10.92001 15.9 8.6 a a 26.0 — 9.4 15.52002 10.8 5.0 a a 7.6 — 11.6 10.62003 11.8 11.0 a a 6.6 — a 10.52004 18.8 11.7 a a a — 19.6 17.02005 21.6 8.0 14.9 a 9.6 — a 16.32006 14.6 10.5 22.4 a 10.7 20.0 a 14.62007 18.4 9.6 a a 5.9 35.0 11.8 15.32008 20.6 9.6 13.8 a 14.1 8.3 4.1 14.82009 8.4 15.2 a a 8.4 9 a 8.82010 17.2 10.1 a a 9.2 15.0 63.1 15.92011 14.9 9.1 a a 14.8 a a 13.52012 15.4 8.6 a a 8.8 a a 11.02013 8.8 10.9 a a 12.6 6.90 4.7 9.6
200–249 mm2000 9.7 4.1 a a a a a 6.62001 a a a a a — a 10.62002 3.1 a a a a — a 3.42003 a a a a a — a a2004 a 13.5 a a a — a 10.92005 a a a a a — a a2006 9.6 6.7 a a a 17.4 a 9.92007 a a a a a a a a2008 4.6 5.8 10.5 a 4.9 4.8 1.3 5.72009 a a a a a 5.6 a 1.82010 a a a a 12.4 a a 7.62011 17.9 a a a 11.0 a a 9.82012 7.8 5.8 a a 4.5 a a 6.02013 6.7 10.1 a a 5.8 a a 7.7
Lower Granite All areasMcNary
Little Goose
Below Bonneville Bonneville The Dalles John Day
24

Table B–2 (cont.). Exploitation rates (%) of northern pikeminnow, grouped by fork length and area, in the Sport-Reward fishery. a = no exploitation rate calculated (n≤3) and dash (–) = not sampled.
Table C–1.Annual abundance index values (catch per 15-minute electrofishing run, scaled to surface area) for northern pikeminnow (≥ 250 mm FL) in the lower Snake River reservoirs during all sampling years. FB = forebay, Mid = mid-reservoir, TR = tailrace, TR/BRZ = tailrace BRZ and dash (–) = not sampled.
Table C–2. Annual abundance index values (catch per 15-minute electrofishing run, scaled to surface area) for smallmouth bass (≥ 200 mm FL) in the lower Snake River reservoirs by season. FB = forebay, Mid = mid-reservoir, TR = tailrace, TR/BRZ = tailrace BRZ and dash (–) = not sampled.
Group,Year
≥250 mm1991 7.6 10.9 23.6 2.8 5.3 2.4 20.0 8.51992 11.4 4.0 6.2 3.4 5.6 11.9 15.0 9.31993 6.0 2.1 7.0 2.4 15.9 3.3 12.5 6.81994 13.6 2.2 9.8 3.2 14.0 6.1 8.7 10.91995 16.1 3.5 14.9 0.0 22.4 2.9 6.4 13.41996 12.7 6.1 15.5 0.0 18.2 8.9 11.7 12.11997 7.8 8.0 5.8 0.0 16.5 0.0 15.5 8.91998 8.2 7.8 12.8 0.0 13.6 0.0 12.1 11.11999 9.6 13.9 16.1 3.7 15.9 0.0 6.1 12.52000 10.0 16.3 a a 9.7 a 8.7 11.92001 16.2 8.5 a a 26.0 — a 16.22002 12.6 6.0 a a 7.7 — 14.3 12.32003 13.6 16.7 a a 8.2 — a 13.02004 20.1 9.3 a a a — 23.8 18.52005 23.1 8.2 18.0 a 13.0 — a 19.02006 15.6 13.7 25.3 a 11.2 26.3 a 17.12007 19.4 11.1 a a 7.5 a 17.3 17.82008 22.2 10.5 15.0 a 16.8 21.7 9.2 19.52009 11.3 15.9 a a 11.6 25.8 a 12.82010 19.8 13.1 a a a a a 18.82011 14.5 10.4 a a 17.8 a a 15.62012 17.4 13.5 a a 17.6 a a 15.92013 9.6 11.2 a a 26.5 a 11.4 10.8
Below Bonneville Bonneville The Dalles John Day McNary
Little Goose
Lower Granite All areas
Lower GraniteYear FB Mid TR TR/BRZ FB Mid TR TR/BRZ FB Mid TR TR/BRZ Rkm 222–2281991 0.05 0.99 0.32 0.15 0.54 2.94 1.29 0.83 1.25 1.74 0.72 1.67 1.561994 – – – – – – 0.28 0.06 – – 0.17 0.38 0.451995 – – – – – – 0.09 0.20 – – 0.03 0.60 0.191996 – – – – – – 0.14 0.05 – – 0.12 0.06 0.251999 – – – – – – 0.00 0.00 – – 0.14 0.00 0.232004 – – – – – – 0.05 0.03 – – 0.13 0.20 0.062007 0.04 0.00 0.12 – 0.03 0.26 0.00 – 0.04 0.00 0.01 – 0.102010 0.00 0.00 0.00 – 0.00 0.32 0.06 – 0.00 0.00 0.05 0.06 0.132013 0.00 0.00 0.03 – 0.00 0.17 0.05 – 0.00 0.00 0.01 0.00 0.10
Ice Harbor Lower Monumental Little Goose
25

Table C–3. Annual abundance index values (catch per 15-minute electrofishing run, scaled to surface area) for walleye (≥200 mm FL) in the lower Snake River reservoirs by season. FB = forebay, Mid = mid-reservoir, TR = tailrace, TR/BRZ = tailrace BRZ and dash (– ) = not sampled.
Table C–4. Spring and summer consumption index values for northern pikeminnow (≥250 mm FL) in the lower Snake River reservoirs during all sampling years. FB = forebay, Mid = mid-reservoir, TR = tailrace, TR/BRZ = tailrace BRZ, dash (–) = not sampled, a = no consumption index calculated (n≤5) and b = no stomach data collected.
Season, Lower Granite Year, FB Mid TR TR/BRZ FB Mid TR TR/BRZ FB Mid TR TR/BRZ Rkm 222–228
Spring,1991 1.31 11.30 2.74 0.02 1.34 3.81 3.26 0.31 3.47 11.94 1.08 0.15 0.701994 – – – – – – 1.65 0.05 – – 2.13 0.03 4.681995 – – – – – – 0.89 0.05 – – 1.52 0.25 1.681996 – – – – – – 0.64 0.00 – – 1.11 – 1.741999 – – – – – – 2.70 0.09 – – 0.80 0.06 1.422004 – – – – – – 0.00 0.00 – – 0.00 0.00 1.542007 1.79 6.50 3.84 – 2.65 5.36 5.04 – 6.81 5.99 0.42 – 3.802010 1.07 8.85 3.43 – 1.56 6.45 4.10 – 2.96 11.34 0.16 0.06 1.382013 3.86 4.04 2.52 – 1.72 5.76 10.08 – 4.83 15.53 0.72 0.24 6.49
Summer,1991 0.65 5.18 1.21 0.14 0.83 1.69 0.96 0.03 3.40 8.72 1.75 0.12 3.721994 – – – – – – 2.25 0.10 – – 0.93 0.12 1.101995 – – – – – – 0.85 0.22 – – 0.83 0.15 1.681996 – – – – – – 1.06 0.05 – – 0.35 0.06 0.461999 – – – – – – – – – – 0.00 – 0.002004 – – – – – – 9.01 0.23 – – 0.47 0.30 2.012007 5.04 11.21 3.74 – 3.80 3.38 4.54 – 6.36 9.52 0.38 – 2.772010 3.84 8.07 2.83 – 3.45 6.51 13.16 – 2.96 11.73 0.68 1.77 3.252013 – – – – – 7.15 7.39 – – 25.15 0.49 – 4.40
Ice Harbor Lower Monumental Little Goose
Season, Lower Granite Year, FB Mid TR TR/BRZ FB Mid TR TR/BRZ FB Mid TR TR/BRZ Rkm 222–228
Spring,1991 0.00 0.00 0.00 0.00 0.00 0.00 0.00 0.00 0.00 0.00 0.00 0.00 0.001994 – – – – – – 0.00 0.00 – – 0.00 0.00 0.001995 – – – – – – 0.00 0.00 – – 0.00 0.00 0.001996 – – – – – – 0.00 0.00 – – 0.00 – 0.001999 – – – – – – 0.08 0.00 – – 0.00 0.00 0.002004 – – – – – – 0.00 0.00 – – 0.00 0.00 0.002007 0.00 0.00 0.00 – 0.00 0.89 0.35 – 0.00 0.00 0.00 – 0.002010 0.00 0.00 0.00 – 0.00 0.00 0.05 – 0.00 0.00 0.00 0.00 0.002013 0.00 0.00 0.00 – 0.00 0.29 0.16 – 0.00 0.00 0.00 0.00 0.00
Summer,1991 0.00 0.00 0.00 0.00 0.00 0.00 0.00 0.00 0.00 0.00 0.00 0.00 0.001994 – – – – – – 0.00 0.00 – – 0.00 0.00 0.001995 – – – – – – 0.00 0.00 – – 0.00 0.00 0.001996 – – – – – – 0.00 0.00 – – 0.00 0.00 0.001999 – – – – – – – – – – 0.00 – 0.002004 – – – – – – 0.00 0.00 – – 0.00 0.00 0.002007 0.00 0.00 0.00 – 0.00 0.32 0.59 – 0.00 0.00 0.00 – 0.002010 0.00 0.00 0.00 – 0.00 0.26 0.14 – 0.00 0.00 0.00 0.00 0.002013 – – – – – 0.32 0.17 – – 0.00 0.00 – 0.00
Ice Harbor Lower Monumental Little Goose
26

Table C–5. Spring and summer predation index values for northern pikeminnow (≥250 mm FL) in the lower Snake River reservoirs during all sampling years. FB = forebay, Mid = mid-reservoir, TR = tailrace, TR/BRZ = tailrace BRZ, dash (–) = not sampled, a = no predation index calculated (n≤5) and b = no stomach data collected.
Table C–6. Spring and summer consumption index values for smallmouth bass (≥200 mm FL) in the lower Snake River reservoirs during all sampling years. FB = forebay, Mid = mid-reservoir, TR = tailrace, TR/BRZ = tailrace BRZ, dash (–) = not sampled, a = no consumption index calculated (n≤5) and b = no stomach data collected.
Season, Lower Granite Year FB Mid TR TR/BRZ FB Mid TR TR/BRZ FB Mid TR TR/BRZ Rkm 222–228
Spring1991 a 0.36 1.02 0.72 0.27 0.00 0.68 0.63 1.00 0.00 0.72 a 0.421994 – – – – – – 0.77 ngs – – 2.32 a 0.771995 – – – – – – b a – – b a 1.271996 – – – – – – a a – – 0.71 – 0.311999 – – – – – – a a – – a a 2.182004 – – – – – – a a – – a a a2007 a a a – a a a – a a a – 0.972010 a a a – a 0.00 a – a a a a a2013 a a a – a a a – a a a a 5.10
Summer1991 b b b b b b b b b b b b b1994 – – – – – – a 0.00 – – a a b1995 – – – – – – a 0.00 – – a a a1996 – – – – – – a 0.00 – – a a a1999 – – – – – – – – – – a – a2004 – – – – – – a 0.00 – – 0.00 a a2007 a a 2.05 – a a a – a a a – a2010 a a a – a a a – a a a a 1.702013 – – – – – a a – a a a – a
Ice Harbor Lower Monumental Little Goose
Season, Lower Granite Year FB Mid TR TR/BRZ FB Mid TR TR/BRZ FB Mid TR TR/BRZ Rkm 222–228
Spring1991 a 0.49 0.45 0.09 0.18 0.00 1.35 0.56 1.34 0.00 1.03 a 1.111994 – – – – – – 0.31 a – – 1.03 a 0.711995 – – – – – – b b – – b a 0.361996 – – – – – – a a – – 0.18 – 0.141999 – – – – – – a a – – a a 0.702004 – – – – – – a a – – a a a2007 a a a – a a a – a a a – 0.192010 a a a – a 0.00 a – a a a a a2013 a a a – a a a – a a a a 0.86
Summer1991 b b b b b b b b b b b b b1994 – – – – – – a 0.00 – – a a b1995 – – – – – – a 0.00 – – a a a1996 – – – – – – a 0.00 – – a a a1999 – – – – – – – – – – a – a2004 – – – – – – a 0.00 – – 0.00 a a2007 a a 0.48 – a a a – a a a – a2010 a a a – a a a – a a a a 0.402013 – – – – – a a – – a a – a
Ice Harbor Lower Monumental Little Goose
27
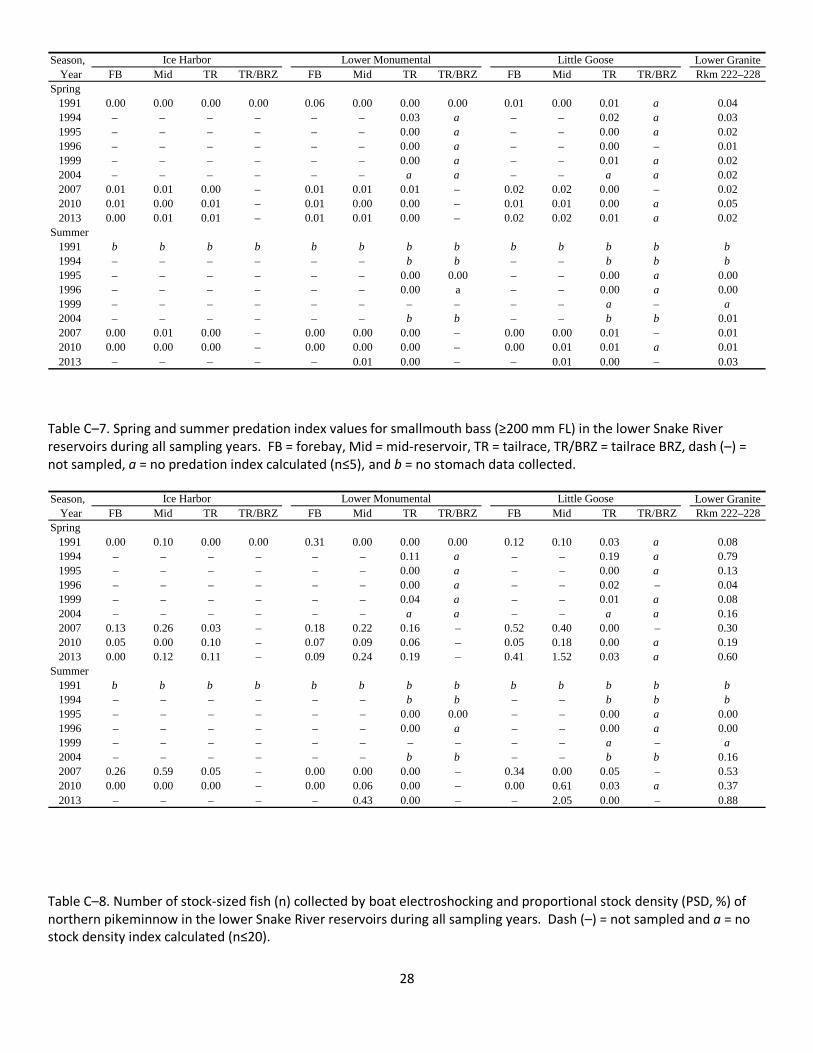
Table C–7. Spring and summer predation index values for smallmouth bass (≥200 mm FL) in the lower Snake River reservoirs during all sampling years. FB = forebay, Mid = mid-reservoir, TR = tailrace, TR/BRZ = tailrace BRZ, dash (–) = not sampled, a = no predation index calculated (n≤5), and b = no stomach data collected.
Table C–8. Number of stock-sized fish (n) collected by boat electroshocking and proportional stock density (PSD, %) of northern pikeminnow in the lower Snake River reservoirs during all sampling years. Dash (–) = not sampled and a = no stock density index calculated (n≤20).
Season, Lower Granite Year FB Mid TR TR/BRZ FB Mid TR TR/BRZ FB Mid TR TR/BRZ Rkm 222–228
Spring1991 0.00 0.00 0.00 0.00 0.06 0.00 0.00 0.00 0.01 0.00 0.01 a 0.041994 – – – – – – 0.03 a – – 0.02 a 0.031995 – – – – – – 0.00 a – – 0.00 a 0.021996 – – – – – – 0.00 a – – 0.00 – 0.011999 – – – – – – 0.00 a – – 0.01 a 0.022004 – – – – – – a a – – a a 0.022007 0.01 0.01 0.00 – 0.01 0.01 0.01 – 0.02 0.02 0.00 – 0.022010 0.01 0.00 0.01 – 0.01 0.00 0.00 – 0.01 0.01 0.00 a 0.052013 0.00 0.01 0.01 – 0.01 0.01 0.00 – 0.02 0.02 0.01 a 0.02
Summer1991 b b b b b b b b b b b b b1994 – – – – – – b b – – b b b1995 – – – – – – 0.00 0.00 – – 0.00 a 0.001996 – – – – – – 0.00 a – – 0.00 a 0.001999 – – – – – – – – – – a – a2004 – – – – – – b b – – b b 0.012007 0.00 0.01 0.00 – 0.00 0.00 0.00 – 0.00 0.00 0.01 – 0.012010 0.00 0.00 0.00 – 0.00 0.00 0.00 – 0.00 0.01 0.01 a 0.012013 – – – – – 0.01 0.00 – – 0.01 0.00 – 0.03
Ice Harbor Lower Monumental Little Goose
Season, Lower Granite Year FB Mid TR TR/BRZ FB Mid TR TR/BRZ FB Mid TR TR/BRZ Rkm 222–228
Spring1991 0.00 0.10 0.00 0.00 0.31 0.00 0.00 0.00 0.12 0.10 0.03 a 0.081994 – – – – – – 0.11 a – – 0.19 a 0.791995 – – – – – – 0.00 a – – 0.00 a 0.131996 – – – – – – 0.00 a – – 0.02 – 0.041999 – – – – – – 0.04 a – – 0.01 a 0.082004 – – – – – – a a – – a a 0.162007 0.13 0.26 0.03 – 0.18 0.22 0.16 – 0.52 0.40 0.00 – 0.302010 0.05 0.00 0.10 – 0.07 0.09 0.06 – 0.05 0.18 0.00 a 0.192013 0.00 0.12 0.11 – 0.09 0.24 0.19 – 0.41 1.52 0.03 a 0.60
Summer1991 b b b b b b b b b b b b b1994 – – – – – – b b – – b b b1995 – – – – – – 0.00 0.00 – – 0.00 a 0.001996 – – – – – – 0.00 a – – 0.00 a 0.001999 – – – – – – – – – – a – a2004 – – – – – – b b – – b b 0.162007 0.26 0.59 0.05 – 0.00 0.00 0.00 – 0.34 0.00 0.05 – 0.532010 0.00 0.00 0.00 – 0.00 0.06 0.00 – 0.00 0.61 0.03 a 0.372013 – – – – – 0.43 0.00 – – 2.05 0.00 – 0.88
Ice Harbor Lower Monumental Little Goose
28
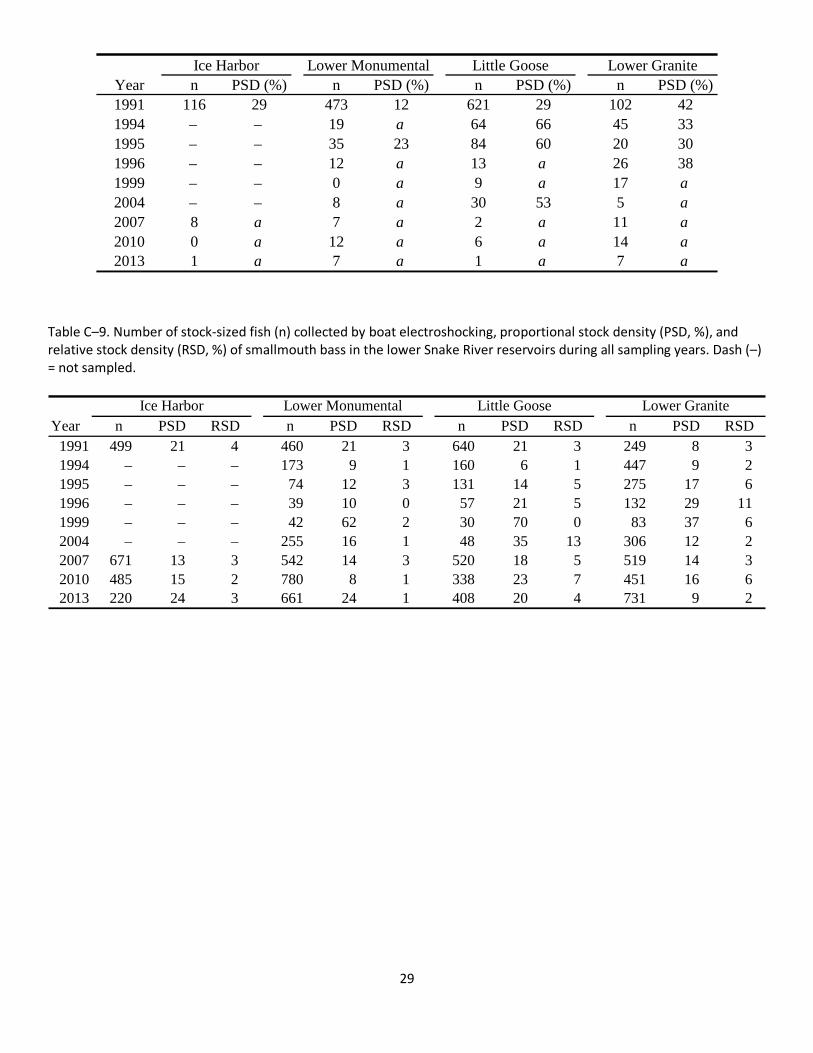
Table C–9. Number of stock-sized fish (n) collected by boat electroshocking, proportional stock density (PSD, %), and relative stock density (RSD, %) of smallmouth bass in the lower Snake River reservoirs during all sampling years. Dash (–) = not sampled.
Year n PSD (%) n PSD (%) n PSD (%) n PSD (%)1991 116 29 473 12 621 29 102 421994 – – 19 a 64 66 45 331995 – – 35 23 84 60 20 301996 – – 12 a 13 a 26 381999 – – 0 a 9 a 17 a2004 – – 8 a 30 53 5 a2007 8 a 7 a 2 a 11 a2010 0 a 12 a 6 a 14 a2013 1 a 7 a 1 a 7 a
Ice Harbor Little Goose Lower GraniteLower Monumental
Year n PSD RSD n PSD RSD n PSD RSD n PSD RSD1991 499 21 4 460 21 3 640 21 3 249 8 31994 – – – 173 9 1 160 6 1 447 9 21995 – – – 74 12 3 131 14 5 275 17 61996 – – – 39 10 0 57 21 5 132 29 111999 – – – 42 62 2 30 70 0 83 37 62004 – – – 255 16 1 48 35 13 306 12 22007 671 13 3 542 14 3 520 18 5 519 14 32010 485 15 2 780 8 1 338 23 7 451 16 62013 220 24 3 661 24 1 408 20 4 731 9 2
Ice Harbor Little Goose Lower GraniteLower Monumental
29

Table C–10. Sample size (n), median relative weight (Wr), and 95% bootstrap confidence interval (CI; quantile) for northern pikeminnow (≥200 mm FL), smallmouth bass (≥200 mm TL), and walleye (≥200 mm TL) in the lower Snake River reservoirs during all sampling years. Dash (–) = not sampled.
Area,Year n Wr CI n Wr CI n Wr CI n Wr CI
Ice Harbor1991 33 90 4.7 35 92 12.4 240 87 4.4 0 na na1994 – – – – – – – – – – – –1995 – – – – – – – – – – – –1996 – – – – – – – – – – – –1999 – – – – – – – – – – – –2004 – – – – – – – – – – – –2007 9 97 16.2 12 91 17.3 408 90 2.3 0 na na2010 0 na na 2 101 4.5 335 95 2.8 0 na na2013 1 87 na 1 135 na 155 94 2.3 0 na na
Lower Monumental1991 121 93 3.2 124 95 5.0 225 91 3.3 0 na na1994 16 92 12.4 12 99 23.6 88 88 5.8 0 na na1995 15 94 9.6 24 101 12.0 60 87 5.9 0 na na1996 5 87 48.0 8 94 27.3 30 83 9.6 0 na na1999 0 na na 0 na na 40 100 7.4 1 105 na2004 4 100 25.0 7 95 16.7 207 100 3.6 0 na na2007 5 91 10.8 6 103 39.6 420 91 2.6 33 91 7.42010 3 90 8.6 15 93 25.9 580 92 2.7 7 100 22.72013 7 97 12.8 13 95 17.4 586 93 1.7 16 96 6.8
Male FemaleNorthern pikeminnow Smallmouth bass Walleye
30
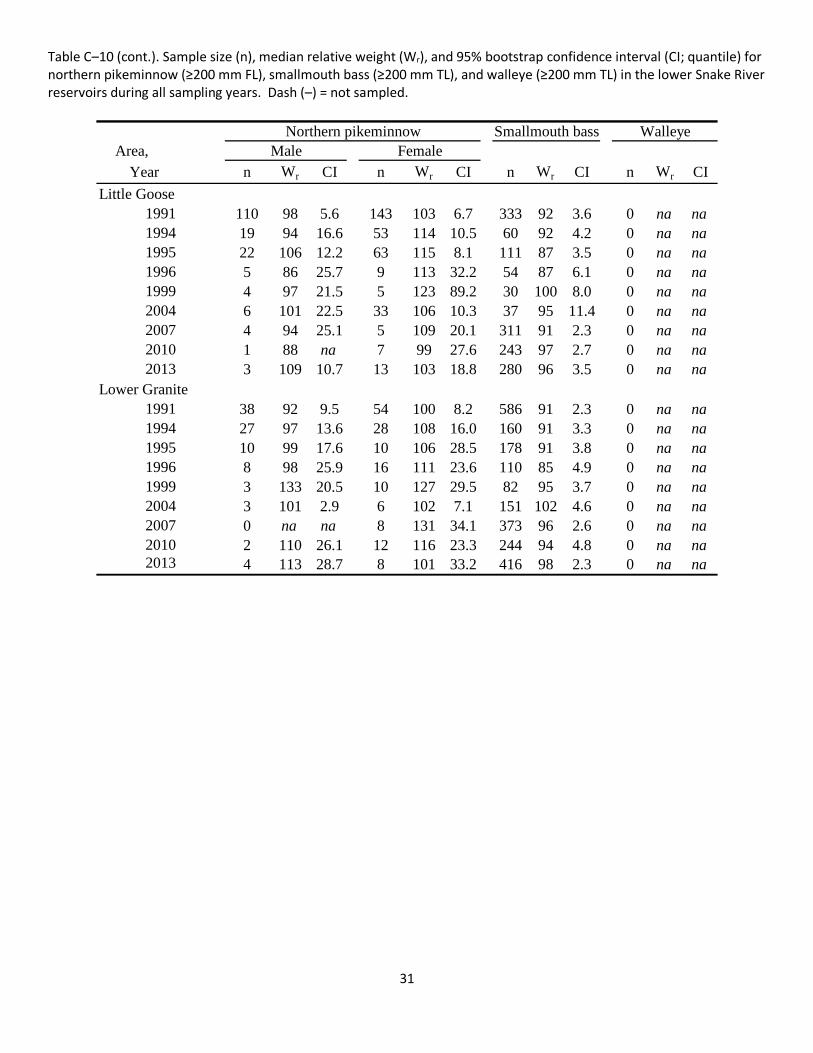
Table C–10 (cont.). Sample size (n), median relative weight (Wr), and 95% bootstrap confidence interval (CI; quantile) for northern pikeminnow (≥200 mm FL), smallmouth bass (≥200 mm TL), and walleye (≥200 mm TL) in the lower Snake River reservoirs during all sampling years. Dash (–) = not sampled.
Area,Year n Wr CI n Wr CI n Wr CI n Wr CI
Little Goose1991 110 98 5.6 143 103 6.7 333 92 3.6 0 na na1994 19 94 16.6 53 114 10.5 60 92 4.2 0 na na1995 22 106 12.2 63 115 8.1 111 87 3.5 0 na na1996 5 86 25.7 9 113 32.2 54 87 6.1 0 na na1999 4 97 21.5 5 123 89.2 30 100 8.0 0 na na2004 6 101 22.5 33 106 10.3 37 95 11.4 0 na na2007 4 94 25.1 5 109 20.1 311 91 2.3 0 na na2010 1 88 na 7 99 27.6 243 97 2.7 0 na na2013 3 109 10.7 13 103 18.8 280 96 3.5 0 na na
Lower Granite1991 38 92 9.5 54 100 8.2 586 91 2.3 0 na na1994 27 97 13.6 28 108 16.0 160 91 3.3 0 na na1995 10 99 17.6 10 106 28.5 178 91 3.8 0 na na1996 8 98 25.9 16 111 23.6 110 85 4.9 0 na na1999 3 133 20.5 10 127 29.5 82 95 3.7 0 na na2004 3 101 2.9 6 102 7.1 151 102 4.6 0 na na2007 0 na na 8 131 34.1 373 96 2.6 0 na na2010 2 110 26.1 12 116 23.3 244 94 4.8 0 na na2013 4 113 28.7 8 101 33.2 416 98 2.3 0 na na
Northern pikeminnow Smallmouth bass WalleyeMale Female
31

Table D–1. Fork length characteristics of northern pikeminnow sampled annually from anglers' catches at Bonneville (2006), The Dalles (2006-2013), and John Day (2007-2013) dams for digestive tract evaluation.
Dam, Year n Minimum Maximum Mean MedianBonneville,
2006 22 267 544 425 438The Dalles,
2006 129 212 549 360 3422007 340 229 550 343 3332008 209 200 518 356 3502009 223 187 545 377 3702010 395 185 545 366 3642011 326 219 574 367 3702012 324 210 525 332 3142013 633 214 578 328 343
John Day,2007 453 230 553 366 3582008 64 262 550 377 3652009 224 251 572 403 3942010 382 233 575 376 3762011 288 230 515 362 3632012 492 230 545 344 3202013 1,109 208 565 355 376
All dams and years 5,613 185 575 357 355
32
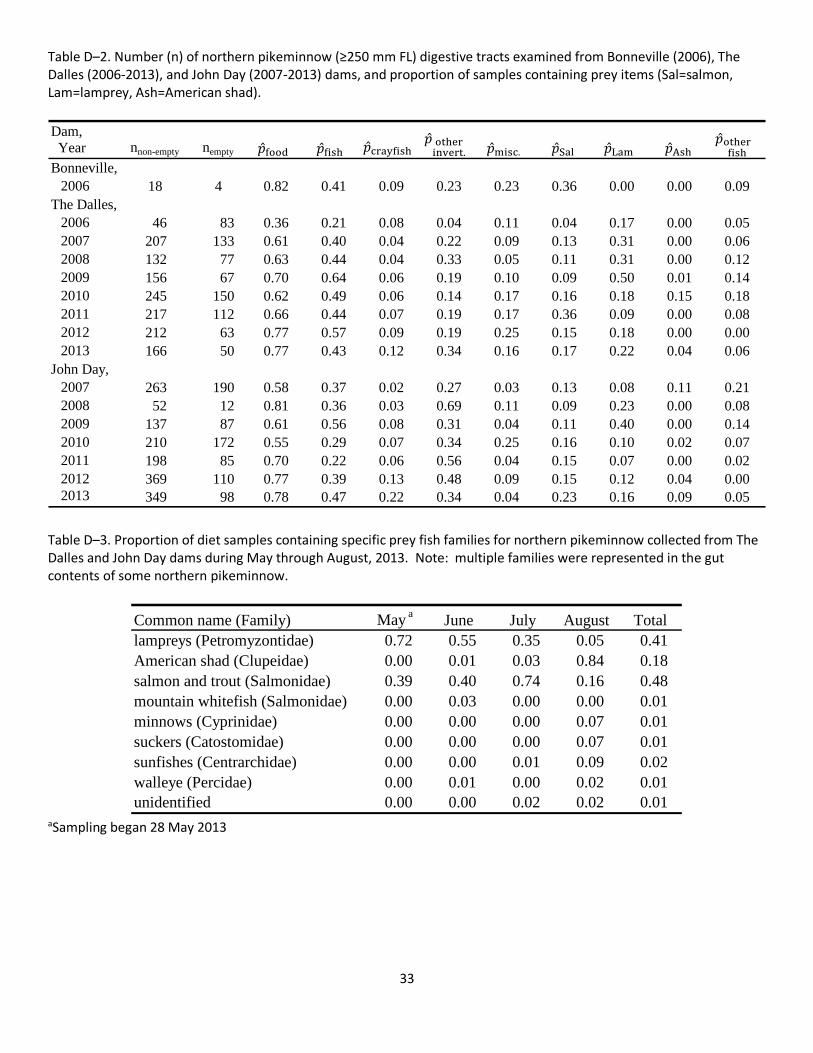
Table D–2. Number (n) of northern pikeminnow (≥250 mm FL) digestive tracts examined from Bonneville (2006), The Dalles (2006-2013), and John Day (2007-2013) dams, and proportion of samples containing prey items (Sal=salmon, Lam=lamprey, Ash=American shad).
Table D–3. Proportion of diet samples containing specific prey fish families for northern pikeminnow collected from The Dalles and John Day dams during May through August, 2013. Note: multiple families were represented in the gut contents of some northern pikeminnow.
aSampling began 28 May 2013
Dam, Year nnon-empty nempty
2006 18 4 0.82 0.41 0.09 0.23 0.23 0.36 0.00 0.00 0.09
2006 46 83 0.36 0.21 0.08 0.04 0.11 0.04 0.17 0.00 0.052007 207 133 0.61 0.40 0.04 0.22 0.09 0.13 0.31 0.00 0.062008 132 77 0.63 0.44 0.04 0.33 0.05 0.11 0.31 0.00 0.122009 156 67 0.70 0.64 0.06 0.19 0.10 0.09 0.50 0.01 0.142010 245 150 0.62 0.49 0.06 0.14 0.17 0.16 0.18 0.15 0.182011 217 112 0.66 0.44 0.07 0.19 0.17 0.36 0.09 0.00 0.082012 212 63 0.77 0.57 0.09 0.19 0.25 0.15 0.18 0.00 0.002013 166 50 0.77 0.43 0.12 0.34 0.16 0.17 0.22 0.04 0.06
2007 263 190 0.58 0.37 0.02 0.27 0.03 0.13 0.08 0.11 0.212008 52 12 0.81 0.36 0.03 0.69 0.11 0.09 0.23 0.00 0.082009 137 87 0.61 0.56 0.08 0.31 0.04 0.11 0.40 0.00 0.142010 210 172 0.55 0.29 0.07 0.34 0.25 0.16 0.10 0.02 0.072011 198 85 0.70 0.22 0.06 0.56 0.04 0.15 0.07 0.00 0.022012 369 110 0.77 0.39 0.13 0.48 0.09 0.15 0.12 0.04 0.002013 349 98 0.78 0.47 0.22 0.34 0.04 0.23 0.16 0.09 0.05
John Day,
Bonneville,
The Dalles,
Common name (Family) May a June July August Totallampreys (Petromyzontidae) 0.72 0.55 0.35 0.05 0.41American shad (Clupeidae) 0.00 0.01 0.03 0.84 0.18salmon and trout (Salmonidae) 0.39 0.40 0.74 0.16 0.48mountain whitefish (Salmonidae) 0.00 0.03 0.00 0.00 0.01minnows (Cyprinidae) 0.00 0.00 0.00 0.07 0.01suckers (Catostomidae) 0.00 0.00 0.00 0.07 0.01sunfishes (Centrarchidae) 0.00 0.00 0.01 0.09 0.02walleye (Percidae) 0.00 0.01 0.00 0.02 0.01unidentified 0.00 0.00 0.02 0.02 0.01
33

1990 1995 2000 2005 2010
Exp
loita
tion
(%)
0
5
10
15
20
25
30
Figure 1. System-wide exploitation rates of northern pikeminnow (≥250 mm FL) for the Sport-Reward fishery, 1991–2013. Error bars represent the 95% confidence interval. Confidence intervals were not available for 1991–1992.
1990 1995 2000 2005 2010 2015
Pot
entia
l Pre
datio
n (%
)
40
50
60
70
80
90
100
A
B
C
Figure 2. Maximum (A), median (B), and minimum (C) levels of potential predation estimated for northern pikeminnow on juvenile salmon relative to predation prior to implementation of the Northern Pikeminnow Management Program. Estimates of predicted predation after 2013 are based on 9-year average values.
34

0.00
0.02
0.04
0.06
0.08
0.10
0.12
0.14
Sta
ndar
dize
d S
mol
t Pas
sage
Inde
x
0.00
0.02
0.04
0.06
0.08
0.10
0.12
0.14
0.00
0.02
0.04
0.06
0.08
0.10
0.12
0.14 NPMP Sample PeriodsYearling smoltsChinook subyearling
1-Apr. 1-May 1-June 1-July 1-Aug.
Little Goose
Lower Monumental
Ice Harbor
Figure 3. Periods of index sampling and index of juvenile salmon passing through Lower Granite, Little Goose and Lower Monumental dams 1 April–31 July 2013 (Source: Fish Passage Center, unpublished data). Passage data are daily smolt passage index values standardized to total passage throughout the period of interest. No comparable passage data exist for Lower Granite Reservoir.
35

Abu
ndan
ce In
dex
(AI)
0.0
0.5
1.0
1.5
2.0
2.5
3.0
3.5Ice Harbor Lower Monumental
1990 1995 2000 2005 2010
0.0
0.5
1.0
1.5
2.0
2.5
3.0
3.5Little Goose
1990 1995 2000 2005 2010
Lower Granite
Figure 4. Abundance index values for northern pikeminnow in discrete reaches of Ice Harbor, Lower Monumental, Little Goose and Lower Granite reservoirs, 1991-2013.
36

Appendix C: List of Metrics and Indicators Category Subcategory Subcategory Focus 1 Subcategory Focus 2 Specific Metric
Title
Fish Catch Per Unit Effort Fish Life Stage: Adult Fish CPUE
Fish Length: Fish Species Fish Life Stage: Adult Fish Fork Length
Fish Mark Retention Fish Life Stage: Adult Fish Mark Retention
Fish Mark/Tag Application Fish Life Stage: Adult Fish PIT and Loop Tag IDs
Fish Mark/Tag Recovery or Detection
Fish Life Stage: Adult Fish Recapture
Fish Predation: Fish Fish Life Stage: Adult Fish Predation Index
Fish Weight: Fish Fish Life Stage: Adult Fish Mass
Fish Consumption: Fish Fish Life Stage: Adult Fish Consumption Index
Fish Condition Fish Life Stage: Adult Fish Relative Weight
Fish Size Structure Fish Life Stage: Adult Fish Proportional Stock Density
Fish Size Structure Fish Life Stage: Adult Fish Relative Stock Density
Fish Diet Composition Fish Life Stage: Adult Fish Frequency
Fish Relative Stock Density Fish Life Stage: Adult Fish
37