northern territory economy overview
TRANSCRIPT

Northern Territory Economy Overview

Darwin
Canberra
Sydney
Adelaide
Hobart
Melbourne
Perth
Brisbane
PortMoresby
Jakarta
Singapore
Kuala Lumpur
Bangkok
Tokyo
Taipei
HongKong
Beijing
Seoul
Hanoi
2650
km
2850 km
3150km
3150km3150
km
3750km
2600km
2700 km
3350 km
3650 km
4450 km
3200km
4300km
4250km
5450km
6000km
5550km
4650km
1800 km
2700km
Brunei
Alice Springs
1500 km
700 km
Dili
Manila
2650
km

1
Economy Overview
Northern Territory Economy OverviewThis overview is a summarised assessment of the Territory economy, including a brief description of recent performance and growth prospects, employment, population, trade, and Australian and international conditions. The Economy Overview is summarised from the more detailed document, Northern Territory Economy. (For more information, visit www.budget.nt.gov.au)
ContentsStructure of the Economy 2
Economic Growth 3
External Economic Environment 4
Population 5
Labour Market 6
Prices 7
Retail and Wholesale Trade 8
International Trade 9
Residential Property Markets 10
Mining and Manufacturing 11
Construction 12
Agriculture, Forestry and Fisheries 13
Tourism 14
Transport and Communication 15
The Public Sector 16
Defence 17
Charts and Tables 18

2
2011-12 Budget
Structure of the Economy • The drivers of economic activity in the Northern Territory economy
are markedly different to other Australian jurisdictions, reflecting the abundance of natural resources, large public sector and significant Defence presence but relatively smaller professional, financial and insurance sectors.
• Mining is the largest industry in the Territory accounting for 25.0 per cent of gross state product (GSP) in 2009-10, more than three times the contribution this sector makes to national gross domestic product (GDP).
• The Territory’s GSP per capita is 34.2 per cent higher than the national average, reflecting the significant contribution of the mining industry to economic growth.
• The Territory’s economic base is relatively concentrated, with the top four industries (mining, public administration, construction and manufacturing) accounting for 49.0 per cent of GSP, compared to 35.4 per cent for the top four industries nationally.
1 Inflation adjusted, base year 2008-09Source: ABS Cat. No. 5220.0
Chart 1: Industry Proportions of GSP and GDP, 2009‑101
0 5 10 15 20 25 30
Agriculture, forestry and fisheries
Mining
Manufacturing
Electricity, gas and water
Construction
Wholesale trade
Retail trade
Accommodation and food services
Transport, postal and warehousing
Information media and telecommunications
Financial and insurance services
Rental, hiring and real estate services
Professional, scientific and technical services
Administrative and support services
Public administration and safety
Education and training
Health care and social assistance
Arts and recreation services
Other services
Ownership of dwellings
Northern Territory Australia%

3
Economy Overview
Economic Growth • The Territory has a relatively small, open economy that is heavily influenced
by international trade and major projects. As such, the Territory’s economic growth can be volatile from year to year.
• In the five years to 2008-09, the Territory recorded the highest annual average economic growth among the jurisdictions at 5.2 per cent, significantly above the national average of 3.0 per cent.
• In 2009-10, economic growth in the Territory moderated to 1.3 per cent due to a large decline in private sector investment following the completion of several major projects in the Territory, the temporary cessation of development at the Montara oilfield and the absence of new major projects in the aftermath of the global financial crisis.
• Economic growth in the Territory is estimated to have strengthened to 2.2 per cent in 2010-11, driven by increased public sector consumption and investment.
• In 2011-12, economic growth in the Territory is forecast to strengthen to 3.2 per cent reflecting a widening trade surplus, a recovery in household consumption and increased private sector investment. Public sector consumption and investment is forecast to decline as Commonwealth stimulus measures conclude.
• The forecasts do not incorporate the construction of the proposed liquefied natural gas plant and associated facilities near Darwin by Japanese oil and gas company INPEX. Should the project proceed it will have a substantial positive effect on future economic growth.
e: estimate; f: forecast1 Inflation adjustedSource: ABS Cat. No. 5220.0 and NT Treasury
Chart 2: Territory Gross State Product and State Final Demand1
(year‑on‑year percentage change)
-10
-5
0
5
10
15
02 03 04 05 06 07 08 09 10 11e 12f
Year ended June
%
SFD
GSP

4
2011-12 Budget
External Economic Environment • The Territory has a relatively small, open economy that is heavily influenced
by international trade, large engineering projects, tourism and population movements.
• After contracting by 0.5 per cent in 2009, the global economy recovered strongly in 2010, with the International Monetary Fund (IMF) estimating world output growth of 5.0 per cent in 2010 and forecasting growth of 4.4 per cent in 2011.
• The IMF estimates that developing Asian economies, led by China and India, grew by 9.5 per cent in 2010 compared to 3.0 per cent for advanced economies. This trend is expected to continue into 2011, with the IMF forecasting growth of 8.4 per cent for developing Asian economies compared to 2.4 per cent for advanced economies.
• The Australian economy grew by 2.6 per cent in 2010. The IMF forecasts the Australian economy to grow by 3.0 per cent in 2011 and 3.5 per cent in 2012.
• Australian economic growth in 2011 and 2012 is expected to be driven by a further recovery in the global economy and, in particular, further strong growth in China, which is expected to underpin high levels of demand for Australia’s key mineral exports.
1 Inflation adjustedSource: ABS Cat. No. 5206.0
Chart 3: International Monetary Fund GDP Forecasts1
0
2
4
6
8
10
12
Japan Europe United States Australia China World output
2010 2011
%

5
Economy Overview
Population • The Territory has the smallest population and lowest population density of
all jurisdictions in Australia.
• More than 30 per cent of the Territory’s population is Indigenous, compared to 2.5 per cent nationally.
• The Territory’s estimated resident population increased by 1.6 per cent through the year to June 2010 to 229 711.
• Natural increase (births minus deaths) is the largest component of population growth in the Territory. However, net interstate migration tends to drive changes in growth.
• The Territory’s annual population growth is estimated to have moderated to 1.0 per cent in 2010, reflecting moderating economic and employment growth, lower net overseas migration and the relocation of the 1st Brigade’s 7th Battalion Royal Australian Regiment to South Australia from the December quarter.
• Population growth is expected to remain stable at 1.0 per cent in 2011, rising to 1.8 per cent in 2012 due to increased residential construction activity, recovering household consumption and the build up of the 1st Brigade’s 5th Battalion Royal Australian Regiment.
e: estimate; f: forecastNote: The ABS changed the net overseas migration estimation methodology in 2007, representing a break in the series. As such, long-term trends need to be interpreted with caution.Source: NT Treasury, ABS Cat. No. 3101.0
0
0.5
1.0
1.5
2.0
2.5
3.0
97 98 99 00 01 02 03 04 05 06 07 08 09 10e 11f 12fCalendar year
%
Northern Territory
Australia
Chart 4: Annual Population Growth in the Territory and
Australia

6
2011-12 Budget
Labour Market • The government administration, health, retail trade and construction
industries are the largest employers in the Territory.
• In 2010-11, employment growth in the Territory is estimated to have moderated to 2.2 per cent, reflecting softer labour demand following the completion of several major projects in the Territory.
• Despite moderating employment growth, the Territory’s unemployment rate is expected to have remained at historically low levels in 2010-11, averaging 2.7 per cent.
• In 2010, growth in the Territory’s wage price index (WPI) moderated to 3.5 per cent, reflecting softer labour market conditions.
• WPI in the Territory is forecast to grow by 3.7 per cent in 2011 and by 4.0 per cent in 2012, reflecting strengthening economic activity in the Territory and ongoing skills shortages.
1 Moving annual averageSource: ABS Cat. No. 6202.0
Chart 5: Territory Unemployment and Participation Rates1
0
1
2
3
4
5
6
7
8
9
10
60
62
64
66
68
70
72
74
76
78
80
02 03 04 05 06 07 08 09 10 11
Participation rate (left-hand axis)
Unemployment rate (right-hand axis)
%
Year ended June
%
7
Economy Overview
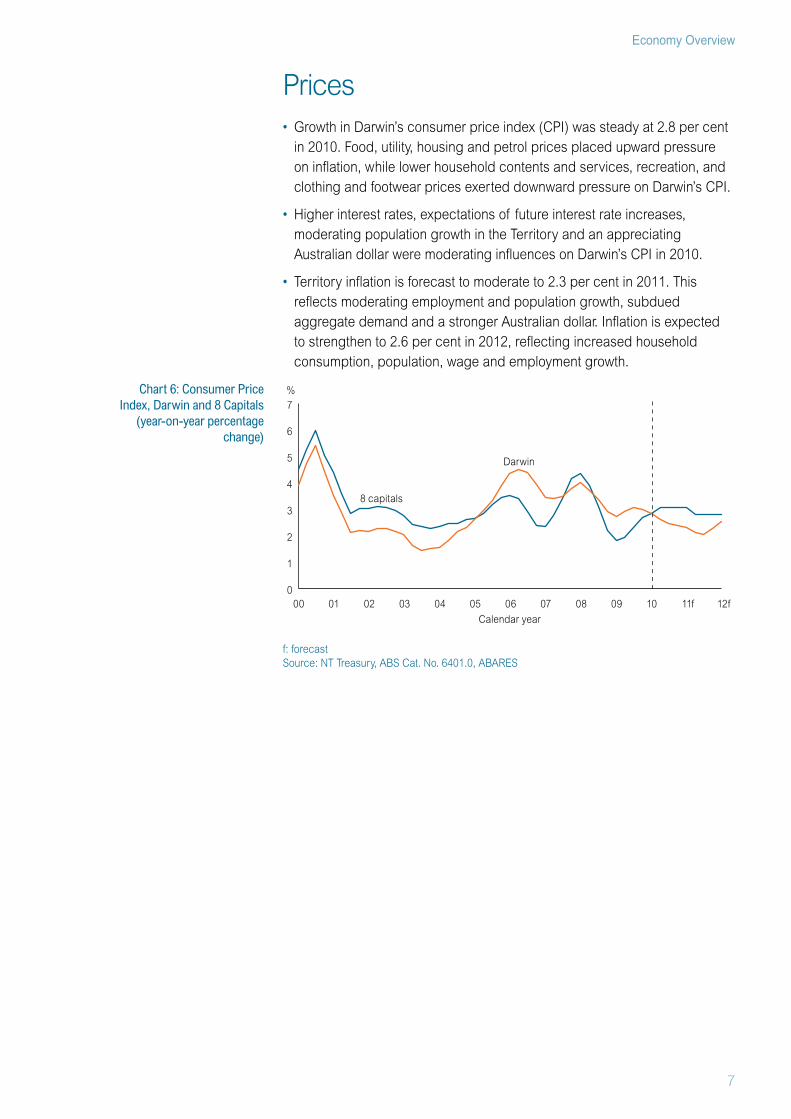
Prices • Growth in Darwin’s consumer price index (CPI) was steady at 2.8 per cent
in 2010. Food, utility, housing and petrol prices placed upward pressure on inflation, while lower household contents and services, recreation, and clothing and footwear prices exerted downward pressure on Darwin’s CPI.
• Higher interest rates, expectations of future interest rate increases, moderating population growth in the Territory and an appreciating Australian dollar were moderating influences on Darwin’s CPI in 2010.
• Territory inflation is forecast to moderate to 2.3 per cent in 2011. This reflects moderating employment and population growth, subdued aggregate demand and a stronger Australian dollar. Inflation is expected to strengthen to 2.6 per cent in 2012, reflecting increased household consumption, population, wage and employment growth.
f: forecastSource: NT Treasury, ABS Cat. No. 6401.0, ABARES
Chart 6: Consumer Price Index, Darwin and 8 Capitals
(year‑on‑year percentage change)
0
1
2
3
4
5
6
7
00 01 02 03 04 05 06 07 08 09 10 11f 12f
Darwin
8 capitals
%
Calendar year

8
2011-12 Budget
Retail and Wholesale Trade • Population and economic growth, which support employment and wage
growth, are the main drivers of retail and wholesale trade in the Territory.
• In 2009-10, retail and wholesale trade accounted for 4.4 per cent of Territory gross state product (GSP), compared to 8.7 per cent of gross domestic product nationally.
• Retail trade (2.8 per cent of GSP) contributes significantly more to the Territory economy than wholesale trade (1.6 per cent of GSP), with many Territory retailers sourcing goods from interstate wholesalers.
• Despite its comparatively small contribution to GSP, retail trade is a relatively labour-intensive industry, accounting for 10.0 per cent of employment in the Territory in 2009-10.
• Inflation adjusted retail trade turnover in the Territory is expected to have remained stable in 2010-11, reflecting slowing employment, wages and population growth, higher interest rates and an increased propensity to save among households.
• Growth in retail trade turnover is expected to increase by 1.8 per cent in 2011-12 as consumer confidence begins to recover and household consumption rises.
e: estimate f: forecast 1 Inflation adjustedSource: NT Treasury, ABS Cat No. 8502.0, Access Economics
Chart 7: Retail Trade Turnover1
(year‑on‑year percentage change)
-2
0
2
4
6
8
10
00 01 02 03 04 05 06 07 08 09 10 11e 12f
%
Year ended June
Australia Northern Territory

9
Economy Overview
International Trade • The Territory’s international trade is dominated by the mining and energy
industry, which accounts for about 84 per cent of goods exports and 62 per cent of goods imports. LNG is the Territory’s largest export.
• Feedstock gas for the Darwin liquefied natural gas (LNG) plant, petroleum products (petrol, diesel and aviation fuel), and machinery and equipment account for the majority of the Territory’s imports.
• In 2009-10, the Territory’s trade surplus increased by 70.9 per cent to $4.1 billion, mainly due to a 35-day maintenance shutdown at the Darwin LNG plant that, because of timing issues, resulted in a 25 per cent decrease in feedstock gas imports but only a 6.3 per cent decline in LNG exports.
• In 2010-11, the Territory’s trade surplus is estimated to have decreased by 7.5 per cent to $3.8 billion. The decline reflects a 19.7 per cent increase in goods imports, particularly feedstock gas, and petroleum from Singapore refineries, which more than offset a 5.6 per cent increase in goods exports.
• In 2011-12, the Territory’s trade surplus is forecast to increase by 13.2 per cent to $4.3 billion, driven by increased oil exports as the Kitan and Montara oilfields commence production. In addition, import growth is forecast to moderate as imports of feedstock gas stabilise.
e: estimate; f: forecast1 inflation adjusted, base year 2008-09Source: NT Treasury, ABS Cat. No. 5368.0
Chart 8: Territory International Merchandise Trade,
2000‑01 to 2011‑121
0
2
4
6
8
10
01 02 03 04 05 06 07 08 09 10 11e 12f
$B
Exports of goods and services
Imports of goods and services
Trade balance
Year ended June

10
2011-12 Budget
Residential Property Markets • Strong economic and population growth and rising disposable household
incomes resulted in significant increases in house and unit prices across the Territory between 2004 and 2009.
• Residential property markets have generally softened in 2010 due to increased interest rates, tighter lending conditions and finalisation of government stimulus schemes following the global financial crisis. However, most regions recorded house and unit price growth through the year.
• As at the December quarter 2010, median house and unit prices in Darwin were the third highest of the eight capital cities.
• Residential land settlements declined in 2010. However, this does not fully reflect sales activity arising from the Territory’s accelerated land release strategy, with some pre-sales occurring in 2010 but settlements to occur in 2011.
• Residential property markets are expected to remain relatively stable through 2011 reflecting modest demand and continuing land release.
Northern Territory 2009 2010Annual
% Change
Land sales, no. 427 304 - 28.8
House sales, no. 2289 1622 - 29.1
Unit sales, no. 2001 1339 - 33.1
Median house price1, $
Darwin overall2 540 000 559 500 3.6
Palmerston 486 000 510 000 4.9
Alice Springs 415 000 465 000 12.0
Katherine 318 500 315 000 - 1.1
Tennant Creek 140 000 207 500 48.2
1 As at December quarter2 Includes Darwin and PalmerstonSource: Australian Valuation Office, Real Estate Institute of the Northern Territory
Table 1: Key Residential Property Market Indicators

11
Economy Overview
Mining and Manufacturing • Mining is the largest industry in the Territory, accounting for 25.0 per cent
of gross state product in 2009-10, the second highest proportion of the jurisdictions. Nationally, mining accounted for 9.4 per cent of gross domestic product.
• In 2010-11, the value of mineral and energy production in the Territory is estimated to have decreased by 0.9 per cent to $5.8 billion, driven by lower offshore oil production following the decommissioning of the Jabiru and Challis/Cassini oilfields, which more than offset increased offshore gas, gold and manganese production.
• In 2010-11, the value of alumina and gas manufacturing is estimated to have increased by 6.9 per cent to $3.1 billion, mainly due to higher liquefied natural gas (LNG) production following the temporary shutdown of the Darwin LNG plant for maintenance and repairs in 2009-10.
• The value of mineral and energy production in the Territory is forecast to increase by 11.8 per cent to $6.5 billion in 2011-12. The increase is expected to be driven by the energy sector with higher levels of oil production reflecting the commencement of production from the Kitan and Montara oilfields and higher uranium production.
• The value of alumina and gas manufacturing is forecast to increase by 7.3 per cent in 2011-12 to $3.3 billion, mainly driven by an increase in alumina production following expansions at the Rio Tinto Alcan refinery.
e: estimate; f: forecast1 Inflation adjusted, base year 2008-09Source: NT Treasury, NT Department of Resources
Chart 9: Value of Mineral and Energy Production1
1
2
3
4
5
6
7
8
9
10
99 00 01 02 03 04 05 06 07 08 09 10 11e 12f
Total mining
Total energy
$B
Total mining and energy
Year ended June

12
2011-12 Budget
Construction • In 2009-10, the construction industry accounted for 8.6 per cent of
Territory gross state product, making it the Territory’s third largest industry.
• The construction industry is one of the Territory’s largest employers, comprising 9.9 per cent of the Territory’s resident employment in 2009-10 as well as a number of fly-in fly-out (FIFO) workers.
• In 2010-11, the value of construction activity in the Territory is estimated to have increased by 8.0 per cent to $2.3 billion, driven by engineering construction associated with the Kitan and Montara oilfield developments. The value of residential construction is estimated to have increased by 0.7 per cent, while non-residential activity is expected to have declined by 3.8 per cent.
• In 2011-12, the value of construction activity in the Territory is forecast to increase by 4.2 per cent to $2.4 billion. Construction is expected to be driven by engineering activity associated with the Kitan and Montara oilfields.
• The value of residential construction is forecast to increase by 2.5 per cent in 2011-12, once settlements from pre-sales following the Territory Government’s accelerated land release in Palmerston East are finalised.
• The value of non-residential construction is expected to increase by 1.4 per cent in 2011-12, as higher private sector investment offsets lower public sector activity due to the finalisation of the Commonwealth Nation Building and Jobs Plan stimulus program.
e: estimate; f: forecast1 Inflation adjusted, base year 2008-09Source: ABS, Cat. No. 8752.0, NT Treasury
Chart 10: Construction Work Done in the Territory,
Quarterly Data1 (moving annual total)
0.0
0.2
0.4
0.6
0.8
1.0
1.2
1.4
96 97 98 99 00 01 02 03 04 05 06 07 08 09 10 11e 12f
Engineering Residential Non-residential TotalYear ended June
$B
BlacktipMontaraGEMCO
Laminaria-Corralina
Railway and Bayu-Undan
LNG plant
Alcan G3
LNG plantmaintenance
KitanMontara
13
Economy Overview
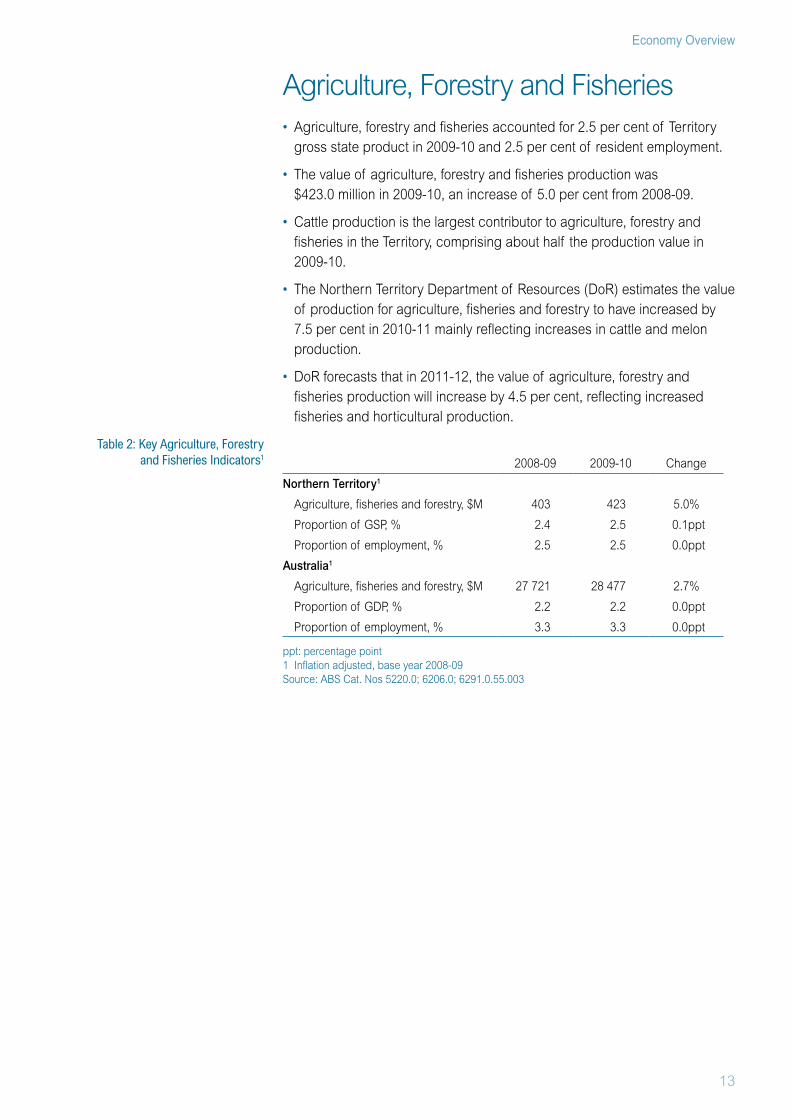
Agriculture, Forestry and Fisheries • Agriculture, forestry and fisheries accounted for 2.5 per cent of Territory
gross state product in 2009-10 and 2.5 per cent of resident employment.
• The value of agriculture, forestry and fisheries production was $423.0 million in 2009-10, an increase of 5.0 per cent from 2008-09.
• Cattle production is the largest contributor to agriculture, forestry and fisheries in the Territory, comprising about half the production value in 2009-10.
• The Northern Territory Department of Resources (DoR) estimates the value of production for agriculture, fisheries and forestry to have increased by 7.5 per cent in 2010-11 mainly reflecting increases in cattle and melon production.
• DoR forecasts that in 2011-12, the value of agriculture, forestry and fisheries production will increase by 4.5 per cent, reflecting increased fisheries and horticultural production.
2008-09 2009-10 Change
Northern Territory1
Agriculture, fisheries and forestry, $M 403 423 5.0%
Proportion of GSP, % 2.4 2.5 0.1ppt
Proportion of employment, % 2.5 2.5 0.0ppt
Australia1
Agriculture, fisheries and forestry, $M 27 721 28 477 2.7%
Proportion of GDP, % 2.2 2.2 0.0ppt
Proportion of employment, % 3.3 3.3 0.0ppt
ppt: percentage point1 Inflation adjusted, base year 2008-09Source: ABS Cat. Nos 5220.0; 6206.0; 6291.0.55.003
Table 2: Key Agriculture, Forestry and Fisheries Indicators1
14
2011-12 Budget
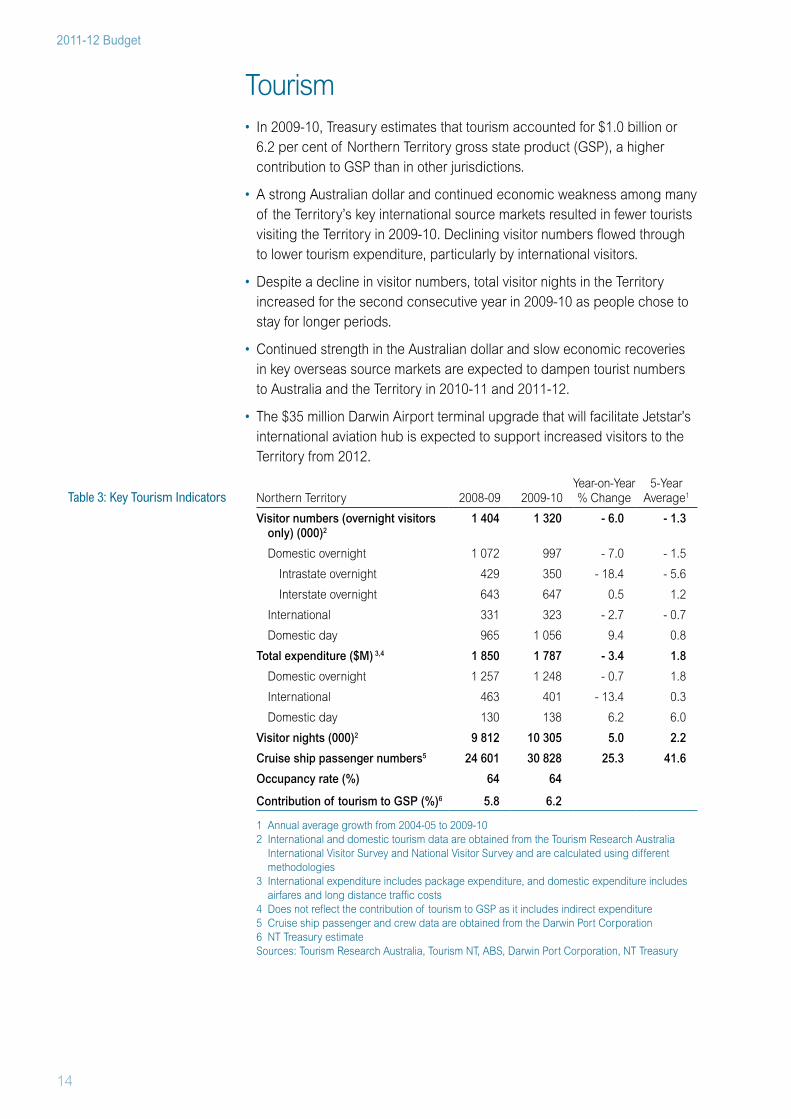
Tourism • In 2009-10, Treasury estimates that tourism accounted for $1.0 billion or
6.2 per cent of Northern Territory gross state product (GSP), a higher contribution to GSP than in other jurisdictions.
• A strong Australian dollar and continued economic weakness among many of the Territory’s key international source markets resulted in fewer tourists visiting the Territory in 2009-10. Declining visitor numbers flowed through to lower tourism expenditure, particularly by international visitors.
• Despite a decline in visitor numbers, total visitor nights in the Territory increased for the second consecutive year in 2009-10 as people chose to stay for longer periods.
• Continued strength in the Australian dollar and slow economic recoveries in key overseas source markets are expected to dampen tourist numbers to Australia and the Territory in 2010-11 and 2011-12.
• The $35 million Darwin Airport terminal upgrade that will facilitate Jetstar’s international aviation hub is expected to support increased visitors to the Territory from 2012.
Northern Territory 2008-09 2009-10Year-on-Year % Change
5-YearAverage1
Visitor numbers (overnight visitors only) (000)2
1 404 1 320 - 6.0 - 1.3
Domestic overnight 1 072 997 - 7.0 - 1.5
Intrastate overnight 429 350 - 18.4 - 5.6
Interstate overnight 643 647 0.5 1.2
International 331 323 - 2.7 - 0.7
Domestic day 965 1 056 9.4 0.8
Total expenditure ($M) 3,4 1 850 1 787 - 3.4 1.8
Domestic overnight 1 257 1 248 - 0.7 1.8
International 463 401 - 13.4 0.3
Domestic day 130 138 6.2 6.0
Visitor nights (000)2 9 812 10 305 5.0 2.2
Cruise ship passenger numbers5 24 601 30 828 25.3 41.6
Occupancy rate (%) 64 64
Contribution of tourism to GSP (%)6 5.8 6.2
1 Annual average growth from 2004-05 to 2009-102 International and domestic tourism data are obtained from the Tourism Research Australia
International Visitor Survey and National Visitor Survey and are calculated using different methodologies
3 International expenditure includes package expenditure, and domestic expenditure includes airfares and long distance traffic costs
4 Does not reflect the contribution of tourism to GSP as it includes indirect expenditure5 Cruise ship passenger and crew data are obtained from the Darwin Port Corporation 6 NT Treasury estimateSources: Tourism Research Australia, Tourism NT, ABS, Darwin Port Corporation, NT Treasury
Table 3: Key Tourism Indicators

15
Economy Overview
Transport and Communication • Transport and communication links play a key role in economic and social
development, especially in jurisdictions such as the Territory that have relatively small and widely dispersed populations.
• In 2009-10, transport and communication services represented 6.1 per cent of Territory gross state product.
• The volume of trade through the Port of Darwin increased by 21.3 per cent in 2009-10 reflecting increases in iron ore and manganese exports, and petroleum imports.
• Passenger travel though the Darwin and Alice Springs airports increased in 2009-10, driven by additional seating capacity and discounting.
• The National Broadband Network is expected to significantly improve the Territory’s connectivity with the rest of Australia by late 2011 through two new fibre optic links.
1 Total includes intrastate trade volumesSource: Darwin Port Corporation
Chart 11: Trade Through the Port of Darwin
0
1
2
3
4
5
00 01 02 03 04 05 06 07 08 09 10
Tonnes (millions)
Year ended JuneOverseas in Overseas out Interstate in Interstate out Total1

16
2011-12 Budget
The Public Sector • The public sector is a major contributor to the Territory economy,
accounting for a higher proportion of state final demand than in most jurisdictions.
• Public sector expenditure in the Territory (excluding Defence), increased by 12.3 per cent to $5.5 billion in 2009-10, reflecting a 69.4 per cent increase in public sector investment due to Commonwealth stimulus measures and the Territory Government’s capital works program.
• The public sector is the largest employer in the Territory. The Australian Bureau of Statistics (ABS) reports that, on a head-count basis and including employees of Charles Darwin University, Batchelor Institute of Indigenous Tertiary Education and the Territory Insurance Office, there were 31 400 public sector employees in the Territory in June 2010 comprising:
− 24 800 Territory Government employees;
− 4 000 Commonwealth employees; and
− 2 600 local government employees.
Note: Excludes Defence1 Inflation adjusted, base year 2008-09Source: ABS Cat. No. 5220.0
Chart 12: Public Sector Spending Per Capita, 2009‑101
0
10 000
20 000
30 000
40 000
50 000
60 000
70 000
80 000
NSW Vic QLD WA SA Tas ACT NT Aust
$
17
Economy Overview
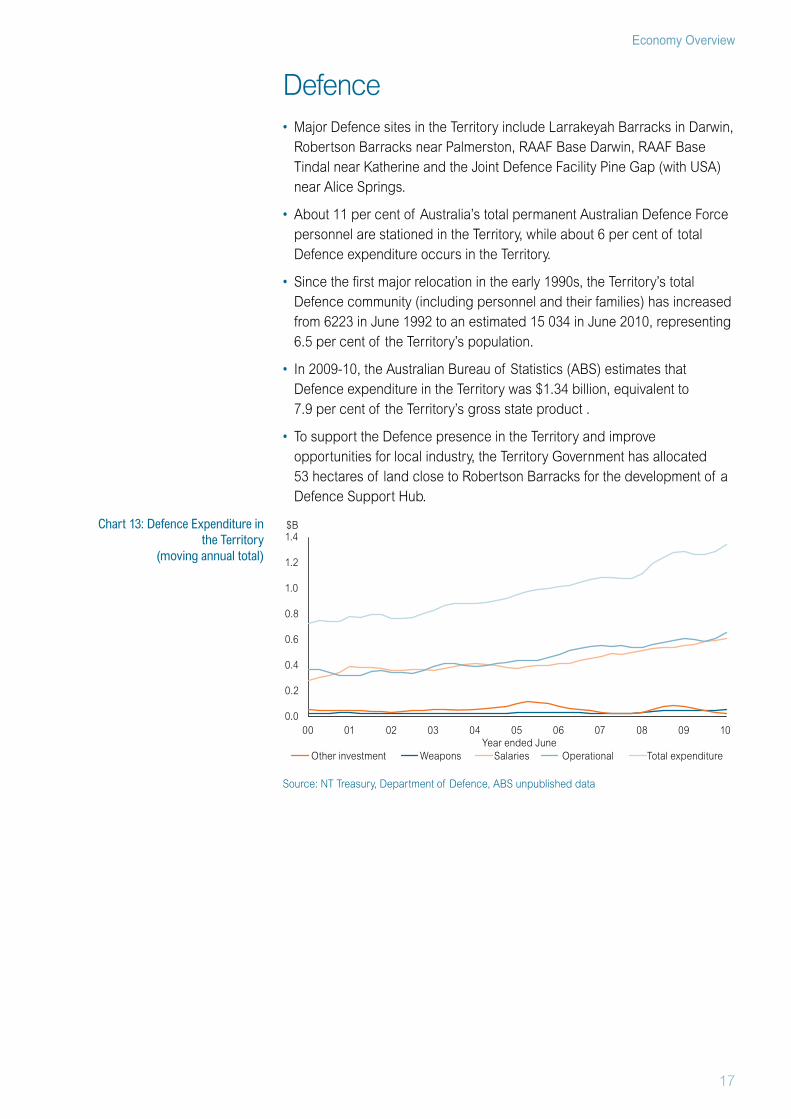
Defence• Major Defence sites in the Territory include Larrakeyah Barracks in Darwin,
Robertson Barracks near Palmerston, RAAF Base Darwin, RAAF Base Tindal near Katherine and the Joint Defence Facility Pine Gap (with USA) near Alice Springs.
• About 11 per cent of Australia’s total permanent Australian Defence Force personnel are stationed in the Territory, while about 6 per cent of total Defence expenditure occurs in the Territory.
• Since the first major relocation in the early 1990s, the Territory’s total Defence community (including personnel and their families) has increased from 6223 in June 1992 to an estimated 15 034 in June 2010, representing 6.5 per cent of the Territory’s population.
• In 2009-10, the Australian Bureau of Statistics (ABS) estimates that Defence expenditure in the Territory was $1.34 billion, equivalent to 7.9 per cent of the Territory’s gross state product .
• To support the Defence presence in the Territory and improve opportunities for local industry, the Territory Government has allocated 53 hectares of land close to Robertson Barracks for the development of a Defence Support Hub.
Source: NT Treasury, Department of Defence, ABS unpublished data
Chart 13: Defence Expenditure in the Territory
(moving annual total)
0.0
0.2
0.4
0.6
0.8
1.0
1.2
1.4
00 01 02 03 04 05 06 07 08 09 10Year ended June
OperationalSalaries
$B
WeaponsOther investment Total expenditure

18
2011-12 Budget
Charts and TablesChart 1: Industry Proportions of GSP and GDP, 2009-10 2
Chart 2: Territory Gross State Product and State Final Demand 3
Chart 3: International Monetary Fund GDP Forecasts 4
Chart 4: Annual Population Growth in the Territory and Australia 5
Chart 5: Territory Unemployment and Participation Rates 6
Chart 6: Consumer Price Index, Darwin and 8 Capitals 7
Chart 7: Retail Trade Turnover 8
Chart 8: Territory International Merchandise Trade, 2000-01 to 2011-12 9
Chart 9: Value of Mineral and Energy Production 11
Chart 10: Construction Work Done in the Territory 12
Chart 11: Trade Through the Port of Darwin 15
Chart 12: Public Sector Spending Per Capita, 2009-10 16
Chart 13: Defence Expenditure in the Territory 17
Table 1: Key Residential Property Market Indicators 10
Table 2: Key Agriculture, Forestry and Fisheries Indicators 13
Table 3: Key Tourism Indicators 14