northumberland child poverty assessment
TRANSCRIPT

Northumberland Poverty and Worklessness Assessment – 2012 Update
1
Northumberland Poverty and Worklessness Assessment 2012 Update
Date published: June 2012
Prepared by: Julie Dowson (Senior Research Officer) Tel. 01670 624740 E-mail. [email protected] Sarah Kidd (Policy Officer) Tel. 01670 624745 E-mail. [email protected] Iain Rowe (Senior Research Officer) Tel. 01670 624739 E-mail. [email protected]
Northumberland Poverty and Worklessness Assessment – 2012 Update
2
CONTENTS
Executive Summary ......................................................................................................................... 4
Key messages regarding poverty and worklessness in Northumberland ........................................ 5
1.0 Introduction .............................................................................................................................. 10
1.1 Background .............................................................................................................................. 10
1.2 National Context ...................................................................................................................... 10
1.3 Northumberland Child Poverty Action Group (NCPAG) .......................................................... 11
1.4 Next Steps ............................................................................................................................... 12
2.0 Children in Northumberland ..................................................................................................... 13
3.0 The Index of Deprivation 2010 ................................................................................................. 13
4.0 Child Poverty ............................................................................................................................ 19
5.0 Take up of formal childcare by low-income working families .................................................. 21
6.0 Overall Employment Rate ........................................................................................................ 22
6.1 Working age people and benefits ............................................................................................ 23
6.2 Earnings ................................................................................................................................... 26
7.0 Homelessness and temporary accommodation ...................................................................... 29
7.1 Proportion of non-decent Council Homes ................................................................................ 31
7.2 Fuel Poverty ............................................................................................................................. 32
8.0 Accessibility ............................................................................................................................. 34
9.0 Attainment ................................................................................................................................ 36
9.1 Young People aged 16-18 Not in Education, Employment or Training (NEET) ...................... 39
10.0 Under 18 Conception Rate .................................................................................................... 40
10.1 Life Expectancy at Birth ......................................................................................................... 42
10.2 Low Birth Weight .................................................................................................................... 44
10.3 Prevalence of Breastfeeding .................................................................................................. 46
10.4 Obesity amongst primary school age children ....................................................................... 47
11.0 Crime ..................................................................................................................................... 49
Northumberland Poverty and Worklessness Assessment – 2012 Update
3
List of Figures
Figure 1: IMD Proportion of LSOAs by Decile ............................................................................... 15
Figure 2: Index of Multiple Deprivation 2010 ................................................................................. 16
Figure 3: Proportion of LSOAs by Income Deprivation Affecting Children Index Decile ............... 17
Figure 4: Map of ID 2010 IDACI .................................................................................................... 18
Figure 5: Local child poverty proxy measure 2009 and 2010 ........................................................ 19
Figure 6: Local child poverty measure ........................................................................................... 20
Figure 7: Child poverty at Northumberland ward level .................................................................. 20
Figure 8: Take up of formal childcare by low-income working families ......................................... 21
Figure 9: Northumberland take up of formal childcare by low-income working families ............... 22
Figure 10: Employment Rate 2006-2011 ....................................................................................... 23
Figure 11: DWP Working-Age Benefit Claimants .......................................................................... 24
Figure 12: Percentage of Working Age Population claiming benefits ........................................... 25
Figure 13: Proportion of Working Age Population claiming out of work benefits 2007-2011 ........ 26
Figure 14: Average (Median) Resident and Workplace Full-Time Gross Weekly Earnings (£ per week).............................................................................................................................................. 27
Figure 15: Average (Median) Resident Full-Time Gross Weekly Earnings (£ per week) .............. 27
Figure 16: Average (Median) Workplace Full-Time Gross Weekly Earnings (£ per week) ........... 28
Figure 17: Average (Mean) Northumberland Household Income by County Ward ....................... 29
Figure 18: Households in Temporary Accommodation 2004-2011 ............................................... 30
Figure 19: Reasons for Homelessness in Northumberland 2009-11 ............................................ 31
Figure 20: Non-decent Council Homes 2009-2011 ....................................................................... 32
Figure 21: Fuel poverty 2008-2009 ................................................................................................ 33
Figure 22: Fuel poverty at Northumberland ward level .................................................................. 34
Figure 23: Average minimum travel time to reach key services by public transport/walking ........ 35
Figure 24: Accessibility to employment centres by public transport/walking ................................. 36
Figure 25: % of working age population in Northumberland with access to employment centres by public transport/walking 2007-10 ................................................................................................... 36
Figure 26: Qualifications (Jan-Dec 2010) ...................................................................................... 37
Figure 27: Pupils Gaining Five or more A* to C GCSE Grades including English and Maths 2009/10 .......................................................................................................................................... 37
Figure 28:% pupils gaining five or more GCSEs incl. English & Maths (2009/10) ........................ 38
Figure 29: 2011 NEET Figures by Local Authority Area ................................................................ 39
Figure 30: Under 18 Conception Rates 2000-10 ........................................................................... 41
Figure 31: Under 18 Conception Rates in Northumberland 2000-10 ............................................ 42
Figure 32: Life expectancy at birth 2008-10 .................................................................................. 44
Figure 33: Low birthweight births 2010 .......................................................................................... 45
Figure 34: Trends in prevalence of breastfeeding 2010-12 ........................................................... 46
Figure 35: National Child Measurement Programme, prevalence estimates for 2010/11 school year based on child’s place of residence ....................................................................................... 48
Figure 36: Notifiable Offences Recorded by the Police 2010-11 .................................................. 50
Figure 37: Notifiable Offences in Northumberland 2010-11 .......................................................... 51
Northumberland Poverty and Worklessness Assessment – 2012 Update
4
Executive Summary
The Northumberland Poverty and Worklessness Assessment – 2012 Update
This report updates the original Interim Poverty and Worklessness Assessment’ which was
published in August 2010 as part of the suite of documents that make up the
Northumberland Local Economic Assessment (LEA).
The report provided a broad spectrum of evidence, relating to child poverty and related
areas. The role of the document is to assist Northumberland County Council (NCC),
Northumberland Strategic Partnership (NSP) and the Northumberland Families and
Children’s Trust to understand the poverty and worklessness agenda in order to inform
future priorities and statutory requirements.
Related information
This report does not cover every aspect of the poverty and worklessness agenda in
Northumberland and is a gradually evolving body of work as part of a wider suite of
documents informing policy and action on this agenda.
For instance the statistics in this report will be impacted upon by the closure of Rio Tinto
Alcan’s aluminium smelter, the county’s largest private sector employer. The link in the
introduction of this report will take you to detailed reports on this subject.
Northumberland Child Poverty Action Group (NCPAG)
The data gathered for the Interim Poverty and Worklessness Assessment prompted a
number of pieces of work and activity including workshops involving various agencies across
Northumberland. This led to the Northumberland Child Poverty Action Group (NCPAG)
being established which covers many organisations and sectors across Northumberland.
The Terms of Reference of the NCPAG outline the main purpose of the group as being: ‘The
members of the Action Group will work together to better understand the range of activity
that is going on within Northumberland, across sectors, that is/will/could have an impact on
child poverty and to look at how that activity could be better co-ordinated to improve life
chances for children and families in poverty’.
Northumberland Poverty and Worklessness Assessment – 2012 Update
5
Statistical Summary
This report provides a broad evidence base that indicates the levels of poverty, deprivation
and disadvantage that exist within the County compared to the surrounding areas and
country as a whole.
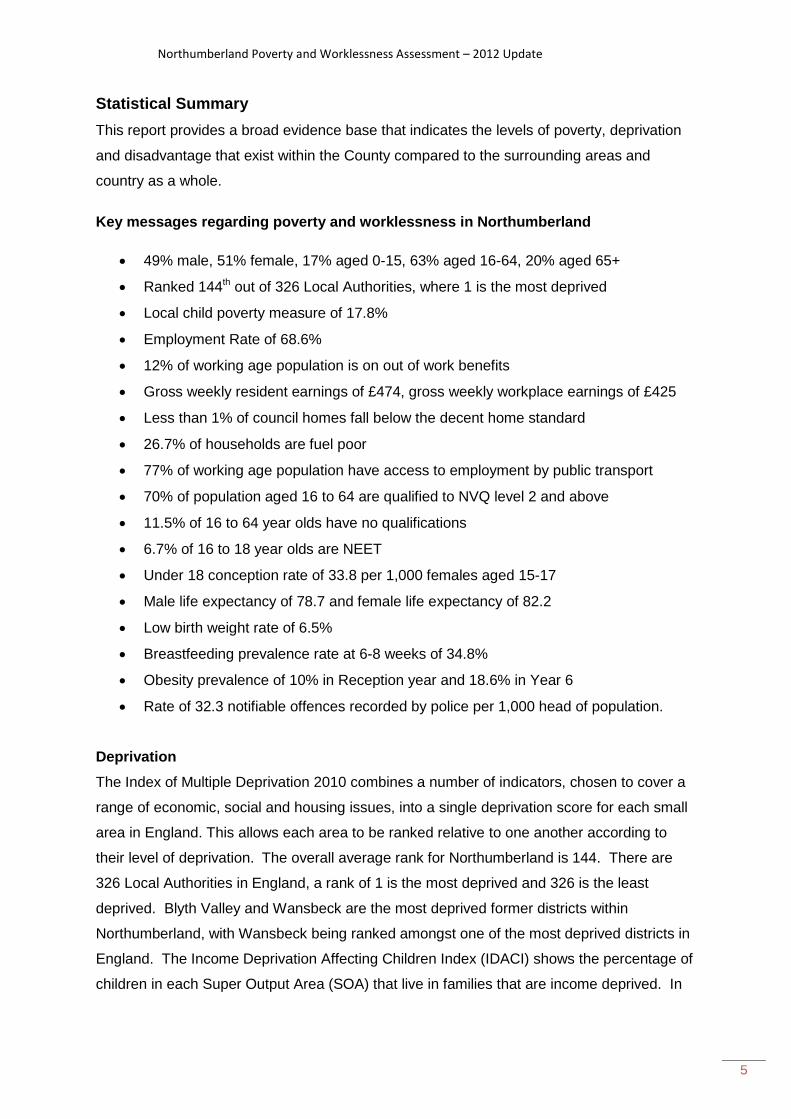
Key messages regarding poverty and worklessness in Northumberland
49% male, 51% female, 17% aged 0-15, 63% aged 16-64, 20% aged 65+
Ranked 144th out of 326 Local Authorities, where 1 is the most deprived
Local child poverty measure of 17.8%
Employment Rate of 68.6%
12% of working age population is on out of work benefits
Gross weekly resident earnings of £474, gross weekly workplace earnings of £425
Less than 1% of council homes fall below the decent home standard
26.7% of households are fuel poor
77% of working age population have access to employment by public transport
70% of population aged 16 to 64 are qualified to NVQ level 2 and above
11.5% of 16 to 64 year olds have no qualifications
6.7% of 16 to 18 year olds are NEET
Under 18 conception rate of 33.8 per 1,000 females aged 15-17
Male life expectancy of 78.7 and female life expectancy of 82.2
Low birth weight rate of 6.5%
Breastfeeding prevalence rate at 6-8 weeks of 34.8%
Obesity prevalence of 10% in Reception year and 18.6% in Year 6
Rate of 32.3 notifiable offences recorded by police per 1,000 head of population.
Deprivation
The Index of Multiple Deprivation 2010 combines a number of indicators, chosen to cover a
range of economic, social and housing issues, into a single deprivation score for each small
area in England. This allows each area to be ranked relative to one another according to
their level of deprivation. The overall average rank for Northumberland is 144. There are
326 Local Authorities in England, a rank of 1 is the most deprived and 326 is the least
deprived. Blyth Valley and Wansbeck are the most deprived former districts within
Northumberland, with Wansbeck being ranked amongst one of the most deprived districts in
England. The Income Deprivation Affecting Children Index (IDACI) shows the percentage of
children in each Super Output Area (SOA) that live in families that are income deprived. In

Northumberland Poverty and Worklessness Assessment – 2012 Update
6
Northumberland, 9 SOAs are ranked within the 10% most deprived in the country, 7 of these
are within the former Wansbeck district.
Northumberland had the lowest proportion of children living in families in receipt of out of
work benefits in the North East region in both 2009 (19%) and 2010 (18.9%). The latest
local child poverty measure (defined as the proportion of children living in families in receipt
of out of work benefits or in receipt of tax credits where their income is less than 60% of
median income) for Northumberland is 17.8% (equal to approximately 9,381 dependent
children under 16). The County-wide figure masks extreme variances at a more local level –
ranging from 1% in the Ponteland South area to 57.6% in the Croft area of Blyth Valley.
Childcare
Provision for childcare is a key contribution to successful entry into the labour market and
sustained employment opportunities. Within Northumberland the proportion of take-up by
low-income working families ranges from less than 5% in parts of Tynedale, Castle Morpeth
and Berwick-upon-Tweed to 40% in other parts of Tynedale. For 2009/10 Northumberland’s
overall take-up was less than the regional and national average (16%).
Employment
Northumberland has a higher employment rate than the North Eastern LEP and the region,
but lower, on average than England. Most recently Northumberland had an employment
rate of 68.6%, the lowest it has been in over 5 years. Proportionately the North East (16%)
and LEP (15%) areas have higher out of work related benefit claimants than England (13%)
as a whole. Northumberland overall tends to reflect the national trends for out of work
related benefit claimants (around 13%) however lower level discrepancies exist, for example
the former district of Wansbeck most recently had 18% of its’ working age population
claiming these benefits. In the last 5 years, Northumberland has showed a 57% increase
in JSA claimant numbers (based on August 2011 and August 2006 figures), for England the
increase was 64%, for the North East and the LEP this was 72%. The number of 16-24 year
olds claiming DWP working age benefits was 26% higher in Northumberland in 2011 than
2006 (32% higher for England, 29% for the North East region and 30% for the LEP).
Earnings
Residents’ weekly earnings (£474) in Northumberland are higher than local workplace
weekly earnings (£425) in the County. The former Tynedale District has the largest
difference of £198. Northumberland’s resident’s earnings are higher than the North East
average (£451) but lower than England (£508). Northumberland’s workplace earnings are

Northumberland Poverty and Worklessness Assessment – 2012 Update
7
much lower than both the regional (£452) and national (£507) averages. Below County level
the differences are much more striking. Berwick-upon-Tweed for example has average
resident full-time gross weekly earnings of just £386 and workplace earnings of £381.
Housing
People making applications to the Northumberland Housing Options and Homelessness
Service remained around 900 for 2009/11. During that period there was a 7% increase in
the number of homelessness acceptances and around a 10% decrease in successful
homeless preventions. The main causes in Northumberland for those accepted as
statutorily homeless during this time were relationship breakdown due to domestic violence,
loss of private rented accommodation and parent eviction. Local authority stock conditions
are generally good in Northumberland and almost all properties now meet the decent homes
standard.
Fuel Poverty
BRE’s latest fuel poverty estimates place Northumberland highest in the region for
proportion of households in fuel poverty (27%), substantially higher than the regional (24%)
and national (18%) average and a marked increase on the previous years’ figures (24%).
Below County level, the proportion of households estimated to be fuel poor range from 55%
in the Bamburgh area to 8% in Cramlington North.
Accessibility
Northumberland has the longest travel times to key services (15 minutes) and the lowest
overall proportion of users able to access employment centres by public transport/walking
(77%) compared with the rest of the North East area (12 minutes and 81%) and England as
a whole (14 minutes and 82%).
Skills
Just over 70% of Northumberland’s population aged 16-64 are qualified to NVQ level 2 and
above, this is a higher proportion than the North Eastern LEP area average (66%), the North
East region (66%) and England (67%). Northumberland has a slightly higher proportion of
people aged 16 to 64 with no qualifications (12%) than England (11%) but lower than the
North Eastern LEP and North East areas (13%). Northumberland’s latest figure for young
people Not in Education, Employment of Training (NEET) of 6.7% is one of the lowest in the
North East area (second only to North Tyneside at 6.2%) and has been classed as “the best
comparative position for our young people yet achieved”. The North East’s latest NEET
figure is 8.8%, England’s is 6.1%.
Northumberland Poverty and Worklessness Assessment – 2012 Update
8
Health
The under-18 conception rate is a national measure of child poverty and one of the three
sexual health indicators in the Public Health Outcomes Framework. Northumberland’s
under-18 conception rate has consistently remained the lowest in the North East area for the
last 10 years, most recently falling to 33.8 conceptions per 1,000 girls aged 15-17. Latest
figures released show England’s overall rate at 35.4. The North East has the highest rate in
the Country (44.3) the lowest is the South East (28.3). The County figures mask large
differences at more local level. The former district of Wansbeck has shown the highest
rates, with an average over the last 10 years of 57.4.
Children born into low-income households are more likely to experience health problems
from birth and accumulate health risks as they grow older. Life expectancy at birth for males
in Northumberland (78.7) is close to the England average (78.6) and the longest in the North
East (average 77.2). Life expectancy for females (82.2) is slightly less than the England
average (82.6) but the longest in the North East (average 81.2). Life expectancy is 9.7 years
lower for men and 6.4 years lower for women in the most deprived areas of Northumberland
than in the least deprived areas.
Managing on a low income has a negative impact on maternal health and health-related
behaviours. Infant mortality is higher amongst children born into poverty, who are more likely
to be born early and have low birth weight. Northumberland has one of the lowest low birth
weight rates in the North East area at 6.5% of all live and still births. Both the regional
(7.6%) and national (7.3%) averages are higher. A number of studies demonstrate that
infants born into low-income households are less likely to be breastfed. Most recently the
North East average rate of breastfeeding at 6-8 weeks was 30.1% compared to a
Northumberland rate of 34.8%. The England average was substantially higher at 46.9%.
Obesity affects people’s health, their lives and the lives of their families, and it places a large
financial burden on the NHS and the wider economy. The National Child Measurement
Programme is an annual programme to measure the height and weight of all children in
Reception and Year 6. In Reception year Northumberland has an overall obesity prevalence
of 10%, which is slightly higher than the North East (9.9%) and England (9.4%) averages. In
Year 6 Northumberland has a prevalence of 18.6% compared to a North East prevalence of
21.4% and an England average of 19%.
Northumberland Poverty and Worklessness Assessment – 2012 Update
9
Crime
There are differing views in research over whether crime can be considered a product of
childhood poverty, however there are higher victim and fear of crime rates among those
living in disadvantaged areas. The most recent figures from the Home Office show that
Northumberland has one of the lowest rate of offences per 1,000 head of population in the
North East area (32.3), compared with 49.3 for the North East and 61 for England as a
whole. Below County level, the former district of Wansbeck displays a higher rate of 50
notifiable offences per 1,000 head of population.
Northumberland Poverty and Worklessness Assessment – 2012 Update
10
1.0 Introduction
1.1 Background
This report updates the original Interim Poverty and Worklessness Assessment’ which was
published in August 2010 as part of the suite of documents that make up the
Northumberland Local Economic Assessment (LEA). The report provided a broad spectrum
of evidence, relating to child poverty and related areas. The role of the document is to assist
Northumberland County Council (NCC), Northumberland Strategic Partnership (NSP) and
the Northumberland Families and Children’s Trust to understand the poverty and
worklessness agenda in order to inform future priorities and statutory requirements.
1.2 National Context
The Governments Child Poverty Strategy ‘A New Approach to Child Poverty: Tackling the
Causes of Disadvantage and Transforming Families’ Lives’ was published in April 2011 and
set out a number of principles:-
A stronger focus on ensuring that families who are in work are supported to work
themselves out of poverty, families who are unable to work are able to live with
dignity and not entrenched in persistent poverty, and that those who can work but are
not in work are provided with services that will address their particular needs and
help them overcome barriers to work.
A stronger focus on improving children’s future life chances, by intervening early to
improve the development and attainment of disadvantaged children and young
people throughout their progression to adulthood.
A stronger focus on place and delivering services as close to the family as possible,
by empowering local partners and ensuring that local diversity can be recognised,
and developing strong local accountability frameworks.
Defining Poverty
Poverty has traditionally been an issue that has proved difficult to define and there are
varying interpretations in national literature. One of the most widely used definitions is from
Child Poverty Action, the leading national charity working to end poverty among children,
Northumberland Poverty and Worklessness Assessment – 2012 Update
11
young people and families in the UK. The Group (CPAG) uses the following definition to
describe what we mean by poverty:
“Individuals, families and groups in the population can be said to be in poverty when they
lack resources to obtain the type of diet, participate in the activities and have the living
conditions and amenities which are customary, or at least widely encouraged and approved,
in the societies in which they belong.”
(Townsend, P. Poverty in the United Kingdom, Allen Lane, 1979)
1.3 Northumberland Child Poverty Action Group (NCPAG)
The data gathered for the Interim Poverty and Worklessness Assessment prompted a
number of pieces of work and activity including workshops involving various agencies across
Northumberland. This led to the Northumberland Child Poverty Action Group (NCPAG)
being established which covers many organisations and sectors across Northumberland. Its
Terms of Reference outlines its main purpose as ‘The members of the Action Group will
work together to better understand the range of activity that is going on within
Northumberland, across sectors, that is/will/could have an impact on child poverty and to
look at how that activity could be better co-ordinated to improve life chances for children and
families in poverty’.
Previously, guidelines were provided for what Government felt should be included in a Child
Poverty Needs Assessment, a statutory duty on Local Authorities. These guidelines were
abolished with the publication of the Government’s child poverty strategy. Local Authorities
are still however required to publish relevant information, in whatever format is most
appropriate. In order to inform and facilitate evaluation of NCPAG activity it is important to
update and understand the broad evidence base that indicates the levels of poverty,
deprivation and disadvantage that exist within the County, the surrounding areas and
country as a whole.
Related information
This report does not cover every aspect of the poverty and worklessness agenda in
Northumberland and is a gradually evolving body of work as part of a wider suite of
documents informing policy and action on this agenda. For instance the statistics in this
report will be impacted upon by the closure of Rio Tinto Alcan’s aluminium smelter, the
county’s largest private sector employer. The links in the overleaf will take you to detailed
Northumberland Poverty and Worklessness Assessment – 2012 Update
12
reports on this subject and the wider suite of plans and research that sit alongside this
report.
Children and Young People’s Plan -
http://www.northumberland.gov.uk/idoc.ashx?docid=eb93bccc-fa98-431a-8be0-
a2aebbe85566&version=-1
Joint Strategic Needs Assessment - Joint Strategic Needs Assessment - JSNA
Northumberland Local Economic Assessment reports including:
o Northumberland Economic Assessment Statistical Update 2012
o Economic Scenario’s for Northumberland (including Broadband infrastructure
scenarios)
o Economic Scenario’s for Northumberland – Low Carbon Scenarios Report
o Alcan Economic Indicators Executive Summary and Report
o Alcan Closure Economic Impacts Report
This link will take you to the reports: Economic Research and Statistics
Other Infonet reports - Research & statistics (infonet)
‘Know Northumberland’ Quarterly Statistical Bulletin
1.4 Next Steps
A successful Child Poverty conference was hosted by NCC Children’s Services in March
2012, which brought together a significant number of people involved in this area of work.
There was an agreement to progress with a ‘Tackling Poverty Together’ strategy and action
plan. This document will be launched later in 2012.
Northumberland Poverty and Worklessness Assessment – 2012 Update
13
2.0 Children in Northumberland
In 2010 there were 52,773 people aged 0-15 living in Northumberland which accounts for
17% of the total population of the County. This is lower than the percentage living in the
North East (17.6%) and England (18.7%).
There are more males aged 0-15 than females – 27,125 (51%) as opposed to 25,608
(49%).
Since 2004 the population aged 0-15 has decreased by 5.8% from 56,043.
The population of people aged 0-15 is set to stagnate between 2010 and 2033 staying at
around 53,000. This shows a different pattern to the total population over the same
period which shows an increase of 8.5% and the change in children’s population at a
North East and England level which both display a growth of 4.9% and 12.5%
respectively.
At a local level (LSOA) the percentage of the total population aged 0-15 ranges from
31.4% in Newsham in Blyth to 5.6% in North Berwick.
In general the higher percentages of people aged 0-15 tend to be in the more urban
parts of the county such as Blyth, Cramlington and Bedlington.
The lowest percentages appear to be in more rural parts – Wooler, Rothbury and
Warkworth areas, but also some urban areas such as the South East of Cramlington.
3.0 The Index of Deprivation 2010
The English Indices of Deprivation (ID) 2010 replaces the Indices of Deprivation 2007 as the
government’s official measure of deprivation in England, it provides a relative ranking of
areas across England according to their level of deprivation. There are 326 Local Authorities
in England therefore the Local Authority with a rank of 1 is the most deprived and 326 is the
least deprived for all Local Authority measures. The overall average rank for
Northumberland is 144.
Blyth Valley and Wansbeck are the most deprived former districts within Northumberland,
with Wansbeck being ranked amongst one of the most deprived districts in England.
There are 16 Super Output Areas (SOA’s) within Northumberland that are ranked amongst
the 10% most deprived SOA’s in England, these are within the following South East
Northumberland Wards:
Northumberland Poverty and Worklessness Assessment – 2012 Update
14
Croft Hirst
College Seaton with Newbiggin West
Cramlington West Newbiggin Central and East
Ashington Central Cowpen
Kitty Brewster Newsham
Bedlington Central
8% (25,198) of the population of Northumberland (Mid 2009 estimates) live in areas in the
10% most deprived nationally, of those 21% (5,324) are between the ages of 0-15. 10% of
all Northumberland’s 0-15 year olds live in the 10% most deprived SOA’s in England.
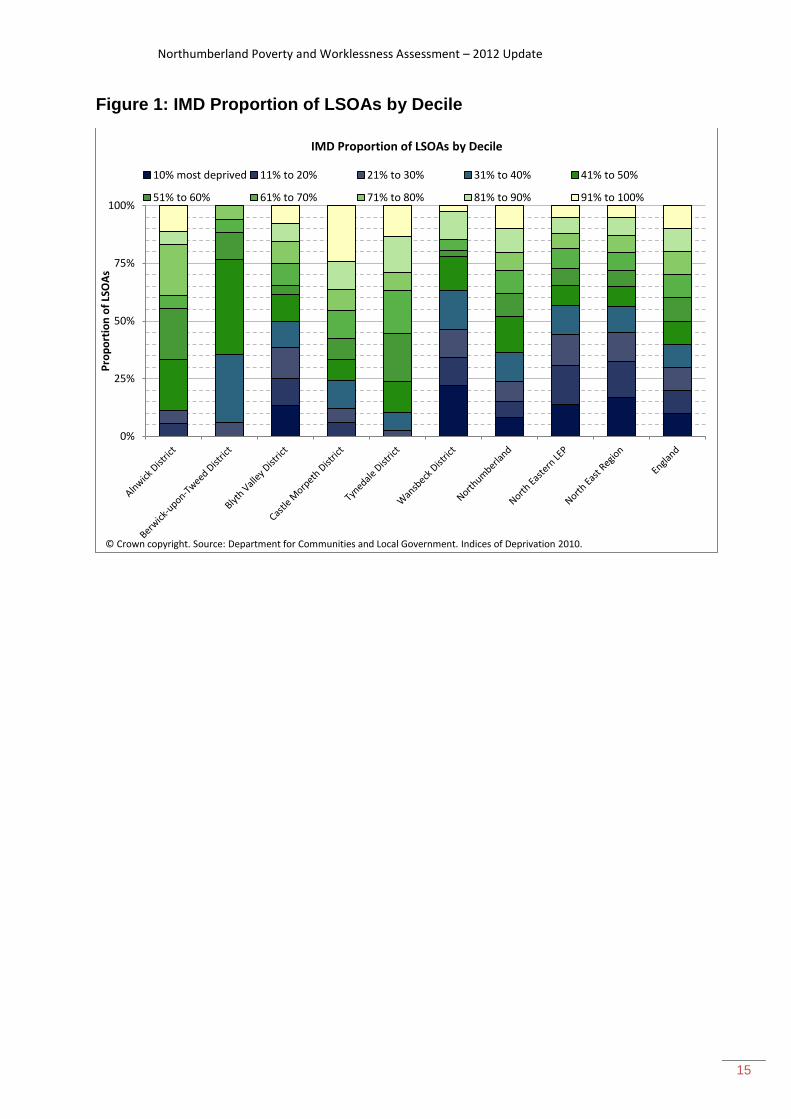
The following figures illustrate the findings of IMD 2010 for Northumberland and shows the
concentrations of most deprivation in dark blue.
Figure 1 shows that Northumberland has a fairly even number of LSOAs in each decile of
the IMD ranging from the most deprived to least deprived nationally, whereas the North East
Region and the North Eastern LEP have higher proportions of LSOAs in the most deprived
deciles of the IMD.
Below Northumberland level the distribution is rather different. The former Wansbeck
District has a high proportion of LSOAs in the most deprived deciles of the IMD nationally, a
higher proportion than Northumberland as a whole and the North East Region and the North
Eastern LEP. The former Blyth Valley District also has a high proportion of LSOAs in the
most deprived deciles of the IMD in comparison to Northumberland while the other four
former districts have higher proportions of LSOAs in the least deprived deciles nationally,
most notably Alnwick, Castle Morpeth and Tynedale.
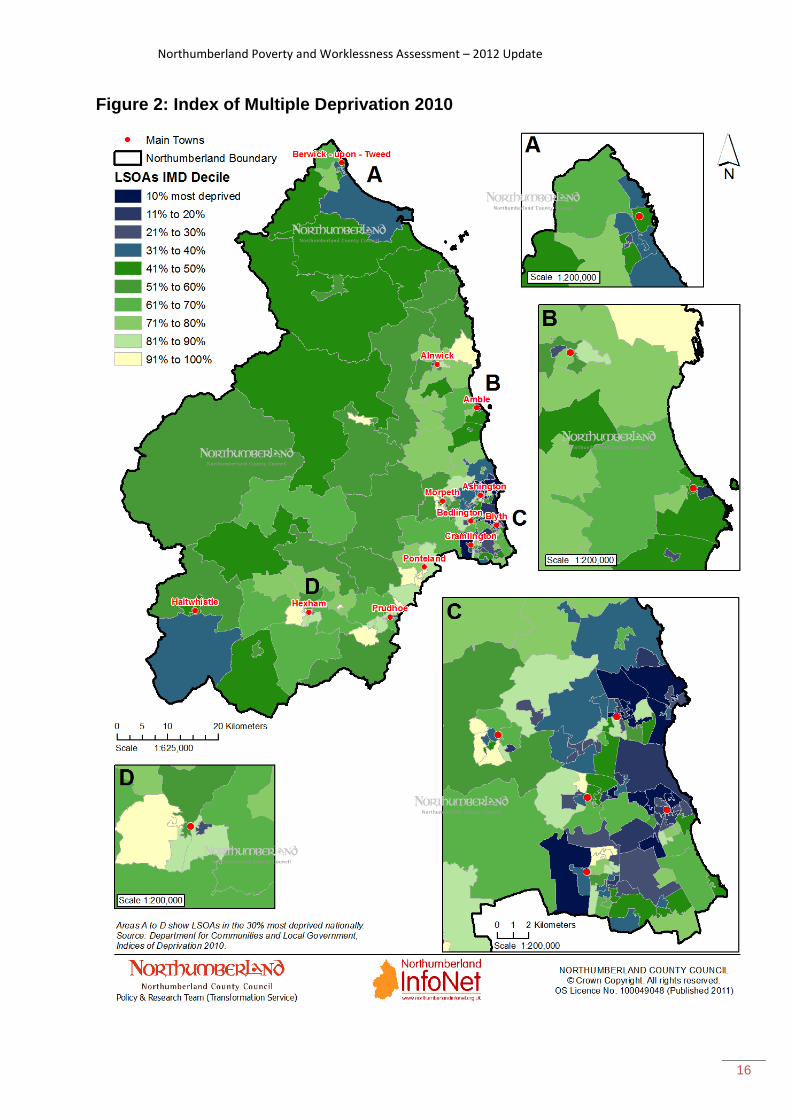
Figure 2 shows that in terms of overall deprivation LSOAs falling into the most deprived
deciles of the IMD in Northumberland are concentrated in the South East corner of the
county. The more rural areas of Northumberland in the North and West of the county
generally have lower levels of deprivation with the areas surrounding towns often being more
deprived than the most rural areas of Northumberland.
Northumberland Poverty and Worklessness Assessment – 2012 Update
15
Figure 1: IMD Proportion of LSOAs by Decile
0%
25%
50%
75%
100%
Pro
po
rtio
n o
f LS
OA
s
IMD Proportion of LSOAs by Decile
10% most deprived 11% to 20% 21% to 30% 31% to 40% 41% to 50%
51% to 60% 61% to 70% 71% to 80% 81% to 90% 91% to 100%
© Crown copyright. Source: Department for Communities and Local Government. Indices of Deprivation 2010.
Northumberland Poverty and Worklessness Assessment – 2012 Update
16
Figure 2: Index of Multiple Deprivation 2010
Northumberland Poverty and Worklessness Assessment – 2012 Update
17
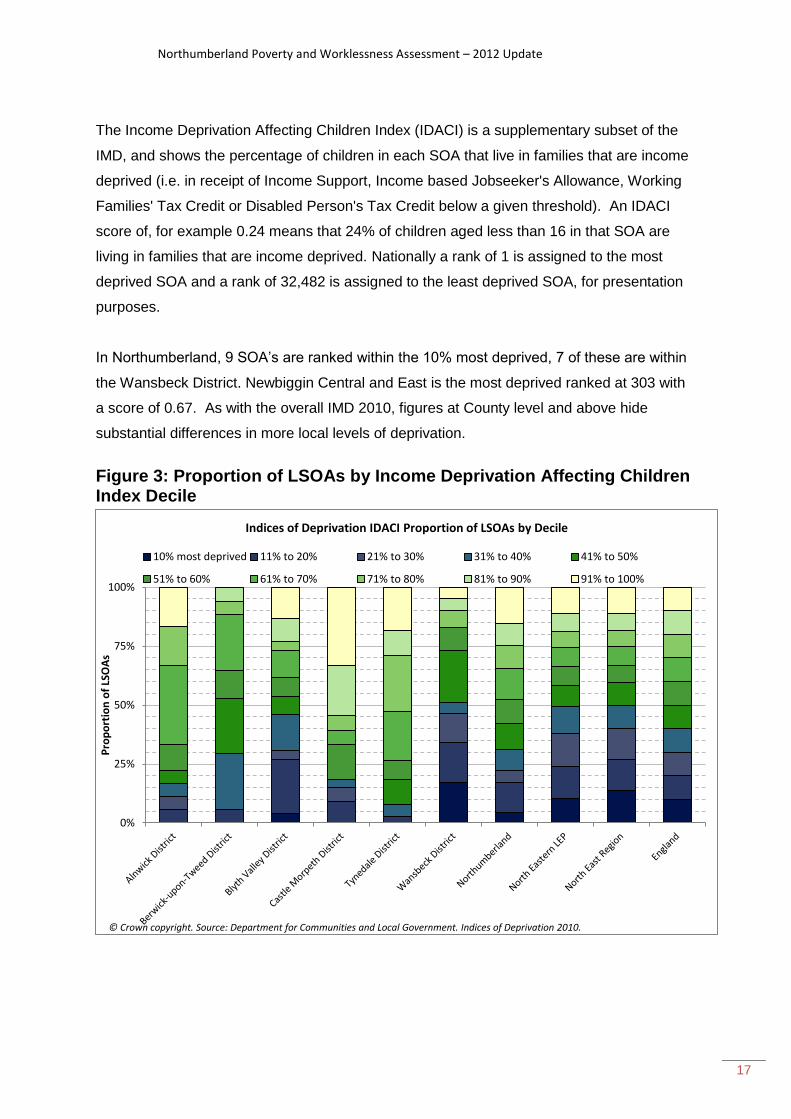
The Income Deprivation Affecting Children Index (IDACI) is a supplementary subset of the
IMD, and shows the percentage of children in each SOA that live in families that are income
deprived (i.e. in receipt of Income Support, Income based Jobseeker's Allowance, Working
Families' Tax Credit or Disabled Person's Tax Credit below a given threshold). An IDACI
score of, for example 0.24 means that 24% of children aged less than 16 in that SOA are
living in families that are income deprived. Nationally a rank of 1 is assigned to the most
deprived SOA and a rank of 32,482 is assigned to the least deprived SOA, for presentation
purposes.
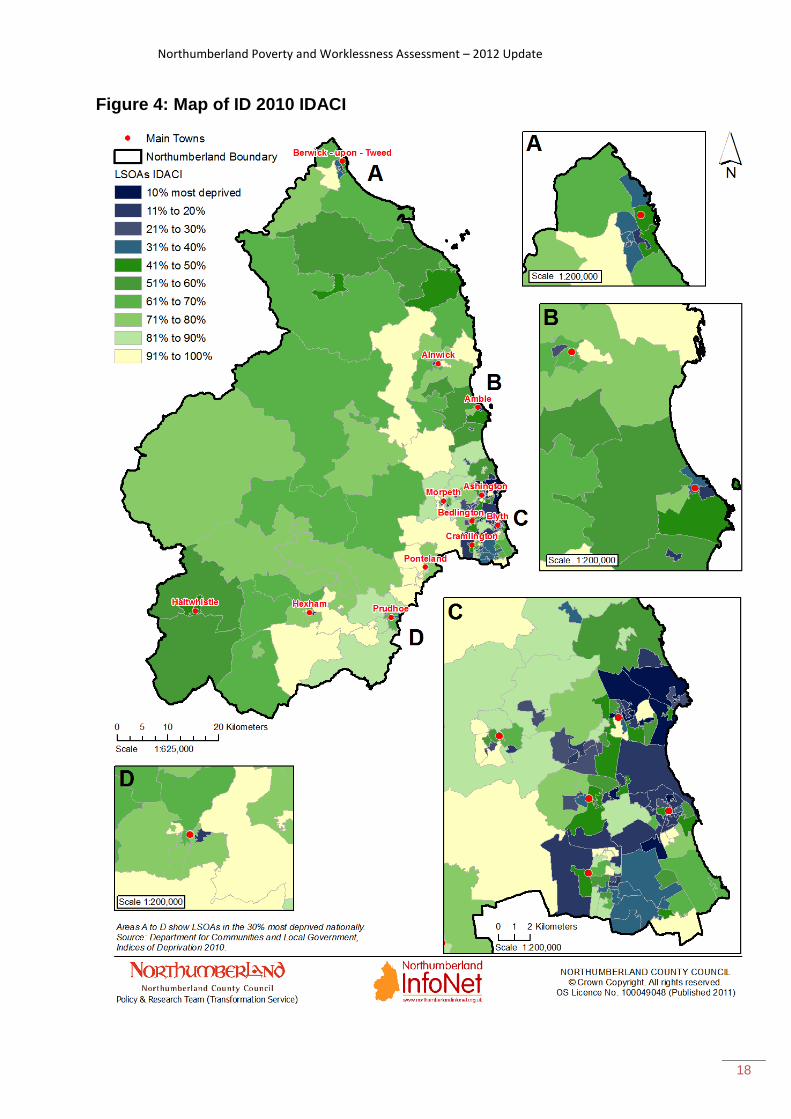
In Northumberland, 9 SOA’s are ranked within the 10% most deprived, 7 of these are within
the Wansbeck District. Newbiggin Central and East is the most deprived ranked at 303 with
a score of 0.67. As with the overall IMD 2010, figures at County level and above hide
substantial differences in more local levels of deprivation.
Figure 3: Proportion of LSOAs by Income Deprivation Affecting Children Index Decile
0%
25%
50%
75%
100%
Pro
po
rtio
n o
f LS
OA
s
Indices of Deprivation IDACI Proportion of LSOAs by Decile
10% most deprived 11% to 20% 21% to 30% 31% to 40% 41% to 50%
51% to 60% 61% to 70% 71% to 80% 81% to 90% 91% to 100%
© Crown copyright. Source: Department for Communities and Local Government. Indices of Deprivation 2010.
Northumberland Poverty and Worklessness Assessment – 2012 Update
18
Figure 4: Map of ID 2010 IDACI

Northumberland Poverty and Worklessness Assessment – 2012 Update
19
4.0 Child Poverty
There are currently two local child poverty measures which estimate the number and
proportion of children in low income poverty in each local authority.
1. The local child poverty proxy measure (formerly NI 116 proxy measure) is defined as
the proportion of children living in families in receipt of out of work benefits and covers
children aged 0-15 years.
The following table shows snapshots at May 2009 and 2010.
Figure 5: Local child poverty proxy measure 2009 and 2010
Children living in families in receipt of out-of-work benefits as
at May 2009
Children living in families in receipt of out of work benefits as
at May 2010
Number Proportion (%) Number Proportion (%)
ENGLAND 2,028,170 22.3% 2,025,360 22.1%
NORTH EAST 117,940 26.2% 117,050 26.2%
County Durham 22,360 25.3% 21,980 24.9%
Darlington 4,390 22.7% 4,320 22.3%
Gateshead 8,680 25.8% 8,500 25.3%
Hartlepool 5,530 30.6% 5,630 31.3%
Middlesbrough 9,440 34.3% 9,580 34.6%
Newcastle upon Tyne 13,630 29.9% 13,400 29.1%
North Tyneside 7,420 21.3% 7,320 20.9%
Northumberland 10,070 19.0% 9,960 18.9%
Redcar and Cleveland 6,820 27.2% 6,730 27.2%
South Tyneside 7,650 28.9% 7,600 28.8%
Stockton-on-Tees 8,350 22.4% 8,490 22.8%
Sunderland 13,600 27.5% 13,540 27.7%
Northumberland had the lowest proportion of children living in families in receipt of out of
work benefits in the North East region in both snapshots – 2009 and 2010, however in
numerical terms, Northumberland had the fourth largest number of children in this proxy
measure. Note the fall in number and proportion throughout most of the North East between
2009 and 2010.
2. The revised local child poverty measure (formerly NI 116) is defined as the proportion of
children living in families in receipt of out of work (means-tested) benefits or in receipt of tax
credits where their reported income is less than 60 per cent of median income. Data is
published annually and the latest data is for 2009. The following table shows how
Northumberland compares regionally and nationally:
Northumberland Poverty and Worklessness Assessment – 2012 Update
20
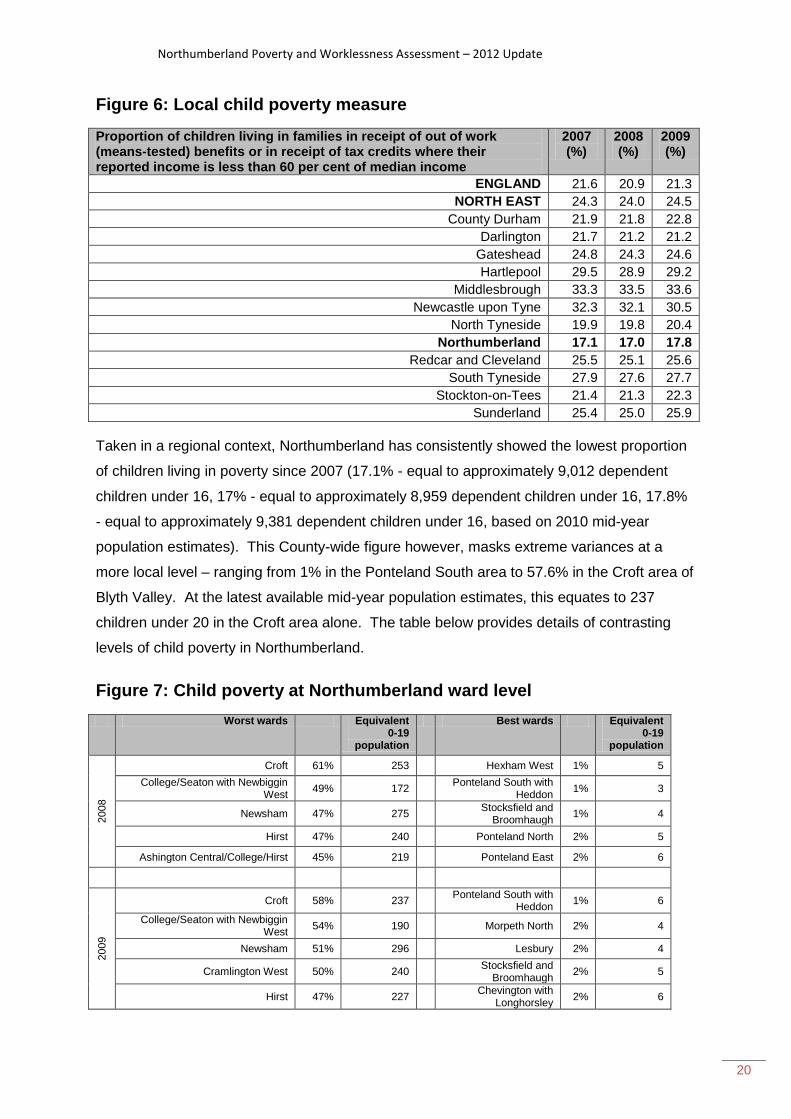
Figure 6: Local child poverty measure
Proportion of children living in families in receipt of out of work (means-tested) benefits or in receipt of tax credits where their reported income is less than 60 per cent of median income
2007 (%)
2008 (%)
2009 (%)
ENGLAND 21.6 20.9 21.3
NORTH EAST 24.3 24.0 24.5
County Durham 21.9 21.8 22.8
Darlington 21.7 21.2 21.2
Gateshead 24.8 24.3 24.6
Hartlepool 29.5 28.9 29.2
Middlesbrough 33.3 33.5 33.6
Newcastle upon Tyne 32.3 32.1 30.5
North Tyneside 19.9 19.8 20.4
Northumberland 17.1 17.0 17.8
Redcar and Cleveland 25.5 25.1 25.6
South Tyneside 27.9 27.6 27.7
Stockton-on-Tees 21.4 21.3 22.3
Sunderland 25.4 25.0 25.9
Taken in a regional context, Northumberland has consistently showed the lowest proportion
of children living in poverty since 2007 (17.1% - equal to approximately 9,012 dependent
children under 16, 17% - equal to approximately 8,959 dependent children under 16, 17.8%
- equal to approximately 9,381 dependent children under 16, based on 2010 mid-year
population estimates). This County-wide figure however, masks extreme variances at a
more local level – ranging from 1% in the Ponteland South area to 57.6% in the Croft area of
Blyth Valley. At the latest available mid-year population estimates, this equates to 237
children under 20 in the Croft area alone. The table below provides details of contrasting
levels of child poverty in Northumberland.
Figure 7: Child poverty at Northumberland ward level
Worst wards Equivalent 0-19
population
Best wards Equivalent 0-19
population
2008
Croft 61% 253 Hexham West 1% 5
College/Seaton with Newbiggin West
49% 172 Ponteland South with
Heddon 1% 3
Newsham 47% 275 Stocksfield and
Broomhaugh 1% 4
Hirst 47% 240 Ponteland North 2% 5
Ashington Central/College/Hirst 45% 219 Ponteland East 2% 6
2009
Croft 58% 237 Ponteland South with
Heddon 1% 6
College/Seaton with Newbiggin West
54% 190 Morpeth North 2% 4
Newsham 51% 296 Lesbury 2% 4
Cramlington West 50% 240 Stocksfield and
Broomhaugh 2% 5
Hirst 47% 227 Chevington with
Longhorsley 2% 6
Northumberland Poverty and Worklessness Assessment – 2012 Update
21
Across the North East there was a 0.5% increase in this child poverty measure between
2008 and 2009. In Northumberland the largest increase was in the Seghill area of Blyth
Valley which increased from 21.7% to 29.7%. The largest decrease was in the Elizabeth
area of Berwick upon Tweed which decreased by 5.6% to 12%.
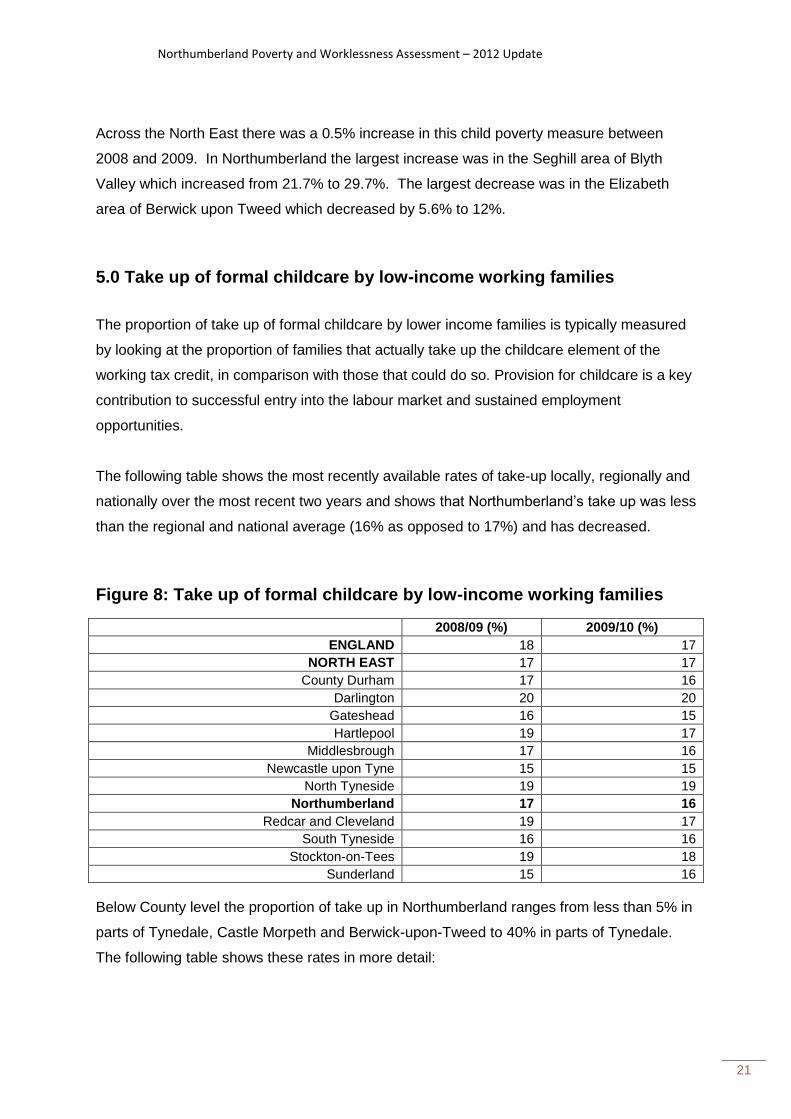
5.0 Take up of formal childcare by low-income working families
The proportion of take up of formal childcare by lower income families is typically measured
by looking at the proportion of families that actually take up the childcare element of the
working tax credit, in comparison with those that could do so. Provision for childcare is a key
contribution to successful entry into the labour market and sustained employment
opportunities.
The following table shows the most recently available rates of take-up locally, regionally and
nationally over the most recent two years and shows that Northumberland’s take up was less
than the regional and national average (16% as opposed to 17%) and has decreased.
Figure 8: Take up of formal childcare by low-income working families
2008/09 (%) 2009/10 (%)
ENGLAND 18 17
NORTH EAST 17 17
County Durham 17 16
Darlington 20 20
Gateshead 16 15
Hartlepool 19 17
Middlesbrough 17 16
Newcastle upon Tyne 15 15
North Tyneside 19 19
Northumberland 17 16
Redcar and Cleveland 19 17
South Tyneside 16 16
Stockton-on-Tees 19 18
Sunderland 15 16
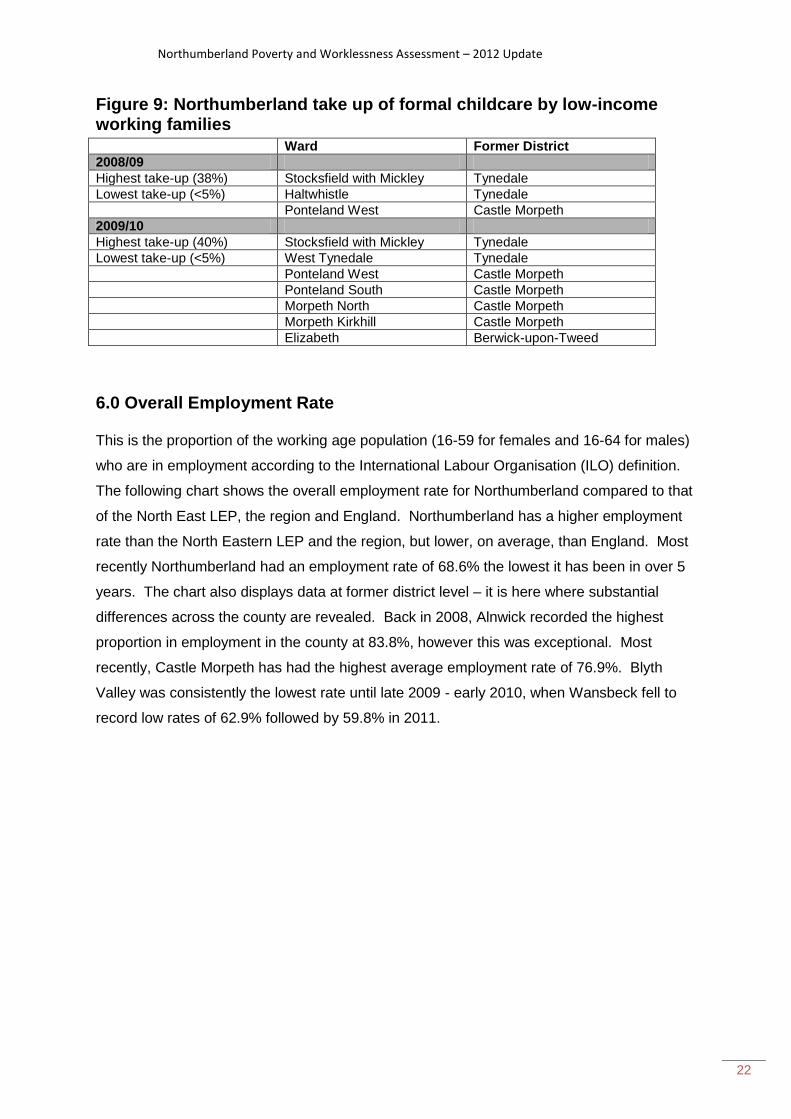
Below County level the proportion of take up in Northumberland ranges from less than 5% in
parts of Tynedale, Castle Morpeth and Berwick-upon-Tweed to 40% in parts of Tynedale.
The following table shows these rates in more detail:
Northumberland Poverty and Worklessness Assessment – 2012 Update
22
Figure 9: Northumberland take up of formal childcare by low-income working families
Ward Former District
2008/09
Highest take-up (38%) Stocksfield with Mickley Tynedale
Lowest take-up (<5%) Haltwhistle Tynedale
Ponteland West Castle Morpeth
2009/10
Highest take-up (40%) Stocksfield with Mickley Tynedale
Lowest take-up (<5%) West Tynedale Tynedale
Ponteland West Castle Morpeth
Ponteland South Castle Morpeth
Morpeth North Castle Morpeth
Morpeth Kirkhill Castle Morpeth
Elizabeth Berwick-upon-Tweed
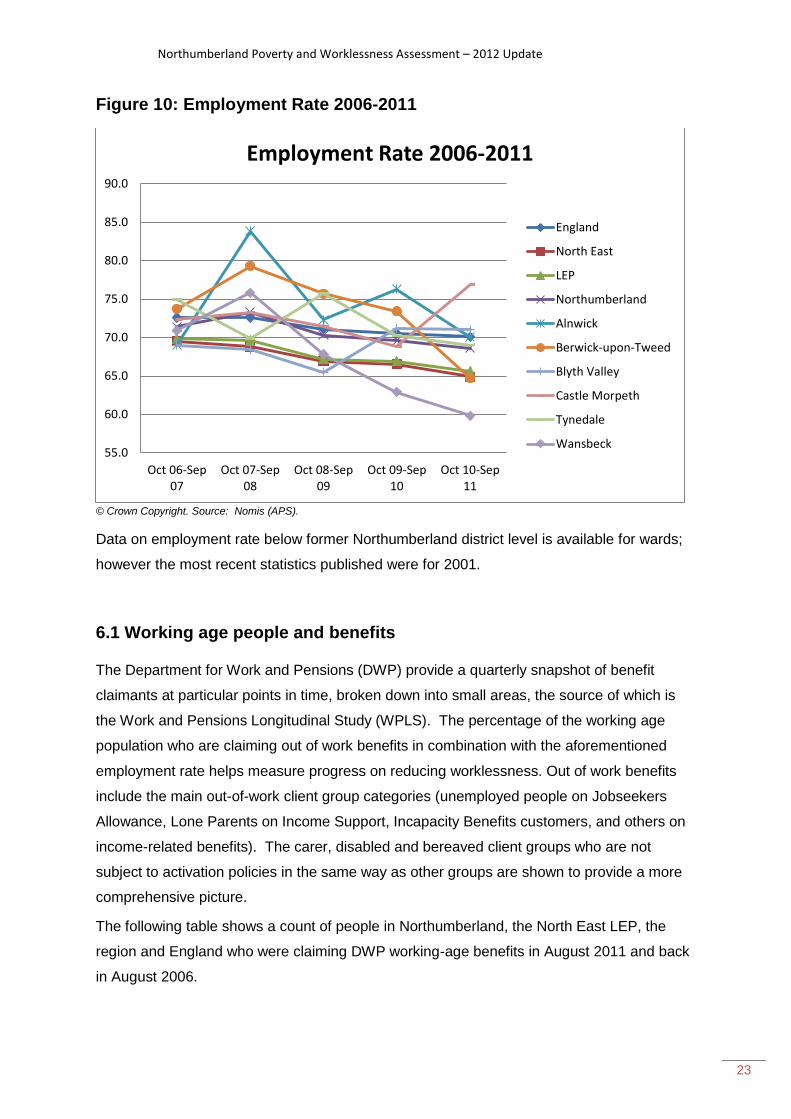
6.0 Overall Employment Rate
This is the proportion of the working age population (16-59 for females and 16-64 for males)
who are in employment according to the International Labour Organisation (ILO) definition.
The following chart shows the overall employment rate for Northumberland compared to that
of the North East LEP, the region and England. Northumberland has a higher employment
rate than the North Eastern LEP and the region, but lower, on average, than England. Most
recently Northumberland had an employment rate of 68.6% the lowest it has been in over 5
years. The chart also displays data at former district level – it is here where substantial
differences across the county are revealed. Back in 2008, Alnwick recorded the highest
proportion in employment in the county at 83.8%, however this was exceptional. Most
recently, Castle Morpeth has had the highest average employment rate of 76.9%. Blyth
Valley was consistently the lowest rate until late 2009 - early 2010, when Wansbeck fell to
record low rates of 62.9% followed by 59.8% in 2011.
Northumberland Poverty and Worklessness Assessment – 2012 Update
23
Figure 10: Employment Rate 2006-2011
© Crown Copyright. Source: Nomis (APS).
Data on employment rate below former Northumberland district level is available for wards;
however the most recent statistics published were for 2001.
6.1 Working age people and benefits
The Department for Work and Pensions (DWP) provide a quarterly snapshot of benefit
claimants at particular points in time, broken down into small areas, the source of which is
the Work and Pensions Longitudinal Study (WPLS). The percentage of the working age
population who are claiming out of work benefits in combination with the aforementioned
employment rate helps measure progress on reducing worklessness. Out of work benefits
include the main out-of-work client group categories (unemployed people on Jobseekers
Allowance, Lone Parents on Income Support, Incapacity Benefits customers, and others on
income-related benefits). The carer, disabled and bereaved client groups who are not
subject to activation policies in the same way as other groups are shown to provide a more
comprehensive picture.
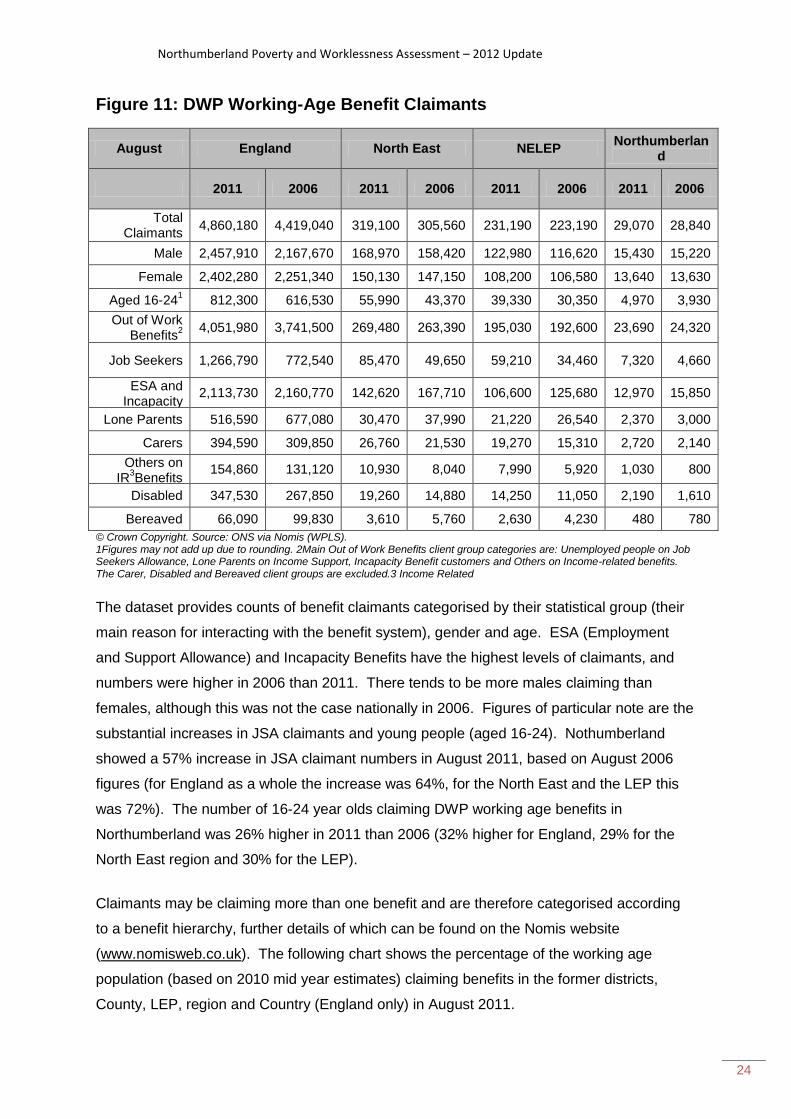
The following table shows a count of people in Northumberland, the North East LEP, the
region and England who were claiming DWP working-age benefits in August 2011 and back
in August 2006.
55.0
60.0
65.0
70.0
75.0
80.0
85.0
90.0
Oct 06-Sep07
Oct 07-Sep08
Oct 08-Sep09
Oct 09-Sep10
Oct 10-Sep11
Employment Rate 2006-2011
England
North East
LEP
Northumberland
Alnwick
Berwick-upon-Tweed
Blyth Valley
Castle Morpeth
Tynedale
Wansbeck
Northumberland Poverty and Worklessness Assessment – 2012 Update
24
Figure 11: DWP Working-Age Benefit Claimants
August England North East NELEP Northumberlan
d
2011 2006 2011 2006 2011 2006 2011 2006
Total Claimants
4,860,180 4,419,040 319,100 305,560 231,190 223,190 29,070 28,840
Male 2,457,910 2,167,670 168,970 158,420 122,980 116,620 15,430 15,220
Female 2,402,280 2,251,340 150,130 147,150 108,200 106,580 13,640 13,630
Aged 16-241 812,300 616,530 55,990 43,370 39,330 30,350 4,970 3,930
Out of Work Benefits
2
4,051,980 3,741,500 269,480 263,390 195,030 192,600 23,690 24,320
Job Seekers 1,266,790 772,540 85,470 49,650 59,210 34,460 7,320 4,660
ESA and Incapacity
Benefits
2,113,730 2,160,770 142,620 167,710 106,600 125,680 12,970 15,850
Lone Parents 516,590 677,080 30,470 37,990 21,220 26,540 2,370 3,000
Carers 394,590 309,850 26,760 21,530 19,270 15,310 2,720 2,140
Others on IR
3Benefits
154,860 131,120 10,930 8,040 7,990 5,920 1,030 800
Disabled 347,530 267,850 19,260 14,880 14,250 11,050 2,190 1,610
Bereaved 66,090 99,830 3,610 5,760 2,630 4,230 480 780
© Crown Copyright. Source: ONS via Nomis (WPLS). 1Figures may not add up due to rounding. 2Main Out of Work Benefits client group categories are: Unemployed people on Job Seekers Allowance, Lone Parents on Income Support, Incapacity Benefit customers and Others on Income-related benefits. The Carer, Disabled and Bereaved client groups are excluded.3 Income Related
The dataset provides counts of benefit claimants categorised by their statistical group (their
main reason for interacting with the benefit system), gender and age. ESA (Employment
and Support Allowance) and Incapacity Benefits have the highest levels of claimants, and
numbers were higher in 2006 than 2011. There tends to be more males claiming than
females, although this was not the case nationally in 2006. Figures of particular note are the
substantial increases in JSA claimants and young people (aged 16-24). Nothumberland
showed a 57% increase in JSA claimant numbers in August 2011, based on August 2006
figures (for England as a whole the increase was 64%, for the North East and the LEP this
was 72%). The number of 16-24 year olds claiming DWP working age benefits in
Northumberland was 26% higher in 2011 than 2006 (32% higher for England, 29% for the
North East region and 30% for the LEP).
Claimants may be claiming more than one benefit and are therefore categorised according
to a benefit hierarchy, further details of which can be found on the Nomis website
(www.nomisweb.co.uk). The following chart shows the percentage of the working age
population (based on 2010 mid year estimates) claiming benefits in the former districts,
County, LEP, region and Country (England only) in August 2011.
Northumberland Poverty and Worklessness Assessment – 2012 Update
25
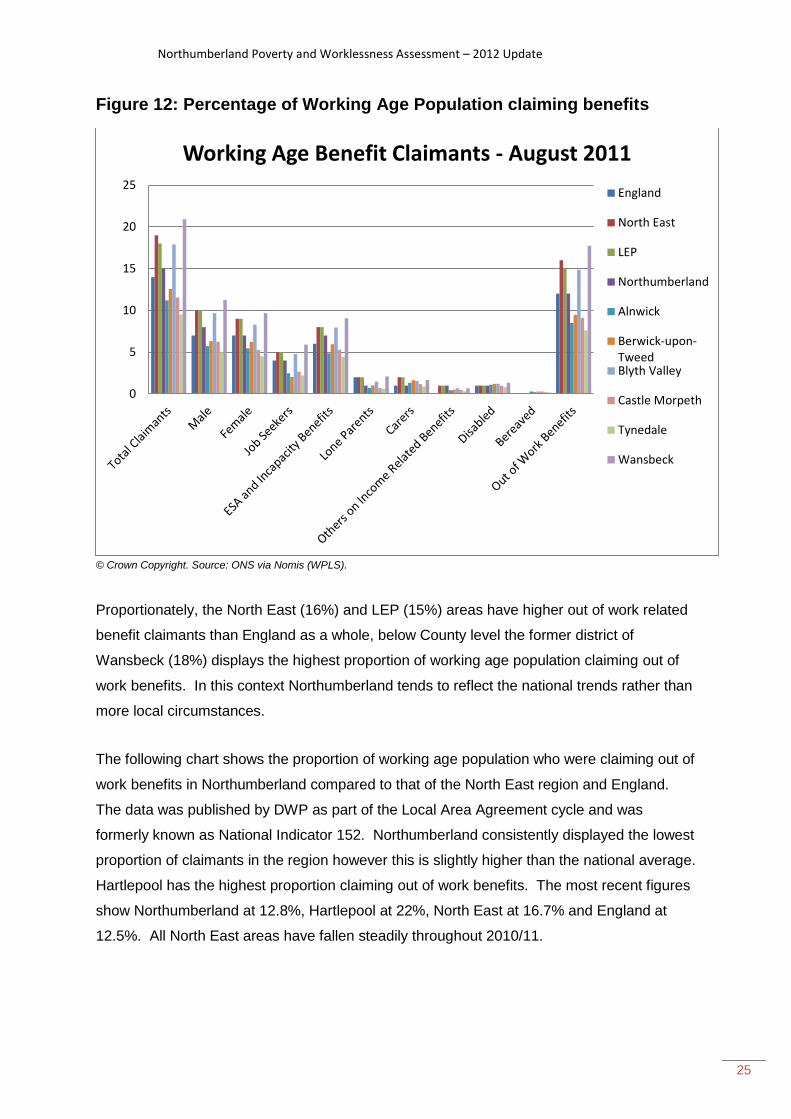
Figure 12: Percentage of Working Age Population claiming benefits
© Crown Copyright. Source: ONS via Nomis (WPLS).
Proportionately, the North East (16%) and LEP (15%) areas have higher out of work related
benefit claimants than England as a whole, below County level the former district of
Wansbeck (18%) displays the highest proportion of working age population claiming out of
work benefits. In this context Northumberland tends to reflect the national trends rather than
more local circumstances.
The following chart shows the proportion of working age population who were claiming out of
work benefits in Northumberland compared to that of the North East region and England.
The data was published by DWP as part of the Local Area Agreement cycle and was
formerly known as National Indicator 152. Northumberland consistently displayed the lowest
proportion of claimants in the region however this is slightly higher than the national average.
Hartlepool has the highest proportion claiming out of work benefits. The most recent figures
show Northumberland at 12.8%, Hartlepool at 22%, North East at 16.7% and England at
12.5%. All North East areas have fallen steadily throughout 2010/11.
0
5
10
15
20
25
Working Age Benefit Claimants - August 2011
England
North East
LEP
Northumberland
Alnwick
Berwick-upon-TweedBlyth Valley
Castle Morpeth
Tynedale
Wansbeck

Northumberland Poverty and Worklessness Assessment – 2012 Update
26
Figure 13: Proportion of Working Age Population claiming out of work benefits 2007-2011
© Crown Copyright. Source: DWP, former NI 152.
Below Northumberland level there is a greater variation in claimants ranging from 43.5%
(equating to 380 people) in the Croft area of Blyth to 3.2% (equating to 25 people) in the
Stocksfield with Mickley area. These figures are based on a snapshot at November 2010
and are a reduction on previous years.
6.2 Earnings
The Annual Survey of Hours and Earnings (ASHE) takes place in April each year to obtain
information on levels and distribution of earnings of employees. ASHE is based on a sample
of employee jobs taken from HM Revenue & Customs PAYE records for employees who are
living or working in an area, who are on adult rates and whose pay for the survey pay-period
was not affected by absence.
Figure 14 shows that resident’s earnings in Northumberland and across all of the former
districts are higher than local workplace earnings in the county. The former Tynedale District
(£198) has the largest difference between residents and workplace pay, the other former
districts with the largest difference between residents and local workplace earnings are
Alnwick (£148) and Castle Morpeth (£86) suggesting people living in these areas are more
likely to commute outside of the county. People living in Northumberland earn on average
£49 per week more than those working in the county while there is only a very small
10.0
12.0
14.0
16.0
18.0
20.0
22.0
24.0
Q3
20
07
Q4
20
07
Q1
20
08
Q2
20
08
Q3
20
08
Q4
20
08
Q1
20
09
Q2
20
09
Q3
20
09
Q4
20
09
Q1
20
10
Q2
20
10
Q3
20
10
Q4
20
10
Q1
20
11
Q2
20
11
Proportion of working age population on out of work benefits 2007-2011
England
North East
County Durham
Darlington
Gateshead
Hartlepool
Middlesbrough
Newcastle upon Tyne
North Tyneside
Northumberland
Redcar and Cleveland
South Tyneside
Stockton-on-Tees
Sunderland

Northumberland Poverty and Worklessness Assessment – 2012 Update
27
difference between the average earnings for residents and workplaces in the North East
Region and England.
The average earnings figures provided in figures 14 to 16 are based on a sample of the
population and are colour coded depending on their confidence level/accuracy:
Precise Reasonably precise Acceptable, but use with caution
Figure 14: Average (Median) Resident and Workplace Full-Time Gross Weekly Earnings (£ per week)
Area 2011
Resident Workplace Difference
Alnwick District 505 358 148
Berwick-upon-Tweed District 386 381 5
Blyth Valley District 446 432 14
Castle Morpeth District 557 471 86
Tynedale District 582 385 198
Wansbeck District 439 431 8
Northumberland 474 425 49
North East 451 452 -1
England 508 507 0 © Crown Copyright. Source: ONS via Nomis (Annual Survey of Hours and Earnings).
When looking at residence based pay in Northumberland average earnings are higher in
Northumberland (£474) than the North East (£451) but lower than England (£508). Resident
earning levels in the former districts of Berwick-upon-Tweed (£386), Blyth Valley (£446) and
Wansbeck (£439) are lower than the Northumberland average meaning there is an even
greater disparity with earning levels across England. Figure 15 shows that since 2007
Northumberland earnings increased each year until 2011 when the earnings levels were
lower than in 2010, while at a North East and England level earnings have increased every
year between 2007 and 2011.
Figure 15: Average (Median) Resident Full-Time Gross Weekly Earnings (£ per week)
Area 2007 2008 2009 2010 2011
Alnwick District 429 452 519 471 505
Berwick-upon-Tweed District 350 334 381 411 386
Blyth Valley District 353 387 414 437 446
Castle Morpeth District 496 550 608 616 557
Tynedale District 500 576 602 626 582
Wansbeck District 424 415 424 441 439
Northumberland 417 433 468 481 474
North East 401 422 439 443 451
England 464 485 496 506 508 © Crown Copyright. Source: ONS via Nomis (Annual Survey of Hours and Earnings).
Northumberland Poverty and Worklessness Assessment – 2012 Update
28
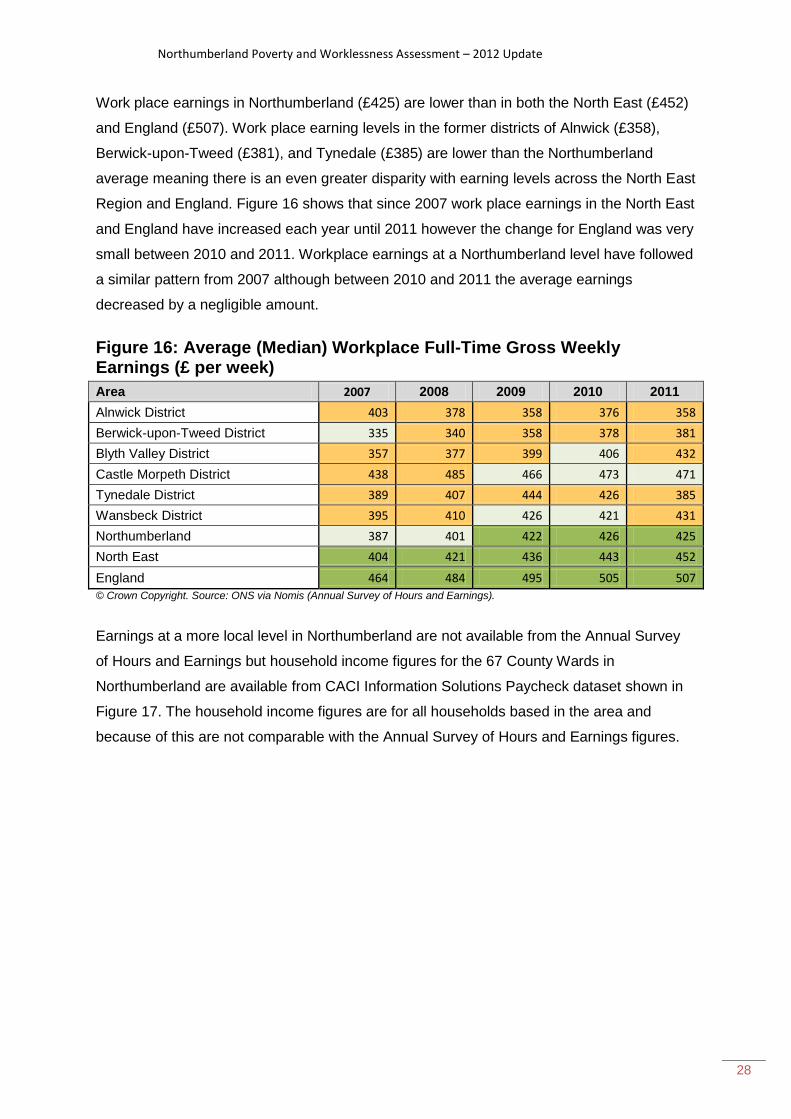
Work place earnings in Northumberland (£425) are lower than in both the North East (£452)
and England (£507). Work place earning levels in the former districts of Alnwick (£358),
Berwick-upon-Tweed (£381), and Tynedale (£385) are lower than the Northumberland
average meaning there is an even greater disparity with earning levels across the North East
Region and England. Figure 16 shows that since 2007 work place earnings in the North East
and England have increased each year until 2011 however the change for England was very
small between 2010 and 2011. Workplace earnings at a Northumberland level have followed
a similar pattern from 2007 although between 2010 and 2011 the average earnings
decreased by a negligible amount.
Figure 16: Average (Median) Workplace Full-Time Gross Weekly Earnings (£ per week)
Area 2007 2008 2009 2010 2011
Alnwick District 403 378 358 376 358
Berwick-upon-Tweed District 335 340 358 378 381
Blyth Valley District 357 377 399 406 432
Castle Morpeth District 438 485 466 473 471
Tynedale District 389 407 444 426 385
Wansbeck District 395 410 426 421 431
Northumberland 387 401 422 426 425
North East 404 421 436 443 452
England 464 484 495 505 507
© Crown Copyright. Source: ONS via Nomis (Annual Survey of Hours and Earnings).
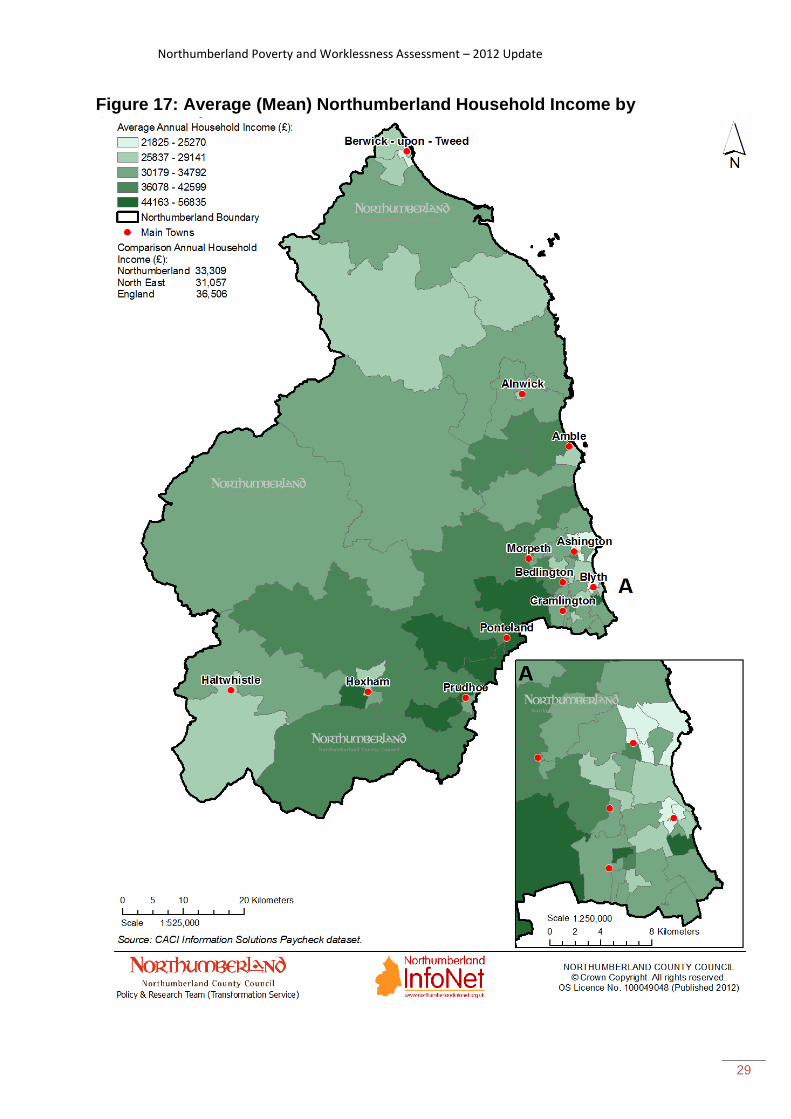
Earnings at a more local level in Northumberland are not available from the Annual Survey
of Hours and Earnings but household income figures for the 67 County Wards in
Northumberland are available from CACI Information Solutions Paycheck dataset shown in
Figure 17. The household income figures are for all households based in the area and
because of this are not comparable with the Annual Survey of Hours and Earnings figures.
Northumberland Poverty and Worklessness Assessment – 2012 Update
29
Figure 17: Average (Mean) Northumberland Household Income by County Ward
Northumberland Poverty and Worklessness Assessment – 2012 Update
30
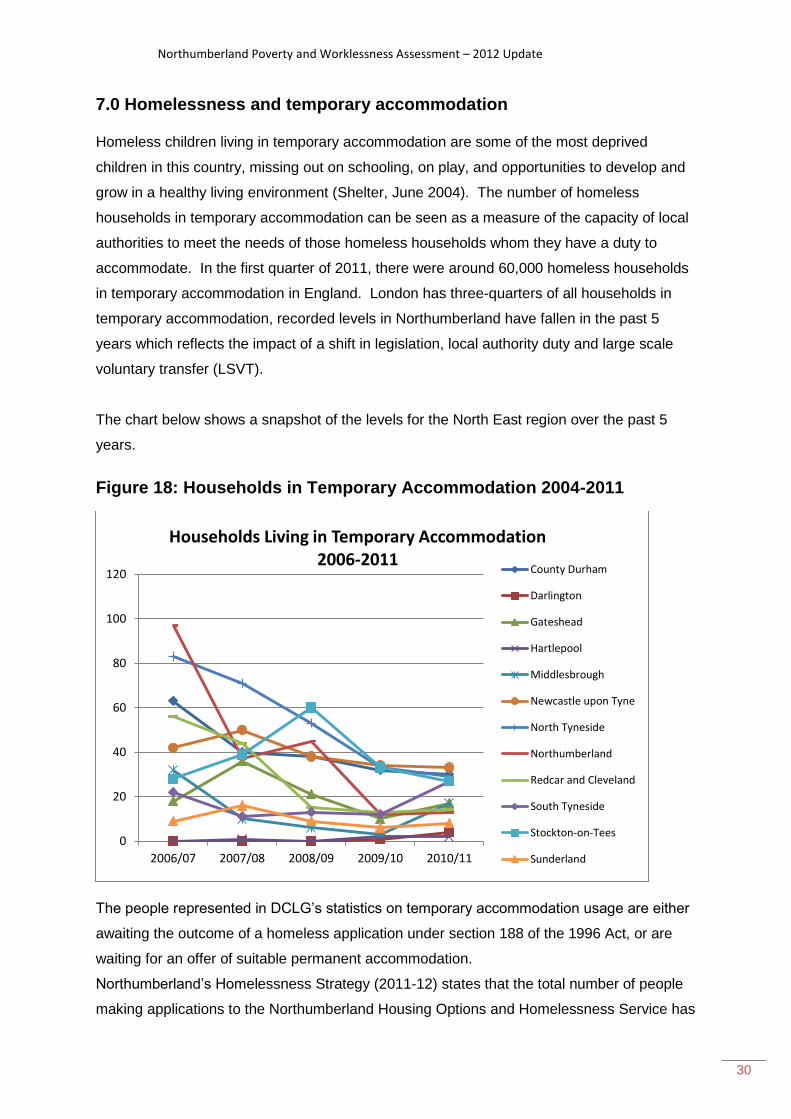
7.0 Homelessness and temporary accommodation
Homeless children living in temporary accommodation are some of the most deprived
children in this country, missing out on schooling, on play, and opportunities to develop and
grow in a healthy living environment (Shelter, June 2004). The number of homeless
households in temporary accommodation can be seen as a measure of the capacity of local
authorities to meet the needs of those homeless households whom they have a duty to
accommodate. In the first quarter of 2011, there were around 60,000 homeless households
in temporary accommodation in England. London has three-quarters of all households in
temporary accommodation, recorded levels in Northumberland have fallen in the past 5
years which reflects the impact of a shift in legislation, local authority duty and large scale
voluntary transfer (LSVT).
The chart below shows a snapshot of the levels for the North East region over the past 5
years.
Figure 18: Households in Temporary Accommodation 2004-2011
The people represented in DCLG’s statistics on temporary accommodation usage are either
awaiting the outcome of a homeless application under section 188 of the 1996 Act, or are
waiting for an offer of suitable permanent accommodation.
Northumberland’s Homelessness Strategy (2011-12) states that the total number of people
making applications to the Northumberland Housing Options and Homelessness Service has
0
20
40
60
80
100
120
2006/07 2007/08 2008/09 2009/10 2010/11
Households Living in Temporary Accommodation 2006-2011
County Durham
Darlington
Gateshead
Hartlepool
Middlesbrough
Newcastle upon Tyne
North Tyneside
Northumberland
Redcar and Cleveland
South Tyneside
Stockton-on-Tees
Sunderland
Northumberland Poverty and Worklessness Assessment – 2012 Update
31
remained around 900 for the past two years. During this period there has been a 7%
increase in the number of homeless acceptances and around a 10% decrease in successful
homeless preventions. The number of rough sleepers and repeat homelessness continue to
be recorded as zero.
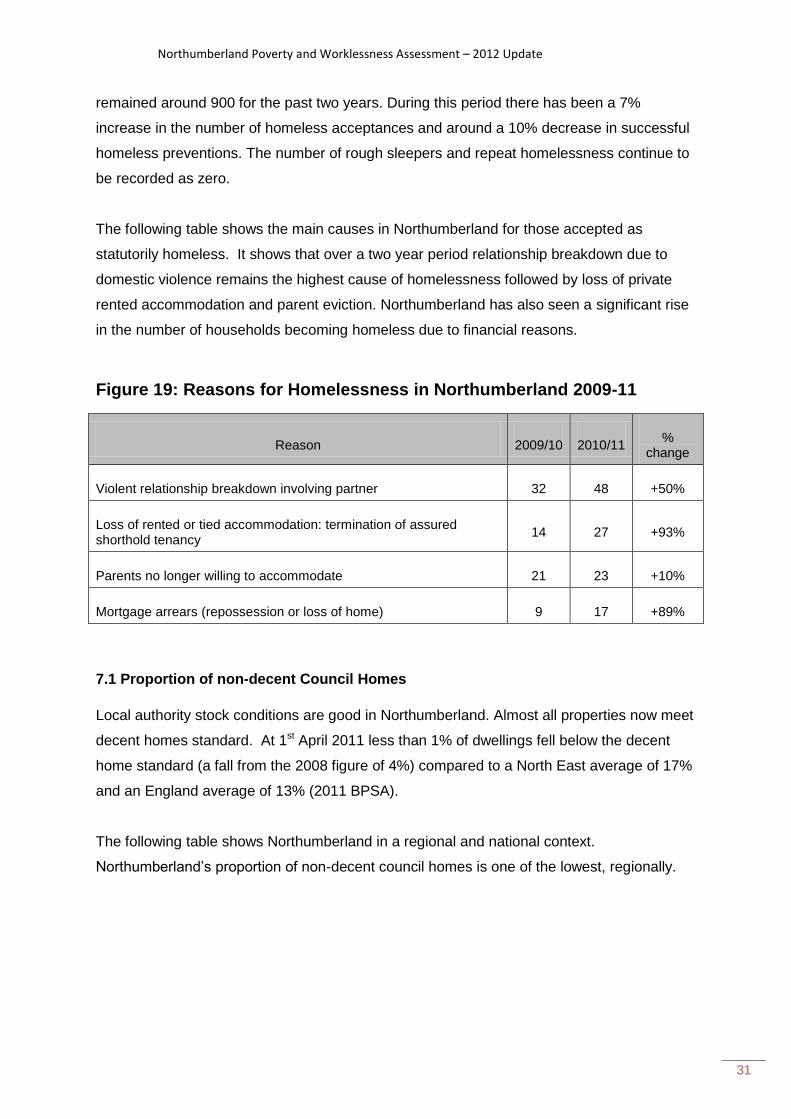
The following table shows the main causes in Northumberland for those accepted as
statutorily homeless. It shows that over a two year period relationship breakdown due to
domestic violence remains the highest cause of homelessness followed by loss of private
rented accommodation and parent eviction. Northumberland has also seen a significant rise
in the number of households becoming homeless due to financial reasons.
Figure 19: Reasons for Homelessness in Northumberland 2009-11
Reason 2009/10 2010/11 %
change
Violent relationship breakdown involving partner 32 48 +50%
Loss of rented or tied accommodation: termination of assured shorthold tenancy
14 27 +93%
Parents no longer willing to accommodate 21 23 +10%
Mortgage arrears (repossession or loss of home) 9 17 +89%
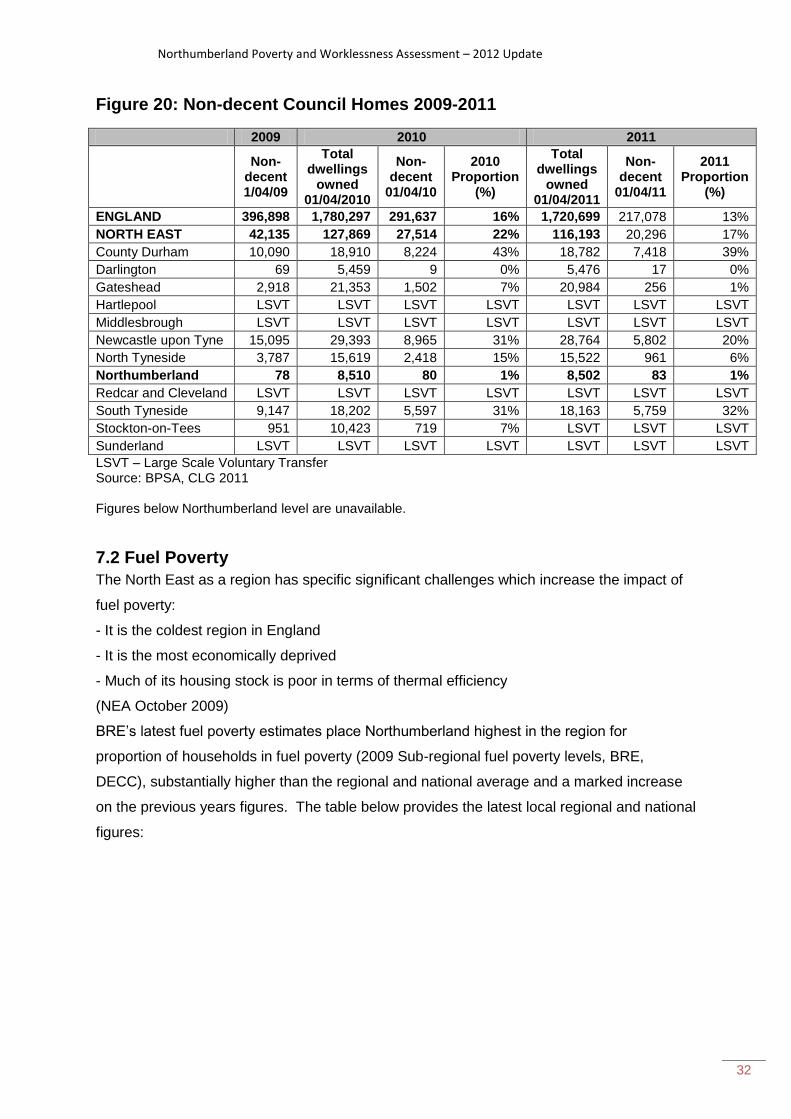
7.1 Proportion of non-decent Council Homes
Local authority stock conditions are good in Northumberland. Almost all properties now meet
decent homes standard. At 1st April 2011 less than 1% of dwellings fell below the decent
home standard (a fall from the 2008 figure of 4%) compared to a North East average of 17%
and an England average of 13% (2011 BPSA).
The following table shows Northumberland in a regional and national context.
Northumberland’s proportion of non-decent council homes is one of the lowest, regionally.
Northumberland Poverty and Worklessness Assessment – 2012 Update
32
Figure 20: Non-decent Council Homes 2009-2011
2009 2010 2011
Non-
decent 1/04/09
Total dwellings
owned 01/04/2010
Non-decent
01/04/10
2010 Proportion
(%)
Total dwellings
owned 01/04/2011
Non-decent
01/04/11
2011 Proportion
(%)
ENGLAND 396,898 1,780,297 291,637 16% 1,720,699 217,078 13%
NORTH EAST 42,135 127,869 27,514 22% 116,193 20,296 17%
County Durham 10,090 18,910 8,224 43% 18,782 7,418 39%
Darlington 69 5,459 9 0% 5,476 17 0%
Gateshead 2,918 21,353 1,502 7% 20,984 256 1%
Hartlepool LSVT LSVT LSVT LSVT LSVT LSVT LSVT
Middlesbrough LSVT LSVT LSVT LSVT LSVT LSVT LSVT
Newcastle upon Tyne 15,095 29,393 8,965 31% 28,764 5,802 20%
North Tyneside 3,787 15,619 2,418 15% 15,522 961 6%
Northumberland 78 8,510 80 1% 8,502 83 1%
Redcar and Cleveland LSVT LSVT LSVT LSVT LSVT LSVT LSVT
South Tyneside 9,147 18,202 5,597 31% 18,163 5,759 32%
Stockton-on-Tees 951 10,423 719 7% LSVT LSVT LSVT
Sunderland LSVT LSVT LSVT LSVT LSVT LSVT LSVT
LSVT – Large Scale Voluntary Transfer Source: BPSA, CLG 2011 Figures below Northumberland level are unavailable.
7.2 Fuel Poverty
The North East as a region has specific significant challenges which increase the impact of
fuel poverty:
- It is the coldest region in England
- It is the most economically deprived
- Much of its housing stock is poor in terms of thermal efficiency
(NEA October 2009)
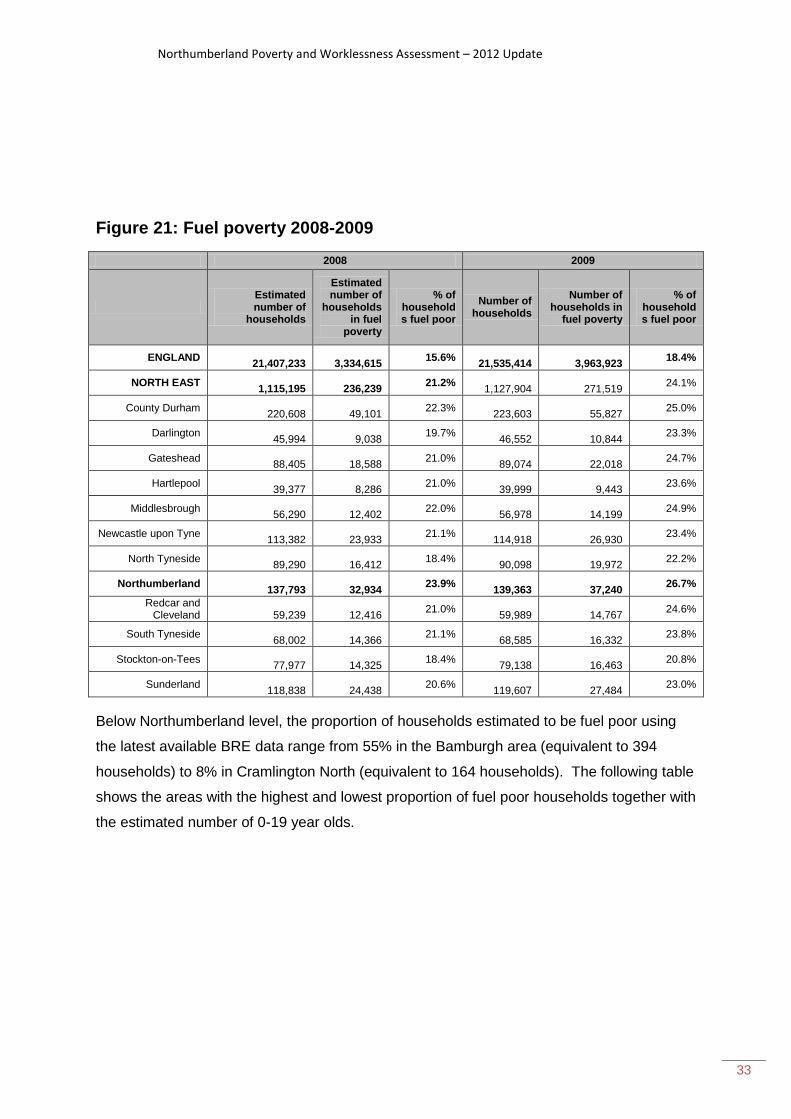
BRE’s latest fuel poverty estimates place Northumberland highest in the region for
proportion of households in fuel poverty (2009 Sub-regional fuel poverty levels, BRE,
DECC), substantially higher than the regional and national average and a marked increase
on the previous years figures. The table below provides the latest local regional and national
figures:
Northumberland Poverty and Worklessness Assessment – 2012 Update
33
Figure 21: Fuel poverty 2008-2009
2008 2009
Estimated number of
households
Estimated number of
households in fuel
poverty
% of households fuel poor
Number of households
Number of households in
fuel poverty
% of households fuel poor
ENGLAND
21,407,233
3,334,615 15.6%
21,535,414
3,963,923
18.4%
NORTH EAST
1,115,195
236,239 21.2%
1,127,904
271,519
24.1%
County Durham
220,608
49,101 22.3%
223,603
55,827
25.0%
Darlington
45,994
9,038 19.7%
46,552
10,844
23.3%
Gateshead
88,405
18,588 21.0%
89,074
22,018
24.7%
Hartlepool
39,377
8,286 21.0%
39,999
9,443
23.6%
Middlesbrough
56,290
12,402 22.0%
56,978
14,199
24.9%
Newcastle upon Tyne
113,382
23,933 21.1%
114,918
26,930
23.4%
North Tyneside
89,290
16,412 18.4%
90,098
19,972
22.2%
Northumberland
137,793
32,934 23.9%
139,363
37,240
26.7%
Redcar and Cleveland
59,239
12,416
21.0%
59,989
14,767 24.6%
South Tyneside
68,002
14,366 21.1%
68,585
16,332
23.8%
Stockton-on-Tees
77,977
14,325 18.4%
79,138
16,463
20.8%
Sunderland
118,838
24,438 20.6%
119,607
27,484
23.0%
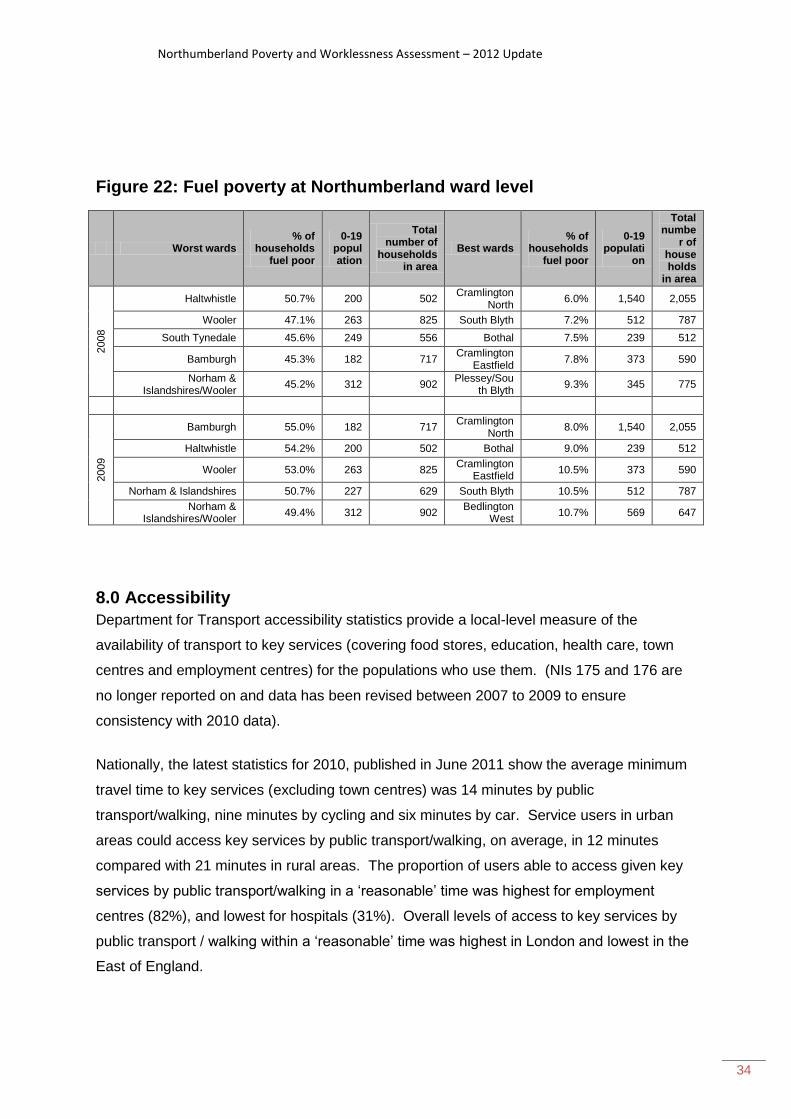
Below Northumberland level, the proportion of households estimated to be fuel poor using
the latest available BRE data range from 55% in the Bamburgh area (equivalent to 394
households) to 8% in Cramlington North (equivalent to 164 households). The following table
shows the areas with the highest and lowest proportion of fuel poor households together with
the estimated number of 0-19 year olds.
Northumberland Poverty and Worklessness Assessment – 2012 Update
34
Figure 22: Fuel poverty at Northumberland ward level
Worst wards % of
households fuel poor
0-19 population
Total number of
households in area
Best wards % of
households fuel poor
0-19 populati
on
Total numbe
r of households
in area
2008
Haltwhistle 50.7% 200 502 Cramlington
North 6.0% 1,540 2,055
Wooler 47.1% 263 825 South Blyth 7.2% 512 787
South Tynedale 45.6% 249 556 Bothal 7.5% 239 512
Bamburgh 45.3% 182 717 Cramlington
Eastfield 7.8% 373 590
Norham & Islandshires/Wooler
45.2% 312 902 Plessey/Sou
th Blyth 9.3% 345 775
2009
Bamburgh 55.0% 182 717 Cramlington
North 8.0% 1,540 2,055
Haltwhistle 54.2% 200 502 Bothal 9.0% 239 512
Wooler 53.0% 263 825 Cramlington
Eastfield 10.5% 373 590
Norham & Islandshires 50.7% 227 629 South Blyth 10.5% 512 787
Norham & Islandshires/Wooler
49.4% 312 902 Bedlington
West 10.7% 569 647
8.0 Accessibility
Department for Transport accessibility statistics provide a local-level measure of the
availability of transport to key services (covering food stores, education, health care, town
centres and employment centres) for the populations who use them. (NIs 175 and 176 are
no longer reported on and data has been revised between 2007 to 2009 to ensure
consistency with 2010 data).
Nationally, the latest statistics for 2010, published in June 2011 show the average minimum
travel time to key services (excluding town centres) was 14 minutes by public
transport/walking, nine minutes by cycling and six minutes by car. Service users in urban
areas could access key services by public transport/walking, on average, in 12 minutes
compared with 21 minutes in rural areas. The proportion of users able to access given key
services by public transport/walking in a ‘reasonable’ time was highest for employment
centres (82%), and lowest for hospitals (31%). Overall levels of access to key services by
public transport / walking within a ‘reasonable’ time was highest in London and lowest in the
East of England.
Northumberland Poverty and Worklessness Assessment – 2012 Update
35
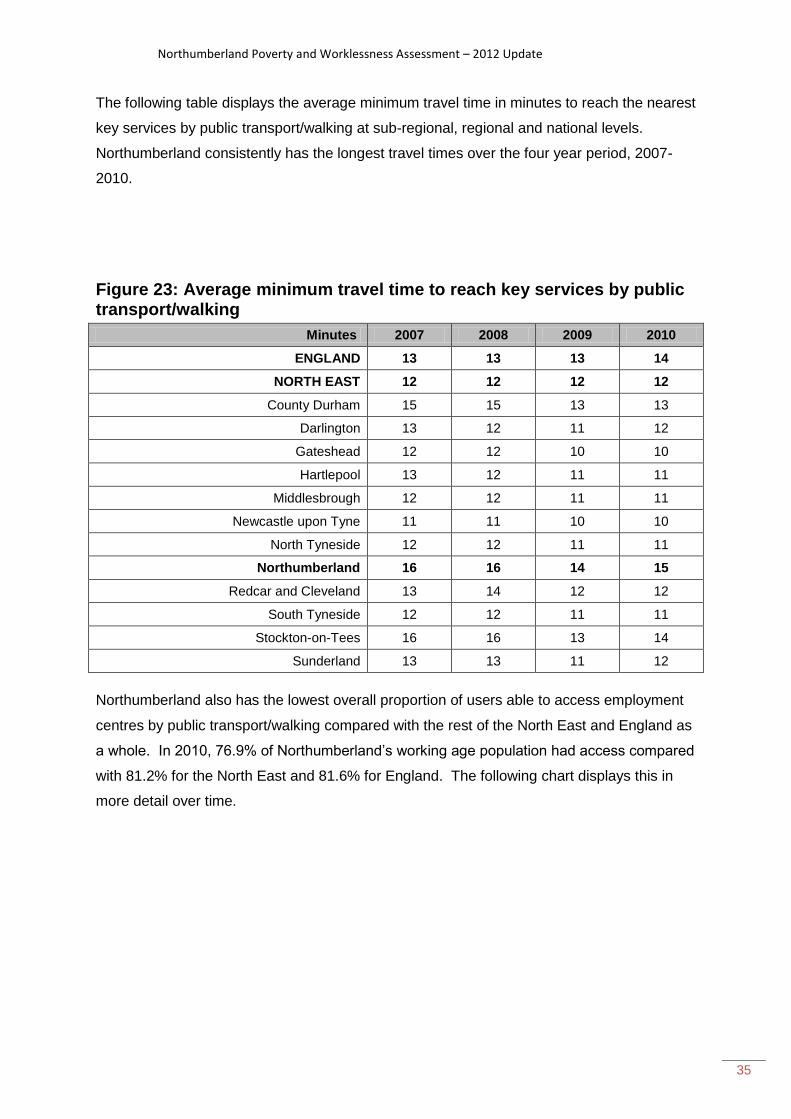
The following table displays the average minimum travel time in minutes to reach the nearest
key services by public transport/walking at sub-regional, regional and national levels.
Northumberland consistently has the longest travel times over the four year period, 2007-
2010.
Figure 23: Average minimum travel time to reach key services by public transport/walking
Minutes 2007 2008 2009 2010
ENGLAND 13 13 13 14
NORTH EAST 12 12 12 12
County Durham 15 15 13 13
Darlington 13 12 11 12
Gateshead 12 12 10 10
Hartlepool 13 12 11 11
Middlesbrough 12 12 11 11
Newcastle upon Tyne 11 11 10 10
North Tyneside 12 12 11 11
Northumberland 16 16 14 15
Redcar and Cleveland 13 14 12 12
South Tyneside 12 12 11 11
Stockton-on-Tees 16 16 13 14
Sunderland 13 13 11 12
Northumberland also has the lowest overall proportion of users able to access employment
centres by public transport/walking compared with the rest of the North East and England as
a whole. In 2010, 76.9% of Northumberland’s working age population had access compared
with 81.2% for the North East and 81.6% for England. The following chart displays this in
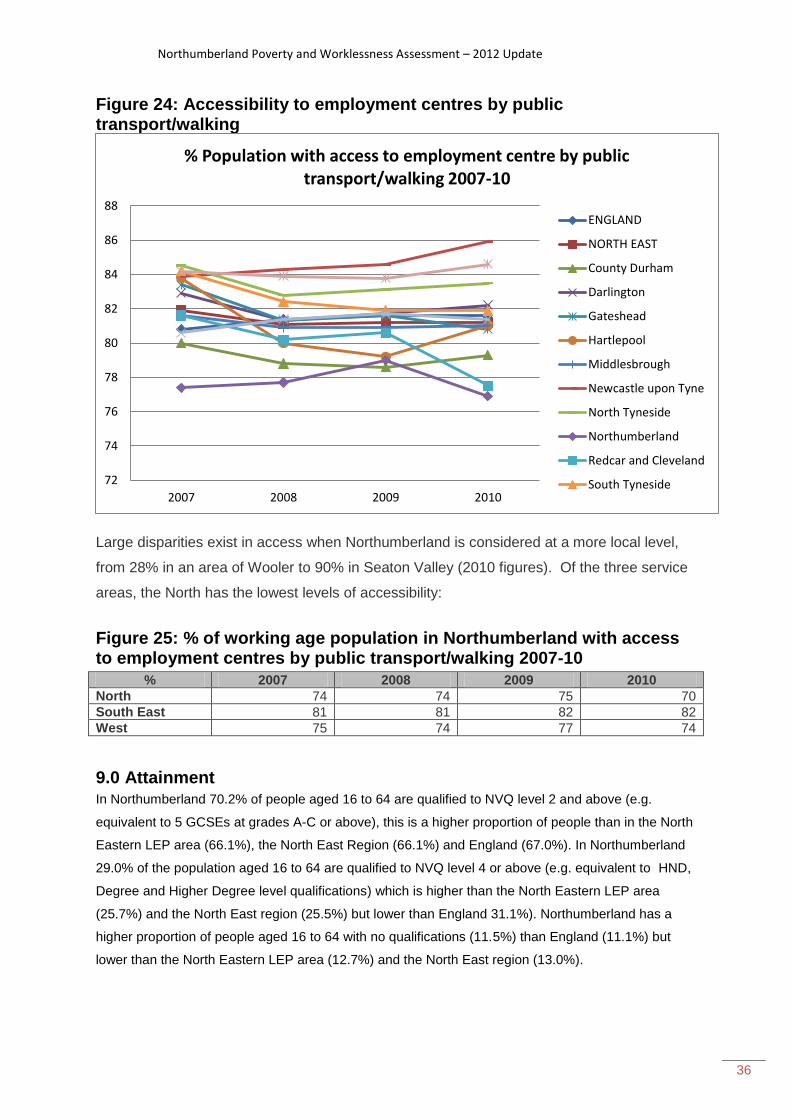
more detail over time.
Northumberland Poverty and Worklessness Assessment – 2012 Update
36
Figure 24: Accessibility to employment centres by public transport/walking
Large disparities exist in access when Northumberland is considered at a more local level,
from 28% in an area of Wooler to 90% in Seaton Valley (2010 figures). Of the three service
areas, the North has the lowest levels of accessibility:
Figure 25: % of working age population in Northumberland with access to employment centres by public transport/walking 2007-10
% 2007 2008 2009 2010
North 74 74 75 70
South East 81 81 82 82
West 75 74 77 74
9.0 Attainment
In Northumberland 70.2% of people aged 16 to 64 are qualified to NVQ level 2 and above (e.g.
equivalent to 5 GCSEs at grades A-C or above), this is a higher proportion of people than in the North
Eastern LEP area (66.1%), the North East Region (66.1%) and England (67.0%). In Northumberland
29.0% of the population aged 16 to 64 are qualified to NVQ level 4 or above (e.g. equivalent to HND,
Degree and Higher Degree level qualifications) which is higher than the North Eastern LEP area
(25.7%) and the North East region (25.5%) but lower than England 31.1%). Northumberland has a
higher proportion of people aged 16 to 64 with no qualifications (11.5%) than England (11.1%) but
lower than the North Eastern LEP area (12.7%) and the North East region (13.0%).
72
74
76
78
80
82
84
86
88
2007 2008 2009 2010
% Population with access to employment centre by public transport/walking 2007-10
ENGLAND
NORTH EAST
County Durham
Darlington
Gateshead
Hartlepool
Middlesbrough
Newcastle upon Tyne
North Tyneside
Northumberland
Redcar and Cleveland
South Tyneside

Northumberland Poverty and Worklessness Assessment – 2012 Update
37
Figure 26: Qualifications (Jan-Dec 2010)
Northumberland North Eastern LEP North East Region England
Number Rate Number Rate Number Rate Number Rate
NVQ4 and above 55,900 29.0 322,400 25.7 427,600 25.5 10,440,600 31.1
NVQ3 and above 96,500 50.0 602,700 48.0 802,500 47.9 16,997,700 50.7
NVQ2 and above 135,400 70.2 829,200 66.1 1,107,800 66.1 22,475,900 67.0
NVQ1 and above 162,000 84.0 1,009,300 80.5 1,344,500 80.3 26,924,800 80.3
Other Qualifications 8,700 4.5 85,300 6.8 112,200 6.7 2,897,400 8.6
No Qualifications 22,200 11.5 159,900 12.7 218,500 13.0 3,722,800 11.1 © Crown copyright. Source: ONS via Nomis Annual Population Survey. Numbers and rates are for resident population aged 16 to 64.
Figure 27 shows that Northumberland has a lower proportion of pupils at the end of Key
Stage 4 (KS4) gaining five or more GCSEs which include English and Maths (2009/10) than
England but a slightly higher proportion than the North East Region.
Figure 27: Pupils Gaining Five or more A* to C GCSE Grades including English and Maths 2009/10
All Pupils at the End of KS4
% of All Pupils at the End of KS4 Achieving 5+ A* to C Including English and Maths
Northumberland 3,460 53.5
North East 29,487 52.9
England 577,810 55.1 © Crown copyright. DfE Research and Statistics Gateway. Data referenced by location of pupil residence.
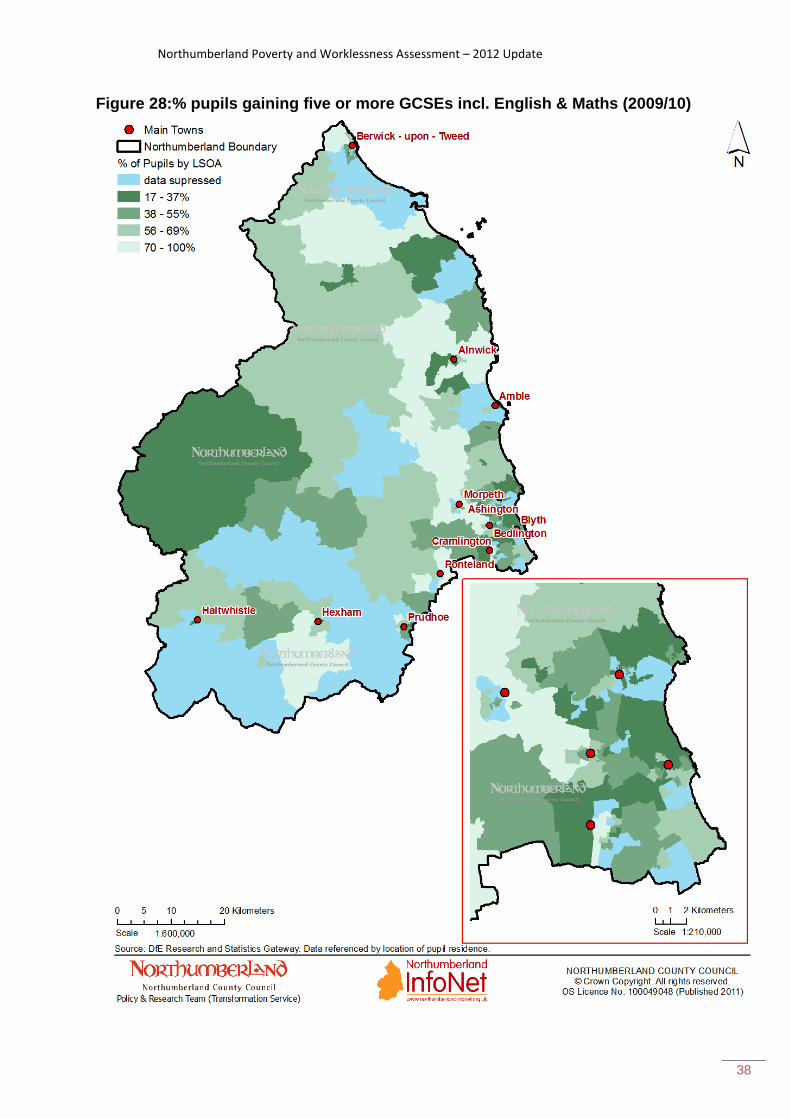
Figure 28 maps the location of the same statistics at LSOA level. The light blue areas on the
map show areas where rates could not be calculated because figures were not published in
order to protect the identity of pupils. The darker green colours show areas where a lower
proportion of pupils gained five or more GCSEs including English and Maths and the lighter
green areas show areas where a higher proportion of students gained five or more GCSEs
including English and Maths. 57 out of the 199 LSOAs in Northumberland do not have a
rate because the data has been suppressed. Of the 142 LSOAs that data is available for
almost half (70 or 49.3%) are below the Northumberland average, a slightly smaller number
(67 or 47.2%) are below the North East average.
Northumberland Poverty and Worklessness Assessment – 2012 Update
38
Figure 28:% pupils gaining five or more GCSEs incl. English & Maths (2009/10)
Northumberland Poverty and Worklessness Assessment – 2012 Update
39
9.1 Young People aged 16-18 Not in Education, Employment or Training (NEET)
For most young people, being NEET is a temporary outcome as they move between
different education and training options – surveys estimate that only one per cent of young
people are NEET at ages 16, 17 and 18. The characteristics of young people who are not
participating are diverse, although there are some groups that are at greater risk of
becoming NEET. This includes, for example, those with few or no qualifications and those
with a health problem, disability or low aspirations (source:
http://www.education.gov.uk/a0064101/16-to-18-year-olds-not-in-education-employment-or-
training-neet).
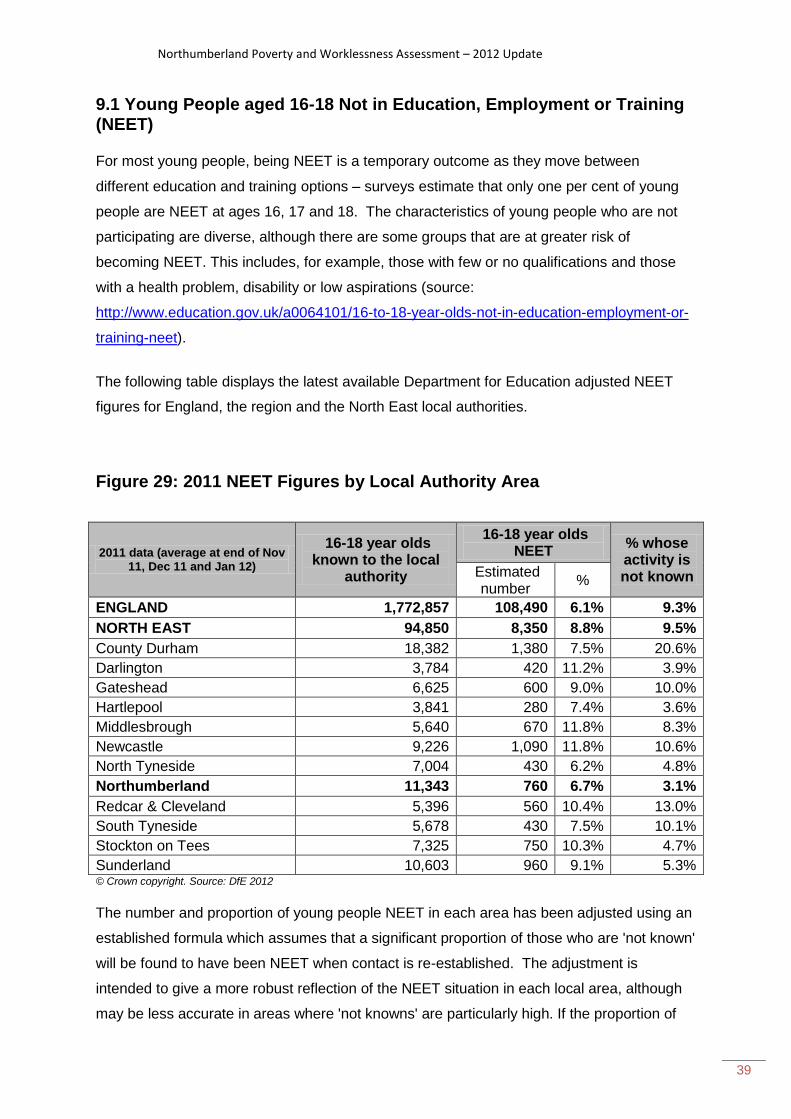
The following table displays the latest available Department for Education adjusted NEET
figures for England, the region and the North East local authorities.
Figure 29: 2011 NEET Figures by Local Authority Area
2011 data (average at end of Nov 11, Dec 11 and Jan 12)
16-18 year olds known to the local
authority
16-18 year olds NEET
% whose activity is not known Estimated
number %
ENGLAND 1,772,857 108,490 6.1% 9.3%
NORTH EAST 94,850 8,350 8.8% 9.5%
County Durham 18,382 1,380 7.5% 20.6%
Darlington 3,784 420 11.2% 3.9%
Gateshead 6,625 600 9.0% 10.0%
Hartlepool 3,841 280 7.4% 3.6%
Middlesbrough 5,640 670 11.8% 8.3%
Newcastle 9,226 1,090 11.8% 10.6%
North Tyneside 7,004 430 6.2% 4.8%
Northumberland 11,343 760 6.7% 3.1%
Redcar & Cleveland 5,396 560 10.4% 13.0%
South Tyneside 5,678 430 7.5% 10.1%
Stockton on Tees 7,325 750 10.3% 4.7%
Sunderland 10,603 960 9.1% 5.3% © Crown copyright. Source: DfE 2012
The number and proportion of young people NEET in each area has been adjusted using an
established formula which assumes that a significant proportion of those who are 'not known'
will be found to have been NEET when contact is re-established. The adjustment is
intended to give a more robust reflection of the NEET situation in each local area, although
may be less accurate in areas where 'not knowns' are particularly high. If the proportion of
Northumberland Poverty and Worklessness Assessment – 2012 Update
40
16-18 year olds whose current activity is not known is more than 50% above the England
average it is possible that the number and proportion NEET will be inaccurate.
2011 data cannot be compared with that published in previous years because significant
changes have been made to the information collected in preparation for the Government’s
commitment to raise the participation age. 2011 figures:
i) relate to young people resident in the local area. Data for previous years related to
the area in which the young person was attending school or college.
ii) relate to the young person's academic age; i.e. their age on 1 September 2011.
Data for previous years was based on calendar age. This is in line with other
statistical collections and has the effect of increasing the number and percentage
NEET.
Northumberland’s NEET of 6.7% ranks in second place in the North East area and has been
classed as “the best comparative position for our young people yet achieved” (Connexions
Northumberland Adapted Quarterly Report Period November 2011-January 2012).
Northumberland has also achieved the lowest “unknown” status of 3.1% demonstrating a
good level of information about the status of engagement of all young people.
Below Northumberland level, hotspot areas exist where NEET status has increased, these
are concentrated in Ashington and Bedlington.
10.0 Under 18 Conception Rate
Ministerial message from Sarah Teather, Minister of State for Children and Families and Paul Burstow, Minister of State for Care Services (DfE 12th March 2012):
“This Government remains committed to reducing rates of teenage pregnancy still further
and improving outcomes for young parents and their children. This is central to our aim to
reduce inter-generational poverty and inequalities. That's why the under-18 conception rate
is a national measure of child poverty and one of the three sexual health indicators in the
Public Health Outcomes Framework.”
(Source:http://www.education.gov.uk/childrenandyoungpeople/healthandwellbeing/teenagep
regnancy/a00205017/teenage-pregnancy-ministerial-message)
Northumberland Poverty and Worklessness Assessment – 2012 Update
41
In 2010, the under-18 conception rate for England was 35.4 conceptions per 1,000 girls
aged 15-17. This represents a decline of 7.3% since 2009 (38.2 conceptions per 1,000) and
continues the overall downward trend since 1998. The under-18 conception rate has fallen
by 24% since 1998, down from 46.6 conceptions per 1,000.
The proportion of conceptions leading to abortions for under-18s was 50.3%, up slightly from
2009 (49.1%). Both maternity and abortion rates for under-18s are declining. However, the
rate of under-18 conceptions leading to births continues to fall at a faster rate than overall
conceptions. In 2010, the rate of under-18 conceptions leading to births was 17.6 per 1,000.
This is 10% lower than in 2009 (19.5 per 1,000) and 35% lower than in 1998 (26.9 per
1,000).
The under-18 conception rate decreased in all regions 2009-10. The North East continues to
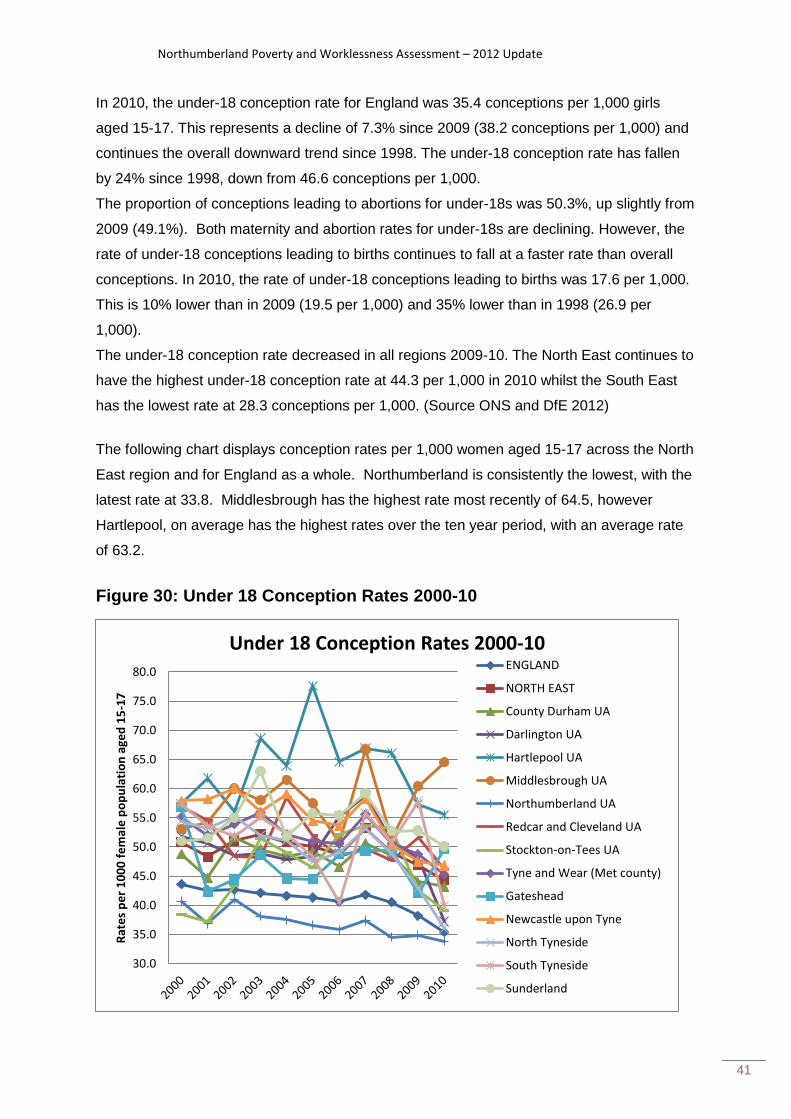
have the highest under-18 conception rate at 44.3 per 1,000 in 2010 whilst the South East
has the lowest rate at 28.3 conceptions per 1,000. (Source ONS and DfE 2012)
The following chart displays conception rates per 1,000 women aged 15-17 across the North
East region and for England as a whole. Northumberland is consistently the lowest, with the
latest rate at 33.8. Middlesbrough has the highest rate most recently of 64.5, however
Hartlepool, on average has the highest rates over the ten year period, with an average rate
of 63.2.
Figure 30: Under 18 Conception Rates 2000-10
30.0
35.0
40.0
45.0
50.0
55.0
60.0
65.0
70.0
75.0
80.0
Rat
es
pe
r 1
00
0 f
em
ale
po
pu
lati
on
age
d 1
5-1
7
Under 18 Conception Rates 2000-10 ENGLAND
NORTH EAST
County Durham UA
Darlington UA
Hartlepool UA
Middlesbrough UA
Northumberland UA
Redcar and Cleveland UA
Stockton-on-Tees UA
Tyne and Wear (Met county)
Gateshead
Newcastle upon Tyne
North Tyneside
South Tyneside
Sunderland
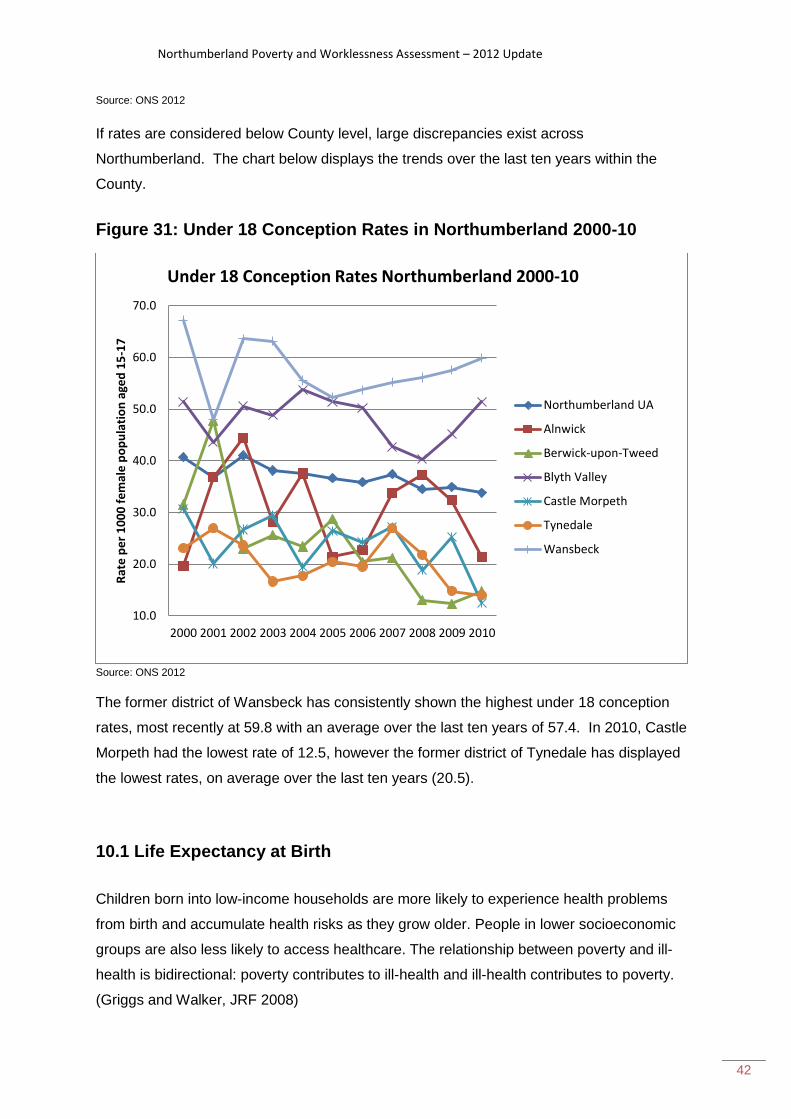
Northumberland Poverty and Worklessness Assessment – 2012 Update
42
Source: ONS 2012
If rates are considered below County level, large discrepancies exist across
Northumberland. The chart below displays the trends over the last ten years within the
County.
Figure 31: Under 18 Conception Rates in Northumberland 2000-10
Source: ONS 2012
The former district of Wansbeck has consistently shown the highest under 18 conception
rates, most recently at 59.8 with an average over the last ten years of 57.4. In 2010, Castle
Morpeth had the lowest rate of 12.5, however the former district of Tynedale has displayed
the lowest rates, on average over the last ten years (20.5).
10.1 Life Expectancy at Birth
Children born into low-income households are more likely to experience health problems
from birth and accumulate health risks as they grow older. People in lower socioeconomic
groups are also less likely to access healthcare. The relationship between poverty and ill-
health is bidirectional: poverty contributes to ill-health and ill-health contributes to poverty.
(Griggs and Walker, JRF 2008)
10.0
20.0
30.0
40.0
50.0
60.0
70.0
2000 2001 2002 2003 2004 2005 2006 2007 2008 2009 2010
Rat
e p
er
10
00
fe
mal
e p
op
ula
tio
n a
ged
15
-17
Under 18 Conception Rates Northumberland 2000-10
Northumberland UA
Alnwick
Berwick-upon-Tweed
Blyth Valley
Castle Morpeth
Tynedale
Wansbeck
Northumberland Poverty and Worklessness Assessment – 2012 Update
43
Geographic analysis of life expectancy illustrates differences in health and mortality
experienced by populations in different parts of the country. Although life expectancy in most
areas continues to improve, there is a widening gap between the areas with the highest and
lowest life expectancies. Over the 2004–06 to 2008–10 period the gaps increased from 12.5
to 13.5 years for males and from 10.1 to 11.8 years for females, showing that inequalities
persist. Individual circumstances such as socio-economic status, genetic and biological
factors, and health behaviour (for example, alcohol consumption and smoking) all have an
impact on health and subsequent mortality. Area characteristics such as environmental
conditions, the proportion of people living with deprivation, and the availability of local
services and resources can also affect health outcomes. (Source: Life expectancy at birth
and at age 65 by local areas in the United Kingdom, 2004–06 to 2008–10, ONS Statistical
Bulletin, 19 October 2011)
More recently, life expectancy for males in Northumberland (2008-10 average 78.7), has
been close to the England average (78.6), but life expectancy at birth for females is less than
the England average (Northumberland 82.2, England 82.6). Life expectancy is 9.7 years
lower for men and 6.4 years lower for women in the most deprived areas of Northumberland
than in the least deprived areas (based on the Slope Index of Inequality published on 5th
January 2011 – APHO 2011). The chart below illustrates average regional and local
variations (figures are not available below former district level).
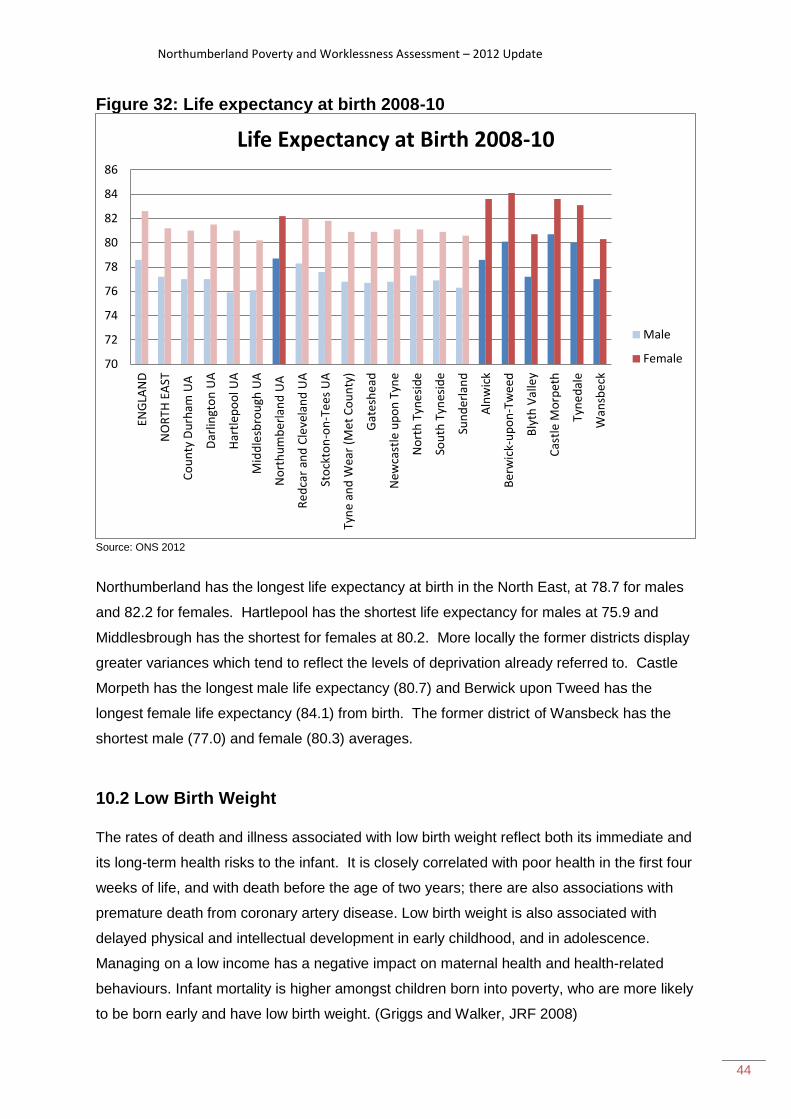
Northumberland Poverty and Worklessness Assessment – 2012 Update
44
Figure 32: Life expectancy at birth 2008-10
Source: ONS 2012
Northumberland has the longest life expectancy at birth in the North East, at 78.7 for males
and 82.2 for females. Hartlepool has the shortest life expectancy for males at 75.9 and
Middlesbrough has the shortest for females at 80.2. More locally the former districts display
greater variances which tend to reflect the levels of deprivation already referred to. Castle
Morpeth has the longest male life expectancy (80.7) and Berwick upon Tweed has the
longest female life expectancy (84.1) from birth. The former district of Wansbeck has the
shortest male (77.0) and female (80.3) averages.
10.2 Low Birth Weight
The rates of death and illness associated with low birth weight reflect both its immediate and
its long-term health risks to the infant. It is closely correlated with poor health in the first four
weeks of life, and with death before the age of two years; there are also associations with
premature death from coronary artery disease. Low birth weight is also associated with
delayed physical and intellectual development in early childhood, and in adolescence.
Managing on a low income has a negative impact on maternal health and health-related
behaviours. Infant mortality is higher amongst children born into poverty, who are more likely
to be born early and have low birth weight. (Griggs and Walker, JRF 2008)
70
72
74
76
78
80
82
84
86
ENG
LAN
D
NO
RTH
EA
ST
Co
un
ty D
urh
am U
A
Dar
lingt
on
UA
Har
tlep
oo
l UA
Mid
dle
sbro
ugh
UA
No
rth
um
ber
lan
d U
A
Re
dca
r an
d C
leve
lan
d U
A
Sto
ckto
n-o
n-T
ees
UA
Tyn
e a
nd
Wea
r (M
et C
ou
nty
)
Gat
esh
ead
New
cast
le u
po
n T
yne
No
rth
Tyn
esi
de
Sou
th T
ynes
ide
Sun
der
lan
d
Aln
wic
k
Be
rwic
k-u
po
n-T
we
ed
Bly
th V
alle
y
Cas
tle
Mo
rpe
th
Tyn
ed
ale
Wan
sbe
ck
Life Expectancy at Birth 2008-10
Male
Female
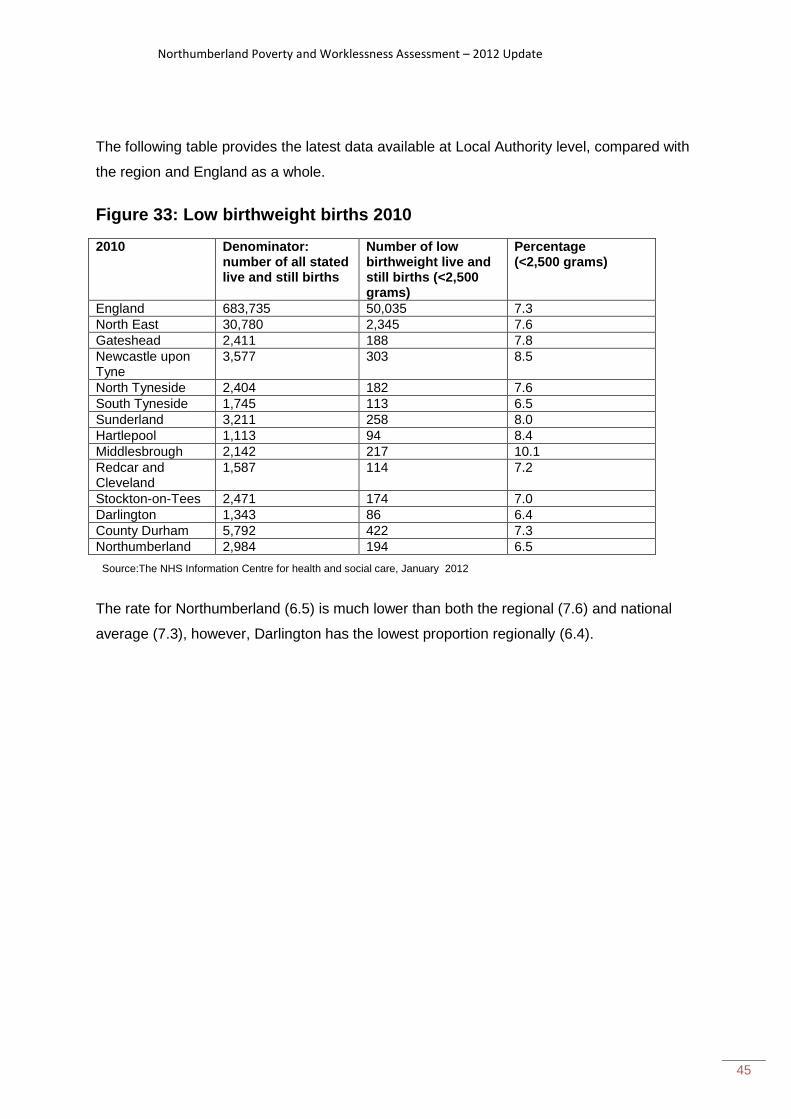
Northumberland Poverty and Worklessness Assessment – 2012 Update
45
The following table provides the latest data available at Local Authority level, compared with
the region and England as a whole.
Figure 33: Low birthweight births 2010
2010 Denominator: number of all stated live and still births
Number of low birthweight live and still births (<2,500 grams)
Percentage (<2,500 grams)
England 683,735 50,035 7.3
North East 30,780 2,345 7.6
Gateshead 2,411 188 7.8
Newcastle upon Tyne
3,577 303 8.5
North Tyneside 2,404 182 7.6
South Tyneside 1,745 113 6.5
Sunderland 3,211 258 8.0
Hartlepool 1,113 94 8.4
Middlesbrough 2,142 217 10.1
Redcar and Cleveland
1,587 114 7.2
Stockton-on-Tees 2,471 174 7.0
Darlington 1,343 86 6.4
County Durham 5,792 422 7.3
Northumberland 2,984 194 6.5
Source:The NHS Information Centre for health and social care, January 2012
The rate for Northumberland (6.5) is much lower than both the regional (7.6) and national
average (7.3), however, Darlington has the lowest proportion regionally (6.4).
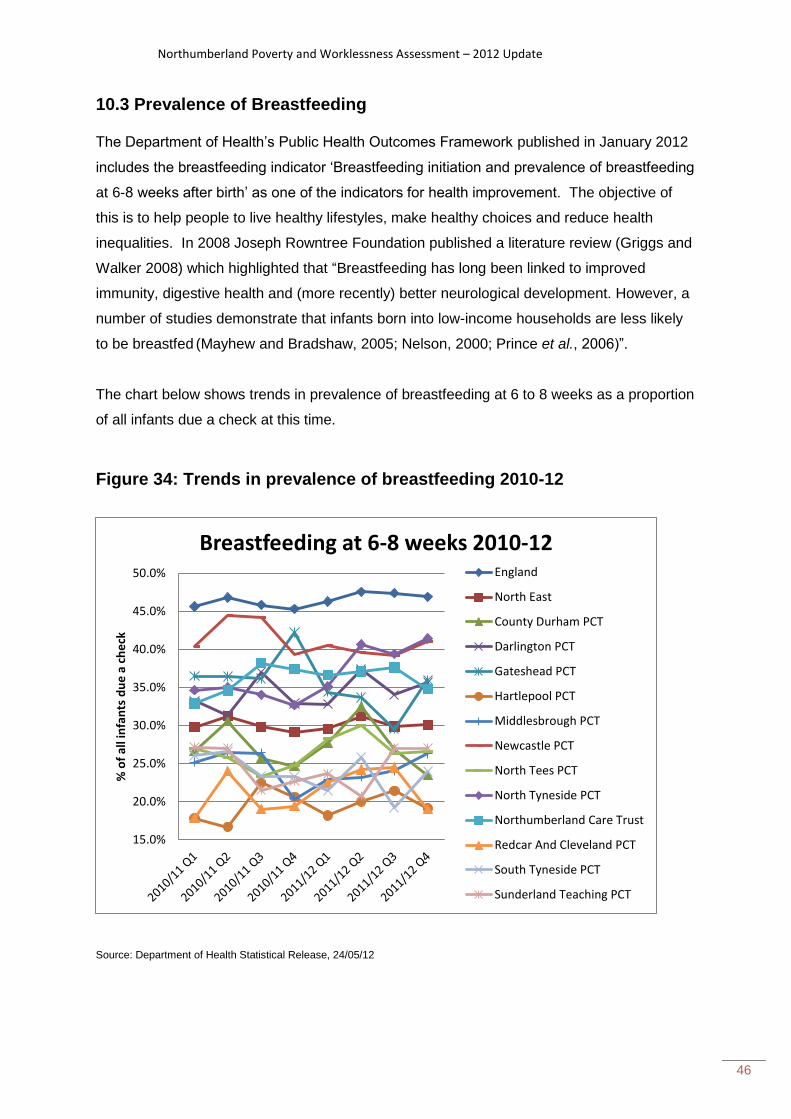
Northumberland Poverty and Worklessness Assessment – 2012 Update
46
10.3 Prevalence of Breastfeeding
The Department of Health’s Public Health Outcomes Framework published in January 2012
includes the breastfeeding indicator ‘Breastfeeding initiation and prevalence of breastfeeding
at 6-8 weeks after birth’ as one of the indicators for health improvement. The objective of
this is to help people to live healthy lifestyles, make healthy choices and reduce health
inequalities. In 2008 Joseph Rowntree Foundation published a literature review (Griggs and
Walker 2008) which highlighted that “Breastfeeding has long been linked to improved
immunity, digestive health and (more recently) better neurological development. However, a
number of studies demonstrate that infants born into low-income households are less likely
to be breastfed (Mayhew and Bradshaw, 2005; Nelson, 2000; Prince et al., 2006)”.
The chart below shows trends in prevalence of breastfeeding at 6 to 8 weeks as a proportion
of all infants due a check at this time.
Figure 34: Trends in prevalence of breastfeeding 2010-12
Source: Department of Health Statistical Release, 24/05/12
15.0%
20.0%
25.0%
30.0%
35.0%
40.0%
45.0%
50.0%
% o
f al
l in
fan
ts d
ue
a c
he
ck
Breastfeeding at 6-8 weeks 2010-12 England
North East
County Durham PCT
Darlington PCT
Gateshead PCT
Hartlepool PCT
Middlesbrough PCT
Newcastle PCT
North Tees PCT
North Tyneside PCT
Northumberland Care Trust
Redcar And Cleveland PCT
South Tyneside PCT
Sunderland Teaching PCT
Northumberland Poverty and Worklessness Assessment – 2012 Update
47
Northumberland PCT remains above the North East average. Most recently the North East
rate was 30.1% compared to a Northumberland rate of 34.8%, however Northumberland’s
levels have fallen over recent months. North Tyneside (41.4%) is the closest to the English
average of 46.9% in quarter four of 2011/12, followed by Newcastle at 41%. Redcar and
Cleveland and Hartlepool have mostly shared the lowest rates over the two year period,
most recently around 19%.
10.4 Obesity amongst primary school age children
The National Child Measurement Programme (NCMP) is an annual programme to measure
the height and weight of all children in Reception and Year 6. The information is used to help
the NHS and local authorities plan and provide better health services for children. ‘Obesity’
is a clinical term used to describe excess body fat associated with increased risks to health.
Being obese can increase the risk of diseases such as type 2 diabetes, cancer and heart
disease. Not only does obesity affect people’s health, their lives and the lives of their
families, but it places a large financial burden on the NHS and the wider economy (source:
http://www.dh.gov.uk/health/2012/04/obesityfacts/). The latest NCMP report for the school
year 2010/11, published in December 2011 highlighted that for England as a whole, “a
strong positive relationship existed between deprivation and obesity prevalence for children
in each age group. The obesity prevalence among Reception year children attending
schools in areas in the least deprived decile was 6.9% compared with 12.1% among those
living in areas in the most deprived decile. Similarly, obesity prevalence among Year 6
children living in areas in the least deprived decile was 13.8% compared with 23.7% among
those living in areas in the most deprived decile.” (The Health and Social Care Information
Centre). The following table displays the latest statistics available for England, the North
East and more locally, derived from the postcode of the child’s residence.
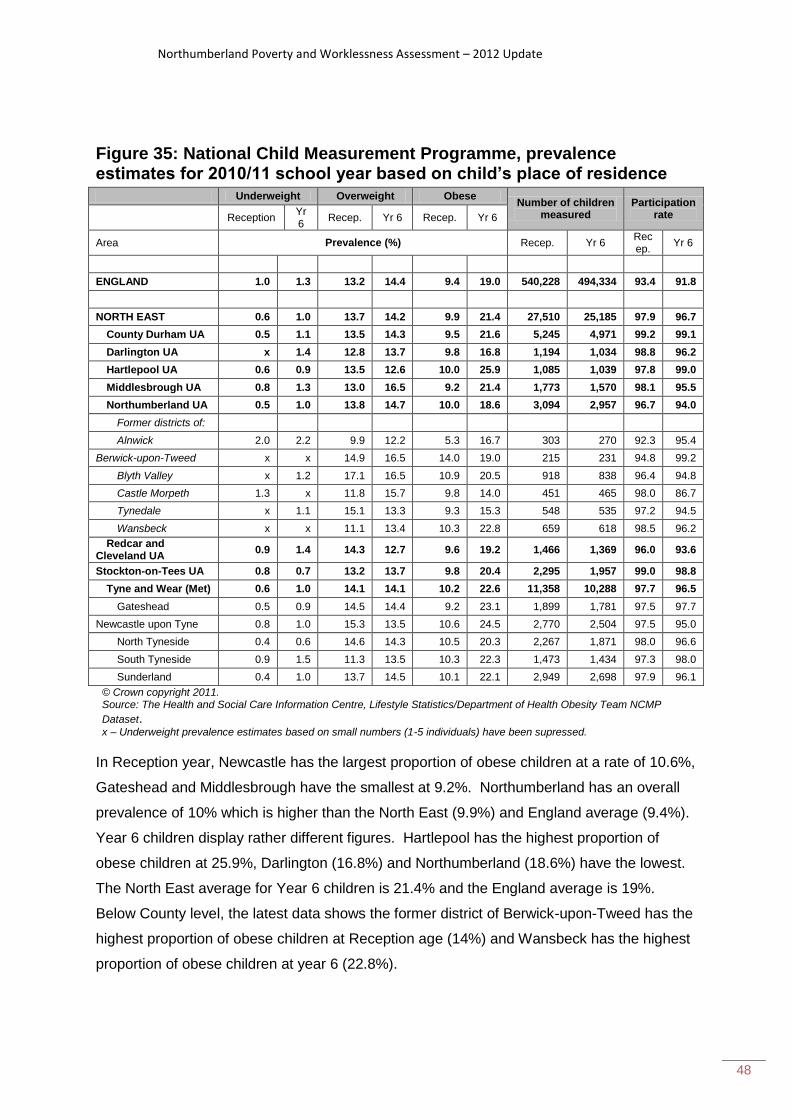
Northumberland Poverty and Worklessness Assessment – 2012 Update
48
Figure 35: National Child Measurement Programme, prevalence estimates for 2010/11 school year based on child’s place of residence
Underweight Overweight Obese Number of children
measured Participation
rate Reception Yr 6
Recep. Yr 6 Recep. Yr 6
Area Prevalence (%) Recep. Yr 6 Recep.
Yr 6
ENGLAND 1.0 1.3 13.2 14.4 9.4 19.0 540,228 494,334 93.4 91.8
NORTH EAST 0.6 1.0 13.7 14.2 9.9 21.4 27,510 25,185 97.9 96.7
County Durham UA 0.5 1.1 13.5 14.3 9.5 21.6 5,245 4,971 99.2 99.1
Darlington UA x 1.4 12.8 13.7 9.8 16.8 1,194 1,034 98.8 96.2
Hartlepool UA 0.6 0.9 13.5 12.6 10.0 25.9 1,085 1,039 97.8 99.0
Middlesbrough UA 0.8 1.3 13.0 16.5 9.2 21.4 1,773 1,570 98.1 95.5
Northumberland UA 0.5 1.0 13.8 14.7 10.0 18.6 3,094 2,957 96.7 94.0
Former districts of:
Alnwick 2.0 2.2 9.9 12.2 5.3 16.7 303 270 92.3 95.4
Berwick-upon-Tweed x x 14.9 16.5 14.0 19.0 215 231 94.8 99.2
Blyth Valley x 1.2 17.1 16.5 10.9 20.5 918 838 96.4 94.8
Castle Morpeth 1.3 x 11.8 15.7 9.8 14.0 451 465 98.0 86.7
Tynedale x 1.1 15.1 13.3 9.3 15.3 548 535 97.2 94.5
Wansbeck x x 11.1 13.4 10.3 22.8 659 618 98.5 96.2
Redcar and Cleveland UA
0.9 1.4 14.3 12.7 9.6 19.2 1,466 1,369 96.0 93.6
Stockton-on-Tees UA 0.8 0.7 13.2 13.7 9.8 20.4 2,295 1,957 99.0 98.8
Tyne and Wear (Met) 0.6 1.0 14.1 14.1 10.2 22.6 11,358 10,288 97.7 96.5
Gateshead 0.5 0.9 14.5 14.4 9.2 23.1 1,899 1,781 97.5 97.7
Newcastle upon Tyne 0.8 1.0 15.3 13.5 10.6 24.5 2,770 2,504 97.5 95.0
North Tyneside 0.4 0.6 14.6 14.3 10.5 20.3 2,267 1,871 98.0 96.6
South Tyneside 0.9 1.5 11.3 13.5 10.3 22.3 1,473 1,434 97.3 98.0
Sunderland 0.4 1.0 13.7 14.5 10.1 22.1 2,949 2,698 97.9 96.1
© Crown copyright 2011. Source: The Health and Social Care Information Centre, Lifestyle Statistics/Department of Health Obesity Team NCMP
Dataset. x – Underweight prevalence estimates based on small numbers (1-5 individuals) have been supressed.
In Reception year, Newcastle has the largest proportion of obese children at a rate of 10.6%,
Gateshead and Middlesbrough have the smallest at 9.2%. Northumberland has an overall
prevalence of 10% which is higher than the North East (9.9%) and England average (9.4%).
Year 6 children display rather different figures. Hartlepool has the highest proportion of
obese children at 25.9%, Darlington (16.8%) and Northumberland (18.6%) have the lowest.
The North East average for Year 6 children is 21.4% and the England average is 19%.
Below County level, the latest data shows the former district of Berwick-upon-Tweed has the
highest proportion of obese children at Reception age (14%) and Wansbeck has the highest
proportion of obese children at year 6 (22.8%).
Northumberland Poverty and Worklessness Assessment – 2012 Update
49
11.0 Crime
There remains disagreement over whether crime can be considered a product of childhood
poverty. The social impacts of crime are substantial and far-reaching. They include
considerable financial, emotional and time costs to victims. (Griggs and Walker, JRF 2008)
Poverty can lead to an increased risk of being a perpetrator of crime and antisocial behaviour. However, it is not a direct link; other factors associated with being a perpetrator, such as parental depression and family conflict, can mediate the effects. (HM Treasury, 2008) Whilst the ‘causality’ debate is ongoing, it is important to recognise that most children raised
in poverty do not become involved in crime (HM Treasury, 2008). However, there are
certainly higher victim and fear of crime rates among those living in disadvantaged areas.
The perpetrators of crime have also been shown to be more likely to be the victims of crime
(HM Treasury, 2004 and 2008). (Sources: HM Treasury (2004) Chid Poverty Review. London: The Stationery
Office, HM Treasury (2008) Ending Child Poverty: Everybody’s Business. London: Crown. Available at http://www.hm-
treasury.gov.uk/media/3/F/bud08_childpoverty_1310.pdf)
The charts below summarise the most recent (April 2010–March 2011) notifiable offences
recorded by the police for England, the North East and more locally at a rate per 1,000 head
of population (using 2010 Mid Year Population Estimates).
Overall, Middlesbrough had the highest rate of offences at 87.9 per 1,000 head of
population, Northumberland and North Tyneside were the lowest with rates of 32.3 and 32.0
respectively. The rate per 1,000 head of population for England as a whole was 61.0 and for
the North East area it was 49.3.
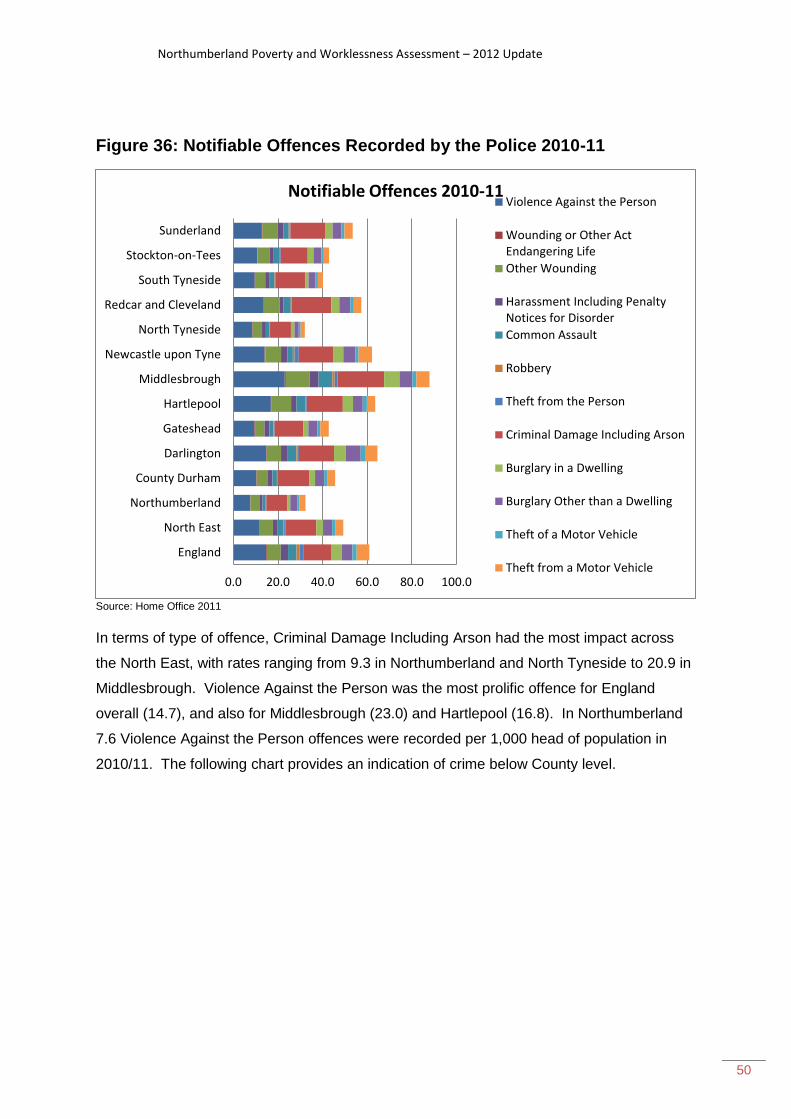
Northumberland Poverty and Worklessness Assessment – 2012 Update
50
Figure 36: Notifiable Offences Recorded by the Police 2010-11
Source: Home Office 2011 In terms of type of offence, Criminal Damage Including Arson had the most impact across
the North East, with rates ranging from 9.3 in Northumberland and North Tyneside to 20.9 in
Middlesbrough. Violence Against the Person was the most prolific offence for England
overall (14.7), and also for Middlesbrough (23.0) and Hartlepool (16.8). In Northumberland
7.6 Violence Against the Person offences were recorded per 1,000 head of population in
2010/11. The following chart provides an indication of crime below County level.
0.0 20.0 40.0 60.0 80.0 100.0
England
North East
Northumberland
County Durham
Darlington
Gateshead
Hartlepool
Middlesbrough
Newcastle upon Tyne
North Tyneside
Redcar and Cleveland
South Tyneside
Stockton-on-Tees
Sunderland
Notifiable Offences 2010-11 Violence Against the Person
Wounding or Other ActEndangering Life
Other Wounding
Harassment Including PenaltyNotices for Disorder
Common Assault
Robbery
Theft from the Person
Criminal Damage Including Arson
Burglary in a Dwelling
Burglary Other than a Dwelling
Theft of a Motor Vehicle
Theft from a Motor Vehicle
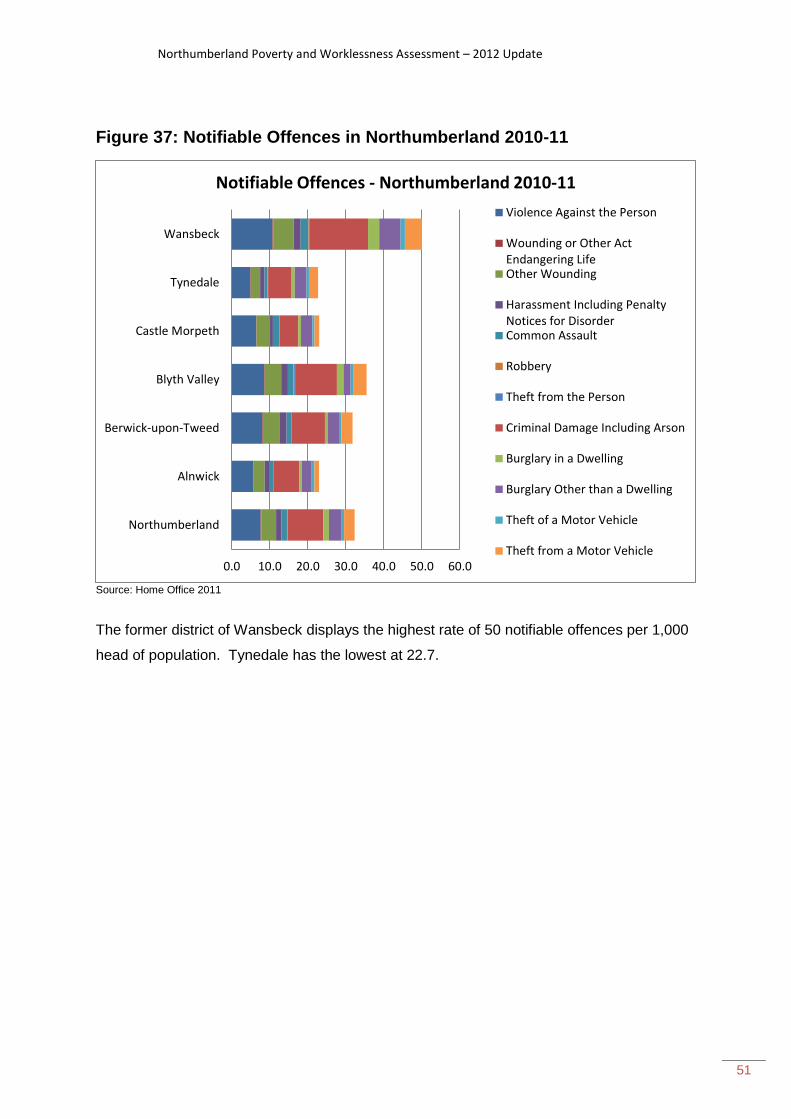
Northumberland Poverty and Worklessness Assessment – 2012 Update
51
Figure 37: Notifiable Offences in Northumberland 2010-11
Source: Home Office 2011
The former district of Wansbeck displays the highest rate of 50 notifiable offences per 1,000
head of population. Tynedale has the lowest at 22.7.
0.0 10.0 20.0 30.0 40.0 50.0 60.0
Northumberland
Alnwick
Berwick-upon-Tweed
Blyth Valley
Castle Morpeth
Tynedale
Wansbeck
Notifiable Offences - Northumberland 2010-11
Violence Against the Person
Wounding or Other ActEndangering LifeOther Wounding
Harassment Including PenaltyNotices for DisorderCommon Assault
Robbery
Theft from the Person
Criminal Damage Including Arson
Burglary in a Dwelling
Burglary Other than a Dwelling
Theft of a Motor Vehicle
Theft from a Motor Vehicle
Northumberland Poverty and Worklessness Assessment – 2012 Update
52
Policy and Research Team Transformation Group Northumberland County Council County Hall Morpeth Northumberland NE61 2EF [email protected] www.northumberlandinfonet.org.uk