not for quotation nor citation - uwa celt · not for quotation nor citation without an author’s...
TRANSCRIPT

Not for quotation nor citation without an author’s permission
June 2005
The Determinants of Students’ Tertiary Academic Success
by
Elisa Rose Birch Business School, University of Western Australia
and
Paul W. Miller*
Business School, University of Western Australia
Abstract Many factors influence students’ academic performance at university, including their prior academic ability, level of wealth and demographic traits. The characteristics of the secondary school attended by students also play an important role in influencing their university outcomes. This paper considers the determinants of grades for students at a large Australian university. Using both first- and second-generation approaches to modelling the determinants of academic success, it finds that university grades are largely influenced by students’ university entrance scores. Schools also appear to affect academic performance at university.
*Miller acknowledges financial assistance from the Australian Research Council and the Department of Education, Science and Training. The authors wish to acknowledge the assistance of the information services staff at the University that provided the data used for the research. Opinions expressed in this paper are those of the authors and should not be attributed to the funding agencies or the University providing the data.
1
The Determinants of Students’ Tertiary Academic Success
I Introduction
A growing concern for government and educators is the large number of university
students who fail their courses and withdraw from their study. Also of concern is the
fact that the proportion of students leaving university prior to the completion of study
has not changed over the past three decades. For example, in 1967 it was estimated
that approximately 42 per cent of students who had enrolled in university six years
earlier had not completed their degree (see Jackson, 1999). By 1997, the proportion of
students not completing their university study after five years of being at university
was still 39 per cent (see Martin et al., 2001a; Urban et. al., 1999; Jackson, 1999).
While some students who do not complete university may return to study, it has been
suggested that only half are likely to complete their course the second time around
(see Martin et al., 2001a).
The large number of students not completing their tertiary education has implications
for the effectiveness of government funding to the sector. In 2000-2001, the
Australian government provided approximately $13,635 million in financial support
for tertiary education (Australian Bureau of Statistics (ABS), 2004). This is equivalent
to around $11,840 per university student, (RMIT Student Union, 2003). Students who
fail their university courses, represent, to some extent, poor use of these public funds.
If at least 20 per cent of students do not complete their university courses (see Martin
et al., 2001a), it is possible to infer that the government may be spending close to
$2,727 million on university students who never obtain university qualifications. This
figure could be as high as $5,454 million if students who leave university prior to the
completion of their studies do not return to tertiary education.
Given the large proportion of students who do not complete their university
qualifications and the high possibility of wasted government funds within the sector,
it seems important that the government and educators have a clear understanding of
the factors which influence students’ academic performance at university. By
identifying students most at risk of failing university and subsequently not completing
their courses, the government, as well as educators, can tailor supplementary

2
programs for their needs. This should, in turn, reduce the level of wasted funds within
the sector.
There is only a small body of Australian literature which has studied the factors which
influence students’ success at universities.1 Of these, most suggest the main factor
influencing students’ grades is their tertiary entrance score and grades in high school.
To a lesser extent, school characteristics such as school type, and personal
characteristics such as wealth and gender, also impact on tertiary academic success.
This study improves the education sectors’ understanding of the factors which
influence student academic performance by estimating the determinants of students’
grades at a large Australian university. It has a particular focus on how students’
tertiary academic performance is influenced by factors which relate directly to the
individual, such as their university entrance scores, and factors which relate directly to
the secondary school attended by the individual, such as the school’s population.
The paper is structured as follows. Section II provides a brief review of the factors
which influence students’ grades at university. Section III discusses the theoretical
model and estimating procedures used. The empirical results from the analysis are
presented in Section IV and a summary of the major findings is given in Section V.
II Literature Review
Students’ tertiary academic success can be measured by a number of factors,
including broad indicators such as the completion of particular years of study (for
example, first-year or second-year) or the completion of their entire program of study.
Length of time to completion of studies could also be taken into account. More
detailed information could be obtained through examination of students’ grades for a
particular university course. This study has a focus on these more detailed measures
of academic success. In the first instance, relevant findings from the Australian and
international literatures on the factors which influence students’ grades at university
are reviewed. 1 While there are many Australian studies examining tertiary academic success (see Table 6 in the Appendix), most are largely descriptive and only a few quantify the relationships between students’ grades and particular characteristics. The body of literature in Australia is very limited compared to the body of literature overseas.

3
There have been several Australian studies which have examined the determinants of
students’ grades at university (these are summarised in Table 6 of the Appendix).2
These vary greatly in their focus, methodology, samples analysed and time periods
covered. Nevertheless, a number of interesting patterns are apparent.
First, it is very common for studies to analyse students’ grades using data samples
from individual universities. For example, Win and Miller (2005) consider student
grades at the University of Western Australia. Evans and Farley (1998) estimate the
determinants of performance for students at Monash University and Auyeung and
Sands (1994) analyse students’ results at Griffith University. In contrast, there have
been few ‘system’ wide analyses, perhaps because of the difficulties of comparing
grades across institutions.
Second, almost all the studies reviewed consider the grades obtained by first-year
students. The difficulties in categorising students into specific years (for example
second-year or third-year) when some students undertake split year programs may
account for this.
Third, the majority of studies examine the factors which influence students’ grades in
accounting units (see Farley and Ramsay, 1988; Ramsay and Baines, 1994; Rohde
and Kavanagh, 1996) or business courses (see Evans and Farley, 1998; Rodgers,
2002). This research strategy appears to offer a rich set of explanatory variables as the
studies are able to focus on aspects of course delivery. The limitation, however, is that
the results may not generalise to the wider student population.
The literature has identified a wide range of characteristics which have a significant
impact on students’ university grades, including their TER score, gender, age, race,
socio-economic status and school type.3 The following discusses how these
2 There have also been a number of studies which have examined the determinants of students’ graduation from university (see Urban et al., 1999; Martin et al., 2001a and 2001b). 3 Other characteristics that have been identified as major determinants of students’ grades include study habits, part-time employment, parents’ education and the costs of attending university. Various secondary school characteristics, such as those of the schools’ population and teaching quality, and university enrolment characteristics, such as field of study and mode of study, have also been considered. However, as there is only a limited number of studies that examine these variables, there is not enough substantial evidence to draw strong conclusions about their impact on university grades.

4
characteristics influence students’ academic performance. Comparisons are made
between the findings in Australian research and findings in overseas studies.
The main student characteristic identified as a determinant of academic success at
university is students’ previous academic achievement. Students who perform well
academically in high school or even primary school perform well academically at
university. The Australian studies that have found a positive relationship between
students’ tertiary grades and tertiary entrance scores include Win and Miller (2005),
Rohde and Kavanagh (1996), Evans and Farley (1998), Dickson et al. (2000), Logan
and Bailey (1983), Dale and Jennings (1986), Dancer and Fiebig (2004), Farley and
Ramsay (1988), Ramsay and Baines (1994), Watkins (1979), Smyth et al. (1990),
West (1985), Everett and Robins (1991), McClelland and Kruger (1993), and
Auyeung and Sands (1994). This finding is comparable to those presented in the wide
body of overseas research on the topic. For example, see Stinebrickner and
Stinebrickner (1994), Robst and Keil (2000) and Gist et al. (1996) for results for the
United States of America, Robb and Robb (1999) for results from Canada, Johnes and
McNabb (2004), Johnes (1997) and Lumsden and Scott (1987) for results for the
United Kingdom and Tay (1994) for results for Singapore.
As shown in Table 1, it appears that the relationship between students’ tertiary
entrance scores and their academic performance is more pronounced in studies using
recent data than in studies using data from an earlier time period. For example, West
(1985) reports that the estimated coefficient on students’ tertiary entrance score in the
estimation of the determinants of university grades was 0.47 using data from 1975,
and 0.52 using data from 1982. Ramsay and Baines (1994) report a similar pattern
using data from the 1980s and the 1990s.4 Table 1 also shows that most studies which
use data from before the mid 1990s indicate that a one percentage point increase in a
student’s tertiary entrance score would result in less than one-half a percentage point
increase in their university grades. In comparison, most studies that use data from the
mid 1990s onwards suggest that a one percentage point increase in students’ tertiary
entrance scores will lead to around a three-quarter to one percentage point increase in
their marks at university. 4 Farley and Ramsay (1988) report that the coefficients on the variable for university entrance scores fell over the early 1980s. However, this is opposite to the general pattern shown in the table.

5
Table 1 Estimated Coefficients on the Variable for Tertiary Entrance Scores: Selected Australian Studies Using OLS(a)
Study and Data
Dependent Variable(b) Explanatory Variables Included in the Model (c)
Estimated Coefficient for
Tertiary Entrance Score(d)
West (1985) -Data from 1975, 1980 and 1982.
-Credit rate.
-Higher School Certificate (HSC) (mark out of 100), and school type.
1975: 1980: 1982:
0.470.480.52
Farley and Ramsay (1988) -Data from 1981, 1982, 1984, and 1985.
-Students’ grade for the theory component of the unit, grade for the math component of the unit and aggregate grade in the first-year accounting unit.
-HSC (mark out of 100), whether completed accounting in school, whether completed maths in school, and grades in accounting at school.
-Theory 1981: 1982: 1984: 1985: -Maths 1981: 1982: 1984: 1985: -Final 1981: 1982: 1984: 1985:
0.160.130.080.09
0.040.050.010.02
0.330.350.140.18
Ramsay and Baines (1994) -Data from 1981, 1982, 1984, 1985 and 1993.
-Students’ grade for the theory component of the unit, grade for the math component of the unit and aggregate grade in the first-year accounting unit.
-HSC (mark out of 100), whether completed accounting in school, whether completed maths in school, grades in accounting at school, and gender.
-Theory 1981: 1982: 1984: 1985: -Math 1981: 1982: 1984: 1985: -Overall 1981: 1982: 1984: 1985: 1993 Sem. 1: 1993 Sem. 2:
0.170.130.080.09
0.040.05N.S0.02
0.340.350.140.180.880.88
-Essay All students: Males: Females:
N.SN.S0.20
-Multiple Choice All students: Males: Females:
0.14N.SN.S
-Aggregate Mark
Auyeung and Sands (1994) -Data from 1991.
-Students’ essay mark, multiple choice mark, and aggregate mark for the first-year accounting unit.
-University entrance score (mark out 990), grades in accounting at school and grades in two maths subjects at school (maths 1 and social maths).
All students: Males: Female:
0.32N.S0.37
Evans and Farley (1998) -Data from 1997.
-Students’ final grade in each of the compulsory first-year business units for two different campuses.
-TER score (rank out of 100), whether attended a ‘disadvantaged’ school, school type, whether studied English at school, grades for English at school, whether studied basic maths at school, grades for basic maths at school, whether studied advanced maths at school, grades for advanced maths at school, whether studied the same subject in school as studied at university, and grades in the same subject in school as the subject studied at university.
-Campus 1 -Sample 1 Economics: Business Com: Management: Accounting: Statistics: Marketing: -Campus 2 -Sample 1 Economics: Statistics: Management: Accounting:
N.SN.SN.SN.SN.SN.S
0.720.970.490.64

6
Table 1 Estimated Coefficients on the Variable for Tertiary Entrance Scores: Selected Australian Studies Using OLS(a)
Study/ Data/
Dependent Variable(b) Explanatory Variables Included in the Model (c)
Estimated Coefficient for
Tertiary Entrance Score(d)
Evans and Farley (1998) continued.
-Campus 2 -Sample 2 Economics: Statistics: Management: Accounting:
0.61 0.63 0.38 0.45
Win (2003) -Data from 2001.
-Students’ average weighted first-year mark.
-TER rank (mark out of 100), gender, locality of residence, socio-economic status, school type, school population, schools’ locality, co-educational school status, proportion of students with high TEE scores, proportion of students graduating from school, and the proportion of students taking four or more TEE subjects at school.
Model 1: Model 2: Model 3:
1.00 1.02 1.04
Notes: (a) For all studies examined, data samples are from single universities. (b) Credit rates refer to the number of subjects in which students obtained a credit or higher grade, as a proportion of the number of first-year units taken. (c) The metric for the tertiary entrance score is in parentheses. (d) N.S. refers to not significant at the 10 per cent level. Evans and Farley (1998) estimate the model using two different samples for the second campus considered. In Win (2003), Model 1 refers to the inclusion of only personal characteristics explanatory variables in the estimating equation, Model 2 refers to the inclusion of personal characteristics and school type explanatory variables in the estimating equation and Model 3 refers to the inclusion of all explanatory variables in the estimating equation.
Two other patterns emerge from Table 1. First, it appears that tertiary entrance scores
influence students’ final grades in a unit to a larger extent than they influence their
grades for a component of the unit. Farley and Ramsay (1988), Ramsay and Baines
(1994) and Auyeung and Sands (1994) indicate that the coefficients on tertiary
entrance scores for the estimations of grades for components of units were smaller
than they were in the study of aggregate grades in the units.
Second, tertiary entrance scores have a different impact on the grades for different
units studied. Hence, Evans and Farley (1998) show that the impact of university
entrance scores on students’ grades in first-year statistics was almost double the
impact that university entrance scores had on grades in first-year management units.
Similar to the overseas research, a positive relationship between grades in high school
and grades in university has also been reported by Evans and Farley (1998), Auyeung

7
and Sands (1994), Ramsay and Baines (1994), Farley and Ramsay (1988) and Dale
and Jennings (1986).5
The variables associated with grades in high school differ from the variables for
students’ tertiary entrance scores as they generally refer to students’ final grade for a
particular subject in secondary school. For example, Evans and Farley (1998) estimate
the impact of students’ final grade in mathematics at secondary school on their grades
at university.6
All the patterns apparent in Table 1 also occur in studies examining the impact of
grades in high school on academic performance at university (see Table 7 in the
Appendix). Thus studies which use data from before the mid 1990s tend to show that
a one percentage point increase in students’ grades in high school is associated with
about a one-third of a percentage point increase in their grades at university. Studies
using data from after the mid 1990s suggest that as students’ grades in high school
increase by a percentage point, their tertiary grades tend to increase by over one-half a
percentage point. The table also shows that the impact of students’ high school grades
on their marks for components of the university units was smaller than their impact on
students’ aggregate mark for the units studied (see Farley and Ramsay, 1988; Ramsay
and Baines, 1994; Auyeung and Sands, 1994). There were also variations in the
effects that high school grades have on university performance across different
university subjects and specifications of the model.
Gender is another characteristic linked with scholastic achievements at university. In
Australia, it is generally suggested that female students obtain higher grades than their
male counterparts (see Win and Miller, 2005; Dancer and Fiebig, 2004, Dobson and
Sharma, 1999; Ramsay and Baines, 1994; Smyth et al., 1990; Everett and Robins,
1991; Abbott-Chapman et al., 1992).7 Their academic advantage over their male
5 See Koh and Koh (1999) for results in Singapore, Smith and Naylor (2001) for results from the United Kingdom, Gist et al. (1996) and Eskew and Farley (1988) for results from the United States of America, and Robb and Robb (1999), Montarquette et al. (2001) and Anderson et al. (1994) for results from Canada. 6 Students’ tertiary entrance scores are generally measured by their Tertiary Entrance Rank (TER) and are representative of their aggregate final grade in high school for subjects that are recognised subjects for university entrance, as well as reflecting a school assessment component. 7 Rodgers (2002) found that students’ grades did not vary significantly by gender.

8
counterparts is, however, quite small. For example, Win and Miller (2005) and
Everett and Robins (1991) indicate that the grades for female students are only
approximately 2 percentage points higher than the grades for male students.
The findings in overseas studies, however, point to a different relationship than that in
Australia, with several studies reporting that male students have higher grades than
female students (see Borg et al., 1989; Myatt and Waddell, 1990; Gramlich and
Greenlee, 1993; Anderson et al., 1994; Robb and Robb, 1999; Tay, 1994) or that there
is no significant difference between the grades of men and women (e.g., see Brasfield
et al., 1993; Douglas and Sulock, 1995; Durden and Ellis, 1995; Gist et al., 1996;
Borde, 1998; Didia and Hasnat, 1998; Hoefer and Gould, 2000; Marcal and Roberts,
2000; O’Malley Borg and Stranahan, 2002).
The differences between the findings in the Australian and international literatures
may be a result of women in Australia being more encouraged to study and participate
in education than women in other countries.8 In recent years in Australia, many
female students have out-performed their male counterparts in university entrance
exams (see Hewitt, 2003; Nowicki, 2003). This has been attributed to differences in
the cultural attitudes towards education among female and male students (Hewitt,
2003). In addition, it had been suggested that as female students are more likely to
meet literacy and numeral requirements in primary school than male students,
differences in the academic abilities across women and men are more pronounced in
later life (Nowicki, 2003).
A student’s age may also affect their performance at university. Most research
suggests that older students have higher grades than younger students. For example,
Didia and Hasnat (1998), Douglas and Sulock (1995), Gramlich and Greenlee (1993)
and Borg et al. (1989) indicate that older students obtained higher grades than
younger students at universities in America. Likewise, De La Harpe et al. (1997) and
Smyth et al. (1990) report that tertiary grades were positively correlated with
students’ age in Australia. However, like the findings regarding gender, the impact of
students’ age on their grades at university is reported to be fairly minor. A number of 8 It may also be a result of the limited amount of research on academic performance in Australia compared to the amount of research overseas (or elsewhere).

9
studies indicate that for every one year increase in students’ age, average marks at
university increase by only two to four percentage points (see Borg et al., 1989 and
Didia and Hasnat, 1998).
The overseas literature has also identified that a student’s race is of importance to
their tertiary academic achievements, with numerous American studies suggesting
that white students have higher grades than non-white students (see Stinebrickner and
Stinebrickner, 2003; Robst and Keil, 2000; Durden and Ellis, 1995). Moreover, the
difference in the grades among white and non-white students appears to be fairly
substantial. For example, the estimated coefficient on the variable for non-white
students in the examination of students’ grades in Stinebrickner and Stinebrickner
(2003) was -0.18.
There are only a few Australian studies that examine the impact of race or ethnic
background on grades. Most of these indicate that students’ race only had a small
impact on their academic performance. Students from non-English speaking
backgrounds have been found to have slightly higher grades in a unit than students
from English speaking backgrounds (see Logan and Bailey, 1983; Long et al., 1994).
The higher grades of students who do not speak English at home may be a result of
them having greater motivation to study at university due to cultural factors that place
a premium on education (see Birrell, 1987).
Another characteristic recognised as a major factor influencing tertiary success is
students’ level of wealth or socio-economic standing. While this issue has not been
addressed substantially in Australia9, it has been overseas, with most research
showing a positive association between students’ wealth and their tertiary grades.
Hence, the analysis by Gramlich and Greenlee (1993) found that students who were of
a ‘minority’ due to their levels of income had lower grades at university than students
who were not classed as a ‘minority’. Similarly, Robst and Keil (2000) reported that
individuals who participated in university programs for low socio-economic students
9 Win and Miller (2005) examine the impact of the socio-economic status of students’ home neighbourhoods. They report a very small, positive relationship between the measure of socio-economic status and grades.
10
received lower marks in their university subjects than their counterparts who did not
participate in such programs.
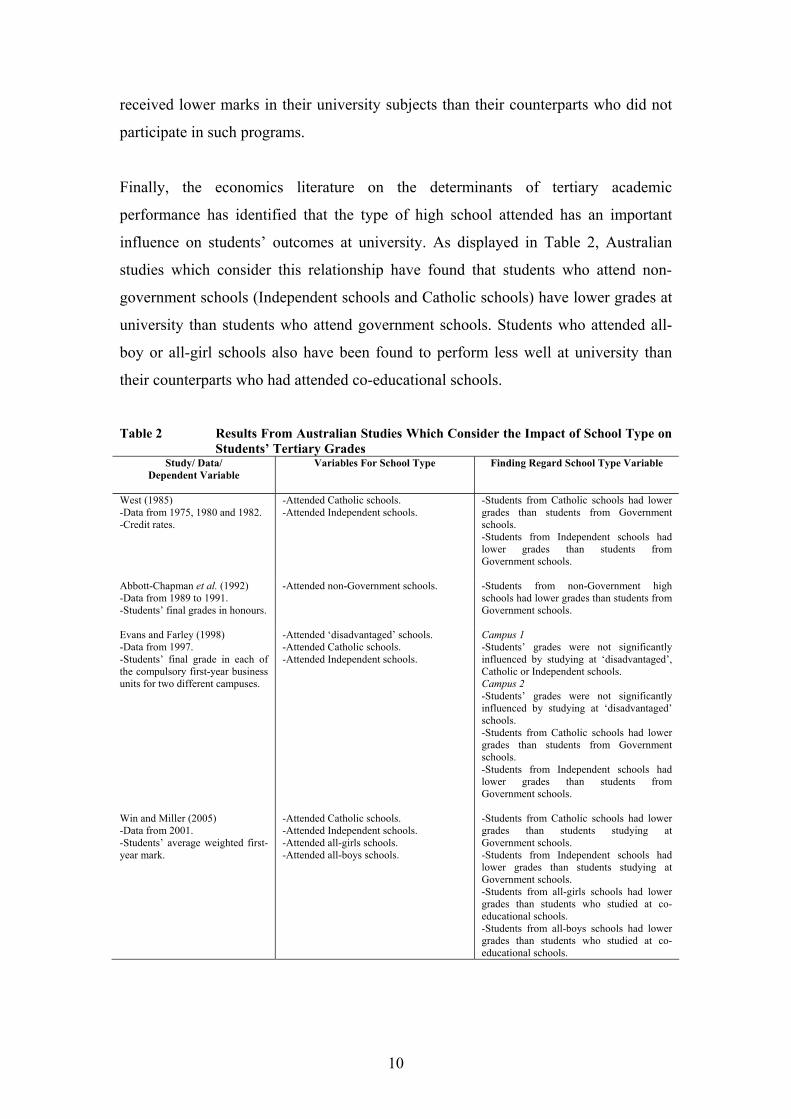
Finally, the economics literature on the determinants of tertiary academic
performance has identified that the type of high school attended has an important
influence on students’ outcomes at university. As displayed in Table 2, Australian
studies which consider this relationship have found that students who attend non-
government schools (Independent schools and Catholic schools) have lower grades at
university than students who attend government schools. Students who attended all-
boy or all-girl schools also have been found to perform less well at university than
their counterparts who had attended co-educational schools.
Table 2 Results From Australian Studies Which Consider the Impact of School Type on
Students’ Tertiary Grades Study/ Data/
Dependent Variable
Variables For School Type Finding Regard School Type Variable
West (1985) -Data from 1975, 1980 and 1982. -Credit rates.
-Attended Catholic schools. -Attended Independent schools.
-Students from Catholic schools had lower grades than students from Government schools. -Students from Independent schools had lower grades than students from Government schools.
Abbott-Chapman et al. (1992) -Data from 1989 to 1991. -Students’ final grades in honours.
-Attended non-Government schools. -Students from non-Government high schools had lower grades than students from Government schools.
Evans and Farley (1998) -Data from 1997. -Students’ final grade in each of the compulsory first-year business units for two different campuses.
-Attended ‘disadvantaged’ schools. -Attended Catholic schools. -Attended Independent schools.
Campus 1 -Students’ grades were not significantly influenced by studying at ‘disadvantaged’, Catholic or Independent schools. Campus 2 -Students’ grades were not significantly influenced by studying at ‘disadvantaged’ schools. -Students from Catholic schools had lower grades than students from Government schools.
-Students from Independent schools had lower grades than students from Government schools.
Win and Miller (2005) -Data from 2001. -Students’ average weighted first-year mark.
-Attended Catholic schools. -Attended Independent schools. -Attended all-girls schools. -Attended all-boys schools.
-Students from Catholic schools had lower grades than students studying at Government schools. -Students from Independent schools had lower grades than students studying at Government schools. -Students from all-girls schools had lower grades than students who studied at co-educational schools. -Students from all-boys schools had lower grades than students who studied at co-educational schools.

11
There are a number of reasons for these relationships. It has been suggested that
students from non-Government schools and all-boys or all-girls schools have
difficulties adjusting to university life (see Lampathakis, 2003). It has also been
argued that some students from private schools have their parents select their
university courses, resulting in these students enrolling in courses which they do not
want to undertake (Lampathakis, 2003). Win and Miller (2005) argue that as students
from non-government schools could have artificially inflated tertiary entrance
scores10, they may be shown in the statistical analysis to be outperformed by students
from government schools when holding students’ TER score constant.
In summary, there is a wide range of factors which influence students’ grades at
university. These factors appear to be clearly associated with students’ prior
educational attainments (measured by tertiary entrance score and grades in high
school) as well as motivation for university study (proxied by, for example, gender
and age).
III Theoretical Model and Estimation Method
The majority of studies estimating the determinants of students’ tertiary academic
performance are based on a simple production function, where a student’s academic
performance ( iAp ) is argued to be a function of their personal characteristics ( iPc )
and the characteristics of the secondary school attended ( jSs ). The production
function for the ith student who attended the jth secondary school is written as:
( ),, jii SsPcFAp = ,,1 ni …= .,,1 mj …= (1)
This educational production function has been estimated using a range of models,
though these can be broadly categorised into first- and second-generation
approaches.11 The distinguishing feature of first-generation models is that they are
based on a single equation that relates students’ academic performance to both
personal characteristics and school characteristics, as follows:
.210 ijii SsPcAp ε+β+β+β= (2)
10 Non-government school students could have artificially inflated tertiary entrance scores due to superior resources and attentive coaching at their secondary schools and elsewhere. 11 See Win and Miller (2005).

12
First-generation studies which measure academic success by students’ grades for a
unit given as a mark out of one hundred generally estimate equation (2) using OLS
(examples include Rodgers, 2002; Evans and Farley, 1998; Ramsay and Baines, 1994;
Stinebrickner and Stinebrickner, 2003). Studies which measure academic performance
by students’ grades, such as a ‘high distinction’, ‘pass’ or ‘fail’, usually estimate the
model using ordered probit procedures (examples include Tay, 1994; Smith and
Naylor, 2001; Didia and Hasnat, 1998; Marcal and Roberts, 2000).
The main limitation of first-generation studies is that they estimate the determinants
of academic performance using a single-level regression model with individual-level
data (such as data on students’ personal characteristics) combined with aggregate-
level data (such as data on secondary schooling characteristics). As such, the studies
do not take into account the fact that students are clustered within schools and hence
that the data are hierarchically structured. A number of problems can arise with the
use of such data in a single-level regression model. These include multicollinearity
between regressors, a failure to satisfy the assumptions of independence for one-level
models and misestimated standard errors (see Win and Miller, 2005; Hill and Rowe,
1996; Hanushek, 1987).
Second-generation studies are an emerging body of research which have attempted to
overcome the problems inherent in first-generation studies. Examples of such studies
include Win and Miller (2005) and Rumberger and Thomas (1993).12 These studies
examine the determinants of academic performance keeping a clear distinction
between the levels of data in the analysis. The models are estimated using hierarchical
linear modelling (HLM), which in the case of data having two levels is a conventional
random coefficients model. This estimation technique allows for the analysis of the
tertiary academic success of students from particular secondary schools, without
losing the distinction between the individual- and aggregate-level variables (see Kreft,
1993 and Win and Miller, 2005).
12 There is only a limited body of second-generation research on the determinants of tertiary students’ academic success. There is, however, a larger body of second-generation research on the determinants of academic success for secondary school students (e.g., Hill and Rowe, 1996; Lee and Bryk, 1988; Kreft, 1993).

13
HLM first considers the relationship between academic performance and individual-
level characteristics. Specifically it considers:
.10 iijji PcAp ε+β+β= (3)
In the model, aggregate-level variables (secondary school characteristics) are indexed
by ‘j’ while the individual-level variables (personal and university enrolment
characteristics) are indexed by ‘i’. The intercept ( 0β ) and the slope parameter ( 1β ) are
treated as random parameters. Variations in the intercept and slope parameters are
modelled using aggregate-level data and the equations:
,000 jjj Ss ν+α+β=β and (4)
,111 jjj Ss µ+α+β=β (5)
where jSsEj 000 )( α+β=β and .)( 111 jSsE
jα+β=β
The empirical analysis below draws upon both first- and second-generation
approaches to estimate the determinants of tertiary academic success. The majority of
the data used in the analysis are from the student records of a large comprehensive
Australian university.13 The data set contains information on students’ enrolment
details, such as their course type and grades, and their admission to university
characteristics, such as their TER scores. It also contains information on the
secondary schools attended by the students, including data on the size of the school
and the school’s location, as well as information on students’ personal characteristics,
such as gender.
The data sample is restricted to undergraduate students who were in their first-year of
university study in 2001 and for whom information was available on the secondary
school attended. Students who did not have a TER score or who completed secondary
education in a state other than that in which the university was located were excluded
from the sample. Overall, the data sample is comprised of 1,452 students.
To obtain an estimate of students’ socio-economic status, the analysis draws on data
from the ABS’s Index of Economic Resources for 2001. The Index of Economic
13 The data were kindly supplied anonymously by the University.

14
Resources is based on the annual income, dwelling size and rent and mortgage
repayments of families living in particular regions. Regions with high scores on the
index have a higher proportion of families with high incomes, more households living
in homes with more than three bedrooms and higher rent and mortgage payments
(ABS, 2001).14
Additional data on the characteristics of the secondary schools attended by students
are drawn from the relevant compilations of statistics on schools. Three characteristics
of schools are employed. They are the percentage of students who graduated from
secondary education, the percentage of students who took four or more TER subjects
and the percentage of students who obtained a high TER score on the completion of
secondary school.15 The first two of these indicators are used to represent the
effectiveness of the school and the university aspirations of the school’s students. The
third indicator is used to proxy the overall academic ability of the student body.16
The analysis measures first-year academic performance by students’ weighted
average first-year mark. This represents students’ average grade across the units of
study they were enrolled in after the penalty free withdrawal period had lapsed. Each
grade is weighted by the relative contribution of the unit studied towards the students’
degree. The mean weighted average first-year mark obtained by students was 58.7.
The main explanatory variable used in the analysis is the students’ TER scores. A
distinction is also made between students who had a TER score above the official cut-
off score for the university considered and those with a TER score below this
threshold. Approximately 10 per cent of the data sample had TER scores below the
University’s official minimum cut-off rank. The main reason for this is that the
reference university, like other universities, gives special consideration to students
14 As individual-level indicators of socio-economic status are not available, the Index of Economic Resources is the most appropriate alternative to use. This aggregate-level variable will measure the socio-economic standing of the individual with error. This is because some poor families may live in rich areas and rich families may live in poor areas. 15 These statistics are based on full-time students who were eligible for graduation in 2000 and on schools with twenty or more full-time eligible students. Students who attended schools with fewer than twenty full-time eligible students were given sample averages of the three characteristics considered. 16 The percentage of students with high TER scores is based on full-time eligible students taking the TER whereas the other two school indicators considered are based on all full-time eligible students in their final year of study.

15
who were affected by certain adversities when sitting the TER. This can be viewed as
analogous to the UWay program at the University of Western Australia described in
Win and Miller (2005).
As illustrated on Figure 1, there is a strong positive relationship between students’
weighted average marks at university and their TER score.17 This relationship occurs
for students with TER scores above the University’s official cut-off rank, and for
students with scores below the University’s cut-off rank. It is readily apparent,
however, that the relationship for students with TERs below the official cut-off score
of the reference university is on a higher trajectory than that for the other students.
This might be expected, given that other information, which would be expected to
impact positively on grades at university, was taken into account when making the
admission decisions.
Figure 1 Mean Weighted Average First-Year Mark by TER Score: Students with TER
Scores Above and Below Cut-Off Rank
50
55
60
65
70
75
OfficialTER
Cut-OffRank
100
TER Score
Mea
n W
eigh
ted
Ave
rage
Mar
k
Below Cut-Off Rank Above Cut-Off Rank
The other individual-level explanatory variables used in the analysis relate to whether
students were only accepted into their lower preference (third or fourth) course for
university, their gender, their locality and their socio-economic status. While 17 Table 8 in the Appendix presents the mean weighted average mark for students with different characteristics. The most striking feature of the data presented in the table is that the mean average weighted mark for many of the students with selected characteristics was similar.

16
information on home postcode is available in the data set, there is concern over its
reliability. Some students appear to report a term postcode as their home postcode.
Hence, the locality and socio-economic status variables are based as the postcodes of
the secondary schools attended by the students. Given that most students attended
secondary schools in areas close to their homes, the school’s locality and the socio-
economic status of the schools’ areas should provide good proxies for the students’
locality and socio-economic status.
The aggregate-level explanatory variables refer to the size of the secondary school,
the co-educational status of the school, the type of school, the percentage of students
graduating from the school, the percentage of students doing four or more TER
subjects at the school and the proportion of students with high TER scores from the
school. The codes names and description of each variable are presented in Table 3.
Table 3 Description of the Variables in the Models of the Determinants of Students’
Grades Variable/ Variable
Code
Description Mean Standard Deviation
Students’ Grade Grade Continuous variable for the students’ weighted average mark measured by a
mark out of one hundred. 58.658 14.139
TER Score TER Continuous variable for the students’ TER score. (a) TER Cut-off Rank Cutoff Dummy variable for students with a TER score below the official TER cut-
off rank for the university. (a)
NonCutoff Omitted category. (a) University Course Preference Third_Fourth Dummy variable for students who were accepted into courses that they
ranked as their third or fourth (out of a possible four choices) preference to university.
0.111 0.314
First_Second Omitted category. 0.889 0.314 Gender Female Dummy variable for women. 0.594 0.491 Male Omitted category. 0.406 0.491 Home Location NonCap Dummy variable for students whose home neighbourhood is located in the
non-capital city area (50 kilometres outside the capital city). Due to concerns over the accuracy of the data on students’ home postcodes, students’ home neighbourhoods are proxied by the neighbourhoods of the secondary school they attended.
0.159 0.366
Capital Omitted category. 0.841 0.366 Socio-Economic Status
SES Continuous variable for the socio-economic status of students. It is measured by the ABS’s Index of Economic Resources and is derived from the postcode of the secondary school the student attended.
1022.270 61.680
School Population Small Dummy variable for attendance at a secondary school with a small number of
students in their final year of study (100 students or less). 0.172 0.378

17
Table 3 Description of the Variables in the Models of the Determinants of Students’ Grades
Variable/ Variable
Code
Description Mean Standard Deviation
Medium Dummy variable for attendance at a secondary school with a medium number of students in their final year of study (101 to 200 students).
0.579 0.494
Large Omitted category. 0.249 0.433 School Gender Boy Dummy variable for studying at an all-boys secondary school. 0.048 0.214 Girl Dummy variable for studying at an all-girls secondary school. 0.064 0.245 Co-Ed Omitted category. 0.888 0.316 School Classification Catholic Dummy variable for studying at a Catholic secondary school. 0.161 0.368 Independent Dummy variable for studying at an Independent or Anglican secondary
school. 0.222 0.416
Government Omitted category. 0.617 0.486 Proportion of Students Doing Four or More TER Subjects TER4 Continuous variable for the percentage of students who took four or more
TER subjects at the secondary school. 62.001 15.881
Proportion of Students Graduating High School Graduate Continuous variable for the percentage of students who graduated from the
secondary school. 91.693 6.307
Proportion of Students With High TER Scores HighTER Continuous variable for the percentage of students with high TER scores
upon the completion of secondary school for the secondary school. 30.183 13.042
Notes: (a) Statistic is not reported for confidentiality reasons.
The empirical analysis first considers how the individual-level characteristics
influence grades at university. It uses the estimating equation:
iGrade = .
_
6
543210
ii
iiiii
SESNoncapFemaleFourthThirdCutoffTER
ε+β+β+β+β+β+β+β
(6)
It then broadens the range of factors that might affect the university grade to a number
of aggregate-level variables. A single-level linear equation is used in this instance,
given by:
iGrade =
.
_
15141312
11109876
543210
iiiii
iiiiii
iiiii
HighTERGraduate4TERtIndependenCatholicGirlBoyMediumSmallSES
NoncapFemaleFourthThirdCutoffTER
ε+β+β+β+β+β+β+β+β+β+β
+β+β+β+β+β+β
(7)
Equations (6) and (7) are based on a first-generation model approach to the
examination of the determinants of academic performance.
The second stage of the analysis is based on second-generation approaches to
estimating the determinants of academic success. It takes into consideration that the

18
school characteristics are comprised of aggregate-level data while personal and
university enrolment characteristics are comprised of individual-level data and that, as
discussed above, there are advantages to keeping the data collected at different levels
separate. The analysis uses equation (6) as a starting point, and then models the
constant term ( j0β ) and the slope coefficient for students’ TER score (j1β ) as random
parameters that vary according to the aggregate-level variables (the school
characteristics). The constant term changes according to the equation:
j0β =.8765
432100
jjjjj
jjjjj
HighTERGraduate4TERtIndependen
CatholicGirlBoyMediumSmall
ν+α+α+α+α
+α+α+α+α+α+β
(8)
The slope coefficient for students’ TER score changes according to:
j1β =
.8765
432101
jjjjj
jjjjj
HighTERGraduate4TERtIndependen
CatholicGirlBoyMediumSmall
µ+γ+γ+γ+γ
+γ+γ+γ+γ+γ+β
(9)
The only slope coefficient in equation (7) that is treated as a random parameter is that
for students’ TER score. This reflects the emphasis on this variable as the key
predictor of academic performance at university in past studies.
IV Empirical Results
Table 4 presents the results from the model to estimate the determinants of students’
academic performance based on a first-generation approach. The dependent variable
in the estimating equation is students’ average weighted first-year mark. So that
students’ predicted (either in-sample or out-of-sample) average weighted mark cannot
be less than zero or greater than one hundred, the dependent variable is transformed
using a logistic function:
iGrade =Log ( )
− i
i
GradeGrade0.100
. (10)
Column (i) presents results from when the model is estimated using just individual-
level characteristics (equation (6)) and column (ii) presents results from when the
model is estimated using both individual-level and aggregate-level characteristics in
one single linear equation (equation (7)). In each case, the equation was estimated

19
using OLS.18 Each column presents the estimated coefficient for the variables, their
associated ‘t’ statistics and the marginal effects. In the case of dummy variables the
marginal effects refer to percentage point differences in average weighted marks
between the students with the characteristics considered and students in the omitted
category. In the case of continuous variables they refer to the change in first-year
marks per unit change in the independent variable. The marginal effects are calculated
using:
( ) ( ) ,100100
−⋅
β=∂
∂ GradeGradeX
Gradex
(11)
where X is the representative explanatory variable. They are evaluated at the mean of
the students’ average weighted first year mark (mean of 58.66).
With the exception of the variable for socio-economic status19, all of the individual-
level variables were highly significant in the specification of the model presented in
column (i). Consistent with most of the findings in Australian studies reviewed in
Section II, there was a strong positive relationship between students’ average
weighted first-year mark and their TER score (TER). Moreover, the relationship holds
regardless of whether the students’ TER was above or below the official cut-off rank
for the University: an interaction term designed to test for differences in the
relationship was statistically insignificant. Consistent with the unstandardised data
presented in Figure 1, however, the relationship between first-year academic
performance and TER for those with a TER below the official TER cut-off rank is on
a higher trajectory than that of students with a TER above the official cut-off rank.
Figure 2 illustrates these relationships, based on the estimated coefficients in column
(i) of Table 4. It shows that students’ predicted average weighted first-year mark
increases approximately 2.8 percentage points for every 5 percentage point increase in
their TER score.
18 The standard errors have been corrected for heteroscedasticity. 19 While socio-economic status (SES) was insignificant when the model was estimated with the inclusion of only individual-level variables, it was significant when the model was estimated with the inclusion of both individual-level and aggregate-level variables. In this instance, students who lived in home neighbourhoods with a higher score on the Index of Economic Resources had slightly higher university marks than their counterparts whose home neighbourhoods had a lower score on the index, with an increase of 50 points on the Index of Economic Resources resulting in a 1 percentage point increase in student’s grades.

20
Figure 2 Predicted Average Weighted First-Year Mark by Students’ TER Score
50.00
55.00
60.00
65.00
70.00
75.00
Official
TER Cut-Off R
ank 100
TER Score
Pred
icte
d M
ean
Ave
rage
Wei
ghte
d Fi
rst-
Yea
r M
ark
Below the Cut-Off Rank Above the Cut-Off Rank
The variable for TER score was also entered in quadratic form in the model to
examine whether there were any non-linearities in the relationship between TER
scores and first-year university grades. Under this specification, both the linear and
quadratic TER variables were insignificant.
The estimated coefficient on the binary variable recording whether a student had a
TER below the University’s official cut-off rank (Cutoff ) shows that these students
have first-year university marks that were, on average, 7.4 percentage points higher
than their counterparts whose TER score was above the cut-off rank. This finding may
reflect these students being more motivated to study at university than students who
gained entry to university on the basis of having a TER score above the cut off rank. It
is also a reflection of the use of other information in admission decisions by university
administrators which appears to be well correlated with academic success in first-
year. This suggests that the use of composite measures in university admission
decisions may have considerable merit. The use of such measures has previously been
canvassed by Everett and Robins (1991), who argue that composite scores might be
formed using school assessment, external examinations and scores achieved in
individual subjects. This list could be expanded to include characteristics of the
school attended (e.g. urban or rural) and the circumstances of the individual (e.g.
hardship experienced during high school).

21
Table 4 Results From the Estimation of the Determinants of First-Year Academic Performance: First-Generation Approaches
Column (i) Column (ii)
Individual-Level Characteristics Only(a)
Individual-Level and Aggregate-Level
Characteristics(a)
Variable(c) Coefficient
‘t’ Value
Marginal Effect
Coefficient ‘t’ Value Marginal Effect
Constant -1.892 -5.189 * -2.40 -4.821 * TER Score TER 0.023 8.216 * 0.558 0.024 8.331 * 0.582 TER Cut-off Rank Cutoff 0.304 3.790 * 7.372 0.303 3.831 * 7.348 University Course Preference Third_Fourth -0.158 -2.440 ** -3.832 -0.158 -2.467 ** -3.832 Gender Female 0.214 5.838 * 5.190 0.231 5.859 * 5.602 Home Location NonCap 0.141 2.931 * 3.419 0.101 1.949 *** 2.449 Socio-Economic Status SES 0.035 1.167 0.090 2.640 * 2.183 School Population Small (b) 0.094 1.380 Medium (b) 0.034 0.616 School Gender Boy (b) 0.047 0.595 Girl (b) -0.138 -1.556 School Classification
Catholic (b) 0.022 0.468 Independent (b) -0.052 0.714 Students With Four TER Subjects
TER4 (b) <-0.001 -0.474 Students Graduating Graduate (b) <0.001 0.122 Students With High TER Scores HighTER (b) -0.004 -1.704 *** -0.097 Adjusted r2 = 0.096 Adjusted r2 = 0.105 F-test (6, 1,445) = 26.280 F-test (15, 1,436) = 12.390 Mean Grade = 56.66 Mean Grade = 56.66 Sample Size = 1,452 Sample Size = 1,452 Notes: (a) The symbol * represents significant at the 1 per cent level, the symbol ** represents
significant at the 5 per cent level and the symbol *** represents significant at the 10 per cent level. The marginal effects are only reported for those variables of statistical significance.
(b) The variable was not entered in the estimating equation. (c) Overall, the set of school characteristics included in the model was significant at the 1 per cent level (F-test (9, 1,436) = 2.59).
Comparable with the results presented in McClelland and Kruger (1993), Table 4
shows that students who were accepted into their third or fourth preference at
university (Third_Fourth) had marks that were 3.4 percentage points lower than
students who were accepted into their first or second university preference. This

22
finding may be a result of these students having lower motivation to achieve high
grades than students who were accepted into their first or second choices of university
courses. The inclusion of this variable did not have any impact on the estimated
coefficient for TER score. Hence, the estimated coefficient for the TER variable
without ‘Third_Fourth’ in the model was 0.024, and it was only marginally different,
at 0.023, when the ‘Third_Fourth’ variable was included in the estimating equation.
Female students (Female) and students who lived outside the capital cities (NonCap)
were found to have higher mean marks than their respective counterparts in their first-
year of university study. The difference between the grades of male and female
students was 5.2 percentage points, and there was a 3.4 percentage point difference in
the grades of students from the capital city and students from non-capital city areas.
These findings are consistent with most of the literature in Australia (e.g. see Win and
Miller, 2005; Dobson and Sharma, 1999; Ramsay and Baines, 1994 for studies on the
effect of gender on students’ grades and Dickson et al., 2000 for research on the
impact of students’ locality of residence on their academic performance), though the
standardised differential between the mean marks of men and women exceeds the
differential that has been reported in other studies.
Column (ii) in Table 4 presents the results of the examination of the determinants of
academic performance when school characteristics are included in the model. It
appears that the inclusion of these aggregate-level variables in the single-level linear
model does not greatly improve the model’s explanatory power. Hence, the adjusted
r2 for the model estimated with just the individual-level characteristics was 0.10. It
was 0.11 when the model was estimated with both aggregate-level and individual-
level data. The F-test on whether the extra variables added to the explanatory power
of the model is significant (F-test (9, 1,436) = 2.59).
Only one of the additional explanatory variables was significant, namely that for
students who attended secondary schools with a higher proportion of students doing
well on the TER (HighTER). This variable was negatively associated with student’s
weighted average first year marks. However, this relationship is only at the margin of
statistical significance. It is also only very minor in empirical importance, with a 5

23
percentage point increase in the proportion of students with high TER scores resulting
in only a 0.4 percentage point decrease in students’ university grades.20
The large number of insignificant secondary school regressors in the model is
consistent with Win (2003) and Hanushek (1986), who both report that many first-
generation studies find that students’ grades at university are not influenced by the
characteristics of the secondary school they attended. It may suggest that students’
first-year tertiary academic performance is predominately influenced by their TER
score. It may also emphasise the problems in the estimation of models of student
outcomes using multi-level data within the framework of a single-level regression
model.21
Table 5 presents the results from a second-generation approach to estimating the
determinants of tertiary academic success. In this model, the individual-level variables
TER, Cutoff, Third_Fourth and Female were included in the estimating equation as
deviations from the mean for that variable for the secondary school attended. The
coefficients for these variables, therefore, are able to be interpreted as impacts for
students who have a value of a particular characteristic more or less than the mean for
the school attended. They can be thought of as capturing within-school effects. The
remaining variables, NonCap, SES, TER4, Graduate and HighTER, were, reflecting
the level for their measurement, included in the estimating equation as deviations
from the variables’ overall means in the data sample. In this form, the impacts of
these variables on academic performance are interpreted as impacts for students from
particular schools (see Win and Miller, 2005 for further discussion). In other words,
these impacts record inter-school effects. This specification does not have any major
impact on the results, though the intra-school, inter-school distinction is generally
argued to assist interpretation of findings when multiple-level data are analysed.
There are three parts to the table. The first part is for the non-random coefficients and
for the mean of the random coefficients. The second part is for the estimates of the 20 The ‘HighTER’ variable was insignificant when the model was estimated without the inclusion of the ‘TER’ and ‘Cutoff’ variables in the estimating equation. 21 The model was also estimated with the individual-level variables entered as deviations from the mean for the school attended by the student, a data transformation that has been used in many second-generation studies (see Table 9 in the Appendix). These results are very similar to those presented in Table 4.

24
parameters used to model the heterogeneity in the constant term. The final set of
estimates pertain to the parameters used to model heterogeneity in the coefficient on
the TER variable.
Table 5 Results From the Estimation of the Determinants of First-Year Academic Performance: Second-Generation Approach
Column (i) (a) Variable Coefficient
‘t’ Value
Marginal Effect
Constant 0.345 13.518 * TER Score TER 0.015 4.423 * 0.218 TER Cut-off Rank Cutoff 0.293 6.931 * 7.105 University Course Preference Third_Fourth -0.169 -4.890 * -4.098 Gender Female 0.247 10.564 * 5.990 Home Location NonCap 0.137 4.420 * 3.322 Socio-Economic Status SES 0.101 4.864 * 2.449 Intercept Heterogeneity School Population Small 0.107 2.288 ** 2.595 Medium
0.006 0.189
School Gender Boy -0.085 -1.437 Girl -0.029 -0.501 School Classification
Catholic -0.056 -0.734 Independent
-0.036 -0.855
Students With Four TER Subjects TER4 <-0.001 -0.902 Students Graduating
Graduate 0.004 1.515 Students With High TER Scores HighTER -0.003 -2.263 ** -0.007 TER Slope Heterogeneity School Population Small 0.017 2.855 * 0.412 Medium 0.013 3.126 * 0.315 School Gender Boy -0.024 -3.284 * -0.582 Girl -0.011 -1.597 School Classification
Catholic 0.010 2.341 ** 0.243 Independent -0.013 -2.422 ** -0.315

25
Table 5 Results From the Estimation of the Determinants of First-Year Academic Performance: Second-Generation Approach
Column (i) (a) Variable Coefficient
‘t’ Value
Marginal Effect
Students With Four TER Subjects TER4 <0.001 4.244 * 0.013 Students Graduating Graduate -0.001 -4.268 * -0.024 Students With High TER Scores HighTER <0.001 4.266 * 0.016 Maximum Log Likelihood = -5380.334 Mean Grade = 56.66 Sample Size = 1,452 Notes: (a) The symbol * represents significant at the 1 per cent level, the symbol ** represents
significant at the 5 per cent level and the symbol *** represents significant at the 10 per cent level. The marginal effects are only reported for those variables of statistical significance.
The estimates for the variables with constant coefficients, and also of the mean impact
of the two random coefficients, are similar to those reported in the OLS model in
Table 4 (column (ii), results for the more encompassing model).22 Hence, the
discussion will focus on the estimates of the sub-models of intercept heterogeneity
and of the TER slope heterogeneity.
Similar to the examination of the impact of school-level variables on first-year
university academic performance using the first-generation approach, Table 5 shows
that many of these variables were insignificant when they were used to account for
heterogeneity in the intercept. Two exceptions to this are the variables for attendance
at a school with a small population of Year 12 students (Small) and attendance at a
school with a large proportion of students with high TER scores (HighTER). Students
who attended schools with a small number of students in their final year had, on
average, a mean grade at university that was 2.6 percentage points higher than the
mean university grade of students who attended schools with a large number of
students in their final year. The mean university achievements of students who
attended schools with a larger proportion of the student body with high TER scores
was less than the mean achievements for students who attended schools with a small
proportion of students with high TER scores. However, this relationship was only
slight, with the estimated coefficient on the variable being -0.003. This result is
22 The difference between the constant terms in the two sets of results is associated with the use of variables as deviations from means in Table 5.

26
discussed further below. Thus, the main finding from this set of results is that schools
are not generally linked to any overall upward (or downward) shift in the tertiary
achievements of their students. There are, however, more subtle schools effects from
modelling the heterogeneity in the coefficient on the TER variable.
Many of the school-level variables were significant determinants of the heterogeneity
in the slope of the TER score variable. In other words, school characteristics can have
a substantial impact on the relationship between students’ first-year university marks
and their TER score, and this is how they impact on students’ grades at university.
The relationship between first-year academic performance and TER is more intense
for students from small or medium high schools (Small and Medium) than for students
from high schools with a large population of students in their final year. Indeed, the
impact of the TER variable is almost twice as large, on average, for a student from a
small or medium high school than it is for a student from a large school.
Figure 3 Predicted Average Weighted First-Year Mark by Students’ TER Score and
School Size
51.00
56.00
61.00
66.00
71.00
76.00
81.00
70 75 80 85 90 95 100
TER Score
Pred
icte
d A
vera
ge W
eigh
ted
Firs
t-Y
ear
Mar
k
Small Schools Medium Schools Large Schools
In the case of students from small schools, therefore, there is a positive impact on
both the intercept and the effect of TER. This means that these schools have a
favourable effect on the subsequent academic success of all their students, but a far

27
greater impact on the subsequent academic success of their more able students. This
relationship is illustrated in Figure 3, which shows that there is little difference in the
predicted average weighted first-year mark for students from small and large schools
who have TER scores of 65-70. In comparison, students from small schools with a
TER score of 95 have predicted grades that are 10 percentage points higher than the
grades for their counterparts with the same TER score who attended large schools.
The school classification variables, Catholic and Independent, are also associated with
significantly different relationships between TER and academic performance at
university. This relationship is more intense for students from Catholic schools than it
is for students from government schools. It is less intense for students from
Independent schools than it is for students from government schools.
Combined with the point estimates of the impact of school classification on the
intercept, the results noted above mean that students from Catholic schools have
better first-year university results than students from government schools. In turn,
students from government schools have better first-year university results than
students from Independent schools. The ranking of government schools and
Independent schools is similar to that reported in Win and Miller (2005). However,
the relative standing of Catholic schools in the current analysis is superior to that
reported by Win and Miller (2005) for first-year performance at the University of
Western Australia. The finding for Independent schools may be related to the
argument advanced by Win and Miller (2005), that non-religious private schools may
have inflated TER scores, and hence the impact of their TER scores on the tertiary
academic performance is less than that for students from government schools.
The three school-level variables used to represent the effectiveness of the school and
the overall academic ability of the student body, namely the variables ‘TER4’,
‘Graduate’ and ‘HighTER’, only had very minor impacts on the slope of the TER
variable. The relationship between first-year academic performance and students’
TER scores was marginally more pronounced among students who attended schools
with a higher proportion of students doing four or more TER subjects (TER4) and
schools with a larger proportion of students with high TER scores (HighTER).

28
Attending schools with a higher proportion of students graduating had a small
negative impact on the slope of the TER variable.
The negative coefficient on the variable for the proportion of students graduating is
counter-intuitive. This coefficient does, however, need to be read in conjunction with
the impact of this school variable on the intercept (positive effect of 0.004, ‘t’ statistic
of 1.58). Hence, students from schools with a high proportion of students graduating
have relatively favourable first-year university performance if they have a low TER.
They have a less favourable first-year university performance if they have a high
TER. That is, low-achieving students do better from this aspect of the school
environment, a phenomenon Win and Miller (2005) refer to an immersion effect.
In the case of the other aggregate school environment variables, the effects on the
coefficients of the TER variable are evidence of positive externalities from studying
with other high aspiring and high achieving students. Again, adopting the terminology
of Win and Miller (2005), this is a reinforcing effect of enrolment at such schools.
Not only do students benefit via a higher TER, they also benefit in that higher TER
translates into a better outcome at university that would occur if they had studied at a
high school with a smaller proportion of students doing three or more TER subjects or
doing very well on the tertiary entrance assessments.
The results from the second-generation approach to estimating the determinants of
first-year academic success are more versatile than the results from the first-
generation approach. This is because the second-generation approach allows for the
separate analysis of the impact of individual-level characteristics and school-level
characteristics on tertiary academic performance. In addition, as shown in the results
above, the second-generation approach to estimating the determinants of grades at
university also allows for analysis of the direct impact of school-level characteristics
on students’ university grades as well as the indirect impact of the school
characteristics on university grades, via their impact on students’ TER scores.
V Conclusion
This paper has examined the determinants of first-year academic success at a large
Australian university. Drawing on both first- and second-generation approaches to

29
estimating the determinants of students’ grades, the analysis considered the impact of
individual-level as well as school-level characteristics on students’ performance at
university.
The first-generation approach to estimating the determinants of academic success,
where both individual-level and aggregate-level variables are included in a single
regression model, suggests that students’ grades at university are largely influenced
by individual-level characteristics. Grades are positively correlated with TER scores,
having a TER score below the official cut-off rank, being female and living outside
the capital city. Grades are negatively associated with acceptance into a third or fourth
preference at university. Almost all of the school-level characteristics are insignificant
regressors in the first-generation model. These findings are consistent with the
majority of the Australian and overseas studies.
The second-generation approach to estimating the determinants of academic success
considers the determinants of first-year university grades for students from particular
high schools, keeping the distinction between individual-level and aggregate-level
variables. It finds that, within schools, the relationship between students’ university
grades and individual-level characteristics is similar to that reported for the first-
generation approach to estimation. It also finds that schools do not directly influence
students’ grades at university. Rather, they play an important role in influencing the
relationship between students’ first-year marks and their TER score. Students who
attended small or medium sized schools, Catholic schools, schools with a larger
proportion of students doing four or more TER subjects and schools with a larger
proportion of students doing well on the TER appear to have a stronger relationship
between their university grades and TER scores than students who attended other
schools. The relationship between first-year university marks and TER scores was
weaker among students who went to Independent schools and all-boy schools.
The findings associated with students’ TER score and grades at university suggest that
students’ TER score is a good measure for their admission to university. However, the
findings associated with university grades and a TER score below the university’s cut-
off rank also indicate that there could be advantages in not basing students’ admission
to university solely on the grounds of their TER score. Other criteria, such as

30
students’ grades in high school and whether they are from a disadvantaged
background may be of merit in the student selection process for entrance to university.
Furthermore, the analysis also identified that school characteristics affect the
increments in students’ grades associated with their TER. As such, there may be
benefits for the university admission process to take into account the characteristics of
the school which the student attended, such as school type. Indeed, this appears to be
of great importance if students are from schools which may have inflated TER scores.
The findings also identify groups of students who do not perform well at university.
These students may need to attend courses which assist in transition from secondary
schooling to tertiary studies. It is clear that students who are male, have lower TER
scores, have a TER score only slightly above the official minimum score for
university entry, are not accepted into their first or second preference course or live in
the capital city have lower grades than other students. Studying at Independent
schools, all-boys schools or large sized schools also results in lower university
grades.23 As these findings are comparable with other studies, such as Win and Miller
(2005), they may hold for the entire tertiary education sector, not just the reference
university. As such, government policy targeting these groups could reduce the
wastage rates at university.
On a final note, the results have shown that second-generation approaches to
estimating the determinants of academic success provide greater insight into the
factors affecting students’ grades than first-generation approaches. Hierarchical linear
modelling, used in second-generation approaches, allows for the analysis of the
factors which directly influence students’ grades and those which indirectly influence
their grades. It shows whether particular school characteristics act as positive or
negative externalities on academic success. Future studies on the determinants of
academic success should consider the second-generation approaches to obtain a fuller
understanding of the factors which influence students’ university outcomes.
The models used to account for tertiary academic performance in this paper could be
useful in many other applications. Economists regularly analyse, using single-level
23 Although this occurs indirectly rather than directly.

31
models, data that have been collected on multiple levels. For example, studies on
nurses might be based on data relating to the characteristics of nurses and of the
hospitals in which they work. More generally, studies of employees might be based
on workers’ attributes and features of the firms or plants at which they work. Studies
of consumers could draw upon demographic and economic data of consumers and
aggregate-level data on the neighbourhood in which the consumers live. Hierarchical
linear modelling is certainly another approach that could be considered in research of
this nature.

32
Appendix
Table 6 Summary of Australian Studies Which Estimate the Determinants of Students’ Tertiary Grades
Study
Measurement of Academic Performance (a)
Sample
Watkins (1979) -Students’ average first-year mark for each unit (mark out of 100).
-Students who were enrolled in first-year courses at the University of New England.
Logan and Bailey (1983)
-Student pass rates.
-Students who were enrolled in a first-year physics unit at the New South Wales Institute of Technology.
West (1985) -Students’ average first-year mark for each unit (fail, pass, credit, distinction or high distinction). -Student pass rates. -Student credit rates.
-Students who were enrolled in first-year courses at Monash University.
Dale and Jennings (1986)
-Students’ mark for the unit (mark out of 100).
-Students who were enrolled in a first-year mechanics unit and general physics unit at Murdoch University.
Farley and Ramsay (1988)
-Students’ mark for the unit (mark out of 100).
-Students who were enrolled in a first-year accounting unit at Monash University.
Smyth et al. (1990) -Students’ average first-year mark for each unit (mark out of 100). -Student pass rates.
-Students enrolled in a first-year arts or science course at the University of Western Australia.
Everett and Robins (1991) -Student pass rates. -Students enrolled in first-year courses at the University of Western Australia.
Abbott-Chapman et al. (1992)
-Students’ final grade in honours (first-class honours, upper second-class, lower second-class and fail).
-Students who were studying honours at the University of Tasmania.
McClelland and Kruger (1993)
-Student credit rates. -Students enrolled in first-year courses at Queensland universities.
Auyeung and Sands (1994)
-Students’ essay grade for the unit. -Students’ multiple-choice grade for the unit. -Students’ computing grade for the unit. -Students’ aggregate mark for the unit (mark out of 100).
-Students who were enrolled in a first-year accounting unit at Griffith University.
Long et al. (1994)
-Students’ mark for each unit (fail, pass, credit, distinction or high distinction). -Student failure rates.
-Students who were enrolled in four major Australian universities.
Ramsay and Baines (1994) -Students’ mark for the unit (mark out of 100).
-Students who were enrolled in a first-year accounting unit at Monash University.
Rohde and Kavanagh (1996)
-Students’ mark for the unit (mark out of 100).
-Students who were enrolled in a first-year accounting unit at the University of Queensland.
De La Harpe et al. (1997)
-Students’ mark for the unit (mark out of 100).
-Students who were enrolled in an educational psychology unit at Curtin University.
Evans and Farley (1998)
-Students’ mark for each compulsory first-year unit (mark out of 100).
-Students who were enrolled in first-year business courses at Monash University.
Dobson and Sharma (1999)
-Student failure rates. -Students who were enrolled in publicly funded universities.

33
Table 6 Summary of Australian Studies Which Estimate the Determinants of Students’ Tertiary Grades
Study
Measurement of Academic Performance (a)
Sample
Dickson et al. (2000) -Students’ grades in the unit (‘A’, ‘B’, ‘C’, ‘D’ or ‘F’).
-Students who were enrolled in a second-year childhood literacy unit at an Australian university.
Rodgers (2002) -Students’ mark for the unit (mark out of 100).
-Students who were enrolled in a first-year statistics unit at an Australian university.
Dancer and Fiebig (2004)
-Students’ grades for the unit (log odds of failing over discontinuing; the log odds of passing over discontinuing, the probability of passing over failing).
-Students who were enrolled in a first-year econometrics course at the University of Sydney.
Win and Miller (2005) -Students’ average first-year mark for each unit (mark out of 100).
-Students enrolled in first-year at the University of Western Australia
Notes: (a) Pass rates refer to the number of units a student passed as a proportion of the number of units they were enrolled in. Credit rates refer to the number of units a student received a credit or higher grade in as a proportion of the number of units they were enrolled in, and failure rates refer to the number of students who failed the course as a proportion of the number of students who enrolled in the course.

34
Table 7 Estimated Coefficients on the Variable for High School Grades: Selected Australian Studies Using OLS(a)
Study/ Data/
Dependent Variable Explanatory Variables Included in the Model (b)
Estimated Coefficient for Tertiary
Entrance Score(c)
Farley and Ramsay (1988) -Data from 1981, 1982, 1984, and 1985.
-Students’ final grade for the theory component of the unit, final grade for the math component of the unit and overall final grade in the first-year accounting unit.
-University entrance score, whether completed accounting in school, whether completed maths in school, and grades in accounting at school.
Theory 1981: 1982: 1984: 1985: Math 1981: 1982: 1984: 1985: Overall 1981: 1982: 1984: 1985:
0.11 N.S 0.20 0.28
0.01 0.03 0.05 0.06
0.38 0.11 0.48 0.52
Ramsay and Baines (1994) -Data from 1981, 1982, 1984, 1985 and 1993.
-Students’ final grade for the theory component of the unit, final grade for the math component of the unit and overall final grade in the first-year accounting unit.
-University entrance score, whether completed accounting in school, whether completed maths in school, grades in accounting at school, and gender.
Theory 1981: 1982: 1984: 1985: Math 1981: 1982: 1984: 1985: Overall 1981: 1982: 1984: 1985: 1993 Sem. 1: 1993 Sem. 2:
0.14 0.02 0.20 0.26
N.S N.S 0.05 0.06
0.37 N.S 0.49 0.51 1.40 N.S
Essay Accounting All students: Males: Females: Maths 1 All students: Males: Females: Social Maths All students: Males: Females:
N.S 0.32 N.S
N.S N.S N.S
N.S N.S N.S
Multiple Choice
Auyeung and Sands (1994) -Data from 1991.
-Students’ total essay marks total multiple choice marks, and total aggregate mark for the first-year accounting unit.
-University entrance score, grades in accounting at school and grades in two maths subjects at school (maths 1 and social maths).
Accounting All students Males: Females: Maths 1 All students: Males: Females: Social Maths All students: Males: Females:
0.54 0.64 0.49
N.S N.S 0.22
N.S N.S N.S

35
Table 7 Estimated Coefficients on the Variable for High School Grades in the Estimation of Students’ Tertiary Grades: Selected Australian Studies Using OLS(a)
Study/ Data/
Dependent Variable Explanatory Variables Included in the Model (b)
Estimated Coefficient for Tertiary
Entrance Score(c)
Aggregate Mark Auyeung and Sands (1994) continued.
Accounting All students: Males: Female: Maths 1 All students Males: Female: Social Maths All students Males: Female:
0.37 0.52 0.28
0.28 N.S 0.33
N.S N.S N.S
Evans and Farley (1998) -Data from 1997.
-Students’ final grade in each of the compulsory first-year business units for two different campuses.
-TER score, whether attended a ‘disadvantaged’ school, school type, whether studied English at school, grades for English at school, whether studied basic maths at school, grades for basic maths at school, whether studied advanced maths at school, grades for advanced maths at school, whether studied the same subject in school as studied at university, and grades in the same subject in school as the subject university.
Campus 1 Sample 1 English Economics: Business Com: Management: Accounting: Statistics: Marketing: Basic Maths Economics: Business Com: Management: Accounting: Statistics: Marketing: Ad. Maths Economics: Business Com: Management: Accounting: Statistics: Marketing: Same Subject Economics: Business Com: Management: Accounting: Campus 2 Sample 1 English Economics: Statistics: Management: Accounting: Basic Maths Economics: Statistics: Management: Accounting: Ad. Maths Economics: Statistics: Management:
N.S 0.53 0.46 N.S N.S 0.64
-1.82 -1.22
N.S -2.21
N.S N.S
0.83 N.S 0.37 1.10 2.01 N.S
N.S N.S 0.93 1.31
N.S -0.40
N.S -0.28
N.S N.S N.S N.S
0.37 0.62 0.33

36
Table 7 Estimated Coefficients on the Variable for High School Grades in the Estimation of Students’ Tertiary Grades: Selected Australian Studies Using OLS(a)
Study/ Data/
Dependent Variable Explanatory Variables Included in the Model (b)
Estimated Coefficient for Tertiary
Entrance Score(c)
Evans and Farley (1998) continued
Accounting: Same Subject Economics: Management: Accounting: Sample 2 English Economics: Statistics: Management: Accounting: Basic Maths Economics: Statistics: Management: Accounting: Ad. Maths Economics: Statistics: Management: Accounting: Same Subject Economics: Management: Accounting:
0.27
-4.98
N.S -25.79
N.S N.S N.S N.S
N.S N.S N.S N.S
0.60 0.61 N.S 0.38
-4.33 33.00
-28.32 Notes: (a) For all studies examined, data samples are from single universities.
(b) The measure for grades in high school is in italics. (c) N.S. refers to not significant at the 10 per cent level.

37
Table 8 Average Weighted First-Year Mark for Students by Selected Characteristics Characteristics Average Weighted First-Year Mark
Mean Standard Deviation
All students 58.658 14.139 TER Score TER score in lowest quintile 56.240 16.044 TER score in second lowest quintile 55.816 14.416 TER score in middle quintile 56.850 12.501 TER score in second highest quintile 59.382 14.420 TER score in highest quintile 65.000 12.936 University Cut-off Rank TER score above cut-off rank 58.885 13.771 TER score below cut-off rank 57.199 16.263 Preference to the Course Course was first or second preference 59.287 13.790 Course was third of fourth preference 53.614 15.846 Gender Male students 55.380 15.387 Female students 60.901 12.749 Home Location Capital city area 58.129 14.152 Non-capital city areas 61.398 13.780 Socio-Economic Status: Home neighbourhood in lowest quintile 59.060 15.238 Home neighbourhood in second lowest quintile 58.433 15.121 Home neighbourhood in middle quintile 58.083 14.886 Home neighbourhood in second highest quintile 58.148 12.976 Home neighbourhood in highest quintile 59.472 12.561 School Population Attended a small sized secondary school 61.060 12.336 Attended a medium sized secondary school 58.473 14.098 Attended a large sized secondary school 57.428 15.201 School Gender Attended an all-boy secondary school 55.000 12.539 Attended an all-girl secondary school 56.237 15.575 Attended a co-educational secondary school 59.031 14.077 School Classification Attended a Catholic secondary school 58.434 12.840 Attended an Independent secondary school 57.530 13.732 Attended a Government secondary school 59.032 14.676 Proportion of Students Doing Four or More TER Subjects Secondary school was in the lowest quintile 59.489 14.619 Secondary school was in the second lowest quintile 60.387 14.300 Secondary school was in the middle quintile 58.803 13.215 Secondary school was in the second highest quintile 58.611 13.863 Secondary school was in the highest quintile 56.024 14.464 Proportion of Students Graduating High School Secondary school was in the lowest quintile 58.604 15.710 Secondary school was in the second lowest quintile 59.333 14.221 Secondary school was in the middle quintile 58.796 13.518 Secondary school was in the second highest quintile 57.942 13.896 Secondary school was in the highest quintile 58.670 13.258 Proportion of Students With High TER Scores Secondary school was in the lowest quintile 60.137 13.936 Secondary school was in the second lowest quintile 58.614 14.548 Secondary school was in the middle quintile 59.566 13.721 Secondary school was in the second highest quintile 58.636 14.064 Secondary school was in the highest quintile 56.490 14.239

38
Table 9 Results From the Estimation of the Determinants of First-Year Academic Performance: First-Generation Approach with Individual-Level Variables Treated as Deviations From the Means
Column (i) Column (ii)
Individual-Level Characteristics Only(a)
Individual-Level and Aggregate-Level
Characteristics(a)
Variable(c) Coefficient
‘t’ Value
Marginal Effect
Coefficient ‘t’ Value Marginal Effect
Constant 0.354 19.691 * 0.344 20.803 * TER Score TER 0.0240 8.082 * 0.582 0.240 8.028 * 5.820 TER Cut-off Rank Cutoff 0.270 3.218 * 6.548 0.270 2.674 * 6.548 University Course Preference Third_Fourth -0.181 -2.626 ** -4.389 -0.181 -2.636 ** -4.389 Gender Female 0.245 5.699 * 5.941 0.245 5.276 * 5.941 Home Location NonCap 0.185 3.846 * 4.486 0.138 2.674 *** 3.347 Socio-Economic Status SES 0.053 1.700 * 1.285 0.092 2.714 * 2.231 School Population Small (b) 0.102 1.481 Medium (b) 0.011 0.194 School Gender Boy (b) -0.084 -1.134 Girl (b) -0.017 -0.192 School Classification
Catholic (b) -0.020 -0.428 Independent (b) -0.017 -0.238 Students With Four TER Subjects TER4 (b) <-0.001 -0.492 Students Graduating Graduate (b) 0.004 0.895 Students With High TER Scores HighTER (b) -0.004 -1.641 Adjusted r2 = 0.096 Adjusted r2 = 0.105 F-test (6, 1,445) = 26.280 F-test (15, 1,436) = 12.390 Mean Grade = 56.66 Mean Grade = 56.66 Sample Size = 1,452 Sample Size = 1,452 Notes: (a) The symbol * represents significant at the 1 per cent level, the symbol ** represents
significant at the 5 per cent level and the symbol *** represents significant at the 10 per cent level. The marginal effects are only reported for those variables of statistical significance.
(b) The variable was not entered in the estimating equation. (c) Overall, the inclusion of the school characteristics in the model was significant at the 5 per cent level (F-test (9, 1,436) = 1.95).

39
References:
Abbott-Chapman, J., Hughes, P. and Wyld, C. (1992), ‘Monitoring student progress: A framework for improving student performance and reducing attrition in higher education’, Youth Education Studies Centre, University of Tasmania, Hobart, Australia.
Anderson, G., Benjamin, D. and Fuss, M. (1994), ‘The determinants of success in
university introductory economics courses’, Journal of Economic Education, Vol. 25 (2), pp. 99-120.
Australian Bureau of Statistics, 2001, Census of Population and Housing: Socio-Economic Indexes for Areas (SEIFA), Information Paper, Australian Bureau of Statistics Cat. No. 2039.0, Canberra, Australia.
- (2004), ‘Year Book Australia’, Cat. No. 1301.0, Canberra, Australia. Auyeung, P. and Sands, D. (1994), ‘Predicting success in first-year accounting using
gender-based learning analysis’, Accounting Education, Vol. 3 (3), pp. 259 to 272.
Birrell, R. 1987, ‘The educational achievement of non-English background students
and the politics of the community languages movement’, in. L. Baker and P. Miller (eds), The Economics of Immigration: Proceedings of a Conference at the Australian National University 22-23 April 1987, Australian Government Publishing Service, Canberra, Australia, pp. 91-121.
Borde, S. (1998), ‘Predictors of student academic performance in the introductory
marketing course’, Journal of Education for Business, Vol. 73 (5), pp. 302-306.
Borg, M., Mason, P. and Shapiro, S. (1989), ‘The case of effort variables in student
performance’, Journal of Economic Education, Vol. 20 (3), pp. 308-313. Brasfield, D., Harrison, D. and McCoy, J. (1993), ‘The impact of high school
economics on the college principles of economics course’, Journal of Economic Education, Vol. 24 (2), pp. 99-111.
Dale, M. and Jennings, P. (1986), ‘Factors affecting the performance of students in
undergraduate physics courses’, Australian Physicist, Vol. 23 (1), pp. 9-12. Dancer, D. and Fiebig, D. (2004), ‘Modelling students at risk’, Australian Economic
Papers, Vol. 43 (2), pp. 158-173. De La Harpe, B., Radloff, A., and Parker, L. (1997), ‘Time spent working and
studying in the first year: What do students tell us?’, In R. Pospisil, and L. Willcoxson, (Eds), Learning Through Teaching, Proceedings of the 6th Annual Teaching Learning Forum, Murdoch University, Perth, Australia, pp. 73-77.

40
Dickson, J., Fleet, A. and Watt, H. (2000), ‘Success or failure in a core university unit: What makes a difference’, Higher Education Research and Development, Vol. 19 (1), pp. 59-73.
Didia, D. and Hasnat, B. (1998), ‘The determinants of performance in the university
introductory finance course’, Financial Practice and Education, Vol. 8 (1), pp. 102-107.
Dobson, I. and Sharma, R. (1999), ‘Student performance and the cost of failure’,
Tertiary Education and Management, Vol. 5 (2), pp. 141-157. Douglas, S. and Sulock, J. (1995), ‘Estimating educational production functions with
corrections for drops’, Journal of Economic Education, Vol. 26 (2), pp. 101-112.
Durden, G. and Ellis, L. (1995), ‘The effects of attendance on student learning in
Principles of Economics’, American Economic Review, Vol. 85 (2), pp. 343-346.
Eskew, R. and Faley, R. (1988), ‘Some determinants of student performance in the
first college-level financial accounting course’, The Accounting Review, Vol. 63 (1), pp. 137-147.
Evans, M. and Farley, A. (1998), ‘Institutional characteristics and the relationship
between students’ first-year university and final-year secondary school academic performance’, Department of Econometrics and Business Statistics Working Paper 18/98, Department of Econometrics and Business Statistics, Monash University, Melbourne, Australia.
Everett, J. and Robins, J. (1991), ‘Tertiary entrance predictors of first-year university
performance’, Australian Journal of Education, Vol. 35 (1), pp. 24-40. Farley, A. and Ramsay, A. (1988), ‘Student performance in first year tertiary
accounting courses and its relationship to secondary accounting education’, Accounting and Finance, Vol. 28 (1), pp. 29-44.
Gist, W., Goedde, H. and Ward, B. (1996), ‘The influence of mathematical skills and
other factors on minority student performance in principles of accounting’, Issues in Accounting, Vol. 11 (1), pp. 49-60.
Gramlich, E. and Greenlee, G. (1993), ‘Measuring teaching performance’, Journal of
Economic Education, Vol. 24 (1), pp. 3-14. Hanushek, E. (1986), ‘The economics of schooling: Production and efficiency in
public schools’, Journal of Economic Literature, Vol. 24 (3), pp. 1141-1177. - (1987), ‘Educational production function’, in G. Psacharopoulos, (Ed),
Economics of Education: Research and Studies, Pergamon Press, New York, United States of America, pp. 33-42.

41
Hewitt, S. (2003), ‘Girls top class- Private schools dominate- Top 10 schools’, West Australian, 17th January 2003, Perth, Australia.
Hill, P. and Rowe, K. (1996), ‘Multilevel modelling in school effectiveness research’,
School Effectiveness and School Improvement, Vol. 7 (1), pp. 1-34. Hoefer, P. and Gould, J. (2000), ‘Assessment of admission criteria for predicting
students’ academic performance in graduate business programs’, Journal of Education for Business, Vol. 75 (4), pp. 225-229.
Jackson, K. (1999), ‘University completion rates in the 1960s and 1990s’, Research
Note 14 1999-2000, Australian Parliament Library, Canberra, Australia. Johnes, J. (1997), ‘Inter-university variations in undergraduate non-completion rates:
A statistical analysis by subject of study’, Journal of Applied Statistics, Vol. 24 (3), pp. 343-361.
Johnes, G. and McNabb, R. (2004), ‘Never give up on the good times: Student
attrition in the UK’, Oxford Bulletin of Economics and Statistics, Vol. 66 (1), pp. 23-47.
Koh, M. and Koh, H. (1999), ‘The determinants of performance in an accountancy
degree programme’, Accounting Education, Vol. 8 (1), pp. 13-29. Kreft, I. (1993), ‘Using multilevel analysis to access school effectiveness: A study of
Dutch secondary schools’, Sociology of Education, Vol. 66 (2), pp. 104-129. Lampathakis, P. (2003), ‘Spoon-fed students dump uni’, Sunday Times, 19th January
2003, Perth, Australia. Lee, V. and Bryk, A. (1988), ‘Curriculum tracking as mediating the social distribution
of high school achievement’, Sociology of Education, Vol. 61 (2), pp. 78-95. Logan, P. and Bailey, D. (1983), ‘Diagnostic testing for success in tertiary physics’,
Australian Physicist, Vol. 20 (1), pp. 62-65. Long, M., Faust, B., Harris, J., King, B., Knight, A. and Taylor, J. (1994), ‘A study of
the academic results of on-campus and off-campus students: Comparative performance within four Australian tertiary institutions’, National Board of Employment, Education and Training Commissioned Report No. 34, Australian Council for Education, Employment and Training, Canberra, Australia.
Lumsden, K. and Scott, A. (1987), ‘The economics student re-examined: Male-female
differences in comprehension’, Journal of Economic Education, Vol. 18 (4), pp. 365-375.
Marcal, L. and Roberts, W. (2000), ‘Computer literacy requirements and student
performance in business communications’, Journal of Education for Business, Vol. 75 (2), pp. 253-257.

42
Martin, Y.M., Maclachlan, M. and Karmel, T. (2001a), ‘Undergraduate completion rates: An update’, Department of Education, Training and Youth Affairs Occasional Paper 01/F, Department of Education, Training and Youth Affairs, Canberra, Australia.
Martin, Y.M., Maclachlan, M. and Karmel, T. (2001b), ‘Postgraduate completion
rates’, Department of Education, Training and Youth Affairs Occasional Paper 01/D, J.S. McMillan Printing Group, Canberra, Australia.
McClelland, A. and Kruger, P. (1993), An Investigation of the Subsequent
Performance in Tertiary Studies of Students Admitted Through the Queensland Tertiary Admission Centre in 1989-90, Australian Government Publishing Service, Canberra, Australia.
Montmarquette, C., Mahseredjian, S. and Houle, R. (2001), ‘The determinants of
university dropouts: A bivariate probability model with sample selection’, Economics of Education Review, Vol. 20 (5), pp. 475-484.
Myatt, A. and Waddell, C. (1990), ‘An approach to testing the effectiveness of the
teaching and learning of economics in high school’, Journal of Economic Education, Vol. 21 (3), pp. 355-363.
Nowicki, D. (2003), ‘Top girls beat boys for TEE honours’, Sunday Times, 5th
January 2003, Perth, Australia. O’Malley Borg, M. and Stranahan, H. (2002), ‘The effect of gender and race on
student performance in principles of economics: The importance of personality type’, Applied Economics, Vol. 34 (5), pp. 589-598.
Ramsay, A. and Baines, A. (1994), ‘The impact of gender on student performance in
introductory accounting courses’, Accounting Research Journal, Vol. 7 (2), pp. 20-32.
RMIT Student Union, (2003), ‘Public funding under attack: Just how much can you
afford to pay?’, Education Under Attack, Vol. 1 (2), Online journal: http://www.su.rmit.edu.au/hot%20issues/hiindex.html.
Robb, R. and Robb, L. (1999), ‘Gender and the study of economics: The role of
gender of the instructor’, Journal of Economic Education, Vol. 30 (1), pp. 3-19.
Robst, J. and Keil, J. (2000), ‘The relationship between athletic participation and
academic performance: Evidence from NCAA Division III’, Applied Economics, Vol. 32 (5), pp. 547-558.
Rodgers, J. (2002), ‘Encouraging tutorial attendance at university did not improve
performance’, Australian Economic Papers, Vol. 41 (3), pp. 255-266.

43
Rohde, F. and Kavanagh, M. (1996), ‘Performance in first year university accounting: Quantifying the advantage of secondary school accounting’, Accounting and Finance, Vol. 36 (2), pp. 275-285.
Rumberger, R. and Thomas, S. (1993), ‘The economic returns to college major,
quality and performance: A multilevel analysis of recent graduates’, Economics of Education Review, Vol. 12 (1), pp. 1-19.
Smith, J. and Naylor, R. (2001), ‘Determinants of degree performance in UK
universities: A statistical analysis of the 1993 student cohort’, Oxford Bulletin of Economics and Statistics, Vol. 63 (1), pp. 29-60.
Smyth, G., Knuiman, M., Thornett, M. and Kilveri, H. (1990), ‘Using the EM
algorithm to predict first-year university performance’, Australian Journal of Education, Vol. 34 (2), pp. 204-234.
Stinebrickner, R. and Stinebrickner, T. (2003), ‘Working during school and academic
performance’, Journal of Labor Economics, Vol. 21 (2), pp. 473-491. Tay, R. (1994), ‘Students’ performance in economics: Does the norm hold across
cultural and institutional settings?’, Journal of Economic Education, Vol. 25 (4), pp. 291-301.
Urban, M., Jones, E., Smith, G., Evans, C., Maclachlan, M. and Karmel, T. (1999),
‘Completions: Undergraduate academic outcomes for 1992 commencing students’, Department of Education, Training and Youth Affairs Occasional Paper 99-G, J.S. McMillan Printing Group, Canberra, Australia.
Watkins, D. (1979), ‘Prediction of university success: A follow up study on the 1977
internal intake to the University of New England’, Australian Journal of Education, Vol. 23 (3), pp. 301-303.
West, L. (1985), ‘Differential prediction of first year university performance for
students from different social backgrounds’, Australian Journal of Education, Vol. 29 (2), pp. 175-187.
Win, R. (2003), ‘Economics of education: Effects of individual and school factors on
university students’ performance’, Unpublished Honours Dissertation, Business School, University of Western Australia, Perth, Australia
Win, R. and Miller, P. (2005), ‘The effects of individual and school factors on
university students’ academic performance’, Australian Economic Review, Vol. 38 (1), pp. 1-18.