notes to the financial statements - maa · • amendments to mfrs 140 ‘classification on...
TRANSCRIPT

087annual report 2016 MAA GROUP BERHAD
1 PRINCIPAL ACTIVITIES AND GENERAL INFORMATION
the Company is principally engaged in investment holding and providing management services, whilst the principal activities of the subsidiaries are as stated in note 7 to the financial statements.
there have been no significant changes in the principal activities of the Company and its subsidiaries during the financial year, other than the significant events as disclosed in note 47 to the financial statements.
the Company is a public limited liability company, incorporated and domiciled in Malaysia and is listed on the Main Board of Bursa Malaysia Securities Berhad (“Bursa Securities”).
the registered office and principal place of business of the Company are as follows:
registered office
Suite 12.03, 12th Floor no.566, Jalan Ipoh 51200 Kuala lumpur
principal place of business
13th Floor, no.566 Jalan Ipoh 51200 Kuala lumpur
these financial statements were authorised for issue by the Board of Directors in accordance with a resolution of the Directors on 13 april 2017.
2 SIGNIFICANT ACCOUNTING POLICIES
unless otherwise stated, the following accounting policies have been applied consistently in dealing with items which are considered material in relation to the financial statements.
2.1 Basis of preparation
the financial statements of the Group and the Company have been prepared in accordance with the Malaysian Financial reporting Standards (“MFrS”), International Financial reporting Standards and the requirements of the Companies act, 1965 in Malaysia.
the preparation of financial statements in conformity with MFrS requires the use of certain critical accounting estimates and assumptions that affect the reported amounts of assets and liabilities and disclosure of contingent assets and liabilities at the date of the financial statements, and the reported amounts of revenues and expenses during the reported financial year. It also requires Directors to exercise their judgment in the process of applying the Group’s and the Company’s accounting policies. although these estimates and judgment are based on the Directors’ best knowledge of current events and actions, actual results may differ from those estimates.
the areas involving a higher degree of judgment or complexity, or areas where assumptions and estimates are significant to the consolidated financial statements are disclosed in note 3 to the financial statements.
the discontinued operations for the financial year ended 31 December 2016 represent Maa takaful Berhad (now known as Zurich takaful Malaysia Berhad) (“Maa takaful”) and Maa Cards Sdn Bhd (“Maa Cards”), subsidiaries disposed during the financial year as disclosed in note 47(b) and (c) to the financial statements respectively, whereas the discontinued operations for the preceding financial year ended 31 December 2015 represent MaaCa Corporate Services Sdn Bhd (“MaaCaCS”) which was disposed during that year. However, to conform to the current financial year’s presentation of financial statements, the preceding financial year’s results of these subsidiaries have been reclassified from continuing operations to discontinued operations for comparative purposes.
(i) Standards, amendments to published standards and interpretations to existing standards that are effective and applicable to the Group and the Company
the following amendments and improvements to MFrSs have been adopted by the Group and the Company for the financial year beginning on or after 1 January 2016:
• amendments to MFrS 11 ‘Joint arrangements’ – accounting with acquisitions of Interests in Joint operations• amendments to MFrS 101 ‘presentation of Financial Statements’ – Disclosure Initiative• amendments to MFrS 127 ‘equity Method In Separate Financial Statements’• amendments to MFrS 10, 12 and 128 ‘Investment entities – applying the consolidation exception’• annual improvements to MFrSs 2012-2014 Cycle• amendments to MFrS 116 ‘property, plant and equipment’ and MFrS 138 ‘Intangible assets’ – Clarification of
acceptable Methods of Depreciation and amortisation
NOTES TO THE FINANCIAL STATEMENTS31 DECEMBER 2016

088
NOTES TO THE FINANCIAL STATEMENTS31 DECEMBER 2016(continued)
MAA GROUP BERHAD annual report 2016
2 SIGNIFICANT ACCOUNTING POLICIES (continued)
2.1 Basis of preparation (continued)
(ii) Standards, amendments to published standards and interpretations to existing standards that are applicable to the Group and the Company but not yet effective
the Group and the Company will apply the standards, amendments to published standards and interpretations to existing standards in the following periods:
Effective from financial year beginning on or after 1 January 2017
• annual improvements to MFrS 12 ‘Disclosures of Interest in other entities’
• amendments to MFrS 107 ‘Statements of Cash Flows’ – Disclosure Initiative introduces an additional disclosure on changes in liabilities arising from financing activities.
• amendments to MFrS 112 ‘Income taxes - recognition of Deferred tax assets for unrealised losses’ clarify the requirements for recognising deferred tax assets on unrealised losses arising from deductible temporary difference on asset carried at fair value.
In addition, in evaluating whether an entity will have sufficient taxable profits in future period against which deductible temporary differences can be utilised, the amendments require an entity to compare the deductible temporary difference with future taxable profits that excludes tax deductions resulting from the reversal of those temporary differences.
the amendments shall be applied retrospectively.
Effective from financial year beginning on or after 1 January 2018
• amendments to MFrS 140 ‘Classification on ‘Change in use’ – assets transferred to, or from, Investment properties’ clarify that to transfer to, or from investment properties there must be a change in use. a change in use would involve an assessment of whether a property meet, or has ceased to meet, the definition of investment property. the change must be supported by evidence that the change in use has occurred and a change in management’s intention in isolation is not sufficient to support a transfer of property.
the amendments also clarify that the same principle applies to assets under construction.
• IC Interpretation 22 ‘Foreign Currency transactions and advance Consideration’ applies when an entity recognises a non-monetary asset or non-monetary liability arising from the payment or receipt of advance consideration. MFrS 121 requires an entity to use the exchange rate at the ‘date of the transaction’ to record foreign currency transactions.
IC Interpretation 22 provides guidance how to determine ‘the date of transaction’ when a single payment/receipt is made, as well as for situations where multiple payments/receipts are made.
the date of transaction is the date when the payment or receipt of advance consideration gives rise to the non-monetary asset or non-monetary liability when the entity is no longer exposed to foreign exchange risk.
If there are multiple payments or receipts in advance, the entity should determine the date of the transaction for each payment or receipt.
an entity has the option to apply IC Interpretation 22 retrospectively or prospectively.
• amendments to MFrS 15 ‘revenue from Contracts with Customers’ replaces MFrS 118 ‘revenue’ and MFrS 111 ‘Construction contracts’ and related interpretations. the core principal in MFrS 15 is that an entity recognises revenue to depict the transfer or promised goods or services to the customer in an amount that reflects the consideration to which the entity expects to be entitled in exchange for those goods or services.
revenue is recognised when a customer obtains control of goods or services, i.e. when the customer has the ability to direct the use if and obtain the benefits from the goods or services.
a new five-step process is applied before revenue can be recognised:
• Identify contracts with customers;• Identify the separate performance obligations;• Determine the transaction price of the contract;• allocate the transaction price to each of the separate performance obligations; and• recognise the revenue as each performance obligation is satisfied.

089
NOTES TO THE FINANCIAL STATEMENTS31 DECEMBER 2016
(continued)
annual report 2016 MAA GROUP BERHAD
2 SIGNIFICANT ACCOUNTING POLICIES (continued)
2.1 Basis of preparation (continued)
(ii) Standards, amendments to published standards and interpretations to existing standards that are effective and applicable to the Group and the Company (continued)
Effective from financial year beginning on or after 1 January 2018 (continued)
Key provisions of the new standard are as follows:
• any bundle goods or services that are distinct must be separately recognised, and any discounts or rebates on the contract price must generally be allocated to the separate elements.• If the consideration varies (such as for incentives, rebates, performance fees, royalties, success of an outcome etc.), minimum amounts of revenue must be recognised if they are not at significant risk of reversal.• the point at which revenue is able to be recognised may shift: some revenue which is currently recognised at a point in time at the end of a contract may have to be recognised over the contract term and vice versa.• there are new specific rules on licenses, warranties, non-refundable upfront fees, and consignment
arrangements, to name a few.• as with any new standard, there are also increased disclosures.
• MFrS 9 ‘Financial Instruments’ - Classification and Measurement of Financial assets and Financial liabilities will replace MFrS 139 ‘Financial Instruments: recognition and Measurement’.
MFrS 9 retains but simplifies the mixed measurement model in MFrS 139 and establishes three measurement categories for financial assets: amortised cost, fair value through profit or loss and fair value through profit or loss and fair value through other comprehensive income (“oCI”). the basis of classification depends on the entity’s business model and the cash flow characteristics if the financial asset. Investments inequity instruments are always measured at fair value through profit or loss with an irrevocable option at inception to present changes in fair value in oCI (provided the instrument is not held for trading). a debt instrument is measures at amortised cost only if the entity is holding it to collect contractual cash flows and the cash flows represent principal and interest.
For liabilities, the standard retains most of the MFrS 139 requirements. these include amortised cost accounting for most financial liabilities, with bifurcation of embedded derivatives. the main change is that, in cases where the fair value option is taken for financial liabilities, the part of a fair value change due to an entity’s own credit risk is recorded in oCI rather than profit or loss, unless this creates an accounting mismatch.
MFrS 9 introduces an expected credit loss model on impairment that replaces the incurred loss impairment model used in MFrS 139. the expected credit loss model is forward-looking and eliminates the need for a trigger event to have occurred before credit losses are recognised.
Effective from financial year beginning on or after 1 January 2019
• MFrS 16 ‘leases’ supersedes MFrS 117 ‘leases’ and the related interpretations. under MFrS 16, a lease is a contract (or part of a contract) that conveys the right to control the use of an identified
asset for a period of time in exchange for consideration.
MFrS 16 eliminates the classification of leases by the lessee as either finance lease (on balance sheet) or operating leases (off balance sheet). MFrS 16 required a lessee to recognise a “right-of-use” of the underlying asset and a lease liability reflecting future lease payments for most leases.
the right-of-use asset is depreciated in accordance with the principle in MFrS 116 ‘property, plant and equipment’ and the lease liability is accreted over time with interest expense recognised in profit or loss.
For lessors, MFrS 16 retains most of the requirements in MFrS 117. lessors continue to classify all leases as either operating leases or finance leases and account for them differently.
Effective date yet to be determined by MASB
• amendments to MFrS 10 ‘Consolidated Financial Statements’ and MFrS 128 ‘Investments in associates and Joint Ventures’ – Sale or Contribution of assets between an Investor and its associate or Joint Venture.
the Group and the Company will assess the application of adopting the above standards, amendments to published standards and interpretations to existing standards before the effective dates.
all other new amendments to published standards and interpretations to existing standards issued by Malaysian accounting Standard Board (“MaSB”) are not expected to have a material impact on the Group and the Company.

090
NOTES TO THE FINANCIAL STATEMENTS31 DECEMBER 2016(continued)
MAA GROUP BERHAD annual report 2016
2 SIGNIFICANT ACCOUNTING POLICIES (continued)
2.2 Basis of consolidation
(a) Subsidiaries
Subsidiaries are all entities (including structured entities) over which the Group has control. the Group controls an entity when the Group is exposed to, or has rights to, variable returns from its involvement with the entity and has the ability to affect those returns through its power to direct the relevant activities of the entity. Subsidiaries are fully consolidated from the date on which control is transferred to the Group. they are deconsolidated from the date that control ceases.
the Group applies the acquisition method to account for business combinations. the consideration transferred for the acquisition of a subsidiary is the fair values of the assets transferred, the liabilities incurred to the former owners of the acquiree and the equity interests issued by the Group. the consideration transferred includes the fair value of any asset or liability resulting from a contingent consideration arrangement and fair value of any pre-existing equity interest in the subsidiary. Identifiable assets acquired and liabilities and contingent liabilities assumed in a business combination are, with limited exceptions, measured initially at their fair values at the acquisition date. the Group recognises any non-controlling interests in the acquiree on an acquisition-by-acquisition basis, either at fair value or at the non-controlling interests’ proportionate share of the recognised amounts of acquiree’ s identifiable net assets.
acquisition-related costs are expensed as incurred. If the business combination is achieved in stages, the carrying value of the acquirer’s previously held equity interest in
the acquiree is re-measured to fair value at the acquisition date, any gains or losses arising from such re-measurement are recognised in profit or loss.
any contingent consideration to be transferred by the Group is recognised at fair value at the acquisition date. Subsequent changes to the fair value of the contingent consideration that is deemed to be an asset or liability is recognised in accordance with MFrS 139 either in profit or loss or as a change to other comprehensive income. Contingent consideration that is classified as equity is not re-measured, and its subsequent settlement is accounted for within equity.
the excess of the consideration transferred, the amount of any non-controlling interests in the acquiree and the acquisition date fair value of any previous equity interest in the acquiree over the fair value of the identifiable net assets acquired at the acquisition date is recorded as goodwill. If the total of consideration transferred, non-controlling interests recognised and previously held interest measured is less than the fair value of the net assets of the subsidiary acquired in the case of a bargain purchase, the difference is recognised directly in profit or loss.
Inter-company transactions, balances, unrealised gains on transactions between group companies are eliminated. unrealised losses are also eliminated unless the transaction provides evidence of an impairment of the transferred asset.
accounting policies of subsidiaries are changed where necessary to ensure consistency with the policies adopted by the Group.
non-controlling interests in the results and equity of subsidiaries are shown separately in statements of comprehensive income, statement of changes in equity and statements of financial position respectively.
(b) Changes in ownership interests in subsidiaries without change of control
transactions with non-controlling interests that do not result in loss of control are accounted for as transactions with equity owners of the Group. a change in ownership interest results in an adjustment between the carrying amounts of the controlling and non-controlling interests to reflect their relative interests in the subsidiary. any difference between the amount of the adjustment to non-controlling interests and any consideration paid or received is recognised in equity attributable to owners of the Group.

091
NOTES TO THE FINANCIAL STATEMENTS31 DECEMBER 2016
(continued)
annual report 2016 MAA GROUP BERHAD
2 SIGNIFICANT ACCOUNTING POLICIES (continued)
2.2 Basis of consolidation (continued)
(c) Disposal of subsidiaries
When the Group ceases to have control over a subsidiary, any retained interest in the entity is remeasured to its fair value at the date when control is lost, with the change in carrying amount recognised in profit or loss. the fair value is the initial carrying amount for the purpose of subsequently accounting for the retained interest as an associate, joint venture or financial asset. In addition, any amounts previously recognised in other comprehensive income in respect of that entity are accounted for as if the Group had directly disposed of the related assets or liabilities. this may mean that amounts previously recognised in other comprehensive income are reclassified to profit or loss.
Gains or losses on the disposal of subsidiaries include the carrying amounts of goodwill relating to the subsidiaries sold.
(d) Associates
associates are all entities over which the Group has significant influence but not control or joint control, generally accompanying a shareholding of between 20% and 50% of the voting rights. Investments in associates are accounted for using the equity method of accounting. under the equity method, the investment in an associate is initially recognised at cost, and adjusted thereafter to recognise the Group’s share of post-acquisition profits or losses of the associate in profit or loss, and the Group’s share of movements in other comprehensive income of the associate in other comprehensive income. Dividends received or receivable from an associate are recognised as a reduction in the carrying amount of the investment. When the Group’s share of losses in an associate equals or exceeds its interest in the associate, including any long-term interest that, in substance, form part of the Group’s net investment in the associate, the Group does not recognise further losses, unless it has incurred legal or constructive obligations or made payments on behalf of the associate.
the Group’s investment in associates includes goodwill identified on acquisition.
the Group determines at each reporting date whether there is any objective evidence that the investment in the associate is impaired. If this is the case, the Group calculates the amount of impairment as the difference between the recoverable amount of the associate and its carrying value and recognises the amount adjacent to ‘share of profit/(loss) of an associate’ in profit or loss.
profits and losses resulting from upstream and downstream transactions between the Group and its associate are recognised in the Group’s financial statements only to the extent of unrelated investor’s interest in the associate. unrealised losses are eliminated unless the transaction provides evidence of an impairment of the asset transferred. accounting policies of associates are changed where necessary to ensure consistency with the policies adopted by the Group.
When the Group ceases to equity account its associate because of a loss of significant influence, any retained interest in the entity is remeasured to its fair value with the change in carrying amount recognised in profit or loss. this fair value becomes the initial carrying amount for the purposes of subsequently accounting for the retained interest as a financial asset. In addition, any amount previously recognised in other comprehensive income in respect of the entity is accounted for as if the Group had directly disposed of the related assets or liabilities. this may mean that amounts previously recognised in other comprehensive income are reclassified to profit or loss.
If the ownership interest in an associate is reduced but significant influence is retained, only a proportionate share of the amounts previously recognised in other comprehensive income is reclassified to profit or loss where appropriate.
Dilution gains and losses arising in investment in associates are recognised in profit or loss.
2.3 Investments in subsidiaries and associates
In the Company’s separate financial statements, investments in subsidiaries and associates are carried at cost less accumulated impairment losses. Where an indication of impairment exists, the carrying amount of the investment is assessed and written down immediately to its recoverable amount (see accounting policy in note 2.9 to the financial statements on impairment of non-financial assets). Impairment loss is charged to profit or loss.
on disposal of investments in subsidiaries and associates, the difference between disposal proceeds and the carrying amounts of the investments is recognised in profit or loss.
2.4 Segment reporting
operating segments are reported in a manner consistent with the internal reporting provided to the chief operating decision-maker. the chief operating decision-maker, who is responsible for allocating resources and assessing performance of the operating segments, has been identified as the Group’s executive Committee that makes strategic decisions.

092
NOTES TO THE FINANCIAL STATEMENTS31 DECEMBER 2016(continued)
MAA GROUP BERHAD annual report 2016
2 SIGNIFICANT ACCOUNTING POLICIES (continued)
2.5 Foreign currency translation
(a) Functional and presentation currency
Items included in the financial statements of each of the Group’s entities are measured using the currency of the primary economic environment in which the entity operates (“functional currency”). the consolidated financial statements are presented in ringgit Malaysia, which is the Group’s functional and presentation currency.
(b) Transactions and balances
Foreign currency transactions are translated into the functional currency using the exchange rates prevailing at the date of transactions or valuation when items are remeasured. Foreign exchange gains and losses resulting from the settlement of such transactions and from the translation at year-end exchange rates of monetary assets and liabilities denominated in foreign currencies are recognised in profit or loss.
For translation differences on financial assets and liabilities held at fair value through profit or loss and available-for-sale financial assets, refer to accounting policy in note 2.11(c) to the financial statements on financial assets.
(c) Group companies
the results and financial positions of the Group’s entities (none of which has the currency of a hyperinflationary economy) that have a functional currency different from the presentation currency of the Group are translated into the presentation currency as follows:
• assets and liabilities for each statement of financial position presented are translated at the closing rate at the date of that statement of financial position;
• income and expenses for each statement of comprehensive income or separate statement of profit or loss presented are translated at average exchange rates (unless this average is not a reasonable approximation of the cumulative effect of the rates prevailing on the transaction dates, in which case income and expenses are translated at the rates on the dates of the transactions); and
• all resulting exchange differences are recognised in other comprehensive income.
Goodwill and fair value adjustments arising on the acquisition of a foreign entity are treated as assets and liabilities of the foreign entity and translated at the closing rate. exchange differences arising are recognised in other comprehensive income.
on consolidation, exchange differences arising from the translation of any net investments in foreign entities are recognised in other comprehensive income.
on the disposal of a foreign operation (that is, a disposal of the Group’s entire interest in a foreign operation, or a disposal involving loss of control over a subsidiary that includes a foreign operation, a disposal involving loss of joint control over a jointly controlled entity that includes a foreign operation, or a disposal involving loss of significant influence over an associate that includes a foreign operation), all of the exchange differences relating to that foreign operation recognised in other comprehensive income and accumulated in the separate component of equity are reclassified to profit or loss.
In the case of a partial disposal that does not result in the Group losing control over a subsidiary that includes a foreign operation, the proportionate share of accumulated exchange differences are re-attributed to non-controlling interests and are not recognised in profit or loss. For all other partial disposals (that is, reductions in the Group’s ownership interests in associates or jointly controlled entities that do not result in the Group losing significant influence or joint control), the proportionate share of the accumulated exchange difference is reclassified to profit or loss.
2.6 Property, plant and equipment (‘PPE’)
(a) Cost
ppe are initially stated at cost. land is subsequently shown at fair value, less subsequent depreciation and impairment losses. Valuations are performed with sufficient regularity to ensure that the fair value of a revalued asset does not differ materially from its carrying amount. any accumulated depreciation at the date of revaluation is eliminated against the gross carrying amount of the asset, and the net amount is restated to the revalued amount of the asset. all other ppe are stated at cost less accumulated depreciation and impairment losses.
the cost of an item of ppe initially recognised includes its purchase price and any cost that is directly attributable to
bringing the asset to the location and condition necessary for it to be capable of operating in the manner intended by management. Cost also includes borrowing costs that are directly attributable to the acquisition, construction or production of a qualifying asset (refer to accounting policy in note 2.19 to the financial statements on borrowings).

093
NOTES TO THE FINANCIAL STATEMENTS31 DECEMBER 2016
(continued)
annual report 2016 MAA GROUP BERHAD
2 SIGNIFICANT ACCOUNTING POLICIES (continued)
2.6 Property, plant and equipment (‘PPE’) (continued)
(a) Cost (continued)
Subsequent costs are included in the asset’s carrying amount or recognised as a separate asset, as appropriate, only when it is probable that future economic benefits associated with the item will flow to the Group/Company and the cost of the item can be measured reliably. the carrying amount of the replaced part is derecognised. all other repair and maintenance costs are recognised as expenses in profit or loss during the financial period in which they are incurred.
assets under construction are not depreciated until they are ready for their intended use. other ppe are depreciated on a straight line basis to allocate the cost of the assets, or their revalued amounts, to their residual values over their estimated useful lives.
leasehold land is amortised in equal instalments over the period of their respective leases or earlier if the expected useful life is lower than the leasehold period.
(b) Depreciation and residual value
the annual depreciation rates are as follows:
leasehold land over the remaining leasehold period plant and machinery 10% - 20% Furniture, fittings and equipment 10% - 20% Motor vehicles 10% - 20% renovation 10% - 20% Yacht 6.25%
the assets’ residual values and useful lives are reviewed, and adjusted if appropriate, at the end of each reporting date.
(c) Impairment
at the end of each reporting date, the Group/Company assesses whether there is any indication of impairment. If such indications exist, an analysis is performed to assess whether the carrying amount of the asset is fully recoverable. a write down is made if the carrying amount exceeds the recoverable amount (see accounting policy in note 2.9 to the financial statements on impairment of non-financial assets).
(d) Gains and losses on disposals
Gains and losses on disposals are determined by comparing sale proceeds with carrying amounts and are credited or charged to profit or loss.
(e) Revaluation reserves
When an asset’s carrying amount is increased as a result of a revaluation, the increase is recognised in other comprehensive income as a revaluation surplus reserve. When the asset’s carrying amount is decreased as a result of a revaluation, the decrease is recognised in profit or loss. However, the decrease is recognised in other comprehensive income to the extent of any credit balance existing in the revaluation surplus reserve of that asset. each year the difference between depreciation based on the revalued carrying amount of the asset charged to profit or loss, and depreciation based on the asset’s original cost is transferred from ‘other reserves’ to ‘retained earnings’.
the revaluation surplus included in equity is transferred directly to retained earnings when the asset is retired or disposed of.
2.7 Investment properties
Investment properties, comprising principally of land and buildings, are held for long term rental yields or for capital appreciation or both, and are not occupied by the Group.
Investment properties are initially stated at cost including related and incidental expenditure incurred and are subsequently carried at fair values. Fair value is based on active market prices, adjusted if necessary, for any difference in the nature, location or condition of the specific asset. If this information is not available, the Group uses alternative valuation methods such as recent prices on less active markets or discounted cash flow projections. the fair values of investment properties are reviewed annually through formal valuations by independent professional valuers.
Gains or losses arising from changes in fair values of investment properties are recognised in profit or loss in the year in which
they arise.
094
NOTES TO THE FINANCIAL STATEMENTS31 DECEMBER 2016(continued)
MAA GROUP BERHAD annual report 2016
2 SIGNIFICANT ACCOUNTING POLICIES (continued)
2.7 Investment properties (continued)
property located on land that is held under an operating lease is classified as investment property as long as it is held for long term yields and is not occupied by the Group. the initial cost of the property is the lower of the fair value of the property and the present value of the maximum lease payments. the property is carried at fair value after initial recognition.
on disposal of an investment property or when it is permanently withdrawn from use and no future economic benefits are expected from its disposal, it is derecognised (eliminated from the statement of financial position). the difference between net
sale proceeds and the carrying amount is recognised in profit or loss in the financial year of the retirement or disposal.
If an investment property becomes owner-occupied, it is reclassified as property, plant and equipment, and its fair value at the date of reclassification becomes its cost for subsequent accounting purposes.
If an item of property, plant and equipment becomes an investment property because its use has changed, any difference arising between the carrying amount and the fair value of this item at the date of transfer is recognised in asset revaluation reserve as a revaluation of property, plant and equipment. However, if a fair value gain reverses a previous impairment loss, the gain is recognised in profit or loss. upon the disposal of such investment property, any surplus previously recorded in asset revaluation reserve is transferred to profit or loss.
2.8 Intangible assets
Computer software
acquired computer software licences are capitalised on the basis of the costs incurred to acquire and bring to use the specific software. these costs are amortised over their estimated useful lives.
Costs associated with maintaining computer software programmes are recognised as expenses when incurred. Costs that are directly associated with identifiable software systems controlled by the Group and the Company, which do not form an integral part of the hardware, and that will probably generate economic benefits exceeding costs beyond one year, are recognised as intangible assets.
Computer software development costs recognised as assets are amortised using the straight line method over their estimated useful lives, ranging between 5 to 10 years.
2.9 Impairment of non-financial assets
assets that have an indefinite useful life are not subject to amortisation and are tested annually for impairment. assets that are subject to amortisation are reviewed for impairment whenever events or changes in circumstances indicate that the carrying amounts may not be recoverable. an impairment loss is recognised for the amount by which the asset’s carrying amount exceeds its recoverable amount. the recoverable amount is the higher of an asset’s fair value less costs to sell and value in use. For the purposes of assessing impairment, assets are grouped at the lowest levels for which there are separately identifiable cash flows which are independent of the cash inflows from other assets or group of assets (cash-generating units). non-financial assets that suffered impairment are reviewed for possible reversal of impairment at each reporting date.
the impairment loss is charged to profit or loss unless it reverses a previous revaluation in which case it is charged to the
revaluation surplus. Impairment losses on goodwill are not reversed. In respect of other assets, any subsequent increase in recoverable amount is recognised in profit or loss unless it reverses an impairment loss on a revalued asset in which case it is taken to revaluation surplus reserve.
2.10 Non-current assets (or disposal groups) held for sale and discontinued operations
non-current assets (or disposal groups) are classified as assets held for sale if their carrying amounts will be recoverable principally through a sale transaction rather than through continue use and the sale is considered highly probable. they are stated at the lower of carrying amounts and fair values less costs to sell, except for assets such as deferred tax assets, assets arising from employee benefits, financial assets and investment properties that are carried at fair values and contractual rights under insurance contracts, which are specifically except from this requirement.
a component of the Group is classified as a discontinued operation when the criteria to be classified as held for sale have been met or it has been disposed of and such a component represents a separate major line of business or geographical area of operations, is part of a single coordinated major line of business or geographical area of operations or is a subsidiary acquired exclusively with a view to resale.

095
NOTES TO THE FINANCIAL STATEMENTS31 DECEMBER 2016
(continued)
annual report 2016 MAA GROUP BERHAD
2 SIGNIFICANT ACCOUNTING POLICIES (continued)
2.11 Financial assets
(a) Classification
the Group/Company classifies its financial assets into the following categories: financial assets at fair value through profit or loss (“FVtpl”), held-to-maturity (“HtM”) financial assets, loans and receivables and available-for-sale (“aFS”) financial assets. the classification depends on the purpose for which the financial assets were acquired. Management determines the classification at initial recognition.
Financial assets at FVtpl
the Group/Company classifies financial assets acquired for the purpose of selling in the short-term as held for trading. Derivatives are also classified as held for trading unless they are designated as hedges. assets in this category are classified as current assets if expected to be settled within 12 months; otherwise, they are classified as non-current.
In addition, certain financial assets are designated at initial recognition at fair value through profit or loss when one of the following designation criteria is met:
• Designation eliminates or significantly reduces a measurement or recognition inconsistency that would otherwise
arise; • Its performance is evaluated on a fair value basis, in accordance with a documented risk management or
investment strategy; and • the item is a hybrid contract that contains one or more embedded derivatives.
Investments held by investment-linked funds are designated at fair value through profit or loss at inception as they are managed and evaluated on a fair value basis, in accordance with the respective investment strategy and mandate.
HtM financial assets
HtM financial assets are debt instruments with fixed or determinable payments and fixed maturity that the Group’s/Company’s management has the positive intention and ability to hold the investments until maturity.
HtM financial assets are classified as non-current assets, except for those having maturity within 12 months of the end of the reporting period.
loans and receivables
loans and receivables are non-derivative financial assets with fixed or determinable payments that are not quoted in an active market but do not include takaful receivables. they are included in current assets, except for maturities greater than 12 months after the end of the reporting period, they are classified as non-current assets.
aFS financial assets
aFS financial assets are non-derivative financial assets that are either designated in this category or not classified in any of the other categories. they are included in non-current assets unless the investment matures or management intends to dispose of it within 12 months of the end of the reporting period.
(b) Recognition and initial measurement
regular purchases and sales of financial assets are recognised on the trade-date, the date on which the Group/Company commits to purchase or sell the asset.
Financial assets are initially recognised at fair values plus transaction costs that are directly attributable to the acquisition of the financial asset for all financial assets not carried at fair value through profit or loss. Financial assets at FVtpl are initially recognised at fair values, and the transaction costs are expensed in profit or loss.
(c) Subsequent measurement – Gains and losses
aFS financial assets and financial assets at FVtpl are subsequently carried at fair values. loans and receivables are subsequently carried at amortised cost using the effective interest method.
Gains or losses arising from changes in the fair values of financial assets at FVtpl, including the effects of currency translation, interest and dividend income are recognised in profit or loss in the period in which the changes arise.
HtM financial assets are subsequently measured at amortised cost using the effective interest method.

096
NOTES TO THE FINANCIAL STATEMENTS31 DECEMBER 2016(continued)
MAA GROUP BERHAD annual report 2016
2 SIGNIFICANT ACCOUNTING POLICIES (continued)
2.11 Financial assets (continued)
(c) Subsequent measurement – Gains and losses (continued)
Changes in the fair values of aFS financial assets are recognised in other comprehensive income, except for impairment losses (see accounting policy in note 2.11(d) to the financial statements) and foreign exchange gains and losses on monetary assets. the exchange differences on monetary assets are recognised in profit or loss, whereas exchange differences on non-monetary assets are recognised in other comprehensive income as part of fair value change. However, for General takaful business and Family takaful business, such fair value gains or losses are reported as a separate component of takaful contract liabilities until the investment is derecognised.
Interest and dividend income on aFS financial assets are recognised separately in profit or loss. Interest on aFS debt securities calculated using the effective interest method is recognised profit or loss. Dividend income on aFS equity instruments are recognised in profit or loss when the Group’s/Company’s right to receive payment is established.
(d) Subsequent measurement – Impairment of financial assets
assets carried at amortised cost
a financial asset or group of financial assets is impaired and impairment losses are incurred only if there is objective evidence of impairment as a result of one or more events that have occurred after the initial recognition of the asset (a ‘loss event’) and that loss event (or events) has an impact on the estimated future cash flows of the financial asset or group of financial assets that can be reliably estimated.
the Group/Company first assesses at each reporting date whether objective evidence of impairment exists individually for financial assets that are individually significant. If the Group/Company determines that no objective evidence of impairment exists for an individually assessed financial asset, whether significant or not, it includes the asset in a group of financial assets with similar credit risk characteristics and collectively assesses them for impairment. assets that are individually assessed for impairment and for which an impairment loss is or continues to be recognised are not included in a collective assessment for impairment.
to determine whether there is objective evidence that an impairment loss on financial assets has occurred, the Group/Company considers factors such as the probability of insolvency or significant financial difficulties of the debtor and default or significant delay in payments.
the amount of the impairment loss is measured as the difference between the asset’s carrying amount and the present value of estimated future cash flows (excluding future expected credit losses that have not been incurred) discounted at the financial asset’s original effective interest rate/yield. the asset’s carrying amount is reduced through the use of an allowance account and the loss is recorded in profit or loss.
If in a subsequent period, the amount of the impairment loss decreases and the decrease can be related objectively to an event occurring after the impairment was recognised (such as improved credit rating), the previously recognised impairment loss is reversed by adjusting the allowance account. the amount of the reversal is recognised in profit or loss, to the extent that the carrying value of the asset does not exceed its amortised cost at the reversal date.
When an asset is uncollectible, it is written off against the related allowance account. Such assets are written off after all the necessary procedures for recovery have been completed and the amount of the loss has been determined.
aFS financial assets
the Group/Company assesses at the end of the reporting date whether there is objective evidence that an aFS financial asset is impaired, including in the case of equity investments classified as aFS, a significant or prolonged decline in the fair value of the security below its cost is also considered as an indicator that the financial assets are impaired.
If any such evidence exists for aFS financial assets, the cumulative loss that had been recognised in equity is transferred from equity through the statement of comprehensive income or from takaful contract liabilities to profit or loss. the amount of cumulative loss that is reclassified to profit or loss is the difference between the acquisition cost and current fair value, less any impairment loss on the financial asset previously recognised in profit or loss. Impairment losses recognised in profit or loss on equity instruments classified as aFS are not subsequently reversed through profit or loss.
the impairment loss is reversed through profit or loss, if in a subsequent period the fair value of a debt instrument classified as aFS increases and the increase can be objectively related to an event occurring after the impairment loss was recognised in profit or loss.
097
NOTES TO THE FINANCIAL STATEMENTS31 DECEMBER 2016
(continued)
annual report 2016 MAA GROUP BERHAD
2 SIGNIFICANT ACCOUNTING POLICIES (continued)
2.11 Financial assets (continued)
(e) De-recognition
Financial assets are de-recognised when the rights to receive cash flows from the investments have expired or have been transferred and the Group/Company has transferred substantially all risks and rewards of ownership.
When aFS financial assets are sold, the accumulated fair value adjustments recognised in equity are reclassified to profit or loss.
2.12 Financial instruments
Description
a financial instrument is any contract that gives rise to both a financial asset of one entity and a financial liability or equity instrument of another enterprise.
a financial asset is any asset that is cash, a contractual right to receive cash or another financial asset from another enterprise, a contractual right to exchange financial instruments with another enterprise under conditions that are potentially favourable, or an equity instrument of another enterprise.
a financial liability is any liability that is a contractual obligation to deliver cash or another financial asset to another enterprise, or to exchange financial instruments with another enterprise under conditions that are potentially unfavourable.
recognition method
the particular recognition method adopted for financial instruments recognised in the statement of financial position is disclosed in the individual accounting policy note associated with each item.
offsetting financial instruments
Financial assets and liabilities are offset and the net amount presented in the statement of financial position when there is a legally enforceable right to offset the recognised amounts and there is an intention to settle on a net basis, or realise the asset and settle the liability simultaneously.
the legally enforceable right must not be contingent on future events and must be enforceable in the normal course of business and in the event of default, insolvency or bankruptcy.
2.13 Fair value of financial instruments
the fair value of financial instruments that are actively traded in organised financial markets is determined by reference to quoted or published bid prices on reporting date. If quoted prices are not available over the counter, broker or dealer price quotations are used.
For investments in unit and real estate investment trusts, fair value is determined by reference to published bid values.
For financial instruments where there is no active market, the fair value is determined by using valuation techniques. Such techniques include using recent arm’s length transactions, reference to the current market value of another instrument which is substantially the same, discounted cash flow analysis and/or option pricing models making maximum use of market inputs and relying as little as possible on entity-specific inputs. For discounted cash flow techniques, estimated future cash flows are based on management’s best estimates and the discount rate used is a market related rate for a similar instrument. Certain financial instruments are valued using pricing models that consider, among other factors, contractual and market prices, co-relation, time value of money, credit risk, yield curve volatility factors and/or prepayment rates of the underlying positions. the use of different pricing models and assumptions could produce materially different estimates of fair values.
the fair value of floating rate and over-night deposits with financial institutions is their carrying value. the carrying value is the cost of the deposit/placement and accrued interest/profit. the fair value of fixed interest/yield-bearing deposits is measured using estimated discounted cash flow techniques. expected cash flows are discounted at current market rates for similar instruments at the reporting date.
If the fair value cannot be measured reliably, these financial instruments are measured at cost, being the fair value of the consideration paid for the acquisition of the instrument or the amount received on issuing the financial liability. all transaction costs directly attributable to the acquisition are also included in the cost of the investment.

098
NOTES TO THE FINANCIAL STATEMENTS31 DECEMBER 2016(continued)
MAA GROUP BERHAD annual report 2016
2 SIGNIFICANT ACCOUNTING POLICIES (continued)
2.14 Loans loans are recognised initially at fair values and subsequently measured at amortised costs using the effective interest
method, less allowance for impairment. an allowance for impairment of loans is established when there is objective evidence that the Group will not be able to collect all amounts due according to the original terms of the receivables. the amount of the allowance is the difference between the assets’ carrying amounts and the present value of estimated future cash flows discounted at the effective interest rates. this includes interest that is suspended and/or recognised to the extent of the recoverable amount.
the amount of specific allowance also takes into account the collateral value and recoverable amount of interest due, which may be discounted to reflect the impact of recovery process. the recovery process is estimated to be between one to five years, depending on default condition of the loan, type of collateral and whether under litigations. the amount of the allowance is recognised in profit or loss.
Where the collateral is property, the net realisable value for the property is determined by using its fair value which is based on open market value by independent property valuers, adjusted if necessary, for any difference in the nature, location or condition of the specific asset, while the net realisable value for share is based on last transacted price. If this information is not available, the Group uses alternative valuation methods such as recent prices on less active markets, adjusted if necessary, for any difference in the nature, location or condition of the specific asset or discounted cash flow projections.
Consistent with previous years, loans are classified as non-performing when repayments or interests are in arrears for more than six (6) months from the first day of default or after maturity date.
2.15 Takaful receivables
takaful receivables are recognised when due. they are measured at initial recognition at the fair value of the consideration received or receivable. Subsequent to initial recognition, takaful receivables are measured at amortised cost, using the effective yield method.
If there is objective evidence that the takaful receivable is impaired, the Group reduces the carrying amount of the takaful receivable accordingly and recognises that impairment loss in profit or loss. the Group gathers the objective evidence that a takaful receivable is impaired using the same process adopted for financial assets carried at amortised cost. the impairment loss is calculated under the same method used for these financial assets. these processes are described in note 2.11(d) to the financial statements on subsequent measurement for impairment of financial assets.
takaful receivables are derecognised when the derecognition criteria for financial assets, as described in note 2.11(e) to the financial statements on derecognition of financial assets have been met.
2.16 Trade and other receivables
trade receivables are amounts due from customers for goods sold or services performed in the ordinary course of business. other receivables generally arise from transactions outside the usual operating activities of the Group. If collection is expected in one year or less (or in the normal operating cycle of the business if longer), they are classified as current assets. If not, they are presented as non-current assets.
trade and other receivables are recognised initially at fair values and subsequently measured at amortised costs using the effective interest method, less allowance for impairment. See accounting policy in note 2.9 on impairment of non-financial assets.
2.17 Operating leases
leases of assets where a significant portion of the risks and rewards of ownerships are retained by the lessor are classified as operating leases. payments made under operating leases (net of any incentives received from the lessor) are charged to profit or loss on a straight line basis over the lease period.
2.18 Finance leases - lessor
When assets are leased out under a finance lease, the present value of the lease payments is recognised as a receivable. the difference between the gross receivable and the present value of the receivable is recognised as unearned finance income. lease income is recognised over the term of the lease using the effective interest rate method.
2.19 Borrowings
Borrowings are recognised initially at fair values, net of transaction costs incurred. Borrowings are subsequently carried at amortised cost; any difference between the initial recognised amount (net of transaction costs) and the redemption value is recognised in profit or loss over the period of the borrowings using the effective interest rate method.

099
NOTES TO THE FINANCIAL STATEMENTS31 DECEMBER 2016
(continued)
annual report 2016 MAA GROUP BERHAD
2 SIGNIFICANT ACCOUNTING POLICIES (continued)
2.20 Cash and cash equivalents
For the purpose of the statement of cash flows, cash equivalents are held for the purpose of meeting short-term cash commitments rather than for investment or other purpose.
Cash and cash equivalents include cash and bank balances and fixed and call deposits with financial institutions, with original maturities of three months or less that are readily convertible to a known amount of cash and which are subject to an insignificant risk of changes in value.
2.21 Contingent liabilities and contingent assets
the Group/Company does not recognise a contingent liability but discloses its existence in the financial statements. a contingent liability is a possible obligation that arises from past events whose existence will be confirmed by uncertain future events beyond the control of the Group/Company or a present obligation that is not recognised because it is not probable that an outflow of resources will be required to settle the obligation. a contingent liability also arises in the extremely rare case where there is a liability that cannot be recognised because it cannot be measured reliably.
a contingent asset is a possible asset that arises from past events whose existence will be confirmed by uncertain future events beyond the control of the Group/Company. the Group/Company does not recognise contingent assets but discloses their existence where inflows of economic benefits are probable, but not virtually certain.
2.22 Provisions
provisions are recognised when the Group/Company has a present obligation, either legal or constructive, as a result of past events, when it is probable that an outflow of resources will be required to settle the obligation, and when a reliable estimate of the amount can be made.
provisions are reviewed at each reporting date and adjusted to reflect the management’s best estimates. If it is no longer probable that an outflow of resources embodying economic benefits will be required to settle the obligation, the provision is reversed. If the effect of the time value of money is material, provisions are discounted using a current pre-tax rate that reflects, where appropriate, the risks specific to the liability. Where discounting is used, the increase in the provision due to the passage of time is recognised as finance costs.
2.23 Employee benefits
Short-term employee benefits
Wages, salaries, paid annual leave, bonuses and non-monetary benefits are accrued in the period in which the associated services are rendered by employees of the Group and the Company.
post employment benefits
the Group and the Company have post-employment benefit schemes for eligible employees, which are defined contribution plans.
a defined contribution plan is a pension plan under which the Group and the Company pay fixed contributions or variable contributions as determined yearly, into a separate entity (“a fund”), and will have no legal or constructive obligations to pay further contributions if the fund does not hold sufficient assets to pay all employee benefits relating to employee service in the current and prior financial years.
the Group’s and the Company’s contributions to defined contribution plans, including the employees’ provident Fund, are charged to profit or loss in the period to which they relate. once the contributions have been paid, the Group and the Company have no further payment obligations.
2.24 Other financial liabilities and takaful payables
other financial liabilities and takaful payables are recognised when due and measured on initial recognition at the fair value of the consideration received less directly attributable transaction costs. Subsequent to initial recognition, they are measured at amortised cost using the effective yield method.
a financial liability and a takaful payable are derecognised when the obligation under the liability is extinguished. When an existing financial liability is replaced by another from the same lender on substantially modified terms, such an exchange or modification is treated as a derecognition of the original liability and the recognition of a new liability, and the difference in the respective carrying amounts is recognised in profit or loss.

100
NOTES TO THE FINANCIAL STATEMENTS31 DECEMBER 2016(continued)
MAA GROUP BERHAD annual report 2016
2 SIGNIFICANT ACCOUNTING POLICIES (continued)
2.25 Share capital
(a) Classification
the Company has issued ordinary shares that are classified as equity.
(b) Share issue expenses
Incremental external costs that are directly attributed to the issue of these shares are recognised in equity, net of tax.
(c) Dividend distribution
Dividends on ordinary shares are recognised as liabilities and deducted from equity when they are approved by the Company’s shareholders. Interim dividends are deducted from equity when they are paid.
Dividends for the financial year that are approved after end of the reporting date are dealt with as an event after the date of the statement of financial position.
2.26 Treasury shares
When the Company re-purchases its own equity shares, the amount of the consideration paid, including directly attributable costs is recognised in equity as treasury shares until they are cancelled, reissued or disposed of. Share re-purchased are held as treasury shares and presented as a deduction from equity. no gain or loss is recognised in profit or loss on the sale, reissuance or cancellation of the treasury shares. Should such treasury shares be reissued by re-sale in the open market, the different between the sale consideration and the carrying amount is shown as a movement in equity, as appropriate. Where treasury shares are distributed as share dividends, the cost of the treasury shares are applied in the reduction of the share premium reserve or distributable retained earnings or both.
2.27 Product classification
the takaful subsidiary of the Group issues contracts that transfer takaful risk or financial risk or both.
Financial risk is the risk of a possible future change in one or more of a specified interest rate, financial instrument price, commodity price, foreign exchange rate, index of price or rate, credit rating or credit index or other variable, provided in the case of a non-financial variable that the variable is not specific to a party to the contract. takaful risk is the risk other than financial risk.
takaful contracts are those contracts that transfer significant takaful risk. a takaful contract is a contract under which the takaful subsidiary (the takaful operator) has accepted significant takaful risk from another party (the participants) by agreeing to compensate the participants if a specified uncertain future event (the insured event) adversely affects the participants. as a general guideline, the takaful subsidiary determines whether it has significant takaful risk, by comparing benefits paid with benefits payable if the takaful event did not occur. Investment contracts are those contracts that do not have significant takaful risk.
once a contract has been classified as a takaful contract, it remains a takaful contract for the remainder of its life-time, even if the takaful risk reduces significantly during this period, unless all rights and obligations are extinguished or expired. Investment contracts can, however, be reclassified as takaful contracts after inception if the takaful risk becomes significant.
Family takaful contract liabilities are calculated based on the Gross premium Valuation (“GpV”) method which takes into consideration not only the guaranteed but also the discretionary benefits in the case of participating products and the underlying assumptions are based on the actual claim experience of the takaful subsidiary.
When takaful contracts contain both a financial risk component and a significant takaful risk component and the cash flows from the two components are distinct and can be measured reliably, the underlying amounts are unbundled. any contributions relating to the takaful risk component are accounted for on the same basis as takaful contracts and the remaining element is accounted for as a deposit through the statement of financial position similar to investment contracts.
the takaful subsidiary defines takaful risk to be significant when the ratio of the takaful risk over the deposit component is not less than 110% of the deposit component at any point of the in force takaful contract. Based on this definition, all takaful contracts issued by the takaful subsidiary met the definition of takaful contracts as at the date of the statement of financial position.

101
NOTES TO THE FINANCIAL STATEMENTS31 DECEMBER 2016
(continued)
annual report 2016 MAA GROUP BERHAD
2 SIGNIFICANT ACCOUNTING POLICIES (continued)
2.28 Retakaful
the takaful subsidiary of the Group cedes takaful risk in the normal course of business for most of its Family takaful and General takaful businesses. retakaful assets represent balances due from retakaful companies. amounts recoverable from retakaful operators are estimated in a manner consistent with the outstanding claims provision or settled claims associated with the retakaful operators’ policies and are in accordance with the related retakaful contracts.
Ceded retakaful arrangements do not relieve the takaful subsidiary from its obligations to participants. Contributions and claims are presented on a gross basis for both ceded and assumed retakaful.
retakaful assets are reviewed for impairment at each reporting date or more frequently when an indication of impairment arises during the reporting period. Impairment occurs when there is objective evidence as a result of an event that occurred after initial recognition of the retakaful asset that the takaful subsidiary may not receive all outstanding amounts due under the terms of the contract and the event has a reliably measurable impact on the amounts that the takaful subsidiary will receive from the retakaful operators. the impairment loss is recorded in profit or loss.
Gains or losses on buying retakaful are recognised in profit or loss immediately at the date of purchase and are not amortised.
the takaful subsidiary also assumes retakaful risk in the normal course of business for Family takaful and General takaful contracts when applicable. Contributions and claims on assumed retakaful are recognised as revenue or expenses in the same manner as they would be if the retakaful were considered direct business, taking into account the product classification of the retakaful business. retakaful liabilities represent balances due to retakaful companies. amounts payable are estimated in a manner consistent with the related retakaful contracts. retakaful assets or liabilities are derecognised when the contractual rights are extinguished or expired or when the takaful contract is transferred to another party.
retakaful contracts that do not transfer significant takaful risk are accounted for directly through the statement of financial position. these are financial assets or financial liabilities that are recognised based on the consideration paid or received less any explicitly identified contribution or fees to be retained by the retakaful operators. Investment income on these retakaful contracts is accounted for using the effective yield method when accrued.
2.29 Takaful contracts - General takaful business
the General takaful business is maintained in accordance with the requirements of the Islamic Financial Services act, 2013 (“IFSa”) and consists of unearned contribution reserves and accumulated surpluses attributable to participants which represent the participants’ share in the net surplus of the General takaful business, distributable in accordance with the terms and conditions prescribed by the Shariah Committee of the takaful subsidiary. the General takaful underwriting results are determined for each class of General takaful business after taking into account retakaful contributions, wakalah fee, unearned contributions reserves and claims incurred.
any deficit in the General takaful business will be made good via a benevolent loan or Qardhul Hassan from the Shareholders’ fund of the takaful subsidiary.
Gross contributions
Gross contributions are recognised in a financial year in respect of risks assumed during that particular financial year. Contributions from direct business are recognised during the financial year upon the issuance of takaful certificates. Contributions in respect of risks incepted for which takaful certificates have not been raised as of the reporting date are accrued at that date.
retakaful contributions
outward retakaful contributions are recognised in the same accounting period as the original certificate to which the retakaful relates.
unearned contribution reserves
unearned contribution reserves (“uCr”) represent the portion of the net contributions of takaful certificates written that relate to the unexpired periods of the certificates at the end of the financial year.
In determining the uCr at the reporting date, the method that most accurately reflects the actual unearned contribution as follow is used:
- 1/365th method for all classes of General takaful business within Malaysia; and
- time apportionment method for non-annual certificates and first year annual certificates with a cover period of more than one year.
with a further reduction for wakalah fee expenses to reflect the wakalah business principle.

102
NOTES TO THE FINANCIAL STATEMENTS31 DECEMBER 2016(continued)
MAA GROUP BERHAD annual report 2016
2 SIGNIFICANT ACCOUNTING POLICIES (continued)
2.29 Takaful contracts - General takaful business (continued)
provision for outstanding claims
a liability for outstanding claim is recognised in respect of both direct takaful and inward retakaful. the amounts of outstanding claims are the best estimate of the claims expenditure required together with related expenses less recoveries to settle the present obligations at the date of the statement of financial position.
provision is also made for the cost of claims, together with related expenses and incurred but not reported (“IBnr”) at the date of the statement of financial position, based on an actuarial valuation by an independent qualified actuary.
Commission and agency expenses
Commission and agency expenses which are costs directly incurred in securing contributions on takaful certificates, net of commission income derived from retakaful in the course of ceding of contributions, are charged to profit or loss of the General takaful business as part of wakalah fees payable to the Shareholders’ fund of the takaful subsidiary in the financial year in which they are incurred.
Deficit/accumulated deficits
Deficits reported by the General takaful business during the financial year are reported as a loss in profit or loss of the General takaful business to the extent that there is no allocated surplus balances residing with the General takaful contract liabilities. accordingly, accumulated deficits and aFS reserve attributable to the Shareholders’ fund of the takaful subsidiary are treated as equity in the financial statements of the Group.
2.30 Takaful contracts - Family takaful business
the Family takaful business is maintained in accordance with the requirements of the IFSa and includes the amount attributable to participants. the amount attributable to participants represents the accumulated surpluses attributable to the participants as determined by an annual actuarial valuation of the Family takaful business and is attributable in accordance with the terms and conditions prescribed by the Shariah Committee of the takaful subsidiary.
any actuarial deficit in the Family takaful business will be made good via a benevolent loan or Qardhul Hassan from the Shareholders’ fund of the takaful subsidiary.
Gross contributions
Gross contributions represent contributions recognised in the Family takaful and investment-linked fund.
Gross contributions from the Family takaful business are recognised as soon as the amount can be reliably measured. First contribution is recognised from inception date and subsequent contribution is recognised when it is due. at the end of the financial year, all the contributions are accounted for to the extent that they can be reliably measured.
Gross contributions of the investment-linked business include net creation of units and represent contributions paid by participants as payment for new contracts or subsequent payments to increase the amount of those contracts. net creation of units is recognised on a receipt basis.
retakaful contributions
outward retakaful contributions are recognised in the same accounting period as the original certificates to which the retakaful relates.
provision for outstanding claims
Claims and settlement costs that are incurred during the financial year are recognised when a claimable event occurs and/or the insurer is notified.
recoveries on retakaful claims are accounted for in the same financial year as the original claims are recognised.
Claims and provisions for claims arising on Family takaful certificates including settlement costs, less retakaful recoveries, are accounted for using the case basis method and for this purpose the benefits payable under a family takaful policy are recognised as follows:
(i) maturity or other certificate benefit payments due on specified dates are treated as claims payable on the due dates;
(ii) death, surrender and other benefits without due dates are treated as claims payable, on the date of receipt of intimation of death of the assured or occurrence of contingency covered.
103
NOTES TO THE FINANCIAL STATEMENTS31 DECEMBER 2016
(continued)
annual report 2016 MAA GROUP BERHAD
2 SIGNIFICANT ACCOUNTING POLICIES (continued)
2.30 Takaful contracts - Family takaful business (continued)
Deficit/accumulated deficits
Deficits recorded by the Family takaful business during the financial year are reported as a loss in profit or loss of the Family takaful business to the extent that there are no unallocated surplus balances residing within the Family takaful contract liabilities. accordingly, accumulated deficits and aFS reserve attributable to the Shareholders’ fund of the takaful subsidiary are treated as equity in the statement of financial position of the Group.
2.31 Takaful contract liabilities
Family takaful contract liabilities
Family takaful contract liabilities are recognised when contracts are entered into and contributions are charged.
a liability adequacy test is performed at 75% confidence level, in line with Bank negara Malaysia (“BnM”)’s new valuation guidelines on Family takaful business and the requirements of MFrS 4 Insurance Contracts. Hence, claim rates, surrender assumptions and other valuation parameters are determined at 75% confidence level.
For investment-linked products, the non-unit liabilities are valued on a cash flow basis by projecting tabarru’ (risk charges) stream on a certificate basis, taking into account expected death and surrenders as decrements. the tabarru’ streams are then compared against the corresponding projected mortality and other risk benefits. Future deficits are reserved on a present value basis, using the risk free spot rates of return. the higher of the uCr and total present value of deficits is taken as the actuarial liability. the value of participant Investment account (“pIa”) is taken as the unit reserves.
In the case of yearly renewable term products with no savings elements, the liability for such Family takaful certificate comprises the provision for unearned contributions and unexpired risks, as well as for claims outstanding, which includes an estimate of the incurred claims that have not yet been reported to the takaful subsidiary. Where the portfolio demonstrates deteriorating experience, a deficiency reserve is set up as an additional reserve.
For long-term term products with implicit guarantees, the liabilities are measured by using a prospective actuarial valuation method. the liability is determined as the sum of present value of future benefits less the present value of future contributions, discounted at the appropriate risk discount rate. the liability is then compared against reserves derived from statutory method, and the larger of the two reserves is held as the liability. In the event that the surrender value is higher than the reserve in aggregate, the excess is held as an additional reserve.
expense liabilities in the Shareholder’s fund of the takaful subsidiary are determined by taking the present value of future deficits, discounted at appropriate spot rates. Future deficits are defined as the excess of future expense stream over future income cash flows, on aggregate basis.
the liability is de-recognised when the contract expires, is discharged or is cancelled.
General takaful contract liabilities
General takaful contract liabilities are recognised when contracts are entered into and contributions are charged.
these liabilities comprise outstanding claims provision and unearned contribution reserves.
outstanding claims provision which includes a margin for adverse deviation is based on the estimated ultimate cost of all claims incurred but not settled at the date of the statement of financial position, whether reported or not, together with related claim handling costs and reduction for the expected value of salvage and other recoveries. Delays can be experienced in the notification and settlement of certain types of claims, therefore, the ultimate cost of these claims cannot be known with certainty at the statement of financial position date. the liability is calculated at the reporting date using a range of standard actuarial claim projection techniques on empirical data. the liability is not discounted for the time value of money. no provision for equalisation or catastrophe reserves is recognised. the liabilities are derecognised when the contract expires, is discharged or is cancelled.
unearned contribution reserves represent contributions received for risks that have not yet expired. Generally, the reserve is released over the term of the contract and is recognised as contribution income.
at each reporting date, the takaful subsidiary reviews its unexpired risks and a liability adequacy test is performed to determine whether there is any overall excess of expected claims. this calculation uses current estimates of future contractual cash flows (taking into consideration current loss ratios) after taking into account the investment return expected to arise on assets relating to the relevant general technical provisions. If these estimates show that the carrying amount of the unearned contributions is inadequate, the deficiency is recognised in profit or loss by setting up a provision for liability adequacy.

104
NOTES TO THE FINANCIAL STATEMENTS31 DECEMBER 2016(continued)
MAA GROUP BERHAD annual report 2016
2 SIGNIFICANT ACCOUNTING POLICIES (continued)
2.32 Shareholders’ fund’s expense liabilities
the expense liabilities of the Shareholders’ fund of the takaful subsidiary consist of expense liabilities of the General and Family takaful businesses which are based on estimations performed by a qualified actuary. the expense liabilities are released over the term of the takaful certificates and recognised in profit or loss.
2.33 Measurement and impairment of Qardhul Hassan
any deficit in the takaful risk fund will be made good via a benevolent loan or Qardhul Hassan, granted by the Shareholders’ fund of the takaful subsidiary to the takaful businesses. Qardhul Hassan shall be repaid from future surplus of the takaful businesses.
Qardhul Hassan is accounted as a receivable and payable in the financial statements of the Shareholders’ fund of the takaful subsidiary and takaful businesses respectively, and is stated at cost. at each date of the statement of financial position, the takaful subsidiary assesses whether there is any indication of impairment in the Shareholders’ fund. If such indication exists, an analysis is performed to assess whether the carrying amount of the asset is fully recoverable. a write down is made if the carrying amount exceeds the recoverable amount, as set out in note 2.9 to the financial statements on impairment of non-financial assets.
Qardhul Hassan payable in the respective takaful businesses is stated at cost.
2.34 Management expenses, commission expenses and wakalah fees
acquisition costs, commissions and management expenses (collectively known as “wakalah fees”) are borne by the Family takaful and General takaful businesses respectively in profit or loss at an agreed percentage of the gross contributions, in accordance with the principles of wakalah as approved by the Shariah Committee of the takaful subsidiary and agreed between the participants and the takaful subsidiary, and are allocated to the Shareholders’ fund of the takaful subsidiary and recognised as income upon issuance of the takaful certificates.
2.35 Other revenue recognition
Interest and profit income
Interest income for financial assets that are not classified as FVtpl is recognised using the effective interest method. When a loan and receivable is impaired, the Group reduces the carrying amount to its recoverable amount, being the estimated future cash flow discounted at the original effective interest rate of the investment and continues unwinding the discount as interest income.
other interest income includes the amount of amortisation of premiums and accretion of discounts is recognised on a time proportion basis that takes into account the effective yield of the asset.
profit income includes the amount of amortisation of premium and accretion of discount of the takaful subsidiary is recognised on a time proportion basis that takes into account the effective yield of the asset.
rental income
rental income on investment property is recognised on receipt basis.
Dividend income
Dividend income is recognised when the right to receive payment is established.
other fee income
Management, consultancy and advisory, educational and card services fees are recognised when the services are provided.
realised gains and losses on investments
realised gains and losses on investments recorded in profit or loss include gains and losses on financial assets and investment properties. Gains and losses on the sale of investments are calculated as the difference between net sale proceeds and the carrying value at date of disposal and are recorded on occurrence of the sale transaction.
Fees and commission income
takaful contract participants are charged for policy administration services, investment management services, surrenders and other contract fees. these fees are recognised as revenue over the period in which the related services are performed. If the fees are for services to be provided in future periods, then they are deferred and recognised over those future periods.

105
NOTES TO THE FINANCIAL STATEMENTS31 DECEMBER 2016
(continued)
annual report 2016 MAA GROUP BERHAD
2 SIGNIFICANT ACCOUNTING POLICIES (continued)
2.36 Current and deferred income tax
the tax expense for the financial year comprises current and deferred tax. tax is recognised in profit or loss, except to the extent that it relates to items recognised in other comprehensive income or directly in equity. In this case, the tax is recognised in other comprehensive income or directly in equity respectively.
Current tax
Current tax is the expected tax payable on the taxable income for the financial year, using tax rates enacted or substantially enacted at the reporting date in the countries where the Group’s subsidiaries and associates operate and generate taxable income, and any adjustments to tax payable in respects of prior financial years.
Management periodically evaluates positions taken in tax returns with respect to situations in which applicable tax regulations are subject to interpretations and makes provisions, where appropriate, on the basis of amounts expected to be paid to the tax authorities using an expected value (weighted average probability) approach.
Deferred tax
Deferred tax is recognised, using the liability method, on temporary differences arising between the carrying amounts attributed to assets and liabilities for tax purposes and their carrying amounts in the financial statements. However, deferred tax is not accounted for if it arises from initial recognition of an asset or liability in a transaction other than a business combination that at the time of the transaction affects neither accounting profit nor taxable profit or loss. Deferred tax is determined using tax rates (tax laws) that have been enacted or substantively enacted at the end of the reporting date and are expected to apply when the deferred tax asset is realised or the deferred tax liability is settled.
Deferred tax assets are recognised to the extent that it is probable that taxable profit will be available against which the deductible temporary differences, unused tax loses or unused tax credit can be utilised.
Deferred tax is recognised on temporary differences arising on investments in subsidiaries, associates and joint ventures except where the timing of the reversal of the temporary difference can be controlled by the Group and it is probable that the temporary difference will not reverse in the foreseeable future.
Deferred and income tax assets and liabilities are offset when there is a legally enforceable right to offset current tax assets against current tax liabilities and when the deferred income tax assets and liabilities relate to taxes levied by the same taxation authority on either the taxable entity or different taxable entities where there is an intention to settle the balances on a net basis.
the carrying amounts of deferred tax assets are reviewed at each reporting date and reduced to the extent that it is no longer probable that sufficient taxable profit will be available to allow all or part of the deferred tax assets to be utilised. unrecognised deferred tax assets are reassessed at each reporting date and are recognised to the extent that it has become probable that future taxable profit will allow the deferred tax asset to be utilised.
Deferred tax is recognised as income or an expense and is included in profit or loss for the period, except when it arises from a transaction which is recognised in other comprehensive income or directly in equity, in which case the deferred tax is also recognised in other comprehensive income or directly in equity.
2.37 Zakat
Zakat represents tithes payable by the takaful subsidiary to comply with Shariah principles and as approved by the Shariah Committee. Zakat provision is calculated at 2.5% of the profit before zakat and taxation of the takaful subsidiary for the financial year.
2.38 Earnings per share
the Group presents basic earnings per share (“epS”) data for its ordinary shares. Basic epS is calculated by dividing the consolidated profit or loss attributable to ordinary shareholders of the Company by the weighted average number of shares outstanding during the period, net of treasury shares. no diluted epS is disclosed in these financial statements as there are no potential dilutive ordinary shares.

106
NOTES TO THE FINANCIAL STATEMENTS31 DECEMBER 2016(continued)
MAA GROUP BERHAD annual report 2016
3 CRITICAL ACCOUNTING ESTIMATES AND JUDGEMENTS IN APPLYING ACCOUNTING POLICIES
estimates and judgements are continually evaluated by the Directors and are based on historical experience and other factors, including expectations of future events that are believed to be reasonable under the circumstances.
(a) Critical accounting estimates and assumptions
the Group makes estimates and assumptions concerning the future. the resulting accounting estimates will, by definition, rarely equal the related actual results. the estimates and assumptions that have a significant risk of causing a material adjustment to the carrying amounts of assets and liabilities within the next financial year are outlined below.
(i) present Value adjustment to remaining Sale Consideration for the Disposal of Maa takaful
under the Spa for the disposal of Maa takaful, the remaining rM93.75 million sale consideration (“retained Consideration”) will be paid on the third anniversary date from the disposal completion date.
taking into account time value of money, the management has discounted the retained Consideration using Zurich’s average cost of debt after taxation at 2.59% per annum as at 30 June 2016 as the discount rate over the remaining period of 2.5 years from financial year ended 31 December 2016 to the third anniversary date of disposal, 30 June 2018. the resulting effect is a present value adjustment of rM5.8 million been recognised in the Company’s profit or loss for the financial year ended 31 December 2016.
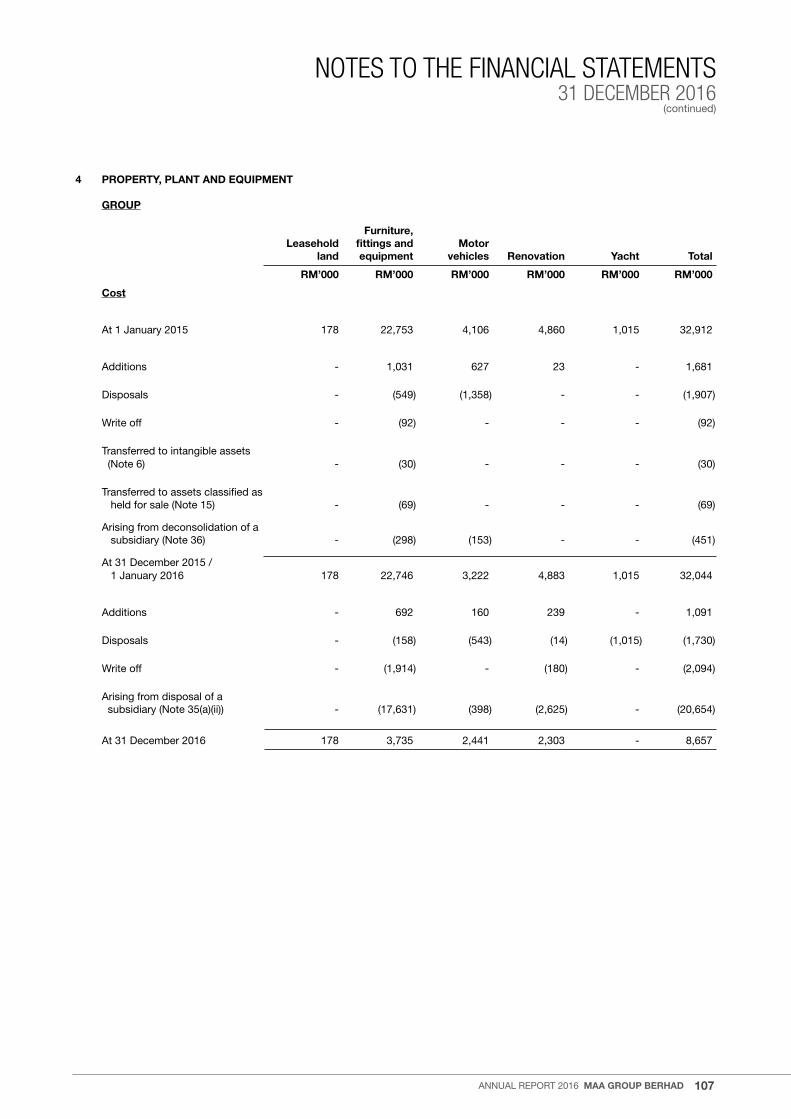
107
NOTES TO THE FINANCIAL STATEMENTS31 DECEMBER 2016
(continued)
annual report 2016 MAA GROUP BERHAD
4 PROPERTY, PLANT AND EQUIPMENT
GROUP Furniture, Leasehold fittings and Motor land equipment vehicles Renovation Yacht Total
RM’000 RM’000 RM’000 RM’000 RM’000 RM’000
Cost
at 1 January 2015 178 22,753 4,106 4,860 1,015 32,912
additions - 1,031 627 23 - 1,681
Disposals - (549) (1,358) - - (1,907)
Write off - (92) - - - (92)
transferred to intangible assets (note 6) - (30) - - - (30)
transferred to assets classified as held for sale (note 15) - (69) - - - (69)
arising from deconsolidation of a subsidiary (note 36) - (298) (153) - - (451)
at 31 December 2015 / 1 January 2016 178 22,746 3,222 4,883 1,015 32,044
additions - 692 160 239 - 1,091
Disposals - (158) (543) (14) (1,015) (1,730)
Write off - (1,914) - (180) - (2,094)
arising from disposal of a subsidiary (note 35(a)(ii)) - (17,631) (398) (2,625) - (20,654)
at 31 December 2016 178 3,735 2,441 2,303 - 8,657

108
NOTES TO THE FINANCIAL STATEMENTS31 DECEMBER 2016(continued)
MAA GROUP BERHAD annual report 2016
4 PROPERTY, PLANT AND EQUIPMENT (continued)
GROUP Furniture, Leasehold fittings and Motor land equipment vehicles Renovation Yacht Total
RM’000 RM’000 RM’000 RM’000 RM’000 RM’000
Accumulated depreciation
at 1 January 2015 2 11,002 3,034 1,470 63 15,571
Depreciation for the financial year (note 30) - 2,521 323 447 64 3,355
amortisation for the financial year (note 30) 2 - - - - 2
Disposals - (537) (1,299) - - (1,836)
Write off - (26) - - - (26)
transferred to intangible assets (note 6) - (7) - - - (7)
transferred to assets classified as held for sale (note 15) - (50) - - - (50)
arising from deconsolidation of a subsidiary (note 36) - (269) (153) - - (422)
at 31 December 2015 / 1 January 2016 4 12,634 1,905 1,917 127 16,587
Depreciation for the financial year (note 30) - 1,473 263 375 - 2,111
amortisation for the financial year (note 30) 2 - - - - 2
Disposals - (109) (533) (6) (127) (775)
Write off - (1,837) - (180) - (2,017)
arising from disposal of a subsidiary (note 35(a)(ii)) - (9,751) (229) (1,013) - (10,993)
at 31 December 2016 6 2,410 1,406 1,093 - 4,915

109
NOTES TO THE FINANCIAL STATEMENTS31 DECEMBER 2016
(continued)
annual report 2016 MAA GROUP BERHAD
4 PROPERTY, PLANT AND EQUIPMENT (continued)
GROUP Furniture, Leasehold fittings and Motor land equipment vehicles Renovation Yacht Total
RM’000 RM’000 RM’000 RM’000 RM’000 RM’000
Accumulated impairment loss
at 1 January 2015 44 - - - - 44
Impairment loss for the financial year (note 28) - - - - 838 838
at 31 December 2015 / 1 January 2016 44 - - - 838 882
Impairment loss for the financial year (note 28) 12 - - - - 12
Disposals - - - - (838) (838)
at 31 December 2016 56 - - - - 56
Net book value
at 31 December 2015 130 10,112 1,317 2,966 50 14,575
at 31 December 2016 116 1,325 1,035 1,210 - 3,686
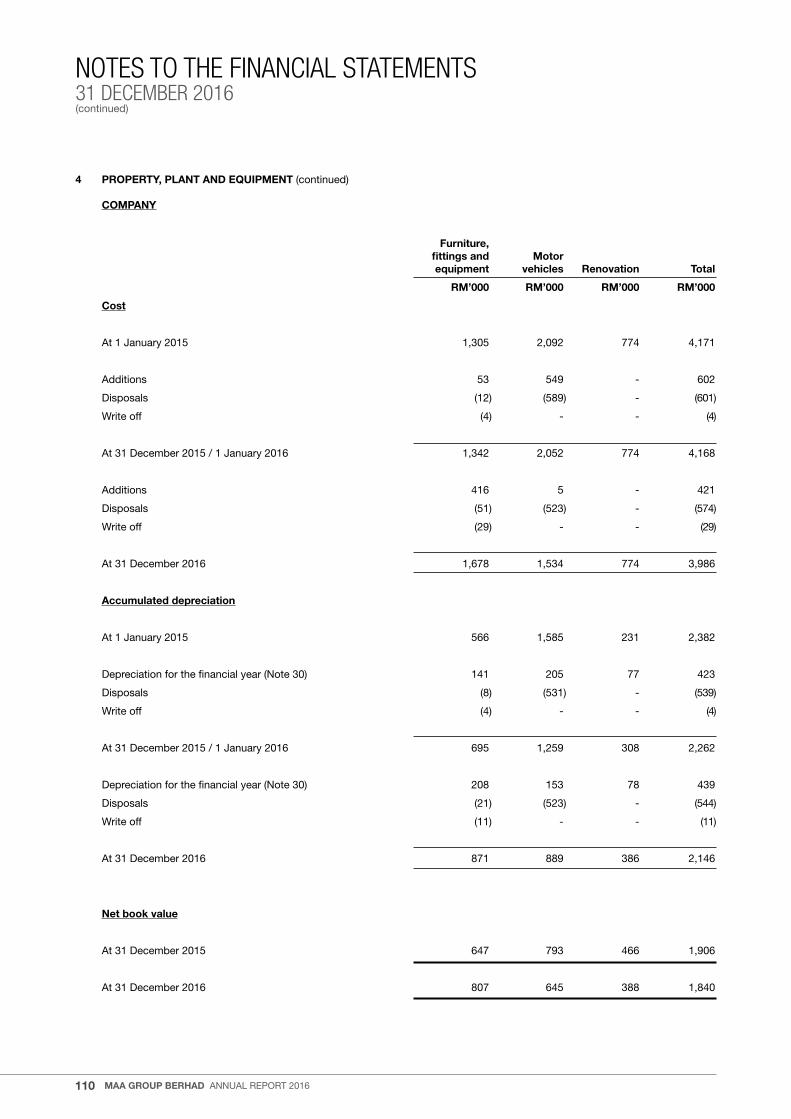
110
NOTES TO THE FINANCIAL STATEMENTS31 DECEMBER 2016(continued)
MAA GROUP BERHAD annual report 2016
4 PROPERTY, PLANT AND EQUIPMENT (continued)
COMPANY Furniture,
fittings and Motor equipment vehicles Renovation Total
RM’000 RM’000 RM’000 RM’000
Cost
at 1 January 2015 1,305 2,092 774 4,171
additions 53 549 - 602
Disposals (12) (589) - (601)
Write off (4) - - (4)
at 31 December 2015 / 1 January 2016 1,342 2,052 774 4,168
additions 416 5 - 421
Disposals (51) (523) - (574)
Write off (29) - - (29)
at 31 December 2016 1,678 1,534 774 3,986
Accumulated depreciation
at 1 January 2015 566 1,585 231 2,382
Depreciation for the financial year (note 30) 141 205 77 423
Disposals (8) (531) - (539)
Write off (4) - - (4)
at 31 December 2015 / 1 January 2016 695 1,259 308 2,262
Depreciation for the financial year (note 30) 208 153 78 439
Disposals (21) (523) - (544)
Write off (11) - - (11)
at 31 December 2016 871 889 386 2,146
Net book value
at 31 December 2015 647 793 466 1,906
at 31 December 2016 807 645 388 1,840

111
NOTES TO THE FINANCIAL STATEMENTS31 DECEMBER 2016
(continued)
annual report 2016 MAA GROUP BERHAD
5 INVESTMENT PROPERTIES
GROUP
31.12.2016 31.12.2015
RM’000 RM’000
at 1 January 19,356 14,846
addition from subsequent expenditure 267 -
Fair value gains – net (note 25) 2,011 1,778
Currency translation differences (1,810) 2,732
at 31 December 19,824 19,356
Comprising:
leasehold land and buildings 19,824 19,356
Investment properties are stated at fair values, which have been determined based on valuations performed by external independent professional valuers at the statement of financial position date. Valuations are performed annually based on the properties’ fair market value using the direct sale comparison. the fair value gain is recorded in profit or loss.
Fair value hierarchy
a level is assigned to each fair value measurement based on the lowest level input significant to the fair value measurement in its entirety. the three-level hierarchy is defined as follows:
level 1 – fair value is derived from unadjusted quoted price in active markets for identical properties that the entity can access at the measurement date.
level 2 – fair value is estimated using inputs that are observable for the properties, either directly or indirectly.
level 3 – fair value is estimated using unobservable inputs for properties.
the fair value of investment properties are categorised as follows:
GROUP
31.12.2016 31.12.2015
RM’000 RM’000
level 2 19,824 19,356
the investment properties under level 2 of the fair value hierarchy are measured in whole by reference to inputs other than quoted prices included within level 1 that are observable for the investment property either directly or indirectly. the investment properties are valued using the comparison method – recent transactions and asking prices of similar properties in the locality are analysed for comparison purpose characteristics to arrive at the fair values.
the Group’s policy is to recognise transfer into and transfer out of fair value hierarchy levels as at the end of the reporting period. there was no transfer during the financial year ended 31 December 2016.
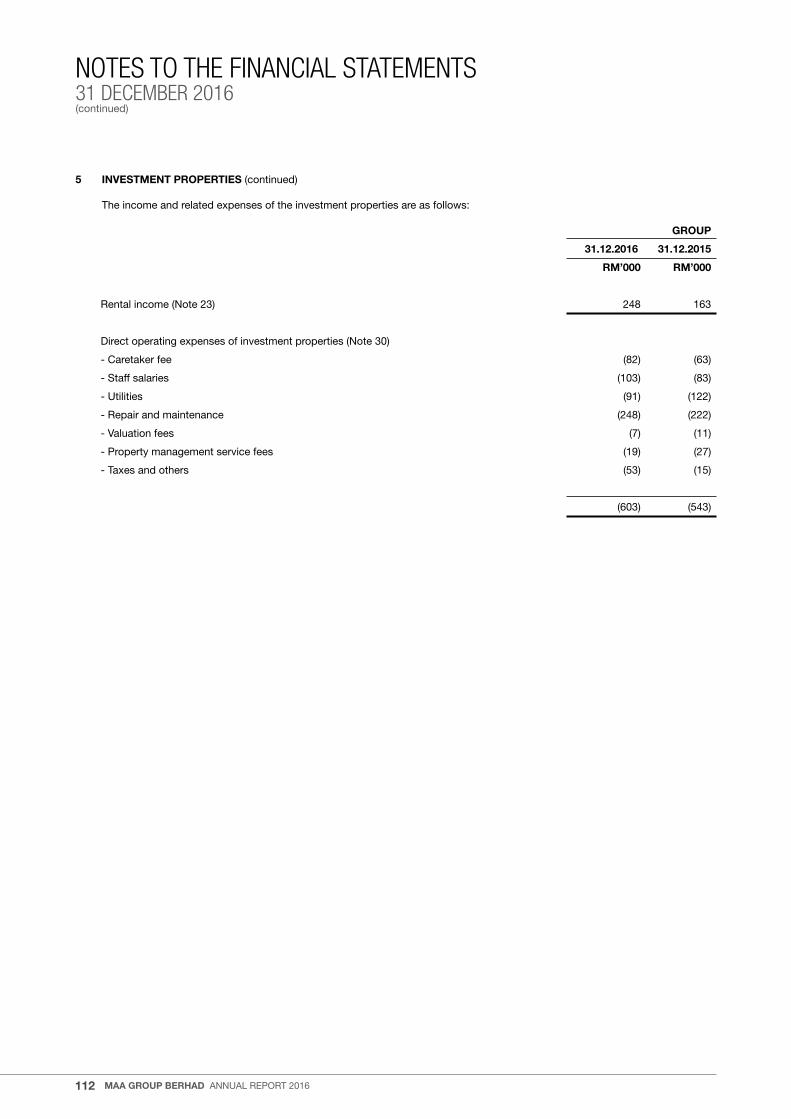
112
NOTES TO THE FINANCIAL STATEMENTS31 DECEMBER 2016(continued)
MAA GROUP BERHAD annual report 2016
5 INVESTMENT PROPERTIES (continued)
the income and related expenses of the investment properties are as follows:
GROUP
31.12.2016 31.12.2015
RM’000 RM’000
rental income (note 23) 248 163
Direct operating expenses of investment properties (note 30)
- Caretaker fee (82) (63)
- Staff salaries (103) (83)
- utilities (91) (122)
- repair and maintenance (248) (222)
- Valuation fees (7) (11)
- property management service fees (19) (27)
- taxes and others (53) (15)
(603) (543)
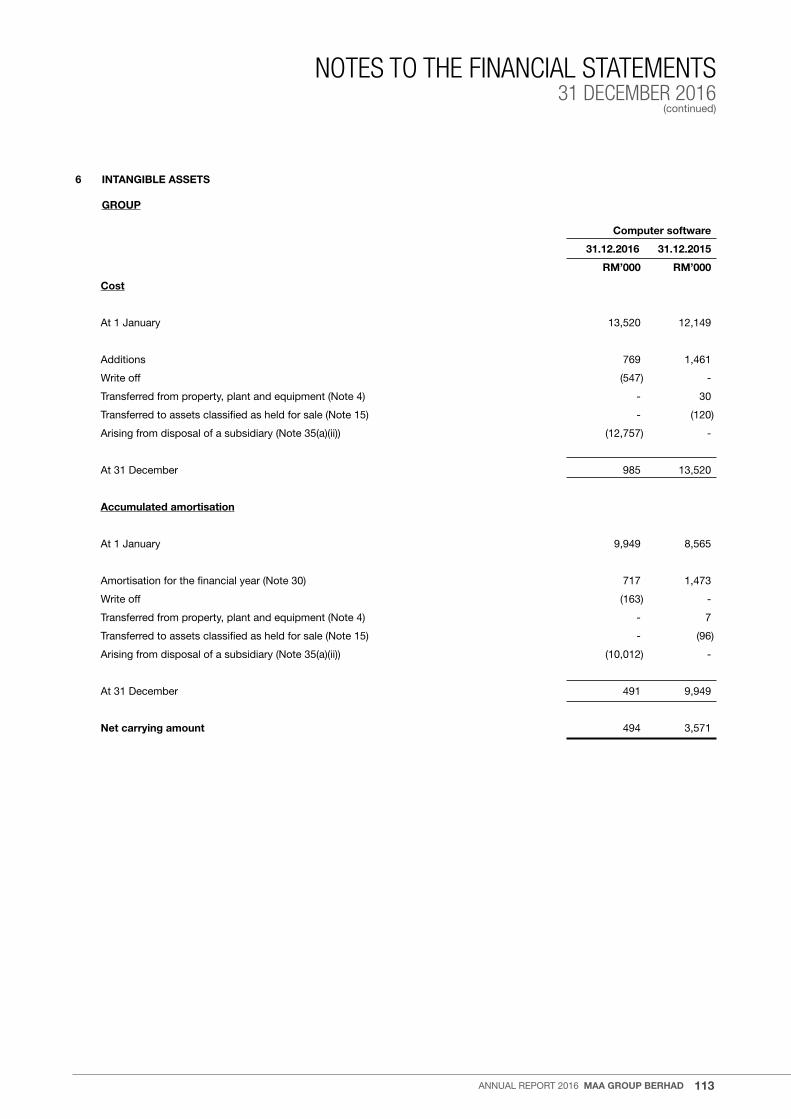
113
NOTES TO THE FINANCIAL STATEMENTS31 DECEMBER 2016
(continued)
annual report 2016 MAA GROUP BERHAD
6 INTANGIBLE ASSETS
GROUP
Computer software
31.12.2016 31.12.2015
RM’000 RM’000
Cost
at 1 January 13,520 12,149
additions 769 1,461
Write off (547) -
transferred from property, plant and equipment (note 4) - 30
transferred to assets classified as held for sale (note 15) - (120)
arising from disposal of a subsidiary (note 35(a)(ii)) (12,757) -
at 31 December 985 13,520
Accumulated amortisation
at 1 January 9,949 8,565
amortisation for the financial year (note 30) 717 1,473
Write off (163) -
transferred from property, plant and equipment (note 4) - 7
transferred to assets classified as held for sale (note 15) - (96)
arising from disposal of a subsidiary (note 35(a)(ii)) (10,012) -
at 31 December 491 9,949
Net carrying amount 494 3,571
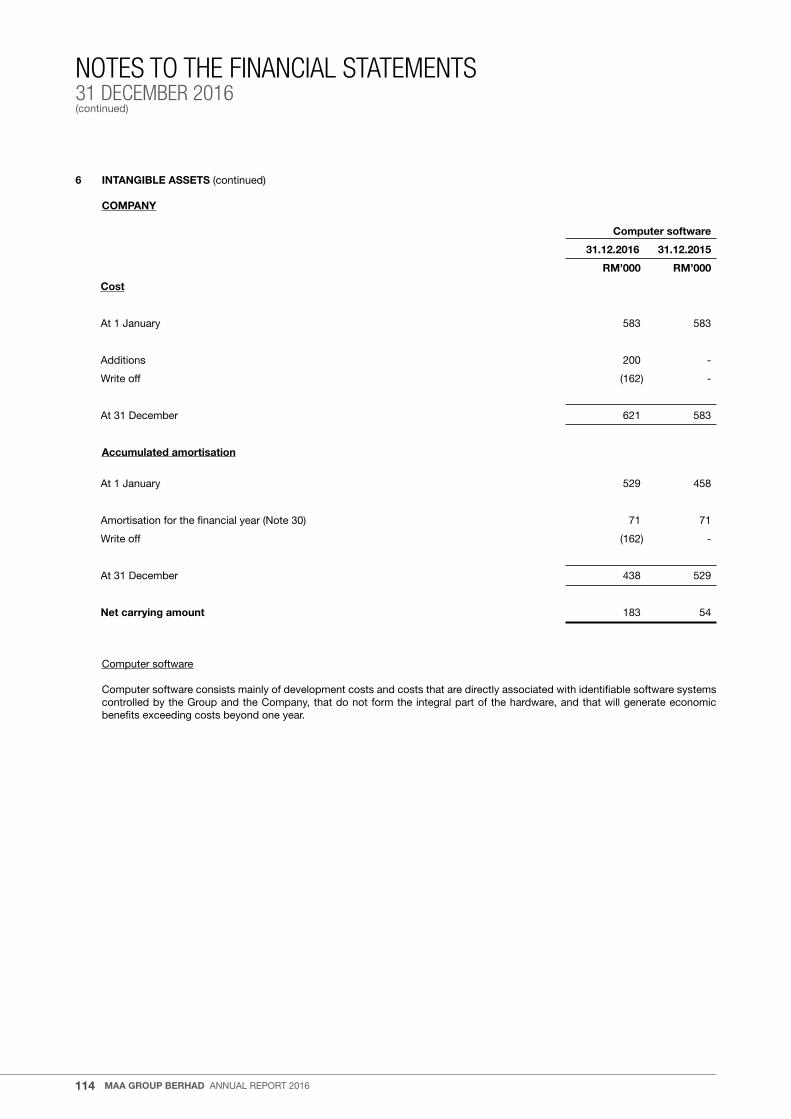
114
NOTES TO THE FINANCIAL STATEMENTS31 DECEMBER 2016(continued)
MAA GROUP BERHAD annual report 2016
6 INTANGIBLE ASSETS (continued) COMPANY
Computer software
31.12.2016 31.12.2015
RM’000 RM’000
Cost
at 1 January 583 583
additions 200 -
Write off (162) -
at 31 December 621 583
Accumulated amortisation
at 1 January 529 458
amortisation for the financial year (note 30) 71 71
Write off (162) -
at 31 December 438 529
Net carrying amount 183 54
Computer software
Computer software consists mainly of development costs and costs that are directly associated with identifiable software systems controlled by the Group and the Company, that do not form the integral part of the hardware, and that will generate economic benefits exceeding costs beyond one year.

115
NOTES TO THE FINANCIAL STATEMENTS31 DECEMBER 2016
(continued)
annual report 2016 MAA GROUP BERHAD
7 SUBSIDIARIES
COMPANY
31.12.2016 31.12.2015
RM’000 RM’000
Investments in subsidiaries, at cost 179,228 227,228
less: accumulated impairment loss (127,005) (127,005)
52,223 100,223
a reconciliation of the allowance for impairment loss on investments in subsidiaries is as follows:
at 1 January 127,005 125,731
allowance for impairment loss (note 28) - 1,274
at 31 December 127,005 127,005
Details of the subsidiaries are as follows:
31.12.2016 31.12.2015
Group’s Non- Group’s Non- Country of effective controlling effective controlling Name of company incorporation interest interests interest interests Principal activities
% % % %
Maa Corporation Sdn Bhd Malaysia 100 - 100 - providing property (“Maa Corp”) management services and investment holding
Maa takaful Berhad(1) Malaysia - - 75 25 General takaful and Family takaful businesses
Subsidiaries of Maa Corp Maa-Medicare Sdn Bhd Malaysia 100 - 100 - operation of charitable kidney dialysis centres
Maa Credit Berhad Malaysia 100 - 100 - Hire purchase, leasing and other credit activities
Maa International labuan, 100 - 100 - Investment holding assurance ltd Malaysia Maa Holdings (BVI) ltd British Virgin 100 - 100 - providing insurance Islands technical and financial consultancy services
Maa Corporate advisory Malaysia 100 - 100 - providing corporate Sdn Bhd advisory and consultancy services

116
NOTES TO THE FINANCIAL STATEMENTS31 DECEMBER 2016(continued)
MAA GROUP BERHAD annual report 2016
7 SUBSIDIARIES (continued)
Details of the subsidiaries are as follows: (continued)
31.12.2016 31.12.2015
Group’s Non- Group’s Non- Country of effective controlling effective controlling Name of company incorporation interest interests interest interests Principal activities
% % % %
Subsidiaries of Maa Corp (continued)
Maa International Malaysia 100 - 100 - Investment holding Corporation ltd
Maa International Malaysia 100 - 100 - Investment holding Investments ltd Menang Bernas Sdn Bhd Malaysia 100 - 100 - Dormant Maa Cards Sdn Bhd(1) Malaysia - - 100 - Business of prepaid cards and services
# MaaxSite Sdn Bhd Malaysia 100 - 100 - Dormant
# MaaxClub Sdn Bhd Malaysia 100 - 100 - Dormant
# Kasturi academia Sdn Bhd Malaysia 100 - 100 - provision of education (formerly known as pusat services and tuisyen Kasturi Sdn Bhd) operations of education tuition centres and investment holding
Subsidiaries of Maa International Investments ltd
# Maa Mutualife philippines 100 - 100 - unit trust funds philippines, Inc management
# Columbus Capital Singapore 100 - 100 - Investment holding Singapore pte ltd Subsidiary of Maa International Corporation ltd # Maa Corporate & philippines 100 - 100 - Inactive Compliance phils. Inc.
Subsidiaries of Maa Corp and Maa Credit Berhad
# Keris Murni Sdn Bhd Malaysia 100 - 100 - Investment holding
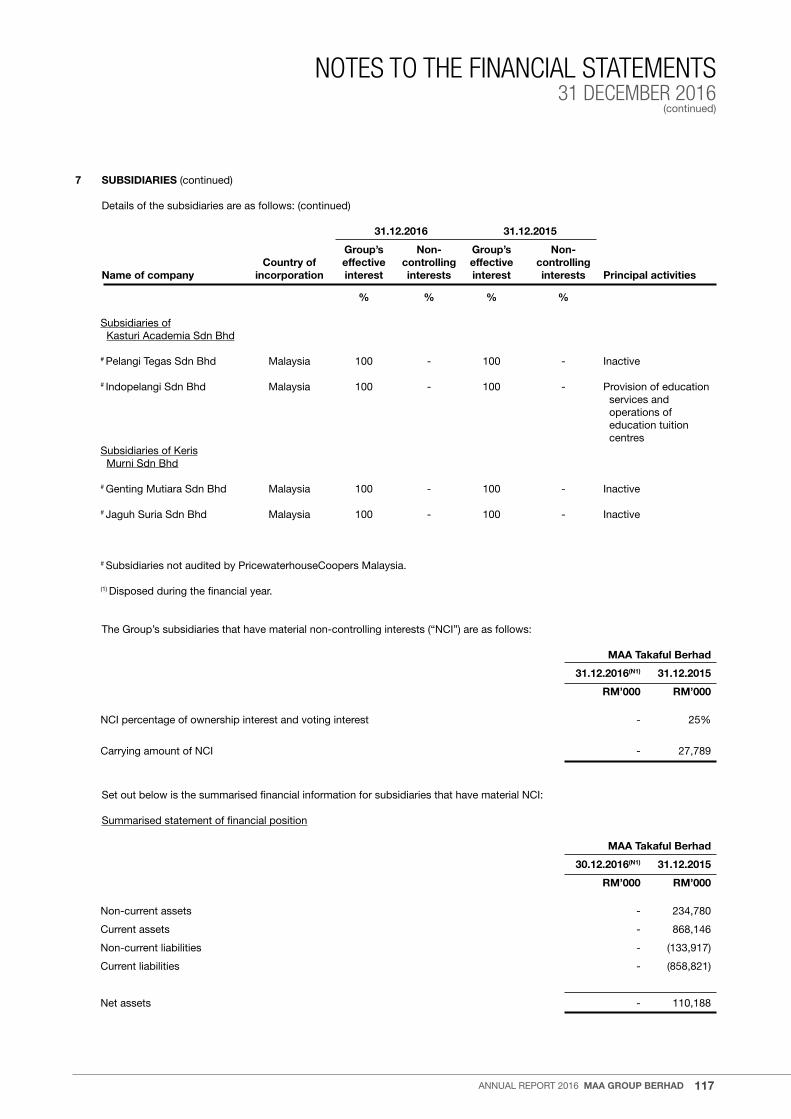
117
NOTES TO THE FINANCIAL STATEMENTS31 DECEMBER 2016
(continued)
annual report 2016 MAA GROUP BERHAD
7 SUBSIDIARIES (continued)
Details of the subsidiaries are as follows: (continued)
31.12.2016 31.12.2015
Group’s Non- Group’s Non- Country of effective controlling effective controlling Name of company incorporation interest interests interest interests Principal activities
% % % %
Subsidiaries of Kasturi academia Sdn Bhd
# pelangi tegas Sdn Bhd Malaysia 100 - 100 - Inactive
# Indopelangi Sdn Bhd Malaysia 100 - 100 - provision of education services and operations of education tuition centresSubsidiaries of Keris Murni Sdn Bhd
# Genting Mutiara Sdn Bhd Malaysia 100 - 100 - Inactive
# Jaguh Suria Sdn Bhd Malaysia 100 - 100 - Inactive
# Subsidiaries not audited by pricewaterhouseCoopers Malaysia.
(1) Disposed during the financial year.
the Group’s subsidiaries that have material non-controlling interests (“nCI”) are as follows:
MAA Takaful Berhad
31.12.2016(N1) 31.12.2015
RM’000 RM’000
nCI percentage of ownership interest and voting interest - 25%
Carrying amount of nCI - 27,789
Set out below is the summarised financial information for subsidiaries that have material nCI:
Summarised statement of financial position
MAA Takaful Berhad
30.12.2016(N1) 31.12.2015
RM’000 RM’000
non-current assets - 234,780
Current assets - 868,146
non-current liabilities - (133,917)
Current liabilities - (858,821)
net assets - 110,188

118
NOTES TO THE FINANCIAL STATEMENTS31 DECEMBER 2016(continued)
MAA GROUP BERHAD annual report 2016
7 SUBSIDIARIES (continued)
Set out below is the summarised financial information for subsidiaries that have material nCI: (continued)
Summarised statement of profit or loss and statement of other comprehensive income
MAA Takaful Berhad PT MAA General Assurance
Financial Financial Financial Financial period ended year ended year ended period ended 30.6.2016(N1) 31.12.2015 31.12.2016 30.11.2015(N2)
RM’000 RM’000 RM’000 RM’000
operating revenue 279,188 548,980 - 165
profit before taxation 5,540 2,813 - 675
taxation (3,729) (9,425) - -
profit/(loss) for the financial period/year 1,811 (6,612) - 675
other comprehensive income/(loss) for the financial period/year 233 (46) - (58)
total comprehensive income/(loss) for the financial period/year 2,044 (6,658) - 617
total comprehensive income/(loss) allocated to nCI 452 (1,654) - 115
Dividends paid to nCI - - - -
the financial information above comprised of the amounts before inter-company elimination.
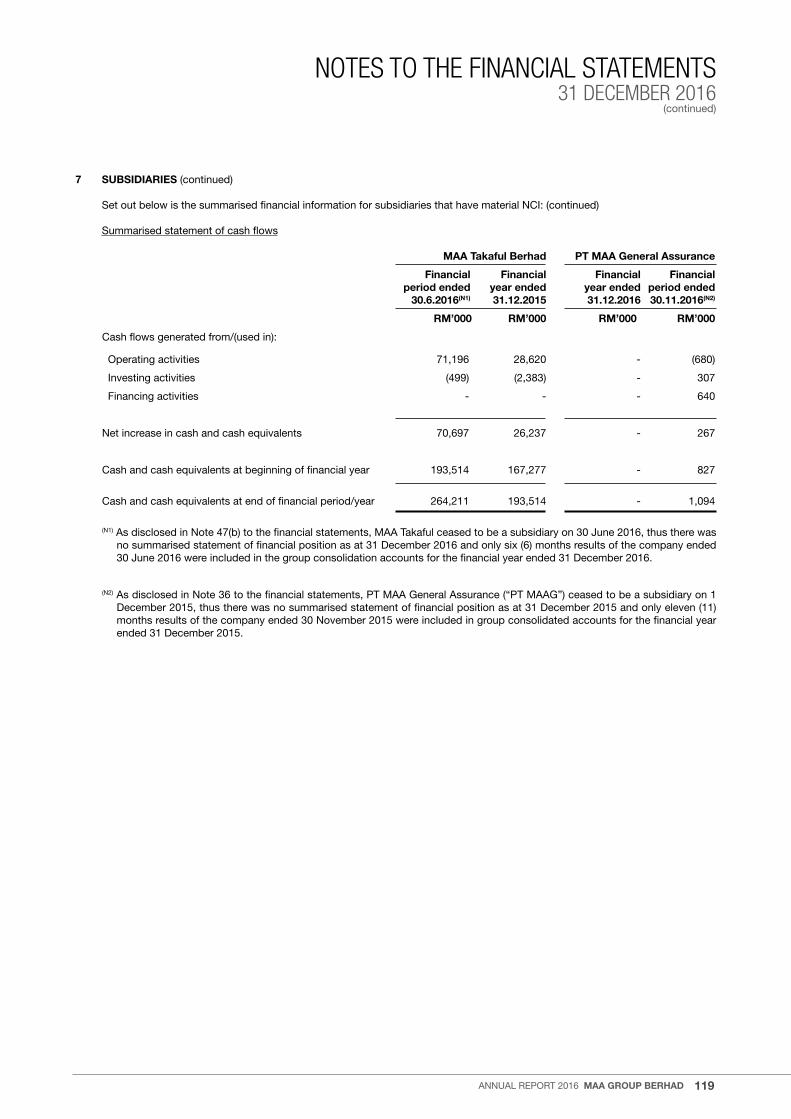
119
NOTES TO THE FINANCIAL STATEMENTS31 DECEMBER 2016
(continued)
annual report 2016 MAA GROUP BERHAD
7 SUBSIDIARIES (continued)
Set out below is the summarised financial information for subsidiaries that have material nCI: (continued)
Summarised statement of cash flows
MAA Takaful Berhad PT MAA General Assurance
Financial Financial Financial Financial period ended year ended year ended period ended 30.6.2016(N1) 31.12.2015 31.12.2016 30.11.2016(N2)
RM’000 RM’000 RM’000 RM’000
Cash flows generated from/(used in):
operating activities 71,196 28,620 - (680)
Investing activities (499) (2,383) - 307
Financing activities - - - 640
net increase in cash and cash equivalents 70,697 26,237 - 267
Cash and cash equivalents at beginning of financial year 193,514 167,277 - 827
Cash and cash equivalents at end of financial period/year 264,211 193,514 - 1,094 (n1) as disclosed in note 47(b) to the financial statements, Maa takaful ceased to be a subsidiary on 30 June 2016, thus there was
no summarised statement of financial position as at 31 December 2016 and only six (6) months results of the company ended 30 June 2016 were included in the group consolidation accounts for the financial year ended 31 December 2016.
(n2) as disclosed in note 36 to the financial statements, pt Maa General assurance (“pt MaaG”) ceased to be a subsidiary on 1 December 2015, thus there was no summarised statement of financial position as at 31 December 2015 and only eleven (11) months results of the company ended 30 november 2015 were included in group consolidated accounts for the financial year ended 31 December 2015.

120
NOTES TO THE FINANCIAL STATEMENTS31 DECEMBER 2016(continued)
MAA GROUP BERHAD annual report 2016
8 ASSOCIATES
GROUP COMPANY
31.12.2016 31.12.2015 31.12.2016 31.12.2015
RM’000 RM’000 RM’000 RM’000
unquoted shares, at cost 71,997 71,997 100 100
less: accumulated impairment loss (7,650) (7,650) (100) (100)
64,347 64,347 - -
Share of post acquisition profit 8,599 3,871 - -
Share of other comprehensive loss (1,254) (264) - -
71,692 67,954 - -
the details of the associates are as follows:
Group’s effective interest
Country of Name of company incorporation 31.12.2016 31.12.2015 Principal activities
% %
Maa Bancwell trustee Berhad Malaysia 49 49 Inactive
associate of Maa Corp
Meridian asset Management Holdings Malaysia 40 40 Investment holding Sdn Bhd
associate of Maa International assurance ltd
Maa General assurance philippines, Inc philippines 40 40 General insurance business
associate of Columbus Capital Singapore pte ltd
Columbus Capital pty limited australia 48 48 retail mortgage lending and loan securitisation
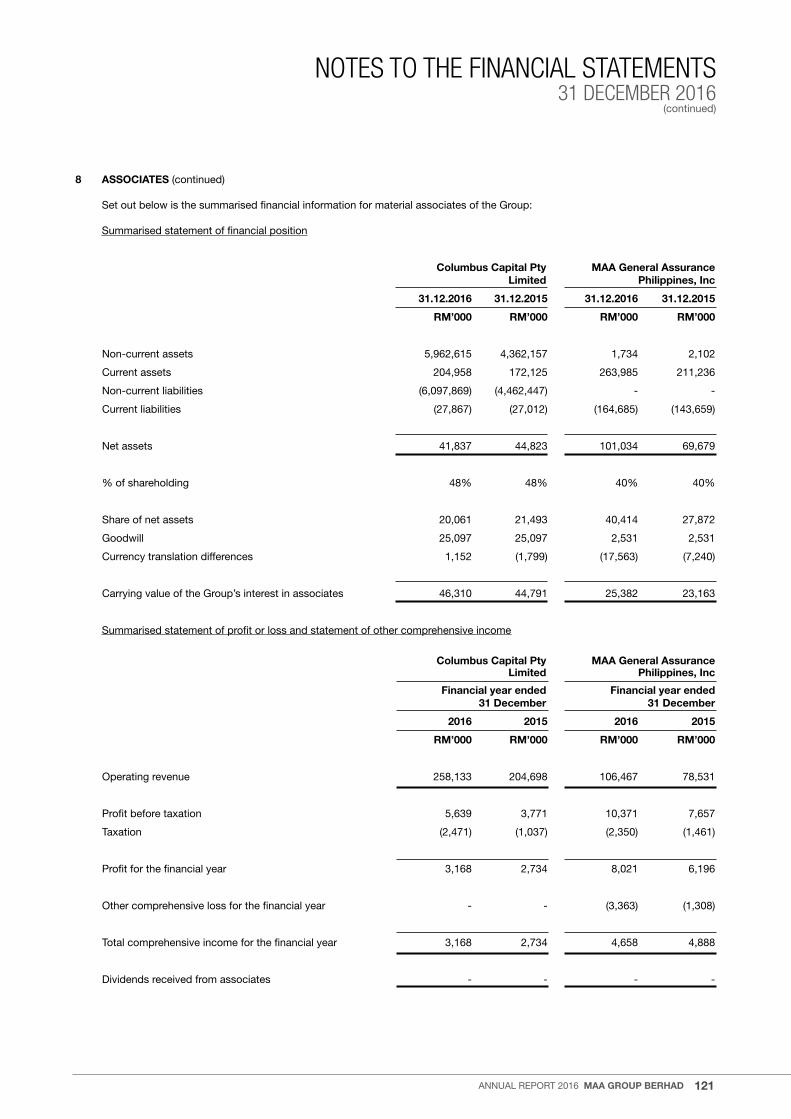
121
NOTES TO THE FINANCIAL STATEMENTS31 DECEMBER 2016
(continued)
annual report 2016 MAA GROUP BERHAD
8 ASSOCIATES (continued) Set out below is the summarised financial information for material associates of the Group:
Summarised statement of financial position
Columbus Capital Pty MAA General Assurance Limited Philippines, Inc
31.12.2016 31.12.2015 31.12.2016 31.12.2015
RM’000 RM’000 RM’000 RM’000
non-current assets 5,962,615 4,362,157 1,734 2,102
Current assets 204,958 172,125 263,985 211,236
non-current liabilities (6,097,869) (4,462,447) - -
Current liabilities (27,867) (27,012) (164,685) (143,659)
net assets 41,837 44,823 101,034 69,679
% of shareholding 48% 48% 40% 40%
Share of net assets 20,061 21,493 40,414 27,872
Goodwill 25,097 25,097 2,531 2,531
Currency translation differences 1,152 (1,799) (17,563) (7,240)
Carrying value of the Group’s interest in associates 46,310 44,791 25,382 23,163
Summarised statement of profit or loss and statement of other comprehensive income
Columbus Capital Pty MAA General Assurance Limited Philippines, Inc
Financial year ended Financial year ended 31 December 31 December
2016 2015 2016 2015
RM’000 RM’000 RM’000 RM’000
operating revenue 258,133 204,698 106,467 78,531
profit before taxation 5,639 3,771 10,371 7,657
taxation (2,471) (1,037) (2,350) (1,461)
profit for the financial year 3,168 2,734 8,021 6,196
other comprehensive loss for the financial year - - (3,363) (1,308)
total comprehensive income for the financial year 3,168 2,734 4,658 4,888
Dividends received from associates - - - -
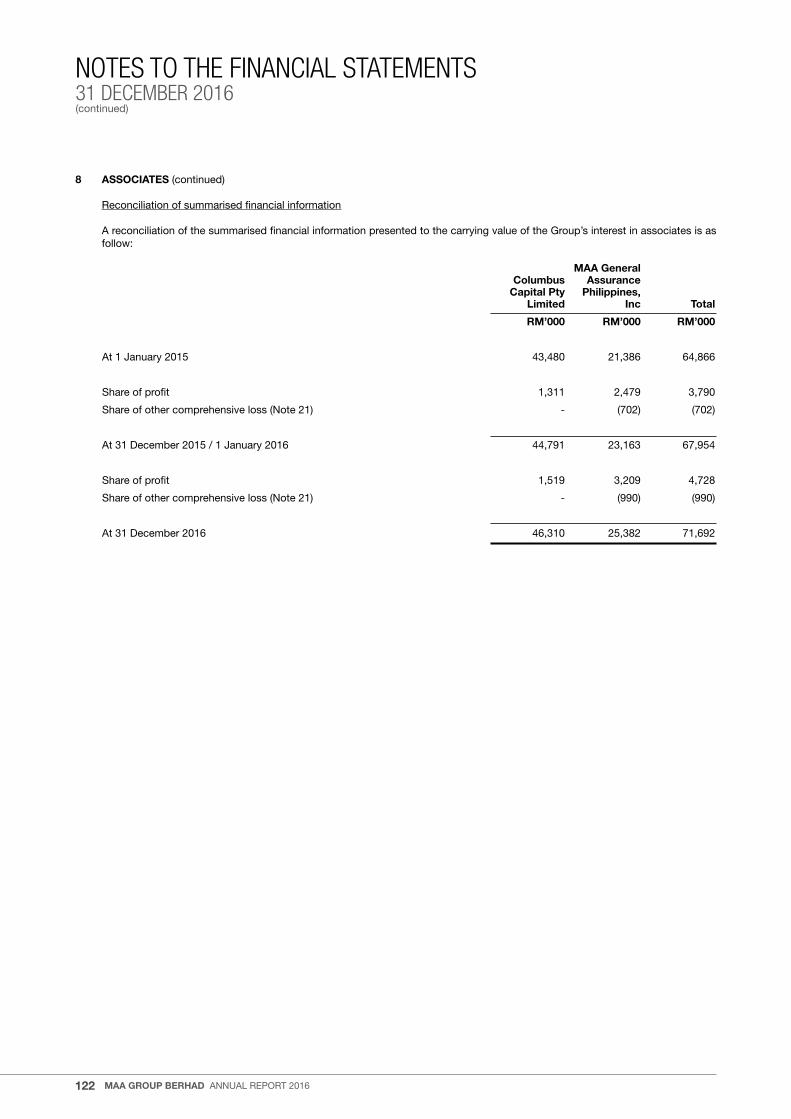
122
NOTES TO THE FINANCIAL STATEMENTS31 DECEMBER 2016(continued)
MAA GROUP BERHAD annual report 2016
8 ASSOCIATES (continued)
reconciliation of summarised financial information
a reconciliation of the summarised financial information presented to the carrying value of the Group’s interest in associates is as follow:
MAA General Columbus Assurance
Capital Pty Philippines, Limited Inc Total
RM’000 RM’000 RM’000
at 1 January 2015 43,480 21,386 64,866
Share of profit 1,311 2,479 3,790
Share of other comprehensive loss (note 21) - (702) (702)
at 31 December 2015 / 1 January 2016 44,791 23,163 67,954
Share of profit 1,519 3,209 4,728
Share of other comprehensive loss (note 21) - (990) (990)
at 31 December 2016 46,310 25,382 71,692

123
NOTES TO THE FINANCIAL STATEMENTS31 DECEMBER 2016
(continued)
annual report 2016 MAA GROUP BERHAD
9 DEFERRED TAX
Deferred tax assets and liabilities are offset when there is a legally enforceable right to set off current tax assets against current tax liabilities and when the deferred taxes relate to the same tax authority.
the following amounts, determined after appropriate offsetting, are shown in the statement of financial position:
GROUP 31.12.2016
General Family Shareholders’ takaful takaful fund fund fund Total
RM’000 RM’000 RM’000 RM’000
non-current
Deferred tax liabilities (185) - - (185)
at 1 January 2016 (900) 2,334 (389) 1,045
(Charged)/credited to profit or loss (note 31):
- property, plant and equipment (78) - - (78)
- financial assets at FVtpl (24) - 1,345 1,321
- allowance for impairment loss - (234) - (234)
(102) (234) 1,345 1,009
Charged to other comprehensive income:
- aFS financial assets (77) - - (77)
Charged to takaful contract liabilities:
- aFS financial assets - (80) (107) (187)
arising from disposal of a subsidiary (note 35(a)(ii)) 894 (2,020) (849) (1,975)
at 31 December 2016 (185) - - (185)
Subject to income tax:
Deferred tax liabilities (before and after offsetting)
property, plant and equipment (185) - - (185)
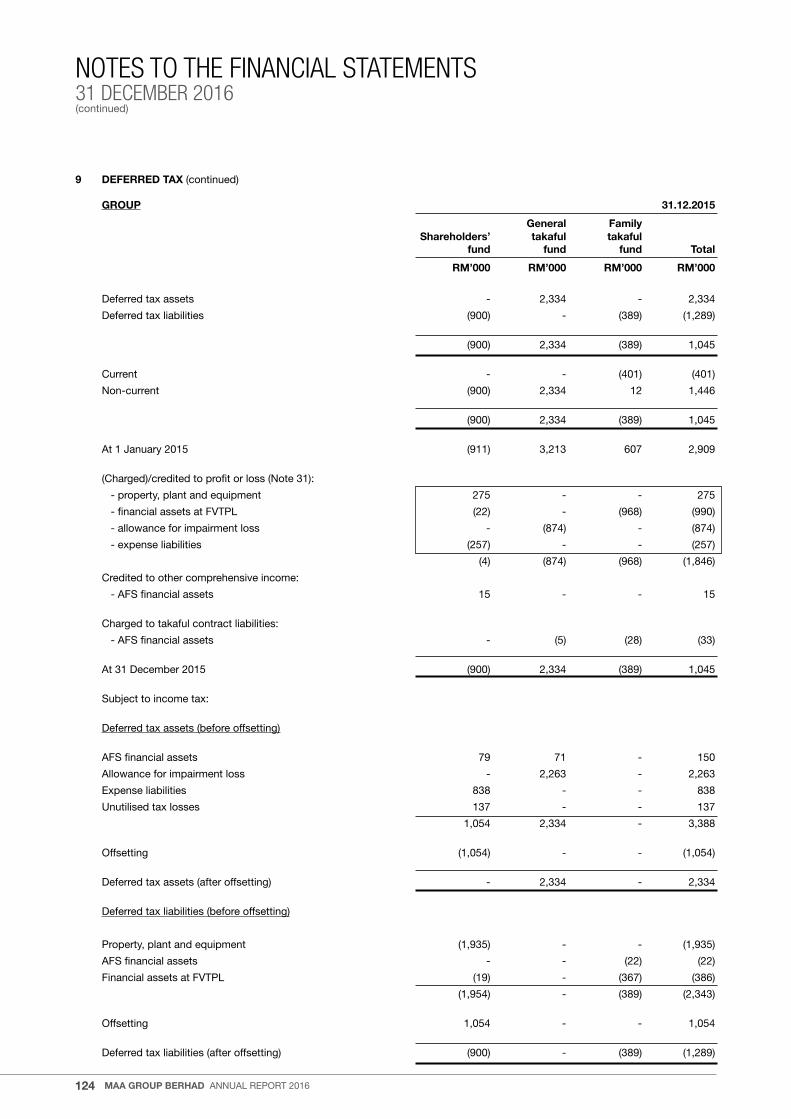
124
NOTES TO THE FINANCIAL STATEMENTS31 DECEMBER 2016(continued)
MAA GROUP BERHAD annual report 2016
9 DEFERRED TAX (continued)
GROUP 31.12.2015
General Family Shareholders’ takaful takaful fund fund fund Total
RM’000 RM’000 RM’000 RM’000
Deferred tax assets - 2,334 - 2,334
Deferred tax liabilities (900) - (389) (1,289)
(900) 2,334 (389) 1,045
Current - - (401) (401)
non-current (900) 2,334 12 1,446
(900) 2,334 (389) 1,045
at 1 January 2015 (911) 3,213 607 2,909
(Charged)/credited to profit or loss (note 31):
- property, plant and equipment 275 - - 275
- financial assets at FVtpl (22) - (968) (990)
- allowance for impairment loss - (874) - (874)
- expense liabilities (257) - - (257)
(4) (874) (968) (1,846)
Credited to other comprehensive income:
- aFS financial assets 15 - - 15
Charged to takaful contract liabilities:
- aFS financial assets - (5) (28) (33)
at 31 December 2015 (900) 2,334 (389) 1,045
Subject to income tax:
Deferred tax assets (before offsetting)
aFS financial assets 79 71 - 150
allowance for impairment loss - 2,263 - 2,263
expense liabilities 838 - - 838
unutilised tax losses 137 - - 137
1,054 2,334 - 3,388
offsetting (1,054) - - (1,054)
Deferred tax assets (after offsetting) - 2,334 - 2,334
Deferred tax liabilities (before offsetting)
property, plant and equipment (1,935) - - (1,935)
aFS financial assets - - (22) (22)
Financial assets at FVtpl (19) - (367) (386)
(1,954) - (389) (2,343)
offsetting 1,054 - - 1,054
Deferred tax liabilities (after offsetting) (900) - (389) (1,289)
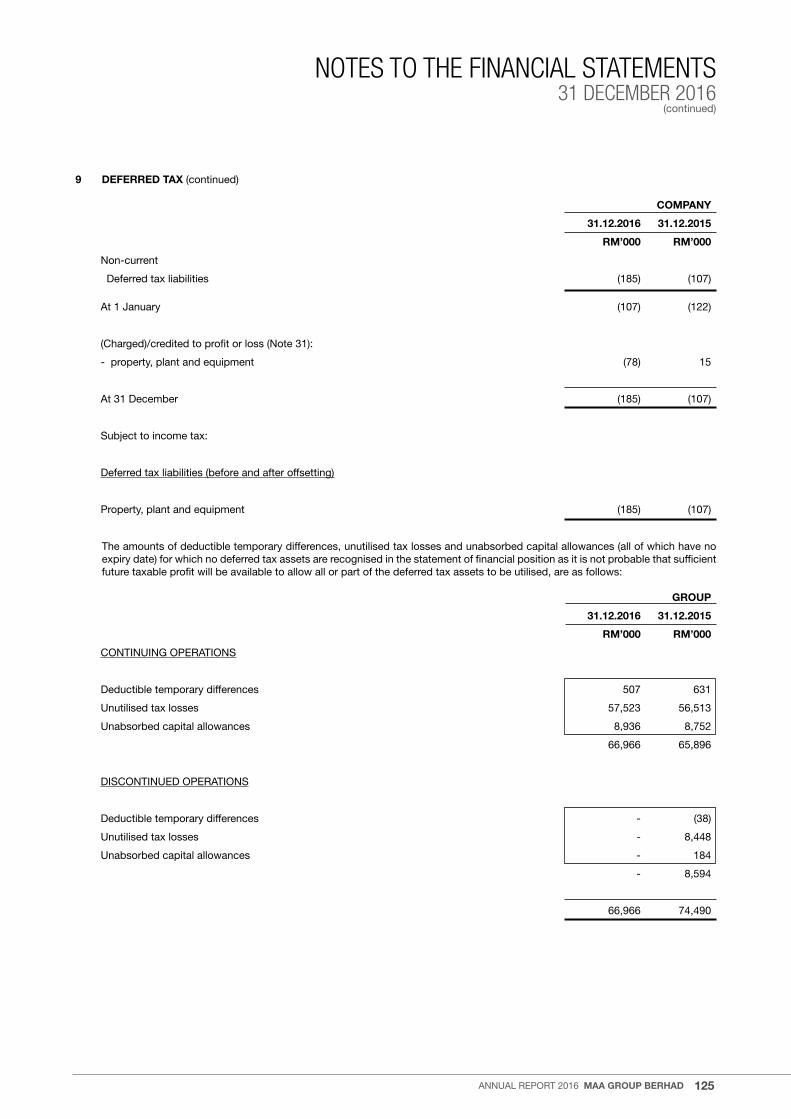
125
NOTES TO THE FINANCIAL STATEMENTS31 DECEMBER 2016
(continued)
annual report 2016 MAA GROUP BERHAD
9 DEFERRED TAX (continued)
COMPANY
31.12.2016 31.12.2015
RM’000 RM’000
non-current
Deferred tax liabilities (185) (107)
at 1 January (107) (122)
(Charged)/credited to profit or loss (note 31):
- property, plant and equipment (78) 15
at 31 December (185) (107)
Subject to income tax:
Deferred tax liabilities (before and after offsetting)
property, plant and equipment (185) (107)
the amounts of deductible temporary differences, unutilised tax losses and unabsorbed capital allowances (all of which have no expiry date) for which no deferred tax assets are recognised in the statement of financial position as it is not probable that sufficient future taxable profit will be available to allow all or part of the deferred tax assets to be utilised, are as follows:
GROUP
31.12.2016 31.12.2015
RM’000 RM’000
ContInuInG operatIonS
Deductible temporary differences 507 631
unutilised tax losses 57,523 56,513
unabsorbed capital allowances 8,936 8,752
66,966 65,896
DISContInueD operatIonS
Deductible temporary differences - (38)
unutilised tax losses - 8,448
unabsorbed capital allowances - 184
- 8,594
66,966 74,490

126
NOTES TO THE FINANCIAL STATEMENTS31 DECEMBER 2016(continued)
MAA GROUP BERHAD annual report 2016
10 INVESTMENTS
GROUP COMPANY
31.12.2016 31.12.2015 31.12.2016 31.12.2015
RM’000 RM’000 RM’000 RM’000
Malaysian Government Guaranteed Financing - 40,632 - -
Islamic debt securities - 168,738 - -
Syariah-approved equity securities - 80,396 - -
equity securities 36,779 29,972 5,084 -
Investment-linked units - 218,518 - -
unit trusts 2,086 1,941 - -
loans 7,159 6,957 7 4
Fixed and call deposits with licensed banks 133,381 40,228 133,381 19,127
179,405 587,382 138,472 19,131
the Group’s and the Company’s investments are summarised by categories as follows:
GROUP COMPANY
31.12.2016 31.12.2015 31.12.2016 31.12.2015
RM’000 RM’000 RM’000 RM’000
Financial assets at FVtpl 2,086 354,855 - -
aFS financial assets 36,779 144,710 5,084 -
HtM financial assets - 40,632 - -
loans and receivables (note 11) 140,540 47,185 133,388 19,131
179,405 587,382 138,472 19,131
the following investments mature after 12 months:
aFS financial assets - 114,738 - -
HtM financial assets - 40,632 - -
loans and receivables (note 11) 2 18 2 2
2 155,388 2 2

127
NOTES TO THE FINANCIAL STATEMENTS31 DECEMBER 2016
(continued)
annual report 2016 MAA GROUP BERHAD
10 INVESTMENTS (continued)
GROUP COMPANY
31.12.2016 31.12.2015 31.12.2016 31.12.2015
RM’000 RM’000 RM’000 RM’000
(a) Financial assets at FVtpl
Held-for-trading:
unit trusts quoted in Malaysia 2,023 1,873 - -
unit trusts quoted outside Malaysia 63 68 - -
Investment-linked units - 218,518 - -
2,086 220,459 - -
Designated at FVtpl:
Shariah-approved equity securities quoted in Malaysia - 80,396 - -
Islamic debt securities unquoted in Malaysia - 54,000 - -
- 134,396 - -
2,086 354,855 - -
(b) aFS financial assets
Fair value:
equity securities unquoted in Malaysia - 1,523 - -
equity securities quoted outside Malaysia 5,084 - 5,084 -
equity securities unquoted outside Malaysia 31,695 28,449 - -
Islamic debt securities unquoted in Malaysia - 114,738 - -
36,779 144,710 5,084 -
(c) HtM financial assets
amortised cost:
Malaysian Government Guaranteed Financing - 40,632 - -
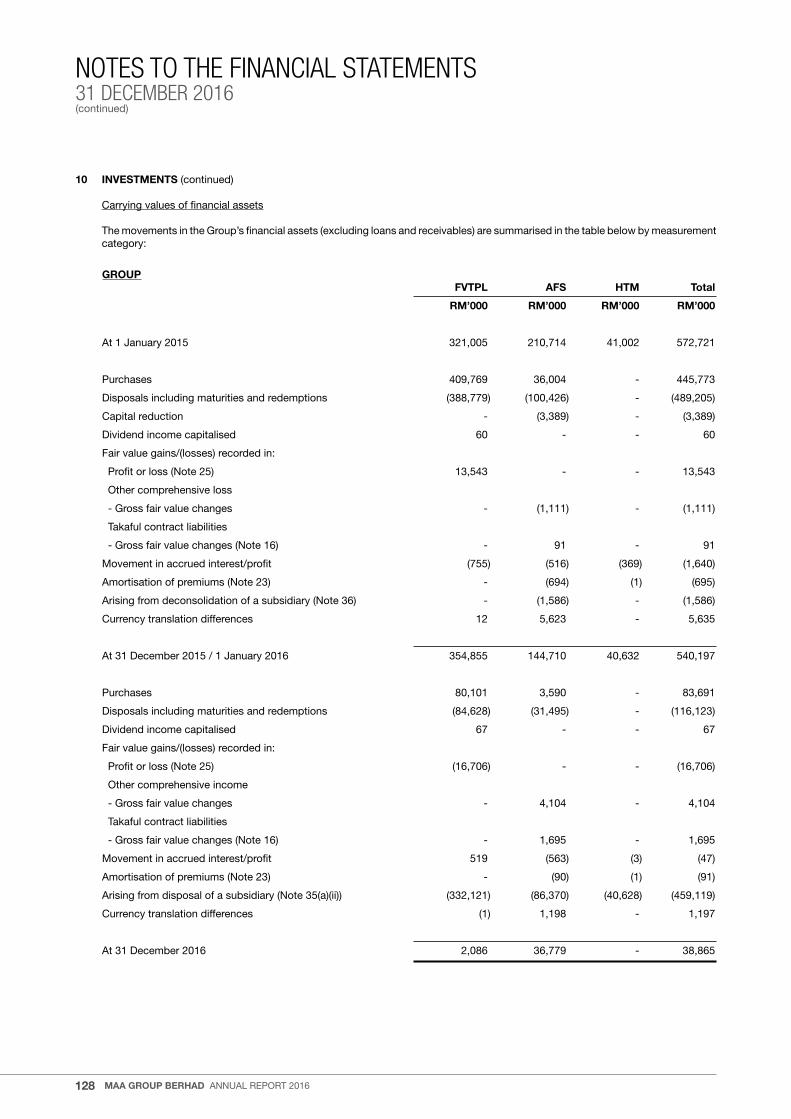
128
NOTES TO THE FINANCIAL STATEMENTS31 DECEMBER 2016(continued)
MAA GROUP BERHAD annual report 2016
10 INVESTMENTS (continued)
Carrying values of financial assets
the movements in the Group’s financial assets (excluding loans and receivables) are summarised in the table below by measurement category:
GROUP FVTPL AFS HTM Total
RM’000 RM’000 RM’000 RM’000
at 1 January 2015 321,005 210,714 41,002 572,721
purchases 409,769 36,004 - 445,773
Disposals including maturities and redemptions (388,779) (100,426) - (489,205)
Capital reduction - (3,389) - (3,389)
Dividend income capitalised 60 - - 60
Fair value gains/(losses) recorded in:
profit or loss (note 25) 13,543 - - 13,543
other comprehensive loss
- Gross fair value changes - (1,111) - (1,111)
takaful contract liabilities
- Gross fair value changes (note 16) - 91 - 91
Movement in accrued interest/profit (755) (516) (369) (1,640)
amortisation of premiums (note 23) - (694) (1) (695)
arising from deconsolidation of a subsidiary (note 36) - (1,586) - (1,586)
Currency translation differences 12 5,623 - 5,635
at 31 December 2015 / 1 January 2016 354,855 144,710 40,632 540,197
purchases 80,101 3,590 - 83,691
Disposals including maturities and redemptions (84,628) (31,495) - (116,123)
Dividend income capitalised 67 - - 67
Fair value gains/(losses) recorded in:
profit or loss (note 25) (16,706) - - (16,706)
other comprehensive income
- Gross fair value changes - 4,104 - 4,104
takaful contract liabilities
- Gross fair value changes (note 16) - 1,695 - 1,695
Movement in accrued interest/profit 519 (563) (3) (47)
amortisation of premiums (note 23) - (90) (1) (91)
arising from disposal of a subsidiary (note 35(a)(ii)) (332,121) (86,370) (40,628) (459,119)
Currency translation differences (1) 1,198 - 1,197
at 31 December 2016 2,086 36,779 - 38,865
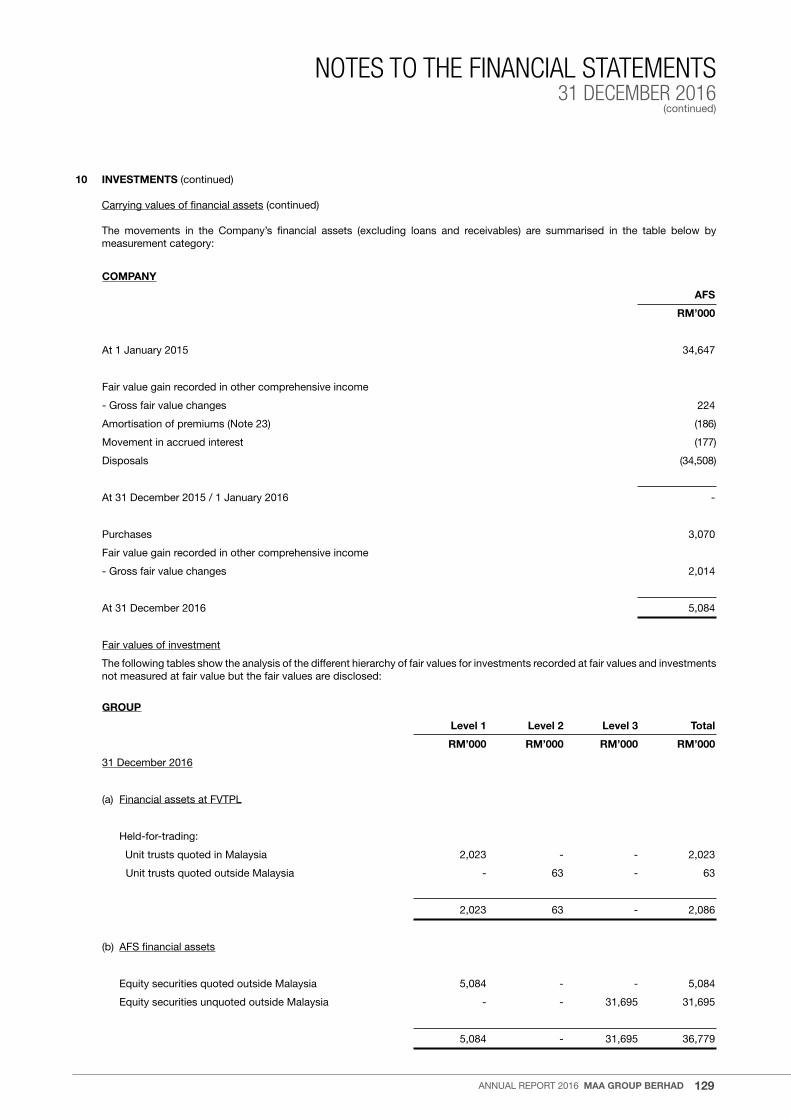
129
NOTES TO THE FINANCIAL STATEMENTS31 DECEMBER 2016
(continued)
annual report 2016 MAA GROUP BERHAD
10 INVESTMENTS (continued)
Carrying values of financial assets (continued)
the movements in the Company’s financial assets (excluding loans and receivables) are summarised in the table below by measurement category:
COMPANY
AFS
RM’000
at 1 January 2015 34,647
Fair value gain recorded in other comprehensive income
- Gross fair value changes 224
amortisation of premiums (note 23) (186)
Movement in accrued interest (177)
Disposals (34,508)
at 31 December 2015 / 1 January 2016 -
purchases 3,070
Fair value gain recorded in other comprehensive income
- Gross fair value changes 2,014
at 31 December 2016 5,084
Fair values of investment
the following tables show the analysis of the different hierarchy of fair values for investments recorded at fair values and investments not measured at fair value but the fair values are disclosed:
GROUP
Level 1 Level 2 Level 3 Total
RM’000 RM’000 RM’000 RM’000
31 December 2016
(a) Financial assets at FVtpl
Held-for-trading:
unit trusts quoted in Malaysia 2,023 - - 2,023
unit trusts quoted outside Malaysia - 63 - 63
2,023 63 - 2,086
(b) aFS financial assets
equity securities quoted outside Malaysia 5,084 - - 5,084
equity securities unquoted outside Malaysia - - 31,695 31,695
5,084 - 31,695 36,779
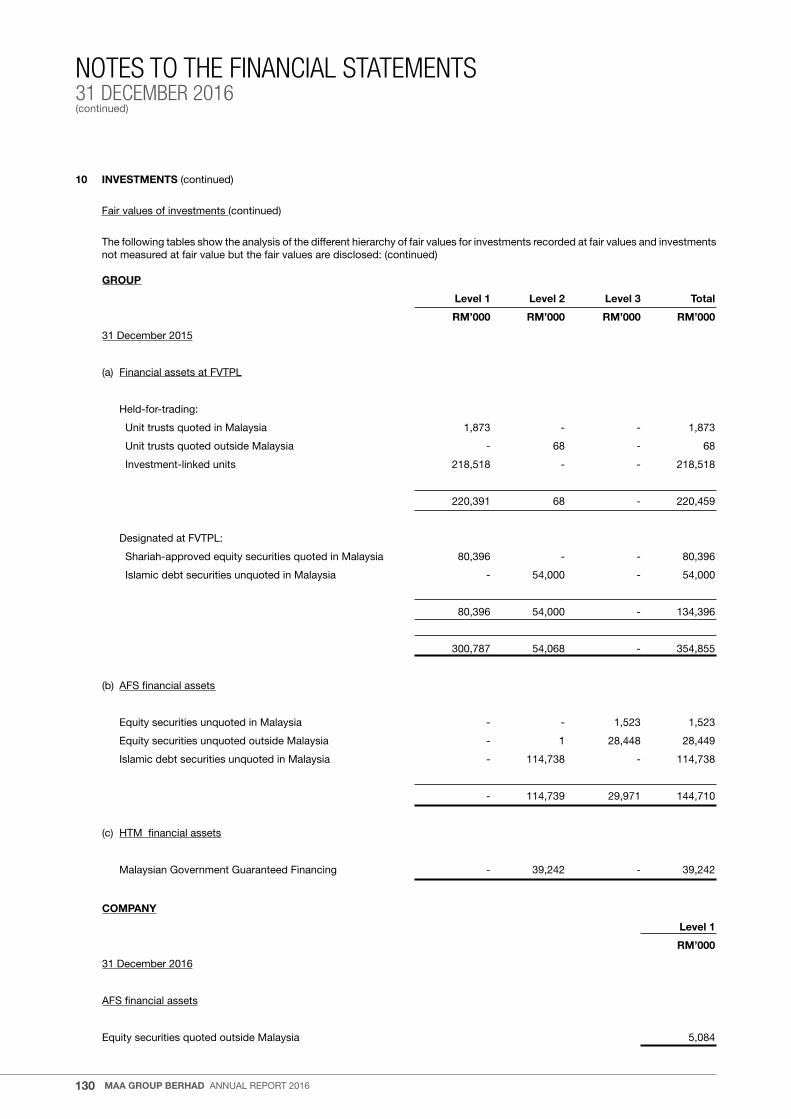
130
NOTES TO THE FINANCIAL STATEMENTS31 DECEMBER 2016(continued)
MAA GROUP BERHAD annual report 2016
10 INVESTMENTS (continued)
Fair values of investments (continued)
the following tables show the analysis of the different hierarchy of fair values for investments recorded at fair values and investments not measured at fair value but the fair values are disclosed: (continued)
GROUP
Level 1 Level 2 Level 3 Total
RM’000 RM’000 RM’000 RM’000
31 December 2015
(a) Financial assets at FVtpl
Held-for-trading:
unit trusts quoted in Malaysia 1,873 - - 1,873
unit trusts quoted outside Malaysia - 68 - 68
Investment-linked units 218,518 - - 218,518
220,391 68 - 220,459
Designated at FVtpl:
Shariah-approved equity securities quoted in Malaysia 80,396 - - 80,396
Islamic debt securities unquoted in Malaysia - 54,000 - 54,000
80,396 54,000 - 134,396
300,787 54,068 - 354,855
(b) aFS financial assets
equity securities unquoted in Malaysia - - 1,523 1,523
equity securities unquoted outside Malaysia - 1 28,448 28,449
Islamic debt securities unquoted in Malaysia - 114,738 - 114,738
- 114,739 29,971 144,710
(c) HtM financial assets
Malaysian Government Guaranteed Financing - 39,242 - 39,242
COMPANY
Level 1
RM’000
31 December 2016
aFS financial assets
equity securities quoted outside Malaysia 5,084

131
NOTES TO THE FINANCIAL STATEMENTS31 DECEMBER 2016
(continued)
annual report 2016 MAA GROUP BERHAD
10 INVESTMENTS (continued)
Fair values of investments (continued)
Valuation techniques – non-market observable inputs (level 3)
GROUP AFS
RM’000
at 1 January 2015 29,107
Capital reduction (3,389)
Fair value loss recorded in other comprehensive loss
- Gross fair value changes (1,227)
arising from deconsolidation of a subsidiary (20)
Currency translation difference 5,500
at 31 December 2015 / 1 January 2016 29,971
Disposal (1,523)
Fair value gain recorded in other comprehensive income
- Gross fair value changes 2,049
Currency translation difference 1,198
at 31 December 2016 31,695
the investments above are classified within level 3 investment for valuation techniques as non-market observable inputs are used. they comprised investments in equity securities of corporation, unquoted in and outside Malaysia. the valuation techniques use the net asset Value (“naV”) as a practical expedient to derive the fair values of the investments.
there was no transfer among level 1, 2, and 3 during the financial year ended 31 December 2016.
Valuation processes applied by the Group for level 3 fair value
the Group has an established control framework in respect to the measurement of fair values of financial instruments. this includes a finance team that has overall responsibility for overseeing all significant fair value measurements, including level 3 fair values, and reports directly to the executive Committee. the finance team regularly reviews significant unobservable inputs and valuation adjustments.
the significant unobservable input for the investment above is naV per share. the higher the naV per share, the higher the estimated fair value.
Sensitivities
Impact on
Change in variables Fair value Equity
% RM’000 RM’000
31 December 2016
net asset value +10% 3,170 2,377
-10% (3,170) (2,377)
31 December 2015
net asset value +10% 2,997 2,248
-10% (2,997) (2,248)
there is no impact to profit before taxation as this is an aFS investment.

132
NOTES TO THE FINANCIAL STATEMENTS31 DECEMBER 2016(continued)
MAA GROUP BERHAD annual report 2016
10 INVESTMENTS (continued)
Fair values of investments (continued)
Included in the quoted market price category are financial instruments that are measured in whole or in part by reference to published quotes in an active market. a financial instrument is regarded as quoted in an active market if quoted prices are readily and regularly available from an exchange, secondary market via dealer and broker, pricing service or regulatory agency and those prices represent actual and regular occurring market transactions on an arm’s length basis. these are considered as level 1 investments.
Financial instruments measured using a valuation technique based on assumptions that are supported by prices from observable current market transactions are instruments for which pricing is obtained via pricing services but where prices have not been determined in an active market, fair values based on broker quotes and discounted cash flow are considered as level 2 investments.
non-market observable inputs means that fair values are determined in whole or in part using a valuation technique based on assumptions that are neither supported by prices from observable current market transactions in the same instrument nor are they based on available market data. the main asset class in this category is unquoted equity securities. Valuation techniques are used to the extent that observable inputs are not available, thereby allowing for situations in which there is little, if any, market activity for the instrument at the measurement date. However, the fair value measurement objective remains the same, that is, there is an exit price from the perspective of the Group. therefore, unobservable inputs reflect the Group’s own assumptions about the assumptions that market participants would use in pricing the instrument (including assumptions about risk). these inputs are developed based on the best information available, which might include the Group’s own data. these are considered as level 3 investments.
11 LOANS AND RECEIVABLES
GROUP COMPANY
31.12.2016 31.12.2015 31.12.2016 31.12.2015
RM’000 RM’000 RM’000 RM’000
loans arising from:
Secured loans 7,152 6,740 - -
unsecured loans 7 189 7 4
7,159 6,929 7 4
loans from leasing, hire purchase and others 20,905 24,492 - -
less: allowance for impairment loss (20,905) (24,464) - -
- 28 - -
Fixed and call deposits with licensed banks 133,381 40,228 133,381 19,127
140,540 47,185 133,388 19,131

133
NOTES TO THE FINANCIAL STATEMENTS31 DECEMBER 2016
(continued)
annual report 2016 MAA GROUP BERHAD
11 LOANS AND RECEIVABLES (continued)
the maturity structure of the loans and receivables is as follows:
GROUP COMPANY
31.12.2016 31.12.2015 31.12.2016 31.12.2015
RM’000 RM’000 RM’000 RM’000
receivables within 12 months:
net loans 7,157 6,939 5 2
Fixed and call deposits with licensed banks 133,381 40,228 133,381 19,127
140,538 47,167 133,386 19,129
receivables after 12 months:
net loans 2 18 2 2
140,540 47,185 133,388 19,131
the carrying amounts disclosed above approximate the fair values at the date of the statement of financial position.
the secured loans bear interest at 3.00% (2015: 3.00%) per annum and are repayable on demand.
the weighted average effective interest rate of fixed and call deposits with licensed banks during the financial year was 4.46% (2015: 2.85% to 4.10%) per annum.
the total loans portfolio from leasing, hire purchase and others as at 31 December 2016 included non-performing loans (“npl”) amounting to rM20,905,000 (2015: rM24,464,000), where full allowance for impairment loss has been made. the borrowers of these npl have committed repayments on agreed fixed repayment schedules and certain npl are collateralised by properties and/or shares. the Group has assessed the values of the collaterals and/or committed cashflows stream based on the methods prescribed in note 2.14 to the financial statements and made allowance for impairment loss where appropriate.
the fair values of the collaterals of loans held by the Group as at the date of the statement of financial position was rM18,264,000
(2015: rM13,128,000).
a reconciliation of the allowance for impairment loss for loans from leasing, hire purchase and others is as follows:
GROUP
31.12.2016 31.12.2015
RM’000 RM’000
at 1 January 24,464 24,565
allowance for impairment loss - 1
Write back of impairment loss in respect of recoveries (6) (93)
allowance for impairment loss – net (note 28) (6) (92)
Bad debts written off (3,553) (9)
at 31 December 20,905 24,464

134
NOTES TO THE FINANCIAL STATEMENTS31 DECEMBER 2016(continued)
MAA GROUP BERHAD annual report 2016
12 TAKAFUL RECEIVABLES
GROUP
31.12.2016 31.12.2015
RM’000 RM’000
Due contributions including agents, brokers and co-takaful balances - 72,116
Due from retakaful operators and cedants - 17,618
- 89,734
less: allowance for impairment loss - (8,693)
- 81,041
receivable within 12 months - 81,041
offsetting financial assets and financial liabilities
Gross amounts of recognised financial assets - 100,876
less: Gross amounts of recognised financial liabilities set off in the statement of financial position (note 17) - (11,142)
net amounts of recognised financial assets presented in the statement of financial position - 89,734
there were no financial assets subject to enforceable netting arrangements or similar agreements, and financial instruments received as collaterals, nor any cash collaterals pledged or received as at 31 December 2016 (2015: nil).
the carrying amounts disclosed above approximate the fair values at the date of the statement of financial position.
a reconciliation of the allowance for impairment loss for takaful receivables is as follows:
GROUP
31.12.2016 31.12.2015
RM’000 RM’000
at 1 January 8,693 18,828
Write back of impairment loss (note 30) (827) (6,164)
Bad debts written off - (1,138)
arising from deconsolidation of a subsidiary - (2,833)
arising from disposal of a subsidiary (7,866) -
at 31 December - 8,693

135
NOTES TO THE FINANCIAL STATEMENTS31 DECEMBER 2016
(continued)
annual report 2016 MAA GROUP BERHAD
13 TRADE AND OTHER RECEIVABLES
GROUP COMPANY
31.12.2016 31.12.2015 31.12.2016 31.12.2015
RM’000 RM’000 RM’000 RM’000
trade receivables of non-insurance subsidiaries 22 30 - -
amounts due from subsidiaries
amounts due from subsidiaries at gross - - 64,219 51,214
less: allowance for impairment loss - - (32,636) (26,129)
- - 31,583 25,085
amounts due from associates 3,617 3,469 - -
proceeds from disposal of a subsidiary deposited in
escrow account - 20,590 - -
other receivables, deposits and prepayments
other receivables, deposits and prepayments, at gross 158,104 44,918 108,876 21,580
less: allowance for impairment loss (30,038) (28,669) (8,982) (7,282)
128,066 16,249 99,894 14,298
131,705 40,338 131,477 39,383
receivables within 12 months 43,755 40,338 43,527 39,383
receivables after 12 months 87,950 - 87,950 -
a reconciliation of the allowance for impairment loss on amounts due from subsidiaries is as follows:
GROUP COMPANY
31.12.2016 31.12.2015 31.12.2016 31.12.2015
RM’000 RM’000 RM’000 RM’000
at 1 January - - 26,129 26,591
allowance for/(write back of) impairment loss (note 28) - - 6,507 (462)
at 31 December - - 32,636 26,129
a reconciliation of the allowance for impairment loss on other receivables is as follows:
GROUP COMPANY
31.12.2016 31.12.2015 31.12.2016 31.12.2015
RM’000 RM’000 RM’000 RM’000
at 1 January 28,669 20,217 7,282 282
allowance for impairment loss (note 30) 1,434 8,452 1,700 7,000
arising from disposal of a subsidiary (65) - - -
at 31 December 30,038 28,669 8,982 7,282
the fair values of receivables after 12 months approximates the carrying values as at the date of the statement of financial position.

136
NOTES TO THE FINANCIAL STATEMENTS31 DECEMBER 2016(continued)
MAA GROUP BERHAD annual report 2016
13 TRADE AND OTHER RECEIVABLES (continued)
as at 31 December 2016, the net amounts due from subsidiaries consist of interest-bearing advances of rM31,583,000 (2015: rM25,085,000). the interest-bearing advances bear interest rates ranging from 3.60% to 7.0% (2015: 3.60% to 7.0%) per annum, unsecured and are repayable on demand.
the amounts due from associates of the Group are non-interest bearing advances, unsecured and repayable on demand.
as at 31 December 2015, the proceeds from disposal of a subsidiary deposited in escrow account of the Group comprised of the following:
(a) an amount of rM19,295,000 (“escrow amount”) being the balance sale proceed from the disposal of MaaKl Mutual Berhad to Manulife Holdings Berhad (“Manulife”). the escrow amount together with accrued interest, less any amount paid by the escrow agent in connection with any claims for a breach of any of the warranties or indemnities stated in the sale and purchase agreement to Manulife, shall be paid to the vendors on the date falling after 24 months from 31 December 2013, the sale completion date; and
(b) interest receivable of rM1,295,000 on the escrow amount. the escrow amount bore an interest rate at 3.30% per annum.
the Group has on 7 January 2016 received the escrow amount together with interest therein from Manulife.
Included in other receivables, deposits and prepayments of the Group and the Company were:
(a) a retained Consideration of rM93,750,000 from the disposal of Maa takaful receivable on the third anniversary of the sale completion date failing on 30 June 2018, and a charge for present value adjustment of rM5,800,000 to account for time value of money.
under the sale and purchase agreement, the retained Consideration will be used to settle Zurich Insurance Company ltd (“Zurich”)’s claims for breach of representations and warranties and also third party claims against Maa takaful during the warranty period. as at 31 December 2016, the Group has not been notified of any claim by Zurich.
(b) an amount of rM20,005,000 (2015: rM20,005,000) (“extended Sum”) extended by the Company to pIMa pembangunaan
Sdn Bhd (“pIMa”) relating to the Company’s obligations to obtain and deliver the individual strata title for Block a of prima avenue Klang (“paK”) to Zurich under the conditions precedent in the Settlement agreement signed with Zurich in 2011 on the disposal of Malaysian assurance alliance Berhad (now known as Zurich Insurance Malaysia Berhad).
the extended Sum is secured by identified unsold retail and office units in Block B, unsold car park parcels and site of
unbuilt Block C located at paK (“Securities”). the extended Sum is to be recovered via sales of the Securities by pIMa in phases within the set timeline in the Joint Venture agreement signed between the Company and pIMa (“the Sale plan”). In view that pIMa has failed to realise the Securities under the Sale plan to settle the extended Sum, the Company taking into consideration the existing soft property market has made a total impairment loss of rM8.7 million (2015: rM7.0 million) on the extended Sum based on the forced sale values of the Securities conducted by independent professional valuers.
(c) a Subscription sum of rM27,255,000 injected into Maa General assurance philippines, Inc. (“MaaGap”) to subscribe for additional 300 million new shares of peso 1,000 per share in MaaGap which is pending the approval from the regulatory authority in the philippines as at 31 December 2016, as disclosed in note 47(d) to the financial statements.
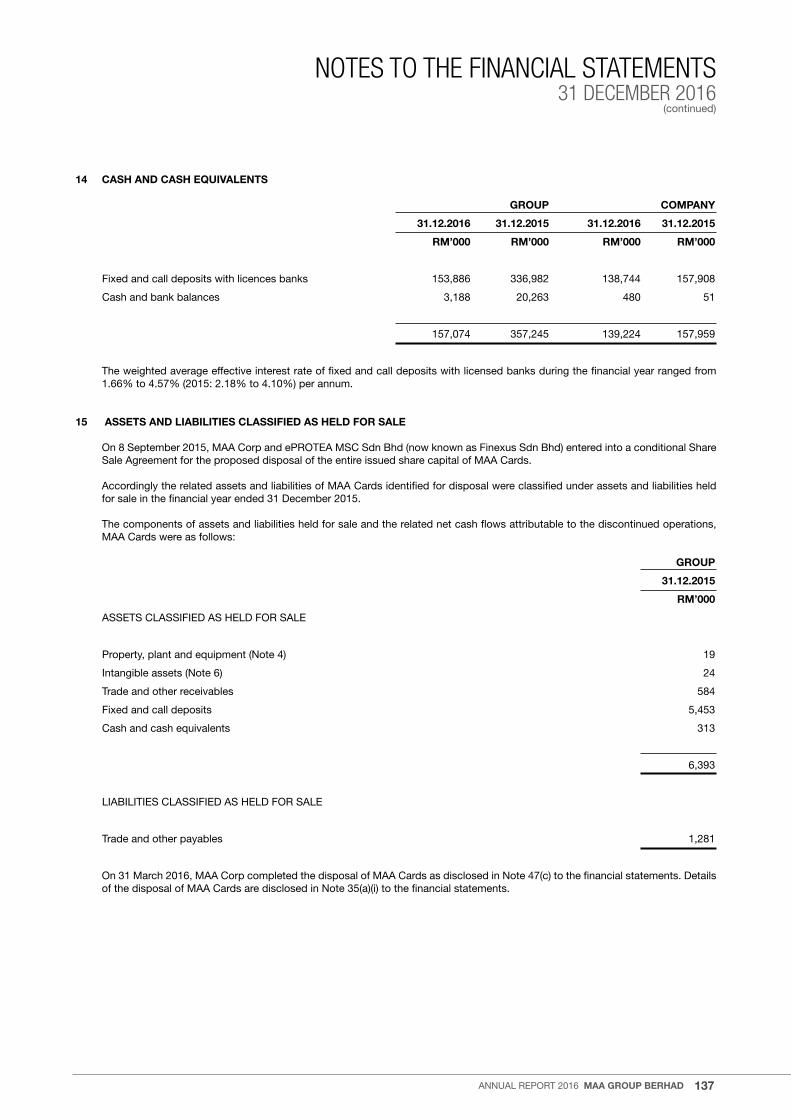
137
NOTES TO THE FINANCIAL STATEMENTS31 DECEMBER 2016
(continued)
annual report 2016 MAA GROUP BERHAD
14 CASH AND CASH EQUIVALENTS
GROUP COMPANY
31.12.2016 31.12.2015 31.12.2016 31.12.2015
RM’000 RM’000 RM’000 RM’000
Fixed and call deposits with licences banks 153,886 336,982 138,744 157,908
Cash and bank balances 3,188 20,263 480 51
157,074 357,245 139,224 157,959
the weighted average effective interest rate of fixed and call deposits with licensed banks during the financial year ranged from 1.66% to 4.57% (2015: 2.18% to 4.10%) per annum.
15 ASSETS AND LIABILITIES CLASSIFIED AS HELD FOR SALE
on 8 September 2015, Maa Corp and eprotea MSC Sdn Bhd (now known as Finexus Sdn Bhd) entered into a conditional Share Sale agreement for the proposed disposal of the entire issued share capital of Maa Cards.
accordingly the related assets and liabilities of Maa Cards identified for disposal were classified under assets and liabilities held for sale in the financial year ended 31 December 2015.
the components of assets and liabilities held for sale and the related net cash flows attributable to the discontinued operations, Maa Cards were as follows:
GROUP
31.12.2015
RM’000
aSSetS ClaSSIFIeD aS HelD For Sale
property, plant and equipment (note 4) 19
Intangible assets (note 6) 24
trade and other receivables 584
Fixed and call deposits 5,453
Cash and cash equivalents 313
6,393
lIaBIlItIeS ClaSSIFIeD aS HelD For Sale
trade and other payables 1,281
on 31 March 2016, Maa Corp completed the disposal of Maa Cards as disclosed in note 47(c) to the financial statements. Details of the disposal of Maa Cards are disclosed in note 35(a)(i) to the financial statements.
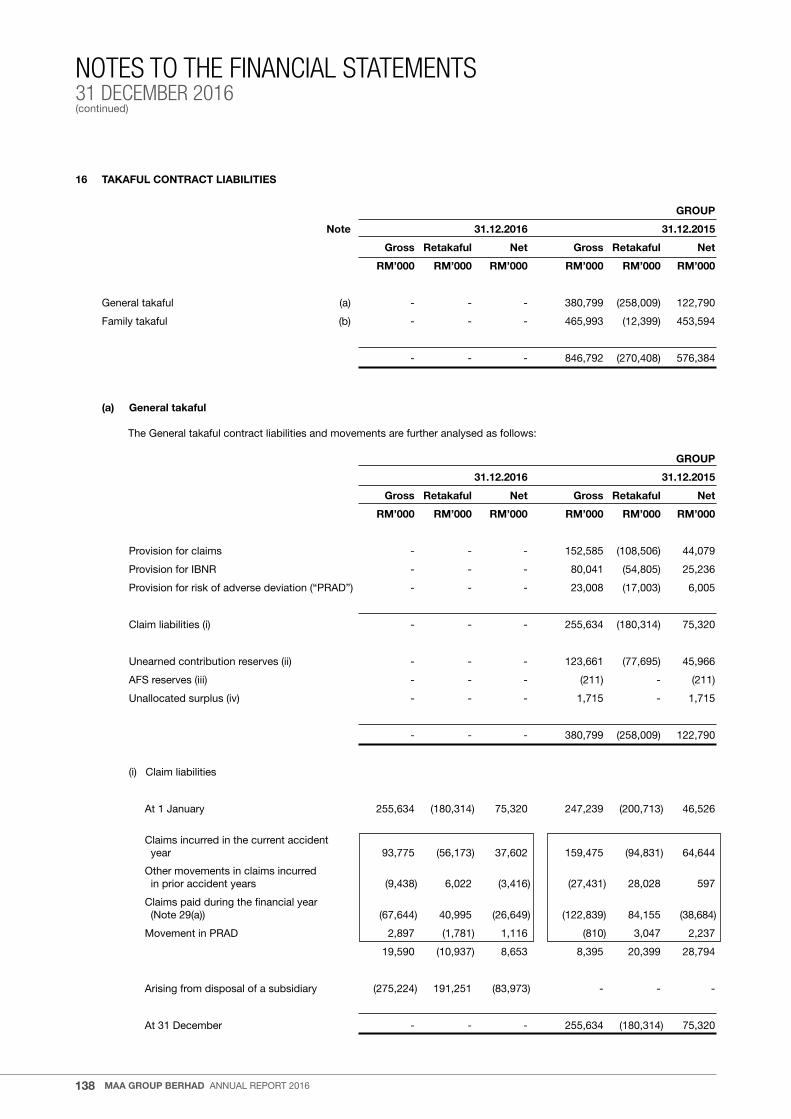
138
NOTES TO THE FINANCIAL STATEMENTS31 DECEMBER 2016(continued)
MAA GROUP BERHAD annual report 2016
16 TAKAFUL CONTRACT LIABILITIES
GROUP
Note 31.12.2016 31.12.2015
Gross Retakaful Net Gross Retakaful Net
RM’000 RM’000 RM’000 RM’000 RM’000 RM’000
General takaful (a) - - - 380,799 (258,009) 122,790
Family takaful (b) - - - 465,993 (12,399) 453,594
- - - 846,792 (270,408) 576,384
(a) General takaful
the General takaful contract liabilities and movements are further analysed as follows:
GROUP
31.12.2016 31.12.2015
Gross Retakaful Net Gross Retakaful Net
RM’000 RM’000 RM’000 RM’000 RM’000 RM’000
provision for claims - - - 152,585 (108,506) 44,079
provision for IBnr - - - 80,041 (54,805) 25,236
provision for risk of adverse deviation (“praD”) - - - 23,008 (17,003) 6,005
Claim liabilities (i) - - - 255,634 (180,314) 75,320
unearned contribution reserves (ii) - - - 123,661 (77,695) 45,966
aFS reserves (iii) - - - (211) - (211)
unallocated surplus (iv) - - - 1,715 - 1,715
- - - 380,799 (258,009) 122,790
(i) Claim liabilities
at 1 January 255,634 (180,314) 75,320 247,239 (200,713) 46,526
Claims incurred in the current accident year 93,775 (56,173) 37,602 159,475 (94,831) 64,644
other movements in claims incurred in prior accident years (9,438) 6,022 (3,416) (27,431) 28,028 597
Claims paid during the financial year (note 29(a)) (67,644) 40,995 (26,649) (122,839) 84,155 (38,684)
Movement in praD 2,897 (1,781) 1,116 (810) 3,047 2,237
19,590 (10,937) 8,653 8,395 20,399 28,794
arising from disposal of a subsidiary (275,224) 191,251 (83,973) - - -
at 31 December - - - 255,634 (180,314) 75,320

139
NOTES TO THE FINANCIAL STATEMENTS31 DECEMBER 2016
(continued)
annual report 2016 MAA GROUP BERHAD
16 TAKAFUL CONTRACT LIABILITIES (continued)
(a) General takaful (continued)
the General takaful contract liabilities and movements are further analysed as follows: (continued)
GROUP
31.12.2016 31.12.2015
Gross Retakaful Net Gross Retakaful Net
RM’000 RM’000 RM’000 RM’000 RM’000 RM’000
(ii) unearned contribution reserves
at 1 January 123,661 (77,695) 45,966 119,279 (79,669) 39,610
Contributions written during the financial year (note 22(a)) 145,527 (91,642) 53,885 281,998 (177,968) 104,030
Contributions earned during the financial year (note 22(a)) (145,031) 92,828 (52,203) (277,616) 179,942 (97,674)
496 1,186 1,682 4,382 1,974 6,356
arising from disposal of a subsidiary (124,157) 76,509 (47,648) - - -
at 31 December - - - 123,661 (77,695) 45,966
(iii) aFS reserves
GROUP
Deferred Gross tax Net
RM’000 RM’000 RM’000
at 1 January 2015 (303) 76 (227)
Fair value changes arising from aFS financial assets (167) 43 (124)
transferred to profit or loss upon disposal of aFS financial assets 188 (48) 140
21 (5) 16
at 31 December 2015 / 1 January 2016 (282) 71 (211)
Fair value changes arising from aFS financial assets 362 (90) 272
transferred to profit or loss upon disposal of aFS financial assets (43) 10 (33)
319 (80) 239
arising from disposal of a subsidiary (37) 9 (28)
at 31 December 2016 - - -

140
NOTES TO THE FINANCIAL STATEMENTS31 DECEMBER 2016(continued)
MAA GROUP BERHAD annual report 2016
16 TAKAFUL CONTRACT LIABILITIES (continued)
(a) General takaful (continued)
the General takaful contract liabilities and movements are further analysed as follows: (continued)
(iv) unallocated surplus GROUP
Gross Retakaful Net
RM’000 RM’000 RM’000
at 1 January 2015 - - -
Surplus generated during the financial year 1,715 - 1,715
at 31 December 2015 / 1 January 2016 1,715 - 1,715
Surplus generated during the financial period 1,439 - 1,439
arising from disposal of a subsidiary (3,154) - (3,154)
at 31 December 2016 - - -
b) Family takaful
the Family takaful contract liabilities and movements are further analysed as follows:
GROUP
31.12.2016 31.12.2015
Gross Retakaful Net Gross Retakaful Net
RM’000 RM’000 RM’000 RM’000 RM’000 RM’000
Certificateholders’ liabilities - - - 86,907 - 86,907
net assets values attributable to unitholders - - - 366,096 (10,778) 355,318
actuarial liabilities - - - 453,003 (10,778) 442,225
unallocated surplus attributable to unitholders - - - 449 - 449
accumulated deficits of non-investment-linked units - - - (16,043) - (16,043)
Qardhul Hassan - - - 16,043 - 16,043
Claim liabilities - - - 12,285 (1,621) 10,664
aFS reserves - - - 256 - 256
- - - 465,993 (12,399) 453,594

141
NOTES TO THE FINANCIAL STATEMENTS31 DECEMBER 2016
(continued)
annual report 2016 MAA GROUP BERHAD
16 TAKAFUL CONTRACT LIABILITIES (continued)
b) Family takaful (continued)
the Family takaful contract liabilities and movements are further analysed as follows: (continued)
GROUP
31.12.2016 31.12.2015
Gross Retakaful Net Gross Retakaful Net
RM’000 RM’000 RM’000 RM’000 RM’000 RM’000
at 1 January 465,993 (12,399) 453,594 445,980 (14,535) 431,445
Contributions received (note 22(b)) 124,399 (7,337) 117,062 250,736 (14,053) 236,683
liabilities paid for death, maturities, surrenders, benefits and claims (note 29(b)) (74,112) 5,865 (68,247) (161,027) 11,307 (149,720)
Movement in claim liabilities (330) 110 (220) 2,353 (1,211) 1,142
experience variance on in force takaful certificates 1,169 1,083 2,252 6,920 (2,576) 4,344
reserves for new policies (5,046) 1,088 (3,958) (9,737) 1,650 (8,087)
Miscellaneous (3,790) (3,090) (6,880) 12,133 7,019 19,152
Fees deducted (41,533) - (41,533) (75,132) - (75,132)
Surplus distributed to Shareholders’ fund (5,740) - (5,740) (11,250) - (11,250)
Qardhul Hassan (4,567) - (4,567) 4,695 - 4,695
Movement in aFS fair value adjustments - Gross fair value changes 1,333 - 1,333 258 - 258
- transferred to profit or loss upon disposal of aFS financial assets - - - 92 - 92
- Deferred tax (107) - (107) (28) - (28)
1,226 - 1,226 322 - 322
arising from disposal of a subsidiary (457,669) 14,680 (442,989) - - -
at 31 December - - - 465,993 (12,399) 453,594
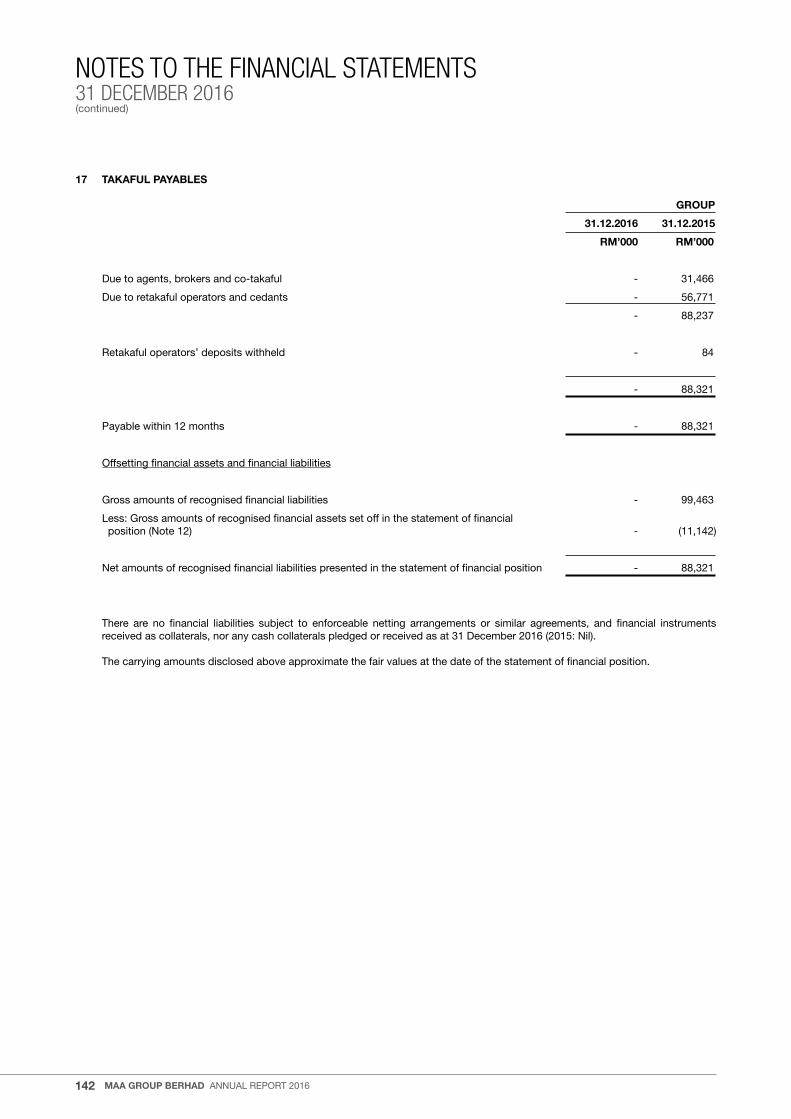
142
NOTES TO THE FINANCIAL STATEMENTS31 DECEMBER 2016(continued)
MAA GROUP BERHAD annual report 2016
17 TAKAFUL PAYABLES
GROUP
31.12.2016 31.12.2015
RM’000 RM’000
Due to agents, brokers and co-takaful - 31,466
Due to retakaful operators and cedants - 56,771
- 88,237
retakaful operators’ deposits withheld - 84
- 88,321
payable within 12 months - 88,321
offsetting financial assets and financial liabilities
Gross amounts of recognised financial liabilities - 99,463
less: Gross amounts of recognised financial assets set off in the statement of financial position (note 12) - (11,142)
net amounts of recognised financial liabilities presented in the statement of financial position - 88,321
there are no financial liabilities subject to enforceable netting arrangements or similar agreements, and financial instruments received as collaterals, nor any cash collaterals pledged or received as at 31 December 2016 (2015: nil).
the carrying amounts disclosed above approximate the fair values at the date of the statement of financial position.

143
NOTES TO THE FINANCIAL STATEMENTS31 DECEMBER 2016
(continued)
annual report 2016 MAA GROUP BERHAD
18 TRADE AND OTHER PAYABLES
GROUP COMPANY
31.12.2016 31.12.2015 31.12.2016 31.12.2015
RM’000 RM’000 RM’000 RM’000
Defined contribution retirement plan payable 137 83 51 54
accrual for unutilised staff leave 227 208 190 179
Commissions payable - 8,697 - -
provision for staff costs 1,831 1,955 1,330 790
Deposits contribution - 7,410 - -
Cash collaterals - 6,530 - -
expenses liabilities - 3,493 - -
proceeds from disposal of subsidiary deposited in escrow accounts payable to previous shareholders - 9,266 - -
provision for liquidation fees and expenses of a deconsolidated subsidiary(*) 5,118 5,656 - -
other payables and accruals 4,803 27,781 3,044 1,532
12,116 71,079 4,615 2,555
payable within 12 months 9,612 67,164 3,578 2,555
payable after 12 months 2,504 3,915 1,037 -
the carrying amounts disclosed above approximate the fair values as at the date of the statement of financial position.
(*) During the previous financial year ended 31 December 2015, the Group made a provision of rM5.66 million for the liquidation fees and expenses related to an ex-subsidiary, pt MaaG which was deconsolidated on 1 December 2015. the said provision was based on the appointed liquidators’ schedule of fees and expenses and estimation of three (3) years to complete the liquidation of pt MaaG.
19 SHARE CAPITAL
GROUP/COMPANY
31.12.2016 31.12.2015
RM’000 RM’000
authorised ordinary shares of rM1 each:
at beginning and end of financial year 500,000 500,000
Issued and fully paid ordinary shares of rM1 each:
at beginning of financial year 292,693 304,354
Cancellation of treasury shares (note 20) (19,175) (11,661)
at end of financial year 273,518 292,693

144
NOTES TO THE FINANCIAL STATEMENTS31 DECEMBER 2016(continued)
MAA GROUP BERHAD annual report 2016
20 TREASURY SHARES
the shareholders of the Company by an ordinary resolution passed at the annual General Meeting on 20 June 2016 approved the Company’s plan to purchase its own shares. the Directors of the Company are committed to enhance the value of the Company to its shareholders and believe that the share buy-back plan can be applied in the best interest of the Company and its shareholders.
During the financial year ended 31 December 2016, the Company purchased a total 18,665,700 (2015: 10,145,100) ordinary shares of rM1 each of its issued share capital from the open market at an average price of rM0.94 (2015: rM0.71) per share. the total purchase consideration paid for the share buy-back including transaction costs amounted to rM17,617,118 (2015: rM7,178,435) and were financed by internally generated funds. the shares purchased are held as treasury shares in accordance with Section 67a of the Companies act, 1965 and carried at purchase cost.
on 1 December 2016, the Company cancelled the whole 19,174,500 treasury shares in accordance with Section 67a of the Companies act, 1965. accordingly, the Company’s issued share capital was diminished by cancellation of the said treasury shares.
as at 31 December 2016, there were no treasury shares held by the Company (2015: 508,800 shares).
Movement in the share buy-back
Total Average Number of purchase price per shares costs Purchase price per share share
Lowest Highest ’000 RM’000 RM RM RM
at 1 January 2015 2,025 1,312 0.65
January 1,622 1,084 0.66 0.67 0.67
February 696 474 0.68 0.68 0.68
July 300 218 0.73 0.73 0.73
august 6,568 4,627 0.70 0.71 0.70
September 312 228 0.72 0.72 0.73
october 138 103 0.75 0.75 0.75
December 509 444 0.87 0.88 0.87
total purchased in 2015 10,145 7,178 0.71
Cancellation of treasury shares (11,661) (8,046)
at 31 December 2015 / 1 January 2016 509 444 0.87
January 491 313 0.88 0.90 0.64
February 1,269 1,325 0.90 0.95 1.04
March 419 396 0.94 0.94 0.95
april 2,117 2,052 0.95 0.99 0.97
July 5,435 5,031 0.81 0.99 0.93
august 2,812 2,625 0.88 0.95 0.93
September 5,523 5,303 0.93 0.99 0.96
october 600 572 0.95 0.95 0.95
total purchased in 2016 18,666 17,617 0.94
Cancellation of treasury shares (19,175) (18,061)
at 31 December 2016 - - -
as at 31 December 2016, the number of shares in issue after setting off treasury shares against equity was 273,518,000 (2015: 292,184,000).
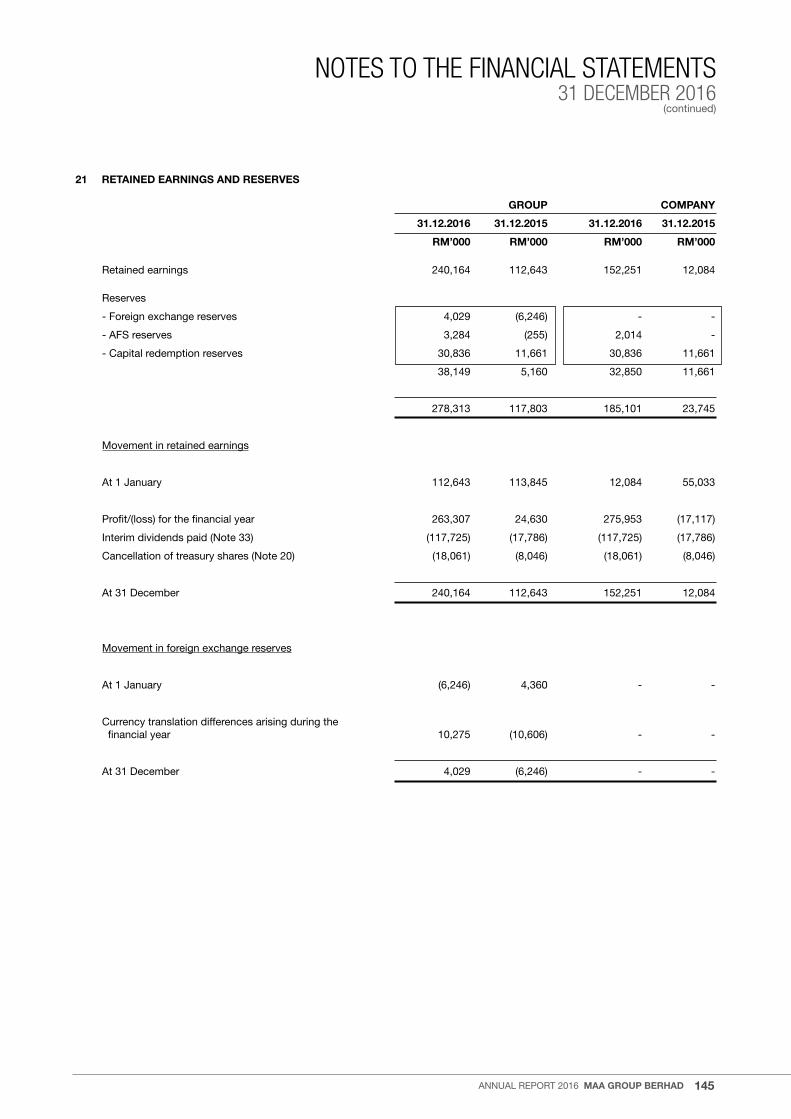
145
NOTES TO THE FINANCIAL STATEMENTS31 DECEMBER 2016
(continued)
annual report 2016 MAA GROUP BERHAD
21 RETAINED EARNINGS AND RESERVES
GROUP COMPANY
31.12.2016 31.12.2015 31.12.2016 31.12.2015
RM’000 RM’000 RM’000 RM’000
retained earnings 240,164 112,643 152,251 12,084
reserves
- Foreign exchange reserves 4,029 (6,246) - -
- aFS reserves 3,284 (255) 2,014 -
- Capital redemption reserves 30,836 11,661 30,836 11,661
38,149 5,160 32,850 11,661
278,313 117,803 185,101 23,745
Movement in retained earnings
at 1 January 112,643 113,845 12,084 55,033
profit/(loss) for the financial year 263,307 24,630 275,953 (17,117)
Interim dividends paid (note 33) (117,725) (17,786) (117,725) (17,786)
Cancellation of treasury shares (note 20) (18,061) (8,046) (18,061) (8,046)
at 31 December 240,164 112,643 152,251 12,084
Movement in foreign exchange reserves
at 1 January (6,246) 4,360 - -
Currency translation differences arising during the financial year 10,275 (10,606) - -
at 31 December 4,029 (6,246) - -
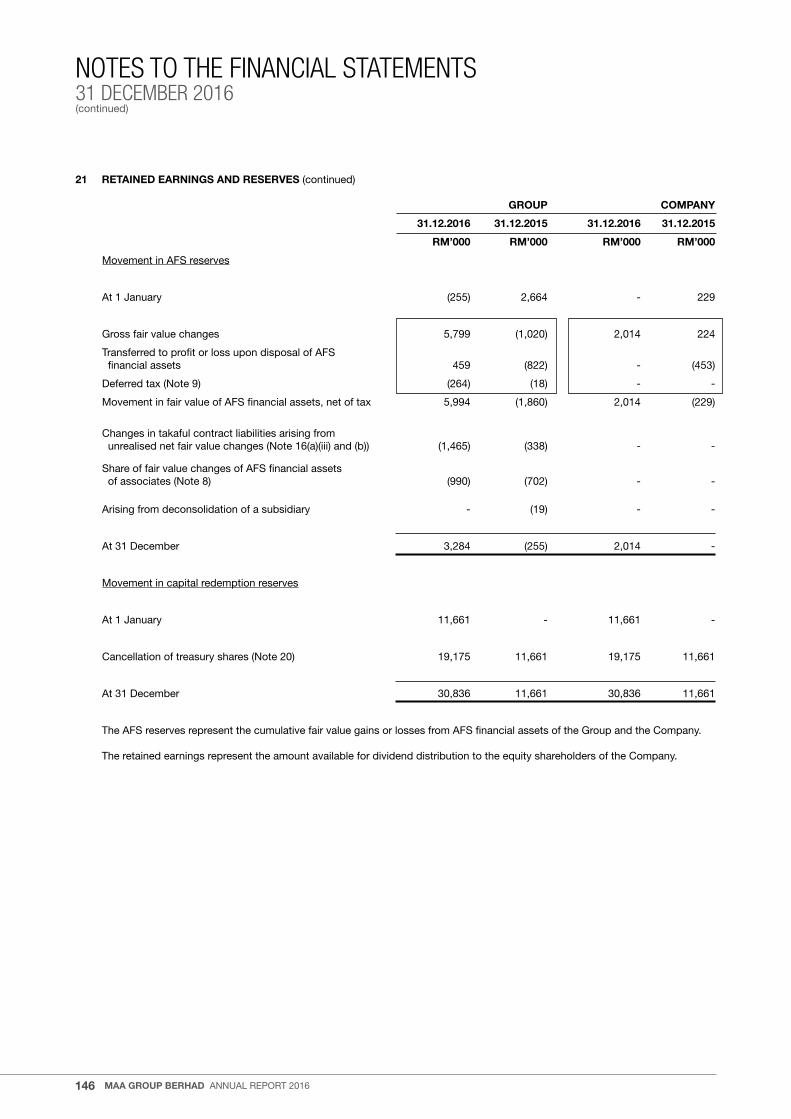
146
NOTES TO THE FINANCIAL STATEMENTS31 DECEMBER 2016(continued)
MAA GROUP BERHAD annual report 2016
21 RETAINED EARNINGS AND RESERVES (continued)
GROUP COMPANY
31.12.2016 31.12.2015 31.12.2016 31.12.2015
RM’000 RM’000 RM’000 RM’000
Movement in aFS reserves
at 1 January (255) 2,664 - 229
Gross fair value changes 5,799 (1,020) 2,014 224
transferred to profit or loss upon disposal of aFS financial assets 459 (822) - (453)
Deferred tax (note 9) (264) (18) - -
Movement in fair value of aFS financial assets, net of tax 5,994 (1,860) 2,014 (229)
Changes in takaful contract liabilities arising from unrealised net fair value changes (note 16(a)(iii) and (b)) (1,465) (338) - -
Share of fair value changes of aFS financial assets of associates (note 8) (990) (702) - -
arising from deconsolidation of a subsidiary - (19) - -
at 31 December 3,284 (255) 2,014 -
Movement in capital redemption reserves
at 1 January 11,661 - 11,661 -
Cancellation of treasury shares (note 20) 19,175 11,661 19,175 11,661
at 31 December 30,836 11,661 30,836 11,661
the aFS reserves represent the cumulative fair value gains or losses from aFS financial assets of the Group and the Company.
the retained earnings represent the amount available for dividend distribution to the equity shareholders of the Company.
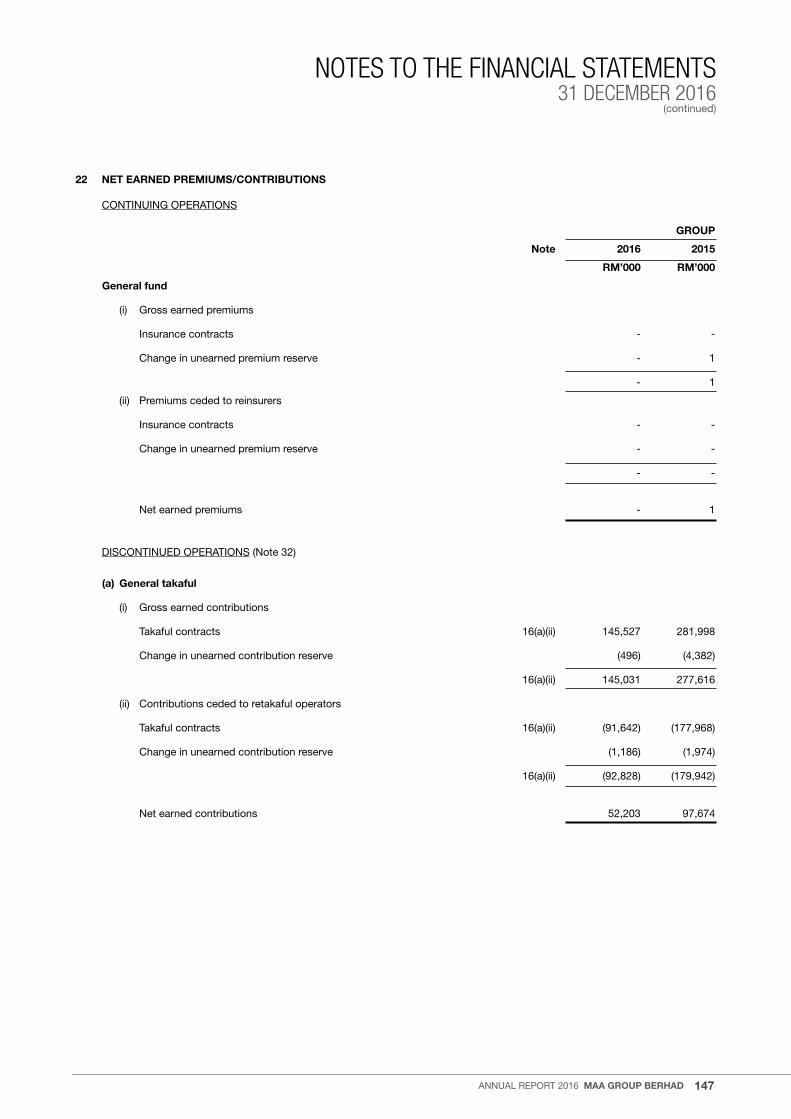
147
NOTES TO THE FINANCIAL STATEMENTS31 DECEMBER 2016
(continued)
annual report 2016 MAA GROUP BERHAD
22 NET EARNED PREMIUMS/CONTRIBUTIONS
ContInuInG operatIonS
GROUP
Note 2016 2015
RM’000 RM’000
General fund
(i) Gross earned premiums
Insurance contracts - -
Change in unearned premium reserve - 1
- 1
(ii) premiums ceded to reinsurers
Insurance contracts - -
Change in unearned premium reserve - -
- -
net earned premiums - 1
DISContInueD operatIonS (note 32)
(a) General takaful
(i) Gross earned contributions
takaful contracts 16(a)(ii) 145,527 281,998
Change in unearned contribution reserve (496) (4,382)
16(a)(ii) 145,031 277,616
(ii) Contributions ceded to retakaful operators
takaful contracts 16(a)(ii) (91,642) (177,968)
Change in unearned contribution reserve (1,186) (1,974)
16(a)(ii) (92,828) (179,942)
net earned contributions 52,203 97,674

148
NOTES TO THE FINANCIAL STATEMENTS31 DECEMBER 2016(continued)
MAA GROUP BERHAD annual report 2016
22 NET EARNED PREMIUMS/CONTRIBUTIONS (continued)
DISContInueD operatIonS (note 32) (continued)
GROUP
Note 2016 2015
RM’000 RM’000
(b) Family takaful
(i) Gross earned contributions
takaful contracts 16(b) 124,399 250,736
(ii) Contributions ceded to retakaful operators
takaful contracts 16(b) (7,337) (14,053)
net earned contributions 117,062 236,683
(c) Total
(i) Gross earned contributions
takaful contracts 269,926 532,734
Change in unearned contribution reserve (496) (4,382)
269,430 528,352
(ii) Contributions ceded to retakaful operators
takaful contracts (98,979) (192,021)
Change in unearned contribution reserve (1,186) (1,974)
(100,165) (193,995)
net earned contributions 169,265 334,357
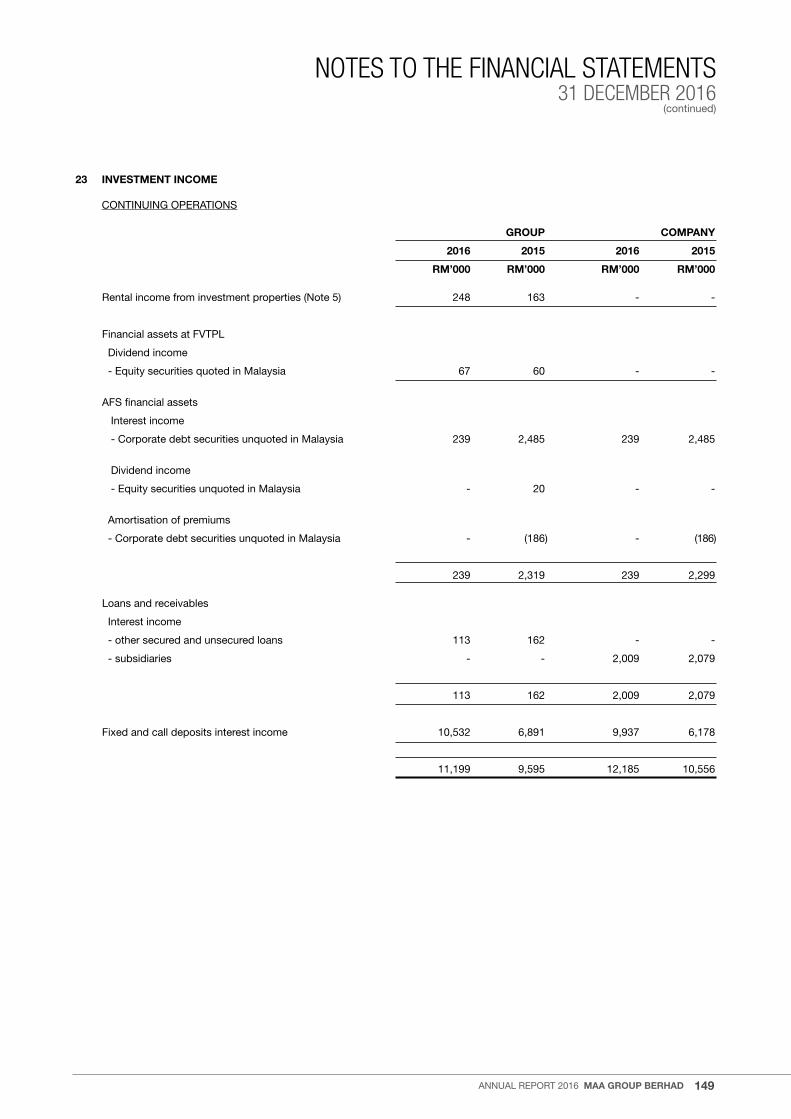
149
NOTES TO THE FINANCIAL STATEMENTS31 DECEMBER 2016
(continued)
annual report 2016 MAA GROUP BERHAD
23 INVESTMENT INCOME
ContInuInG operatIonS
GROUP COMPANY
2016 2015 2016 2015
RM’000 RM’000 RM’000 RM’000
rental income from investment properties (note 5) 248 163 - -
Financial assets at FVtpl
Dividend income
- equity securities quoted in Malaysia 67 60 - -
aFS financial assets
Interest income
- Corporate debt securities unquoted in Malaysia 239 2,485 239 2,485
Dividend income
- equity securities unquoted in Malaysia - 20 - -
amortisation of premiums
- Corporate debt securities unquoted in Malaysia - (186) - (186)
239 2,319 239 2,299
loans and receivables
Interest income
- other secured and unsecured loans 113 162 - -
- subsidiaries - - 2,009 2,079
113 162 2,009 2,079
Fixed and call deposits interest income 10,532 6,891 9,937 6,178
11,199 9,595 12,185 10,556

150
NOTES TO THE FINANCIAL STATEMENTS31 DECEMBER 2016(continued)
MAA GROUP BERHAD annual report 2016
23 INVESTMENT INCOME (continued)
DISContInueD operatIonS (note 32)
GROUP
2016 2015
RM’000 RM’000
Financial assets at FVtpl
profit income
- Islamic debt securities unquoted in Malaysia 1,371 3,475
Dividend income
- Syariah-approved equity securities quoted in Malaysia 867 2,938
2,238 6,413
aFS financial assets
profit income
- Islamic debt securities unquoted in Malaysia 2,652 7,444
amortisation of premiums
- Islamic debt securities unquoted in Malaysia (90) (508)
2,562 6,936
HtM financial assets
profit income
- Malaysian Government Guaranteed Financing 909 1,823
amortisation of premiums
- Malaysian Government Guaranteed Financing (1) (1)
908 1,822
Fixed and call deposits interest/profit income 4,137 5,605
9,845 20,776
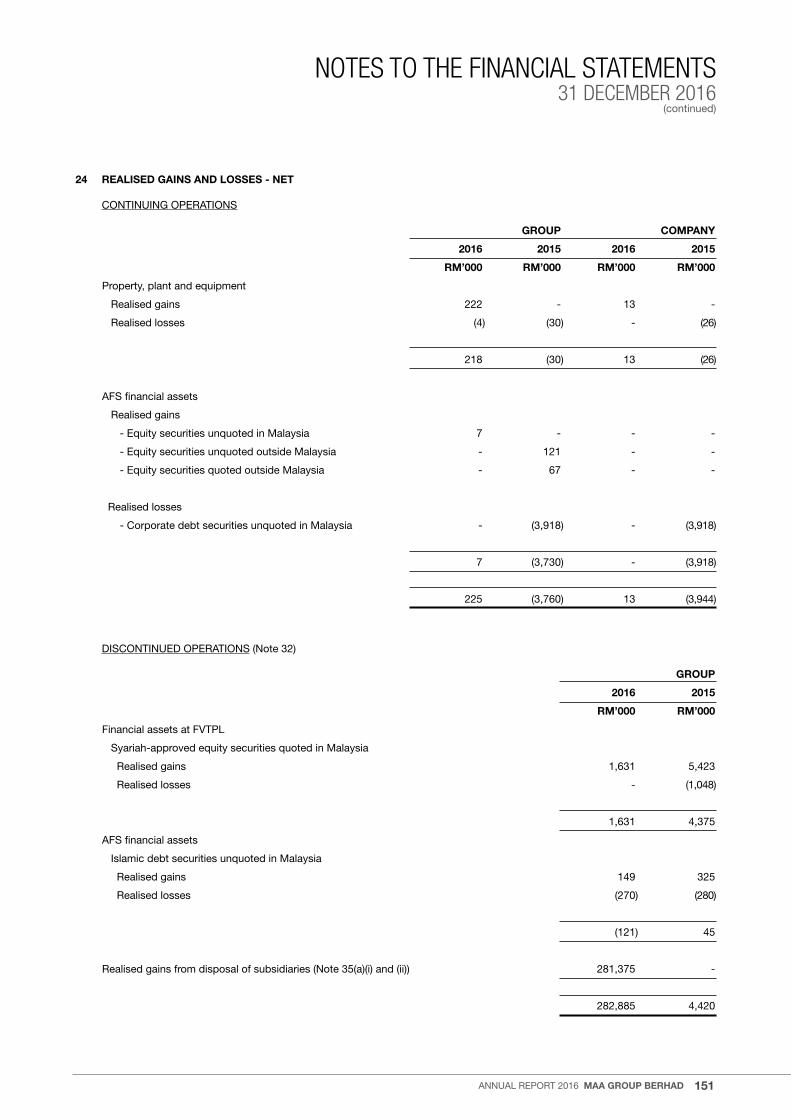
151
NOTES TO THE FINANCIAL STATEMENTS31 DECEMBER 2016
(continued)
annual report 2016 MAA GROUP BERHAD
24 REALISED GAINS AND LOSSES - NET
ContInuInG operatIonS
GROUP COMPANY
2016 2015 2016 2015
RM’000 RM’000 RM’000 RM’000
property, plant and equipment
realised gains 222 - 13 -
realised losses (4) (30) - (26)
218 (30) 13 (26)
aFS financial assets
realised gains
- equity securities unquoted in Malaysia 7 - - -
- equity securities unquoted outside Malaysia - 121 - -
- equity securities quoted outside Malaysia - 67 - -
realised losses
- Corporate debt securities unquoted in Malaysia - (3,918) - (3,918)
7 (3,730) - (3,918)
225 (3,760) 13 (3,944)
DISContInueD operatIonS (note 32)
GROUP
2016 2015
RM’000 RM’000
Financial assets at FVtpl
Syariah-approved equity securities quoted in Malaysia
realised gains 1,631 5,423
realised losses - (1,048)
1,631 4,375
aFS financial assets
Islamic debt securities unquoted in Malaysia
realised gains 149 325
realised losses (270) (280)
(121) 45
realised gains from disposal of subsidiaries (note 35(a)(i) and (ii)) 281,375 -
282,885 4,420
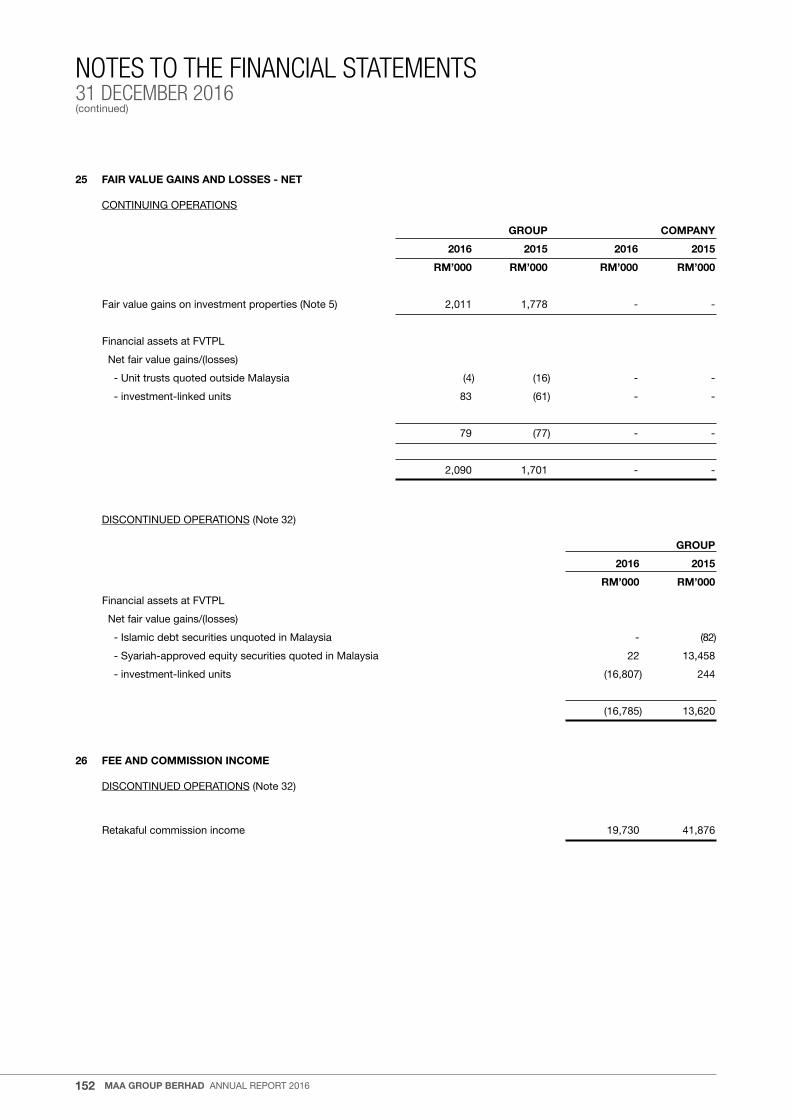
152
NOTES TO THE FINANCIAL STATEMENTS31 DECEMBER 2016(continued)
MAA GROUP BERHAD annual report 2016
25 FAIR VALUE GAINS AND LOSSES - NET
ContInuInG operatIonS
GROUP COMPANY
2016 2015 2016 2015
RM’000 RM’000 RM’000 RM’000
Fair value gains on investment properties (note 5) 2,011 1,778 - -
Financial assets at FVtpl
net fair value gains/(losses)
- unit trusts quoted outside Malaysia (4) (16) - -
- investment-linked units 83 (61) - -
79 (77) - -
2,090 1,701 - -
DISContInueD operatIonS (note 32)
GROUP
2016 2015
RM’000 RM’000
Financial assets at FVtpl
net fair value gains/(losses)
- Islamic debt securities unquoted in Malaysia - (82)
- Syariah-approved equity securities quoted in Malaysia 22 13,458
- investment-linked units (16,807) 244
(16,785) 13,620
26 FEE AND COMMISSION INCOME
DISContInueD operatIonS (note 32)
retakaful commission income 19,730 41,876

153
NOTES TO THE FINANCIAL STATEMENTS31 DECEMBER 2016
(continued)
annual report 2016 MAA GROUP BERHAD
27 OTHER OPERATING REVENUE FROM NON-INSURANCE BUSINESSES
ContInuInG operatIonS
GROUP COMPANY
2016 2015 2016 2015
RM’000 RM’000 RM’000 RM’000
revenue from non-insurance businesses
- management fee income 25 12 944 1,294
- interest income from hire purchase, leasing and other credit activities 28 29 - -
- fee income from education services 6,533 6,798 - -
- others 274 226 - -
6,860 7,065 944 1,294
DISContInueD operatIonS (note 32)
GROUP
2016 2015
RM’000 RM’000
revenue from non-insurance businesses
- income from card services 104 269
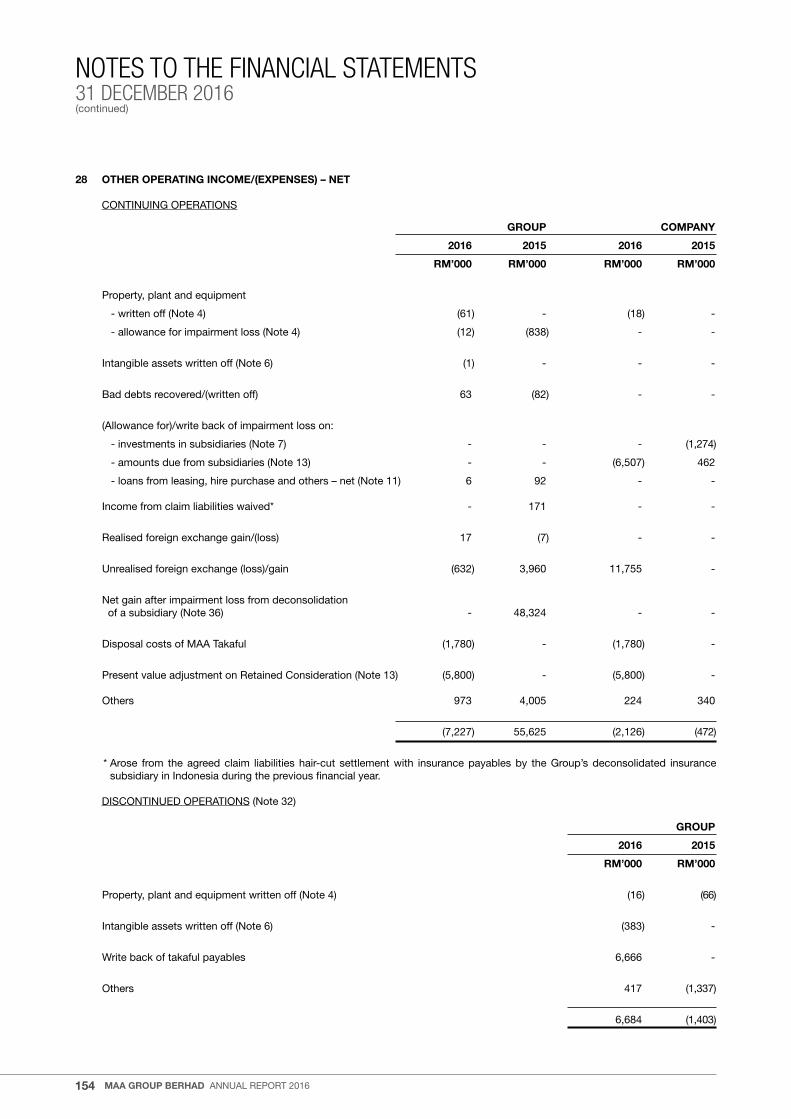
154
NOTES TO THE FINANCIAL STATEMENTS31 DECEMBER 2016(continued)
MAA GROUP BERHAD annual report 2016
28 OTHER OPERATING INCOME/(EXPENSES) – NET
ContInuInG operatIonS
GROUP COMPANY
2016 2015 2016 2015
RM’000 RM’000 RM’000 RM’000
property, plant and equipment
- written off (note 4) (61) - (18) -
- allowance for impairment loss (note 4) (12) (838) - -
Intangible assets written off (note 6) (1) - - -
Bad debts recovered/(written off) 63 (82) - -
(allowance for)/write back of impairment loss on:
- investments in subsidiaries (note 7) - - - (1,274)
- amounts due from subsidiaries (note 13) - - (6,507) 462
- loans from leasing, hire purchase and others – net (note 11) 6 92 - - Income from claim liabilities waived* - 171 - -
realised foreign exchange gain/(loss) 17 (7) - -
unrealised foreign exchange (loss)/gain (632) 3,960 11,755 -
net gain after impairment loss from deconsolidation of a subsidiary (note 36) - 48,324 - -
Disposal costs of Maa takaful (1,780) - (1,780) -
present value adjustment on retained Consideration (note 13) (5,800) - (5,800) - others 973 4,005 224 340
(7,227) 55,625 (2,126) (472)
* arose from the agreed claim liabilities hair-cut settlement with insurance payables by the Group’s deconsolidated insurance
subsidiary in Indonesia during the previous financial year.
DISContInueD operatIonS (note 32)
GROUP
2016 2015
RM’000 RM’000
property, plant and equipment written off (note 4) (16) (66)
Intangible assets written off (note 6) (383) -
Write back of takaful payables 6,666 -
others 417 (1,337)
6,684 (1,403)
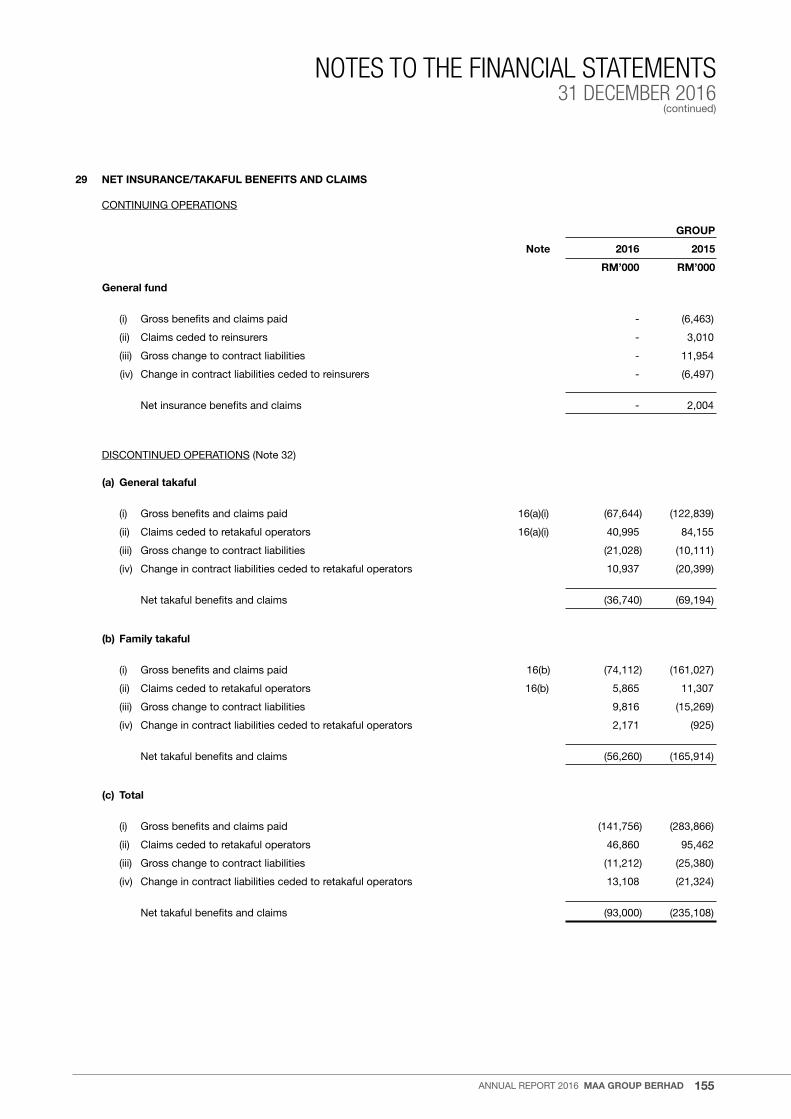
155
NOTES TO THE FINANCIAL STATEMENTS31 DECEMBER 2016
(continued)
annual report 2016 MAA GROUP BERHAD
29 NET INSURANCE/TAKAFUL BENEFITS AND CLAIMS
ContInuInG operatIonS
GROUP
Note 2016 2015
RM’000 RM’000
General fund
(i) Gross benefits and claims paid - (6,463)
(ii) Claims ceded to reinsurers - 3,010
(iii) Gross change to contract liabilities - 11,954
(iv) Change in contract liabilities ceded to reinsurers - (6,497)
net insurance benefits and claims - 2,004
DISContInueD operatIonS (note 32)
(a) General takaful
(i) Gross benefits and claims paid 16(a)(i) (67,644) (122,839)
(ii) Claims ceded to retakaful operators 16(a)(i) 40,995 84,155
(iii) Gross change to contract liabilities (21,028) (10,111)
(iv) Change in contract liabilities ceded to retakaful operators 10,937 (20,399)
net takaful benefits and claims (36,740) (69,194)
(b) Family takaful
(i) Gross benefits and claims paid 16(b) (74,112) (161,027)
(ii) Claims ceded to retakaful operators 16(b) 5,865 11,307
(iii) Gross change to contract liabilities 9,816 (15,269)
(iv) Change in contract liabilities ceded to retakaful operators 2,171 (925)
net takaful benefits and claims (56,260) (165,914)
(c) Total
(i) Gross benefits and claims paid (141,756) (283,866)
(ii) Claims ceded to retakaful operators 46,860 95,462
(iii) Gross change to contract liabilities (11,212) (25,380)
(iv) Change in contract liabilities ceded to retakaful operators 13,108 (21,324)
net takaful benefits and claims (93,000) (235,108)

156
NOTES TO THE FINANCIAL STATEMENTS31 DECEMBER 2016(continued)
MAA GROUP BERHAD annual report 2016
30 MANAGEMENT EXPENSES
ContInuInG operatIonS
GROUP COMPANY
2016 2015 2016 2015
RM’000 RM’000 RM’000 RM’000
Staff costs (including executive Directors)
- salaries and bonus 16,667 15,405 10,946 8,925
- defined contribution retirement benefits 2,534 2,058 1,697 1,354
- annual leave 18 (91) 10 (79)
- other staff benefits 572 310 175 186
19,791 17,682 12,828 10,386
Depreciation of property, plant and equipment (note 4) 828 853 439 423
amortisation of intangible assets (note 6) 86 85 71 71
amortisation of leases (note 4) 2 2 - -
auditors’ remuneration
- statutory audit
- current year 299 176 235 112
- under provision in prior financial year 40 27 40 44
- audit related services
- under provision in prior years 150* - 150* -
- non-audit related services
- current year 570* - 570* -
auditors’ remuneration payable/paid to other audit firms 57 85 - -
non-executive Directors’ fees and other emoluments 299 300 257 248
tutors’ fees for education services 769 680 - -
Fees paid to a company in which certain Directors have an interest 241 228 219 204
allowance for impairment loss on other receivables (note 13) 1,407 8,431 1,700 7,000
office rental 1,644 1,648 421 421
Staff training expenses 39 50 36 31
Computer expenses 311 431 281 401
advertising, promotional and entertainment expenses 953 715 752 561
Motor vehicle, accommodation and travelling expenses 1,689 1,563 1,369 1,070
printing and stationery 411 333 130 106
postage, telephone and fax 135 139 68 68
professional fees 2,587 1,883 2,461 1,164
Staff amenities 194 164 112 126
electricity and water 277 288 34 46
expenses of investment properties (note 5) 603 543 - -
Security charges 401 451 401 451
provision for liquidation fees and expenses of a deconsolidated subsidiary - 5,656 - -
others 3,408 2,779 1,810 1,633
37,191 45,192 24,384 24,566
* Disposal costs of Maa takaful
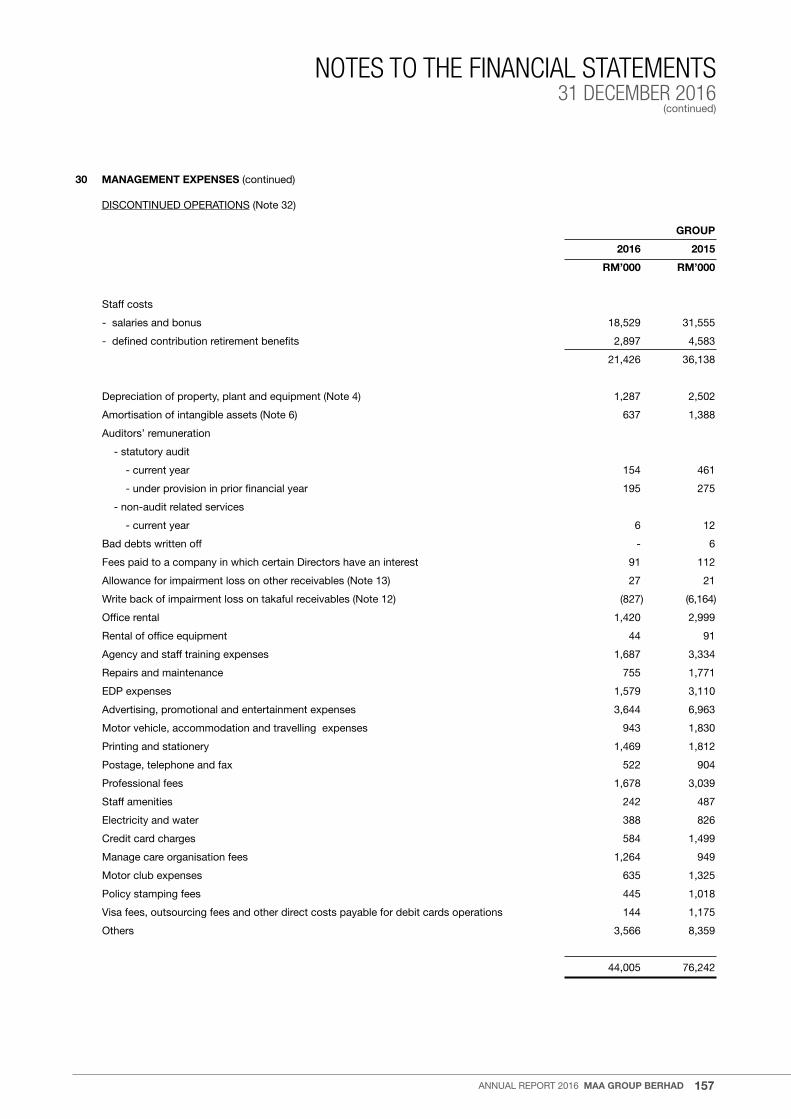
157
NOTES TO THE FINANCIAL STATEMENTS31 DECEMBER 2016
(continued)
annual report 2016 MAA GROUP BERHAD
30 MANAGEMENT EXPENSES (continued)
DISContInueD operatIonS (note 32)
GROUP
2016 2015
RM’000 RM’000
Staff costs
- salaries and bonus 18,529 31,555
- defined contribution retirement benefits 2,897 4,583
21,426 36,138
Depreciation of property, plant and equipment (note 4) 1,287 2,502
amortisation of intangible assets (note 6) 637 1,388
auditors’ remuneration
- statutory audit
- current year 154 461
- under provision in prior financial year 195 275
- non-audit related services
- current year 6 12
Bad debts written off - 6
Fees paid to a company in which certain Directors have an interest 91 112
allowance for impairment loss on other receivables (note 13) 27 21
Write back of impairment loss on takaful receivables (note 12) (827) (6,164)
office rental 1,420 2,999
rental of office equipment 44 91
agency and staff training expenses 1,687 3,334
repairs and maintenance 755 1,771
eDp expenses 1,579 3,110
advertising, promotional and entertainment expenses 3,644 6,963
Motor vehicle, accommodation and travelling expenses 943 1,830
printing and stationery 1,469 1,812
postage, telephone and fax 522 904
professional fees 1,678 3,039
Staff amenities 242 487
electricity and water 388 826
Credit card charges 584 1,499
Manage care organisation fees 1,264 949
Motor club expenses 635 1,325
policy stamping fees 445 1,018
Visa fees, outsourcing fees and other direct costs payable for debit cards operations 144 1,175
others 3,566 8,359
44,005 76,242
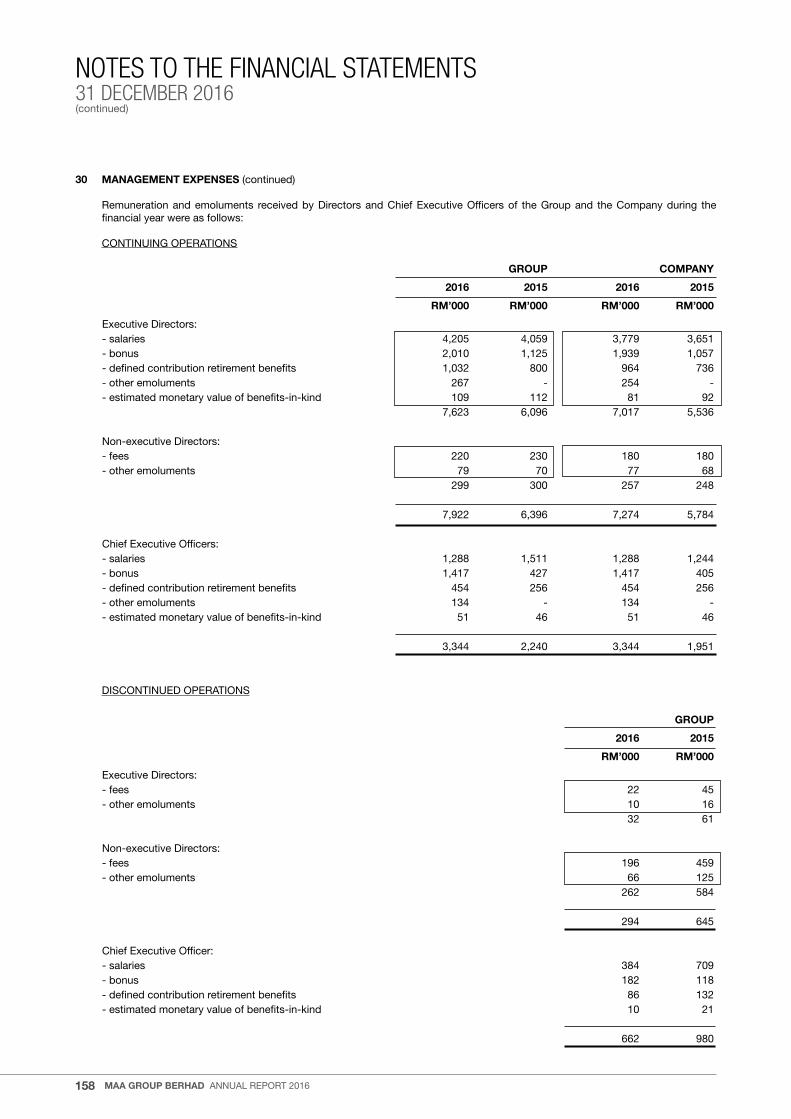
158
NOTES TO THE FINANCIAL STATEMENTS31 DECEMBER 2016(continued)
MAA GROUP BERHAD annual report 2016
30 MANAGEMENT EXPENSES (continued)
remuneration and emoluments received by Directors and Chief executive officers of the Group and the Company during the financial year were as follows:
ContInuInG operatIonS
GROUP COMPANY
2016 2015 2016 2015
RM’000 RM’000 RM’000 RM’000
executive Directors:- salaries 4,205 4,059 3,779 3,651- bonus 2,010 1,125 1,939 1,057- defined contribution retirement benefits 1,032 800 964 736- other emoluments 267 - 254 -- estimated monetary value of benefits-in-kind 109 112 81 92 7,623 6,096 7,017 5,536 non-executive Directors:- fees 220 230 180 180- other emoluments 79 70 77 68 299 300 257 248 7,922 6,396 7,274 5,784 Chief executive officers: - salaries 1,288 1,511 1,288 1,244- bonus 1,417 427 1,417 405- defined contribution retirement benefits 454 256 454 256- other emoluments 134 - 134 -- estimated monetary value of benefits-in-kind 51 46 51 46 3,344 2,240 3,344 1,951
DISContInueD operatIonS
GROUP
2016 2015
RM’000 RM’000
executive Directors: - fees 22 45- other emoluments 10 16 32 61 non-executive Directors: - fees 196 459- other emoluments 66 125 262 584 294 645 Chief executive officer: - salaries 384 709- bonus 182 118- defined contribution retirement benefits 86 132- estimated monetary value of benefits-in-kind 10 21 662 980

159
NOTES TO THE FINANCIAL STATEMENTS31 DECEMBER 2016
(continued)
annual report 2016 MAA GROUP BERHAD
31 TAXATION
ContInuInG operatIonS
GROUP
Shareholders’ fund Total
RM’000 RM’000
2016
Current tax (12) (12)
Deferred tax (note 9) 78 78
tax expenses 66 66
Current tax
Current financial year 1 1
over provision in prior financial years (13) (13)
(12) (12)
Deferred tax
origination and reversal of temporary differences 78 78
66 66
2015
Current tax 125 125
Deferred tax (note 9) (15) (15)
tax expenses 110 110
Current tax
Current financial year 111 111
under provision in prior financial years 14 14
125 125
Deferred tax
origination and reversal of temporary differences (15) (15)
110 110

160
NOTES TO THE FINANCIAL STATEMENTS31 DECEMBER 2016(continued)
MAA GROUP BERHAD annual report 2016
31 TAXATION (continued)
DISContInueD operatIonS (note 32)
GROUP
Shareholders’ General Family fund takaful fund takaful fund Total
RM’000 RM’000 RM’000 RM’000
2016
Current tax 3,705 1,919 572 6,196
Deferred tax (note 9) 24 234 (1,345) (1,087)
tax expenses 3,729 2,153 (773) 5,109
Current tax
Current financial year 3,705 1,919 572 6,196
Deferred tax
origination and reversal of temporary differences 24 234 (1,345) (1,087)
3,729 2,153 (773) 5,109
2015
Current tax 9,406 96 1,066 10,568
Deferred tax (note 9) 19 874 968 1,861
tax expenses 9,425 970 2,034 12,429
Current tax
Current financial year 2,694 96 1,310 4,100
under/(over) provision in prior financial years 6,712 - (244) 6,468
9,406 96 1,066 10,568
Deferred tax
origination and reversal of temporary differences 19 874 968 1,861
9,425 970 2,034 12,429

161
NOTES TO THE FINANCIAL STATEMENTS31 DECEMBER 2016
(continued)
annual report 2016 MAA GROUP BERHAD
31 TAXATION (continued)
COMPANY
2016 2015
RM’000 RM’000
Deferred tax (note 9) 78 (15)
tax expenses/(income) 78 (15)
Deferred tax
origination and reversal of temporary differences 78 (15)
tax expenses/(income) comprised the following:
GROUP
Shareholders’ General Family fund takaful fund takaful fund Total
RM’000 RM’000 RM’000 RM’000
2016
Continuing operations 66 - - 66
Discontinued operations 3,729 2,153 (773) 5,109
tax expenses/(income) 3,795 2,153 (773) 5,175
2015
Continuing operations 110 - - 110
Discontinued operations 9,425 970 2,034 12,429
tax expenses 9,535 970 2,034 12,539
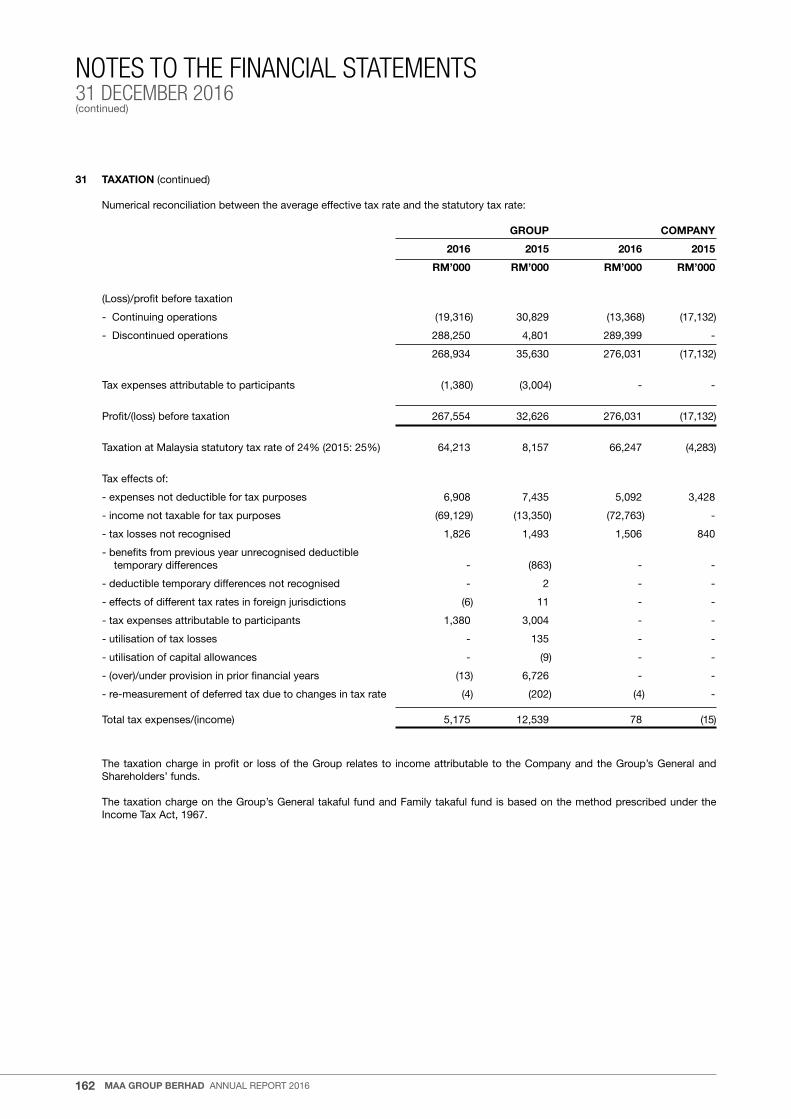
162
NOTES TO THE FINANCIAL STATEMENTS31 DECEMBER 2016(continued)
MAA GROUP BERHAD annual report 2016
31 TAXATION (continued)
numerical reconciliation between the average effective tax rate and the statutory tax rate:
GROUP COMPANY
2016 2015 2016 2015
RM’000 RM’000 RM’000 RM’000
(loss)/profit before taxation
- Continuing operations (19,316) 30,829 (13,368) (17,132)
- Discontinued operations 288,250 4,801 289,399 -
268,934 35,630 276,031 (17,132)
tax expenses attributable to participants (1,380) (3,004) - -
profit/(loss) before taxation 267,554 32,626 276,031 (17,132)
taxation at Malaysia statutory tax rate of 24% (2015: 25%) 64,213 8,157 66,247 (4,283)
tax effects of:
- expenses not deductible for tax purposes 6,908 7,435 5,092 3,428
- income not taxable for tax purposes (69,129) (13,350) (72,763) -
- tax losses not recognised 1,826 1,493 1,506 840
- benefits from previous year unrecognised deductible temporary differences - (863) - -
- deductible temporary differences not recognised - 2 - -
- effects of different tax rates in foreign jurisdictions (6) 11 - -
- tax expenses attributable to participants 1,380 3,004 - -
- utilisation of tax losses - 135 - -
- utilisation of capital allowances - (9) - -
- (over)/under provision in prior financial years (13) 6,726 - -
- re-measurement of deferred tax due to changes in tax rate (4) (202) (4) -
total tax expenses/(income) 5,175 12,539 78 (15)
the taxation charge in profit or loss of the Group relates to income attributable to the Company and the Group’s General and Shareholders’ funds.
the taxation charge on the Group’s General takaful fund and Family takaful fund is based on the method prescribed under the Income tax act, 1967.

163
NOTES TO THE FINANCIAL STATEMENTS31 DECEMBER 2016
(continued)
annual report 2016 MAA GROUP BERHAD
32 DISCONTINUED OPERATIONS
GROUP
Note 2016 2015
RM’000 RM’000
Gross earned contributions 22(c) 269,430 528,352
Contributions ceded to retakaful operators 22(c) (100,165) (193,995)
Net earned contributions 169,265 334,357
Investment income 23 9,845 20,776
realised gains and losses - net 24 282,885 4,420
Fair value gains and losses - net 25 (16,785) 13,620
Fee and commission income 26 19,730 41,876
other operating revenue from non-insurance businesses 27 104 269
other operating income/(expenses)- net 28 6,684 (1,403)
Other revenue 302,463 79,558
Total revenue 471,728 413,915
Gross benefits and claims paid 29(c) (141,756) (283,866)
Claims ceded to retakaful operators 29(c) 46,860 95,462
Gross change to contract liabilities 29(c) (11,212) (25,380)
Change in contract liabilities ceded to retakaful operators 29(c) 13,108 (21,324)
Net takaful benefits and claims (93,000) (235,108)
Fee and commission expenses (46,143) (97,315)
Management expenses 30 (44,005) (76,242)
expense liabilities (330) (377)
Other expenses (90,478) (173,934)
Profit before zakat 288,250 4,873
Zakat - (72)
Profit after zakat 288,250 4,801
tax expenses attributable to participants (1,380) (3,004)
Profit before taxation 286,870 1,797
taxation 31 (5,109) (12,429)
tax expenses attributable to participants 1,380 3,004
tax expenses attributable to Shareholders’ fund (3,729) (9,425)
Profit/(loss) for the financial year 283,141 (7,628)
the financial results of discontinued operations for the financial year ended 31 December 2016 represent Maa takaful and Maa Cards, subsidiaries disposed during the financial year as disclosed respectively in note 47(b) and (c) to the financial statements. the comparatives have been restated to include the financial results of those disposed subsidiaries.
COMPANY
the profit of rM289,399,000 for the financial year ended 31 December 2016 comprised of realised gain from disposal of Maa takaful as disclosed in note 35(a)(ii) to the financial statements.
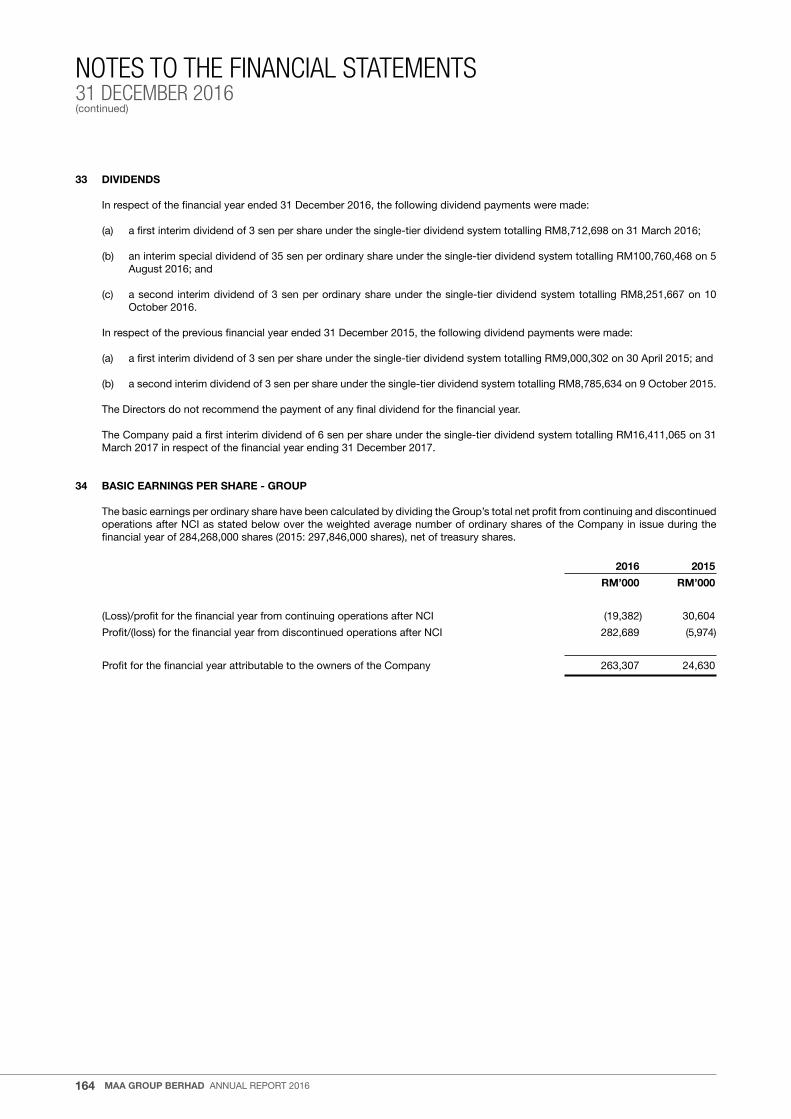
164
NOTES TO THE FINANCIAL STATEMENTS31 DECEMBER 2016(continued)
MAA GROUP BERHAD annual report 2016
33 DIVIDENDS
In respect of the financial year ended 31 December 2016, the following dividend payments were made:
(a) a first interim dividend of 3 sen per share under the single-tier dividend system totalling rM8,712,698 on 31 March 2016;
(b) an interim special dividend of 35 sen per ordinary share under the single-tier dividend system totalling rM100,760,468 on 5 august 2016; and
(c) a second interim dividend of 3 sen per ordinary share under the single-tier dividend system totalling rM8,251,667 on 10 october 2016.
In respect of the previous financial year ended 31 December 2015, the following dividend payments were made:
(a) a first interim dividend of 3 sen per share under the single-tier dividend system totalling rM9,000,302 on 30 april 2015; and
(b) a second interim dividend of 3 sen per share under the single-tier dividend system totalling rM8,785,634 on 9 october 2015.
the Directors do not recommend the payment of any final dividend for the financial year.
the Company paid a first interim dividend of 6 sen per share under the single-tier dividend system totalling rM16,411,065 on 31 March 2017 in respect of the financial year ending 31 December 2017.
34 BASIC EARNINGS PER SHARE - GROUP
the basic earnings per ordinary share have been calculated by dividing the Group’s total net profit from continuing and discontinued operations after nCI as stated below over the weighted average number of ordinary shares of the Company in issue during the financial year of 284,268,000 shares (2015: 297,846,000 shares), net of treasury shares.
2016 2015
RM’000 RM’000
(loss)/profit for the financial year from continuing operations after nCI (19,382) 30,604
profit/(loss) for the financial year from discontinued operations after nCI 282,689 (5,974)
profit for the financial year attributable to the owners of the Company 263,307 24,630

165
NOTES TO THE FINANCIAL STATEMENTS31 DECEMBER 2016
(continued)
annual report 2016 MAA GROUP BERHAD
35 DISPOSAL OF SUBSIDIARIES
(a) Disposal of subsidiaries carried out during the financial year ended 31 December 2016 were:
(i) on 31 March 2016, Maa Corp completed the disposal of its entire equity interest in Maa Card for a total cash consideration of the aggregate of rM1.0 million and the amount equivalent to the final net current asset of Maa Card on completion date, as disclosed in note 47(c) to the financial statements.
Following the completion of the disposal, Maa Cards ceased to be subsidiary of the Group.
Details of the disposal of Maa Cards are as follows:
GROUP At date of disposal
RM’000
property, plant and equipment 15
Intangible assets 18
trade and other receivables 400
Fixed and call deposits 5,537
Cash and cash equivalents 534
trade and other payables (1,456)
net assets 5,048
net disposal proceeds (6,015)
Gain on disposal to the Group (note 24) (967)
the net cash flow on disposal was determined as follows:
net cash received 6,015
Cash and cash equivalents of disposed subsidiary (534)
Cash inflow to the Group on disposal 5,481

166
NOTES TO THE FINANCIAL STATEMENTS31 DECEMBER 2016(continued)
MAA GROUP BERHAD annual report 2016
35 DISPOSAL OF SUBSIDIARIES (continued)
(a) Disposal of subsidiaries carried out during the financial year ended 31 December 2016 were: (continued)
(ii) on 30 June 2016, the Company completed the disposal of its 75% equity interest in Maa takaful to Zurich for a cash consideration of rM393.75 million, as disclosed in note 47(b) to the financial statements.
Following the completion of the disposal, Maa takaful ceased to be subsidiary of the Group. Details of the disposal of Maa takaful are as follows:
GROUP At date of disposal
RM’000
property, plant and equipment (note 4) 9,661
Intangible assets (note 6) 2,745
Deferred tax assets 2,964
retakaful assets 282,440
Investments 475,275
Financial assets at FVtpl 332,121
aFS financial assets 86,370
HtM financial assets 40,628
loans and receivables 16,156
takaful receivables 55,075
other receivables 15,569
Cash and cash equivalents 264,211
takaful contract liabilities (note 16) (860,232)
Deferred tax liabilities (989)
takaful payables (79,177)
other payables (49,257)
Current tax liabilities (6,053)
net assets 112,232
less: nCI (28,241)
83,991
net disposal proceeds (*) (364,399)
Gain on disposal to the Group (note 24) (280,408)
the net cash flow on disposal was determined as follows:
net disposal proceeds (*) 364,399
less: retained Consideration (**) (93,750)
net cash received 270,649
Cash and cash equivalents of disposed subsidiary (264,211)
Cash inflow to the Group on disposal 6,438

167
NOTES TO THE FINANCIAL STATEMENTS31 DECEMBER 2016
(continued)
annual report 2016 MAA GROUP BERHAD
35 DISPOSAL OF SUBSIDIARIES (continued)
(a) Disposal of subsidiaries carried out during the financial year ended 31 December 2016 were: (continued)
(ii) Details of the disposal of Maa takaful are as follows: (continued)
COMPANY At date of disposal
RM’000
Cost of investment 75,000
net disposal proceeds (*) (364,399)
Gain on disposal to the Company (note 32) 289,399
the net cash flow on disposal was determined as follows:
net disposal proceeds (*) 364,399
less: retained Consideration (**) (93,750)
net cash received 270,649
*the net disposal proceeds of the Group are derived from sale consideration of rM393,750,000 less a downward adjustment of rM29,351,000 pursuant to income statement and statement of financial position of Maa takaful for the period from 1 January 2015 to the completion date on 30 June 2016, which were prepared in accordance with the terms of the Spa and agreed by all parties.
**the retained Consideration of rM93,750,000 from the disposal of Maa takaful will be receivable on the third anniversary of the sale completion date failing on 30 June 2018.
(b) Disposal of subsidiary carried out during the previous financial year ended 31 December 2015 was:
on 20 May 2015, Maa Corporate advisory Sdn Bhd completed the disposal of its entire equity interest in MaaCaCS for a total cash consideration of rM10.
Following the completion of the disposal, MaaCaCS ceased to be subsidiary of the Group.
Details of the disposal of MaaCaCS were as follows:
GROUP At date of disposal
RM’000
Cash and cash equivalents 9
other payables (9)
net assets -
net disposal proceeds -(*)
Gain on disposal to the Group (note 24) -
the net cash flow on disposal was determined as follows:
net cash received -(*)
Cash and cash equivalents of disposed subsidiary (9)
Cash outflow to the Group on disposal (9)
(*) Denotes rM10.

168
NOTES TO THE FINANCIAL STATEMENTS31 DECEMBER 2016(continued)
MAA GROUP BERHAD annual report 2016
36 DECONSOLIDATION OF A SUBSIDIARY
on 14 September 2015, the Company announced that pt MaaG received a letter dated 10 September 2015 from otoritas Jasa Keuangan (“oJK”), the Indonesia Financial Services authority, informing pt MaaG that its operating license had been revoked with effect from 3 September 2015. oJK performs its regulatory and supervisory duties over financial services activities including insurance activities in Indonesia. Based on the terms and conditions contained in the said letter, pt MaaG was required to appoint a liquidator or form a liquidation team within 30 days from the date of the revocation letter. pt MaaG had submitted an application to oJK to seek extension of time till end of november 2015 to appoint a liquidator.
on 30 September 2015, pt MaaG passed a members’ resolution to approve the dissolution and winding up of the company. on 1 December 2015, tuan Dharma azhar Demonic, S.H. and tuan romanus Muda Kota, S.H. of SrD & Co lawyers were appointed as liquidators to facilitate the member’s voluntary winding up of pt MaaG.
Following the appointment of the liquidators, the Company had relinquished its control and involvement in the operation and financial matters of pt MaaG to the liquidators. accordingly, pt MaaG had ceased to be a subsidiary of the Group with effect from 1 December 2015 and had been deconsolidated from group consolidated accounts on that date.
Details of the deconsolidation of pt MaaG were as follows:
GROUP At date of deconsolidation
RM’000
property, plant and equipment (note 4) 29
aFS financial assets 1,586
loans and receivables 478
Insurance receivables 59,927
trade and other receivables 151
Cash and cash equivalents 1,094
Insurance contract liabilities (note 36(i)) (24,975)
Insurance payables (94,977)
trade and other payables (23,223)
net liabilities (79,910)
less: nCI (9,242)
Gain on deconsolidation (89,152)
less: impairment loss on investment in pt MaaG 20,696
less: impairment loss on amount due from pt MaaG 20,132
net gain after impairment loss on deconsolidation to the Group (note 28) (48,324)
the net cash flow on deconsolidation was determined as follows:
net cash received -
Cash and cash equivalents of deconsolidated subsidiary (1,094)
Cash outflow to the Group on deconsolidated (1,094)
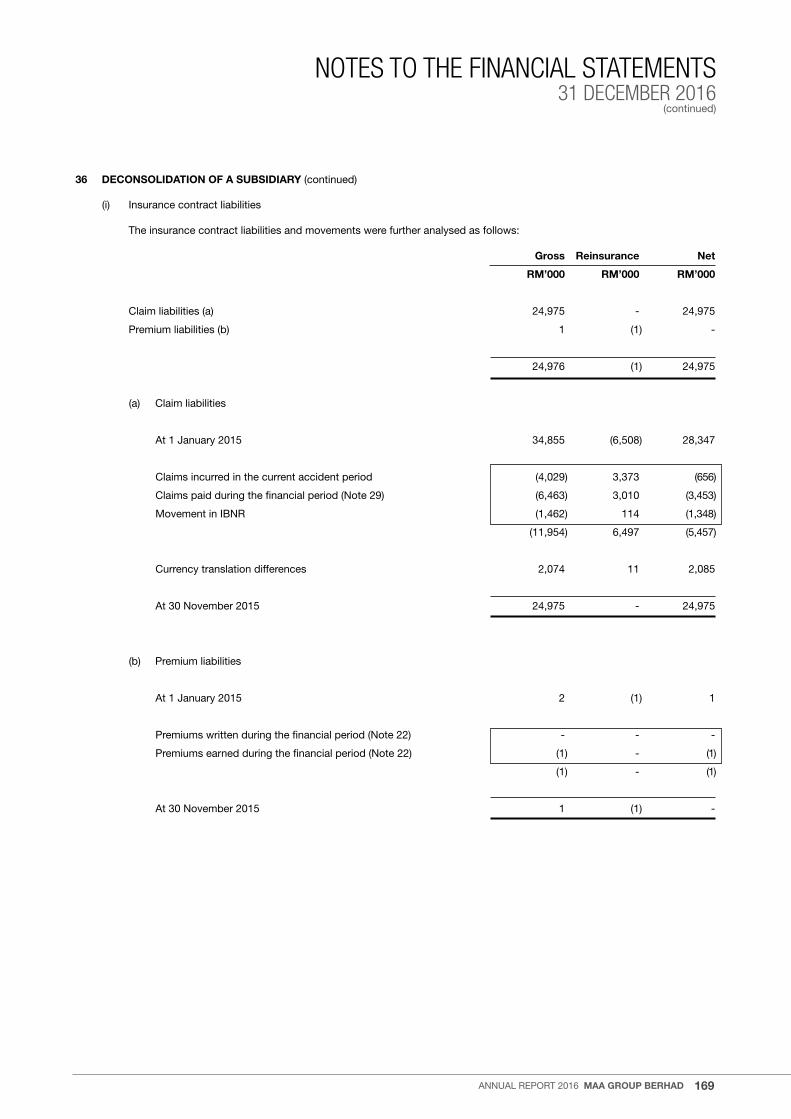
169
NOTES TO THE FINANCIAL STATEMENTS31 DECEMBER 2016
(continued)
annual report 2016 MAA GROUP BERHAD
36 DECONSOLIDATION OF A SUBSIDIARY (continued)
(i) Insurance contract liabilities
the insurance contract liabilities and movements were further analysed as follows:
Gross Reinsurance Net
RM’000 RM’000 RM’000
Claim liabilities (a) 24,975 - 24,975
premium liabilities (b) 1 (1) -
24,976 (1) 24,975
(a) Claim liabilities
at 1 January 2015 34,855 (6,508) 28,347
Claims incurred in the current accident period (4,029) 3,373 (656)
Claims paid during the financial period (note 29) (6,463) 3,010 (3,453)
Movement in IBnr (1,462) 114 (1,348)
(11,954) 6,497 (5,457)
Currency translation differences 2,074 11 2,085
at 30 november 2015 24,975 - 24,975
(b) premium liabilities
at 1 January 2015 2 (1) 1
premiums written during the financial period (note 22) - - -
premiums earned during the financial period (note 22) (1) - (1)
(1) - (1)
at 30 november 2015 1 (1) -

170
NOTES TO THE FINANCIAL STATEMENTS31 DECEMBER 2016(continued)
MAA GROUP BERHAD annual report 2016
37 CAPITAL AND OTHER COMMITMENTS
(a) Capital commitments
Capital expenditure contracted for at the date of the statement of financial position but not yet incurred is as follows:
GROUP COMPANY
31.12.2016 31.12.2015 31.12.2016 31.12.2015
RM’000 RM’000 RM’000 RM’000
property, plant and equipment
- office renovation - 114 - -
(b) operating lease commitments
the Group and the Company lease various offices under operating lease agreements. the lease terms are between 1 and 3 years, and majority of the lease agreements are renewable at the end of the lease period at market rate. the lease expenditure (office rental) charged to profit or loss during the year is disclosed in note 30 to the financial statements.
the future aggregate lease payments under operating leases are as follows:
GROUP COMPANY
31.12.2016 31.12.2015 31.12.2016 31.12.2015
RM’000 RM’000 RM’000 RM’000
no later than 1 year 775 3,356 386 421
later than 1 year and no later than 3 years - 2,846 - 386
775 6,202 386 807
38 SIGNIFICANT RELATED PARTY DISCLOSURES
related parties and relationships
the subsidiaries and associates of the Company are disclosed in notes 7 and 8 to the financial statements respectively. the other related parties of, and their relationships with the Group and the Company are as follows:
related party relationship Melewar equities Sdn Bhd Substantial shareholder of the Company Melewar Khyra Sdn Bhd Substantial shareholder of the Company trace Management Services Sdn Bhd Company controlled by certain Directors of the Company Melewar Industrial Group Berhad Company controlled by certain Directors of the Company
Significant related party transactions
During the financial year, the Group and the Company undertook various transactions based on agreed terms and conditions with its subsidiaries, associates and other companies deemed related parties as disclosed above.
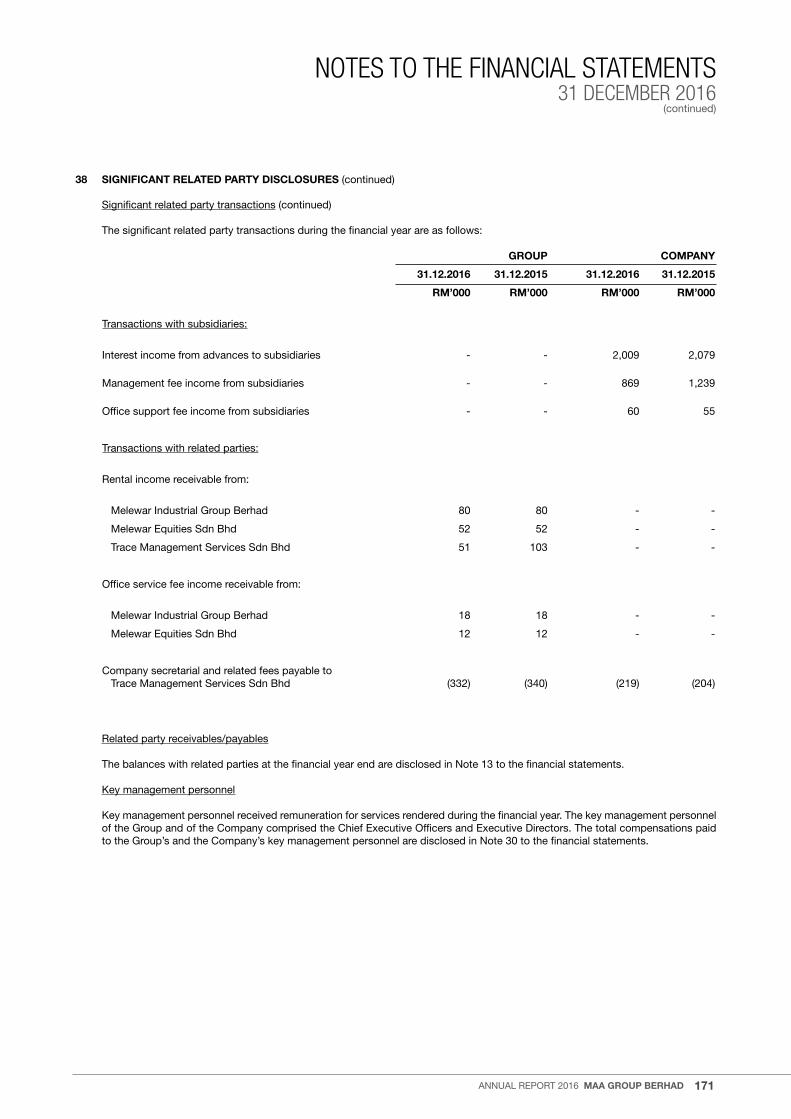
171
NOTES TO THE FINANCIAL STATEMENTS31 DECEMBER 2016
(continued)
annual report 2016 MAA GROUP BERHAD
38 SIGNIFICANT RELATED PARTY DISCLOSURES (continued)
Significant related party transactions (continued)
the significant related party transactions during the financial year are as follows:
GROUP COMPANY
31.12.2016 31.12.2015 31.12.2016 31.12.2015
RM’000 RM’000 RM’000 RM’000
transactions with subsidiaries:
Interest income from advances to subsidiaries - - 2,009 2,079
Management fee income from subsidiaries - - 869 1,239
office support fee income from subsidiaries - - 60 55
transactions with related parties:
rental income receivable from:
Melewar Industrial Group Berhad 80 80 - -
Melewar equities Sdn Bhd 52 52 - -
trace Management Services Sdn Bhd 51 103 - -
office service fee income receivable from:
Melewar Industrial Group Berhad 18 18 - -
Melewar equities Sdn Bhd 12 12 - -
Company secretarial and related fees payable to trace Management Services Sdn Bhd (332) (340) (219) (204)
related party receivables/payables
the balances with related parties at the financial year end are disclosed in note 13 to the financial statements.
Key management personnel
Key management personnel received remuneration for services rendered during the financial year. the key management personnel of the Group and of the Company comprised the Chief executive officers and executive Directors. the total compensations paid to the Group’s and the Company’s key management personnel are disclosed in note 30 to the financial statements.
172
NOTES TO THE FINANCIAL STATEMENTS31 DECEMBER 2016(continued)
MAA GROUP BERHAD annual report 2016
39 SEGMENTAL INFORMATION
the following segment information has been prepared in accordance with MFrS 8 ‘operating Segments’, which defines the requirements for the disclosure of financial information of an entity’s operating segments. It is prepared on the basis of the “management approach”, which requires presentation of the segments on the basis of internal reports about the components of the entity which are regularly reviewed by the chief operating decision-maker in order to allocate resources to a segment and to assess its performance.
During the current financial year, the Group has reassessed its operating segments in accordance with MFrS 8.13. Based on the assessment, the Group has identified education services, retail mortgage lending and loan securitisation which met the quantitative thresholds as the Group’s additional operating segments. In order to conform to the current financial year’s presentation of segmental information, the preceding financial year’s segmental information of the additional operating segments have been restated accordingly.
the Group’s operating segments as described below are the Group’s strategic business units. the strategic business units offer different products and services, and are managed separately because they employ different technology and marketing strategies. the operating segments are reported in a manner consistent with the internal reporting provided to the executive Committee of the Company (the chief operating decision maker).
the following summary describes the operations in each of the Group’s operating segments for the current financial year ended 31 December 2016:
• Investment holdings • education services • retail mortgage lending and loan securitisation • General insurance - underwriting all classes of general insurance business • Family takaful business - underwriting family takaful business(*) • General takaful business - underwriting general takaful business(*) • Shareholders’ fund of the takaful businesses(*)
other segments comprise hire purchase, leasing and other credit activities, consultancy services and card business.
*Discontinued operations
other than the stated above, there have been no material changes in total assets, the basis of segmentation and the basis of measurement of segment profit or loss from the last annual financial statements, except:
(i) in the previous financial year pt MaaG, a subsidiary which carried out the general insurance business was recognised as operating segment for 11 months period ended 30 november 2015 before it was deconsolidated from group consolidated account with effect from 1 December 2015 when liquidators were appointed to commence the shareholders voluntary winding of the company; and
(ii) as disclosed in note 47(b) and (c) to the financial statements, the Company has completed the disposal of Maa takaful and Maa Cards on 30 June 2016 and 31 March 2016 respectively. accordingly the total assets and liabilities of Maa takaful and Maa Cards were deconsolidated upon disposal as they had ceased to be subsidiaries of the Group.
Measurement and Evaluation of Segment Performance
the executive Committee evaluates operating segments’ performance on the basis of revenue and profit. expenses directly associated with each operating segment are included in determining their respective profits. transactions between operating segments are based on mutually agreed allocation bases. In addition to the operating segments, the segment information also discloses non inter-segment eliminations.

173
NOTES TO THE FINANCIAL STATEMENTS31 DECEMBER 2016
(continued)
annual report 2016 MAA GROUP BERHAD
39
SE
GM
EN
TAL
INFO
RM
AT
ION
(con
tinue
d)
Fi
nanc
ial y
ear
end
ed 3
1 D
ecem
ber
201
6
R
etai
l
mo
rtg
age
le
ndin
g
and
loan
In
ter-
Ed
ucat
ion
secu
riti
- G
ener
al
O
ther
seg
men
t
In
vest
men
t ho
ldin
gs
serv
ices
sa
tio
n in
sura
nce
Ta
kafu
l se
gm
ents
To
tal
elim
inat
ion
G
roup
G
ener
al
Fam
ily
Sha
re
ta
kafu
l ta
kafu
l ho
lder
s’
fund
fu
nd
fund
Co
nti-
D
isco
nti-
Dis
cont
i-
Dis
cont
i-
Dis
cont
i-
Co
nti-
D
isco
nti-
nuin
g
nued
nued
nu
ed
nued
nu
ing
nu
ed
R
M’0
00
RM
’000
R
M’0
00
RM
’000
R
M’0
00
RM
’000
R
M’0
00
RM
’000
R
M’0
00
RM
’000
R
M’0
00
RM
’000
R
M’0
00
ext
erna
l rev
enue
11,3
66
- 6,
536
- -
148,
280
129,
143
1,81
4 15
7 14
2 29
7,43
8 -
297,
438
net
ear
ned
con
trib
utio
ns (n
ote
22)
-
- -
- -
52,2
03
117,
062
- -
- 16
9,26
5 -
169,
265
Inte
rest
/pro
fit in
com
e (n
ote
23)
10
,832
-
3 -
- 3,
302
3,91
3 1,
816
49
38
19,9
53
- 19
,953
Writ
e b
ack
of i
mp
airm
ent
loss
on
loa
ns fr
om le
asin
g, h
ire p
urch
ase
and
oth
ers
– ne
t (n
ote
28)
-
- -
- -
- -
- 6
- 6
- 6
oth
er r
even
ue
(4
,583
) 28
1,37
5 6,
625
- -
27,3
22
(13,
647)
90
,248
21
5 10
4 38
7,65
9 (9
2,00
8)
295,
651
net
tak
aful
ben
efits
and
cla
ims
(n
ote
29)
-
- -
- -
(36,
740)
(5
6,26
0)
- -
- (9
3,00
0)
- (9
3,00
0)a
llow
ance
for
imp
airm
ent
loss
on
oth
er r
ecei
vab
les
(not
e 30
)
(1,9
45)
- -
- -
(27)
-
- -
- (1
,972
) -
(1,9
72)
Writ
e b
ack
of i
mp
airm
ent
loss
on
tak
aful
rec
eiva
ble
s (n
ote
30)
-
- -
- -
827
- -
- -
827
- 82
7o
ther
exp
ense
s
(25,
429)
-
(6,5
77)
- -
(44,
734)
(4
7,27
4)
(89,
017)
(2
,326
) (3
37)
(215
,694
) 92
,008
(1
23,6
86)
Dep
reci
atio
n (n
ote
30)
(7
28)
- (9
8)
- -
- -
(1,2
83)
(2)
(4)
(2,1
15)
- (2
,115
)a
mor
tisat
ion
(not
e 30
)
(71)
-
(8)
- -
- -
(631
) (7
) (6
) (7
23)
- (7
23)
(l
oss)
/pro
fit b
y se
gmen
ts
(2
1,92
4)
281,
375
(55)
-
- 2,
153
3,79
4 1,
133
(2,0
65)
(205
) 26
4,20
6 -
264,
206
ta
x (e
xpen
ses)
/inco
me
attr
ibut
able
to
par
ticip
ants
- -
- -
- (2
,153
) 77
3 -
- -
(1,3
80)
- (1
,380
)
(21,
924)
28
1,37
5 (5
5)
- -
- 4,
567
1,13
3 (2
,065
) (2
05)
262,
826
- 26
2,82
6
Sha
re o
f pro
fit o
f ass
ocia
tes
-
- -
1,51
9 3,
209
- -
- -
- 4,
728
- 4,
728
(l
oss)
/pro
fit b
efor
e ta
xatio
n
(21,
924)
28
1,37
5 (5
5)
1,51
9 3,
209
- 4,
567
1,13
3 (2
,065
) (2
05)
267,
554
- 26
7,55
4

174
NOTES TO THE FINANCIAL STATEMENTS31 DECEMBER 2016(continued)
MAA GROUP BERHAD annual report 2016
39
SE
GM
EN
TAL
INFO
RM
AT
ION
(con
tinue
d)
Fi
nanc
ial y
ear
end
ed 3
1 D
ecem
ber
201
5
R
etai
l
mo
rtg
age
le
ndin
g
and
loan
In
ter-
Ed
ucat
ion
secu
riti
- G
ener
al
O
ther
seg
men
t
In
vest
men
t ho
ldin
gs
serv
ices
sa
tio
n in
sura
nce
Ta
kafu
l se
gm
ents
To
tal
elim
inat
ion
G
roup
G
ener
al
Fam
ily
Sha
re
ta
kafu
l ta
kafu
l ho
lder
s’
fund
fu
nd
fund
C
ont
i-
Dis
cont
i-
D
isco
nti-
D
isco
nti-
D
isco
nti-
C
ont
i-
Dis
cont
i-
nu
ing
nu
ed
nu
ed
nued
nu
ed
nuin
g
nued
R
M’0
00
RM
’000
R
M’0
00
RM
’000
R
M’0
00
RM
’000
R
M’0
00
RM
’000
R
M’0
00
RM
’000
R
M’0
00
RM
’000
R
M’0
00
ext
erna
l rev
enue
9,53
2 -
6,80
4 -
165
283,
138
261,
976
3,86
6 16
0 41
7 56
6,05
8 -
566,
058
n
et e
arne
d p
rem
ium
s/co
ntrib
utio
ns
(n
ote
22)
-
- -
- 1
97,6
74
236,
683
- -
- 33
4,35
8 -
334,
358
Inte
rest
/pro
fit in
com
e (n
ote
23)
9,
304
- 6
- 16
4 5,
708
8,52
6 3,
965
64
148
27,8
85
- 27
,885
Writ
e b
ack
of im
pai
rmen
t lo
ss o
n l
oans
from
leas
ing,
hire
pur
chas
e a
nd o
ther
s –
net
(not
e 28
)
- -
- -
- -
- -
92
- 92
-
92o
ther
rev
enue
51,0
85
- 6,
815
- 25
9 39
,564
19
,131
18
1,70
8 2,
437
269
301,
268
(179
,461
) 12
1,80
7n
et in
sura
nce/
taka
ful b
enefi
ts a
nd c
laim
s (n
ote
29)
-
- -
- 2,
004
(69,
194)
(1
65,9
14)
- -
- (2
33,1
04)
- (2
33,1
04)
(allo
wan
ce fo
r)/w
rite
bac
k of
im
pai
rmen
t lo
ss o
n ot
her
rec
eiva
ble
s (n
ote
30)
(8
,637
) -
- -
- (2
1)
- -
206
- (8
,452
) -
(8,4
52)
Writ
e b
ack
of im
pai
rmen
t lo
ss o
n i
nsur
ance
/tak
aful
rec
eiva
ble
s (n
ote
30)
-
- -
- -
4,66
4 1,
500
- -
- 6,
164
- 6,
164
oth
er e
xpen
ses
(2
6,49
6)
- (6
,066
) -
(1,7
24)
(76,
874)
(1
02,5
87)
(174
,437
) (1
,537
) (1
,750
) (3
91,4
71)
179,
461
(212
,010
)D
epre
ciat
ion
(not
e 30
)
(763
) -
(55)
-
(29)
-
- (2
,488
) (6
) (1
4)
(3,3
55)
- (3
,355
)a
mor
tisat
ion
(not
e 30
)
(71)
-
(9)
- -
- -
(1,3
64)
(5)
(24)
(1
,473
) -
(1,4
73)
p
rofit
/(lo
ss) b
y se
gmen
ts
24
,422
-
691
- 67
5 1,
521
(2,6
61)
7,38
4 1,
251
(1,3
71)
31,9
12
- 31
,912
Z
akat
- -
- -
- -
- (7
2)
- -
(72)
-
(72)
ta
x ex
pen
ses
attr
ibut
able
to
par
ticip
ants
- -
- -
- (9
70)
(2,0
34)
- -
- (3
,004
) -
(3,0
04)
24
,422
-
691
- 67
5 55
1 (4
,695
) 7,
312
1,25
1 (1
,371
) 28
,836
-
28,8
36
Sha
re o
f pro
fit o
f ass
ocia
tes
-
- -
1,31
1 2,
479
- -
- -
- 3,
790
- 3,
790
p
rofit
/(lo
ss) b
efor
e ta
xatio
n
24,4
22
- 69
1 1,
311
3,15
4 55
1 (4
,695
) 7,
312
1,25
1 (1
,371
) 32
,626
-
32,6
26

175
NOTES TO THE FINANCIAL STATEMENTS31 DECEMBER 2016
(continued)
annual report 2016 MAA GROUP BERHAD
39 SEGMENTAL INFORMATION (continued)
Investment Education Other holdings services Takaful segments Group
General Family Share takaful takaful holders’ fund fund fund
Disconti- Disconti- Disconti- nued nued nued
RM’000 RM’000 RM’000 RM’000 RM’000 RM’000 RM’000 31 December 2016 Segment assets 485,532 1,564 - - - 5,344 492,440 associates * 71,692 - - - - - 71,692 total assets 557,224 1,564 - - - 5,344 564,132 31 December 2015 Segment assets 267,169 1,805 483,239 482,982 136,705 11,083 1,382,983 associates * 67,954 - - - - - 67,954 total assets 335,123 1,805 483,239 482,982 136,705 11,083 1,450,937
* operating segments engaged in general insurance, retail mortgage lending and loan securitisation activities
Geographical segments
the Group operates mainly in Malaysia. In determining the geographical segments of the Group, revenues and non-current assets are based on the geographical location of assets.
External revenue Non-current assets
31.12.2016 31.12.2015 31.12.2016 31.12.2015
RM’000 RM’000 RM’000 RM’000
Malaysia
- Continuing operations 18,051 16,404 276,425 18,166
- Discontinued operations 279,379 549,397 - -
297,430 565,801 276,425 18,166
Indonesia - 165 11,122 9,687
london - - 8,702 9,669
others 8 92 - -
297,438 566,058 296,249 37,522

176
NOTES TO THE FINANCIAL STATEMENTS31 DECEMBER 2016(continued)
MAA GROUP BERHAD annual report 2016
40 CAPITAL MANAGEMENT
the Group’s capital management underlying objective is to manage capital and to allocate funds and capital efficiently for business growth taking into account the associated business risks to meet regulatory requirements, obligations to policyholders and the expectation of stakeholders.
the Company manages the capital of the Group to ensure that source of capital and the related costs meet the overall objectives of the capital plan. excess capital generated from profits at the subsidiary level exceeding planned requirements is returned to the Company in the form of dividends under the Group’s capital management plan.
the Group and the Company’s capital comprised initial ordinary share capital and retained earnings. the Group and the Company do not have any borrowings as at 31 December 2016.
41 RISK MANAGEMENT FRAMEWORK
Risk Governance Structure
the Group’s risk governance structure and risk reporting requirement is incorporated in the Group’s enterprise risk Management (“erM”) Framework. the Framework explains the underlying approach and defines an on-going and consistent process for identifying, analysing, evaluating, monitoring, reporting and managing significant risks faced by the business units in the Group. It also outlines the key aspects of the risks management process and identifies the main reporting procedures.
the Board through the Group risk Management Committee is ultimately responsible for effective risk oversight and the framework within the Group. the Group risk Management Committee determines the remit, roles, resources and structure for risk management functions to operate effectively and efficiently and is supported by the Group audit and risk Department. as for the operation in philippines and australia, the risk management function is supported by their own internal team who report directly to their respective risk Management Committees, and indirectly to the Group risk Management Committee.
the Group erM Framework is premised with three lines of defence that serves as the guiding principles within the Group:
1. the first line of defense is the Business units who are primarily responsible for identifying, evaluating and managing risks within their units. the Head of Business units are responsible to implement and execute appropriate risk mitigation action plan on a timely manner. the Business units are responsible to ensure the execution of appropriate risk reduction action plans on a timely manner. priority is accorded to mitigate high and significant risks in order to ensure that their day-to-day business activities are carried out within acceptable risk level.
2. the second line of defense is the Group audit and risk Department that provides independent oversight of the risk management activities of the first line of defense. the responsibilities of the second line functions typically include participating in risk management meetings, reviewing risk reports and validating compliance to the risk management framework requirements, with the objective of ensuring that risks are actively and appropriately managed.
3. the third line of defense is the internal auditors who report independently to the audit Committee of the Board. the internal auditors review the first and second line of defense activities and results to ensure that the erM arrangements and structures are appropriate and are discharging their roles and responsibilities completely and accurately.
the Group has also established management committees to act as a platform for two-way communication between the Management and the Board. the two management committees are executive Committee and Business Committee. these committees are responsible for overseeing the development and assessing the effectiveness of risk management policies, reviewing risk exposure and portfolio compositions and ensuring that infrastructure, resources and systems are put in place for effective risk management activities.
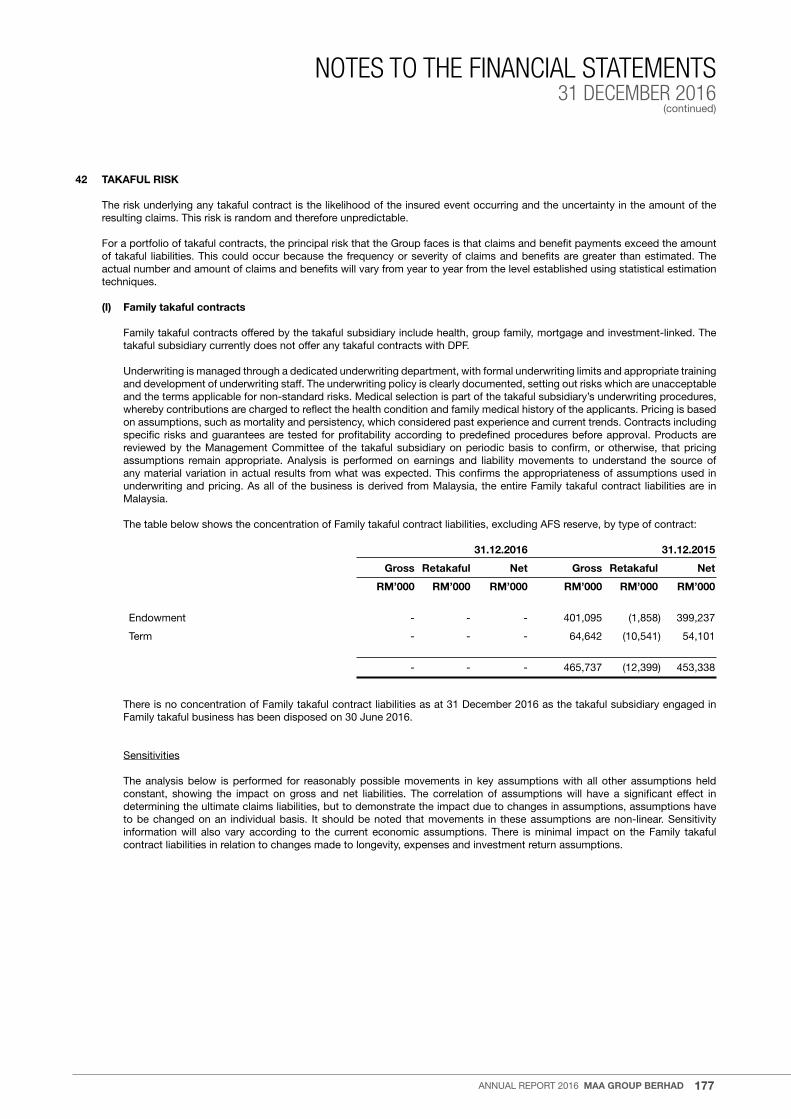
177
NOTES TO THE FINANCIAL STATEMENTS31 DECEMBER 2016
(continued)
annual report 2016 MAA GROUP BERHAD
42 TAKAFUL RISK
the risk underlying any takaful contract is the likelihood of the insured event occurring and the uncertainty in the amount of the resulting claims. this risk is random and therefore unpredictable.
For a portfolio of takaful contracts, the principal risk that the Group faces is that claims and benefit payments exceed the amount of takaful liabilities. this could occur because the frequency or severity of claims and benefits are greater than estimated. the actual number and amount of claims and benefits will vary from year to year from the level established using statistical estimation techniques.
(I) Family takaful contracts
Family takaful contracts offered by the takaful subsidiary include health, group family, mortgage and investment-linked. the takaful subsidiary currently does not offer any takaful contracts with DpF.
underwriting is managed through a dedicated underwriting department, with formal underwriting limits and appropriate training and development of underwriting staff. the underwriting policy is clearly documented, setting out risks which are unacceptable and the terms applicable for non-standard risks. Medical selection is part of the takaful subsidiary’s underwriting procedures, whereby contributions are charged to reflect the health condition and family medical history of the applicants. pricing is based on assumptions, such as mortality and persistency, which considered past experience and current trends. Contracts including specific risks and guarantees are tested for profitability according to predefined procedures before approval. products are reviewed by the Management Committee of the takaful subsidiary on periodic basis to confirm, or otherwise, that pricing assumptions remain appropriate. analysis is performed on earnings and liability movements to understand the source of any material variation in actual results from what was expected. this confirms the appropriateness of assumptions used in underwriting and pricing. as all of the business is derived from Malaysia, the entire Family takaful contract liabilities are in Malaysia.
the table below shows the concentration of Family takaful contract liabilities, excluding aFS reserve, by type of contract:
31.12.2016 31.12.2015
Gross Retakaful Net Gross Retakaful Net
RM’000 RM’000 RM’000 RM’000 RM’000 RM’000
endowment - - - 401,095 (1,858) 399,237
term - - - 64,642 (10,541) 54,101
- - - 465,737 (12,399) 453,338
there is no concentration of Family takaful contract liabilities as at 31 December 2016 as the takaful subsidiary engaged in Family takaful business has been disposed on 30 June 2016.
Sensitivities
the analysis below is performed for reasonably possible movements in key assumptions with all other assumptions held constant, showing the impact on gross and net liabilities. the correlation of assumptions will have a significant effect in determining the ultimate claims liabilities, but to demonstrate the impact due to changes in assumptions, assumptions have to be changed on an individual basis. It should be noted that movements in these assumptions are non-linear. Sensitivity information will also vary according to the current economic assumptions. there is minimal impact on the Family takaful contract liabilities in relation to changes made to longevity, expenses and investment return assumptions.
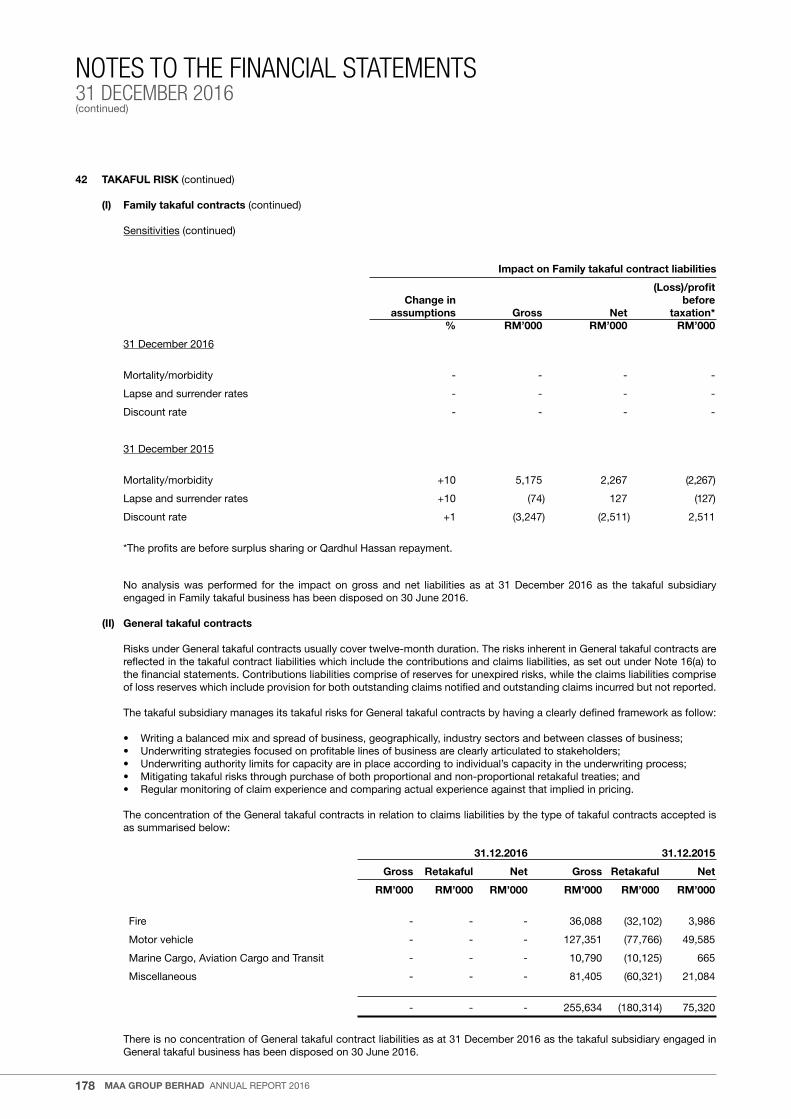
178
NOTES TO THE FINANCIAL STATEMENTS31 DECEMBER 2016(continued)
MAA GROUP BERHAD annual report 2016
42 TAKAFUL RISK (continued)
(I) Family takaful contracts (continued)
Sensitivities (continued)
Impact on Family takaful contract liabilities
(Loss)/profit Change in before assumptions Gross Net taxation* % RM’000 RM’000 RM’000
31 December 2016
Mortality/morbidity - - - -
lapse and surrender rates - - - -
Discount rate - - - -
31 December 2015
Mortality/morbidity +10 5,175 2,267 (2,267)
lapse and surrender rates +10 (74) 127 (127)
Discount rate +1 (3,247) (2,511) 2,511
*the profits are before surplus sharing or Qardhul Hassan repayment.
no analysis was performed for the impact on gross and net liabilities as at 31 December 2016 as the takaful subsidiary engaged in Family takaful business has been disposed on 30 June 2016.
(II) General takaful contracts
risks under General takaful contracts usually cover twelve-month duration. the risks inherent in General takaful contracts are reflected in the takaful contract liabilities which include the contributions and claims liabilities, as set out under note 16(a) to the financial statements. Contributions liabilities comprise of reserves for unexpired risks, while the claims liabilities comprise of loss reserves which include provision for both outstanding claims notified and outstanding claims incurred but not reported.
the takaful subsidiary manages its takaful risks for General takaful contracts by having a clearly defined framework as follow:
• Writing a balanced mix and spread of business, geographically, industry sectors and between classes of business;• underwriting strategies focused on profitable lines of business are clearly articulated to stakeholders; • underwriting authority limits for capacity are in place according to individual’s capacity in the underwriting process;• Mitigating takaful risks through purchase of both proportional and non-proportional retakaful treaties; and• regular monitoring of claim experience and comparing actual experience against that implied in pricing.
the concentration of the General takaful contracts in relation to claims liabilities by the type of takaful contracts accepted is as summarised below:
31.12.2016 31.12.2015
Gross Retakaful Net Gross Retakaful Net
RM’000 RM’000 RM’000 RM’000 RM’000 RM’000
Fire - - - 36,088 (32,102) 3,986
Motor vehicle - - - 127,351 (77,766) 49,585
Marine Cargo, aviation Cargo and transit - - - 10,790 (10,125) 665
Miscellaneous - - - 81,405 (60,321) 21,084
- - - 255,634 (180,314) 75,320
there is no concentration of General takaful contract liabilities as at 31 December 2016 as the takaful subsidiary engaged in General takaful business has been disposed on 30 June 2016.
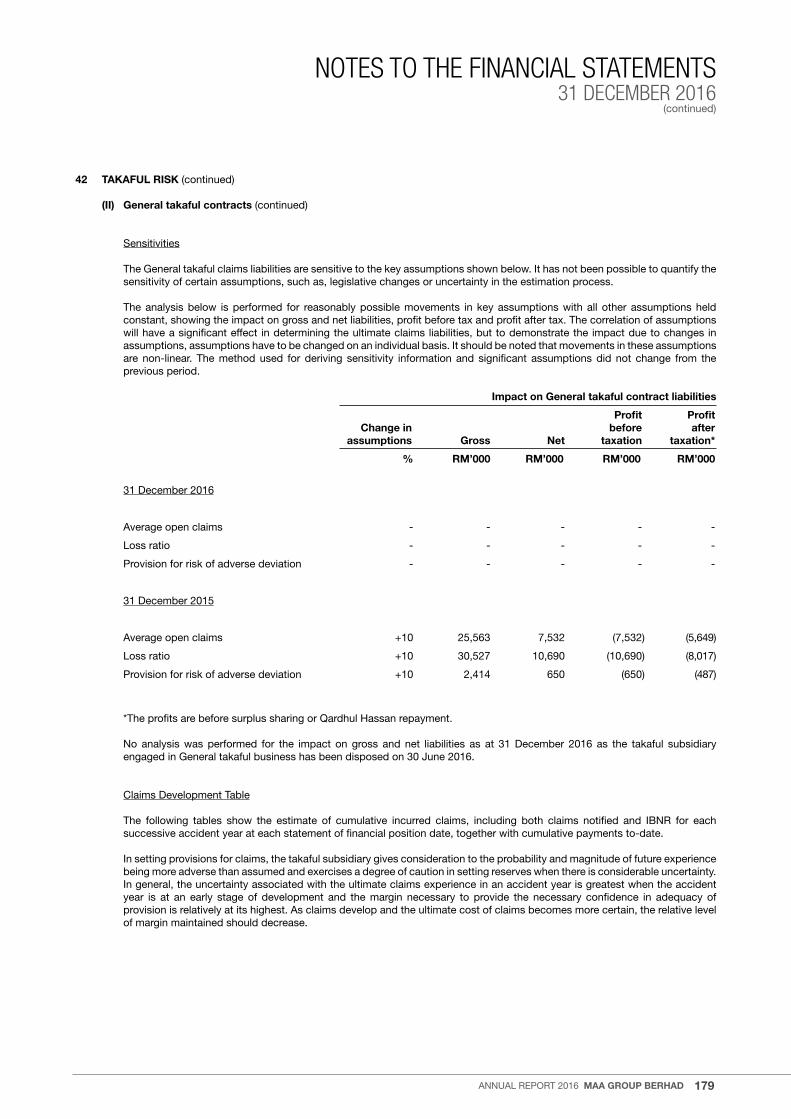
179
NOTES TO THE FINANCIAL STATEMENTS31 DECEMBER 2016
(continued)
annual report 2016 MAA GROUP BERHAD
42 TAKAFUL RISK (continued)
(II) General takaful contracts (continued)
Sensitivities
the General takaful claims liabilities are sensitive to the key assumptions shown below. It has not been possible to quantify the sensitivity of certain assumptions, such as, legislative changes or uncertainty in the estimation process.
the analysis below is performed for reasonably possible movements in key assumptions with all other assumptions held constant, showing the impact on gross and net liabilities, profit before tax and profit after tax. the correlation of assumptions will have a significant effect in determining the ultimate claims liabilities, but to demonstrate the impact due to changes in assumptions, assumptions have to be changed on an individual basis. It should be noted that movements in these assumptions are non-linear. the method used for deriving sensitivity information and significant assumptions did not change from the previous period.
Impact on General takaful contract liabilities
Profit Profit Change in before after assumptions Gross Net taxation taxation*
% RM’000 RM’000 RM’000 RM’000
31 December 2016
average open claims - - - - -
loss ratio - - - - -
provision for risk of adverse deviation - - - - -
31 December 2015
average open claims +10 25,563 7,532 (7,532) (5,649)
loss ratio +10 30,527 10,690 (10,690) (8,017)
provision for risk of adverse deviation +10 2,414 650 (650) (487)
*the profits are before surplus sharing or Qardhul Hassan repayment.
no analysis was performed for the impact on gross and net liabilities as at 31 December 2016 as the takaful subsidiary engaged in General takaful business has been disposed on 30 June 2016.
Claims Development table
the following tables show the estimate of cumulative incurred claims, including both claims notified and IBnr for each successive accident year at each statement of financial position date, together with cumulative payments to-date.
In setting provisions for claims, the takaful subsidiary gives consideration to the probability and magnitude of future experience being more adverse than assumed and exercises a degree of caution in setting reserves when there is considerable uncertainty. In general, the uncertainty associated with the ultimate claims experience in an accident year is greatest when the accident year is at an early stage of development and the margin necessary to provide the necessary confidence in adequacy of provision is relatively at its highest. as claims develop and the ultimate cost of claims becomes more certain, the relative level of margin maintained should decrease.

180
NOTES TO THE FINANCIAL STATEMENTS31 DECEMBER 2016(continued)
MAA GROUP BERHAD annual report 2016
42 TAKAFUL RISK (continued)
(II) General takaful contracts (continued)
Claims Development table (continued)
Gross General takaful Contract liabilities for 2015
2008 2009 2010 2011 2012 2013 2014 2015 Total
RM’000 RM’000 RM’000 RM’000 RM’000 RM’000 RM’000 RM’000 RM’000
accident year
at end of accident year 6,816 24,168 54,138 57,359 75,801 122,510 173,322 153,400
one year later 4,592 20,220 58,202 55,296 73,172 113,516 150,108 -
two years later 3,714 16,567 52,314 52,335 71,157 108,045 - -
three years later 3,214 13,865 49,989 49,023 72,160 - - -
Four years later 3,249 13,352 49,702 49,894 - - - -
Five years later 3,203 13,360 49,515 - - - - -
Six years later 3,179 12,977 - - - - - -
Seven years later 3,129 - - - - - - -
Current estimate of cumulative claims incurred 3,129 12,977 49,515 49,894 72,160 108,045 150,108 153,400
at end of accident year (1,100) (4,021) (10,114) (12,429) (18,204) (33,270) (40,158) (43,447)
one year later (2,807) (9,177) (29,052) (34,709) (45,537) (67,240) (93,627) -
two years later (3,035) (10,278) (35,595) (39,689) (51,451) (85,084) - -
three years later (3,076) (12,049) (37,091) (43,152) (56,490) - - -
Four years later (3,089) (12,107) (39,485) (44,206) - - - -
Five years later (3,092) (12,339) (39,916) - - - - -
Six years later (3,092) (12,377) - - - - - -
Seven years later (3,091) - - - - - - -
Cumulative payments to-date (3,091) (12,377) (39,916) (44,206) (56,490) (85,084) (93,627) (43,447)
Gross General takaful contract liabilities 38 600 9,599 5,688 15,670 22,961 56,481 109,953 220,990
provision for risk of adverse deviation 23,008
pipeline business 11,636
Gross General takaful contract liabilities 255,634

181
NOTES TO THE FINANCIAL STATEMENTS31 DECEMBER 2016
(continued)
annual report 2016 MAA GROUP BERHAD
42 TAKAFUL RISK (continued)
(II) General takaful contracts (continued)
Claims Development table (continued)
net General takaful Contract liabilities for 2015
2008 2009 2010 2011 2012 2013 2014 2015 Total
RM’000 RM’000 RM’000 RM’000 RM’000 RM’000 RM’000 RM’000 RM’000
accident year
at end of accident year 1,640 5,655 25,190 17,488 17,662 28,156 35,176 60,770
one year later 1,642 6,165 24,835 15,510 17,635 25,865 35,319 -
two years later 1,370 5,340 23,500 14,818 16,905 26,826 - -
three years later 1,198 5,206 22,573 14,495 16,821 - - -
Four years later 1,230 5,040 22,407 14,467 - - - -
Five years later 1,213 4,989 22,233 - - - - -
Six years later 1,202 4,775 - - - - - -
Seven years later 1,195 - - - - - - -
Current estimate of cumulative claims incurred 1,195 4,775 22,233 14,467 16,821 26,826 35,319 60,770
at end of accident year (339) (1,548) (5,284) (4,927) (5,573) (9,537) (10,443) (19,313)
one year later (1,032) (3,831) (14,461) (11,260) (12,654) (18,208) (23,279) -
two years later (1,169) (4,285) (18,328) (12,480) (14,142) (22,095) - -
three years later (1,182) (4,511) (19,342) (12,846) (14,936) - - -
Four years later (1,186) (4,587) (19,571) (13,116) - - - -
Five years later (1,187) (4,599) (19,637) - - - - -
Six years later (1,187) (4,600) - - - - - -
Seven years later (1,187) - - - - - - -
Cumulative payments to-date (1,187) (4,600) (19,637) (13,116) (14,936) (22,095) (23,279) (19,313)
net General takaful contract liabilities 8 175 2,596 1,351 1,885 4,731 12,040 41,457 64,243
provision for risk of adverse deviation 6,005
pipeline business 5,072
net General takaful contract liabilities 75,320
there is no estimate of estimate of cumulative incurred claims, including both claims notified and IBnr by accident year as at 31 December 2016 as the takaful subsidiary engaged in General takaful business has been disposed on 30 June 2016.
182
NOTES TO THE FINANCIAL STATEMENTS31 DECEMBER 2016(continued)
MAA GROUP BERHAD annual report 2016
43 FINANCIAL RISK
the Group is exposed to a range of financial risks through its assets, financial liabilities and takaful liabilities. In particular, the key financial risk is that in the long term the operating profits and investment returns are not sufficient to fund the obligations arising from the takaful contracts. the most important components of the financial risk are credit risk, liquidity risk, market risk which comprise of currency risk, interest/profit rate risk and price risk.
the Group manages these positions within the risk management policies of the takaful subsidiary to achieve long term investment returns in excess its obligations under the takaful contracts. the key principles of the policies are to match assets to the liabilities by reference to the type of benefits payable to contract holders. For each distinct class of liabilities, a separate portfolio of assets is maintained and monitored. the Group has not changed the processes used to manage its risks from previous periods.
the Group’s risk management policies are integrated with the management of the financial risks associated with the Group’s other classes of financial assets and liabilities not directly associated with takaful liabilities. the note below explains how financial risks are managed by the Group. In particular, the risk management policies require the management of interest/profit rate risk, equity price risk and liquidity risk at the portfolio level. Credit risk is managed on a group-wide basis. the following notes are in relation to the Group’s management disclosure with respect to credit risk, liquidity risk, interest/profit rate risk, and price risk.
Credit Risk
the Group has exposure in credit risk, which is the risk that one party to a financial instrument will cause a financial loss to the other party by failing to discharge an obligation. the Group is exposed to credit risk through (i) investments in cash and corporate and Islamic debt securities and (ii) receivables including takaful receivables and retakaful assets. For investments in corporate and Islamic debt securities, a downgrade of credit rating or widening of credit spread may also incur financial loss. the retakaful share of unearned contribution reserves in relation to the General takaful fund and Qardhul Hassan are not financial instruments and hence are not exposed to credit risk.
retakaful is used to manage takaful risk. this does not, however, discharge the Group’s liability as primary takaful operator. If a participant retakaful operator fails to pay a claim for any reason, the Group remains liable for the payment to the participants. the creditworthiness of retakaful operators is considered on an annual basis by reviewing their financial strength prior to finalisation of any contract.
the Group issues investment-linked investment contracts. In the investment-linked business, the holders of these contracts bear the investment risks on the assets held in the investment-linked funds as the contract benefits are directly linked to the value of the assets in the fund. therefore, the Group has no material credit risk on unit-linked financial assets.
Debtor recoverability and risk concentration monitoring are part of credit risk management which is reviewed regularly. the management monitors the market value of the collateral, requests additional collateral when needed and performs an impairment valuation. allowance of doubtful debts/specific provision in made on those securities/loans (or part of remaining amount) where the level of security has been impaired.
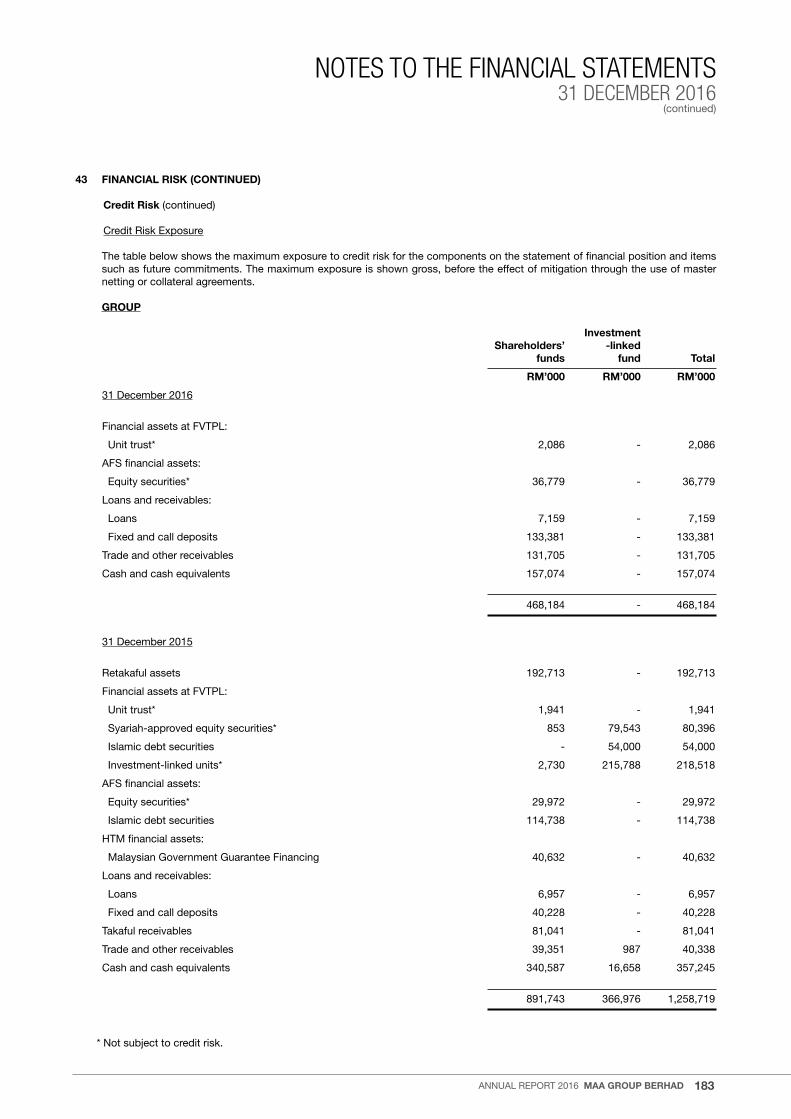
183
NOTES TO THE FINANCIAL STATEMENTS31 DECEMBER 2016
(continued)
annual report 2016 MAA GROUP BERHAD
43 FINANCIAL RISK (CONTINUED)
Credit Risk (continued)
Credit risk exposure
the table below shows the maximum exposure to credit risk for the components on the statement of financial position and items such as future commitments. the maximum exposure is shown gross, before the effect of mitigation through the use of master netting or collateral agreements.
GROUP
Investment Shareholders’ -linked funds fund Total
RM’000 RM’000 RM’000
31 December 2016
Financial assets at FVtpl:
unit trust* 2,086 - 2,086
aFS financial assets:
equity securities* 36,779 - 36,779
loans and receivables:
loans 7,159 - 7,159
Fixed and call deposits 133,381 - 133,381
trade and other receivables 131,705 - 131,705
Cash and cash equivalents 157,074 - 157,074
468,184 - 468,184
31 December 2015
retakaful assets 192,713 - 192,713
Financial assets at FVtpl:
unit trust* 1,941 - 1,941
Syariah-approved equity securities* 853 79,543 80,396
Islamic debt securities - 54,000 54,000
Investment-linked units* 2,730 215,788 218,518
aFS financial assets:
equity securities* 29,972 - 29,972
Islamic debt securities 114,738 - 114,738
HtM financial assets:
Malaysian Government Guarantee Financing 40,632 - 40,632
loans and receivables:
loans 6,957 - 6,957
Fixed and call deposits 40,228 - 40,228
takaful receivables 81,041 - 81,041
trade and other receivables 39,351 987 40,338
Cash and cash equivalents 340,587 16,658 357,245
891,743 366,976 1,258,719
* not subject to credit risk.
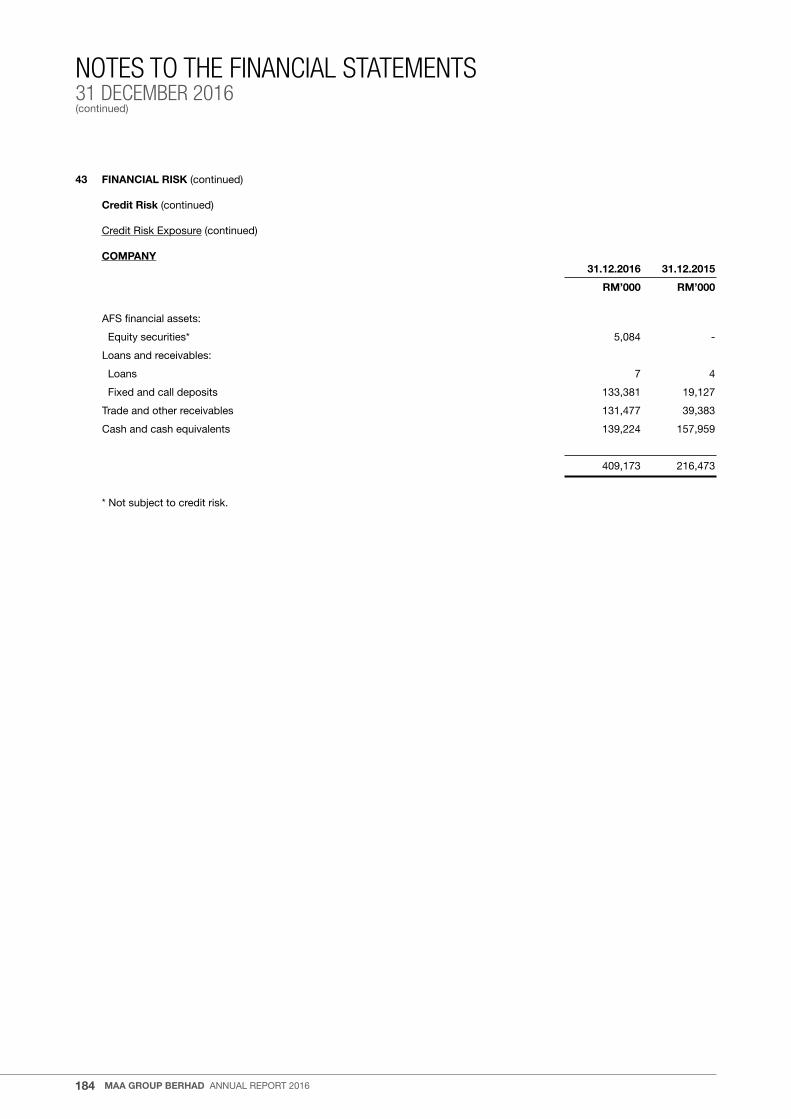
184
NOTES TO THE FINANCIAL STATEMENTS31 DECEMBER 2016(continued)
MAA GROUP BERHAD annual report 2016
43 FINANCIAL RISK (continued)
Credit Risk (continued)
Credit risk exposure (continued)
COMPANY 31.12.2016 31.12.2015
RM’000 RM’000
aFS financial assets:
equity securities* 5,084 -
loans and receivables:
loans 7 4
Fixed and call deposits 133,381 19,127
trade and other receivables 131,477 39,383
Cash and cash equivalents 139,224 157,959
409,173 216,473
* not subject to credit risk.

185
NOTES TO THE FINANCIAL STATEMENTS31 DECEMBER 2016
(continued)
annual report 2016 MAA GROUP BERHAD
43
FIN
AN
CIA
L R
ISK
(con
tinue
d)
C
red
it R
isk
(con
tinue
d)
C
red
it r
isk
exp
osur
e b
y C
red
it r
atin
g
th
e ta
ble
bel
ow p
rovi
des
info
rmat
ion
rega
rdin
g th
e cr
edit
risk
exp
osur
e of
the
Gro
up b
y cl
assi
fyin
g as
sets
acc
ord
ing
to th
e G
roup
’s c
red
it ra
ting
of c
ount
erp
artie
s. a
aa
is th
e hi
ghes
t pos
sib
le
ratin
g. a
sset
s th
at a
ll ou
tsid
e th
e ra
nge
of a
aa
to
BB
B a
re c
lass
ified
as
spec
ulat
ive
grad
e.
GR
OU
P
Nei
ther
pas
t-d
ue n
or
imp
aire
d
N
ot
P
ast
due
P
ast
due
sub
ject
to
In
vest
men
t-
but
no
t an
d
A
AA
A
A
A
BB
B
No
t ra
ted
cr
edit
ris
k lin
ked
fun
d
imp
aire
d
imp
aire
d
Tota
l
R
M’0
00
RM
’000
R
M’0
00
RM
’000
R
M’0
00
RM
’000
R
M’0
00
RM
’000
R
M’0
00
RM
’000
31 D
ecem
ber
201
6
Fina
ncia
l ass
ets
at F
Vtp
l:
u
nit
trus
t
- -
- -
- 2,
086
- -
- 2,
086
aFS
fina
ncia
l ass
ets:
e
qui
ty s
ecur
ities
- -
- -
- 36
,779
-
- -
36,7
79lo
ans
and
rec
eiva
ble
s:
loan
s
- -
- -
7,15
9 -
- -
20,9
05
28,0
64
Fixe
d a
nd c
all d
epos
its
13
3,38
1 -
- -
- -
- -
- 13
3,38
1tr
ade
and
oth
er r
ecei
vab
les
- 87
,950
-
- 43
,755
-
- -
30,0
38
161,
743
Cas
h an
d c
ash
equi
vale
nts
61
,029
96
,003
-
- 42
-
- -
- 15
7,07
4a
llow
ance
for
imp
airm
ent
loss
-
- -
- -
- -
- (5
0,94
3)
(50,
943)
19
4,41
0 18
3,95
3 -
- 50
,956
38
,865
-
- -
468,
184

186
NOTES TO THE FINANCIAL STATEMENTS31 DECEMBER 2016(continued)
MAA GROUP BERHAD annual report 2016
43
FIN
AN
CIA
L R
ISK
(con
tinue
d)
C
red
it R
isk
(con
tinue
d)
C
red
it r
isk
exp
osur
e b
y C
red
it r
atin
g (c
ontin
ued
)
G
RO
UP
Nei
ther
pas
t-d
ue n
or
imp
aire
d
N
ot
P
ast
due
P
ast
due
sub
ject
to
In
vest
men
t-
but
no
t an
d
A
AA
A
A
A
BB
B
No
t ra
ted
cr
edit
ris
k lin
ked
fun
d
imp
aire
d
imp
aire
d
Tota
l
R
M’0
00
RM
’000
R
M’0
00
RM
’000
R
M’0
00
RM
’000
R
M’0
00
RM
’000
R
M’0
00
RM
’000
31 D
ecem
ber
201
5
ret
akaf
ul a
sset
s
- 54
,755
76
,832
18
,576
42
,550
-
- -
- 19
2,71
3Fi
nanc
ial a
sset
s at
FV
tpl:
u
nit
trus
t
- -
- -
- 1,
941
- -
- 1,
941
Sya
riah-
app
rove
d e
qui
ty s
ecur
ities
-
- -
- -
853
79,5
43
- -
80,3
96 I
slam
ic d
ebt
secu
ritie
s
- -
- -
- -
54,0
00
- -
54,0
00 I
nves
tmen
t-lin
ked
uni
ts
-
- -
- -
2,73
0 21
5,78
8 -
- 21
8,51
8a
FS fi
nanc
ial a
sset
s:
e
qui
ty s
ecur
ities
- -
- -
- 29
,972
-
- -
29,9
72 I
slam
ic d
ebt
secu
ritie
s
34,8
89
74,8
52
- -
4,99
7 -
- -
- 11
4,73
8H
tM fi
nanc
ial a
sset
s:
M
alay
sian
Gov
ernm
ent
Gua
rant
ee F
inan
cing
- -
- -
40,6
32
- -
- -
40,6
32lo
ans
and
rec
eiva
ble
s:
l
oans
- -
- -
6,95
7 -
- -
24,4
64
31,4
21 F
ixed
and
cal
l dep
osits
22,0
72
13,1
19
5,03
7 -
- -
- -
- 40
,228
taka
ful r
ecei
vab
les
48
8 3,
281
5,52
4 29
1 45
,849
-
- 25
,608
8,
693
89,7
34tr
ade
and
oth
er r
ecei
vab
les
- -
- -
39,3
51
- 98
7 -
28,6
69
69,0
07C
ash
and
cas
h eq
uiva
lent
s
186,
357
145,
618
8,52
3 -
89
- 16
,658
-
- 35
7,24
5a
llow
ance
for
imp
airm
ent
loss
-
- -
- -
- -
- (6
1,82
6)
(61,
826)
24
3,80
6 29
1,62
5 95
,916
18
,867
18
0,42
5 35
,496
36
6,97
6 25
,608
-
1,25
8,71
9

187
NOTES TO THE FINANCIAL STATEMENTS31 DECEMBER 2016
(continued)
annual report 2016 MAA GROUP BERHAD
43 FINANCIAL RISK (continued)
Credit Risk (continued)
Credit risk exposure by Credit rating (continued)
the table below provides information regarding the credit risk exposure of the Company by classifying assets according to the Company’s credit rating of counterparties.
COMPANY
Neither past-due nor impaired Not subject AAA to AA A Not rated to credit risk Total
RM’000 RM’000 RM’000 RM’000 RM’00031 December 2016 aFS financial assets: equity securities - - - 5,084 5,084loan and receivables: loans - - 7 - 7 Fixed and call deposits 133,381 - - - 133,381trade and other receivables 87,950 - 43,527 - 131,477Cash and cash equivalents 139,221 - 3 - 139,224 360,552 - 43,537 5,084 409,173 31 December 2015 loan and receivables: loans - - 4 - 4 Fixed and call deposits 19,127 - - - 19,127trade and other receivables - - 39,383 - 39,383Cash and cash equivalents 157,956 - 3 - 157,959 177,083 - 39,390 - 216,473
aged analysis of financial assets past due but not impaired
GROUP > 60 days > 120 days Total
RM’000 RM’000 RM’000
31 December 2016 takaful receivables - - -
31 December 2015
takaful receivables 23,559 2,049 25,608
there is no aged analysis of financial assets past due but not impaired as at 31 December 2016 as the takaful subsidiary has been
disposed on 30 June 2016.
For assets to be classified as “past-due and impaired”, contractual payments must be in arrears for more than six (6) months for loans, and more than 90 days for takaful receivables. In addition, full impairment was made on outstanding debts exceeding twelve months, outstanding debts with terminated status, closed accounts, commuted, winding-up under legal action, accounts written off or those served with letters of demand. this applies similarly to retakaful assets, particularly retakaful recoverable on outstanding claims. Collateral are held as securities for certain past due or impaired assets. the Group records impairment allowance for takaful receivables and loans and receivables in separate allowance for impairment accounts.

188
NOTES TO THE FINANCIAL STATEMENTS31 DECEMBER 2016(continued)
MAA GROUP BERHAD annual report 2016
43 FINANCIAL RISK (continued)
Liquidity Risk
liquidity risk is the risk that the Group is unable to meet its financial obligations when due. this situation arises when the Group is unable to convert its financial assets into cash when needed. Demands for funds can usually be met through on going normal operations, contributions received, sale of assets or borrowings through committed credit facilities from bankers. unexpected demands for liquidity may be triggered by negative publicity, deterioration of the economy, reports of problems in other companies in the same or similar lines of business, unanticipated policy claims, unexpected high levels of policies lapses/surrenders, or other unexpected cash demands from policyholders.
expected liquidity demands are managed through a combination of treasury, investment and asset-liability management practices, which are monitored on an ongoing basis. actual and projected cash inflows and outflows are monitored and an adequate cushion in the form of cash and very liquid investments are maintained at all times. the projected cash flows from the in-force takaful contract liabilities consist of renewal contributions, commissions, claims, maturities and surrenders. renewal contributions, commissions, claims and maturities are generally stable and predictable. Surrenders can be more uncertain.
unexpected liquidity demands are managed through a combination of product design, diversification limits, investment strategies and systematic monitoring. the existing of surrender penalty in Family takaful contracts also protects the Group from losses due to unexpected surrender trends as well as reduces the sensitivity of surrenders to changes in interest rates.
In addition, for General takaful contracts, the Group’s catastrophe excess-of-loss reinsurance contracts contain clauses permitting the immediate drawdown of funds to meet claims payments should claims events exceed a certain amount.
Maturity profile
the table below summarises the maturity profile of the Group’s financial assets and liabilities based on outstanding terms to maturity still remaining. all liabilities are presented on a contractual cash flow basis except for takaful contract liabilities, the maturity profiles are determined based on the estimated timing of net cash outflows from the recognised takaful liabilities.
the takaful contract liabilities below are gross of retakaful (no retakaful credit is taken into account). Investment-lined fund liabilities are repayable or transferrable upon notice by certificate holders and are disclosed separately under the “investment-linked fund” column. repayments which are subject to notices are treated as if notices were to be given immediately. products which have no maturity benefits such as term assurance and yearly renewable plans are excluded as they carry no maturity values.
aFS fair value adjustments, unearned contributions and the retakaful operators’ share of unearned contributions have been excluded from the analysis as they are not contractual obligations.
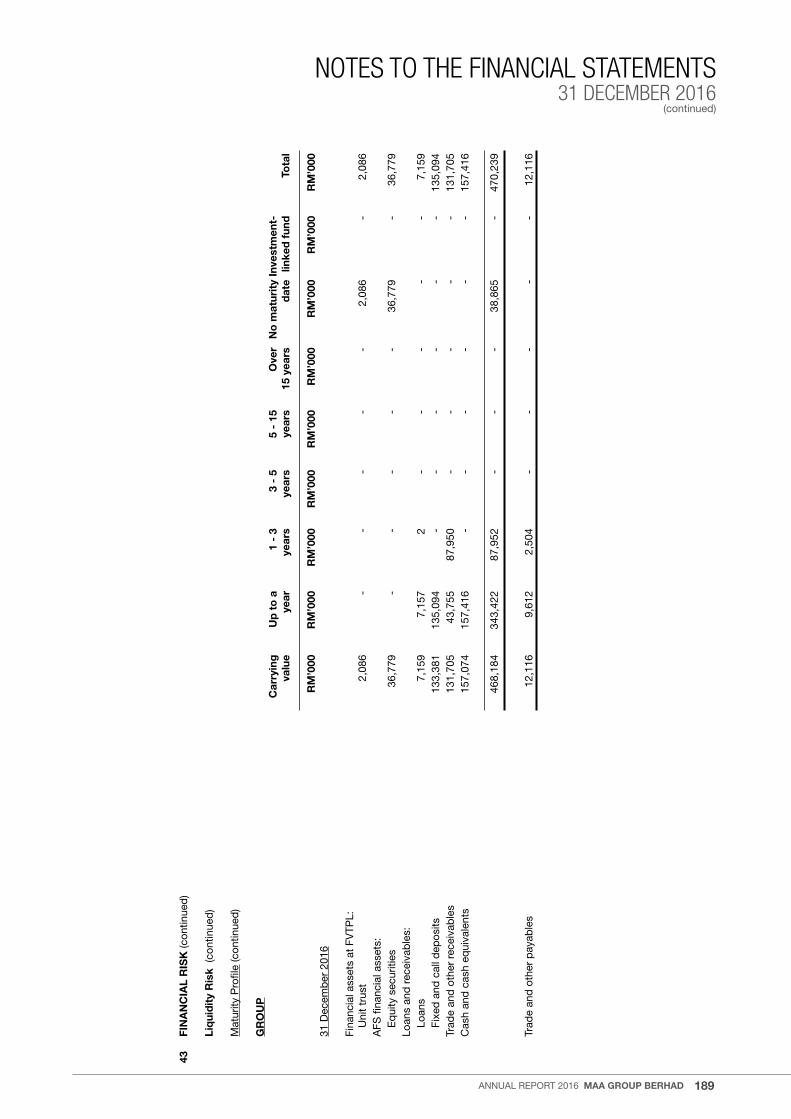
189
NOTES TO THE FINANCIAL STATEMENTS31 DECEMBER 2016
(continued)
annual report 2016 MAA GROUP BERHAD
43
FIN
AN
CIA
L R
ISK
(con
tinue
d)
Li
qui
dit
y R
isk
(con
tinue
d)
M
atur
ity p
rofil
e (c
ontin
ued
)
G
RO
UP
Car
ryin
g
Up
to
a
1 -
3 3
- 5
5 -
15
Ove
r N
o m
atur
ity
Inve
stm
ent-
valu
e ye
ar
year
s ye
ars
year
s 15
yea
rs
dat
e lin
ked
fun
d
Tota
l
R
M’0
00
RM
’000
R
M’0
00
RM
’000
R
M’0
00
RM
’000
R
M’0
00
RM
’000
R
M’0
0031
Dec
emb
er 2
016
Fina
ncia
l ass
ets
at F
Vtp
l:
u
nit
trus
t 2,
086
- -
- -
- 2,
086
- 2,
086
aFS
fina
ncia
l ass
ets:
eq
uity
sec
uriti
es
36,7
79
- -
- -
- 36
,779
-
36,7
79lo
ans
and
rec
eiva
ble
s:
lo
ans
7,15
9 7,
157
2 -
- -
- -
7,15
9
Fixe
d a
nd c
all d
epos
its
133,
381
135,
094
- -
- -
- -
135,
094
trad
e an
d o
ther
rec
eiva
ble
s 13
1,70
5 43
,755
87
,950
-
- -
- -
131,
705
Cas
h an
d c
ash
equi
vale
nts
157,
074
157,
416
- -
- -
- -
157,
416
46
8,18
4 34
3,42
2 87
,952
-
- -
38,8
65
- 47
0,23
9
trad
e an
d o
ther
pay
able
s 12
,116
9,
612
2,50
4 -
- -
- -
12,1
16

190
NOTES TO THE FINANCIAL STATEMENTS31 DECEMBER 2016(continued)
MAA GROUP BERHAD annual report 2016
43
FIN
AN
CIA
L R
ISK
(con
tinue
d)
Li
qui
dit
y R
isk
(con
tinue
d)
M
atur
ity p
rofil
e (c
ontin
ued
)
G
RO
UP
Car
ryin
g
Up
to
a
1 -
3 3
- 5
5 -
15
Ove
r N
o m
atur
ity
Inve
stm
ent-
valu
e ye
ar
year
s ye
ars
year
s 15
yea
rs
dat
e lin
ked
fun
d
Tota
l
R
M’0
00
RM
’000
R
M’0
00
RM
’000
R
M’0
00
RM
’000
R
M’0
00
RM
’000
R
M’0
0031
Dec
emb
er 2
015
ret
akaf
ul a
sset
s 19
2,71
3 12
7,52
3 49
,428
6,
443
2,79
8 6,
521
- -
192,
713
Fina
ncia
l ass
ets
at F
Vtp
l:
u
nit
trus
t 1,
941
- -
- -
- 1,
941
- 1,
941
S
yaria
h-ap
pro
ved
eq
uity
sec
uriti
es
80,3
96
- -
- -
- 85
3 79
,543
80
,396
Is
lam
ic d
ebt
secu
ritie
s 54
,000
-
- -
- -
- 54
,000
54
,000
In
vest
men
t-lin
ked
uni
ts
218,
518
- -
- -
- 2,
730
215,
788
218,
518
aFS
fina
ncia
l ass
ets:
eq
uity
sec
uriti
es
29,9
72
- -
- -
- 29
,972
-
29,9
72
Isla
mic
deb
t se
curit
ies
114,
738
- 14
,691
23
,305
80
,537
47
,566
-
- 16
6,09
9H
tM fi
nanc
ial a
sset
s:
M
alay
sian
Gov
ernm
ent
Gua
rant
ee F
inan
cing
40
,632
-
- -
45,9
18
19,2
95
- -
65,2
13lo
ans
and
rec
eiva
ble
s:
lo
ans
6,95
7 6,
939
18
- -
- -
- 6,
957
Fi
xed
and
cal
l dep
osits
40
,228
41
,009
-
- -
- -
- 41
,009
taka
ful r
ecei
vab
les
81,0
41
81,0
41
- -
- -
-
81,0
41tr
ade
and
oth
er r
ecei
vab
les
40,3
38
39,3
51
- -
- -
- 98
7 40
,338
Cas
h an
d c
ash
equi
vale
nts
357,
245
341,
548
- -
- -
- 16
,658
35
8,20
6
1,25
8,71
9 63
7,41
1 64
,137
29
,748
12
9,25
3 73
,382
35
,496
36
6,97
6 1,
336,
403
ta
kafu
l con
trac
t lia
bili
ties
723,
342
590,
351
69,7
90
7,82
6 5,
874
33,4
58
16,0
43
- 72
3,34
2ta
kafu
l pay
able
s 88
,321
88
,321
-
- -
- -
- 88
,321
trad
e an
d o
ther
pay
able
s 71
,079
67
,164
3,
915
- -
- -
- 71
,079
88
2,74
2 74
5,83
6 73
,705
7,
826
5,87
4 33
,458
16
,043
-
882,
742

191
NOTES TO THE FINANCIAL STATEMENTS31 DECEMBER 2016
(continued)
annual report 2016 MAA GROUP BERHAD
43 FINANCIAL RISK (continued)
Liquidity Risk (continued)
Maturity profile (continued)
COMPANY Carrying Up to a Over 3 No maturity Value year Years date Total
RM’000 RM’000 RM’000 RM’000 RM’000
31 December 2016 aFS financial assets: equity securities 5,084 - - 5,084 5,084loans and receivables: loans 7 5 2 - 7 Fixed and call deposits 133,381 135,094 - - 135,094trade and other receivables 131,477 43,527 87,950 - 131,477Cash and cash equivalents 139,224 139,524 - - 139,524 409,173 318,150 87,952 5,084 411,186
trade and other payables 4,615 3,578 1,037 - 4,615 31 December 2015 loans and receivables: loans 4 2 2 - 4 Fixed and call deposits 19,127 19,380 - - 19,380trade and other receivables 39,383 39,383 - - 39,383Cash and cash equivalents 157,959 158,280 - - 158,280 216,473 217,045 2 - 217,047
trade and other payables 2,555 2,555 - - 2,555
Market Risk
Market risk is the risk of loss in the valuation of the Group’s investments due to adverse changes or volatility of prices in economic and financial markets. Market risk comprises three (3) types of risk i.e. currency risk, market interest/profit rate risk and price risk.
the Group manages market risks through setting of investment policy and asset allocation, approving portfolio limit structure and
risk management methodologies, approving hedging and alternative risk transfer strategies. Investment limits monitoring is in place at various levels to ensure that all investment activities are aligned with the Group’s risk management principles and philosophies. Compliance with established financial risk limits forms an integral part of the risk governance and financial reporting framework.
the Group also issues investment-linked investment policies in a number of its products. In the investment-linked business, the
holders of these contracts bear the investment risk on the assets held in the investment-linked funds as the policy benefits are directly linked to the values of the assets in the funds. the Group’s exposure to market risk on this business is limited to the extent that income arising from asset management charges is based on the values of the assets in the funds.
Currency risk
Currency risk is the risk that the fair value of future cash flows of a financial instrument will fluctuate because of changes in foreign exchange rates.
the Group has overseas associates that operate in philippines and australia whose revenue and expenses are denominated in united States Dollar, philippines peso and australian Dollar respectively. In order to protect the Group’s exposure to the exchange rate movements of the foreign currencies against ringgit Malaysia, the Group finances its net investments in the foreign subsidiary and associates by means of composition of ringgit Malaysia and united States Dollar denominated funds based on assessment of the exchange rate exposure.
the Group’s exposure to transactional foreign exchange risk is monitored on an ongoing basis. the Group does not hedge its foreign currency risk.

192
NOTES TO THE FINANCIAL STATEMENTS31 DECEMBER 2016(continued)
MAA GROUP BERHAD annual report 2016
43 FINANCIAL RISK (continued)
Market Risk (continued)
Currency risk (continued)
the Group’s financial assets are also primarily denominated in the same currency as its takaful contract liabilities as required under the applicable regulatory requirements. thus, the main foreign exchange risk from recognised assets and liabilities arises from transactions other than those in which takaful contract liabilities are expected to be settled.
the Group’s main foreign exchange risk from recognised assets and liabilities arises from reinsurance transactions for which the balances are expected to be settled and realised in less than a year. the impact arising from sensitivity in foreign exchange rates is deemed minimal as the Group has no significant concentration of foreign currency risk.
Interest/profit rate risk
Interest/profit rate risk is part of market risk as any adverse movements in interest/profit rates may affect the Group’s investment fair valuation and reinvestment issues. the Group’s Investment Committees of the takaful subsidiary actively monitor such developments as well as discuss changes in maturity profiles of the assets and liabilities to minimise overall mismatch given the long duration of policy liabilities and the uncertainty of cash flows, it is not possible to hold assets that will perfectly match the policy liabilities.
the Group has no significant concentration of interest/profit rate risk.
the analysis below is performed for reasonably possible movements in key variables with all other variables held constant, showing the impact on equity (that reflects adjustments to profit before tax and re-valuing fixed rate/yield aFS financial assets). the correlation of variables will have a significant effect in determining the ultimate impact on interest/profit rate risk but to demonstrate the impact due to changes in variables, variables had to be changed in an individual basis. It should be noted that movements in these variables are non-linear.
Impact on profit before taxation Impact on equity*
31.12.2016 31.12.2015 31.12.2016 31.12.2015
RM’000 RM’000 RM’000 RM’000
GROUP
Interest/profit rate
+ 100 basis points 2,873 3,606 2,155 1,879
- 100 basis points (2,873) (3,606) (2,155) (1,783)
COMPANY
Interest/profit rate
+ 100 basis points 2,721 - 2,041 -
- 100 basis points (2,721) - (2,041) -
* Impact on equity reflects adjustments for tax, when applicable.
the method used for deriving sensitivity information and significant variables did not change from previous year.
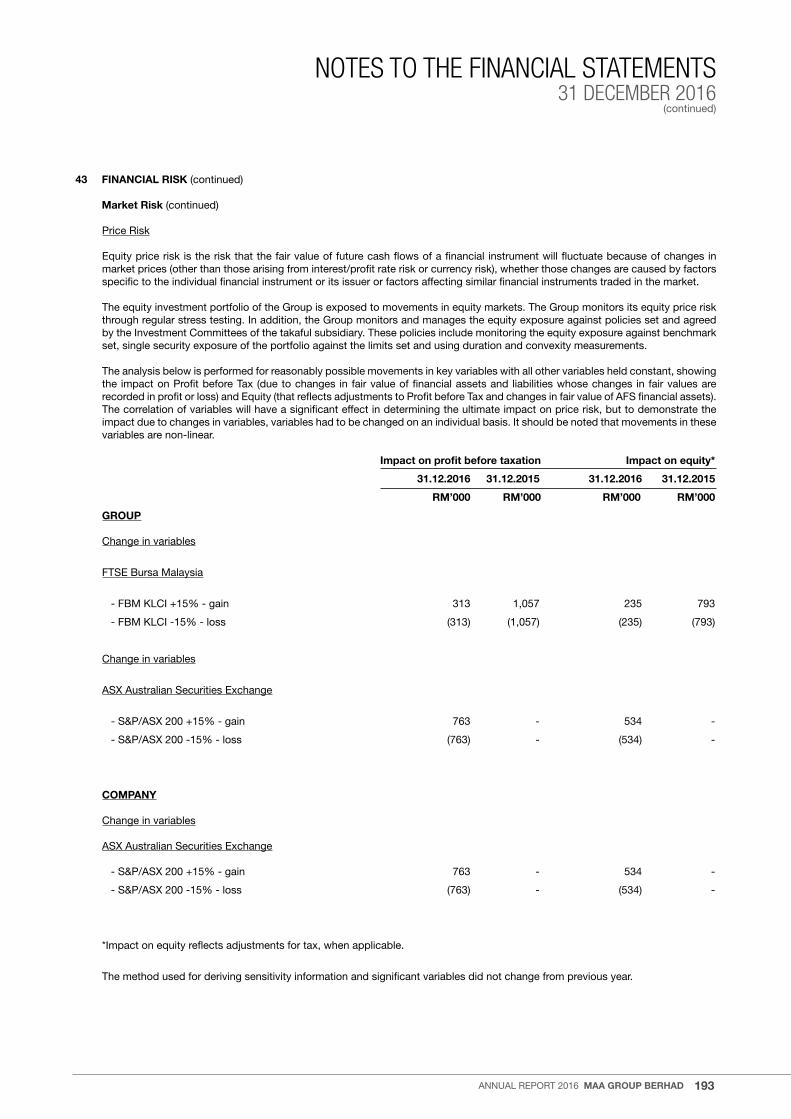
193
NOTES TO THE FINANCIAL STATEMENTS31 DECEMBER 2016
(continued)
annual report 2016 MAA GROUP BERHAD
43 FINANCIAL RISK (continued)
Market Risk (continued)
price risk
equity price risk is the risk that the fair value of future cash flows of a financial instrument will fluctuate because of changes in market prices (other than those arising from interest/profit rate risk or currency risk), whether those changes are caused by factors specific to the individual financial instrument or its issuer or factors affecting similar financial instruments traded in the market.
the equity investment portfolio of the Group is exposed to movements in equity markets. the Group monitors its equity price risk through regular stress testing. In addition, the Group monitors and manages the equity exposure against policies set and agreed by the Investment Committees of the takaful subsidiary. these policies include monitoring the equity exposure against benchmark set, single security exposure of the portfolio against the limits set and using duration and convexity measurements.
the analysis below is performed for reasonably possible movements in key variables with all other variables held constant, showing the impact on profit before tax (due to changes in fair value of financial assets and liabilities whose changes in fair values are recorded in profit or loss) and equity (that reflects adjustments to profit before tax and changes in fair value of aFS financial assets). the correlation of variables will have a significant effect in determining the ultimate impact on price risk, but to demonstrate the impact due to changes in variables, variables had to be changed on an individual basis. It should be noted that movements in these variables are non-linear.
Impact on profit before taxation Impact on equity*
31.12.2016 31.12.2015 31.12.2016 31.12.2015
RM’000 RM’000 RM’000 RM’000
GROUP
Change in variables
FtSe Bursa Malaysia
- FBM KlCI +15% - gain 313 1,057 235 793
- FBM KlCI -15% - loss (313) (1,057) (235) (793)
Change in variables
aSX australian Securities exchange
- S&p/aSX 200 +15% - gain 763 - 534 -
- S&p/aSX 200 -15% - loss (763) - (534) -
COMPANY
Change in variables
aSX australian Securities exchange
- S&p/aSX 200 +15% - gain 763 - 534 -
- S&p/aSX 200 -15% - loss (763) - (534) -
*Impact on equity reflects adjustments for tax, when applicable.
the method used for deriving sensitivity information and significant variables did not change from previous year.
194
NOTES TO THE FINANCIAL STATEMENTS31 DECEMBER 2016(continued)
MAA GROUP BERHAD annual report 2016
44 OPERATIONAL RISK
operational risk arises from inadequate or failed performance of business functions or internal processes. exposure to this risk can cause deficiencies or breakdowns in internal controls or processes, technology and external events such as interruption of business operations due to a breakdown of It systems, landslide or flood.
the Group has developed comprehensive operating policies and procedures manuals to enable all business units will implement, measure, monitor and control the risks in order to avoid or reduce losses. Furthermore, the Group’s risk Management and Internal audit Department facilitates business units to review and ensure the current procedures adhere to all rules and regulations.
45 COMPLIANCE RISK
Compliance risk is the risk arising from violations of, or non conformance with business principles, internal policies and procedures, related laws, rules and regulations governing the Group’s products and activities.
Consequently, the exposure to this risk can damage the Group’s reputation, lead to legal or regulatory sanctions and/or financial loss.
the Group has established a Compliance Framework to ensure that the companies within the Group are in compliance with all laws and regulatory requirements. the audit Committee and the Board have oversight of the Group’s compliance matters through the Compliance Framework implemented by the Group’s Compliance Department. In addition, the core regulated subsidiaries in the Group have their respective dedicated compliance and/or governance terms to manage the compliance functions to ensure its process and internal policies and procedures comply with the applicable laws and guidelines issued by the regulatory authorities.

195
NOTES TO THE FINANCIAL STATEMENTS31 DECEMBER 2016
(continued)
annual report 2016 MAA GROUP BERHAD
46 INSURANCE FUNDS
Statement of Financial Position by Funds As at 31 December 2016
Shareholders’ fund Total
RM’000 RM’000 Assets property, plant and equipment 3,686 3,686
Investment properties 19,824 19,824
Intangible assets 494 494
associates 71,692 71,692
tax recoverable 252 252
Investments 179,405 179,405
Financial assets at FVtpl 2,086 2,086
aFS financial assets 36,779 36,779
loans and receivables 140,540 140,540
trade and other receivables 131,705 131,705
Cash and cash equivalents 157,074 157,074
Total assets 564,132 564,132 Equity and liabilities Liabilities Deferred tax liabilities 185 185
trade and other payables 12,116 12,116
Total liabilities 12,301 12,301 Equity Share capital 273,518 273,518
treasury shares - -
retained earnings 240,164 240,164
reserves 38,149 38,149
Total equity attributable to the owners of the Company 551,831 551,831 non-controlling interests - -
Total equity 551,831 551,831 total equity and liabilities 564,132 564,132 Inter-fund balances - -

196
NOTES TO THE FINANCIAL STATEMENTS31 DECEMBER 2016(continued)
MAA GROUP BERHAD annual report 2016
46 INSURANCE FUNDS (continued)
Statement of Financial Position by Funds As at 31 December 2015
Shareholders’ General Family fund takaful fund takaful fund Total
RM’000 RM’000 RM’000 RM’000
Assets
property, plant and equipment 14,575 - - 14,575
Investment properties 19,356 - - 19,356
Intangible assets 3,571 - - 3,571
associates 67,954 - - 67,954
Deferred tax assets - 2,334 - 2,334
tax recoverable 331 - 9 340
retakaful assets - 258,009 12,399 270,408
Investments 84,728 86,310 416,344 587,382
Financial assets at FVtpl 5,524 - 349,331 354,855
aFS financial assets 40,428 62,662 41,620 144,710
HtM financial assets - 15,245 25,387 40,632
loans and receivables 38,776 8,403 6 47,185
takaful receivables - 76,775 4,266 81,041
trade and other receivables 36,152 3,101 1,085 40,338
Cash and cash equivalents 251,656 56,710 48,879 357,245
assets classified as held for sale 6,393 - - 6,393
Total assets 484,716 483,239 482,982 1,450,937
Equity, policyholders’ funds and liabilities
Liabilities
takaful contract liabilities - 380,799 465,993 846,792
Deferred tax liabilities 900 - 389 1,289
takaful payables - 83,345 4,976 88,321
trade and other payables 43,766 15,800 11,513 71,079
Current tax liabilities 4,118 - 216 4,334
liabilities associated with assets classified as held for sale 1,281 - - 1,281
Total liabilities 50,065 479,944 483,087 1,013,096
Equity
Share capital 292,693 - - 292,693
treasury shares (444) - - (444)
retained earnings 128,686 - (16,043) 112,643
reserves 5,160 - - 5,160
Total equity attributable to the owners of the Company 426,095 - (16,043) 410,052 non-controlling interests 27,789 - - 27,789
Total equity 453,884 - (16,043) 437,841
Total equity, policyholders’ funds and liabilities 503,949 479,944 467,044 1,450,937
Inter-fund balances (19,233) 3,295 15,938 -
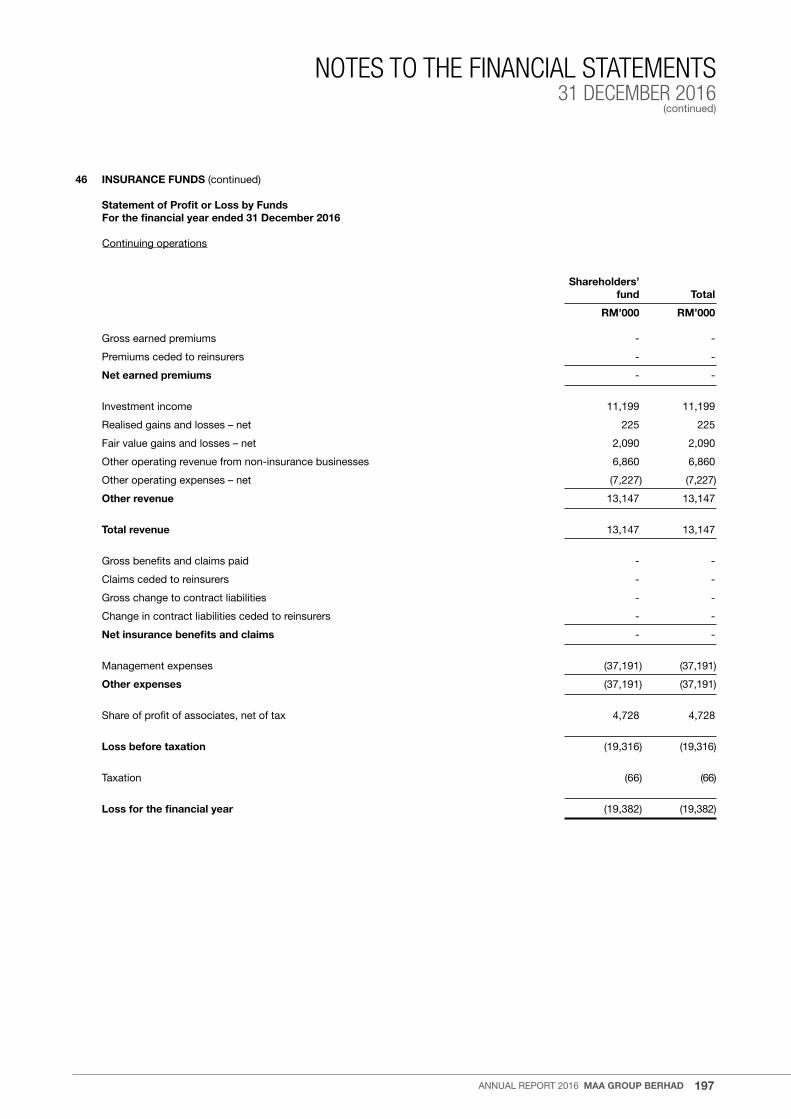
197
NOTES TO THE FINANCIAL STATEMENTS31 DECEMBER 2016
(continued)
annual report 2016 MAA GROUP BERHAD
46 INSURANCE FUNDS (continued)
Statement of Profit or Loss by Funds For the financial year ended 31 December 2016
Continuing operations
Shareholders’
fund Total
RM’000 RM’000 Gross earned premiums - -
premiums ceded to reinsurers - -
Net earned premiums - -
Investment income 11,199 11,199
realised gains and losses – net 225 225
Fair value gains and losses – net 2,090 2,090
other operating revenue from non-insurance businesses 6,860 6,860
other operating expenses – net (7,227) (7,227)
Other revenue 13,147 13,147
Total revenue 13,147 13,147
Gross benefits and claims paid - -
Claims ceded to reinsurers - -
Gross change to contract liabilities - -
Change in contract liabilities ceded to reinsurers - -
Net insurance benefits and claims - -
Management expenses (37,191) (37,191)
Other expenses (37,191) (37,191)
Share of profit of associates, net of tax 4,728 4,728
Loss before taxation (19,316) (19,316)
taxation (66) (66)
Loss for the financial year (19,382) (19,382)
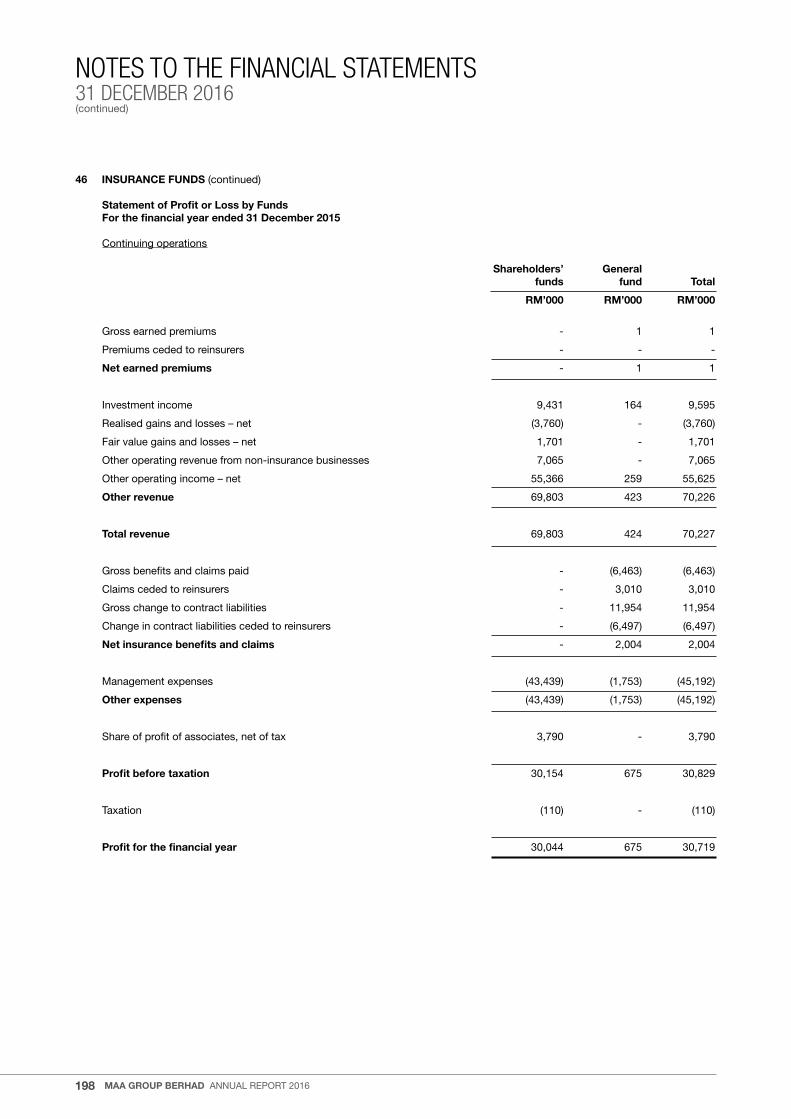
198
NOTES TO THE FINANCIAL STATEMENTS31 DECEMBER 2016(continued)
MAA GROUP BERHAD annual report 2016
46 INSURANCE FUNDS (continued)
Statement of Profit or Loss by Funds For the financial year ended 31 December 2015
Continuing operations
Shareholders’ General funds fund Total
RM’000 RM’000 RM’000
Gross earned premiums - 1 1
premiums ceded to reinsurers - - -
Net earned premiums - 1 1
Investment income 9,431 164 9,595
realised gains and losses – net (3,760) - (3,760)
Fair value gains and losses – net 1,701 - 1,701
other operating revenue from non-insurance businesses 7,065 - 7,065
other operating income – net 55,366 259 55,625
Other revenue 69,803 423 70,226
Total revenue 69,803 424 70,227
Gross benefits and claims paid - (6,463) (6,463)
Claims ceded to reinsurers - 3,010 3,010
Gross change to contract liabilities - 11,954 11,954
Change in contract liabilities ceded to reinsurers - (6,497) (6,497)
Net insurance benefits and claims - 2,004 2,004
Management expenses (43,439) (1,753) (45,192)
Other expenses (43,439) (1,753) (45,192)
Share of profit of associates, net of tax 3,790 - 3,790
Profit before taxation 30,154 675 30,829
taxation (110) - (110)
Profit for the financial year 30,044 675 30,719

199
NOTES TO THE FINANCIAL STATEMENTS31 DECEMBER 2016
(continued)
annual report 2016 MAA GROUP BERHAD
46 INSURANCE FUNDS (continued)
Statement of Profit or Loss by Funds For the financial year ended 31 December 2016
Discontinued operations Share- General Family holders’ takaful takaful Interfund fund fund fund elimination Total
RM’000 RM’000 RM’000 RM’000 RM’000
Gross earned contributions - 145,031 124,399 - 269,430
Contributions ceded to retakaful operators - (92,828) (7,337) - (100,165)
Net earned contributions - 52,203 117,062 - 169,265
Investment income 1,852 3,249 4,744 - 9,845
realised gains and losses – net 281,105 43 1,737 - 282,885
Fair value gains and losses – net 70 - (16,855) - (16,785)
Fee and commission income - 19,730 - - 19,730
other operating revenue from non-insurance businesses 104 - - - 104
other operating (expenses)/income – net (1,558) 7,602 640 - 6,684
Surplus sharing from General takaful 2,017 - - (2,017) -
Surplus sharing from Family takaful 5,740 - - (5,740) -
Wakalah fee from takaful business 84,251 - - (84,251) -
Other revenue 373,581 30,624 (9,734) (92,008) 302,463
Total revenue 373,581 82,827 107,328 (92,008) 471,728
Gross benefits and claims paid - (67,644) (74,112) - (141,756)
Claims ceded to retakaful operators - 40,995 5,865 - 46,860
Gross change to contract liabilities - (21,028) 9,816 - (11,212)
Change in contract liabilities ceded to retakaful operators - 10,937 2,171 - 13,108
Net takaful benefits and claims - (36,740) (56,260) - (93,000)
Fee and commission expenses (46,143) - - - (46,143)
Management expenses (44,805) 800 - - (44,005)
expense liabilities (330) - - - (330)
Surplus sharing with Shareholders’ fund - (2,017) (5,740) 7,757 -
Wakalah fees payable to Shareholders’ fund - (42,717) (41,534) 84,251 -
Other expenses (91,278) (43,934) (47,274) 92,008 (90,478)
Profit before zakat 282,303 2,153 3,794 - 288,250
Zakat - - - - -
Profit after Zakat 282,303 2,153 3,794 - 288,250
tax (expenses)/income attributable to participants - (2,153) 773 - (1,380)
Profit before taxation 282,303 - 4,567 - 286,870
taxation (3,729) (2,153) 773 - (5,109)
tax expenses/(income) attributable to participants - 2,153 (773) - 1,380
tax expenses attributable to Shareholders’ fund (3,729) - - - (3,729)
Profit for the financial year 278,574 - 4,567 - 283,141

200
NOTES TO THE FINANCIAL STATEMENTS31 DECEMBER 2016(continued)
MAA GROUP BERHAD annual report 2016
46 INSURANCE FUNDS (continued)
Statement of Profit or Loss by Funds For the financial year ended 31 December 2015
Discontinued operations
Share- General Family holders’ takaful takaful Interfund fund fund fund elimination Total
RM’000 RM’000 RM’000 RM’000 RM’000
Gross earned contributions - 277,616 250,736 - 528,352
Contributions ceded to retakaful operators - (179,942) (14,053) - (193,995)
Net earned contributions - 97,674 236,683 - 334,357
Investment income 4,014 5,522 11,240 - 20,776
realised gains and losses – net (723) (188) 5,331 - 4,420
Fair value gains and losses – net 1,476 - 12,144 - 13,620
Fee and commission income - 41,876 - - 41,876
other operating revenue from non-insurance businesses 269 - - - 269
other operating income/(expenses) – net 1,593 (1,938) (1,058) - (1,403)
Surplus sharing from General takaful 1,518 - - (1,518) -
Surplus sharing from Family takaful 11,250 - - (11,250) -
Wakalah fee from takaful business 166,693 - - (166,693) -
Other revenue 186,090 45,272 27,657 (179,461) 79,558
Total revenue 186,090 142,946 264,340 (179,461) 413,915
Gross benefits and claims paid - (122,839) (161,027) - (283,866)
Claims ceded to retakaful operators - 84,155 11,307 - 95,462
Gross change to contract liabilities - (10,111) (15,269) - (25,380)
Change in contract liabilities ceded to retakaful operators - (20,399) (925) - (21,324)
Net takaful benefits and claims - (69,194) (165,914) - (235,108)
Fee and commission expenses (97,315) - - - (97,315)
Management expenses (82,385) 4,643 1,500 - (76,242)
expense liabilities (377) - - - (377)
Surplus sharing with Shareholders’ fund - (1,518) (11,250) 12,768 -
Wakalah fees payable to Shareholders’ fund - (75,356) (91,337) 166,693 -
Other expenses (180,077) (72,231) (101,087) 179,461 (173,934)
Profit/(loss) before zakat 6,013 1,521 (2,661) - 4,873
Zakat (72) - - - (72)
Profit/(loss) after Zakat 5,941 1,521 (2,661) - 4,801
tax expenses attributable to participants - (970) (2,034) - (3,004)
Profit/(loss) before taxation 5,941 551 (4,695) - 1,797
taxation (9,425) (970) (2,034) - (12,429)
tax expenses attributable to participants - 970 2,034 - 3,004
tax expenses attributable to Shareholders’ fund (9,425) - - - (9,425)
(Loss)/profit for the financial year (3,484) 551 (4,695) - (7,628)

201
NOTES TO THE FINANCIAL STATEMENTS31 DECEMBER 2016
(continued)
annual report 2016 MAA GROUP BERHAD
46 INSURANCE FUNDS (continued)
Statement of cash flows by Funds
Share- General Family holders’ General Life takaful takaful fund fund fund fund fund Total
RM’000 RM’000 RM’000 RM’000 RM’000 RM’000
31 December 2016 Cash flows from: operating activities 135,527 - - (56,710) (48,879) 29,938 Investing activities (103,873) - - - - (103,873) Financing activities (135,342) - - - - (135,342) net decrease in cash and cash equivalents (103,688) - - (56,710) (48,879) (209,277) Currency translation differences 9,106 - - - - 9,106 Cash and cash equivalents at beginning of financial year 251,656 - - 56,710 48,879 357,245 Cash and cash equivalents at end of financial year 157,074 - - - - 157,074 31 December 2015 Cash flows from: operating activities 97,975 (827) (420) 15,523 (30,300) 81,951 Investing activities (16,102) - - (6,935) - (23,037) Financing activities (24,964) - - - - (24,964) net increase/(decrease) in cash and cash equivalents 56,909 (827) (420) 8,588 (30,300) 33,950 Currency translation differences (18,973) - - - - (18,973) Cash and cash equivalents at beginning of financial year 213,720 827 420 48,122 79,179 342,268 Cash and cash equivalents at end of financial year 251,656 - - 56,710 48,879 357,245
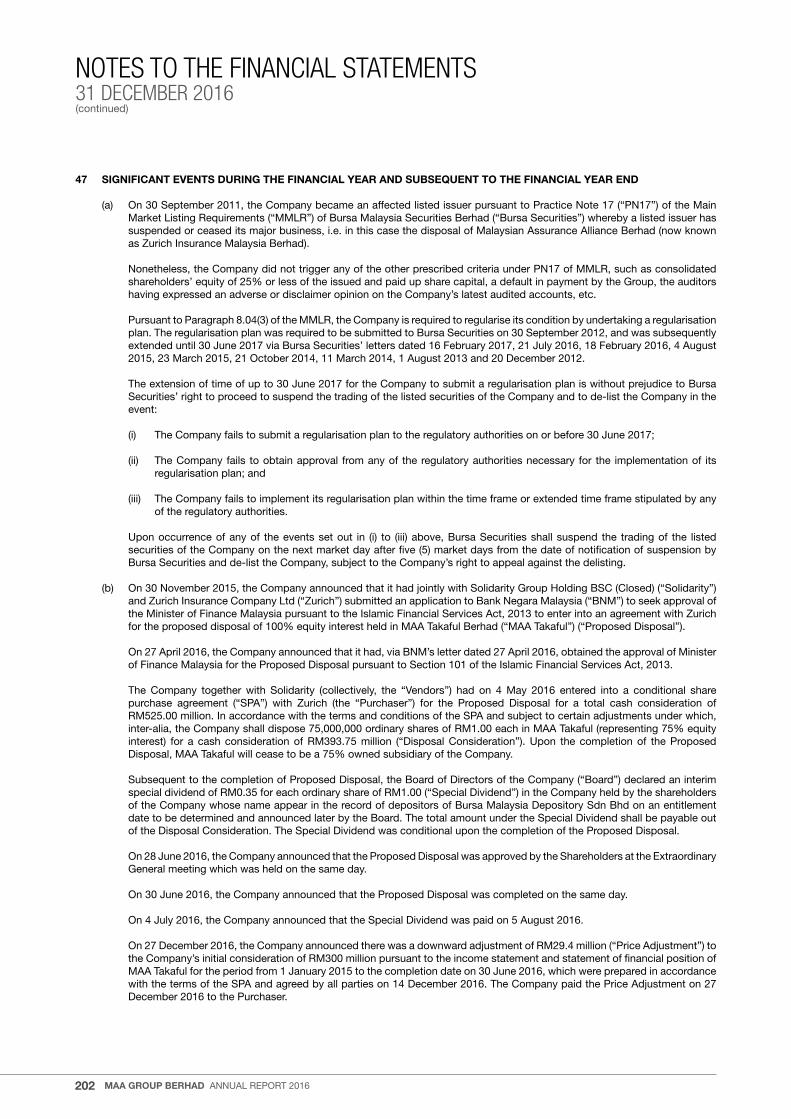
202
NOTES TO THE FINANCIAL STATEMENTS31 DECEMBER 2016(continued)
MAA GROUP BERHAD annual report 2016
47 SIGNIFICANT EVENTS DURING THE FINANCIAL YEAR AND SUBSEQUENT TO THE FINANCIAL YEAR END
(a) on 30 September 2011, the Company became an affected listed issuer pursuant to practice note 17 (“pn17”) of the Main Market listing requirements (“MMlr”) of Bursa Malaysia Securities Berhad (“Bursa Securities”) whereby a listed issuer has suspended or ceased its major business, i.e. in this case the disposal of Malaysian assurance alliance Berhad (now known as Zurich Insurance Malaysia Berhad).
nonetheless, the Company did not trigger any of the other prescribed criteria under pn17 of MMlr, such as consolidated shareholders’ equity of 25% or less of the issued and paid up share capital, a default in payment by the Group, the auditors having expressed an adverse or disclaimer opinion on the Company’s latest audited accounts, etc.
pursuant to paragraph 8.04(3) of the MMlr, the Company is required to regularise its condition by undertaking a regularisation plan. the regularisation plan was required to be submitted to Bursa Securities on 30 September 2012, and was subsequently extended until 30 June 2017 via Bursa Securities’ letters dated 16 February 2017, 21 July 2016, 18 February 2016, 4 august 2015, 23 March 2015, 21 october 2014, 11 March 2014, 1 august 2013 and 20 December 2012.
the extension of time of up to 30 June 2017 for the Company to submit a regularisation plan is without prejudice to Bursa Securities’ right to proceed to suspend the trading of the listed securities of the Company and to de-list the Company in the event:
(i) the Company fails to submit a regularisation plan to the regulatory authorities on or before 30 June 2017;
(ii) the Company fails to obtain approval from any of the regulatory authorities necessary for the implementation of its regularisation plan; and
(iii) the Company fails to implement its regularisation plan within the time frame or extended time frame stipulated by any of the regulatory authorities.
upon occurrence of any of the events set out in (i) to (iii) above, Bursa Securities shall suspend the trading of the listed securities of the Company on the next market day after five (5) market days from the date of notification of suspension by Bursa Securities and de-list the Company, subject to the Company’s right to appeal against the delisting.
(b) on 30 november 2015, the Company announced that it had jointly with Solidarity Group Holding BSC (Closed) (“Solidarity”) and Zurich Insurance Company ltd (“Zurich”) submitted an application to Bank negara Malaysia (“BnM”) to seek approval of the Minister of Finance Malaysia pursuant to the Islamic Financial Services act, 2013 to enter into an agreement with Zurich for the proposed disposal of 100% equity interest held in Maa takaful Berhad (“Maa takaful”) (“proposed Disposal”).
on 27 april 2016, the Company announced that it had, via BnM’s letter dated 27 april 2016, obtained the approval of Minister of Finance Malaysia for the proposed Disposal pursuant to Section 101 of the Islamic Financial Services act, 2013.
the Company together with Solidarity (collectively, the “Vendors”) had on 4 May 2016 entered into a conditional share purchase agreement (“Spa”) with Zurich (the “purchaser”) for the proposed Disposal for a total cash consideration of rM525.00 million. In accordance with the terms and conditions of the Spa and subject to certain adjustments under which, inter-alia, the Company shall dispose 75,000,000 ordinary shares of rM1.00 each in Maa takaful (representing 75% equity interest) for a cash consideration of rM393.75 million (“Disposal Consideration”). upon the completion of the proposed Disposal, Maa takaful will cease to be a 75% owned subsidiary of the Company.
Subsequent to the completion of proposed Disposal, the Board of Directors of the Company (“Board”) declared an interim special dividend of rM0.35 for each ordinary share of rM1.00 (“Special Dividend”) in the Company held by the shareholders of the Company whose name appear in the record of depositors of Bursa Malaysia Depository Sdn Bhd on an entitlement date to be determined and announced later by the Board. the total amount under the Special Dividend shall be payable out of the Disposal Consideration. the Special Dividend was conditional upon the completion of the proposed Disposal.
on 28 June 2016, the Company announced that the proposed Disposal was approved by the Shareholders at the extraordinary
General meeting which was held on the same day.
on 30 June 2016, the Company announced that the proposed Disposal was completed on the same day.
on 4 July 2016, the Company announced that the Special Dividend was paid on 5 august 2016.
on 27 December 2016, the Company announced there was a downward adjustment of rM29.4 million (“price adjustment”) to the Company’s initial consideration of rM300 million pursuant to the income statement and statement of financial position of Maa takaful for the period from 1 January 2015 to the completion date on 30 June 2016, which were prepared in accordance with the terms of the Spa and agreed by all parties on 14 December 2016. the Company paid the price adjustment on 27 December 2016 to the purchaser.
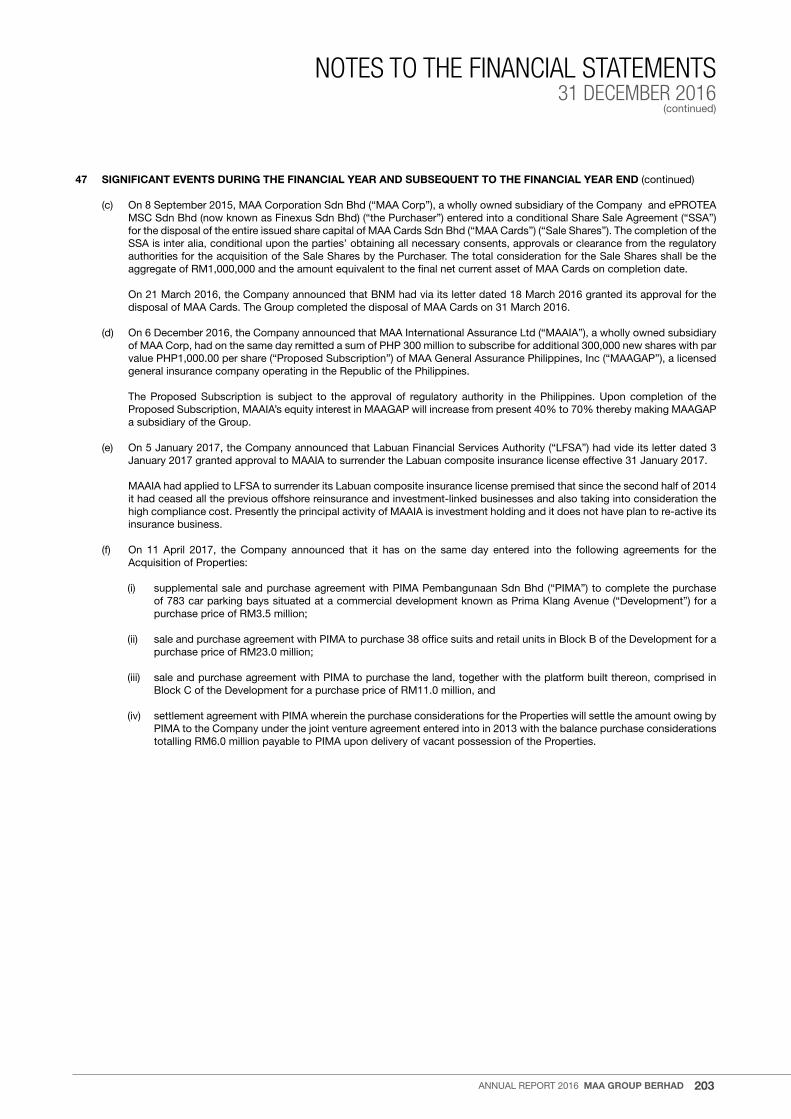
203
NOTES TO THE FINANCIAL STATEMENTS31 DECEMBER 2016
(continued)
annual report 2016 MAA GROUP BERHAD
47 SIGNIFICANT EVENTS DURING THE FINANCIAL YEAR AND SUBSEQUENT TO THE FINANCIAL YEAR END (continued)
(c) on 8 September 2015, Maa Corporation Sdn Bhd (“Maa Corp”), a wholly owned subsidiary of the Company and eprotea MSC Sdn Bhd (now known as Finexus Sdn Bhd) (“the purchaser”) entered into a conditional Share Sale agreement (“SSa”) for the disposal of the entire issued share capital of Maa Cards Sdn Bhd (“Maa Cards”) (“Sale Shares”). the completion of the SSa is inter alia, conditional upon the parties’ obtaining all necessary consents, approvals or clearance from the regulatory authorities for the acquisition of the Sale Shares by the purchaser. the total consideration for the Sale Shares shall be the aggregate of rM1,000,000 and the amount equivalent to the final net current asset of Maa Cards on completion date.
on 21 March 2016, the Company announced that BnM had via its letter dated 18 March 2016 granted its approval for the disposal of Maa Cards. the Group completed the disposal of Maa Cards on 31 March 2016.
(d) on 6 December 2016, the Company announced that Maa International assurance ltd (“MaaIa”), a wholly owned subsidiary of Maa Corp, had on the same day remitted a sum of pHp 300 million to subscribe for additional 300,000 new shares with par value pHp1,000.00 per share (“proposed Subscription”) of Maa General assurance philippines, Inc (“MaaGap”), a licensed general insurance company operating in the republic of the philippines.
the proposed Subscription is subject to the approval of regulatory authority in the philippines. upon completion of the proposed Subscription, MaaIa’s equity interest in MaaGap will increase from present 40% to 70% thereby making MaaGap a subsidiary of the Group.
(e) on 5 January 2017, the Company announced that labuan Financial Services authority (“lFSa”) had vide its letter dated 3 January 2017 granted approval to MaaIa to surrender the labuan composite insurance license effective 31 January 2017.
MaaIa had applied to lFSa to surrender its labuan composite insurance license premised that since the second half of 2014 it had ceased all the previous offshore reinsurance and investment-linked businesses and also taking into consideration the high compliance cost. presently the principal activity of MaaIa is investment holding and it does not have plan to re-active its insurance business.
(f) on 11 april 2017, the Company announced that it has on the same day entered into the following agreements for the acquisition of properties:
(i) supplemental sale and purchase agreement with pIMa pembangunaan Sdn Bhd (“pIMa”) to complete the purchase of 783 car parking bays situated at a commercial development known as prima Klang avenue (“Development”) for a purchase price of rM3.5 million;
(ii) sale and purchase agreement with pIMa to purchase 38 office suits and retail units in Block B of the Development for a purchase price of rM23.0 million;
(iii) sale and purchase agreement with pIMa to purchase the land, together with the platform built thereon, comprised in Block C of the Development for a purchase price of rM11.0 million, and
(iv) settlement agreement with pIMa wherein the purchase considerations for the properties will settle the amount owing by pIMa to the Company under the joint venture agreement entered into in 2013 with the balance purchase considerations totalling rM6.0 million payable to pIMa upon delivery of vacant possession of the properties.
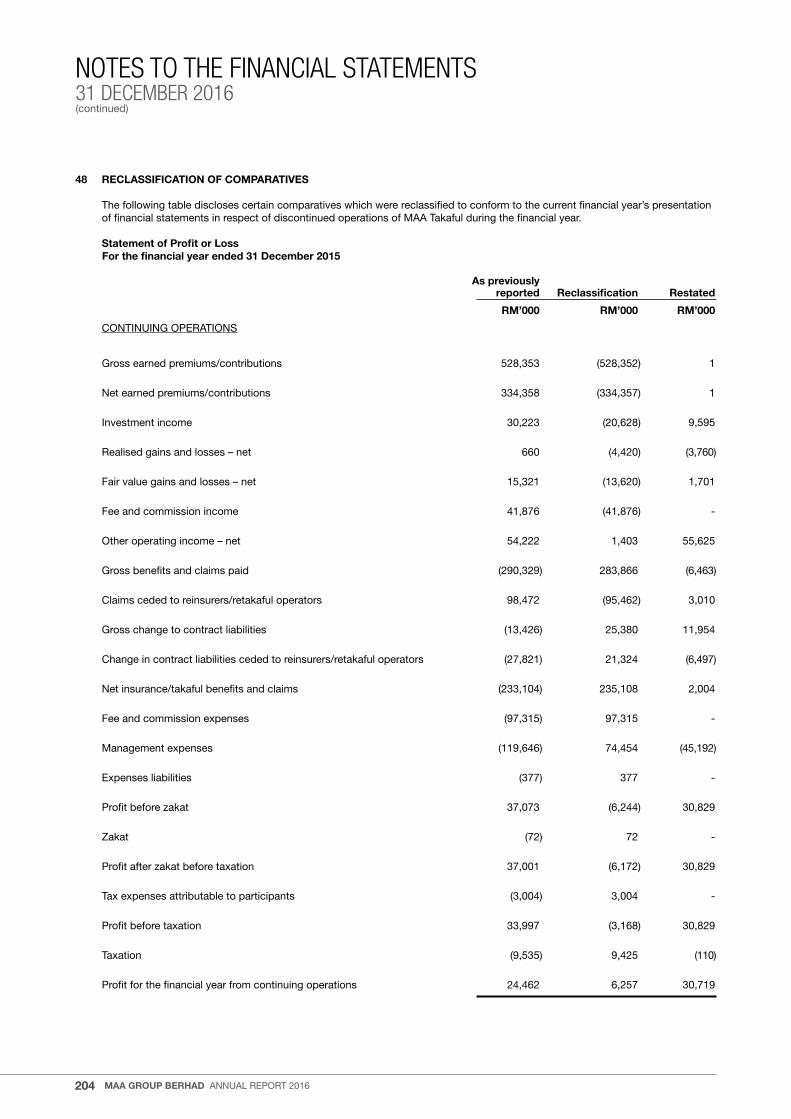
204
NOTES TO THE FINANCIAL STATEMENTS31 DECEMBER 2016(continued)
MAA GROUP BERHAD annual report 2016
48 RECLASSIFICATION OF COMPARATIVES
the following table discloses certain comparatives which were reclassified to conform to the current financial year’s presentation of financial statements in respect of discontinued operations of Maa takaful during the financial year.
Statement of Profit or Loss For the financial year ended 31 December 2015
As previously reported Reclassification Restated
RM’000 RM’000 RM’000
ContInuInG operatIonS
Gross earned premiums/contributions 528,353 (528,352) 1
net earned premiums/contributions 334,358 (334,357) 1
Investment income 30,223 (20,628) 9,595
realised gains and losses – net 660 (4,420) (3,760)
Fair value gains and losses – net 15,321 (13,620) 1,701
Fee and commission income 41,876 (41,876) -
other operating income – net 54,222 1,403 55,625
Gross benefits and claims paid (290,329) 283,866 (6,463)
Claims ceded to reinsurers/retakaful operators 98,472 (95,462) 3,010
Gross change to contract liabilities (13,426) 25,380 11,954
Change in contract liabilities ceded to reinsurers/retakaful operators (27,821) 21,324 (6,497)
net insurance/takaful benefits and claims (233,104) 235,108 2,004
Fee and commission expenses (97,315) 97,315 -
Management expenses (119,646) 74,454 (45,192)
expenses liabilities (377) 377 -
profit before zakat 37,073 (6,244) 30,829
Zakat (72) 72 -
profit after zakat before taxation 37,001 (6,172) 30,829
tax expenses attributable to participants (3,004) 3,004 -
profit before taxation 33,997 (3,168) 30,829
taxation (9,535) 9,425 (110)
profit for the financial year from continuing operations 24,462 6,257 30,719
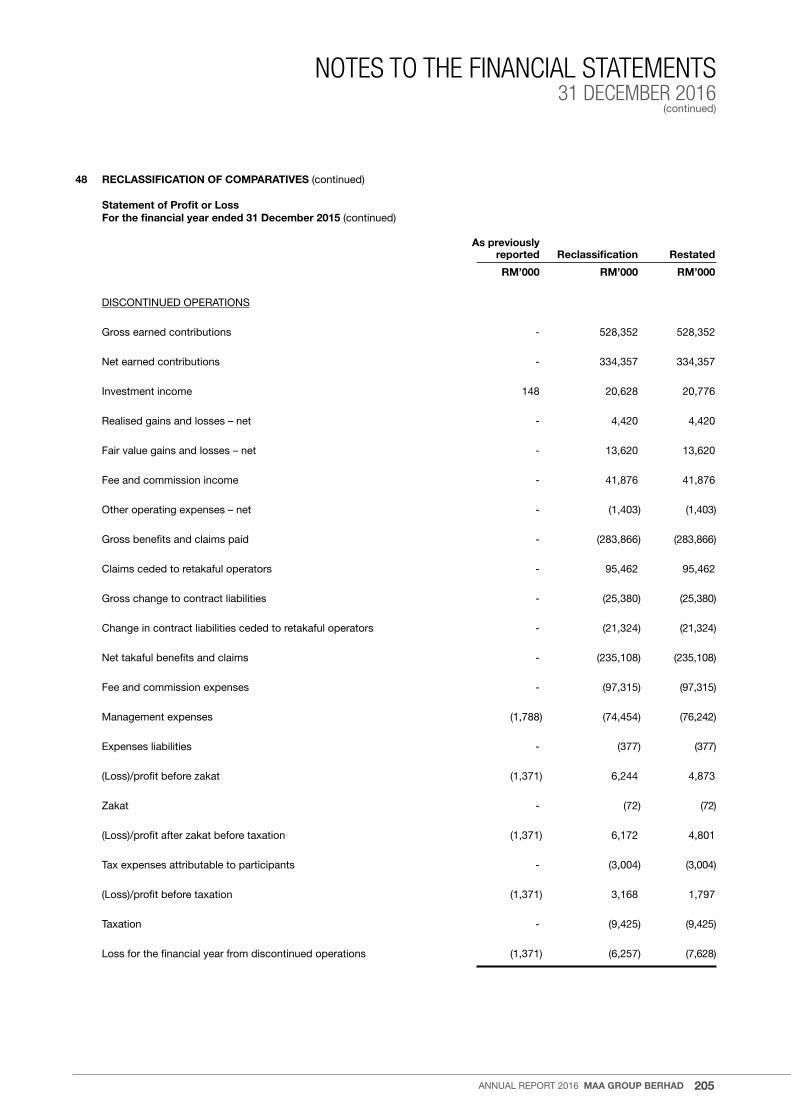
205
NOTES TO THE FINANCIAL STATEMENTS31 DECEMBER 2016
(continued)
annual report 2016 MAA GROUP BERHAD
48 RECLASSIFICATION OF COMPARATIVES (continued)
Statement of Profit or Loss For the financial year ended 31 December 2015 (continued)
As previously reported Reclassification Restated
RM’000 RM’000 RM’000
DISContInueD operatIonS
Gross earned contributions - 528,352 528,352
net earned contributions - 334,357 334,357
Investment income 148 20,628 20,776
realised gains and losses – net - 4,420 4,420
Fair value gains and losses – net - 13,620 13,620
Fee and commission income - 41,876 41,876
other operating expenses – net - (1,403) (1,403)
Gross benefits and claims paid - (283,866) (283,866)
Claims ceded to retakaful operators - 95,462 95,462
Gross change to contract liabilities - (25,380) (25,380)
Change in contract liabilities ceded to retakaful operators - (21,324) (21,324)
net takaful benefits and claims - (235,108) (235,108)
Fee and commission expenses - (97,315) (97,315)
Management expenses (1,788) (74,454) (76,242)
expenses liabilities - (377) (377)
(loss)/profit before zakat (1,371) 6,244 4,873
Zakat - (72) (72)
(loss)/profit after zakat before taxation (1,371) 6,172 4,801
tax expenses attributable to participants - (3,004) (3,004)
(loss)/profit before taxation (1,371) 3,168 1,797
taxation - (9,425) (9,425)
loss for the financial year from discontinued operations (1,371) (6,257) (7,628)

206
NOTES TO THE FINANCIAL STATEMENTS31 DECEMBER 2016(continued)
MAA GROUP BERHAD annual report 2016
49 DISCLOSURE OF REALISED AND UNREALISED PROFITS
the following analysis of realised and unrealised retained profits at the legal entity level is prepared in accordance with Guidance of Special Matter no.1, Determination of realised and unrealised profits or losses in the Context of Disclosure pursuant to Bursa Securities listing requirements, issued by the Malaysian Institute of accountants whilst the disclosure at the Group level is based on the prescribed format by the Bursa Securities.
GROUP COMPANY
31.12.2016 31.12.2015 31.12.2016 31.12.2015
RM’000 RM’000 RM’000 RM’000
total retained earnings:
realised 211,670 91,845 152,436 12,191
unrealised 11,039 14,845 (185) (107)
222,709 106,690 152,251 12,084
total share of accumulated profits/(losses) from associates:
- realised 9,475 (56) - -
- unrealised (875) 3,928 - -
8,600 3,872 - -
231,309 110,562 152,251 12,084
less: Consolidation adjustments 8,855 2,081 - -
total retained earnings 240,164 112,643 152,251 12,084
the disclosure of realised and unrealised profits/(losses) above is solely for compliance with the directive issued by Bursa Securities
and should not be used for any other purpose.