notice of acquisition and disposition of assets, and the ... of... · 2 (2) outline of assets to be...
TRANSCRIPT
1
December 18, 2017
To All Concerned Parties
Name of REIT Issuer:
Nippon Building Fund, Inc.
Yoshiki Kageyama, Executive Director
(TSE Code : 8951)
Contact:
Asset Management Company
Nippon Building Fund Management, Ltd.
Kenichi Tanaka, President and CEO
Person to Contact:
Yutaka Kaneko, General Manager
(TEL. +81-3-6259-8681)
Notice of Acquisition and Disposition of Assets,
and the Commencement and Termination of Leases
(Acquisition of Roppongi T-CUBE and one other property,
and disposition of NBF Hibiya Bldg. and two other properties)
Nippon Building Fund Management, Ltd. ("NBFM"), to which Nippon Building Fund, Inc. (“NBF”) entrusts
asset management services, hereby provides notice of its decision on December 18, 2017 on acquisition
and disposition of assets (“Transactions”) as follows:
The Transactions will result in the commencement of leases for the acquisition of assets, as well as the
termination of leases for the disposition of assets.
Description
1. Summary of Transactions
(1) Outline of Assets to be Acquired
Assets to be Acquired; names of assets; acquisition price
NO. Assets to be Acquired Name of Assets
Acquisition Price
(*1)
I. Trust beneficiary right in
real estate Roppongi T-CUBE ¥62,800,000,000
II. Real Property
Celestine Shiba Mitsui Bldg.
(Additional Acquisition) ¥19,500,000,000
Total ¥82,300,000,000
*1 Miscellaneous acquisition costs, adjusted amount of fixed assets tax and city-planning tax, as
well as consumption tax etc. are excluded from this amount.

2
(2) Outline of Assets to be Disposed
1) Assets to be Disposed; name of assets; disposition price
NO. Assets to be Disposed Name of Assets Disposition Price
(*2)
III. Trust beneficiary right in
real estate NBF Hibiya Bldg. ¥64,000,000,000
IV. Trust beneficiary right in
real estate GSK Bldg. ¥17,000,000,000
V. Real Property
*Upon the disposition,
the trust of the Real
Property will be
established on the same
date as the delivery
date, and the trust
beneficiary right in real
estate will be
transferred.
NBF Shin-Urayasu Tower ¥11,700,000,000
Total ¥92,700,000,000
*2 The adjusted amount of fixed assets tax and city-planning tax, as well as consumption tax etc.
are excluded from this amount.
2) Difference between disposition price and book value (As of June 30, 2017)
Book value
(as of June 30, 2017)
Difference between disposition price and book value
(*3)
(“Disposition price” as stated above
minus “book value”)
III. ¥63,757,220,070 ¥242,779,930
IV. ¥11,535,424,018 ¥5,464,575,982
V. ¥15,611,360,287 (¥3,911,360,287)
Total ¥90,904,004,375 ¥1,795,995,625
*3 The above figures are for reference only and based on the book value as of June 30, 2017,
which may differ from the actual figures at the time of disposition.
(3) Counterparties to Transactions; date of contracts; dates of transfer
Counterparty (*4) Date of Contract Date of Transfer
(expected)
Acquisitions I.
Mitsui Fudosan Co., Ltd .
("Mitsui Fudosan")
December 18, 2017
March 30, 2018
II.
Dispositions
III.
IV. Mitsui Fudosan Residential
Co.,Ltd.
("Mitsui Fudosan Residential")
December 26, 2017
V. Undisclosed (Domestic special
purpose company) December 20, 2017
*4 Please see “4. Outline of Counterparties to Transactions” below for more details.
3
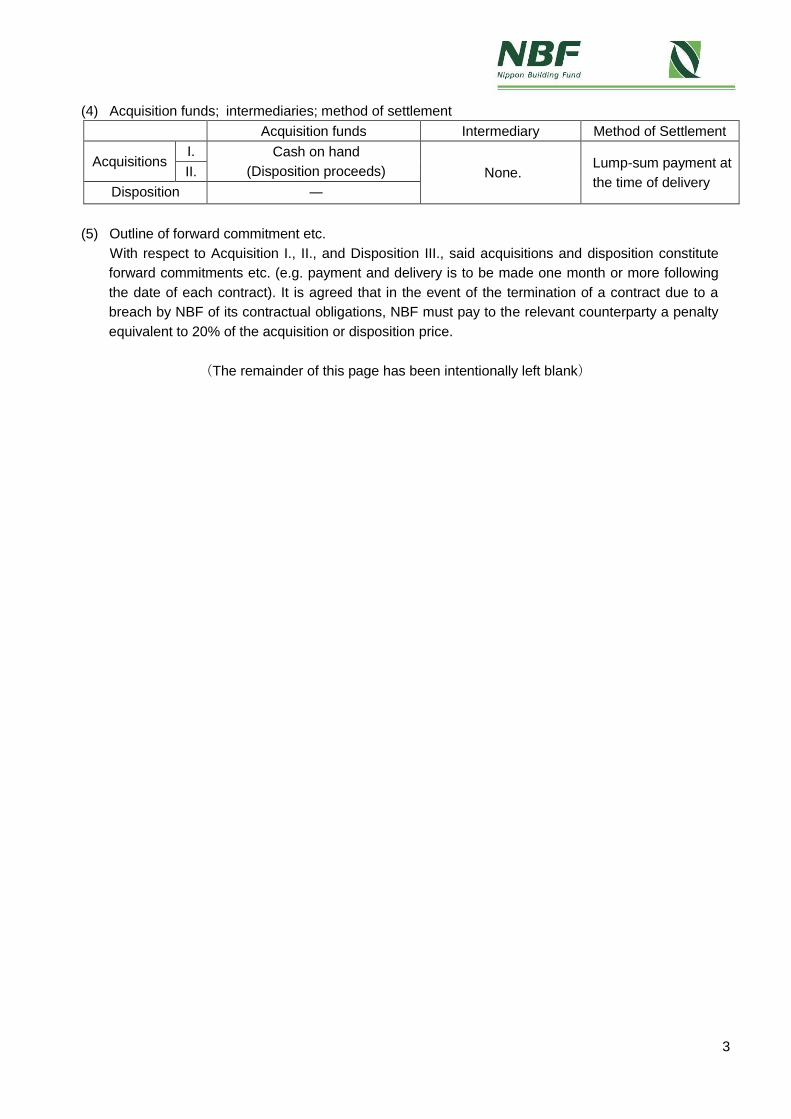
(4) Acquisition funds; intermediaries; method of settlement
Acquisition funds Intermediary Method of Settlement
Acquisitions I. Cash on hand
(Disposition proceeds) None. Lump-sum payment at
the time of delivery II.
Disposition ―
(5) Outline of forward commitment etc.
With respect to Acquisition I., II., and Disposition III., said acquisitions and disposition constitute
forward commitments etc. (e.g. payment and delivery is to be made one month or more following
the date of each contract). It is agreed that in the event of the termination of a contract due to a
breach by NBF of its contractual obligations, NBF must pay to the relevant counterparty a penalty
equivalent to 20% of the acquisition or disposition price.
(The remainder of this page has been intentionally left blank)

4
2. Objective of the Transactions
The Transactions take advantage of the favorable real estate transaction market, and represent a
sizable replacement of properties in the portfolio, which will improve the mid-to-long-term underlying
earnings capability of the portfolio.
NBF is utilizing the comprehensive strength of the Mitsui Fudosan Group, our main sponsor. Together
with transaction with a third party, NBF can achieve a more effective, large-sized deal and intends to
improve unitholder value
Through these Transactions, NBF will simultaneously:
(1)Lower the average age of the portfolio,
(2)Increase NAV (net asset value), and
(3)Improve earnings capability
Meanwhile, more than 10 billion yen will be collected and added to the investment capability of
NBF.
The NBF Hibiya Building, a property in the Transactions, is one of our flagship properties in central
Tokyo. It is a competitive property facing the Hibiya Park, but 33 years has passed since its construction
in 1984, and with the abundant supply of high-spec large-sized offices in central Tokyo, the yield has
been sluggish, and the property has consistently had an unrealized loss. Meanwhile, the “Tokyo Midtown
Hibiya”, which Mitsui Fudosan has been working on in the adjacent area for a long time, is expected to
have its grand opening next March. With this opening, the attractiveness of the Hibiya area is expected to
improve, and we are seizing the opportunity to dispose this property to Mitsui Fudosan, who regards the
property as having even more value considering its development potential.
Meanwhile, the Roppongi T-CUBE property which is to be acquired is a large-scale property for which
Mitsui Fudosan took the lead in the development. This will be the first opportunity for NBF to invest in the
Roppongi area. The property has direct connection to the Roppongi Icchome Station on the Tokyo Metro
Namboku Line. It is a relatively new, high quality property that mainly consists of office space, as well as
high-end residential for lease on the upper floors, and retail facilities etc. on the lower floors. With its
strong locational characteristics, size, building grade etc., it can newly be positioned as one of our
flagship properties.
The other property to be acquired is the Celestine Shiba Mitsui Building (additional acquisition), which
is a property in which NBF has owned sectional ownership and co-ownership of sectional ownership in
the office and retail space. With this additional acquisition, NBF will gain full ownership of the property,
including the hotel portion, and it will also become one of our flagship properties, with a total investment
size of 42 billion yen. The hotel portion has undergone a major refurbishment by the Mitsui Fudosan
Group this autumn, and has reopened as a high-class brand hotel, under the name of “Hotel The
Celestine Tokyo Shiba”, adding to the attractiveness of the property.
As for the GSK Building, we have received a departure notice from the tenant for the entire building,
which is taking place next January. NBF considered continuing to lease the office property and several
other options. Having conducted office leasing activities, and considering the costs of renewal work for
office lease as well as the losses to be incurred from the downtime, we came to the conclusion that it was

5
best to dispose the property as a potential residential development, with its good transportation access,
local environment, views, etc. We have thus decided to dispose the property to Mitsui Fudosan
Residential, which has strength in high-end condominium development in central Tokyo.
As for the NBF Shin-Urayasu Tower, there has been a significant decline in the market rent in the local
area since the acquisition in March 2008, with the Financial Crisis followed by the impact from the Great
East Japan Earthquake, as well as other factors. The appraisal value has continuously been lower than
the book value, and with no major improvement expected, we have decided to dispose and replace the
property.
(The remainder of this page has been intentionally left blank)

6
A summary of the above, based on (1) building age, (2) NAV and (3) earnings capability, is as follows:
(1) The lowering of the average age
The assets to be disposed are all around 30 years old, which is much older than the average age
of the portfolio, which is 18.85 years as of the end of the first half of 2017 (the 32nd fiscal period).
Meanwhile the average age of the properties to be acquired is around 15 years.
With the disposals and the acquisitions, the actual average age of the portfolio will be lowered by
around 1.4 years, as shown below.
<Assets to be Acquired>(*5) <Assets to be Disposed>(*5)
<Portfolio average>
*5 Assumptions for the end of the 1st half of 2018 (the 34th fiscal period)
*6 Assumes the Transactions do not take place, and there are no other changes to the portfolio
*7 Assumes the Transactions do take place, but there are no other changes to the portfolio
*5-7“Total” and “Average” years are weighted average figures, based on acquisition price.
(The remainder of this page has been intentionally left blank)
Building age
Ⅰ. 14.75 years
Ⅱ. 16.17 years
Total 15.09 years
Building age
Ⅲ. 34.00 years
Ⅳ. 27.58 years
Ⅴ. 27.67 years
Total 31.95 years
Actual, as of the end
of the 1st half of 2017
(the 32nd fiscal
period)
Forecast, as of the
end of the 1st half of
2018
(the 34th fiscal
period) (*6)
Average 18.85 years 19.85 years
Forecast, as of the
end of the 1st half of
2018 (the 34th fiscal
period) (*7)
18.45 years Following the
Transactions
Effectively
brings down the
average age by
1.4 years
7
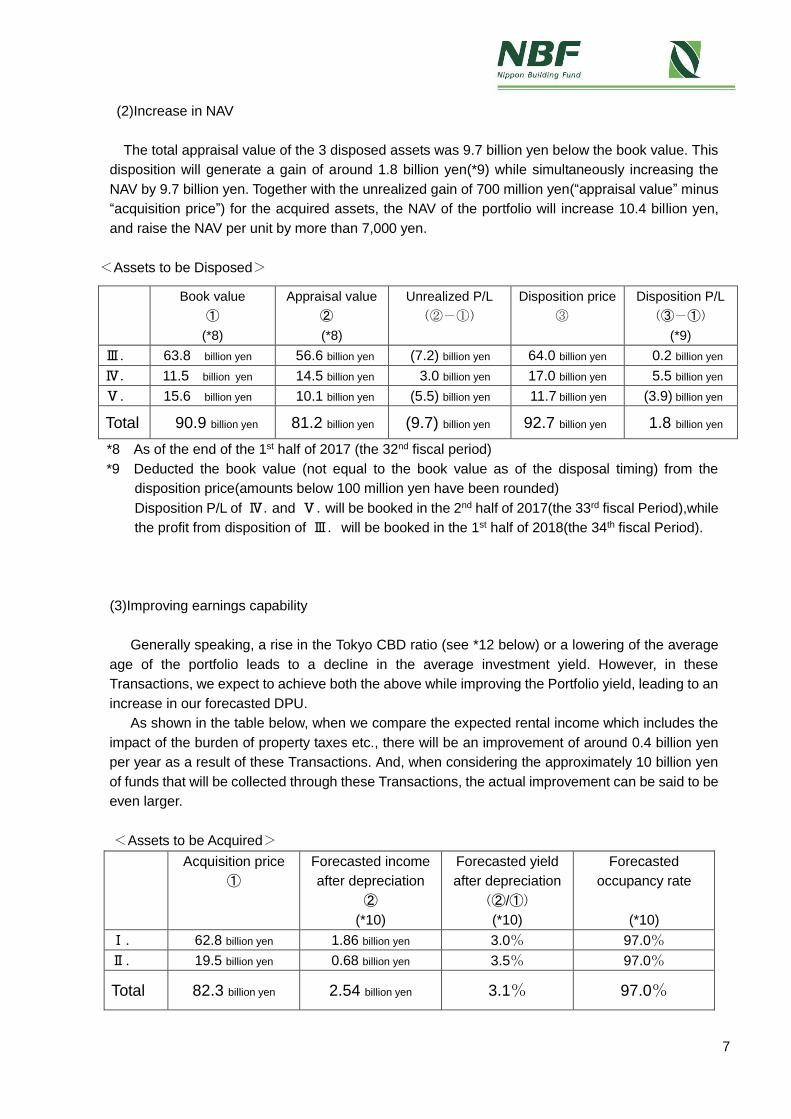
(2)Increase in NAV
The total appraisal value of the 3 disposed assets was 9.7 billion yen below the book value. This
disposition will generate a gain of around 1.8 billion yen(*9) while simultaneously increasing the
NAV by 9.7 billion yen. Together with the unrealized gain of 700 million yen(“appraisal value” minus
“acquisition price”) for the acquired assets, the NAV of the portfolio will increase 10.4 billion yen,
and raise the NAV per unit by more than 7,000 yen.
<Assets to be Disposed>
*8 As of the end of the 1st half of 2017 (the 32nd fiscal period)
*9 Deducted the book value (not equal to the book value as of the disposal timing) from the
disposition price(amounts below 100 million yen have been rounded)
Disposition P/L of Ⅳ.and Ⅴ.will be booked in the 2nd half of 2017(the 33rd fiscal Period),while
the profit from disposition of Ⅲ.will be booked in the 1st half of 2018(the 34th fiscal Period).
(3)Improving earnings capability
Generally speaking, a rise in the Tokyo CBD ratio (see *12 below) or a lowering of the average
age of the portfolio leads to a decline in the average investment yield. However, in these
Transactions, we expect to achieve both the above while improving the Portfolio yield, leading to an
increase in our forecasted DPU.
As shown in the table below, when we compare the expected rental income which includes the
impact of the burden of property taxes etc., there will be an improvement of around 0.4 billion yen
per year as a result of these Transactions. And, when considering the approximately 10 billion yen
of funds that will be collected through these Transactions, the actual improvement can be said to be
even larger.
<Assets to be Acquired>
Book value
①
(*8)
Appraisal value
②
(*8)
Unrealized P/L
(②-①)
Disposition price
③
Disposition P/L
(③-①)
(*9)
Ⅲ. 63.8 billion yen 56.6 billion yen (7.2) billion yen 64.0 billion yen 0.2 billion yen
Ⅳ. 11.5 billion yen 14.5 billion yen 3.0 billion yen 17.0 billion yen 5.5 billion yen
Ⅴ. 15.6 billion yen 10.1 billion yen (5.5) billion yen 11.7 billion yen (3.9) billion yen
Total 90.9 billion yen 81.2 billion yen (9.7) billion yen 92.7 billion yen 1.8 billion yen
Acquisition price
①
Forecasted income
after depreciation
②
(*10)
Forecasted yield
after depreciation
(②/①)
(*10)
Forecasted
occupancy rate
(*10)
Ⅰ. 62.8 billion yen 1.86 billion yen 3.0% 97.0%
Ⅱ. 19.5 billion yen 0.68 billion yen 3.5% 97.0%
Total 82.3 billion yen 2.54 billion yen 3.1% 97.0%

8
<Assets to be Disposed>
*10 ・The forecasted income after depreciation assumes annual stabilized operations, based on
the lease terms etc. as of the acquisition date (compiled from documents received from the
sellers), as well as the payment of taxes etc. (rounded to the first decimal point).
・The forecasted occupancy rate outlined in I and II applies only to the office section. 90.0%
has been applied to the serviced apartment section in I, and 100.0% to the hotel section in
II.
*11 Actual annual income after depreciation has been calculated using the actual figures of the
2nd half of 2016 (the 31st fiscal period) and the 1st half of 2017 (the 32nd fiscal
period)(rounded to the first decimal point).
*10,11 The respective yields after depreciation have been calculated by dividing the incomes
after depreciation by the acquisition/disposition prices (rounded to the first decimal point).
*12 Investment amount/ratio by geography
Actual figures <As of the end of the 1st half of 2017 (the 32nd fiscal period)>
23 Wards of Tokyo
(Tokyo CBD ratio)
Out of which, the
central 5 wards
of Tokyo
Other Greater
Tokyo
Other Cities Total
878.2 billion yen
(79.4%)
559.0 billion yen
(50.5%)
100.7 billion yen
(9.1%)
127.6 billion yen
(11.5%)
1,106.6 billion yen
(100.0%)
Forecast <As of the end of the 1st half of 2018 (the 34th fiscal period) (*7)
23 Wards of Tokyo
(Tokyo CBD ratio)
Out of which, the
central 5 wards
of Tokyo
Other Greater
Tokyo
Other Cities Total
882.5 billion yen
(80.6%)
563.4 billion yen
(51.4%)
85.0 billion yen
(7.8%)
127.6 billion yen
(11.6%)
1,095.2 billion yen
(100.0%)
(The remainder of this page has been intentionally left blank)
Disposition price
③
Actual income after
depreciation
④
(*11)
Actual yield after
depreciation
(④/③)
(*11)
Actual occupancy
rate
(average during the
period)
Ⅲ. 64.0 billion yen 1.19 billion yen 1.9% 96.6%
Ⅳ. 17.0 billion yen 0.66 billion yen 3.9% 100.0%
Ⅴ. 11.7 billion yen 0.27 billion yen 2.3% 95.1%
Total 92.7 billion yen 2.12 billion yen 2.3% 98.3%
9
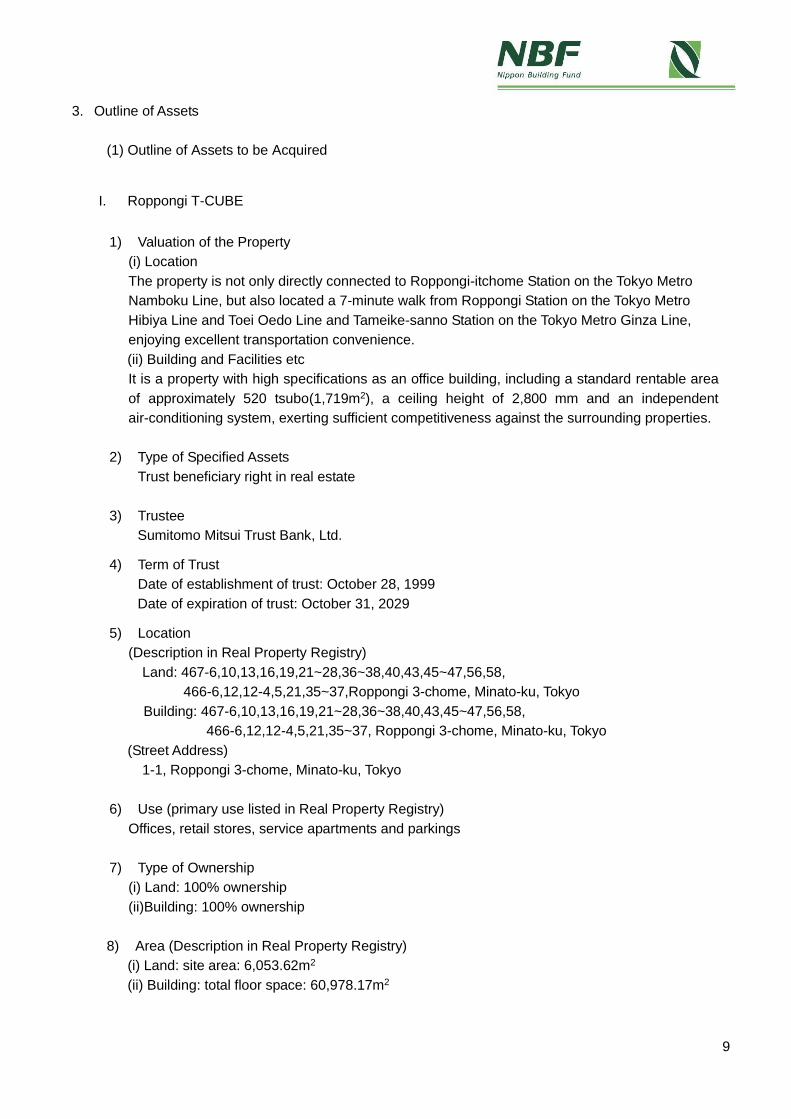
3. Outline of Assets
(1) Outline of Assets to be Acquired
I. Roppongi T-CUBE
1) Valuation of the Property
(i) Location
The property is not only directly connected to Roppongi-itchome Station on the Tokyo Metro
Namboku Line, but also located a 7-minute walk from Roppongi Station on the Tokyo Metro
Hibiya Line and Toei Oedo Line and Tameike-sanno Station on the Tokyo Metro Ginza Line,
enjoying excellent transportation convenience.
(ii) Building and Facilities etc
It is a property with high specifications as an office building, including a standard rentable area
of approximately 520 tsubo(1,719m2), a ceiling height of 2,800 mm and an independent
air-conditioning system, exerting sufficient competitiveness against the surrounding properties.
2) Type of Specified Assets
Trust beneficiary right in real estate
3) Trustee
Sumitomo Mitsui Trust Bank, Ltd.
4) Term of Trust
Date of establishment of trust: October 28, 1999
Date of expiration of trust: October 31, 2029
5) Location
(Description in Real Property Registry)
Land: 467-6,10,13,16,19,21~28,36~38,40,43,45~47,56,58,
466-6,12,12-4,5,21,35~37,Roppongi 3-chome, Minato-ku, Tokyo
Building: 467-6,10,13,16,19,21~28,36~38,40,43,45~47,56,58,
466-6,12,12-4,5,21,35~37, Roppongi 3-chome, Minato-ku, Tokyo
(Street Address)
1-1, Roppongi 3-chome, Minato-ku, Tokyo
6) Use (primary use listed in Real Property Registry)
Offices, retail stores, service apartments and parkings
7) Type of Ownership
(i) Land: 100% ownership
(ii)Building: 100% ownership
8) Area (Description in Real Property Registry)
(i) Land: site area: 6,053.62m2
(ii) Building: total floor space: 60,978.17m2

10
9 ) Structure (Description in Real Property Registry)
Steel frame and steel framed reinforced concrete structure, flat roof, 27 floors above ground and
1 floor below ground
10) Completion (Description in Real Property Registry)
September 30, 2003
11) Design and Construction
Design: Nihon Sekkei Inc.
Construction: Nishimatsu Construction Co., Ltd
12) Earthquake PML
1.6% (obtained from the building condition investigation report prepared by Engineering & Risk
Services Corporation)
13) Existence of Secured Interests (liens)
None.
14) Description of Tenants (Tenancy as of November 30, 2017)
NBF will lease the property (offices, retail stores, service apartments) in its entirety to Mitsui
Fudosan, the lone tenant. Mitsui Fudosan will sublease the property to its sublessees.
Furthermore, the tenant meets the selection standards of NBF listed in the “Report on the
Operation System of Issuer of Real Estate Investment Trust Securities” dated September 28,
2017.
The status of sub-lessees as of November 30, 2017 is as follows.
Total number and summary of lessees: 14 companies (7 general business companies and 7
retail stores)
Total rental revenues: approximately ¥3,006 million/year (rent received by NBF from Mitsui
Fudosan)
Total rentable area: 34,637.03m2
Total leased(sub-leased) area: 34,619.12m2
Occupancy Rate: 99.9%
Total lease deposit amount: approximately ¥2,367 million(lease deposit deposited to NBF by
Mitsui Fudosan)
(The remainder of this page has been intentionally left blank)
11
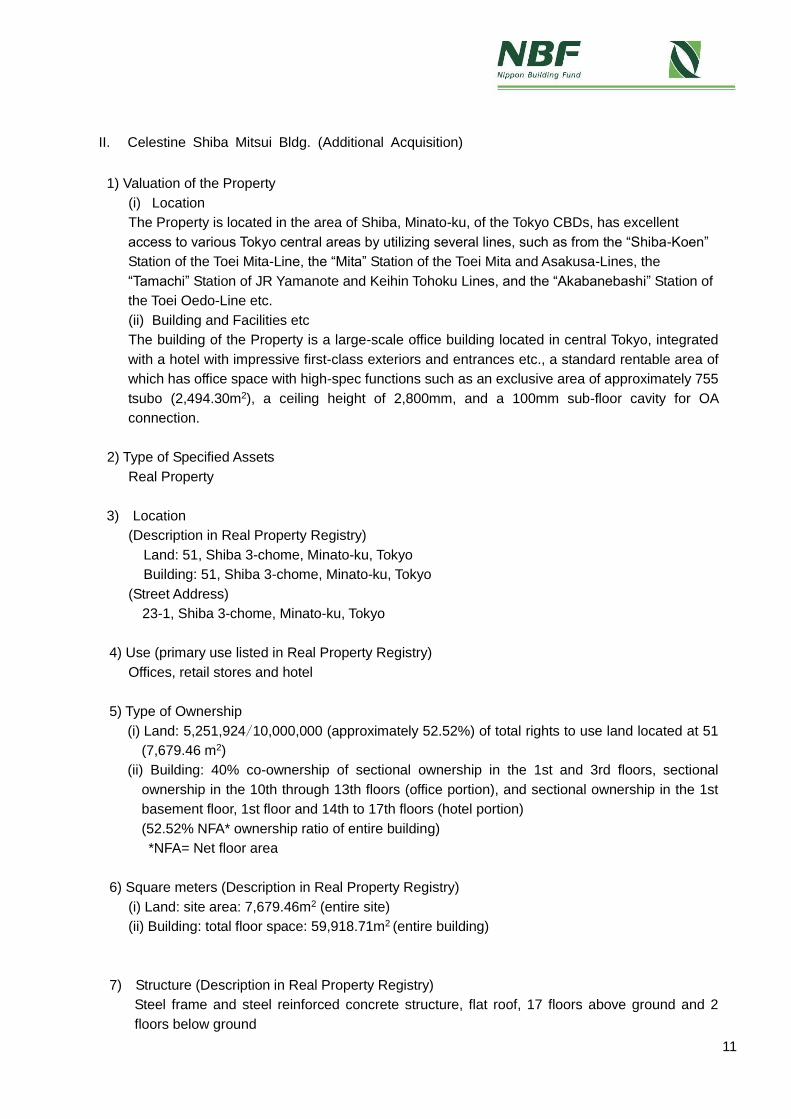
II. Celestine Shiba Mitsui Bldg. (Additional Acquisition)
1) Valuation of the Property
(i) Location
The Property is located in the area of Shiba, Minato-ku, of the Tokyo CBDs, has excellent
access to various Tokyo central areas by utilizing several lines, such as from the “Shiba-Koen”
Station of the Toei Mita-Line, the “Mita” Station of the Toei Mita and Asakusa-Lines, the
“Tamachi” Station of JR Yamanote and Keihin Tohoku Lines, and the “Akabanebashi” Station of
the Toei Oedo-Line etc.
(ii) Building and Facilities etc
The building of the Property is a large-scale office building located in central Tokyo, integrated
with a hotel with impressive first-class exteriors and entrances etc., a standard rentable area of
which has office space with high-spec functions such as an exclusive area of approximately 755
tsubo (2,494.30m2), a ceiling height of 2,800mm, and a 100mm sub-floor cavity for OA
connection.
2) Type of Specified Assets
Real Property
3) Location
(Description in Real Property Registry)
Land: 51, Shiba 3-chome, Minato-ku, Tokyo
Building: 51, Shiba 3-chome, Minato-ku, Tokyo
(Street Address)
23-1, Shiba 3-chome, Minato-ku, Tokyo
4) Use (primary use listed in Real Property Registry)
Offices, retail stores and hotel
5) Type of Ownership
(i) Land: 5,251,924/10,000,000 (approximately 52.52%) of total rights to use land located at 51
(7,679.46 m2)
(ii) Building: 40% co-ownership of sectional ownership in the 1st and 3rd floors, sectional
ownership in the 10th through 13th floors (office portion), and sectional ownership in the 1st
basement floor, 1st floor and 14th to 17th floors (hotel portion)
(52.52% NFA* ownership ratio of entire building)
*NFA= Net floor area
6) Square meters (Description in Real Property Registry)
(i) Land: site area: 7,679.46m2 (entire site)
(ii) Building: total floor space: 59,918.71m2 (entire building)
7) Structure (Description in Real Property Registry)
Steel frame and steel reinforced concrete structure, flat roof, 17 floors above ground and 2
floors below ground
12
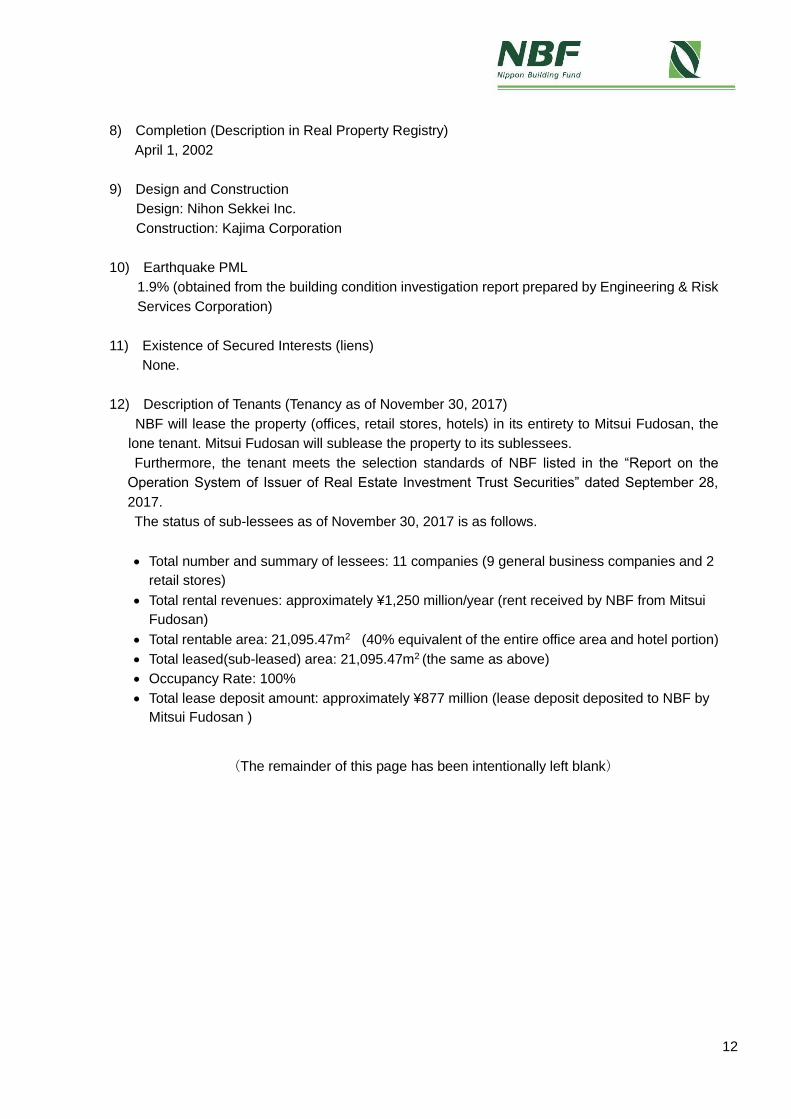
8) Completion (Description in Real Property Registry)
April 1, 2002
9) Design and Construction
Design: Nihon Sekkei Inc.
Construction: Kajima Corporation
10) Earthquake PML
1.9% (obtained from the building condition investigation report prepared by Engineering & Risk
Services Corporation)
11) Existence of Secured Interests (liens)
None.
12) Description of Tenants (Tenancy as of November 30, 2017)
NBF will lease the property (offices, retail stores, hotels) in its entirety to Mitsui Fudosan, the
lone tenant. Mitsui Fudosan will sublease the property to its sublessees.
Furthermore, the tenant meets the selection standards of NBF listed in the “Report on the
Operation System of Issuer of Real Estate Investment Trust Securities” dated September 28,
2017.
The status of sub-lessees as of November 30, 2017 is as follows.
Total number and summary of lessees: 11 companies (9 general business companies and 2
retail stores)
Total rental revenues: approximately ¥1,250 million/year (rent received by NBF from Mitsui
Fudosan)
Total rentable area: 21,095.47m2 (40% equivalent of the entire office area and hotel portion)
Total leased(sub-leased) area: 21,095.47m2 (the same as above)
Occupancy Rate: 100%
Total lease deposit amount: approximately ¥877 million (lease deposit deposited to NBF by
Mitsui Fudosan )
(The remainder of this page has been intentionally left blank)
13
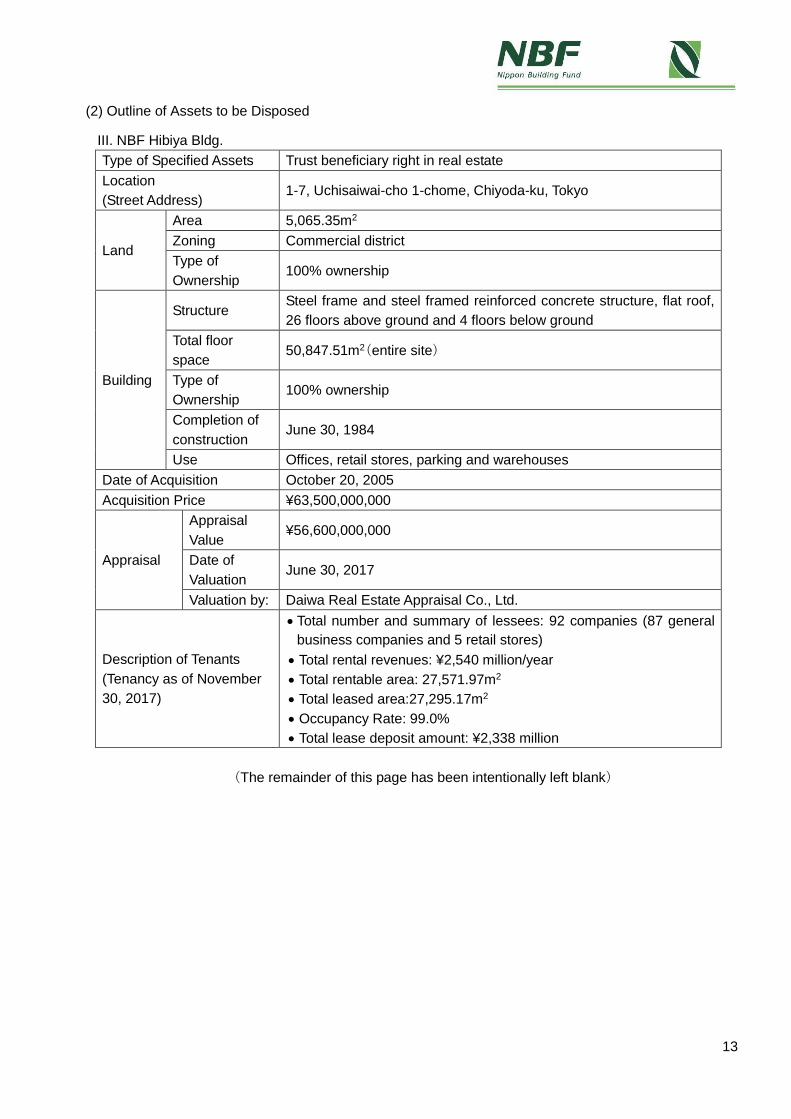
(2) Outline of Assets to be Disposed
III. NBF Hibiya Bldg.
Type of Specified Assets Trust beneficiary right in real estate
Location
(Street Address) 1-7, Uchisaiwai-cho 1-chome, Chiyoda-ku, Tokyo
Land
Area 5,065.35m2
Zoning Commercial district
Type of
Ownership 100% ownership
Building
Structure Steel frame and steel framed reinforced concrete structure, flat roof,
26 floors above ground and 4 floors below ground
Total floor
space 50,847.51m2(entire site)
Type of
Ownership 100% ownership
Completion of
construction June 30, 1984
Use Offices, retail stores, parking and warehouses
Date of Acquisition October 20, 2005
Acquisition Price ¥63,500,000,000
Appraisal
Appraisal
Value ¥56,600,000,000
Date of
Valuation June 30, 2017
Valuation by: Daiwa Real Estate Appraisal Co., Ltd.
Description of Tenants
(Tenancy as of November
30, 2017)
Total number and summary of lessees: 92 companies (87 general
business companies and 5 retail stores)
Total rental revenues: ¥2,540 million/year
Total rentable area: 27,571.97m2
Total leased area:27,295.17m2
Occupancy Rate: 99.0%
Total lease deposit amount: ¥2,338 million
(The remainder of this page has been intentionally left blank)
14
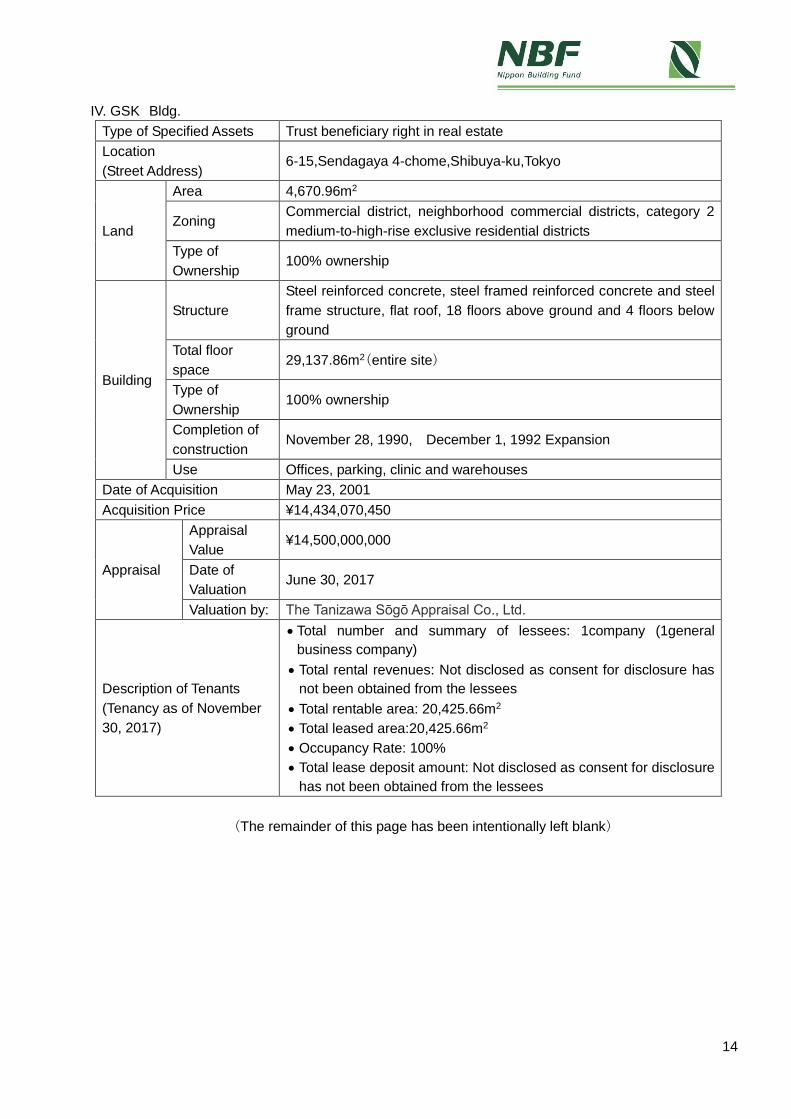
IV. GSK Bldg.
Type of Specified Assets Trust beneficiary right in real estate
Location
(Street Address) 6-15,Sendagaya 4-chome,Shibuya-ku,Tokyo
Land
Area 4,670.96m2
Zoning Commercial district, neighborhood commercial districts, category 2
medium-to-high-rise exclusive residential districts
Type of
Ownership 100% ownership
Building
Structure
Steel reinforced concrete, steel framed reinforced concrete and steel
frame structure, flat roof, 18 floors above ground and 4 floors below
ground
Total floor
space 29,137.86m2(entire site)
Type of
Ownership 100% ownership
Completion of
construction November 28, 1990, December 1, 1992 Expansion
Use Offices, parking, clinic and warehouses
Date of Acquisition May 23, 2001
Acquisition Price ¥14,434,070,450
Appraisal
Appraisal
Value ¥14,500,000,000
Date of
Valuation June 30, 2017
Valuation by: The Tanizawa Sōgō Appraisal Co., Ltd.
Description of Tenants
(Tenancy as of November
30, 2017)
Total number and summary of lessees: 1company (1general
business company)
Total rental revenues: Not disclosed as consent for disclosure has
not been obtained from the lessees
Total rentable area: 20,425.66m2
Total leased area:20,425.66m2
Occupancy Rate: 100%
Total lease deposit amount: Not disclosed as consent for disclosure
has not been obtained from the lessees
(The remainder of this page has been intentionally left blank)
15
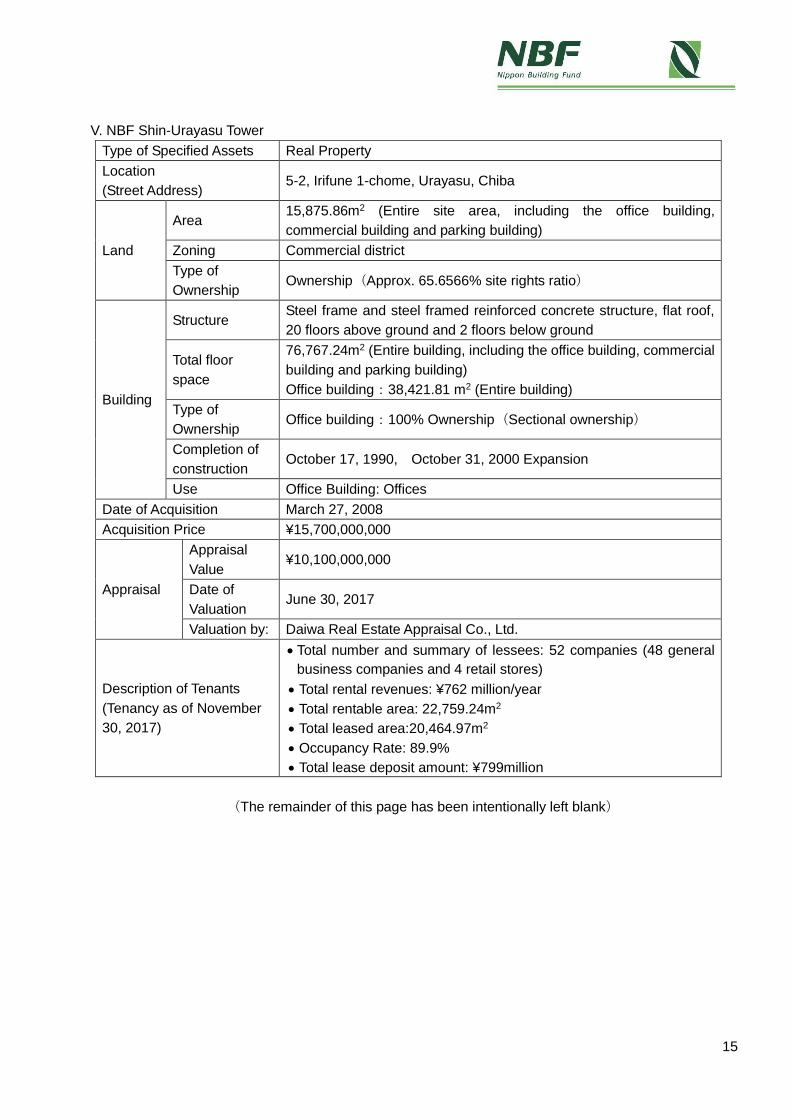
V. NBF Shin-Urayasu Tower
Type of Specified Assets Real Property
Location
(Street Address) 5-2, Irifune 1-chome, Urayasu, Chiba
Land
Area 15,875.86m2 (Entire site area, including the office building,
commercial building and parking building)
Zoning Commercial district
Type of
Ownership Ownership(Approx. 65.6566% site rights ratio)
Building
Structure Steel frame and steel framed reinforced concrete structure, flat roof,
20 floors above ground and 2 floors below ground
Total floor
space
76,767.24m2 (Entire building, including the office building, commercial
building and parking building)
Office building:38,421.81 m2 (Entire building)
Type of
Ownership Office building:100% Ownership(Sectional ownership)
Completion of
construction October 17, 1990, October 31, 2000 Expansion
Use Office Building: Offices
Date of Acquisition March 27, 2008
Acquisition Price ¥15,700,000,000
Appraisal
Appraisal
Value ¥10,100,000,000
Date of
Valuation June 30, 2017
Valuation by: Daiwa Real Estate Appraisal Co., Ltd.
Description of Tenants
(Tenancy as of November
30, 2017)
Total number and summary of lessees: 52 companies (48 general
business companies and 4 retail stores)
Total rental revenues: ¥762 million/year
Total rentable area: 22,759.24m2
Total leased area:20,464.97m2
Occupancy Rate: 89.9%
Total lease deposit amount: ¥799million
(The remainder of this page has been intentionally left blank)
16
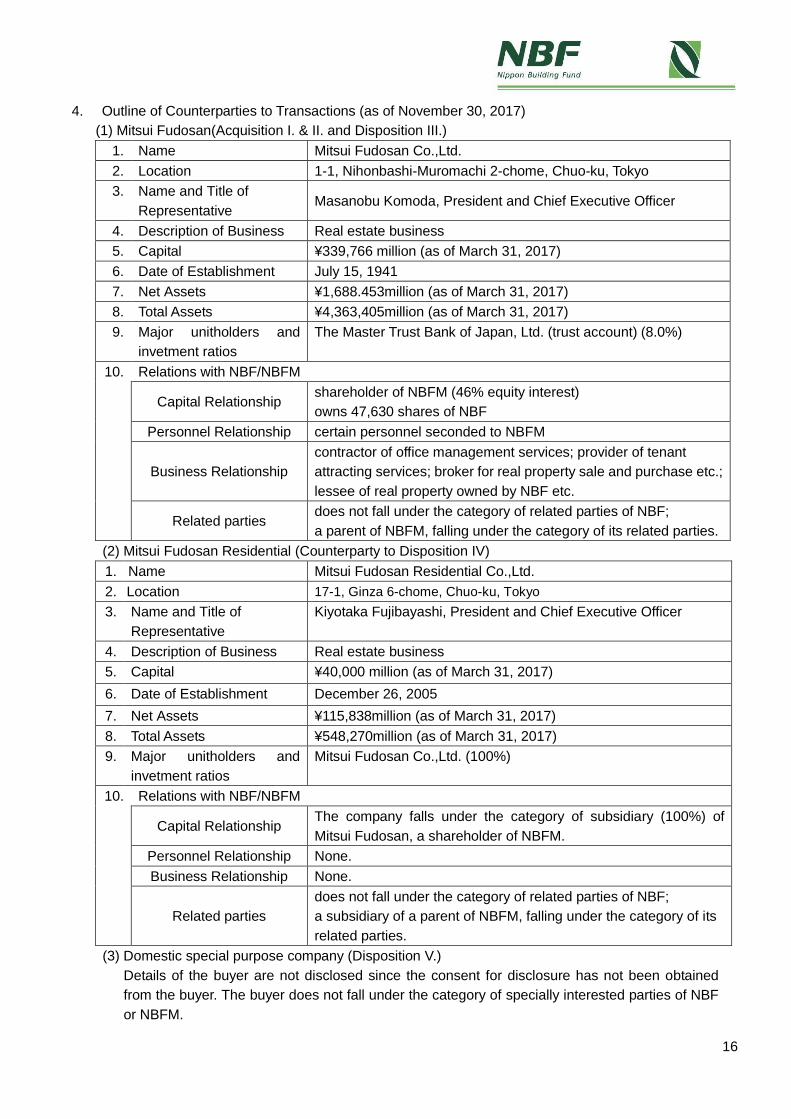
4. Outline of Counterparties to Transactions (as of November 30, 2017)
(1) Mitsui Fudosan(Acquisition I. & II. and Disposition III.)
1. Name Mitsui Fudosan Co.,Ltd.
2. Location 1-1, Nihonbashi-Muromachi 2-chome, Chuo-ku, Tokyo
3. Name and Title of
Representative Masanobu Komoda, President and Chief Executive Officer
4. Description of Business Real estate business
5. Capital ¥339,766 million (as of March 31, 2017)
6. Date of Establishment July 15, 1941
7. Net Assets ¥1,688.453million (as of March 31, 2017)
8. Total Assets ¥4,363,405million (as of March 31, 2017)
9. Major unitholders and
invetment ratios
The Master Trust Bank of Japan, Ltd. (trust account) (8.0%)
10. Relations with NBF/NBFM
Capital Relationship
shareholder of NBFM (46% equity interest)
owns 47,630 shares of NBF
Personnel Relationship certain personnel seconded to NBFM
Business Relationship
contractor of office management services; provider of tenant
attracting services; broker for real property sale and purchase etc.;
lessee of real property owned by NBF etc.
Related parties does not fall under the category of related parties of NBF;
a parent of NBFM, falling under the category of its related parties.
(2) Mitsui Fudosan Residential (Counterparty to Disposition IV)
1. Name Mitsui Fudosan Residential Co.,Ltd.
2. Location 17-1, Ginza 6-chome, Chuo-ku, Tokyo
3. Name and Title of
Representative
Kiyotaka Fujibayashi, President and Chief Executive Officer
4. Description of Business Real estate business
5. Capital ¥40,000 million (as of March 31, 2017)
6. Date of Establishment December 26, 2005
7. Net Assets ¥115,838million (as of March 31, 2017)
8. Total Assets ¥548,270million (as of March 31, 2017)
9. Major unitholders and
invetment ratios
Mitsui Fudosan Co.,Ltd. (100%)
10. Relations with NBF/NBFM
Capital Relationship
The company falls under the category of subsidiary (100%) of
Mitsui Fudosan, a shareholder of NBFM.
Personnel Relationship None.
Business Relationship None.
Related parties
does not fall under the category of related parties of NBF;
a subsidiary of a parent of NBFM, falling under the category of its
related parties.
(3) Domestic special purpose company (Disposition V.)
Details of the buyer are not disclosed since the consent for disclosure has not been obtained
from the buyer. The buyer does not fall under the category of specially interested parties of NBF
or NBFM.

17
5. Status of Owners etc. of the Properties
Name of
Assets
Status of Owners etc. of the Properties
Previous Owner (seller) Earlier Previous Owner
I.
Roppongi
T-CUBE
Corporate Name/Name
①Mitsui Fudosan
②Mitsui Fudosan
①None
②not disclosed as
consent for disclosure
has not been obtained
from the earlier
previous owner
Relationship with a
specially interested
party
falls under the category of
Interested Parties etc. of NBFM
None of the beneficiaries
falls under the category of
a specially interested
party
History/Reason etc. for
acquisition
①new construction
②acquired for the purpose of
investment management
①-
②new construction
Acquisition Price
not disclosed as the previous
owner owned the same for
more than one year
-
Date of Acquisition ①October 29, 2003
②April 1, 2015,March 30, 2016
①-
②October 29, 2003
II.
Celestine
Shiba Mitsui
Bldg. (Addition
al Acquisition)
Corporate Name/Name ①Mitsui Fudosan
②Mitsui Fudosan
①None.
②K.K. Kokusai Kanko
Kaikan
(Current Name: Mitsui
Fudosan Hotel
Management Co., Ltd.)
Relationship with a
specially interested
party
falls under the category of
Interested Parties etc. of NBFM
falls under the category of
Interested Parties etc. of
NBFM
History/Reason etc. for
acquisition
①new construction
②succeeded to building
business of the previous
owner through
absorption-type split
①-
②new construction
Acquisition Price
not disclosed as the previous
owner owned the same for
more than one year
-
Date of Acquisition ①April 22, 2002
②July 2, 2007
①-
②April 22, 2002
(Note) I and II contain portions owned by the Previous Owners from the time of construction completion
(represented by ①) and portions transferred to the Previous Owners by the Earlier Previous Owners
(represented by ②). The status of each purchaser, etc. for I and II is stated above.

18
6. Forecasted Management Situation as at the piriod ending December 2017
For information on the impact of the Transactions upon NBF’s management situation during the
periods ending December 31, 2017, please see the “Notice Concerning Revision of Forecasts of
Operating Results for the Period ending December 31, 2017“ of the same date hereof.
(The remainder of this page has been intentionally left blank)

19
7. Summary of Appraisal Report
I.Roppongi T-CUBE
Property Name Roppongi T-CUBE
Appraisal Value ¥63,000,000 thousand
Appraiser Daiwa Real Estate Appraisal Co., Ltd.
Date of Valuation December 1, 2017
Item
Breakdown
(in thousands
of yen)
Remarks
Appraisal value based on income method
63,000,000 Estimated by combining the appraisal values
under the DCF method and the direct
capitalization method
Appraisal value based on direct
capitalization method
65,000,000
(1) Operating Revenue ((i) - (ii)) 3,466,687
(i) Effective gross income
3,574,552 Estimated based on income consisting of rents,
common area charges, utility charges, parking
rents etc. which are deemed stable on a mid-
and-long-term basis
(ii) Losses from vacancy, etc.
107,866 Estimated based on a vacancy rate which is
deemed stable on a mid- and-long-term basis
(2) Operating Expenses 1,193,956
Building Maintenance Costs/
Property Management Fees
(Note)
586,484 Estimated based on past results verified applying
the level of maintenance costs/property
management fees for similar real properties
Utilities Expenses
191,070 Estimated based on past results verified applying
the level of utilities expenses for similar real
properties
Repair Expenses
21,981 Estimated based on the Engineering Report as
well as the level of repair expenses for similar
real properties
Leasing Expenses, etc.
21,712 Estimated based on the assumed turnover rate
and the level of leasing expenses for similar real
properties
Taxes & Public Duties 349,551 Estimated based on actual taxes in fiscal 2017
etc.
Insurance Premiums 13,157 Estimated based on insurance rates etc. for
similar real properties
Other Expenses 10,000 Estimated based on actual past results etc.
(3) Net Operating Income
((1)-(2))
2,272,731
(4) Investment Income from
Temporary Deposits
26,010 Estimated applying investment return of 1.0%
(5) Capital Expenditure 153,030 Estimated by adding the amount equivalent to
renewal expenses concerning furniture, fixtures,
etc. for the residential portion to the level of
renewal expenses stated in the Engineering
Report
(6) Net Income ((3)+(4)-(5)) 2,145,711
(7) Capitalization Rate
3.3% Estimated taking into consideration examples of
transactions for similar real properties, as well as location and building conditions, and improvements, rights, contractual terms etc. of the Property
20
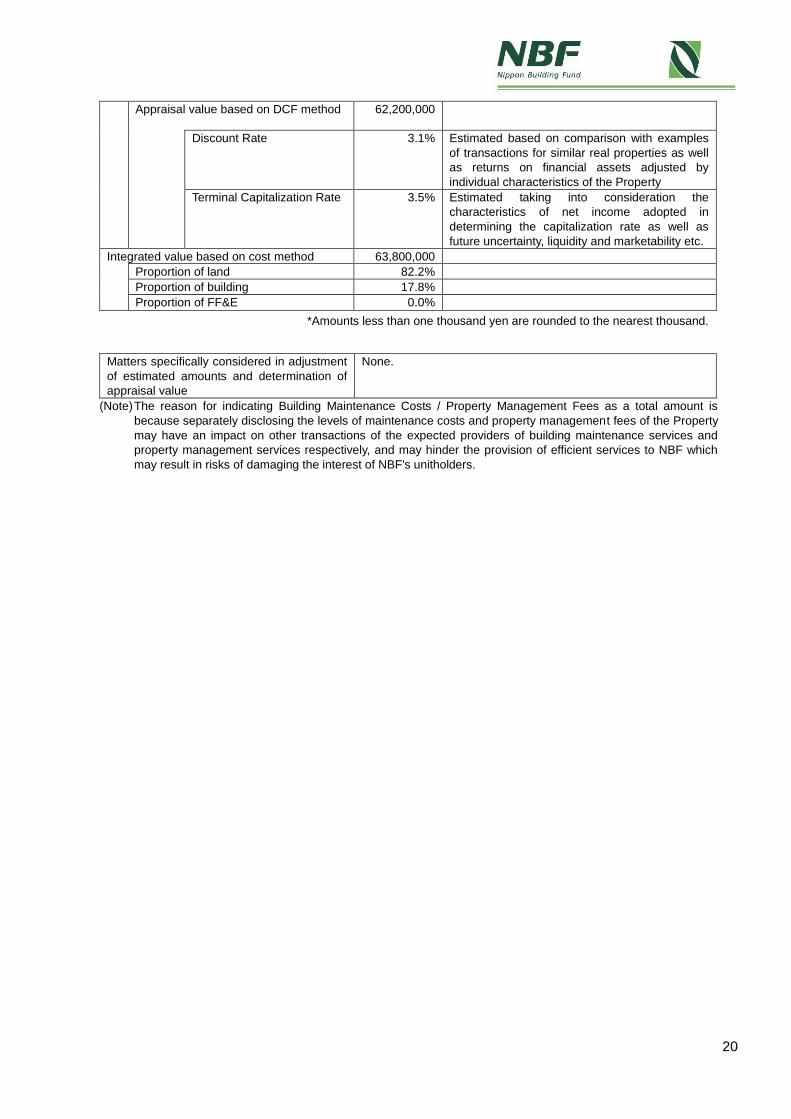
Appraisal value based on DCF method 62,200,000
Discount Rate
3.1% Estimated based on comparison with examples
of transactions for similar real properties as well
as returns on financial assets adjusted by
individual characteristics of the Property
Terminal Capitalization Rate 3.5% Estimated taking into consideration the
characteristics of net income adopted in
determining the capitalization rate as well as
future uncertainty, liquidity and marketability etc.
Integrated value based on cost method 63,800,000
Proportion of land 82.2%
Proportion of building 17.8%
Proportion of FF&E 0.0%
*Amounts less than one thousand yen are rounded to the nearest thousand.
Matters specifically considered in adjustment
of estimated amounts and determination of
appraisal value
None.
(Note) The reason for indicating Building Maintenance Costs / Property Management Fees as a total amount is
because separately disclosing the levels of maintenance costs and property management fees of the Property
may have an impact on other transactions of the expected providers of building maintenance services and
property management services respectively, and may hinder the provision of efficient services to NBF which
may result in risks of damaging the interest of NBF's unitholders.
21
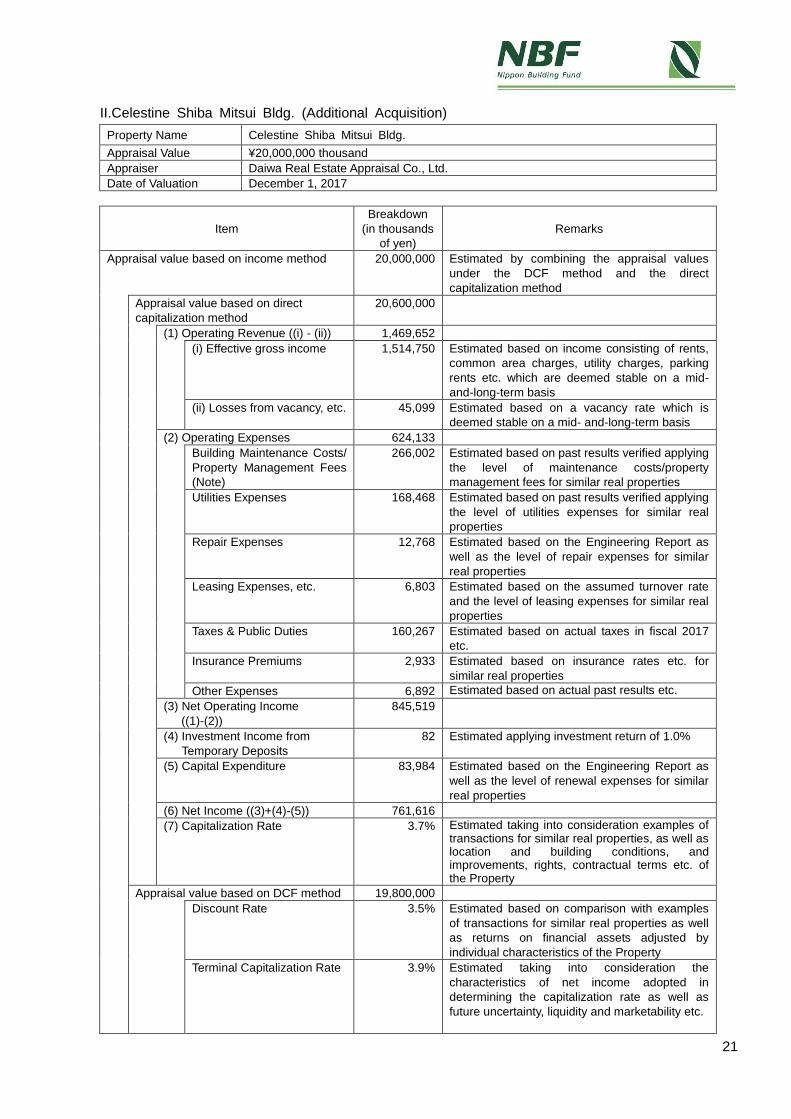
II.Celestine Shiba Mitsui Bldg. (Additional Acquisition)
Property Name Celestine Shiba Mitsui Bldg.
Appraisal Value ¥20,000,000 thousand
Appraiser Daiwa Real Estate Appraisal Co., Ltd.
Date of Valuation December 1, 2017
Item
Breakdown
(in thousands
of yen)
Remarks
Appraisal value based on income method
20,000,000 Estimated by combining the appraisal values
under the DCF method and the direct
capitalization method
Appraisal value based on direct
capitalization method
20,600,000
(1) Operating Revenue ((i) - (ii)) 1,469,652
(i) Effective gross income
1,514,750 Estimated based on income consisting of rents,
common area charges, utility charges, parking
rents etc. which are deemed stable on a mid-
and-long-term basis
(ii) Losses from vacancy, etc.
45,099 Estimated based on a vacancy rate which is
deemed stable on a mid- and-long-term basis
(2) Operating Expenses 624,133
Building Maintenance Costs/
Property Management Fees
(Note)
266,002 Estimated based on past results verified applying
the level of maintenance costs/property
management fees for similar real properties
Utilities Expenses
168,468 Estimated based on past results verified applying
the level of utilities expenses for similar real
properties
Repair Expenses
12,768 Estimated based on the Engineering Report as
well as the level of repair expenses for similar
real properties
Leasing Expenses, etc.
6,803 Estimated based on the assumed turnover rate
and the level of leasing expenses for similar real
properties
Taxes & Public Duties 160,267 Estimated based on actual taxes in fiscal 2017
etc.
Insurance Premiums 2,933 Estimated based on insurance rates etc. for
similar real properties
Other Expenses 6,892 Estimated based on actual past results etc.
(3) Net Operating Income
((1)-(2))
845,519
(4) Investment Income from
Temporary Deposits
82 Estimated applying investment return of 1.0%
(5) Capital Expenditure 83,984 Estimated based on the Engineering Report as
well as the level of renewal expenses for similar
real properties
(6) Net Income ((3)+(4)-(5)) 761,616
(7) Capitalization Rate
3.7% Estimated taking into consideration examples of
transactions for similar real properties, as well as location and building conditions, and improvements, rights, contractual terms etc. of the Property
Appraisal value based on DCF method 19,800,000
Discount Rate
3.5% Estimated based on comparison with examples
of transactions for similar real properties as well
as returns on financial assets adjusted by
individual characteristics of the Property
Terminal Capitalization Rate 3.9% Estimated taking into consideration the
characteristics of net income adopted in
determining the capitalization rate as well as
future uncertainty, liquidity and marketability etc.
22
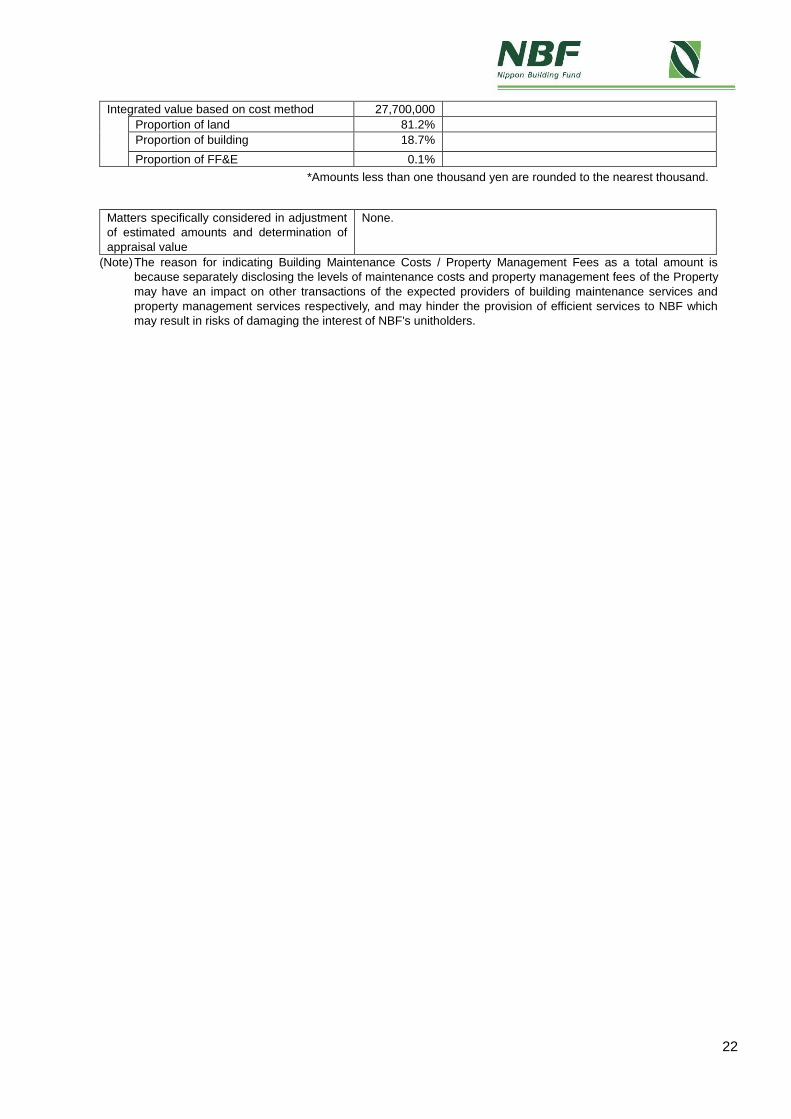
Integrated value based on cost method 27,700,000
Proportion of land 81.2%
Proportion of building 18.7%
Proportion of FF&E 0.1%
*Amounts less than one thousand yen are rounded to the nearest thousand.
Matters specifically considered in adjustment
of estimated amounts and determination of
appraisal value
None.
(Note) The reason for indicating Building Maintenance Costs / Property Management Fees as a total amount is
because separately disclosing the levels of maintenance costs and property management fees of the Property
may have an impact on other transactions of the expected providers of building maintenance services and
property management services respectively, and may hinder the provision of efficient services to NBF which
may result in risks of damaging the interest of NBF's unitholders.

23
III. NBF Hibiya Bldg.
Property Name NBF Hibiya Bldg.
Appraisal Value ¥56,600,000 thousand
Appraiser Daiwa Real Estate Appraisal Co., Ltd.
Date of Valuation June 30, 2017
Item
Breakdown
(in thousands
of yen)
Remarks
Appraisal value based on income method
56,600,000 Estimated by combining the appraisal values
under the DCF method and the direct
capitalization method
Appraisal value based on direct
capitalization method
58,900,000
(1) Operating Revenue ((i) - (ii)) 3,411,216
(i) Effective gross income
3,530,389 Estimated based on income consisting of rents,
common area charges, utility charges, parking
rents etc. which are deemed stable on a mid-
and-long-term basis
(ii) Losses from vacancy, etc.
119,173 Estimated based on a vacancy rate which is
deemed stable on a mid- and-long-term basis
(2) Operating Expenses 1,292,191
Building Maintenance Costs/
Property Management Fees
(Note)
314,495 Estimated based on past results verified applying
the level of maintenance costs/property
management fees for similar real properties
Utilities Expenses
200,177 Estimated based on past results verified applying
the level of utilities expenses for similar real
properties
Repair Expenses
19,888 Estimated based on the Engineering Report as
well as the level of repair expenses for similar
real properties
Leasing Expenses, etc.
22,340 Estimated based on the assumed turnover rate
and the level of leasing expenses for similar real
properties
Taxes & Public Duties 706,871 Estimated based on actual taxes in fiscal 2017
etc.
Insurance Premiums 2,971 Estimated based on insurance rates etc. for
similar real properties
Other Expenses 25,449 Estimated based on actual past results etc.
(3) Net Operating Income
((1)-(2))
2,119,025
(4) Investment Income from
Temporary Deposits
25,994 Estimated applying investment return of 1.0%
(5) Capital Expenditure 261,614 Estimated based on the Engineering Report as
well as the level of renewal expenses for similar
real properties
(6) Net Income ((3)+(4)-(5)) 1,883,405
(7) Capitalization Rate
3.2% Estimated taking into consideration examples of
transactions for similar real properties, as well as location and building conditions, and improvements, rights, contractual terms etc. of the Property
Appraisal value based on DCF method 55,600,000
Discount Rate
2.8% Estimated based on comparison with examples
of transactions for similar real properties as well
as returns on financial assets adjusted by
individual characteristics of the Property
Terminal Capitalization Rate 3.3% Estimated taking into consideration the
characteristics of net income adopted in
determining the capitalization rate as well as
future uncertainty, liquidity and marketability etc.
24
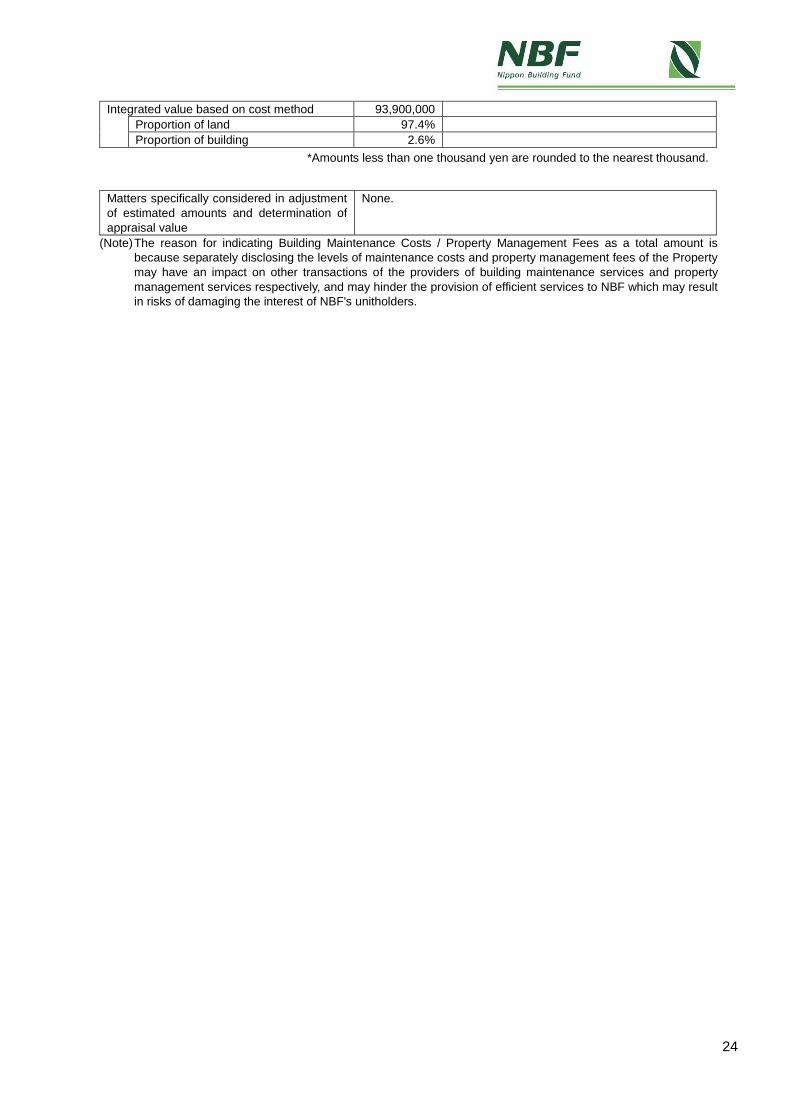
Integrated value based on cost method 93,900,000
Proportion of land 97.4%
Proportion of building 2.6%
*Amounts less than one thousand yen are rounded to the nearest thousand.
Matters specifically considered in adjustment
of estimated amounts and determination of
appraisal value
None.
(Note) The reason for indicating Building Maintenance Costs / Property Management Fees as a total amount is
because separately disclosing the levels of maintenance costs and property management fees of the Property
may have an impact on other transactions of the providers of building maintenance services and property
management services respectively, and may hinder the provision of efficient services to NBF which may result
in risks of damaging the interest of NBF's unitholders.
25
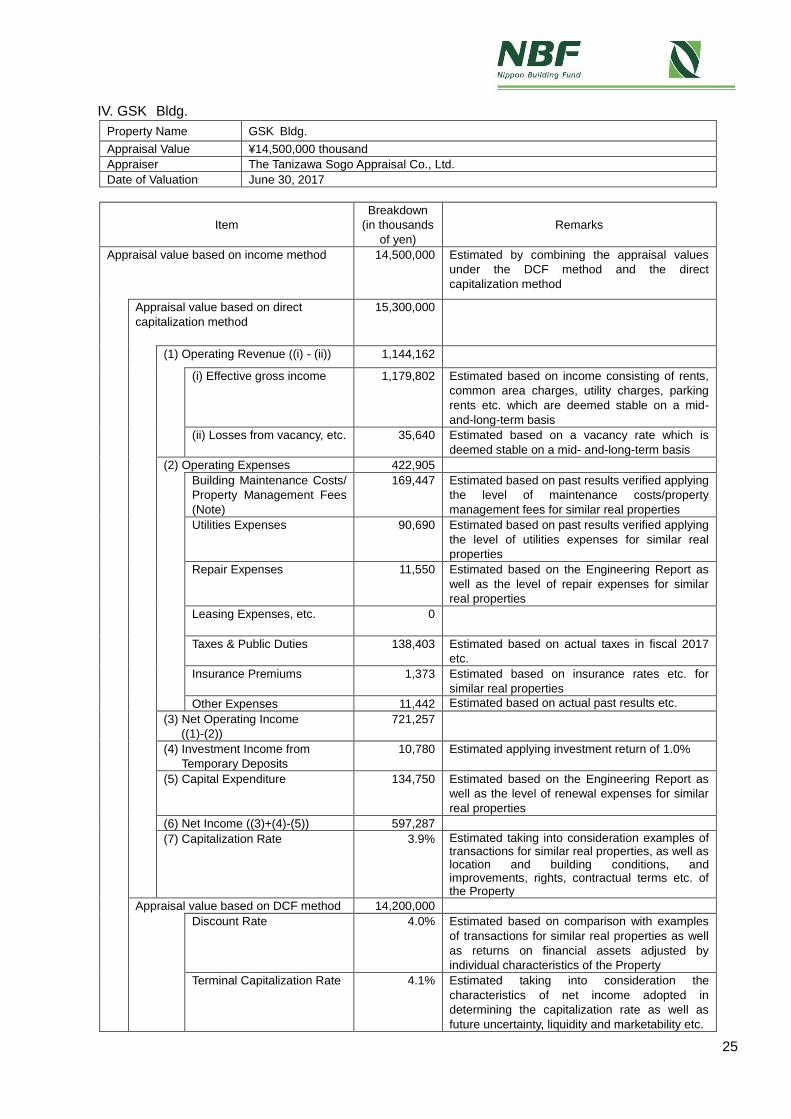
IV. GSK Bldg.
Property Name GSK Bldg.
Appraisal Value ¥14,500,000 thousand
Appraiser The Tanizawa Sogo Appraisal Co., Ltd.
Date of Valuation June 30, 2017
Item
Breakdown
(in thousands
of yen)
Remarks
Appraisal value based on income method
14,500,000 Estimated by combining the appraisal values
under the DCF method and the direct
capitalization method
Appraisal value based on direct
capitalization method
15,300,000
(1) Operating Revenue ((i) - (ii)) 1,144,162
(i) Effective gross income
1,179,802 Estimated based on income consisting of rents,
common area charges, utility charges, parking
rents etc. which are deemed stable on a mid-
and-long-term basis
(ii) Losses from vacancy, etc.
35,640 Estimated based on a vacancy rate which is
deemed stable on a mid- and-long-term basis
(2) Operating Expenses 422,905
Building Maintenance Costs/
Property Management Fees
(Note)
169,447 Estimated based on past results verified applying
the level of maintenance costs/property
management fees for similar real properties
Utilities Expenses
90,690 Estimated based on past results verified applying
the level of utilities expenses for similar real
properties
Repair Expenses
11,550 Estimated based on the Engineering Report as
well as the level of repair expenses for similar
real properties
Leasing Expenses, etc.
0
Taxes & Public Duties 138,403 Estimated based on actual taxes in fiscal 2017
etc.
Insurance Premiums 1,373 Estimated based on insurance rates etc. for
similar real properties
Other Expenses 11,442 Estimated based on actual past results etc.
(3) Net Operating Income
((1)-(2))
721,257
(4) Investment Income from
Temporary Deposits
10,780 Estimated applying investment return of 1.0%
(5) Capital Expenditure 134,750 Estimated based on the Engineering Report as
well as the level of renewal expenses for similar
real properties
(6) Net Income ((3)+(4)-(5)) 597,287
(7) Capitalization Rate
3.9% Estimated taking into consideration examples of
transactions for similar real properties, as well as location and building conditions, and improvements, rights, contractual terms etc. of the Property
Appraisal value based on DCF method 14,200,000
Discount Rate
4.0% Estimated based on comparison with examples
of transactions for similar real properties as well
as returns on financial assets adjusted by
individual characteristics of the Property
Terminal Capitalization Rate 4.1% Estimated taking into consideration the
characteristics of net income adopted in
determining the capitalization rate as well as
future uncertainty, liquidity and marketability etc.

26
Integrated value based on cost method 14,800,000
Proportion of land 85.4%
Proportion of building 14.6%
*Amounts less than one thousand yen are rounded to the nearest thousand.
Matters specifically considered in adjustment
of estimated amounts and determination of
appraisal value
None.
(Note) The reason for indicating Building Maintenance Costs / Property Management Fees as a total amount is
because separately disclosing the levels of maintenance costs and property management fees of the Property
may have an impact on other transactions of the providers of building maintenance services and property
management services respectively, and may hinder the provision of efficient services to NBF which may result
in risks of damaging the interest of NBF's unitholders.
27
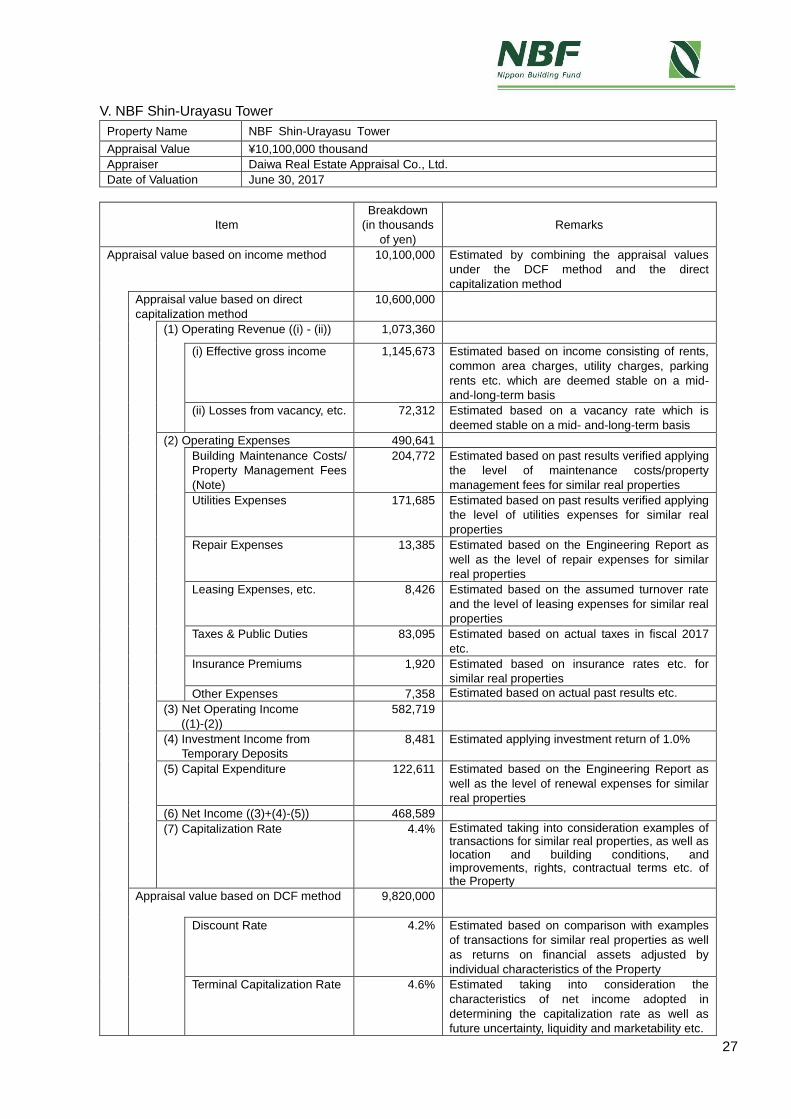
V. NBF Shin-Urayasu Tower
Property Name NBF Shin-Urayasu Tower
Appraisal Value ¥10,100,000 thousand
Appraiser Daiwa Real Estate Appraisal Co., Ltd.
Date of Valuation June 30, 2017
Item
Breakdown
(in thousands
of yen)
Remarks
Appraisal value based on income method
10,100,000 Estimated by combining the appraisal values
under the DCF method and the direct
capitalization method
Appraisal value based on direct
capitalization method
10,600,000
(1) Operating Revenue ((i) - (ii)) 1,073,360
(i) Effective gross income
1,145,673 Estimated based on income consisting of rents,
common area charges, utility charges, parking
rents etc. which are deemed stable on a mid-
and-long-term basis
(ii) Losses from vacancy, etc.
72,312 Estimated based on a vacancy rate which is
deemed stable on a mid- and-long-term basis
(2) Operating Expenses 490,641
Building Maintenance Costs/
Property Management Fees
(Note)
204,772 Estimated based on past results verified applying
the level of maintenance costs/property
management fees for similar real properties
Utilities Expenses
171,685 Estimated based on past results verified applying
the level of utilities expenses for similar real
properties
Repair Expenses
13,385 Estimated based on the Engineering Report as
well as the level of repair expenses for similar
real properties
Leasing Expenses, etc.
8,426
Estimated based on the assumed turnover rate
and the level of leasing expenses for similar real
properties
Taxes & Public Duties 83,095 Estimated based on actual taxes in fiscal 2017
etc.
Insurance Premiums 1,920 Estimated based on insurance rates etc. for
similar real properties
Other Expenses 7,358 Estimated based on actual past results etc.
(3) Net Operating Income
((1)-(2))
582,719
(4) Investment Income from
Temporary Deposits
8,481 Estimated applying investment return of 1.0%
(5) Capital Expenditure 122,611 Estimated based on the Engineering Report as
well as the level of renewal expenses for similar
real properties
(6) Net Income ((3)+(4)-(5)) 468,589
(7) Capitalization Rate
4.4% Estimated taking into consideration examples of
transactions for similar real properties, as well as location and building conditions, and improvements, rights, contractual terms etc. of the Property
Appraisal value based on DCF method 9,820,000
Discount Rate
4.2% Estimated based on comparison with examples
of transactions for similar real properties as well
as returns on financial assets adjusted by
individual characteristics of the Property
Terminal Capitalization Rate 4.6% Estimated taking into consideration the
characteristics of net income adopted in
determining the capitalization rate as well as
future uncertainty, liquidity and marketability etc.

28
Integrated value based on cost method 11,900,000
Proportion of land 74.2%
Proportion of building 25.8%
*Amounts less than one thousand yen are rounded to the nearest thousand.
Matters specifically considered in adjustment
of estimated amounts and determination of
appraisal value
None
(Note) The reason for indicating Building Maintenance Costs / Property Management Fees as a total amount is
because separately disclosing the levels of maintenance costs and property management fees of the Property
may have an impact on other transactions of the providers of building maintenance services and property
management services respectively, and may hinder the provision of efficient services to NBF which may result
in risks of damaging the interest of NBF's unitholders.
End
This English language notice is a translation of the Japanese language notice dated December 18, 2017 and
was prepared solely for the convenience of, and reference by, overseas investors. Neither NBF nor NBFM
makes any warranties as to its accuracy or completeness.
<Attached Materials>
【Reference Material 1】Exterior Appearance and Standard Floor Plan etc. of the 2 Properties to be Acquired
I. Roppongi T-CUBE
II. Celestine Shiba Mitsui Bldg. (Additional Acquisition)
【Reference Material 2】Summary of Portfolio after the Transactions

29
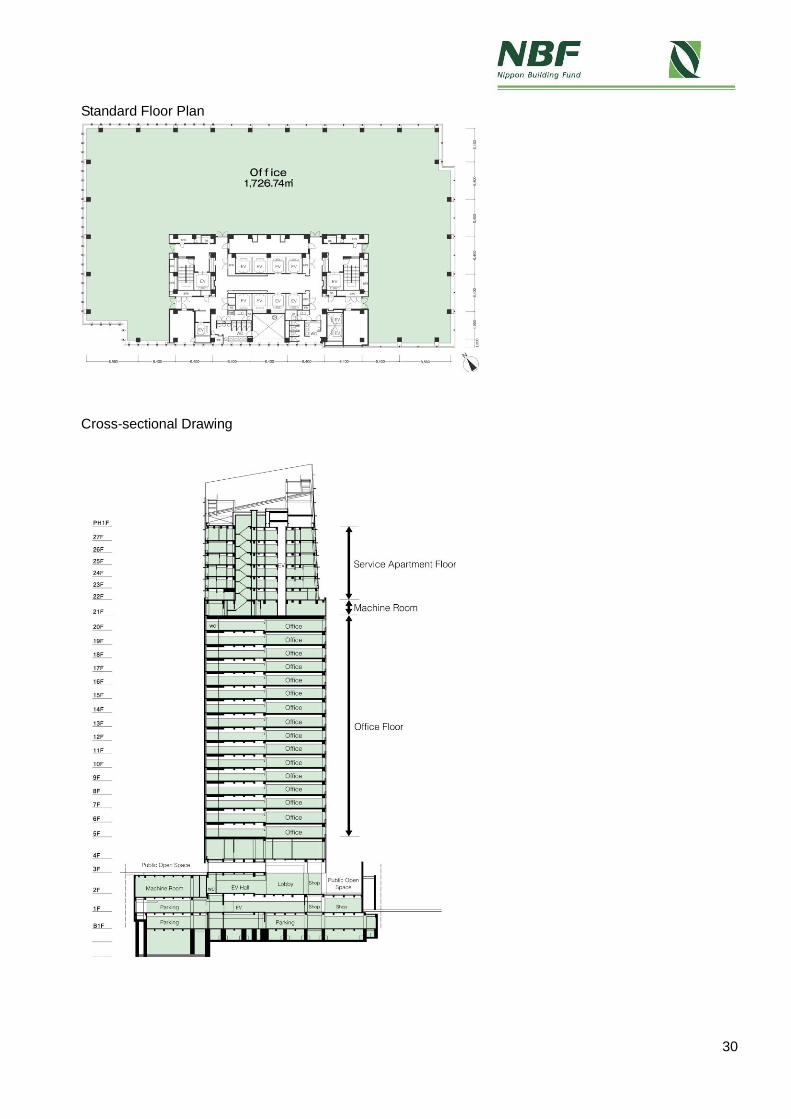
【Reference Material 1】 Exterior Appearance and Standard Floor Plan etc. of the 2 Properties to be Acquired
I. Roppongi T-CUBE
Exterior Appearance
30
Standard Floor Plan
Cross-sectional Drawing

31
II. Celestine Shiba Mitsui Bldg. (Additional Acquisition)
Exterior Appearance

32
Standard Floor Plan
.
Cross-sectional Drawing

33
【Reference Material 2】 Summary of Portfolio after the Transactions
Property NameAcquisition Price(\ in thousands)
(Note 1)Percentage
Value (Real EstateAppraisal Value)(\ in thousands)
(Note 2)
NBF Hibiya Bldg. (Note 3) - - -Roppongi T-CUBE (Note 4) 62,800,000 5.7% 63,000,000Nishi-Shinjuku Mitsui Bldg. 45,213,698 4.1% 41,300,000Mitsubishi Heavy Industries Head Office Bldg. 36,300,000 3.3% 48,000,000Shiba NBF Tower 32,000,000 2.9% 28,400,000NBF Platinum Tower 31,000,000 2.8% 60,800,000NBF Minami-Aoyama Bldg. 31,000,000 2.8% 19,100,000NBF COMODIO Shiodome 28,800,000 2.6% 33,700,000Toranomon Kotohira Tower 24,543,000 2.2% 35,000,000Celestine Shiba Mitsui Bldg. 22,500,000 2.1% 26,400,000Celestine Shiba Mitsui Bldg.(Additional Acquisition) (Note 4) 19,500,000 1.8% 20,000,000NBF Ochanomizu Bldg. 20,840,000 1.9% 13,800,000NBF Ginza Street Bldg. 20,269,000 1.9% 31,300,000NBF Shibuya Garden Front 17,000,000 1.6% 16,900,000Shinjuku Mitsui Bldg. No.2 16,285,400 1.5% 18,500,000GSK Bldg (Note 5) - - -River City M-SQUARE 13,350,000 1.2% 16,300,000NBF Toranomon Bldg. 13,337,000 1.2% 17,000,000Kowa Nishi-Shinbashi Bldg. B 13,303,200 1.2% 14,500,000NBF Shinkawa Bldg. 12,614,118 1.2% 14,700,000Shinbashi M-SQUARE 11,900,000 1.1% 14,800,000NBF ALLIANCE 9,126,000 0.8% 12,500,000Yotsuya Medical Bldg. 8,800,000 0.8% 7,600,000NBF Shibuya East 8,000,000 0.7% 7,150,000NBF Shibakouen Bldg. 6,770,000 0.6% 8,150,000NBF Takanawa Bldg. 6,667,200 0.6% 7,190,000NBF Akasaka Sanno Square 6,250,000 0.6% 6,550,000NBF Shibakouen Daimon Street Bldg. 6,100,000 0.6% 4,400,000NBF Kandasudacho Bldg. 5,960,000 0.5% 8,090,000Sumitomo Densetsu Bldg. 5,365,000 0.5% 5,710,000NBF Higashi-Ginza Square 5,200,000 0.5% 7,810,000Panasonic Tokyo Shiodome Bldg. 5,075,000 0.5% 6,120,000NBF Ogawamachi Bldg. 4,940,000 0.5% 5,880,000Nihonbashi Kabuto-cho M-SQUARE 4,850,000 0.4% 5,560,000Ryukakusan Bldg. 4,050,000 0.4% 4,870,000Jingumae M-SQUARE 3,700,000 0.3% 3,980,000NBF Osaki Bldg. 66,660,000 6.1% 85,900,000Gate City Ohsaki 57,281,060 5.2% 66,900,000Nakanosakaue Sunbright Twin 40,750,488 3.7% 30,000,000NBF Toyosu Canal Front 35,200,000 3.2% 36,000,000NBF Toyosu Garden Front 25,018,000 2.3% 29,100,000Nakameguro GT Tower 23,856,000 2.2% 21,800,000Ueno East Tower 21,600,000 2.0% 22,100,000NBF Ueno Bldg. 10,400,000 0.9% 9,290,000NBF Ikebukuro East 8,630,000 0.8% 10,700,000Higashi Gotanda Square 8,350,000 0.8% 8,300,000Toyo-cho Center Bldg. 7,800,000 0.7% 8,460,000NBF Ikebukuro Tower 4,695,000 0.4% 5,720,000Osaki Bright Core - Bright Plaza 4,500,000 0.4% 4,800,000NBF Ikebukuro City Bldg. 4,428,000 0.4% 5,420,000Chofu South Gate Bldg. 9,320,000 0.9% 10,300,000Shin-Kawasaki Mitsui Bldg. 25,820,000 2.4% 23,100,000Yokohama ST Bldg. 13,529,300 1.2% 15,000,000Parale Mitsui Bldg. 3,800,000 0.3% 3,830,000Tsukuba Mitsui Bldg. 8,875,500 0.8% 8,260,000NBF Utsunomiya Bldg. 2,435,000 0.2% 2,100,000S-ino Omiya North Wing 16,816,345 1.5% 20,500,000NBF Urawa Bldg. 2,000,000 0.2% 2,360,000NBF Shin-Urayasu Tower (Note 6) - - -NBF Matsudo Bldg. 2,455,000 0.2% 2,420,000Sapporo L-Plaza 4,404,405 0.4% 7,110,000NBF Sapporo Minami Nijo Bldg. 1,870,300 0.2% 1,470,000NBF Unix Bldg. 4,028,900 0.4% 3,350,000NBF Niigata Telecom Bldg. 3,957,500 0.4% 2,690,000Sumitomo Mitsui Banking Nagoya Bldg. 14,900,000 1.4% 16,500,000NBF Nagoya Hirokoji Bldg. 7,232,000 0.7% 7,310,000Aqua Dojima NBF Tower 17,810,000 1.6% 17,600,000Nakanoshima Central Tower 14,900,000 1.4% 16,900,000Shinanobashi Mitsui Bldg. 14,400,000 1.3% 12,900,000Sakaisuji-Honmachi Center Bldg. 12,700,000 1.2% 13,500,000Sun Mullion NBF Tower 10,500,000 1.0% 6,280,000NBF Hiroshima Tatemachi Bldg. 2,930,000 0.3% 2,490,000Hiroshima Fukuromachi Bldg. 2,215,000 0.2% 2,370,000NBF Matsuyama Nichigin-mae Bldg. 3,310,000 0.3% 3,760,000Hakata Gion M-SQUARE 8,000,000 0.7% 10,300,000NBF Kumamoto Bldg. 4,500,000 0.4% 3,920,000
1,095,286,416 100% 1,195,870,000
(Note 1)
(Note 2)
(Note 3)
(Note 4)
(Note 5)(Note 6)
Central 5 Wards
23 Wards of Tokyo
51.4%
80.6%
“NBF Shin-Urayasu Tower” will be disposed of as of December 20, 2017.“GSK Bldg” will be disposed of as of December 26, 2017.
“Value (Real Estate Appraisal Value)” represents the appraisal value as of June 30, 2017.
“Roppongi T-CUBE” and “Celestine Shiba Mitsui Bldg.(Additional Acquisition)” will be acquired as of March 30, 2018.
7.8%
11.6%
100%
Area
Other GreaterTokyo
Other Cities
Total
Percentage of each area
“NBF Hibiya Bldg.” will be disposed of as of March 30, 2018.
“Acquisition Price” represents in principle the price for which NBF acquired the property. As for the property to be acquired, the future represents the sale and purchaseprice set forth in the relevant sale and purchase contract etc. at the time of the decision to acquire the said property (excluding miscellaneous acquisition costs, fixed assetstax, city-planning tax and consumption tax etc.).
The “Value (Real Estate Appraisal Value)” shown above is as of December 1, 2017.