notice of annual meeting of stockholders information statement€¦ · notice of annual meeting of...
TRANSCRIPT

NOTICE OF ANNUAL MEETING OF STOCKHOLDERS
&
INFORMATION STATEMENT
Tuesday, May 7, 2013 (10:00 a.m.) Rockwell Tent, Rockwell Drive corner Estrella St., Rockwell Center, Makati City, Philippines

3
ENERGY DEVELOPMENT CORPORATION
Annual Stockholders’ Meeting
May 7, 2013
PART I: INFORMATION REQUIRED IN INFORMATION STATEMENT
A. GENERAL INFORMATION
Item 1. Date, Time and Place of Meeting of Security Holders:
The annual stockholders‘ meeting of ENERGY DEVELOPMENT CORPORATION (hereafter the
―Registrant‖ or ― Company‖) will be held on May 7, 2013 at 10:00 a.m. at the Rockwell Tent, Rockwell Drive
corner Estrella St., Rockwell Center, Makati City, Philippines.
The complete mailing address of the Registrant is P.O. Box 2102 Makati City Post Office, Makati City.
The approximate date when the information statement and proxy form will be first sent to security holders will
be on April 15, 2013.
Item 2. Dissenters’ Right of Appraisal
There are no matters to be taken up during the annual stockholders‘ meeting with respect to which the law
allows the exercise of appraisal right by any dissenting stockholder. The Corporation Code limits the exercise
of the appraisal right only in the following instances:
a. In case any amendment to the articles of incorporation has the effect of changing or restricting the rights
of any stockholder or class of share, or of authorizing preferences in respect superior to those of
outstanding shares of any class, or of extending or shortening the term of corporate existence (Section 81);
b. In case of the sale, lease, exchange, transfer, mortgage, pledge or other disposition of all or substantially
all of the corporate property and assets (Section 81);
c. In case of merger or consolidation (Section 81);
d. In case of investments in another corporation, business or purpose (Section 42).
Since the matters to be taken up do not include any of the foregoing, the appraisal right will not be available.
However, if at any time after this Information Statement has been sent out, an action which may give rise to
the right of appraisal is proposed at the meeting, any stockholder who votes against the proposed action and
who wishes to exercise such right must make a written demand, within thirty (30) days after the date of the
meeting or when the vote was taken, for the payment of the fair market value of his shares. Upon payment, he
must surrender his certificates of stock. No payment shall be made to any dissenting stockholder unless the
Company has unrestricted retained earnings in its books to cover such payment.

4
Item 3. Interest of Certain Persons in or Opposition to Matters to be Acted Upon
No member of the Board of Directors or executive officer since the beginning of the last fiscal year, or
nominee for election as director, or their associates, has any substantial interest, direct or indirect, by security
holdings or otherwise, in any of the matters to be acted upon in the meeting, other than election to office.
No director has informed the Company in writing or otherwise that he intends to oppose any action to be taken
up at the meeting.
B. CONTROL AND COMPENSATION INFORMATION
Item 4. Voting Securities and Principal Holders Thereof
The record date for the purpose of determining the stockholders entitled to notice of, and to vote at the Annual
Stockholders‘ Meeting is March 8, 2013.
As of record date March 8, 2013, there are 18,750,000,000 outstanding unclassified common shares and
9,375,000,000 unclassified preferred shares entitled to notice and to vote at the meeting. A common or
preferred share is entitled to one (1) vote each. Total number of common shares owned by foreigners is
6,699,316,448 shares (35.73%). All preferred shares are owned by Red Vulcan Holdings Corporation, a
Philippine corporation. None of the preferred shares are foreign-owned.
The election of directors for the current year will be taken up and all stockholders have the right to cumulate
their votes in favor of their chosen nominees for director in accordance with Section 24 of the Corporation
Code. Section 24 provides that a stockholder, may vote such number of shares registered in his name as of the
record date for as many persons as there are directors to be elected or he may cumulate said shares and give
one candidate as many votes as the number of directors to be elected multiplied by the number of shares shall
equal, or he may distribute them on the same principle among as many candidates as he shall see fit. The total
number of votes cast by such stockholder should not exceed the number of shares owned by him as shown in
the books of the corporation multiplied by the whole number of directors to be elected.
Security Ownership of Certain Record and Beneficial Owners and Management
1) Persons Known to the Registrant to be Directly or Indirectly the Record or Beneficial Owner of
More than 5% of Any Class of the Registrant’s Voting Securities:
As of record date March 8, 2013, the Registrant has no knowledge of any individual or any party who
beneficially owns more than 5% of its outstanding common stock except as set forth in the table below:
Type of
Class
Name, address of Record Owner
and Relationship with Issuer
Name of Beneficial
Owner &
Relationship with
Record Owner
Citizenship
No. of Shares
Held
Percent
of Class
Common
Preferred
Red Vulcan Holdings Corporation
3rd Floor Benpres Bldg.,
Exchange Road cor. Meralco Ave.,
Pasig City
(Red Vulcan Holdings Corp. is a
major stockholder of EDC)
Beneficial Owner -
First Gen
Corporation
(First Gen Corp. is a
major stockholder
of Red Vulcan
Holdings Corp.)
Proxy - Federico R.
Lopez, Chairman of
First Gen
Corporation
Filipino 7,500,000,000
9,375,000,000
40.00%
100.00%

5
Common PCD Nominee Corporation
(Foreign) *
(PCD Nominee Corp. is a
stockholder of EDC)
There are no
beneficial owners of
more than 5% of the
outstanding shares.
Foreign 6,698,795,196 35.73%
Common PCD Nominee Corporation
(Filipino) *
(PCD Nominee Corp. is a
stockholder of EDC)
There are no
beneficial owners of
more than 5% of the
outstanding shares.
Filipino 2,704,535,147 14.42%
Common First Gen Corporation
3rd Floor Benpres Bldg.,
Exchange Road cor. Meralco Ave.,
Pasig City
(First Gen Corp. is a stockholder
of EDC)
Beneficial Owner -
First Gen
Corporation
Proxy - Federico R.
Lopez, Chairman of
First Gen
Corporation
Filipino 991,782,700 5.29%
Common Northern Terracotta
3rd Floor Benpres Bldg.,
Exchange Road cor. Meralco Ave.,
Pasig City
(Northern Terracotta is a
stockholder of EDC)
Beneficial Owner -
First Gen
Corporation
(Northern
Terracotta is a
stockholder of EDC
and a wholly-owned
subsidiary of First
Gen Corp.)
Proxy - Federico R.
Lopez, Chairman of
First Gen
Corporation
Filipino 819,486.400
4.37%
* PCD Nominee Corporation, a wholly owned subsidiary of Philippine Central Depository, Inc. (PCD), is the registered owner of the
shares in the books of the Company‘s transfer agent in the Philippines. The beneficial owners of such shares are PCD‘s
participants, who hold the shares on their behalf or in behalf of their clients. PCD is a private company organized by the major
institutions actively participating in the Philippines capital market to implement an automated book-entry system of handling
securities transactions in the Philippines.
2) Security Ownership of Directors and Management as of record date March 8, 2013
Title of Class
Name of Beneficial Owner
Amount of
Shares
Nature of
Ownership
Citizenship
Percent
of Class
Directors
Common Oscar M. Lopez 200,501
500,000
Direct
Indirect
Filipino
Filipino
0.001%
0.003%
Common Federico R. Lopez 1 Direct Filipino 0.000%
Common Peter D. Garrucho, Jr. 5,670,000
1,000,000
Direct
Indirect
Filipino
Filipino
0.030%
0.005%
Common Richard B. Tantoco 7,104,501
1,125,000
Direct
Indirect
Filipino
Filipino
0.038%
0.006%
Common Elpidio L. Ibañez 500,001 Direct Filipino 0.003%
Common Ernesto B. Pantangco 37,501 Direct Filipino 0.000%
Common Francis Giles B. Puno 2,102,501 Direct Filipino 0.011%
Common Jonathan C. Russell 672,751 Direct British 0.004%
Common Edgar O. Chua 1 Direct Filipino 0.000% Common Francis Ed. Lim 30,001 Direct Filipino 0.000% Common Arturo T. Valdez 1 Direct Filipino 0.000%

6
Title of Class
Name of Beneficial Owner
Amount of
Shares
Nature of
Ownership
Citizenship
Percent
of Class
Key Executive Officers Common Agnes C. De Jesus 1,962,500 Direct Filipino 0.011%
Common Nestor H. Vasay 450,000 Direct Filipino 0.002%
Common Marcelino M. Tongco 1,825,000 Direct Filipino 0.010%
Common Manual S. Ogena 2,323,751 Direct Filipino 0.012%
Common Dominic M. Camu 0 - Filipino 0.000%
Common Elizabeth D. Nasol 10,000 Direct Filipino 0.000%
Common Ernesto G. Espinosa 140,000 Direct Filipino 0.001%
Common Vincent Martin C. Villegas 500 Direct Filipino 0.000%
Common Erwin O. Avante 100,000 Direct Filipino 0.001%
Common Rico G. Bersamin 0 - Filipino 0.000%
Common Ferdinand B. Poblete 10,000 Direct Filipino 0.000%
Common Ariel Arman V. Lapus 148,000 Direct Filipino 0.001%
Common Ellsworth R. Lucero 1,228,125 Direct Filipino 0.007%
Common Dwight A. Maxino 1,228,125 Direct Filipino 0.007%
Common Manuel C. Paete 1,228,125 Direct Filipino 0.007%
Common Liberato S. Virata 1,252,250 Direct Filipino 0.007%
Common Wilfredo A. Malonzo 0 - Filipino 0.000%
Common Maribel A. Manlapaz 70,000 Direct Filipino 0.000%
Common Teodorico Jose R. Delfin 0 - Filipino 0.000%
Common Ana Maria A. Katigbak 272,000 Indirect Filipino 0.002%
Common Glenn L. Tee 0 - Filipino 0.000%
Common Erudito S. Recio 42,000
23,700
Direct
Indirect
Filipino
Filipino
0.000%
0.000%
As of record date March 8, 2013, the total number of shares owned by the Directors and key executive officers
is 31,256,836 or 0.17% of total common shares.
3) Voting Trust Holders of 5% or more
The Company knows of no persons holding more than 5% of common shares under a voting trust or similar
agreement.
4) Changes in control
No change in control of the Registrant has occurred since the previous fiscal year.
Item 5. Directors and Executive Officers
The following are the directors and executive officers of the Company, each having a term of one (1) year
and to serve as such until their successors are elected and qualified, and their respective positions, ages and
business experience in the past five years.
Directors
Oscar M. Lopez, 82
Mr. Lopez, Filipino, is the Chairman Emeritus of both the Lopez Holdings Corporation (formerly Benpres
Holdings Corporation), the holding company for major investments in broadcast, telecoms and cable, power
generation and distribution; and First Philippine Holdings Corporation (FPH), the specific associate holding
company for power generation and distribution, property and manufacturing. He has been a member of the
EDC Board of Directors since the Company‘s full privatization in 2007.
Mr. Lopez is one of the most respected and admired business leaders in Asia. He was Management
Association of the Philippines‘ Management Man of the Year in 2000 and one of the top 20 finalists for
CNBC and TNT International‘s Asia Business Leader Awards in 2004. He was the first Filipino businessman

7
to be awarded the most prestigious Officer‘s Cross of the Order of Merit of the Federal Republic of Germany
in 2005. He was a recipient of The Outstanding Filipino (TOFIL) Award in the field of Business for the year
2009.
Named by Forbes Magazine as among the ―Heroes of Philanthropy‖ in Asia, he is involved in several social
and environmental concerns, among them the Eugenio Lopez Foundation, Lopez Group Foundation.In 2006,
he was honored in Monaco with the IMD-Lombard Odier Hentsch Distinguished Family Award for ―an
outstanding commitment on philanthropy for the family‘s achievement in excellence such as the clarity and
sustainability of their social endeavors, exemplary corporate governance, a focus on family values, and the
involvement of multiple generations.‖
He was conferred Honorary Degree Doctor of Laws, honoris causa by the Philippine Women‘s University in
April 2009; conferred Honorary Degree of Humanities, honoris causa by De La Salle University in Oct. 2010
and by the Ateneo de Manila University in Nov. 2010. He was the 2011 Ramon del Rosario, Sr. Awardee for
Nation Building. He was conferred Honorary Degree of Doctor of Laws, honoris causaby the University of
the Philippines in March 2012.
Mr. Lopez was born on April 19, 1930. Has a Master‘s degree in Public Administration from the Littauer
School of Public Administration in Harvard University (1955), where he also earned his Bachelor of Arts
degree, cum laude (1951).
Federico R. Lopez, 51
Mr. Lopez, Filipino, is Chairman and Chief Executive Officer (CEO) of EDC and has been a member of its
Board of Directors since the Company‘s full privatization in 2007. He is also the Chairman and CEO of First
Philippine Holdings Corporation, First Gen Corporation, FG Hydro Corporation, First Gas Power
Corporation, FGP Corp., First Gen Energy Solutions, Green Core Geothermal Inc., First Gen Renewable Inc.,
and FG Bukidnon Power Corp. He is Chairman of First Philippine Industrial Corp., First Philippine Electric
Corp., First Philippine Realty Corp., and First Balfour Inc., and is Treasurer of Lopez Holdings, Inc. He also
sits on the board of ABSCBN Corporation. A staunch environmentalist, he is the Chairman of the Philippine
Solar Car Challenge Society and is a member of the Board of Trustees of Philippine Business for Social
Progress and the Philippine Tropical Forest Conservation Foundation. He is also a member of the World
President‘s Organization.
Mr. Lopez is a graduate of the University of Pennsylvania with a Bachelor of Arts degree in Economics and
International Relations, cum laude (1983).
Peter D. Garrucho, Jr., 68
Mr. Garrucho, Filipino, has been a Director of EDC since November 2007. Until his retirement in January
2008, he served as Managing Director for Energy of FPHC and as Vice Chairman and CEO of First Gen Corp.
where he continues to be a Director. He also sits in subsidiaries of these corporations including the First Gas
Holdings Group of companies (First Gas Power, FGPCorp, Unified Holdings and First Gas Pipeline), First
Gen Hydro Corp., FG Bukidnon Power Corp., First Gen Energy Solutions, Inc., Red Vulcan Holdings Corp.,
Prime Terracota Holdings Corp., First Philippine Industrial Corp. and First Balfour Corp. At present, he is
also Vice Chairman of Franklin Baker Corp. where he has a significant shareholding.
He served in the government as Secretary of the Department of Tourism and the Department of Trade and
Industry during the administration of President Corazon C. Aquino. He was also Executive Secretary and
Presidential Adviser on Energy Affairs under President Fidel V. Ramos. In 2000, he was given the award of
an Honorary Officer of the Order of the British Empire by Her Majesty, Queen Elizabeth II.
Mr. Garrucho earned his Master in Business Administration degree from Stanford University (1971) and his
AB-BSBA degree from the De La Salle University (1966).

8
Elpidio L. Ibañez, 62
Mr. Ibañez, Filipino, has been a Director of EDC since July 2010. He is also the President and Chief
Operating Officer of FPHC. He is a member of the boards of First Gen Renewables Inc., FG Bukidnon Power
Corp., Bauang Private Power Corp., First Private Power Corp., First Gas Holdings Corp., First Gas Power
Corp., FGP Corp., Unified Holdings Corp., First Gas Pipeline Corp., FL Geothermal, and GCGI. He is
Chairman of the board of First Batangas Hotel Corp. and President of First Philippine Utilities Corp. He is
also a director of various FPHC subsidiaries and affiliates such as First Balfour, Inc., First Philippine Electric
Corp., First Philippine Industrial Corp., First Philippine Industrial Park, Philippine Electric Corp., and
Securities Transfer Services, Inc.
Mr. Ibañez obtained a Masters degree in Business Administration from the University of the Philippines
(1975) and a Bachelor of Arts degree major in Economics from Ateneo de Manila University (1972).
Richard B. Tantoco, 46
Mr. Tantoco, Filipino, is the President and Chief Operating Officer (COO) of EDC and has been a Director of
the Company since November 2007. He is also a Director and Executive Vice President of First Gen Corp.,
First Gen Luzon Power Corp., First Gen Hydro Power Corp., First Gen Geothermal Power Corporation, First
Gen Visayas Hydro Power Corporation, First Gen Mindanao Hydro Power Corporation, First Gen Energy
Solutions, Inc., First Gen Premier Energy Corp., Red Vulcan Holdings Corp., First Gen Visayas Energy Inc.,
First Gen Prime Energy Corporation, First Gen Renewables, Inc., Blue Vulcan Holdings Corp., Northern
Terracotta Power Corp., Prime Meridian Powergen Corporation, OneCore Holdings Inc., DualCore Holdings
Inc., GoldSilk Holdings Corp., First Gas Holdings Corporation, First Gas Power Corporation, FGP Corp.,
First Gas Pipeline Corp., First NatGas Power Corp., AlliedGen Power Corporation and FGLand Corp; and
Executive Vice President of First Gen Bukidnon Power Corporation, Unified Holdings Corp., First Gen
Northern Energy Corp., and First Philippine Holdings. He was recently elected as one of the Board of
Trustees and President of the Oscar M. Lopez Center for Climate Change Adaptation and Disaster Risk
Management Foundation, Inc. He has been a Director of the International Geothermal Association since 2010.
He worked previously with management consulting firm Booz, Allen and Hamilton, Inc. in New York and
London where he specialized in mergers and acquisition advisory, turnaround strategy advisory, and growth
strategy formulation for media and manufacturing companies.
Mr. Tantoco has an MBA in Finance from the Wharton School of Business of the University of Pennsylvania
(1993) and a Bachelor of Science degree in Business Management from the Ateneo de Manila University
where he graduated with honors (1988).
Ernesto B. Pantangco, 62
Mr. Pantangco, Filipino, has been a Director of EDC since November 2007 and is also the Company‘s
Executive Vice President (EVP). He is an EVP of First Gen Corp., and President and CEO of FPPC and
BPPC. He also sits in the boards of FG Luzon, GCGI, EWEHI, FG Bukidnon, FGHPC, First Gen Geothermal
Power Corp., First Gen Visayas Hydro Power Corp., and First Gen Mindanao Hydro Power Corp. He is
President of FGHPC and First Gen Northern Energy Corp., and Executive Vice President of First Gen
Geothermal Power Corp., First Gen Visayas Hydro Power Corp., First Gen Mindanao Hydro Power Corp.,
FGLuzon, and Red Vulcan. He is the President of the Philippine Independent Power Producers Association
(PIPPA) for the last eleven (11) years. He is also Vice-Chairman of the National Renewable Energy Board
(NREB) and was recently asked to be Chairman of MAP Committee on Energy.
Mr. Pantangco has a Bachelor of Science in Mechanical Engineering degree from the De La Salle University
(1973) and Master of Business Administration degree from the Asian Institute of Management, dean‘s list
(1976). He is a registered mechanical engineer and placed 6th in the 1973 board exams.

9
Francis Giles B. Puno, 48
Mr. Puno, Filipino, has been a Director of EDC since November 2007. He is the President and Chief
Operating Officer (COO) of First Gen Corp., First Gen Renewables Inc, FG Bukidnon Power Corp., First Gen
Energy Solutions, Inc., Red Vulcan Holdings Corp., First Gen Luzon Power Corp., First Gen Geothermal
Power Corp., First Gen Northern Energy Corp., First Gen Visayas Hydro Power Corp, First Gen Mindanao
Hydro Power Corp., First Gas Holdings Corp., First Gas Power Corp., FGP Corp., Unified Holdings Corp.,
First Gas Pipeline Corp., First NatGas Power Corp., and FGLand Corp. He is also the Executive Vice
President and Chief Financial Officer (CFO) of First Philippine Holdings Corp., and sits in the board of First
Gen Hydro Power Corporation, He worked previously with the Global Power and Environmental Group of
The Chase Manhattan Bank in Singapore and Hong Kong where he originated and executed financial advisory
and debt arrangement mandates for power and water projects in Asia.
Mr. Puno has a Master of Management degree from the Kellogg Graduate School of Management of
Northwestern University (1990) and a Bachelor of Science degree in Business Management from the Ateneo
de Manila University (1985).
Jonathan C. Russell, 48
Mr. Russell, British, has been a Director of EDC since November 2007. He is also an Executive Vice
President of First Gen Corp. and Director of GCGI. He was previously Vice President of Generation Ventures
Associates (GVA), an international developer of independent power projects based in Boston, USA,
responsible for the development of 1,720 MW of IPP projects in Asia. Prior to joining GVA, he worked for
BG plc based in London and Boston, responsible for the development of power and natural gas distribution
projects.
Mr. Russell has an MBA with Distinction in International Business & Export Management from the City
University Business School, London, England (1989) and a Bachelor of Science with Honours in Chemical &
Administrative Sciences from the City University, London, England (1987).
Francisco Ed. Lim, 58
Mr. Lim, Filipino, is an Independent Director of EDC since July 2010. He is the Co-Managing Partner and
Senior Partner of Angara Abello Concepcion Regala & Cruz Law Offices (ACCRALAW) and is the Head of
its Corporate and Special Projects Department. He is a member of the Financial Executives of the Philippines
(FINEX). He is a law professor at the College of Law of the Ateneo de Manila University and the Graduate
School of Law of San Beda College, and the Vice-Chair, Commercial Law Department of the Philippine
Judicial Academy. He is a member of both the Philippine Bar and New York State Bar.
He served as past President and CEO and Director of Philippine Stock Exchange, Inc. (PSE), President &
CEO of Securities Clearing Corporation of the Philippines (SCCP), Chairman of the Philippine Stock
Exchange Foundation, Inc., (PSEFI) and Capital Market Development Center, Inc. (CMDCI), Director of the
Philippine Dealing & Exchange Corporation (PDEx), Trustee of the Securities Investors Protection Fund
(SIPF), and member of Capital Market Development Council (CMDC) from September 15, 2004 to February
15, 2010. He successfully worked for the passage by Congress of several capital market development related
laws, namely, Personal Equity Retirement Account Act (PERAA), Credit Investment System Act (CISA),
Real Estate Investment Trust Act (REITA), Documentary Stamp Duty Exemption for secondary trading of
listed stocks, and Financial Rehabilitation and Insolvency Act (FRIA). He was Chairman of the Technical
Work Group on the Collective Investment Schemes Law (CISL) and Chairman of the Technical Work Group
on Real Estate Investments Trusts (REITS) in the Fourteenth Congress of the Senate of the Republic of the
Philippines.
Mr. Lim graduated magna cum laude in Bachelor of Philosophy and cum laude in Bachelor of Arts from the
University of Santo Tomas. He completed with honors his Bachelor of Laws degree (Second Honors) from
the Ateneo de Manila University and his Master of Laws degree from the University of Pennsylvania, USA.
10
Edgar O. Chua, 56
Mr. Chua, Filipino, is an Independent Director of EDC since July 2010. He is also the Country Chairman of
the Shell Companies in the Philippines. He has corporate responsibility for the various Shell companies in the
exploration, manufacturing and marketing sector of the petroleum business. Likewise, he oversees the
Chemicals businesses and Shared Services. He is currently the Chairman of the Philippine Business for the
Environment and President of Pilipinas Shell Foundation, Inc.
He has more than 30 years of experience in the business fields of chemicals, auditing, supply planning and
trading, marketing and sales, lubricants, corporate affairs and general management. He held senior positions
outside the Philippines as Transport analyst in Group Planning in the UK and as General Manager of the Shell
Company of Cambodia. From July1999 to August 2003, he held various regional positions in Shell Oil
Products East including GM for Consumer Lubricants covering all countries East of Suez Canal including
Saudi Arabia, China, India, Korea, ASEAN, Australia, New Zealand and the Pacific Islands.
Mr. Chua earned his Bachelor of Science degree in Chemical Engineering from De La Salle University (1978)
and attended various international seminars and courses including the senior management course in INSEAD
in Fontainebleau, France.
Arturo T. Valdez, 64
Mr. Valdez, Filipino, is an Independent Director of EDC since July 2011. He served as Undersecretary at the
Department of Transportation and Communication (DOTC) from 1996 to 2004 and was appointed Special
Envoy to the Middle East from October 2007 to March 2008. During his stint in government, he was
instrumental in reforming the maritime industry and rationalizing the land transport sector. He was past
president (1974 to 1986) of the National Mountaineering Federation of the Philippines, Inc., the largest
organization of mountaineering clubs in the country. He conceived, organized and led the First Philippine Mt.
Everest Expedition which successfully accomplished the ―reconnaissance‖ climb of May 2006 when the
Philippine flag was first planted at the peak of Mt. Everest, and the ―first and only women traverse‖ of Mt.
Everest by three Pinays in May 2007, a feat unsurpassed in the history of Himalayan mountaineering until
today. Coming from the mountain after finishing the highest marathon on earth - the 2008 Mt Everest
Marathon - he went directly to the sea and built the ―Balangay,‖ an exact replica of a boat similar to the
ancient sea craft dug up in Butuan City carbon dated 320 A.D., and sailed it together with an intrepid crew of
Filipinos around the Philippines and Southeast Asia for 15 months solely powered by the wind and steered by
the stars to highlight the superb seamanship and daringness of our ancestors as they sailed and habited the vast
Pacific and Indian Oceans.
Mr. Valdez believed that the Mt. Everest and Balangay expeditions may be daunting but their success was
symbolic of what Filipinos can achieve if they are united and set their mind on anything.
Mr. Valdez was an American Field Service scholar and graduated with an AB in Economics from the
University of Santo Tomas (1970). He completed special studies on Social Market Economy (1971), and
Party Building and Parliamentary Government (1994) at Conrad Adenauer Foundation Institute in Germany.
Aside from always having been connected with the Ramos for Peace and Development Foundation and
concurrently as consultant/adviser at the Office of the Executive Secretary, Office of the President, his main
preoccupation today is getting involved with groups exploring alternative sources of clean and renewable fuel
for the transport sector to mitigate climate change. In like manner, alarmed by the series of devastations
caused by man-made and natural disasters that wrought untold misery in the country recently, he is working
develop solutions for operational challenges or problems by conducting concept based experimentation to
introduce indigenous innovations and integrate technologies from other countries in Saving Lives.

11
Key Executive Officers
Agnes C. de Jesus, 59 - Senior Vice President for Environment and External Relations, and
Compliance Officer
Ms. de Jesus, Filipino, joined the Company in 1980 and has held her current position since June 2007. She
was appointed as Compliance Officer last March 10, 2010. She was Vice President of the Environment and
External Relations Sector prior to her current position.
She has had extensive experience in environmental and watershed management, government relations, policy
formulation, Corporate Social Responsibility (CSR), public relations and conflict resolution for energy
projects.
On the international front, Ms. de Jesus was a member of the Board of Consultants of the Kenya Geothermal
Program from July 1993-December 2001 and April 2004-December 2009, and the environmental editor of
Geothermics (International Journal on Geothermal Research and its Applications) from 1996 to 2004. In the
Philippines, she is the Chairperson of the National Steering Committee of the Philippine Small Grants Project
of the UN Development Programme from January 2011 to the present; an accredited Environmental
Assessment Expert of the Department of Environment and Natural Resources (DENR) since December 1997;
a member of the Advisory Council of the Philippine Business for the Environment since August 2011; and a
member of the RE Developers Council representing the geothermal sector in the National Renewable Energy
Board since September 2010. On her Corporate Social Responsibility involvement, she was the Chairperson
of the Environment Committee of the League of Corporate Foundations (LCF) from October 2007- May2011,
and continues to be a member of the organization to date. The LCF is the association of CSR practitioners.
From 2006 to present, she has been a Third Party Expert Reviewer of World Bank policies and country
reports. She has reviewed the World Bank Country Reports and Safeguards Diagnostic on the Philippine
Environmental Impact Statement System, Indigenous Peoples Rights, Involuntary Resettlement and Natural
Habitats. Her environmental efforts are recognized through the 22 awards received by the Company based on
the initiatives she led. At the personal level, she was one of the Top Ten Outstanding Pollution Control
Officers for 2001 and lately, as the EDC Team Leader, won for her team the Lopez Achievement Awards on
Business Communication and Reputation Building in 2009 and again in 2012. Because of the skills and
knowledge of Ms. De Jesus, she was a speaker/lecturer/participant in 19foreign and 94 local conferences and
has reviewed 20 Environmental Impact Assessment Reports on energy projects. Her latest contribution to the
advocacy for biodiversity is her co-authorship of the book ―Rafflesia of the Philippines‖ published by EDC in
2012. The book describes the Philippine species of the largest flower on the planet, Rafflesia.
Ms. de Jesus obtained her Bachelor and Master‘s degrees in Botany from the University of the Philippines in
Diliman and completed the Management Development Program of AIM (1996).
Nestor H. Vasay, 59 - Senior Vice President and Chief Financial Officer
Mr. Vasay, Filipino, is the Chief Financial Officer and Treasurer of the Company since October 2010. He has
been with the Lopez Group since 1997 and held appointments with First Gen Corp. under various capacities
including his current position as Senior Vice President. Prior to joining First Gen Corp., he worked with
Metropolitan Bank and Trust Company, Chase Manhattan Bank and International Exchange Bank where he
held key executive positions responsible for the credit review of institutional and corporate clients, portfolio
management, risk management and Treasury and F/X Operations.
Mr. Vasay holds a Diploma in International Executive Management from Chartered Management Institution
of Ashridge Berkhamsted-London (2006). He earned his Bachelor‘s Degree in Business Administration from
the Angeles University (1976), and passed the Philippine Government Board Examinations for Certified
Public Accountant (CPA) a year later.

12
Marcelino M. Tongco, 58 – Senior Vice President for Strategic Contracting
Mr. Tongco, Filipino, has been with the Company since 1979 and has held his current position since March
2012. Prior to this he was the Senior Vice President for Steamfield Operations since 2010. He served as Vice
President for Steamfield Operations from 2005 to 2010, General Manager for Operations from 1994 to 2005,
Manager for Project Development from 1991 to 1994, and Manager for Engineering and Construction from
1988 to 1991.
Mr. Tongco graduated with a B. S. in Civil Engineering degree from the University of Santo Tomas and has
pursued master‘s studies in Civil Engineering at the University of the Philippines in Diliman. He also
completed the Management Development Program of AIM (1997) and obtained a Master‘s Certificate in
Project Management from George Washington University (1997).
Manuel S. Ogena, 56 – Senior Vice President for Technical Services
Mr. Ogena, Filipino, joined the Company in 1979 and has held his current position since 2010. He joined the
Company as a Geologist and was appointed Supervisor under the Geoscientific department in 1983. He
became the Exploration Manager in 1994, Geoservices Manager in 1997, Geoscientific Senior Manager in
2003, and Vice President for Technical Services in 2005. He has been a regular speaker in various local &
international Geothermal Conferences (GRC/WGC, AGS, etc.), and past member of the board of directors of
the International Geothermal Association in 2006 and 2009.
Mr. Ogena graduated with a B. S. in Geology degree from the University of the Philippines in Diliman in
1977 and placed 8th in the Geologist licensure examination. He completed his MS Engineering degree (with
distinction) from the University of Auckland, New Zealand in 1989. He is also a graduate of the Management
Development Program of AIM (1991) and earned his Master‘s Certificate in Project Management from
George Washington University (1995).
Dominic M. Camu, 50 – Senior Vice President for Power Generation
Mr. Camu, Filipino, was appointed by the Board in March 2012. Prior to this, he served as Vice President and
General Manager for First Gas Corporation from 2009 to 2012 and has also held key positions in General
Electric International Inc, Covanta Power International Holdings Inc and Ogden Energy Philippine Holdings
Inc. He has accommodated more than 28 years of power plant EPC and O&M of power plant and energy
facilities.
Mr. Camu graduated with a Bachelor of Science Degree in Electrical Engineering from Mapua Institute of
Technology (1983). A member of the Institute of Integrated Electrical Engineers of the Philippines, he passed
the Professional Regulation Commission Board Examinations for Electrical Engineer in 1984.
Ma. Elizabeth D. Nasol, 55 – Vice President, Human Resource Management
Ms. Nasol, Filipino, joined the Company in February 2013 as Vice-President for the Human Resources
Management Sector.
She has had extensive track record in Human Resource Management, as well as a wealth of experience
holding leadership positions and managing organizational change and transformation and motivating for high
performance for both domestic and international companies in the manufacturing, service and
telecommunications industry.
Prior to joining EDC, Ms. Nasol was the Vice-President of the Corporate Human Resources of First Philec
(2011-2012), Vice-President, Corporate Human Resource of the Roxas Holdings, Inc. and all its subsidiaries
(2008-2011), and Head of the Center for Excellence of Globe Telecommunications, Inc. (2007-2008). She
also held various leadership positions throughout the San Miguel Corporation and its subsidiaries from 1987
to 2007. She also served in key Management positions in the Fil-Estate Group of Companies and John

13
Clemens Consultants, Inc.
On the international front, Ms. Nasol was responsible for providing service and advice in assessing and
developing organizational capabilities (culture, systems, structure, processes and roles) and in designing and
managing change to improve organizational performance in San Miguel Packaging Products (SMPP)
international operations in China, Indonesia and Vietnam. She was also responsible for the management and
administration of the expatriate program for SMPP, including selections or expatriates for the offshore
installation, development and design of expatriate compensation package, training and country orientation,
pay administration, re-integration of expatriates.
Ms. Nasol is currently taking her Masteral and Doctorate Degrees in Organization Development in the
Southeast Asia Interdisciplinary Development Institute (SAIDI). She graduated from the University of Santo
Tomas with a Bachelor‘s Degree in Psychology and completed an Executive Development Program in
INSEAD Singapore in 1992 and her Strategic HR Management Program from University of Michigan in
1995.
Ernesto G. Espinosa, 60 – Vice President for Change Management
Mr. Espinosa, Filipino, was appointed by the Board in October 2009. He worked as Vice President, HR
Management from October 2009 to September 2012 until he was appointed as Vice President, Change
Management in October 2012, the position he currently holds. Prior to his appointment in the Company, he
worked with Fujitsu Computer Products Corporation of the Philippines as Vice President for Human Resource
and General Affairs from 2004 to October 2009, Assistant Vice President from 2000 to 2004 and Director
from 1995 to 2000. He is currently the President of the Asia Pacific Federation of Human Resource
Management (APFHRM), the position he held in 2007 and will serve again from 2012 to 2014. He was the
Past President of the World Federation of People Management Associations (WFPMA), serving from 2008 to
2010, the first Filipino and third Asian to be elected in such position. He was also the President of the People
Management Association of the Philippines (PMAP) in 2002. He was awarded as Personnel Manager of the
Year by PMAP in 2006.
Mr. Espinosa obtained his Masters in Business Administration degree from the De La Salle University (1978).
He also has a Certificate in Computer Applications from Cornell University, Ithaca, New York (1989). He
graduated with a Bachelor of Science Degree in Commerce Major in Accounting from the University of Santo
Tomas (1972).
Vincent Martin C. Villegas, 40 – Vice President for Business Development
Mr. Villegas, Filipino, was appointed by the Board in October 2009. He is also a Vice President of First Gen,
FL Geothermal, GCGI, BGI and EBWPC. He is the Treasurer and Director of the Wind Energy Developers
Association of the Philippines and also serves as the Director of the National Geothermal Association of the
Philippines. Prior to joining First Gen, he worked with the Treasury Group of PHINMA, Inc. from 1994 to
1996.
Mr. Villegas has a Masters in Business Management from AIM (1998). He graduated with an AB in
Management Economics degree from the Ateneo de Manila University (1993).
Ellsworth R. Lucero, 54 – Vice President for Power Generation
Mr. Lucero, Filipino, was appointed by the Board in December 2010. He joined the Company as an engineer
in LGPF in 1982, and since then has been assigned to different geothermal production fields across the
country holding various positions. He was promoted to manager of the BGPF in 1994 and to resident
manager of MGPF in 2004.

14
Mr. Lucero graduated with a B. S. in Mechanical Engineering from the Cebu Institute of Technology (1979)
and passed the Mechanical Engineer Licensure Examination in the same year. He completed the Management
Development Program of AIM (1995) and has undergone geothermal energy training in New Zealand (1986).
Dwight A. Maxino, 54 – Vice President, Southern Negros and Northern Negros Geothermal Production
Fields
Mr. Maxino, Filipino, was appointed by the Board in December 2010. He has been with EDC since February
1980 and has held various positions including Well Test Aide, Reservoir Engineer, Well Test Measurement
and Maintenance Supervisor, Production Superintendent, and Production Manager. He served as the Resident
Manager of LGPF from 2004 to 2005 and SNGP from 2006-2010, and as OIC Resident Manager of NNGPF
from 2009 to 2010.
Mr. Maxino graduated with a B. S. in Mechanical Engineering degree from the Cebu Institute of Technology
(1979) and passed the Mechanical Engineer Licensure Examination (1980). He holds a Diploma in
Geothermal Technology from the University of Auckland (New Zealand, 1981) and completed the
Management Development Program of AIM (1993).
Manuel C. Paete, 57 – Vice President, Leyte Geothermal Production Field
Mr. Paete, Filipino, was appointed by the Board in December 2010. He started his career in EDC as a
reservoir engineer trainee in LGPF in 1980. He then assumed various positions in well test measurements and
FCRS operations before becoming the LGPF Production Manager in 2004 and Resident Manager in 2005.
Mr. Paete graduated with a B. S. in Mechanical Engineering degree from the Leyte Institute of Technology
(1978) and passed the Mechanical Engineer Licensure Examination in the same year. He became a
Professional Mechanical Engineer in 2010. He also completed a course on Geothermal Technology with
specialization in Borehole Geophysics at the United Nations University, Reykjavik, Iceland (1983). In
October 2012, he received The Outstanding Mechanical Engineer in the field of Management by the
Philippine Society of Mechanical Engineers (PSME) during the 60th PSME national convention.
Liberato S. Virata, 53 - Vice President, BacMan Geothermal Production Field
Mr. Virata, Filipino, was appointed by the Board in December 2010. He started working for EDC in 1982 and
held various positions including Field Maintenance Manager for LGPF, Production Manager and Resident
Manager for BGPF prior to his current position.
Mr. Virata graduated with a B. S. in Mechanical Engineering degree from the Mapua Institute of Technology
in Manila (1981). He became a Registered Mechanical Engineer in 1982 and a Professional Mechanical
Engineer in 2006. He completed the Management Development Program of AIM (1993), Refinery
Operations Course at Shell Refinery Clyde, Sydney New South Wales, Australia (1988), and Diploma Course
in Maintenance Management System (JICA) at Kitakyushu, Japan (2003).
Erwin O. Avante, 38 – Vice President, Corporate Finance Division
Mr. Avante, Filipino, was appointed by the Board in March 2011. He is also a Vice-President in First Gen
Corporation and has been a member of the Board of Trustees of the CFA Society of the Philippines since
2010. Prior to joining the Lopez Group in 1998, Mr. Avante worked as Senior Audit In-charge at SyCip,
Gorres, Velayo &. Co.
Mr. Avante has Masters in Business Administration (2000) and Masters of Science in Computational Finance
(2003), both obtained from the Graduate School of Business – De La Salle University, and a Bachelor of
Science in Accountancy degree from De La Salle University (1994). Mr. Avante placed 1st in the May 1995
Certified Public Accountants board examination. He is also a CFA charterholder since 2005.

15
Rico G. Bersamin, 65 – Vice President, Steam Field Operations
Mr. Bersamin, Filipino, was appointed by the Board in July 2011. He had previously spent
39 years with Pilipinas Shell Petroleum Corporation and its affiliates, holding various engineering, operational
and managerial positions in Tabangao and Pililla refineries. His last assignment was in Al-Jubail, Saudi
Arabia where he was the Executive Vice President and General Manager for Production and Maintenance of
the 300,000 bpd fully-complex crude oil refinery of Saudi Aramco Shell Refinery Company.
Mr. Bersamin graduated with a B. S. in Electronics Engineering degree, magna cum laude from the University
of Santo Tomas (1969).
Ferdinand B. Poblete, 51 – Vice-President for Information Services / Chief Information Officer
Mr. Poblete, Filipino, was appointed by the Board in September 2011. He is a global information technology
(IT) executive with over 25 years of diverse experience in cross-cultural markets across Asia, Europe, Middle
East, Africa, Latin America and North America. He has held various leadership positions with responsibilities
covering IT infrastructure, manufacturing, sales, logistics systems, people management, strategic business
planning and management, and business development. He was formerly the Senior Vice President and
Director for the Strategic Initiatives Office of Philamlife Insurance Co. He was also with Procter & Gamble
(P&G) for 18 years, holding various positions such as Country IT Manager of Korea, Associate Director for
Worldwide Distribution Systems and Associate Director for Business Information Solutions for Asia Regional
Operations.
Mr. Poblete graduated with a B. S. in Electrical Engineering degree from the University of the Philippines in
Diliman, and is an alumnus of the Philippine Science High School.
Ariel Arman V. Lapus, 43 – Vice President, Business Development – International
Mr.Lapus, Filipino, was appointed by the Board in March 2012 to oversee EDC‘s operations in Latin
America. He is also a Vice President in First Gen Corporation where he headed the power marketing and
trading operation group. Prior to joining First Gen in November 2009, he was Executive Vice President of
Global Business Power Corporation and Vice President of Mirant Philippines Corporation.
Mr.Lapus graduated with a Bachelor of Science degree in Business Management from the Ateneo de Manila
University (1990) and has a Master in Business Management (MBM) degree from the Asian Institute of
Management (1997).
Wilfredo A. Malonzo, 48 – Vice President for Supply Chain Management
Mr. Malonzo, Filipino, was appointed by the Board in January 2012. He is an expert and a leader in supply
chain management operations in cross-cultural countries, specifically in Asia and Europe. Prior to joining
EDC, he was the Head of Indirect Sourcing, Philippines and Southeast Asia Cluster of Novartis Healthcare
Philippines, Inc., responsible for managing sourcing functions in the Philippines, Singapore, Indonesia,
Bangladesh and Pakistan, and for fleet management and building administration for the Philippines. He
worked as Strategic Sourcing Manager of On Semiconductor Philippines, Inc. from 2009 to 2010. He was
also with Intel Technology Philippines, Inc. for five years, holding various regional and global managerial
positions in supply chain management.
Mr. Malonzo is the past Chairman of the Association of Semiconductor and Electronics Industries of the
Philippines, Inc. Purchasing Managers (ASPM). He graduated with a B. S. in Mechanical Engineering
Technology from De La Salle University (1984).

16
Maribel A. Manlapaz, 48 – Comptroller
Ms. Manlapaz, Filipino, joined Energy Development Corporation in November 2009. She is a Certified
Public Accountant with more than 20 years of experience in multinational pharmaceutical and consumer
products industries. Prior to joining EDC, Ms. Manlapaz was the Finance Director for UCB Philippines, Inc.,
a multinational Pharmaceutical company based in Belgium.
Ms. Manlapaz graduated Cum Laude from the Philippine School of Business Administration (1986) and
completed her Masters in Business Administration for Top Executives from Pamantasan Ng Lungsod Ng
Maynila (1996).
Teodorico Jose R. Delfin, 44 - Corporate Secretary
Atty. Delfin, Filipino, was appointed by the Board in July 2010. He is also the Corporate Secretary of First
Gen Hydro Power Corp., Green Core Geothermal Inc., Bac-Man Geothermal Inc., EDC Geothermal Corp.,
EDC Wind Energy Holdings, Inc., and several other Company subsidiaries. He also served as Assistant
Corporate Secretary of First Gen Corp., FG Bukidnon Power Corp., First Gen Renewables, Inc., Red Vulcan
Holdings Corp., First Gen Northern Energy Corp., and other First Gen subsidiaries. Prior to joining the Lopez
Group, he was part of the Feria Law Offices and the East Asia Power Resources Group, and has served in
various capacities at the state-owned Philippine Amusement and Gaming Corporation.
Atty. Delfin graduated with a Bachelor of Arts in Political Science degree from the University of the
Philippines (1989) and earned his Bachelor of Laws degree from the University of the Philippines College of
Law (1997).
Ana Maria A. Katigbak, 43 - Assistant Corporate Secretary
Atty. Katigbak, Filipino, was appointed by the Board in January 2007. She is a member of the Castillo Laman
Tan Pantaleon & San Jose Law Firm. Atty. Katigbak graduated cum laude at the University of the Philippines
with a Bachelor of Arts degree in Comparative Literature. She is a graduate of the University of the
Philippines College of Law (1994) and a member of the Phi Kappa Phi international honor society. Her
practice areas are corporate law, securities and litigation. She was admitted to the Philippine Bar in 1995.
Glenn L. Tee, 41 - Senior Manager, Internal Audit and Chief Audit Executive
Mr. Tee, Filipino, was appointed by the Board in October 2010. Prior to his appointment at EDC, he was
Internal Audit Head of First Gen for two years. He has been with the Lopez Group since 1994 and has held
key positions in the internal audit and accounting departments of First Philippine Holdings Corp. and First
Philippine Infrastructure and Development Corp.
Mr. Tee graduated from San Beda College (1992), and is both a Certified Public Accountant and Certified
Internal Auditor. He completed the academic requirements of the Executive Masters in Business
Administration from the AIM (2009).
Erudito S. Recio, 55 - Senior Manager, Investor Relations
Mr. Recio, Filipino, has been with the Company since 1981. He was appointed to his current position in
January 2007 but has performed his current duties since December 2006. He started with the Company as a
Planning Engineer in 1981 and has since held various positions in the Planning & Control Division. He was
Corporate Planning Manager from 1993 to 2006.
Mr. Recio obtained a B. S. in Management Engineering degree from the Ateneo de Manila University. He
completed the Management Development Program of AIM (1996).

17
Significant Employees
No single person or employee is expected to make a significant contribution to the Company‘s business since
the Company considers the collective efforts of all its employees as instrumental to the success of the
Company.
Nominees for Directors
The following are the nominees for regular and independent directors:
For Regular Directors For Independent Directors 1. OSCAR M. LOPEZ
2. FEDERICO R. LOPEZ 3. PETER D. GARRUCHO, JR. 4. ELPIDIO L. IBAÑEZ 5. ERNESTO B. PANTANGCO 6. FRANCIS GILES B. PUNO
7. JONATHAN C. RUSSELL 8. RICHARD B. TANTOCO
9. EDGAR O. CHUA
10. FRANCISCO ED. LIM 11. ARTURO T. VALDEZ
All nominations for regular and independent director have been reviewed and approved by the Company‘s
Nomination and Compensation Committee.
Please refer to the above biographical details of current directors that have been renominated.
Independent Directors/Nomination Committee
In compliance with SRC Rule 38, which provides for the guidelines on the nomination and election of
independent directors, a Nomination and Compensation Committee has been constituted to pre-screen and
accept the nominations of regular and independent directors. It is headed by Federico R. Lopez as chairman
with Peter D. Garrucho, Jr., Elpidio L. Ibañez, Francis Giles B. Puno and Arturo T. Valdez (Independent
Director) as members.
Accordingly, the Nomination and Compensation Committee has approved the nominations of Messrs. Francis
Ed. Lim, Edgar O. Chua and Arturo T. Valdez as independent directors conformably with the criteria
prescribed in SRC Rule 38, the Company‘s Code of Corporate Governance and the Charter of the Nomination
and Compensation Committee.
The SEC approved on July 20, 2009 certain amendment to the Company‘s By-laws incorporating among
others, the provisions of SRC Rule 38, as amended, on the nomination and election of Independent Directors.
Mr. Lim was nominated by stockholder Veronica T. Villanueva. Mr. Chua was nominated by stockholder
Carlo Lorenzo L. Vega. Mr. Valdez was nominated by stockholder Carlo Sebastian G. Gutierrez. The
nominees for independent director are not related to their respective nominators.
Family Relationships
Oscar M. Lopez is the father of Federico R. Lopez; Ernesto B. Pantangco is the cousin-in-law of Oscar M.
Lopez; and the wives of Federico R. Lopez and Francis Giles B. Puno are sisters.
Involvement in Certain Legal Proceedings
To the best of the Company‘s knowledge, there has been no occurrence during the past five years of any of the
following events since its incorporation which are material to an evaluation of the ability or integrity of any

18
director, person nominated to become a director, executive officer, or control person of the Company:
1. Any insolvency or bankruptcy petition filed by or against any business of which such person was a
general partner or executive officer either at the time of the insolvency or within two years prior to that
time;
2. Any conviction by final judgment in a criminal proceeding, domestic or foreign, or any pending criminal
proceeding, domestic or foreign, excluding traffic violations and other minor offenses;
3. Any final and executory order, judgment, or decree of any court of competent jurisdiction, domestic or
foreign, permanently or temporarily enjoining, barring, suspending, or otherwise limiting involvement in
any type of business, securities, commodities, or banking activities; and
4. Any final and executory judgment by a domestic or foreign court of competent jurisdiction (in a civil
action), the Philippine SEC, or comparable foreign body, or a domestic or foreign exchange or electronic
marketplace or self-regulatory organization, for violation of a securities or commodities law.
Mr. Tantoco in his capacity as President has been impleaded as respondent in one ongoing labor case filed by
a former Company employee. The Company, however, does not believe that this claim affects Mr. Tantoco‘s
ability or integrity as a Company Officer.

19
Certain Relationships and Related Transactions
Parties are considered to be related if one party has the ability, directly or indirectly, to control the other
party or exercise significant influence over the other party in making financial and operating decisions.
Parties are also considered to be related if they are subject to common control or common significant
influence.
a. Following are the amounts of transactions and outstanding balances as of and for the years ended
December 31, 2012 and 2011:
The purchases from related parties are made at normal commercial terms and conditions.
The amounts outstanding are unsecured and will be settled in cash. The Company has not recognized
any impairment losses on receivables from related parties as of December 31, 2012 and 2011.
Transactions for the years
ended December 31
Net amounts due from/to
related parties as at December 31
Related Party Nature of Transaction Terms 2012 2011 2012 2011
Due from related parties
First Gen Interest-free advances
Unsecured and will
be settled in cash P=– P=3,437 P=– P=3,437
First Gen Northern Energy
Corp.
Interest-free advances
- do - – 2,511 – 2,511
First GES Interest-free advances - do - – 1,864 – 1,864
P=– P=7,812 P=– P=7,812
Due to related parties
First Gen Consultancy fee - do - P=165,619,598 P=161,590,588 P=41,379,949 P=53,863,530
Interest-free advances - do - 26,095,569 62,587,201 8,166,941 6,061,620
Lopez Group Foundation,
Inc.
Donation to support the Group‘s
Corporate Social
Responsibility efforts
- do - 1,095,000 838,400 – –
First Gas Power Corporation
Interest-free advances
- do -
147,794
626,755
30,613
165,675
Bauang Private
Power Corporation
Acquisition of one unit MVA
transformer - do - 57,330 – – –
Eugenio Lopez Foundation,
Inc.
Donation to Lopez Museum
- do -
–
2,400,000
–
–
P=193,015,291 P=228,042,944 P=49,577,503 P=60,090,825
Trade and other payables
(Note 17)
Thermaprime
Drilling and other related
services
- do - P=1,155,169,743 P=994,573,343 P=171,699,140 P=101,171,006
First Balfour Inc.
Steam augmentation and other
services
- do - 192,687,664 158,696,338 73,339,568 38,989,273
First Philec Manufacturing Technologies Corp
Purchase of services and utilities
- do -
3,696,180 625,000 2,077,482 328,720
Adtel Purchase of services and utilities - do - 3,272,208 – 1,452,277 –
FEDCOR Purchase of services and utilities - do - 2,930,000 – – –
ABS-CBN Publishing, Inc. Purchase of services and utilities - do - 1,284,110 47,500 – –
FPRC Purchase of services and utilities - do - 1,190,822 2,435,646 – 458,150
Bayantel Purchase of services and utilities - do - 531,781 1,090,465 5,038,978 4,524,811
Goldlink Security and
Investigative Services Inc.
Purchase of services and utilities
- do -
494,787 458,603 – –
Securities Transfer
Services, Inc.
Purchase of services and utilities
- do -
129,920 159,884 39,370 39,370
ABS-CBN Corp. Purchase of services and utilities - do - 118,878 70,000 496,000 –
Rockwell Land Corporation Purchase of services and utilities - do - 70,000 – – –
First Philippine Industrial
Corporation
Purchase of services and utilities
- do - 1,488 – – –
Sky Cable Purchase of services and utilities - do - – 12,100 – –
P=1,361,577,581 P=1,158,168,879 P=254,142,815 P=145,511,330
Long-term debt
IFC (Note 19) Interest-bearing loans - do - P=519,860,137 P=4,223,815,201 P=6,740,716,758 P=7,067,386,685

20
i. First Gen
First Gen provides financial consultancy, business development and other related services to the
Parent Company under a consultancy agreement beginning September 1, 2008. Such agreement is
for a period of three years up to August 31, 2011. Under the terms of the agreement, billings for
consultancy services shall be P=8.7 million per month plus applicable taxes. This was increased to
P=11.8 million per month plus applicable taxes effective September 2009 to cover the cost of
additional officers and staff assigned to the Parent Company.
The consultancy agreement was subsequently extended for another 16 months from
September 1, 2011 to December 31, 2012. The consultancy agreement was extended for another
two years from January 1, 2013 to December 31, 2014. Total consultancy services amounted to
P=165.6 million, P=161.6 million and P=170.8 million in 2012, 2011 and 2010, respectively, and were
included in the ―Costs of sales of electricity and steam‖ under ―Purchased services and utilities‖
account. In addition, First Gen charged P=236.4 million in 2010 for the reimbursement of the
employee costs of its seconded personnel to the Company and was included in the general and
administrative expenses under ―Business and related expenses‖ account. There were no similar
charges in 2012 and 2011.
In 2012, the Parent Company purchased 5.4 million shares of First Gen with acquisition cost of
P=77.1 million recorded as AFS investments.
ii. IFC
IFC is a shareholder of the Parent Company that has approximately 5% ownership interest in the
Parent Company. On May 20, 2011, the Parent Company signed a 15-year
US$75.0 million loan facility with IFC. The loan was drawn in Peso on September 30, 2011,
amounting to P=3,262.5 million. As of December 31, 2012 and 2011, the outstanding balance of the
loan amounting to P=3,203.3 million and P=3,196.1 million, respectively, is included under the
―Long-term debts‖ account in the consolidated statement of financial position.
On November 27, 2008, the Parent Company entered into a loan agreement with IFC for US$100.0
million or its Peso equivalent of P=4.1 billion. On January 7, 2009, the Parent Company opted to
draw the loan in Peso and received the proceeds amounting to P=4,048.8 million, net of
P=51.3 million front-end fee. The loan is payable in 24 equal semi-annual installments after a three-
year grace period at an interest rate of 7.4% per annum for the first five years subject to repricing
for another five to 10 years. Under the loan agreement, the Parent Company is restricted from
creating liens and is subject to certain financial covenants. As of December 31, 2012 and 2011, the
outstanding loan amounted to P=3,537.5 million and P=3,871.3 million, respectively, net of
unamortized transaction costs of P=49.6 million and P=57.8 million, respectively. This loan is
included under the ―Long-term debts‖ account in the consolidated statement of financial position.
iii. First Balfour, Inc. (First Balfour)
Following the usual bidding process in 2010, the Company awarded to First Balfour procurement
contracts amounting to P=217.7 million for various works such as Palinpinon 1 zero condensate
disposal system, civil, structural and mechanical/piping works in Leyte and Bac-Man and
refurbishment of BGI‘s geothermal power plants.
As of December 31, 2012 and 2011, the outstanding balance amounted to P=73.3 million and
P=39.0 million, respectively, recorded under ―Trade and other payables‖ account in the consolidated
financial statements.
First Balfour is a wholly owned subsidiary of First Holdings.

21
iv. Other Related Parties
Bauang Private Power Corporation is a subsidiary of First Private Power Corporation, an
associate of First Gen. First Gas Holdings Corporation and First Gas Power Corporation are
subsidiaries of First Gen. First Holdings, parent company of First Gen, is an associate of Lopez
Holdings Corporation (formerly Benpres Holdings Corporation).
Bayan Telecommunications Inc. (Bayantel) is 97.3%-owned by Bayantel Holdings on which
Lopez Holdings Corporation has 47.3% ownership.
Sky Cable Corporation (Sky Cable) is 80.7%-owned by ABS-CBN Corp. on which Lopez
Holdings Corporation has 57.3% interest. ABS-CBN Publishing, Inc. is a wholly owned
subsidiary of ABS-CBN Corp.
Rockwell Land Corporation is 86.79% owned by First Holdings.
First Electro Dynamics Corporation (FEDCOR) is a wholly owned subsidiary of First Holdings.
Adtel Inc. is a wholly owned Lopez Incorporated entity.
Lopez Group Foundation, Inc. is the coordinative hub for the corporate social responsibility
initiatives of Lopez Holdings Corporation.
First Philec Manufacturing Technologies Corp., Securities Transfer Services, Inc. and First
Philippine Realty Corp. (FPRC), formerly known as INAEC Development Corp, are wholly
owned subsidiaries of First Holdings.
Thermaprime Well Services, Inc. (Thermaprime) is a subsidiary of First Balfour, a wholly
owned subsidiary of First Holdings. Thermaprime provides drilling services such as, but not
limited to, rig operations, rig maintenance, well design and engineering.
First Gen Energy Solutions (First GES) and First Gen Northern Energy Corp. are wholly owned
subsidiaries of First Gen.
First Philippine Industrial Corp. is 60% owned by First Holdings.

22
Item 6. Compensation of Directors and Executive Officers
The aggregate compensation paid or incurred during the last two fiscal years and estimated to be paid in the
ensuing fiscal year to the executive officers of the Company are as follows:
Summary Compensation Table
Name Year Salary
Bonus/Other
Annual
Compensation
Federico R. Lopez, Chairman & CEO
Richard B. Tantoco, President & COO
Ernesto B. Pantangco, Executive Vice President
Nestor H. Vasay, Sr. Vice President, Chief
Financial Officer and Treasurer
Agnes C. De Jesus, Sr. Vice President for
Environment and External Relations, and
Compliance Officer
CEO and the four most highly compensated
officers named above
2011 P37,118,601 P31,186,927
2012 P45,652,399 P36,992,530
2013 (estimate) P46,655,700 P39,571,900
Aggregate compensation paid to all officers
and directors as a group unnamed
2011 P63,978,272 P55,247,062
2012 P66,601,800 P60,618,702
2013 (estimate) P72,418,426 P59,478,150
*Note: Certain officers of the Corporation, including the top four members of senior management listed in the table above, are
seconded and receive their salaries from First Gen Corp.
Description of Any Standard Arrangement
In compliance with EDC Board Resolution No. 54, S‘ 2007, the members of the Board are remunerated with a
compensation package as follows:
Monthly director‘s fee: P50,000.00
Attendance fee for Board meetings: P10,000.00 per meeting
Bonus to Directors as a group: ½ of 1% of declared cash dividend
Group Life Insurance Coverage: P4 million, at a premium per month of P1,080.00 wherein P372.10 is
being shouldered by the Company while the balance of P707.90 is being shouldered by the director.
Group Hospitalization Insurance Coverage: P2,632.38 per month
Description of Material Terms of Any Other Arrangement
None
Description of the Terms and Conditions of (a) Employment Contracts between the Registrant and
Named Executive Officers, and (b) Compensatory Plan or Arrangement
There is no employment contract between EDC and Messrs. Lopez, Tantoco, Pantangco and Vasay. The
foregoing officers are seconded to EDC and receive their respective salaries from First Gen Corp.
SVP de Jesus receives her salary and bonus from EDC in an amount appropriate to her position. She is also
covered by EDC‘s standard employee benefits which include health insurance, rice allowance, retirement plan
and the Savings Land Home Ownership Plan.
Warrants
As of the date hereof, there are no outstanding warrants held by the Company‘s president, named executive
officers, and all directors and officers, as a group.
23
Stock Ownership Plans
The Corporation‘s board of directors and stockholders approved on May 25 and June 10, 2008, respectively,
the creation of Stock Ownership Plans consisting of a Stock Grant Plan, Stock Option Plan, and Stock
Financing Plan (collectively the "Stock Ownership Plans") covering the Corporation‘s officers and employees.
The total number of shares to be awarded under the Stock Ownership Plans shall not exceed four percent (4%)
of the Company‘s issued common capital stock. The finalization and approval of each of the plans constituting
the Stock Ownership Plans, including the rules thereof, have been delegated to the Company‘s board of
directors. To date, only the rules of the Stock Grant Plan have been approved by the Company‘s board of
directors.
Under the Stock Grant Plan, the company‘s Nomination and Compensation Committee (―NCC‖) has the sole
discretion to select individuals to whom awards shall be granted in any calendar year. As of the date of this
statement, the NCC has granted in favor of certain officers and employees of the company a total of Fourteen
Million Eight Hundred Seventy Five Thousand (14,875,000) stock awards broken down into: Seven Million
(7,000,000) stock awards granted on December 1, 2009, Two Million Six Hundred Twenty Five Thousand
(2,625,000) stock awards granted on January 18, 2010, Two Million Six Hundred Twenty Five Thousand
(2,625,000) stock awards on June 18, 2011 and Two Million Six Hundred Twenty Five Thousand (2,625,000)
stock awards granted on June 20, 2012.
The granted shares will vest over a three (3)-year period as follows: twenty percent (20%) after the 1st
anniversary of the grant date; thirty percent (30%) after the 2nd
anniversary of the grant date; and the
remaining fifty percent (50%) after the 3rd
anniversary of the grant date. Of the Seven Million (7,000,000)
shares granted on December 1, 2009, One Million Four Hundred Thousand (1,400,000) shares vested on
January 1, 2010, Two Million One Hundred Thousand (2,100,000) shares vested on January 1, 2011 and
Three Million Five Hundred Thousand (3,500,000) shares vested on January 1, 2012. Of the Two Million Six
Hundred Twenty Five Thousand (2,625,000) shares granted on January 18, 2010, Five Hundred Twenty Five
Thousand (525,000) shares vested on January 1, 2011, Seven Hundred Eighty Seven Thousand Five Hundred
(787,500) shares vested on January 1, 2012 and One Million Three Hundred Twelve Thousand Five Hundred
(1,312,500) shares vested on January 1, 2013. Of the Two Million Six Hundred Twenty Five Thousand
(2,625,000) shares granted on June 18, 2011, Five Hundred Twenty Five Thousand (525,000) shares vested on
January 1, 2012. Of the Two Million Six Hundred Twenty Five Thousand (2,625,000) shares granted on June
20, 2012, Five Hundred Twenty Five Thousand (525,000) shares vested on January 1, 2013 and Seven
Hundred Eighty Seven Thousand Five Hundred (787,500) shares vested on January 1, 2013.
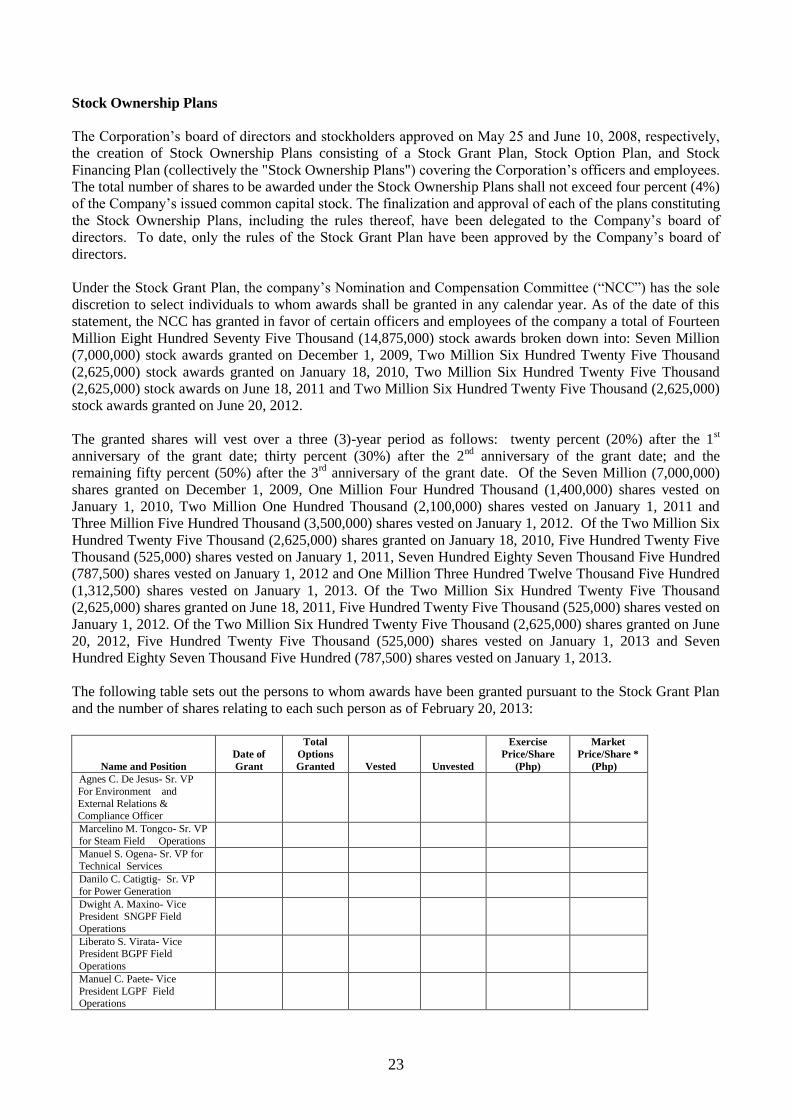
The following table sets out the persons to whom awards have been granted pursuant to the Stock Grant Plan
and the number of shares relating to each such person as of February 20, 2013:
Name and Position
Date of
Grant
Total
Options
Granted Vested
Unvested
Exercise
Price/Share
(Php)
Market
Price/Share *
(Php)
Agnes C. De Jesus- Sr. VP
For Environment and
External Relations & Compliance Officer
Marcelino M. Tongco- Sr. VP
for Steam Field Operations
Manuel S. Ogena- Sr. VP for Technical Services
Danilo C. Catigtig- Sr. VP
for Power Generation
Dwight A. Maxino- Vice President SNGPF Field
Operations
Liberato S. Virata- Vice President BGPF Field
Operations
Manuel C. Paete- Vice
President LGPF Field Operations

24
Name and Position
Date of
Grant
Total
Options
Granted Vested
Unvested
Exercise
Price/Share
(Php)
Market
Price/Share *
(Php)
Ellsworth R. Lucero- Vice
President Power Plant
Operations- Leyte
Aggregate number of shares
granted to the above-named
officers
Dec.18, ‗09
7,000,000 7,000,000 - 4.70/5.80/6.35 5.87
Jun. 18 ‗10 2,625,000 2,625,000 - 5.80/6.35/6.85 6.04
Jun. 18 ‗11 2,625,000 1,312,500 1,312,500 6.35/6.85 6.21 Jun. 18 ‗12 2,625,000 525,000 2,100,000 6.85 6.46 Aggregate number of shares
granted to all officers and
directors as a group unnamed
Dec.18, ‗09
7,000,000 7,000,000 - 4.70/5.80/6.35 5.87
Jun. 18 ‗10 2,625,000 2,625,000 - 5.80/6.35/6.85 6.04
Jun. 18 ‗11 2,625,000 1,312,500 1,312,500 6.35/6.85 6.21 Jun. 18 ‗12 2,625,000 525,000 2,100,000 6.85 6.46
* average market price from date of grant to February 20, 2013
Item 7. Independent Public Accountants
Since 1987, the Commission on Audit of the Philippines had served as the independent auditor of the
Company to audit the Company‘s financial statements. With the full privatization of the Company in 2007, it
has engaged SGV & Co. as its external auditor for the last four years. The Company has not had any material
disagreements on accounting matters or financial disclosure matters with both Commission on Audit and SGV
& Co. It is proposed to reappoint during the annual stockholders‘ meeting, SGV& Co. as the Company‘s
external auditor for the current year.
The Company shall comply with the requirement under SRC Rule 68, Paragraph 3(b)(iv) on the rotation of its
external auditor or partner in charge every five years.
Representatives of SGV & Co. shall be present at the meeting, will have the opportunity to make a statement
if they choose to do so, and will be available to respond to appropriate questions.
In February 2013, the Company‘s Audit and Governance Committee (AGC) reviewed together with
EDC Management and SGV & Co. the Company‘s 2012 Annual Financial Statements. They endorsed the
statement‘s release to regulatory bodies and the stockholders. The AGC is headed by independent director
Edgardo O. Chua with members Francisco Ed. Lim (Independent Director), Ernesto B. Pantangco and Francis
Giles B. Puno.
C. OTHER MATTERS
Item 8. Action with Respect to Reports:
The Minutes of the previous annual stockholders‘ meeting will be submitted for stockholder‘s approval.
During the last stockholders‘ meeting held on May 9, 2012, the stockholders approved the following: (i)
minutes of the previous annual meeting held on July 13, 2011; (ii) Management report; (iii) ratification of
Management‘s acts (See attached Annex ―A‖); (iv) change in annual meeting date to the first Tuesday of May
of each year, and amendment of By-laws; (v) election of directors; and (vi) appointment of the Company‘s
independent auditors.
Approval of the Minutes will constitute a ratification of the accuracy and faithfulness of the Minutes to the
events that transpired during the meeting. This does not constitute a second approval of the same matters
taken up at the annual stockholders‘ meeting, which has been approved.
25
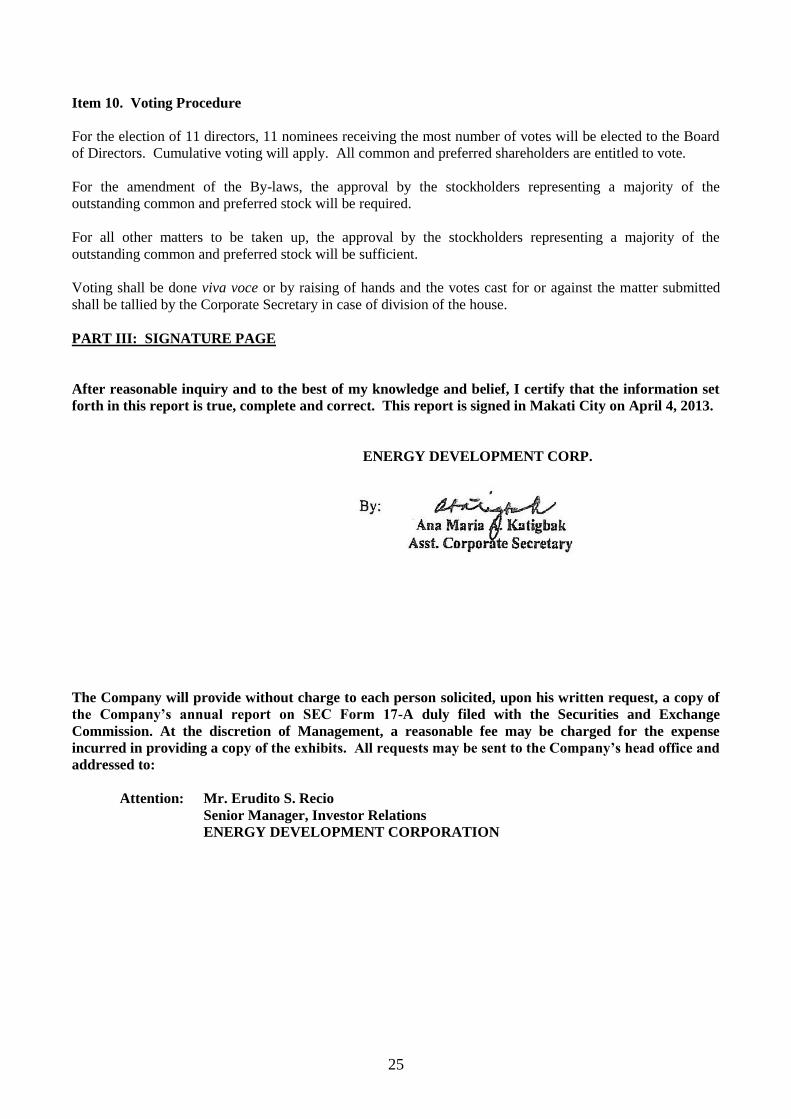
Item 10. Voting Procedure
For the election of 11 directors, 11 nominees receiving the most number of votes will be elected to the Board
of Directors. Cumulative voting will apply. All common and preferred shareholders are entitled to vote.
For the amendment of the By-laws, the approval by the stockholders representing a majority of the
outstanding common and preferred stock will be required.
For all other matters to be taken up, the approval by the stockholders representing a majority of the
outstanding common and preferred stock will be sufficient.
Voting shall be done viva voce or by raising of hands and the votes cast for or against the matter submitted
shall be tallied by the Corporate Secretary in case of division of the house.
PART III: SIGNATURE PAGE
After reasonable inquiry and to the best of my knowledge and belief, I certify that the information set
forth in this report is true, complete and correct. This report is signed in Makati City on April 4, 2013.
ENERGY DEVELOPMENT CORP.
The Company will provide without charge to each person solicited, upon his written request, a copy of
the Company’s annual report on SEC Form 17-A duly filed with the Securities and Exchange
Commission. At the discretion of Management, a reasonable fee may be charged for the expense
incurred in providing a copy of the exhibits. All requests may be sent to the Company’s head office and
addressed to:
Attention: Mr. Erudito S. Recio
Senior Manager, Investor Relations
ENERGY DEVELOPMENT CORPORATION

Definitive Information Statement
Annex “A”
Summary of Acts for Ratification
The acts for ratification from the date of the last stockholders’ meeting include the following:
- Election of officers, designation of Board Committees, appointment of advisors and
consultants and approval of authorities;
- Approval of BOI registration of power projects;
- Approval of assignment of wind energy service contracts;
- Approval to incorporate and organize Indonesian entities;
- Approval of amendments to the Corporate Governance Manual and committee charters
- Approval of changes to authorized bank and contractual signatories and amendment of
existing resolutions;
- Approval of letters of credit;
- Approval of bidding authorities;
- Authorization for permit applications;
- Approval of interim financial statements and audited financial statements;
- Authorizations and contract approvals for N2N Relocation Project;
- Approval of amendment to IFC loan agreement;
- Amendment of authorities on the filing of cases;
- Approval of USD Club Loan;
- Award of control system integration contract;
- Approval of special cash dividend;
- Approval of regular cash dividend;
- Authorization to sell rigs;
- Approval of drilling contract with Thermaprime;
- Approval of financing for Burgos wind project;
- Approval of industrial security contracts;
- Approval of Nasulo fluid collection and recycling system project;
- Approval of purchase requirements for power plants;
- Approval of strategic contracting with First Balfour;
- Approval of stock options;
- Approval of hedging program;
- Award of master service agreement for heavy equipment;
- Approval of budget;
- Approval of fixed rate Peso bonds;
- Award of air drilling contracts;
- Authroization of OpsCom to implement Nasulo steamfield development plan;
- Approval of schedule of stockholders meeting and related requirements;

26
ENERGY DEVELOPMENT CORPORATION
MANAGEMENT REPORT
Pursuant to SRC Rule 20
For the Annual Stockholders’ Meeting
On May 7, 2013
Audited Financial Statements for Fiscal Year Ended December 31, 2012
Please refer to the accompanying audited financial statements for 2012.
General Nature and Business of the Company
Nature
Energy Development Corporation (the ―Parent Company‖ or ―EDC‖) is a subsidiary of Red Vulcan
Holdings Corporation (Red Vulcan). The Parent Company and its subsidiaries (collectively hereinafter
referred to as the ―Company‖), were separately incorporated and registered with the Philippine Securities
and Exchange Commission (SEC), except for its foreign subsidiaries. Below are the Parent Company‘s
ownership interests in its subsidiaries:
Percentage of Ownership
December 31,
2012 December 31, 2011
Direct Indirect Direct Indirect
EDC Drillco Corporation (EDC Drillco)**** 100.00 – 100.00 –
EDC Geothermal Corp. (EGC) 100.00 – 100.00 – Green Core Geothermal Inc. (GCGI)
– 100.00 – 100.00 Bac-Man Geothermal Inc. (BGI) – 100.00 – 100.00 Unified Leyte Geothermal Energy Inc.
(ULGEI) – 100.00 – 100.00 Southern Negros Geothermal, Inc. (SNGI)
*** – 100.00 – 100.00 EDC Mindanao Geothermal Inc. (EMGI)
*** – 100.00 – 100.00
Bac-Man Energy Development Corporation
(BEDC)*** –
100.00
–
100.00
Kayabon Geothermal, Inc. (KGI)*** – 100.00 – 100.00
Energy Development (EDC) Corporation Chile
Limitada [EDC Chile Limitada] 99.99
0.01 99.99
0.01
EDC Holdings International Limited (EHIL)** 100.00 – 100.00 –
Energy Development Corporation Hong Kong
Limited (EDC HKL) ** – 100.00 – 100.00
EDC Chile Holdings SPA (ECH SPA)* – 100.00 – –
EDC Geotermica Chile (EG Chile)* – 100.00 – –
EDC Peru Holdings S.A.C. (EPH SAC)* – 100.00 – –

27
EDC Geotermica Peru S.A.C. (EG
Peru)*
– 100.00 –
–
EDC Quellaapacheta (EQ)* – 70.00 – –
PT EDC Indonesia (PTEI)* – 95.00 – –
PT EDC Panas Bumi Indonesia (PTEPBI)* – 95.00 – –
EDC Wind Energy Holdings, Inc. (EWEHI) 100.00 – 100.00 – EDC Burgos Wind Power Corporation (EBWPC) – 100.00 33.33 66.67
EDC Pagudpud Wind Power Corporation (EPWPC)
* –
100.00 –
–
First Gen Hydro Power Corporation (FG Hydro) 60.00 – 60.00 – *Incorporated in 2012 and has not yet started commercial operations.
**Incorporated in 2011and serves as an investment holding company.
***Incorporated in 2011 and has not yet started commercial operations
****Incorporated in 2009 and remains non-operating
History of Ownership
Beginning December 13, 2006, the common shares of EDC were listed and traded in the Philippine Stock
Exchange (PSE). Up to November 2007, EDC was controlled by the Philippine National Oil Company
(PNOC), a government-owned and controlled corporation, and the PNOC EDC Retirement Fund.
On November 29, 2007, PNOC and PNOC EDC Retirement Fund sold their combined interests in EDC to
Red Vulcan (a Philippine corporation). Red Vulcan was then a wholly owned subsidiary of First Gen
Corporation (First Gen, a publicly listed Philippine corporation) through Prime Terracota Holdings
Corporation (Prime Terracota, a Philippine corporation). First Gen‘s indirect interest in EDC consists of
6.0 billion common shares and 7.5 billion preferred shares. Control was then established through First
Gen‘s 60% indirect voting interest in EDC. Meanwhile, First Philippine Holdings Corporation (First
Holdings, a publicly listed Philippine corporation) directly owns 66.2% of the common shares of First
Gen. Accordingly, First Holdings became then the ultimate parent of the Company.
On May 12, 2009, First Gen‘s indirect voting interest in Red Vulcan was reduced to 45% with the balance
taken up by Lopez Inc. Retirement Fund (40%) and Quialex Realty Corporation (15%) through the
issuance of preferred shares by Prime Terracota. As a result of this transaction, Prime Terracota replaced
First Holdings as the ultimate parent of EDC effective May 12, 2009.
Nature of Operations
The Parent Company operates 12 geothermal energy projects in five Geothermal Service Contract (GSC)
areas, namely:
1. Bacon-Manito Geothermal Project (BMGP);
2. Mt. Apo Geothermal Project (MAGP);
3. Northern Negros Geothermal Project (NNGP);
4. Southern Negros Geothermal Project (SNGP); and,
5. Tongonan Geothermal Project (TGP).
These GSCs are entered into with the Department of Energy (DOE) pursuant to the provisions of
Presidential Decree 1442 (P.D. 1442). These GSCs were replaced by Geothermal Renewable Energy
Service Contracts (GRESCs) on October 23, 2009 in accordance with the provisions of R.A. 9513 or the
Renewable Energy Act of 2008 (RE Law).
Geothermal steam produced is delivered to the National Power Corporation (NPC) and fed to the Parent
Company‘s and subsidiary‘s power plants to produce electricity. EDC sells steam and electricity to NPC
under the Steam Sales Agreements (SSAs) and Power Purchase Agreements (PPAs), respectively (see

28
Notes 37 and 38). Meanwhile, GCGI and BGI sells electricity to bilateral customers under the Power
Supply Agreements (PSAs).
Also, until October 2012, the Parent Company had drilling activities in Papua New Guinea.
Subsidiaries
EDC Drillco
EDC Drillco is a company incorporated on September 28, 2009 to act as an independent service
contractor, consultant, specialized technical adviser for well construction and drilling, and other related
activities. As of December 31, 2012, EDC Drillco remained non-operating.
EGC
EGC, originally named as First Luzon Geothermal Energy Corporation, is a special-purpose company
incorporated on April 9, 2008 to participate in the bid for another local power plant. The bid was won by
and awarded to another local entity. Thereafter, EGC became an investment holding company of its
wholly owned subsidiaries, namely GCGI, BGI, ULGEI, SNGI, EMGI, BEDC and KGI. EGC also has a
0.01% stake in EDC Chile Limitada.
On March 8, 2011, the Philippine SEC approved the change of its corporate name to EDC Geothermal
Corp.
Further details on EGC‘s wholly owned subsidiaries follow:
GCGI was incorporated on June 22, 2009 with primary activities on power generation, transmission,
distribution, and other energy related businesses. GCGI is currently operating the 192.5 Megawatt
(MW) Palinpinon and 112.5 MW Tongonan 1 geothermal power plants in Negros Oriental and Leyte,
respectively, following its successful acquisition from the Power Sector Assets and Liabilities
Management Corporation (PSALM) in 2009.
BGI was incorporated on April 7, 2010 primarily to carry on the general business of generating,
transmitting, and/or distributing energy. BGI has successfully acquired the 150 MW Bac-Man
Geothermal Power Plants (BMGPP) from PSALM in 2010. BMGPP is currently under rehabilitation
to restore its capacity and reliability.
ULGEI is a company incorporated on June 23, 2010; SNGI and EMGI are companies incorporated on
February 4, 2011; and BEDC and KGI are companies incorporated on September 22 and 28, 2011,
respectively. These are Philippine companies incorporated to carry on the general business of
generating, transmitting, and/or distributing energy derived from any and all forms, types and kinds of
energy sources for lighting and power purposes and whole-selling the electric power to power
corporations, public electric utilities and electric cooperatives. As of December 31, 2012, ULGEI,
SNGI, EMGI, BEDC and KGI remained non-operating.
EHIL and EDC HKL
EHIL was incorporated on August 17, 2011 in British Virgin Islands and will serve as an investment
holding company of EDC‘s international subsidiaries. Under EHIL is EDC HKL, which was incorporated
on November 22, 2011 in Hong Kong. The following entities are the subsidiaries under EDC HKL:
EDC Chile Holdings SPA, which was incorporated on January 13, 2012 in Santiago, Chile, is a
wholly owned subsidiary of EDC HKL and is the holding company of EDC Geotermica Chile, a
wholly owned foreign subsidiary that was also incorporated on January 13, 2012 in Santiago, Chile.
EDC Peru Holdings S.A.C., incorporated on January 19, 2012 in Lima, Peru is a 99.9%-owned
subsidiary of EDC HKL. EDC Peru Holdings S.A.C. holds 99.9% stake in EDC Geotermica Peru
S.A.C., which was also incorporated on January 19, 2012 in Lima, Peru. EHIL owns the remaining
0.1% stake in EDC Peru Holdings S.A.C. and EDC Geotermica Peru S.A.C.

29
On July 17, 2012, EDC Quellaapacheta was incorporated in Lima, Peru as a 70%-owned subsidiary of
EDC Geotermica Peru S.A.C.
On July 9, 2012, PT EDC Indonesia and PT EDC Panas Bumi Indonesia were incorporated in Jakarta
Pusat, Indonesia as 95%-owned subsidiaries of EDC HKL.
As of December 31, 2012, all subsidiaries of EDC HKL remained non-operating.
EWEHI
EWEHI is a holding company incorporated on April 15, 2010. The following entities are the wholly owned
subsidiaries of EWEHI:
EBWPC is a company incorporated on April 13, 2010 to carry on the general business of generating,
transmitting, and/or distributing energy. In September 2012, following EWEHI‘s acquisition of
1,249,500 shares of EBWPC, representing 33.33% ownership interest, from EDC for P=141.4 million,
EBWPC became a wholly owned subsidiary of EWEHI. EBPWC is currently developing the 86 MW
wind energy concession in Burgos, Ilocos Norte.
EPWPC is a company incorporated on February 29, 2012 to carry on the general business of
generating, transmitting, and/or distributing energy. As of December 31, 2012, EPWPC remained
non-operating.
FG Hydro
On October 20 and November 17, 2008, in line with its objective of focusing on renewable energy, the
Parent Company acquired a total of 60% interest in FG Hydro from First Gen. FG Hydro operates the 132
MW Pantabangan and Masiway Hydro-Electric Power Plants (PAHEP/MAHEP) located in Nueva Ecija,
Philippines. FG Hydro buys from and sells electricity to the Wholesale Electricity Spot Market (WESM)
and to various privately-owned distribution utilities (DUs) under the PSAs and Power Supply Contracts
(PSCs).
EDC Chile Limitada
EDC Chile Limitada is a limited liability company incorporated on February 11, 2010 in Santiago, Chile
with the purpose of exploring, evaluating and extracting any mineral or substance to generate geothermal
energy. The Chilean Ministry of Energy awarded to EDC Chile Limitada the geothermal exploration
concessions of Newen on January 10, 2012, and of San Rafael and Batea, both on January 19, 2012.
Operational Highlights
The company generated total revenues of P28,368.6 million in 2012, a 15.6% increase from P24,539.6 million
in 2011. From a consolidated sales volume of 7,033.3 GWh from sale to bilateral contracts and WESM, the
Company‘s revenues for 2012 from electricity business amounted to P26,040.5 million. As compared to 2011,
revenue from sale of electricity increased by P2,607.1 million, or 11.1%, from P23,433.4 million as sales
volume increased by 194.5 GWh, or 2.8%, from 6,838.8 GWh. Revenue from sale of electricity as
contingency and dispatchable reserves increased by P1,221.8 million, to P2,328.0 million from the
P1,106.2 million in 2011.
Electricity Generation
For the current year, electricity revenues from the 7,033.3 GWh sold amounted to P28,368.6 million. It
increased by P3,828.9 million, as compared with the P24,539.6 million revenues in 2011. The increase was
primarily brought about by Tongonan I and Palinpinon power plant‘s WESM sales and re-pricing of GCGI‘s
power supply agreements (PSA), and FG Hydro‘s revenues from sales of electricity.

30
Of the total sales volume, 53.0% or 3,726.8 GWh was generated by Unified Leyte in 2012 as compared to
3,827.9 GWh in 2011. Gross revenues for 2012 from Unified Leyte amounted to P11,065.9 million as
compared to the P11,451.9 million in 2011.
Mindanao I and II generated a total sales volume of 714.4 GWh, lower by 73.6 GWh than its minimum energy
off-take (MEOT) volume of 788 GWh. For 2012, revenues from the Mindanao I and II reached
P1,985.6 million as compared to the P2,169.7 million in 2011.
There was no generation for Northern Negros in 2012 as compared to the 65.6 GWh amounting to
P298.0 million in 2011.
In 2012, electricity revenues from WESM and BCQs recognized for FG Hydro amounted to P2,425.3 million
from the 447.8 GWh sold, higher by P1,123.9 million or 86.4%, as compared to the P1,301.4 million
recognized from the 286.6 GWh sold in 2011 due to higher average tariff and sales volume. Revenue from
sale of electricity as contingency and dispatchable reserves of P2,328.0 million in 2012 is an increase of
P1,221.8 million from the P1,106.2 million revenues in 2011.
Third Party Drilling
In October 2012, the contract with Lihir Gold Limited in Papua, New Guinea was discontinued. Due to this,
Third Party Drilling financial results are presented under net income/loss from discontinued operations.
Health, Safety and Environment
With EDC gearing itself toward global operations, the Medical Services system was remodeled to follow the
Minimum Health Management Standard upon which the medical department anchors all its activities. These
include the now standardized delivery of health care and benefits, and new programs to better cater to the
company‘s Occupational Health needs. The Medical Emergency Response (MER) covering 5 levels was
rolled out to all the project sites and was regularly tested using MER drills. Likewise, the Food Safety
program was also implemented prompting training of food handlers and Food Safety audits of various
concessionaires across all sites. Expedition teams going to Chile, Peru and Indonesia were trained on first-aid
and briefed on health hazards before they were allowed to leave the country with adequate medical supplies.
Preparations for programs for roll-out in 2013 had been undertaken, ensuring continuous improvement of
delivery of occupational health and medical services.
On December 7, 2012, the Safety and Health Association of the Philippines in the Energy Sector (SHAPES),
in coordination with the Department of Energy (DOE) presented Plaque of Achievements to Energy
Development Corporation‘s (EDC) steam fields and power plants for achieving ―No Lost Time‖ for the period
November 1, 2008 to October 31, 2012. The recognition was given to the following projects:
a) Geothermal Production Fields – Steam Field Operation
- Mt. Apo Geothermal Project (MAGP)
b) Geothermal Power Plants – Power Generation Sector
- Upper Mahiao Power Plant (UMPP)
- Mahanagdong Geothermal Power Plant (MGPP)
- Northern Negros Geothermal Power Plant (NNGPP)
- Mt. Apo Geothermal Power Plant (MAGPP)
b) EDC Subsidiaries
- Bacman Geothermal Inc. (BGI)
- Tongonan Geothermal Power Plant (TGPP)
The company‘s hydropower asset in Pantabangan also qualified for an award.

31
This is the second year in a row that EDC received multiple awards in safety performance, after receiving
seven Corporate Excellence Safety Awards in the previous SHAPES Convention.
The recognition is awarded to industries that achieved ―no lost time‖ work for a period of 3 straight years or
an equivalent minimum accumulation of 3 million safe man-hours.
To better improve its safety performance, the company embarked on the following programs across all
operating units:
PROGRAM OBJECTIVES EFFECTS Contractor Safety
Management
Provide safety requirements to EDC
contractors and require safety
training to all contractor workers
Prevent accident in EDC
worksites.
Road Transport Safety Identify weakness in road accidents
in EDC and make recommendations
to address weaknesses and develop
transport safety policy
Prevent road accident in
EDC.
NFPA 70E Training Increase knowledge of employees
involved in high voltage activities
on the hazards of shock and arc-
flash.
Determine proper mitigating
measures to address electrical
hazards.
NFPA 72, 20 & 25
Training
Increase knowledge of employees
on fire protection. Determine proper mitigating
measures to address fire
hazards. Safety Indoctrination
Training
Provide safety training to all
employees. Increase safety awareness
among employees. Confined Space and
Rope Rescue Training
Increase knowledge and skills of
EDC‘s Emergency Response Team Enhance capability to respond
to a wide variety of confined
space and rope rescue
incidents. Fire and Electrical
Safety Audit
Assess the current electrical safety
and fire protection programs of
EDC.
Develop corporate standards
in designing, constructing and
operating/maintaining
hardware and facilities.
Moreover, pollution control related permits for water, air, toxic chemicals, hazardous materials and hazardous
wastes are secured by EDC. In 2012, the Watershed Management Department (WMD) and the Environmental
Management Department (EMD) filed a total of 104 and 148 forestry and environmental permit applications,
respectively.
Corporate Social Responsibility
EDC maintains to develop strong partnerships with community stakeholders through its Corporate Social
Responsibility Program called ―Community Partnerships‖. The Program‘s approach provides integrated
support projects in four major areas – health promotion, educational support, livelihood/entrepreneurial
development and environmental protection / enhancement – to encourage development through self-reliance
in its 47 host communities.
In 2012, about 63,487 individuals and 151 groups have benefitted from EDC‘s community development
activities across the five project sites.

32
1. Health Promotion. To improve the barangay health centers‘ (BHCs) capacity of providing quality medical
care in their communities, EDC constructed 1 rural health building to serve the entire municipality of
Valencia. In 2012, it has been successfully inaugurated and turned over to the local government. EDC also
repaired 13 BHCs, provided functional equipment to 20 BHCs, and distributed medicines and medical
supplies to 45 BHCs. More than 300 barangay health workers from 45 host barangays were supported with
health care paraphernalia to further capacitate them in providing quality health service to the community.
To complement the improved facilities and supplies, EDC also enhanced the skills of more than 147
community health workers through refresher trainings on primary health care, basic life support, diseases
prevention, responsible parenthood and emergency preparedness and response. Support in health services,
such as medical, dental, optical, blood-letting and outreach activities, was also extended to 16,562 individuals
of host communities across the five sites. Likewise, 4,916 school children were beneficiaries of the nutrition-
feeding program implemented in EDC‘s assisted partner schools. To further ensure the health of the
community and improve sanitation practices, EDC has also rehabilitated 6 barangay water systems.
2. Educational Support. The CSR Program focuses on creating equal opportunities of quality education and
gainful employment for the communities‘ youth. Working towards this objective, EDC has constructed 1 pre-
school building in Valencia, repaired 33 schools, and provided 12 schools with functional equipment to
encourage conducive learning environments. EDC also equipped 28 partner elementary schools with
Educational TV packages to improve school performance through innovative learning methods. Trainings on
various teaching skills enhancement were conducted with 373 teacher participants, financial incentives were
provided to 56 teachers, and working paraphernalia were turned over to 265 teachers. EDC subsidized the
miscellaneous fees, financial assistance and school supplies of 22,947 elementary school students, 1,176 top-
performing high school students and 34 college students, thus, giving them an opportunity to stay in school for
another year.
Apart from enhancing the academic capability of the students, physical fitness, values formation,
environmental awareness and entrepreneurship are also strengthened through the annual Energy Camp, which
involved 120 high school students last year.
A special education program, the two Leyte Schools for Excellence (SFE), fully subsidized the elementary
education of 735 elementary students. Through EDC‘s investment in the SFE‘s hardware and software
components, the schools have continued to maintain an increase in enrolment, attendance, retention,
participation and achievement rates. There were also improvements in the National Achievement Test results
and in the awards received by both schools.
Providing equal access to quality education and gainful employment, EDC continues to implement the
College Admission Review and Readiness (CAREERS) Project. In 2012, 16 UPCAT qualifiers have become
University of the Philippines (UP) students. There are currently 27 students in the different UP campuses who
benefit from the Project‘s monthly monitoring, mentoring and financial assistance. Also in 2012, a second
batch of 162 students underwent a 20-day review class to prepare for entrance tests of premium universities,
such as UP. The CAREERS Project also facilitated their UPCAT applications last year.
Creating gainful employment opportunities for trade school students is also a part of the CSR education
program. In its third year, the Kananga-EDC Institute of Technology (KEITECH) has produced 140 trainees
who have all successfully passed the qualification assessment for National Certifications. Aside from
technical skills, the training center takes pride in its values formation program. Tech-voc experts and the
trainees‘ parents have observed significant positive behavioral changes in the trainees.
EDC supports the youth in the communities also through career guidance orientations that were conducted last
year with 2,056 graduating high school students across EDC partner schools. The Special Program for the
Employment of Students (SPES), Kasanayan sa Hanapbuhay (KASH) and on-the-job training programs also
accommodated 333 students.

33
3. Livelihood and Enterprise Development. EDC aims to instill the spirit of enterprise within its 43 upland
communities. To cultivate entrepreneurial skills through income generating projects of host communities,
EDC supervised livelihood modules that are implemented by 111 farmers and community associations across
the five sites. To further enhance the productivity of selected enterprise modules, such as the sweet corn,
banana and sugarcane production, financial management and product marketing systems have been installed.
Apart from establishing systems for livelihood development, EDC has directly awarded P175.2 Million worth
of small/large -scale contracts to local farmers federations.
As reward for the good fiscal management of BGPF‘s FEDBAHC, the Land Bank of the Philippines has
increased the federation‘s credit facility to P10 Million from P5 Million. Likewise, the credit facility of
LGPF‘s PMPC was increased to P3.5 Million for its efficient financial management. On the aspect of
capacity-building, EDC facilitated skills training for 332 farmers, community association members and local
residents for various income-generating projects.
4. Environmental Conservation, Protection, Enhancement and Advocacy. From simply planting trees,
EDC has branched out in to tree biodiversity preservation. EDC‘s BINHI program aims to rehabilitate forest
fragments and ensure preservation of biodiversity with its three modules, which are: Tree for Life, Tree for
Food and Tree for the Future. In 2012, EDC has planted a total of 1,550,341 trees, comprising of 112 species
of timber-producing, fruit-bearing, and premium and endangered trees, respectively for their specific modules.
Through these modules, EDC has planted trees in 1,057.73 hectares of open land in 90 different locations.
EDC has also continued to rescue and preserve 74 Philippine premium and endangered species, and produced
4,023 seedlings of 54 species through vegetative materials production. Through the Program, 5,310
individuals from partner schools and organizations have been oriented on preserving tree species and
biodiversity. The first BINHI Youth Conference was also launched in 2012. It engaged 58 student leaders
from colleges and universities across the country to actively promote and initiate projects within their schools,
and further advocate for the propagation and preservation of Philippine endangered trees.
Business of the Issuer
Principal Products or Services and their markets
The Company operates twelve geothermal steam fields in the five geothermal service contract areas where it
is principally involved in:
i. the production of geothermal steam for sale to National Power Corporation (NPC) pursuant to Steam
Sales Agreements (SSAs) and
ii. the generation and sale of electricity through Company-owned geothermal power plants to NPC and
privately-owned distribution utilities (DUs), pursuant to Power Purchase Agreements (PPAs) and
Electricity Sales Agreements (ESAs), respectively.
Starting September 3, 2010, on account of the extended waiver, the Company ceased billing to NPC after
BGI‘s successful acquisition of the plants from NPC.
Through its 60% equity interest in First Gen Hydro (FG Hydro), the Company indirectly operates the 120
MW Pantabangan and 12 MW Masiway Hydroelectric Power Plants, located in Pantabangan, Nueva Ecija
Province, Central Luzon. The power plants supply electricity into the Luzon grid to service the consumption
of its customers which include the Wholesale Electricity Spot Market (WESM), distribution utilities covered
by bilateral contract quantities (BCQ) and the National Grid Corporation of the Philippines (NGCP) for
ancillary services.
For the Company‘s third business segment, EDC provides drilling services to the Lihir Gold Limited in Papua
New Guinea, which was discontinued in October 2012.

34
The Company has evolved into being the country‘s premier pure renewable energy play, possessing interests
in geothermal energy and hydro power. For geothermal energy, its expertise spans the entire geothermal
value chain, i.e., from geothermal energy exploration and development, reservoir engineering and
management, engineering design and construction, environmental management and energy research and
development. With FG Hydro, the Company has not only acquired expertise in hydropower operation and
maintenance, but also the capability to sell power on a merchant basis.
Distribution methods of products or services
About 63.1% of the 7,033.3 GWh sales volume from its electricity business was sold to NPC. Electricity
production of about 447.8 GWh, i.e., pertaining to electricity generated by the hydro power plants of FG
Hydro, was sold to the WESM and its distribution utility clients comprised of electric cooperatives in the
province of Nueva Ecija while 2,144.2 GWh generated by the geothermal power plants in Tongonan I and
Palinpinon was sold to electric cooperatives and industrial customers in the Visayas region. The Company‘s
total sales volume comprised of 6,585.5 GWh coming from electricity production in Leyte, Mindanao,
Tongonan I and Palinpinon geothermal power plants; and 447.8 GWh sold from hydro power plant operations
in Pantabangan, Nueva Ecija.
The electricity generated by the Company‘s geothermal power plants is transmitted to customers i.e.,
distribution utilities, electric cooperatives or bulk power customers by the National Grid Corporation of the
Philippines (NGCP) through its high voltage backbone system.
FG Hydro generated 447.8 GWh of electricity in 2012, of which 74.6% or 334.0 GWh, was consumed by its
contracted customers and 25.4% or 113.9 GWh was sold to the Wholesale Electricity Spot Market (WESM).
New Products or Services
On May 5, 2010, BGI, the Company‘s wholly-owned subsidiary through EGC, submitted the winning bid of
US$28.25 million for PSALM‘s auction of the 150 MW Bacon-Manito Geothermal Power Plants located in
the towns of Bacon, Sorsogon Province and Manito, Albay Province. The power plants were turned over to
BGI in September 2010, and are currently under rehabilitation to restore capacity and reliability.
Although under rehabilitation, Unit 2 of Bacman generated 104,163 MWh valued at Php520.4 million in
testing and commissioning revenues early this year. This was, however, recorded as a reduction in Property
Plant and Equipment as required by Philippine Accounting Standards (PAS) No. 16.
Competition
With the privatization of more than 70% of NPC-owned power generation facilities and Independent Power
Producer (IPP) contracts, the establishment of the WESM, and the impending implementation of open access
and retail competition targeted for June 2013, the Company now faces competition from other power
generation plants, particularly in terms of acquiring offtakers for its recently acquired plants and future
projects. The Company competes with power generation companies that rely not only on geothermal energy,
but also on coal, gas and oil, substantially all of which is imported. Multinationals that currently operate in
the Philippines include Korea Electric Power Corporation, Marubeni, CalEnergy, Tokyo Electric Power
Company, AES and Sumitomo. Domestic corporations, as in San Miguel Corporation, Ayala Corporation, GN
Power Corporation of the Philippines, Aboitiz Power, compete with EDC for the sale of electricity to different
privately owned distribution utilities.

35
The following table sets out the Department of Energy‘s (DOE) breakdown of total installed capacity and
electricity production by energy source for FY 2011.
Installed Capacity Power Generation
Energy Source MW % GWH % Coal 4,917 30.5 25,577 37.0
Oil Based 2,994 18.5 3,295 4.8
Geothermal 1,783 11.0 9,942 14.4
EDC 1,161 7.2 6,466 9.4
Chevron 622 3.8 3,476 5.0
Hydro 3,491 21.6 9,440 13.7
Natural Gas 2,861 17.7 20,591 29.8
Renewable/Others 117 0.7 205 0.3
Total 16,163 100.0 69,050.0 100.0
The only Philippine company (with operating assets) engaged in the production of steam is Chevron
Geothermal Philippines Holdings, currently supplying geothermal steam to Aboitiz Power Corporation‘s 622
MW Tiwi-Makban geothermal power plants. Construction of the Maibarara Goethermal Power Project
(MGPP) is on-going, with project sponsor Maibarara Geothermal, Inc. (MGI), targeting commercial
operations in late 2013. Shareholding interests in MGI comprises of the following: Petrogreen Energy
Corporation (PGEC) – 65%, Trans-Asia Oil – 25%, and PNOC-Renewables Corporation (RC) – 10%. PGEC
is a wholly-owned subsidiary of publicly-listed Petroenergy Resources Corporation (PERC).
Non-Philippine companies that are actively engaged in geothermal consultancy in the Asia-Pacific region are
West Japan Engineering Consultancy, GeothermEx, Sinclair Knight Merz Engineering Consultancy and PB
Power.
Dependence on one or a few major customers and identity of any such major customers
Close to 46.0% of the Company‘s electricity revenues are derived from existing long-term Power Purchase
Agreements (PPAs) with NPC.
Patents, trademarks, licenses, franchises, concessions, royalty payments
The five geothermal service contract areas where the EDC‘s geothermal production steam fields are located
are:
• Tongonan Geothermal Project (expiring in 2031)
• Southern Negros Geothermal Project (expiring in 2031)
• Bacon-Manito Geothermal Project (expiring in 2031)
• Mt. Apo Geothermal Project (expiring in 2042)
Northern Negros Geothermal Project (expiring in 2044)
These contract areas are located in four islands of the Philippines, namely Luzon, Leyte, Negros and
Mindanao. The following table provides a summary of the Company‘s geothermal projects, grouped by the
contract areas in which they are located:

36
Geothermal Renewable Energy Service
Contract (GRESC) Areas
Contract Area Expiration
of GRESC Project
Installed
Capacity Product
Expiration of
Offtake
Agreement
Minimum
Take-or-pay
Capacity 1
Plant
Owner
(in MWe) (in GWh/year)
Tongonan Geothermal
Project
2031 Tongonan 112.5 Steam and
Electricity
2009 (SSA) 2
2031 (GRSC)
GCGI5
Upper Mahiao 125.0 Steam and Electricity
2022 (PPA) 4 4,288.0 EDC
Malitbog 232.5 Steam and
Electricity
2022 (PPA) 4 EDC
Mahanagdong 180.0 Steam and
Electricity
2022 (PPA) 4 EDC
Optimization 50.9 Steam and Electricity
2022 (PPA) 4 EDC
Northern Negros
Geothermal Project
20443 Northern Negros 49.4 Steam and
Electricity
2012 (ESA) N/A EDC
Southern Negros Geothermal Project
2031 Palinpinon I 112.5 Steam and Electricity
2008 (SSA) 2 2031 (GRSC)
GCGI5
Palinpinon II 80.0 Steam and
Electricity
2018 (SSA)
2031 (GRSC)
GCGI5
Bacon-Manito
Geothermal Project
2031 BacMan I 110.0 Steam 2018 (SSA) 722.7 BGI6
BacMan II 40.0 Steam 2019/2023
(SSA)
262.8 BGI6
Mt.Apo Geothermal
Project
20423
Mindanao I 52.0 Steam and
Electricity
2022 (PPA) 390.0 EDC
Mindanao II 54.0 Steam and Electricity
2024 (PPA) 398.0 EDC
Total 1,198.8 8,065.3
1 Refers to 1-year period, ending in July 2009. Minimum Take-or-pay capacity varies from year to year. 2 The SSAs that govern the sale of steam for use at the NPC-owned Tongonan I and Palinpinon I power plants expired in December 2008 but were
extended to a date when these plants are sold or privatized, pursuant to the privatization process under the EPIRA. 3 Includes a 25-year extension period to GRESC. 4 Unified Leyte PPA 5 On October 23, 2009, the Palinpinon and Tongonan geothermal power plants were turned over to Green Core, which won the PSALM’s auction of the
said plants last September 2, 2009. 6 On September 3, 2010, the Bacman 1 and Bacman II geothermal power plants were turned over to BGI, which won the PSALM’s auction of the said
plants last May 5,2010.
The Company, through its subsidiaries Green Core Geothermal Inc. and Bac-Man Geothermal Inc. secured
three (3) Geothermal Operating Contracts covering power plant operations:
Tongonan Geothermal Power Plant (with a twenty-five (25) year contract period expiring in 2037,
renewable for another twenty-five (25) years)
Palinpinon Geothermal Power Plant (with a twenty-five (25) year contract period expiring in 2037,
renewable for another twenty-five (25) years)
Bacon-Manito Geothermal Power Plant (with a twenty-five (25) year contract period expiring in 2037,
renewable for another twenty-five (25) years)
The Company also holds geothermal resource service contracts for the following prospect areas:
Mt Cabalian Geothermal Project (expiring by 2034)
Mt. Labo Geothermal Project (with a 5 year pre-development period expiring in 2015, 25-year contract
period expiring in 2035)
Mt. Mainit Geothermal Project (with a 5 year pre-development period expiring in 2015, 25-year contract
period expiring in 2035)
Ampiro Geothermal Project (with a five-year pre-development period expiring in 2017, 25-year contract
period expiring in 2037)
Mandalagan Geothermal Project (with a five-year pre-development period expiring in 2017, 25-year
contract period expiring in 2037)
Mt. Zion Geothermal Project (with a five-year pre-development period expiring in 2017, 25-year contract
period expiring in 2037)
Lakewood Geothermal Project (with a five-year pre-development period expiring in 2017, 25-year
contract period expiring in 2037)

37
Balingasag Geothermal Project (with a five-year pre-development period expiring in 2017, 25-year
contract period expiring in 2037)
The Parent Company has WESCs with the DOE for the following contract areas:
1. Burgos Wind Project (WESC assigned by EDC to EDC Burgos Wind Power Corporation)
Under DOE Certificate of Registration No. WESC 2009-09-004 (25-year contract period expiring in
2034)
2. Pagudpud Wind Project,
Under DOE Certificate of Registration No. WESC 2010-02-040 (pre-development stage expiring in
2013, 25-year contract period expiring in 2035)
3. Camiguin Wind Project,
Under DOE Certificate of Registration No. WESC 2010-02-041 (pre-development stage expiring in
2013, 25-year contract period expiring in 2035)
Cost and effects of compliance with environmental laws
The Company‘s geothermal steam field and power generation operations are subject to extensive, evolving
and increasingly stringent safety, health and environmental laws and regulations. These legal requirements
address, among other things, air emissions, wastewater discharges, handling of chemicals, generation and
management of hazardous wastes, workplace conditions and employee exposure to hazardous substances.
The total cost incurred by the Company to comply with environmental laws for the years 2011 and 2012 were
approximately P157.4 million and P174.0 million, respectively.
Employees and Labor Relations
As of December 31, 2012, the Parent Company has 2,244 employees consisting of 28 Executives, 1,346
Managerial, Professional and Technical (MPT) employees, and 870 Rank and File (R&F) employees. In
particular, the distribution of employees by sector is as follows:
Sector Number %
Office of the Chairman/President
Business Development
Technical Services
Power Generation
Steam Field Operations
Environment & External Relations
Engineering & Construction
Finance
HR Management
Information Technology
Supply Chain Management
Strategic Initiatives Office
67
33
311
382
847
108
84
106
88
47
134
37
3.0
1.5
13.9
17.0
37.7
4.8
3.7
4.7
3.9
2.1
6.0
1.6
Total Headcount 2,244 100
The Company has a funded, non-contributory, defined benefit retirement plan. The plan covers regular
employees and is administered by a trustee bank. The Company also provides post-retirement medical and
life insurance benefits which are unfunded.

38
There are 13 labor unions within the Parent Company, each representing a specific collective bargaining unit
allowed by law. They are distributed in the different locations as follows:
Name of Union Location/Project No. of
Members
1. PNOC Energy Group of Employees Association (PEGEA) Head Office 56
2. Tongonan Workers‘ Union (TWU) Tongonan Geothermal Project 74
3. Leyte A Geothermal Project Employees‘ Union (LAGPEU) Tongonan Geothermal Project 272
4. United Power Employees‘ Union (UPEU) Tongonan Geothermal Project 48
5. PNOC EDC-LGPF and TIPF Association of Technical, Supervisory
and Professional Employees (PELT ATSAPE)
Tongonan Geothermal Project 176
6. Demokratikong Samahang Manggagawa ng BGPF (DSM-BGPF) Bacon-Manito Geothermal Project 123
7. EDC-BGPF Supervisory Employees‘ Union (EBSEU) Bacon-Manito Geothermal Project 23
8. Bac-Man Professional and Technical Employees Union (BAPTEU) Bacon-Manito Geothermal Project 54
9. Mt. Apo Workers Union (MAWU) Mt. Apo Geothermal Project 113
10. Mt. Apo Professional and Technical Employees Union (MAPTEU) Mt. Apo Geothermal Project 43
11. PNOC EDC SNGP Rank and File Union Southern Negros Geothermal Project 134
12. PNOC EDC SNGP Supervisory Association (PESSA) Southern Negros Geothermal Project 70
13. PNOC EDC NNGP Employees Rank and File (PENERFU) Northern Negros Geothermal Project 31
1217
These unions enter into regular collective bargaining agreements (CBAs) with the Parent Company as regards
to number of working hours, compensation, employee benefits, and other employee entitlements as provided
under Philippine labor laws; and in 2012, nine (9) CBA negotiations were concluded in an average of one (1)
meeting.
Management believes that the Company‘s current relationship with its employees is generally good. Although
the Company had been involved in arbitrations with its labor unions, it has not experienced in the last twelve
(12) years any strikes, lock-outs or work stoppages as a result of labor disagreements.
As of December 31, 2012, the Company‘s subsidiaries, GCGI, BGI and FGHPC employ the following
number of employees:
Subsidiary Managerial, Professional &
Technical Rank & File Total
GCGI
BGI
FGHPC
116
35
48
81
33
10
197
68
58
PROPERTY
Land
The Company is the registered owner of land located in various parts of the Philippines.
As of October 30, 2009, these lands were valued by Asian Appraisal Company, Inc., an independent
appraiser, at P180.9 million. The Company‘s landholdings include four lots in Fort Bonifacio, Taguig City,
Metro Manila with a total area of 3,479 square meters. As of February 2010, the market value of the land as
appraised by the Taguig Assessor‘s Office was P55.67 million or P16,000 per square meter.
Other parcels of land are used for its various projects, such as sites for power plants for the Leyte Geothermal
Production Field and the Northern Negros Geothermal Project. EDC does not own any parcel of land in the
Mindanao Geothermal Production Field as the area where the Mindanao power plants are located is classified
as public land. Most of the lots that were previously leased by the Company located in Burgos, Ilocos Norte
are now under the process of expropriation in preparation for the construction of the Burgos Wind Project.
About two hundred twenty three hectares was added to the wind farm area as of 2013.

39
The following table sets out certain information regarding the Company‘s landholdings:
Location/Project
Parcels
of Land
Area
(hectares)
Under
Expropriation
Leased
Acquired
w/ title to
EDC
Title for
Consolidation Fort Bonifacio 4 0.3479 None None 1 3
Baguio 1 0.25 None None 1 None
Bacon-Manito
Geothermal Project
104 82.50 None None 13 91
Northern Negros
Geothermal Project
201 250.16 24 106 12 59
Southern Negros
Geothermal Project
99 128.78 4 7 0 88
Leyte Geothermal
Project
444 189.07 13 9 23 399
Burgos Wind Project 2,096 689.00 1,952 144 None None
Total 2,949 1,340.34 1,993 266 50 640
None of the properties owned by the Company is subject to any mortgage, lien, encumbrance, or limitation on
ownership and usage.
For lots whose titles are still in the name of the registered/previous owners, the company outsourced the
services of a third party surveyor and local lawyers in Ormoc City and Dumaguete City to facilitate the
transfer of titles from previous lot owners to EDC.
First Gen Hydro Power Corporation
The Pantabangan Hydroelectric Power Plant (PHEP – 120.80 MW) is located at the foot of the Pantabangan
dam and consists of two generators, each capable of generating full load power of originally 50 MW at 90%
power factor. As part of the just concluded three year (2008- 2011) Plant Refurbishment and Upgrade Project
(PRUP), Units 1 and 2 have been refurbished and upgraded in December 2009 and December 2010,
respectively to 60.40 MW each (first and second phase of PRUP). Each generator is coupled to a vertical
shaft Francis Turbine that converts the kinetic energy of the water from the dam to 81,000 mechanical
horsepower at a design head of 75 meters.
The electric power output of PHEP is delivered to the Luzon Grid through a 13.8kV/230kV Ring Bus
Switchyard, composed formerly of two 64 MVA transformers, switching and protective equipment. The two
transformers were eventually replaced last May 2011 (third phase of PRUP) with a higher rating of 75 MVA
to match the increase in output.
Located some 7 kms. downstream of PHEP is the Masiway Hydroelectric Power Plant (MHEP – 12 MW). It
uses a 16,800 HP Kaplan turbine to convert the energy of the low head but high flow release of water from the
Masiway re-regulating dam to a directly coupled generator that is capable of generating 12 MW of electric
power at 90% power factor. The power output of MHEP is delivered to the Grid through a switchyard mainly
composed of a 15 MVA transformer, switching and protective equipment all owned by FG Hydro.
For both PHEP and MHEP, the power components owned and operated by FG Hydro are the power houses
and generating equipment plus auxiliary systems, warehouse, lay down and areas associated with the
powerhouses. In addition, FG Hydro also owns the steel penstock and main step-up transformers at PHEP. For
MHEP, the intake and trash rack machine as well as the main step-up transformer that include the 69 KV
switchyard equipment are owned by FG Hydro. The transmission facilities including the switchyard at PHEP
are owned by National Grid Corporation of the Philippines (formerly TRANSCO).
The volume of water release from the Pantabangan reservoir is based on the Irrigation Diversion Requirement
(IDR) dictated by the National Irrigation Administration (NIA). NIA operates and maintains the non-power
components which include the watershed, spillway, intake structures of PHEP, and Pantabangan and Masiway
reservoirs.

40
As of December 31, 2012, the consolidated net book value of property, plant and equipment amounted to
P60,680.2 million.
Green Core Geothermal, Inc.
Located in Valencia, Negros Oriental, the Palinpinon geothermal power plant consists of two power stations,
Palinpinon I and II, which are approximately five kilometers apart. Commissioned in 1983, Palinpinon I
comprises three 37.5–MW steam turbines for a total rated capacity of 112.5 MW. Palinpinon II, on the other
hand, consists of three modular power plants: Nasuji, Okoy 5 and Sogongon. The 20-MW Nasuji was
commissioned in 1993, while the 20-MW Okoy 5 went on stream in 1994. Started in 1995, Sogongon consists
of the 20-MW Sogongon 1 and 20-MW Sogongon 2. Situated in Sitio Sambaloran, Barangay Lim-Ao,
Kananga, Leyte province in Eastern Visayas, the Tongonan geothermal power plant consists of three 37.5-
MW units, which went into commercial operations in 1983. Both plants use steam supplied by EDC.
Bac-Man Geothermal, Inc.
Located in Bacon, Sorsogon City and Manito, Albay in the Bicol region, the Bac-Man plant package consists
of two steam plant complexes. The Bac-Man I geothermal facility comprises two 55 MW turbines, which
were both commissioned in 1993. Bac-Man II, on the other hand, consists of two 20 MW units namely,
Cawayan located in Barangay Basud and Botong in Osiao, Sorsogon City. The Cawayan unit was
commissioned in 1994 and the Botong unit in 1998. EDC supplies steam to these plants.
Other Subsidiaries
EWEHI, EBWPC, EDC Drillco, ULGEI, EDC Chile Limitada, SNGI, EMGI, BEDC, KGI, EHIL and EDC
HKL are the other subsidiaries of the Company that have not started with their operations yet.
PTEI, PTEPBI, ECH SPA, EG Chile, EPH SAC, EG Peru, EQ and EPWPC are the other subsidiaries of the
Company that were incorporated within the year 2012 but have not started with their operations yet.
LEGAL PROCEEDINGS
Except as disclosed herein, there are no material pending legal proceedings to which the Company is a party
or to which any of its material properties are subject. If the Company is not successful in one or more of the
proceedings described below, it could be liable for payments and incur damages and costs which could be
substantial and could have a material adverse effect on the Company‘s business, financial condition, results of
operations and liquidity.
Expropriation Proceedings
Several expropriation proceedings filed by the Republic of the Philippines, through the Department of
Energy, and PNOC to acquire lands needed by the Company for its power plants and projects are still
pending before various Philippine courts, in particular, with respect to the land requirements of the Leyte
Geothermal Production Field, the Southern Negros Geothermal Production Field, Northern Negros
Geothermal Project and the Burgos Wind Project. As of December 31, 2012, there were 299 such cases
pending and the aggregate amount claimed by the landowners as just compensation is approximately
P267.1 million. To date, the Republic of the Philippines and the PNOC‘s authority to expropriate land for
the Company‘s use and the Company‘s possession of the land expropriated has not been questioned in the
pending expropriation proceedings. The common issue in these cases is the amount of compensation to be
paid to the owners of expropriated lands.

41
Tax Cases
a) Real Property Taxes
In January 2009, the Company received a Notice of Assessment from the Provincial Assessor of Leyte,
covering the 125 MW Upper Mahiao power plant, 231 MW Malitbog power plant, 18 MW Topping
Cycle—Tongonan plant and 25 MW Bottoming Cycle—Malitbog plant and other supposed Company
properties located at Lim-ao, Tongonan and Aguiting, all in the Province of Leyte. The Company elevated
the matter and questioned the validity and legality of these assessments before the Local Board of
Assessment Appeals in Tacloban City, Leyte (the ―LBAA‖). On May 22, 2009, after receiving an
unfavorable response from the LBAA, the Company filed a civil case entitled Energy Development
Corporation vs. Province of Leyte, et. al which was docketed as Case No. 026 to question the
aforementioned assessment. The case is still pending before the said court. The aggregate amount of the
real property tax liabilities corresponding to the assessment stood at P1 billion. On June 25, 2009,
pursuant to Sangguniang Panlalawigan Resolution No. 09-249 of the Province of Leyte, the Company
settled its liabilities for P235.0 million for the years 2004-2008 and P52.0 million for the year 2009. In
2010, the Treasurer‘s Office of Tacloban City issued a tax clearance to the Company, which settled the
issue on the aforementioned real property tax liabilities. A joint motion for the dismissal of the case has
already been filed.
On May 22, 2009, the Company received another Notice of Assessment from the Provincial Assessor of
Leyte assessing the value of the Company‘s geothermal and production wells at a value of
P5,920.0 million which facilities are located in Tongonan, Malitbog and Lim-ao. On August 7, 2009, the
Company filed the corresponding appeal before the Local Board of Assessment Appeals of the Province
of Leyte in a case entitled Energy Development Corporation vs. Province of Leyte, LBAA Case NO. 029,
for the annulment of the assessments made on the ground that the properties assessed are exempted from
real property tax.
On February 2, 2011, EDC paid under protest the taxes accruing to the SEF on its transmission lines and
other improvements located in Bago City for the taxable year 2010 amounting to P2.7 million. On March
4, 2011, EDC filed with the Treasurer its formal protest. On May 27, 2011, due to the Treasurer‘s
inaction, EDC was constrained to appeal the same before the Local Board of Assessment Appeals – Bago
City. EDC is not liable to pay SEF under the R.A. 9513.
On March 29, 2012, the Company received a Notice of Assessment from the Municipal Assessor of
Manito, Albay assessing the Company‘s properties situated at the Bac-man Geothermal Facility at an
assessed value of P810.0 million. On May 28, 2012, the Company filed an appeal with the Local Board of
Assessment Appeals of the Province of Albay entitled Energy Development Corporation vs. the
Municipality of Manito et al., LBAA Case No. 02-2012, for the annulment of the assessment. As a result
of a manifestation of the Manito Municipal Mayor that the assessment shall be withdrawn, the Company
filed a Manifestation with Motion to dismiss the appeal, conditioned upon the actual withdrawal and
cancellation of the (i) assessment roll, (ii) the notices of assessment and (iii) tax declarations. On
September 19, 2012, the Company received another Notice of Assessment from the Municipal Assessor of
Manito. On October 18, 2012, the Company filed a written Claim for Exemption with the Office of the
Municipal Assessor on the ground that the properties are exempted from real property tax. The Albay
Provincial Assessor and Manito Municipal Assessor have already granted the claim, and has issued
revised tax declarations stating that the properties are exempt from real property tax effective October 1,
2010
On March 14, 2012, the Company received a Notice of Assessment for real properties located in the
Mount Apo Geothermal Production Field with an assessed value of P7.5 million. On May 15, 2012, the
Company filed an appeal with the Local Board of Assessment Appeals entitled Energy Development
Corporation vs. The City of Kidapawan on the ground that the properties are exempt from real property
tax.

42
On April 24, 2012, the Company filed an appeal with the Local Board of Assessment Appeals of Bago
City seeking to refund a portion of the real property tax payments made for the fiscal year 2010
representing the amount in excess of the preferential real property tax rate of 1.5% under Section 15(c) of
Republic Act No. 9513, amounting to P6.0 million.
On July 30, 2012, the Company also filed an appeal with the Local Board of Assessments Appeals of the
Province of Leyte seeking to refund a portion of real property taxes paid for properties located in
Kananga, Leyte for the fiscal year 2010 in the sum of P17.0 million. On August 23, 2012, the Company
also filed an appeal with the Local Board of Assessment Appeals appealing the inaction of the Leyte
Provincial Treasurer on the payment under protest of the amount of P11.0 million for properties located in
Kananga, Leyte for the fiscal year 2012. The excess amounts pertain to the amounts in excess of the 1.5%
preferential real property tax rate imposed by Section 15(c) of R.A. 9513. The Company also filed a
similar appeal with the Local Board of Assessment Appeals of Kidapawan City on March 19, 2012,
seeking to refund an amount of P2.8 million. On June 1, 2012, the Company also filed an appeal to the
Local Board of Assessment Appeals of Ormoc City, appealing the denial of the Ormoc City Treasurer of
the Company‘s protest of excess real property tax payments in the amount of P39.5 million.
b) Franchise Taxes
The Province of Leyte assessed the Company an aggregate of P310.6 million in franchise taxes in respect
of the operations from 2000-2004, 2006 and 2007 of its geothermal power plants in the Province. The
Company seasonably filed the corresponding appeals before the Regional Trial Court of Tacloban City,
Leyte, for the annulment of the assessments. The said cases have been docketed as Consolidated Civil
Cases No. 2006-07-77, 2006-05-49, 2006-05-48 and 2007-08-03, and 2008-05-537 captioned PNOC EDC
vs. province of Leyte, et. al.
In December 2008, the Company received a Consolidated Notice of Assessment and Demand for Payment
from the Province of Leyte, demanding from the Company the payment of franchise tax in the amount of
P443.7 million. This assessment cancelled previous assessments since the new assessment covers the
period starting 1998 until 2006. On April 24, 2009, the Company protested the said assessment and, since
the Province denied the said protest, the matter is currently under appeal before the Regional Trial Court
of Tacloban City, Leyte, docketed as Civil Case No. 2009-04-46, captioned EDC vs. Province of Leyte, et
al.
On July 17 and September 15, 2009, respectively, the Court issued two orders granting the Company‘s
prayer for the issuance of a Preliminary Injunction restraining the Province from levying and collecting
franchise tax from the company. These orders are subject of a Petition for Certiorari with Prayer for
Issuance of Preliminary Injunction and/or Temporary Restraining Order docketed CA G.R. CEB SP
No. 04575 filed by the province seeking to annul the said orders. On August 3, 2012, the Court of Appeals
issued a Resolution denying the Province of Leyte‘s Motion for Reconsideration of the Resolution dated
September 21, 2011 dismissing the Petition for Certiorari.
On August 11, 2010, EDC received a notice of assessment of franchise tax dated July 26, 2010 from OIC
City Treasurer of Sorsogon demanding payment of a franchise tax in the total amount of P3.7 million for
the operations of the Geothermal Plant for the year 2009. EDC timely filed its protest on October 8, 2010.
The treasurer failed to act, hence, EDC filed the appropriate Petition with the Regional Trial Court. On
January 10, 2012, EDC received an adverse decision of the RTC. The case was already on appeal to the
Court of Tax Appeals.
The Company believes that it is not liable for franchise taxes on the basis that it does not possess a
legislative franchise. This view is supported by an opinion of the Office of the Government Corporate
Counsel. In addition, under EPIRA, power generation is not a public utility activity and does not require a
franchise. Furthermore, the Company is not engaged in a business that requires a franchise.

43
c) Input Value Added Tax
On June 5, 2008, April 24, 2009, and December 29, 2009, and March 31, 2011, the Company filed
Petitions for Review with the Court of Tax Appeals with respect to its un-acted claim from the Bureau of
Internal Revenue for Tax Credit on Input Value Added Tax relating to the Company‘s zero-rated sales for
2006, 2007, 2008, and 2009, respectively. The aggregate claim amounts to P663.3 million. These cases
are entitled Energy Development Corporation (Formerly PNOC Energy Development Corporation) vs.
Commissioner of Internal Revenue and have been docketed as CTA Case No. 7792, 7926, 8019, and
8255, respectively. The Company believes that the Company‘s sales are zero-rated pursuant to the
provisions of EPIRA and the provisions of the National Internal Revenue Code, as amended. The CTA
partially decided in favor of EDC for its 2006 claim, granting EDC a refund amounting to P17.0 million.
Civil Cases
On July 28, 2008, a case for prohibitory injunction with prayer for temporary restraining order (TRO) was
filed against the Company by Delia Locsin, et al. The case entitled Delia Ediltrudes Locsin, et al. vs.
EDC, et al. docketed as Civil Case No. 08-13236 before the Regional Trial Court of Bacolod City sought
to declare null and void DENR‘s permit allowing EDC to clear trees within the buffer zone of Mt.
Kanlaon National Park, to perpetually enjoin the carrying out any activity within the said area, and to
perpetually enjoin the Company from conducting directional drilling into the Mt. Kanlaon National Park
protected area.
To date, no TRO has been issued against the EDC as the hearing on the same is temporarily set aside due
to the Company‘s pending motion for inhibition of the presiding judge and as well as the manifestation for
outright denial of the TRO based on R.A. 8975, which prohibits the issuance of TRO‘s and writs of
preliminary injunctions against the implementation of government infrastructure projects. Moreover, the
Company has already completed the works sought to be enjoined. The Company maintains that its
operations in the area are lawful and sanctioned by the DENR.
As of December 31, 2012, there are 17 other civil cases to which EDC is a party. Although the aggregate
monetary claims in these cases amount to approximately P17.0 million, the Company does not believe
that an adverse result in any one case pose a material risk to the Company‘s operations.
Labor Cases
As of December 31, 2012, there were 13 pending labor cases against the Company, most of which deal
with plaintiffs‘ claims of illegal dismissal and backwages. Although the aggregate monetary claims in
these cases amount to approximately P33.8 million, the Company does not believe that any one case poses
a material risk to the Company‘s operations.

44
Management Discussion and Analysis of Results of Operations and Financial Condition
Energy Development Corporation (EDC) operates 12 geothermal projects in the five geothermal service
contract areas where it is principally involved in the production of steam for delivery to Company-owned
power plants which convert steam to electricity for sale by EDC to NPC, privately-owned distribution utilities
(DUs) and large industrial customers, pursuant to Power Purchase Agreements (PPAs) and Power Supply
Agreements (PSAs). Separately, it also has drilling activities in Papua New Guinea.
On May 5, 2010, Bac-Man Geothermal Inc. (BGI), a wholly-owned subsidiary of the Company, participated
and won the auction for the 150 MW Bac-Man Geothermal Power Plants by remitting P1,279.7 million to
PSALM.
Starting September 3, 2010, on account of the extended waiver, the Company ceased billing to NPC after
BGI‘s successful acquisition of the plants from NPC.
EDC provided drilling services to the Lihir Gold Limited in Papua, New Guinea based on the contract signed
in March 2007, which was pre-terminated in October 2012.
The following discussion focuses on the results of operations of EDC and its subsidiaries, FG Hydro, GCGI
and BGI.
FACTORS AFFECTING THE COMPANY’S RESULTS OF OPERATIONS
Set out below are some of the more significant factors that have affected and continue to affect the Company‘s
results of operations.
The Company’s Relationship with NPC
Contractual framework.
As per the Company‘s SSAs and PPAs, NPC is obligated to pay for a minimum quantity of steam and
electricity pursuant to its take-or-pay and minimum energy offtake (MEOT) obligations. As of December
31, 2012, the remaining lives of these contracts are up to 6 and 11 years for the SSAs and PPAs,
respectively. The remaining active SSAs of the Company with the NPC are those pertaining to the Bac-
Man I and II Geothermal Power Plants.
Starting September 3, 2010, on account of the extended waiver, the Company ceased billing to NPC after
BGI‘s successful acquisition of the plants from NPC pending the commercial operation of the Bac-Man
plants. Upon resumption of billing, PSALM/NPC, EDC and BGI have also agreed to allow EDC bill BGI
directly, on behalf of PSALM/NPC, for the Bacman steam supply.
Exchange Rate Fluctuations
The Company‘s accounting records and financial statements are prepared in Pesos, even as its payments for
debt service and major materials and services are denominated substantially in US Dollars. Foreign exchange
rate fluctuations affect the cost of borrowings, as well as the Peso value of such in the Company‘s balance
sheet.
In 2012 and 2011, the Company recorded a foreign exchange gain of P1,053.5 million and foreign exchange
loss of P111.1 million, respectively.
Also, the unit prices for majority of the SSAs and PPAs are indexed to the US Dollars vis-a-vis the Philippine
Peso.

45
FINANCIAL RESULTS FOR THE YEARS ENDED DECEMBER 31, 2012, 2011 AND 2010
Financial results for the years ended December 31, 2012, 2011 and 2010
CONSOLIDATED (AUDITED)
(Amounts in Million Pesos) 2012 2011 2010 Income Statement Data (Restated)
Revenues 28,368.6 24,539.6 24,152.9
Income before income tax 11,014.9 580.4 4,923.8
Foreign exchange gains (losses) - net 1,053.5 (111.0) (15.8)
Net income 10,375.7 614.8 4,395.1
Net Income (Loss) attributable to Equity Holders of the Parent
Company 8,659.4 (167.2) 4,115.8
As at December 31
(Amounts in Million Pesos) 2012 2011 2010
Balance Sheet Data
(Restated)
ASSETS
Total current assets 19,699.5 20,676.3 14,854.8
Property, plant and equipment 60,680.2 57,676.9 56,603.1
Intangbile assets 4,818.4 4,705.2 4,543.0
Deferred tax assets - net 1,092.1 1,420.7 893.7
Exploration and evaluation assets 1,604.1 1,087.1 1,170.4
Other non-current assets 6,408.9 4,451.6 3,238.6
Total Assets 94,303.2 90,017.8 81,303.6
LIABILITIES AND EQUITY
Total current liabilities 10,249.6 9,320.0 7,486.8
Long-term debts - net of current portion 46,656.0 49,240.1 39,678.7
Royalty fee payable - net of current portion - - 300.6
Derivative liabilities 153.5 - -
Net retirement and other post employment benefits 659.9 1,054.2 1,307.1
Provision and other long-term liabilities 1,150.4 756.9 291.4
Total Liabilities 58,869.4 60,371.2 49,064.6
Equity attributable to equity holders of the Parent Company 33,361.3 27,429.1 30,669.9
Non-controlling interest 2,072.5 2,217.5 1,569.1
Total Equity 35,433.8 29,646.6 32,239.0
Total Liabilities and Equity 94,303.2 90,017.8 81,303.6

46
FINANCIAL HIGHLIGHTS
December 2012 vs. December 2011 Results
1) Net income increased by 1,587.7% or P9,760.9 million to P10,375.7 million in 2012 from
P614.8 million in 2011.
The favorable variance was primarily attributed to the following:
GCGI‘s higher revenues by P2,377.3 million due from Tongonan I and Palinpinon power plants as per
agreed contracts that became effective in mid-2011 and the additional power supply agreements that
were signed in December 2011;
FG Hydro‘s P2,345.7 million higher revenues from total sale of electricity; and
P1,164.6 million foreign exchange gains turnaround from the foreign exchange losses in 2011 brought
about by appreciation of Philippine Peso against US dollar;
Impairment loss on property, plant and equipment of Northern Negros Geothermal Project of
P4,998.6 million that was recognized in June 2011;
These were partially offset by the implementation of Early Retirement and Manpower Reduction
Programs (ERP/MRP) of P605.2 million.
The net income in 2012 represented 36.6% of total revenue as compared to 2.5% in 2011.
2) The recurring net income generated in 2012 increased by 88.7% or P4,650.1 million to P9,895.2 million
from P5,245.1 million in 2011.
The favorable variance was primarily due to the following:
GCGI‘s higher revenues by P2,377.3 million due from Tongonan I and Palinpinon power plants as per
agreed contracts that became effective in mid-2011 and the additional power supply agreements that
were signed in December 2011;
FG Hydro‘s P2,345.7 million higher revenues from total sale of electricity; and
Major Transactions for CY 2012
Increase in FG Hydro‘s sale of electricity (P2,345.7 million)
Increase in revenue of GCGI mainly from new BCQs and re-pricing of PSAs (P2,377.3 million)
Implementation of Early Retirement and Manpower Reduction Programs (ERP/MRP)
(P605.2 million)
Testing & commissioning revenues from Bacman power plant (P520.4 million)

47
RESULTS OF OPERATIONS
CONSOLIDATED INCOME STATEMENT
December 2012 vs. December 2011 Results
Favorable (Unfavorable) Variance
(Amounts in PHP millions) Dec. 2012
Dec. 2011
(Restated) Amount % 2012 2011
REVENUES
Sale of electricity 28,368.6 24,539.6 3,829.0 15.6% 100.0% 100.0%
COST OF SALES OF ELECTRICITY AND STEAM (10,125.2) (10,569.9) 444.7 -4.2% -35.7% -43.1%
GENERAL AND ADMINISTRATIVE EXPENSES (4,781.2) (4,660.3) (120.9) 2.6% -16.9% -19.0%
FINANCIAL INCOME (EXPENSE)
Interest income 364.5 390.2 (25.7) -6.6% 1.3% 1.6%
Interest expense (3,703.6) (4,106.5) 402.9 -9.8% -13.1% -16.7%
(3,339.1) (3,716.3) 377.2 -10.1% -11.8% -15.1%
OTHER INCOME (CHARGES)
Loss on impairment of property, plant and equipment - (4,998.6) 4,998.6 -100.0% 0.0% -20.4%
Foreign exchange gains (losses), net 1,053.5 (111.1) 1,164.6 -1048.2% 3.7% -0.5%
Derivatives gains (losses), net - 108.3 (108.3) -100.0% 0.0% 0.4%
Miscellaneous, net (161.7) (11.3) (150.4) 1331.0% -0.6% 0.0%
891.8 (5,012.7) 5,904.5 -117.8% 3.1% -20.5%
INCOME BEFORE INCOME TAX 11,014.9 580.4 10,434.5 1797.8% 38.8% 2.4%
BENEFIT FROM (PROVISION FOR) INCOME TAX
Current (433.8) (421.6) (12.2) 2.9% -1.5% -1.7%
Deferred (302.9) 537.2 (840.1) -156.4% -1.1% 2.2%
(736.7) 115.6 (852.3) -737.3% -2.6% 0.5%
10,278.2 696.0 9,582.2 1376.8% 36.2% 2.8%
97.5 (81.2) 178.7 -220.1% 0.3% -0.3%
NET INCOME 10,375.7 614.8 9,760.9 1587.7% 36.6% 2.5%
Net income (loss) attributable to:
Equity holders of the Parent Company 8,659.4 (167.2) 8,826.6 -5279.1% 30.5% -0.7%
Non-controlling interest 1,716.3 782.0 934.3 119.5% 6.0% 3.2%
EBITDA 17,330.3 13,237.5 4,092.8 30.9% 61.1% 53.9%
RECURRING NET INCOME 9,895.2 5,245.1 4,650.1 88.7% 34.9% 21.4%
Recurring net income attributable to:
Equity holders of the Parent Company 8,178.8 4,451.0 3,727.8 83.8% 28.8% 18.1%
Non-controlling interest 1,716.4 794.2 922.2 116.1% 6.1% 3.2%
HORIZONTAL ANALYSIS VERTICAL ANALYSIS
NET INCOME FROM CONTINUING OPERATIONS
NET INCOME (LOSS) FROM DISCONTINUED
OPERATIONS
Revenues
Total revenues pertaining to Sale of Electricity for the year ended December 31, 2012 increased by 15.6% or
P3,829.0 million to P28,368.6 million from P24,539.6 million in 2011. The increase in revenue was primarily
due to the following:
P2,377.3 million GCGI‘s higher revenues from Tongonan I and Palinpinon power plants as per
agreed contracts that became effective in mid-2011 and the additional power supply agreements that
were signed in December 2011; and
P2,345.7 million FG Hydro‘s higher revenues from total sale of electricity.
These were offset by the P868.2 million decrease in electricity sales by the Parent Company.

48
Cost of Sales of Electricity and Steam
Cost of sales of electricity and steam decreased by 4.2% or P444.7 million to P10,125.2 million in 2012 from
P10,569.9 million in 2011 mainly due to decrease in repairs and maintenance by P438.1 million and the
decrease in purchased services and utilities by P264.6 million. These were offset by the P295.6 million
recognized separation costs due to the implementation of Early Retirement and Manpower Reduction
Programs (ERP/MRP).
General and Administrative Expenses
General and administrative expenses increased by 2.6% or P120.9 million to P4,781.2 million in 2012 from
P4,660.3 million in 2011. The increase was mainly due to the P309.6 million recognized separation costs for
the implementation of Early Retirement and Manpower Reduction Programs (ERP/MRP, partly offset by the
decrease in provision for doubtful accounts and other expenses.
Financial Income (Expenses)
Net financial expenses decreased by 10.1% or P377.2 million to P3,339.1 million in 2012 from
P3,716.3 million in 2011 mainly due to lower interest charges.
Interest Income
Interest income decreased by 6.6% or P25.7 million to P364.5 million in 2012 from P390.2 million in
2011 mainly on account of lower interest income on placement of funds due to the decrease in
monthly average investible funds from the full drawdown of Peso Public bond and IFC loan in
September 2011 (2012 = P9.5 billion vs. 2011 = P13.0 billion) coupled with the decrease in weighted
average interest rates on peso placements (2012 = 3.96% vs. 2011 = 4.36%).
This was offset by the increase in interest on placements of FG Hydro by P16.8 million and of GCGI
by P11.6 million.
Interest Expense
Interest expense decreased by 9.8% or P402.9 million to P3,703.6 million in 2012 from
P4,106.5 million in 2011 mainly due to the:
P213.6 million capitalization of borrowing cost for Bacman rehabilitation at consolidated
level under PAS 16/23;
P54.3 million net decrease on the Parent company‘s long term debts;
Lower interest expense of P33.5 million on asset retirement obligation initially recognized in
March 2011 based on net present value in compliance with Philippine Accounting Standard
(PAS) No. 37 due to the drop in inflation index;
Absence in 2012 of the P31.8 million full recognition in 2011 of guarantee fee on OECF 21th
Yen loan preterminated/fully settled in 2011; and
P20.4 million lower amortization of Day-1 gain on royalty fee payable due DOE on account
of the decreasing balance of liability because of the amortizing payment of principal, which
was fully amortized in December 2012.
Other Income (Charges)
Other income of P891.8 million in 2012 is a 117.8% improvement from the other charges of P5,012.7 million
in 2011, primarily due to the absence of any provision for asset impairment in 2012.
49
Impairment loss on property, plant and equipment of NNGP
Impairment loss on property, plant and equipment of NNGP amounting to P4,998.6 million was
recognized in June 2011 based on the result of the technical assessment of the Northern Negros steam
resource.
Foreign Exchange Gains (Losses) - net
The P1,053.5 million foreign exchange gains as of December 31, 2012 is a P1,164.6 million
turnaround from the foreign exchange losses of P111.1 million in the same period in 2011. The
favorable variance was brought about by appreciation of the peso against the US dollar.
Derivatives Gains, Net
Derivative gains, net of P108.3 million in 2011 pertain to the gains from foreign currency forwards
last year that are not designated as accounting hedges.
Miscellaneous, Net
Miscellaneous charges increased by 1,331.0% or P150.4 million to P161.7 million in 2012 from
P11.3 million in 2011 caused by the following:
Recognition of the P114.7 million loss on extinguishment of P3,108.0 million fixed rate corporate
notes in April 2012 against the P197.9 million loss on the early extinguishment of US$175
million term-loan facility in June 2011 (P83.2 million);
Recovery of allowance for impairment of NNGP power plant recognized in 2012 (P63.6 million).
Prior year's reversal of long-outstanding payables, while none in 2012 (P189.6 million);
This year's loss on extinguishment from FG Hydro's loan (P73.5 million); and
Net increase in loss on disposal of assets (P34.5 million).
Provision for Income Tax
Deferred tax expense of P302.9 million in December 2012, or a 156.4% turnaround from the
P537.2 million deferred tax income in December 2011 was primarily contributed by the following:
Absence in 2012 of the deferred tax asset on provision for full impairment of NNGP's property, plant
and equipment recognized in June 2011 (P499.9 million);
Parent Company‘s deferred taxable income versus deferred taxable loss mainly attributed to higher
unrealized foreign exchange gains on the realignment of foreign loans (P251.2 million); and
GCGI‘s deferred tax expense on the 2011 NOLCO which was claimed as deduction from this year's
taxable income of P126.9 million, in contrast to last year's deferred tax benefit on NOLCO of
P55.8 million.
Net Income (Loss) from Discontinued Operations
This results from the discontinued drilling services contract with Lihir Gold Limited effective October 2012.
Net income from discontinued operations of P97.5 million in December 2012, or a 220.1% turnaround from
the P81.2 million net loss from discontinued operations in December 2011 is mainly due to the following:
Net Revenue from Demobilization of Rig 11 in 2012 amounting to P66.8 million;
Lower foreign contractor‘s tax (FCT) of P61.0 million; and
Decrease of P54.5 million in parts and supplies issued.

50
Net Income
The Company‘s net income increased by 1,587.7% or P9,760.9 million to P10,375.7 million in 2012 from
P614.8 million in 2011.
Net income is equivalent to 36.6% of total revenues in 2012 as compared to the 2.5% in 2011

51
December 2011 vs. December 2010 Results
Revenues
Total revenues for the year ended December 31, 2011 increased by 1.6% or P386.7 million to
P24,539.6 million from P24,152.9 million in 2010.
Sale of Electricity
Revenues from sale of electricity increased by 7.0% or P1,595.4 million to P24,539.6 million in 2011
from P22,944.2 million in 2010. The increase in revenue was primarily due to the following:
P1,631.1 million GCGI‘s higher revenues from Tongonan I and Palinpinon power plants
mainly due to WESM sales and the re-pricing of GCGI‘s PSAs; and
P1,106.2 million fresh contribution from FG Hydro‘s sale of electricity as contingency and
dispatchable reserves.
Favorable (Unfavorable) Variance
(Amounts in PHP millions) Dec. 2011 Dec. 2010 Amount % 2011 2010
REVENUES
Sale of electricity 24,539.6 22,944.2 1,595.4 7.0% 100.0% 95.0%
Sale of steam - 1,208.7 (1,208.7) -100.0% 0.0% 5.0%
24,539.6 24,152.9 386.7 1.6% 100.0% 100.0%
COST OF SALES OF ELECTRICITY AND STEAM (10,569.9) (9,465.8) (1,104.1) 11.7% -43.1% -39.2%
GENERAL AND ADMINISTRATIVE EXPENSES (4,660.4) (4,691.0) 30.6 -0.7% -19.0% -19.4%
FINANCIAL INCOME (EXPENSE)
Interest income 390.2 347.7 42.5 12.2% 1.6% 1.4%
Interest expense (4,106.5) (3,708.5) (398.0) 10.7% -16.7% -15.4%
(3,716.3) (3,360.8) (355.5) 10.6% -15.1% -14.0%
OTHER INCOME (CHARGES)
Loss on impairment of property, plant and equipment (4,998.6) (3,390.0) (1,608.6) 47.5% -20.4% -14.0%
Foreign exchange gains (losses), net (111.0) (15.8) (95.2) 602.5% -0.5% -0.1%
Derivatives gains (losses), net 108.3 437.0 (328.7) -75.2% 0.4% 1.8%
Miscellaneous, net (11.3) 1,257.3 (1,268.6) -100.9% 0.0% 5.2%
(5,012.6) (1,711.5) (3,301.1) 192.9% -20.5% -7.1%
INCOME BEFORE INCOME TAX 580.4 4,923.8 (4,343.4) -88.2% 2.4% 20.4%
BENEFIT FROM (PROVISION FOR) INCOME TAX
Current (421.6) (404.7) (16.9) 4.2% -1.7% -1.7%
Deferred 0.0%
Others 537.2 (298.0) 835.2 -280.3% 2.2% -1.2%
115.6 (702.7) 818.3 -116.5% 0.5% -2.9%
696.0 4,221.1 (3,525.1) -83.5% 2.5% 18.2%
(81.2) 174.0 (255.2) -146.7% -0.3% 0.7%
NET INCOME 614.8 4,395.1 (3,780.3) -86.0% 2.5% 18.2%
Net income (loss) attributable to:
Equity holders of the Parent Company (167.2) 4,115.8 (4,283.0) -104.1% -0.7% 17.0%
Non-controlling interest 782.0 279.3 502.7 180.0% 3.2% 1.2%
EBITDA 13,237.5 13,747.9 (510.4) -3.7% 53.9% 56.9%
RECURRING NET INCOME 5,245.1 7,237.8 (1,992.7) -27.5% 21.4% 30.0%
Recurring net income attributable to:
Equity holders of the Parent Company 4,451.0 6,637.6 (2,186.6) -32.9% 18.1% 27.5%
Non-controlling interest 794.2 600.2 194.0 32.3% 3.2% 2.5%
HORIZONTAL ANALYSIS VERTICAL ANALYSIS
NET INCOME FROM CONTINUING OPERATIONS
NET INCOME (LOSS) FROM DISCONTINUED
OPERATIONS

52
These increases were partially offset by the following:
P854.7 million decline in FGHPC‘s regular sales due to significantly lower dispatch and
electricity spot prices; and
P329.6 million decrease mainly due to lower average electricity price of Unified Leyte and
Mindanao.
Sale of Steam
No revenue from sale of steam was reported in 2011 as compared to the P1,208.7 million in 2010
following the acquisition of the Bacman power plants.
Cost of Sales of Electricity and Steam
Cost of sales of electricity and steam increased by 11.7% or P1,104.1 million to P10,569.9 million in 2011
from P9,465.8 million in 2010 mainly accounted to higher expenses on maintenance of steam field facilities of
P1,141.3 million mainly on account of work-over drilling activities in Leyte and Bacman.
Financial Income (Expenses)
Net financial expenses increased by 10.6% or P355.5 million to P3,716.3 million in 2011 from
P3,360.8 million in 2010 due to the increase in outstanding borrowings.
Interest Income
Interest income increased by 12.2% or P42.5 million to P390.2 million in 2011 from P347.7 million in
2010 mainly due to placement of funds - net of final tax brought about by higher monthly average
fund level because of new loan drawdown and higher weighted average interest rates on peso
placements.
Interest Expense
Interest expense increased by 10.7% or P398.0 million to P4,106.5 million in 2011 from
P3,708.5 million in 2010. The unfavorable variance was mainly due to the following:
Interest charges of the US$300 million bond and US$175 million syndicated term loan
facility issued/acquired in January 2011 and June 2010, respectively (P380.4 million); and
Interest expense on asset retirement obligation recognized in March 2011 in compliance with
Philippine Accounting Standard (PAS) No. 37 (P61.1 million).
These were partially offset by lower accretion of Day-1 gain on royalty fee payable due DOE on
account of the decreasing balance of liability due to the principal amortization (P24.8 million).
Other Income (Charges)
Other charges–net increased by 192.9% or P3,301.1 million to P5,012.6 million in 2011 from
P1,711.5 million in 2010. The unfavorable variance was primarily contributed by the absence in 2011 of the
recovery of impairment provision on input value added tax claims recognized in 2010 and higher provision of
allowance for impairment of NNGP‘s assets.

53
Impairment loss on property, plant and equipment of NNGP
Impairment loss on property, plant and equipment of NNGP increased by 47.5% or P1,608.6 million
to P4,998.6 million in 2011 from P3,390.0 million in 2010 due to full provision of allowance for
impairment of NNGP‘s remaining book value.
Foreign Exchange Gains (Losses) - net
Net foreign exchange losses increased by P95.2 million, or 602.5%, to P111.0 million from
P15.8 million in 2010. The losses in 2011 were mainly contributed by the decline in value of US
dollar investments/placements partially offset by gains on payment/realignment of foreign
denominated long-term loans transacted during the year.
Derivatives Gain (Loss) - Net
Derivatives gain, net decreased by 75.2%, or P328.7 million, to P108.3 million in 2011 from the
P437.0 million balance in 2010. The 2011 gain pertained to various swap transactions for US dollar
and Japanese yen currencies entered into with various banks in 2011 while the 2010 gain consisted of
realized gain on forward currency contracts with various banks for Japanese Yen used for the full
settlement of Miyazawa II Yen loan in June 2010 and IBRD 3764/JBIC 15th Yen loans in May 2010.
Miscellaneous - Net
The Company recognized miscellaneous charges – net of P11.3 million in 2011 compared to
miscellaneous income – net of P1,257.3 million in 2010 mainly due to the absence in 2011 of the
P1,638.9 million recovery of impairment loss on Input VAT claims recognized in 2010. This was
offset by the P370.0 million decrease in loss on disposal of property, plant and equipment.
Provision for Income Tax
Deferred tax income of P537.2 million in 2011 was a reversal of P298.0 million deferred tax expense in 2010.
The favorable variance was primarily contributed by the following:
One-time write-off in 2010 of deferred tax asset on amortized foreign exchange losses on long-term
foreign loans previously covered under PD 1442 (P340.1 million);
One-time reversal in 2010 of allowance for impairment loss on Input VAT claims and its
corresponding deferred tax asset due to the receipt of Tax Credit Certificates from the BIR
(P189.4 million)
Higher recognition of deferred tax asset on the provision for the impairment of NNGP assets
(P160.9 million)
Lower reversal of deferred tax assets on prior years' unrealized foreign exchange losses which became
realized during the settlement of long-term foreign loans (P151.5 million)
Net Income (Loss) from Discontinued Operations
Net loss from discontinued operations of P81.2 million in December 2011, or a 146.7% turnaround from the
P174.0 million net income from discontinued operations in December 2010 is due to the following:
Higher cost of drilling services caused by expense of P148.0 million foreign contractor‘s tax (FCT)
versus 2010 treatment of FCT as tax credit; and
Higher fees on professional and technical services by P133.9 million including the engagement of
Therma Prime‘s services starting March 2011.

54
Net Income
The Company‘s net income decreased by 86.0% or P3,780.3 million to P614.8 million in 2011 from
P4,395.1 million in 2010.
Net income is equivalent to 2.5% of total revenues in 2011 as compared to the 18.2% in 2010

55
BALANCE SHEET
Horizontal and Vertical Analysis of Material Changes as of December 31, 2012 and 2011
(Amounts In PHP millions) Dec. 2012 Dec. 2011
(Restated)
Amount % 2012 2011
ASSETS
Current Assets
Cash and cash equivalents 11,420.1 12,493.4 (1,073.3) -8.6% 12.1% 13.9%
Trade and other receivables 4,115.8 3,411.3 704.5 20.7% 4.4% 3.8%
Available-for-sale (AFS) investments 132.3 673.9 (541.6) -80.4% 0.1% 0.7%
Parts and supplies inventories 3,338.8 3,355.8 (17.0) -0.5% 3.5% 3.7%
Derivative assets 0.2 - 0.2 100.0% 0.0% 0.0%
Other current assets 692.3 741.9 (49.6) -6.7% 0.7% 0.8%
Total Current Assets 19,699.5 20,676.3 (976.8) -4.7% 20.9% 23.0%
Noncurrent Assets
Property, plant and equipment 60,680.2 57,676.9 3,003.3 5.2% 64.3% 64.1%
Intangible assets 4,818.4 4,705.2 113.2 2.4% 5.1% 5.2%
Deferred tax assets - net 1,092.1 1,420.7 (328.6) -23.1% 1.2% 1.6%
Exploration and evaluation assets 1,604.1 1,087.1 517.0 47.6% 1.7% 1.2%
Available-for-sale (AFS) investments 707.1 20.4 686.7 3366.2% 0.7% 0.0%
Other noncurrent assets 5,701.8 4,431.2 1,270.6 28.7% 6.0% 4.9%
Total Noncurrent Assets 74,603.7 69,341.5 5,262.2 7.6% 79.0% 77.0%
TOTAL ASSETS 94,303.2 90,017.8 4,285.4 4.8% 99.9% 100.0%
LIABILITIES AND EQUITY
LIABILITIES
Current Liabilities
Trade and other payables 7,694.9 6,704.1 990.8 14.8% 8.2% 7.4%
Income tax payable 5.2 18.7 (13.5) -72.2% 0.0% 0.0%
Due to related parties 49.6 60.1 (10.5) -17.5% 0.1% 0.1%
Current portion of:
Long-term debts 2,393.9 2,249.5 144.4 6.4% 2.5% 2.5%
Derivative liabilities 85.4 - 85.4 100.0% 0.1% 0.0%
Royalty fee payable 20.6 287.6 (267.0) -92.8% 0.0% 0.3%
Total Current Liabilities 10,249.6 9,320.0 929.6 10.0% 10.9% 10.4%
Noncurrent Liabilities
Long-term debts - net of current portion 46,656.0 49,240.1 (2,584.1) -5.2% 49.5% 54.7%
Derivative liabilities - net of current portion 153.5 - 153.5 100.0% 0.2% 0.0%
Net retirement and other post-employment benefits 659.9 1,054.2 (394.3) -37.4% 0.7% 1.2%
Provisions and other long-term liabilities 1,150.4 756.9 393.5 52.0% 1.2% 0.8%
Total Noncurrent Liabilities 48,619.8 51,051.2 (2,431.4) -4.8% 51.6% 56.7%
EQUITY
Equity Attributable to Equity Holders of the Parent
Preferred stock 93.8 93.8 - 0.0% 0.1% 0.1%
Common stock 18,750.0 18,750.0 - 0.0% 19.9% 20.8%
Common shares in employee trust account (358.4) (372.3) 13.9 -3.7% -0.4% -0.4%
Additional paid-in capital 6,277.8 6,266.9 10.9 0.2% 6.7% 7.0%
Equity reserve (3,706.4) (3,706.4) - 0.0% -4.0% -4.0%
Net accumulated unrealized gain on AFS investments 111.5 91.8 19.7 21.5% 0.1% 0.1%
Retained earnings 12,331.6 6,304.7 6,026.9 95.6% 13.1% 7.0%
Cumulative translation adjustment (138.6) 0.6 (139.2) -23200.0% -0.1% 0.0%
33,361.3 27,429.1 5,932.2 21.6% 35.3% 30.5%
Non-controlling interest 2,072.5 2,217.5 (145.0) -6.5% 2.2% 2.5%
Total Equity 35,433.8 29,646.6 5,787.2 19.5% 37.5% 32.9%
TOTAL LIABILITIES AND EQUITY 94,303.2 90,017.8 4,285.4 4.8% 100.0% 100.0%
HORIZONTAL
ANALYSIS
VERTICAL
ANALYSIS
Increase (Decrease)

56
The Company‘s total resources as of December 31, 2012, amounted to P94,303.2 million, 4.8% or
P4,285.4 million higher than the December 31, 2011 year-end level of P90,017.8 million. EDC‘s debt ratio
moved to 58:42 from 63:37 as of December 31, 2012 and December 31, 2011, respectively. This year‘s
current ratio of 1.92:1 was significantly lower than previous year‘s 2.22:1.
Cash and cash equivalents
This account consists mainly of cash on hand and in banks. Cash equivalents include money market
placements with maturities of less than three months.
Cash and cash equivalents decreased by 8.6% or P1,073.3 million to P11,420.1 million as of
December 31, 2012 from the P12,493.4 million December 31, 2011 balance. The decrease was primarily
accounted for by the following:
P8,361.3 million acquisitions of property, plant and equipment and other noncurrent assets;
P4,495.0 million payment of cash dividend; and
P4,108.4 million interest and other financing charges paid
P1,353.0 million net debt servicing
The above decreases were mainly offset by the P17,292.9 million cash generated from operations.
Trade and other receivables
This account, consisting of receivables from NPC, contractors and employees, increased by 20.7% or
P704.5 million to P4,115.8 million as of December 31, 2012 from the P3,411.3 million balance as of
December 31, 2011. The movement was mainly due to increase in trade receivables by P656.8 million
resulting from higher revenues.
AFS investments- current
This account decreased by 80.4% or P541.6 million to P132.3 million as of December 31, 2012, from the
P673.9 million balance as of December 31, 2011 mainly due to the reclassification to other non-current assets
of ROP bonds maturing beyond 2013.
Derivative assets
Derivative assets balance of P0.2 million as of December 31, 2012 pertain to the fair value of the outstanding
foreign currency forward.
Other current assets
The 6.7% or P49.6 million decrease to P692.3 million as of December 31, 2012 from the P741.9 million as of
December 31, 2011 was mainly due to the reclassification of tax credit certificates to non-current assets.
Property, plant and equipment
The 5.2% or P3,003.3 million increase to P60,680.2 million as of December 31, 2012 from the
P57,676.9 million balance as of December 31, 2011 was primarily due to the additions partially offset by the
depreciation for the year.
Deferred tax assets - net
Deferred tax assets decreased by 23.1% or P328.6 million to P1,092.1 million as of December 31, 2012 from
the P1,420.7 million as of December 31, 2011. The decrease was caused by the P226.3 million decrease in
Parent Company‘s DTA mainly due to this year‘s recognition of deferred liability on unrealized forex gains

57
on translation of long-term foreign loans. This was supplemented by GCGI‘s P121.9 million movement
mainly due to reduction of DTA on its outstanding NOLCO.
Exploration and evaluation assets
The 47.6% or P517.0 million increase to P1,604.1 million as of December 31, 2012 from the P1,087.1 million
balance as of December 31, 2011 was primarily due to the expenditures of Bacman Rangas/Kayabon and
Mindanao III areas.
Other noncurrent assets
The 28.7% or P1,270.6 million increase to P5,701.8 million as of December 31, 2012 from the
P4,431.1 million as of December 31, 2011 was mainly due to the P1,038.3 million increase in input VAT and
the P202.0 million reclassified tax credit certificates from other current assets.
Trade and other payables
This account increased by 14.8% or P990.8 million to P7,694.9 million as of December 31,2012 from the
P6,704.1 million as of December 31, 2011 primarily due to the P1,041.7 million increase in accounts payable
from third parties.
Income tax payable
The 72.2% or P13.5 million decrease to P5.2 million as of December 31, 2012 from the P18.7 million
December 31, 2011 balance was primarily due to payment effected through creditable withholding taxes.
Due to related parties
The 17.5% or P10.5 million decrease to P49.6 million as of December 31, 2012 from the P60.1 million
balance as of December 31, 2011 was mainly due to the settlement of liabilities to First Gen Corporation.
Current portion of long-term debts
This account increased by 6.4% or P144.4 million to P2,393.9 million as of December 31, 2012 from
P2,249.5 million balance as of December 31, 2011 mainly due to the P1,411.2 million, P243.5 million and
P64.8 million reclassified noncurrent portion of US$175 syndicated loan, IFC 2 loan and FXCN loan tranche
1 & 2, respectively. These were offset by the P1,534.9 million prepayment of the FCRN loans series 1, 2 & 3
and the P20.3 million settlement of outstanding balance of OECF 8th yen loan.
Current portion of derivative liabilities
The P85.4 million balance as of December 31, 2012 pertain to the fair value of the current portion of the
cross-currency swaps designated as accounting hedges.
Current portion of royalty fee payable
The 92.8% or P267.0 million decrease to P20.6 million as of December 31, 2012 from the P287.6 million
balance as of December 31, 2011 was mainly due to the full payment of deferred royalty fee.

58
Long-term debts – net of current portion
This account decreased by 5.2% or P2,584.1 million to P46,656.0 million as of December 31, 2012 from
P49,240.1 million balance as of December 31, 2011 primarily due to the following:
P7,420.6 million prepayment of the FCRN loans series 1, 2 & 3;
P1,719.5 million reclassified to current portion of the US$175M syndicated loan, IFC 2 loan and
FXCN loan tranche 1 and 2; and
P341.9 million reclassified to current portion of IFC 1 loan.
These were offset by the proceeds of the FXCN Loan tranche 1 and 2 of P2,985.0 million and
P3,980.0 million, respectively.
Derivative liabilities – net of current portion
The P153.5 million balance as of December 31, 2012 pertain to the outstanding non-current portion of the
cross-currency swaps designated as accounting hedges.
Net retirement and other post-employment benefits
This account pertains to the Company‘s obligation to its defined retirement plan, maintained for all Parent
Company, GCGI, BGI and FG Hydro‘s permanent employees. The 37.4% or P394.3 million decrease to
P659.9 million as of December 31, 2012 from the P1,054.2 million as of December 31, 2011 was mainly due
to the Parent Company‘s contribution to the fund.
Provisions and other long-term liabilities
This account increased by 52.0% or P393.5 million to P1,150.4 million as of December 31, 2012 from the
P756.9 million balance as of December 31, 2011 mainly due to the liability recognized on expropriation of
land.
Net accumulated unrealized gain on AFS investments
The 21.5% or P19.7 million increase to P111.5 million as of December 31, 2012 from P91.8 million at end of
December 2011 is mainly due to the higher fair value of the AFS investments for the year.
Retained earnings
Retained earnings increased by 95.6% or P6,026.9 million to P12,331.6 million as of December 31, 2012 from
P6,304.7 million as of December 31, 2011 mainly due to the net income for the year of P8,659.4 million offset
by the P2,632.5 million total cash dividend paid during the year.
Non-controlling interest
This account decreased by 6.5% or P145.0 million, to P2,072.5 million as of December 31, 2012 from
P2,217.5 million balance as of December 31, 2011 due to this year‘s total cash dividends of P1,862.5 million
offset by the P1,716.3 million minority share in net income.

59
Horizontal and Vertical Analysis of Material Changes as of December 31, 2011 and 2010
(Amounts In PHP millions) Dec. 2010 Amount % 2011 2010
ASSETS
Current Assets
Cash and cash equivalents 12,493.4 6,157.9 6,335.5 102.9% 13.9% 7.6%
Trade and other receivables 3,411.3 4,602.1 (1,190.8) -25.9% 3.8% 5.7%
Available-for-sale (AFS) investments 673.9 707.5 (33.6) -4.7% 0.7% 0.9%
Parts and supplies inventories 3,355.8 2,653.5 702.3 26.5% 3.7% 3.3%
Other current assets 741.9 733.8 8.1 1.1% 0.8% 0.9%
Total Current Assets 20,676.3 14,854.8 5,821.5 39.2% 23.0% 18.3%
Noncurrent Assets
Property, plant and equipment 57,676.9 56,603.1 1,073.8 1.9% 64.1% 69.6%
Intangible assets 4,705.2 4,543.0 162.2 100.0% 5.2% 5.6%
Deferred tax assets - net 1,420.7 893.7 527.0 59.0% 1.6% 1.1%
Exploration and evaluation assets 1,087.1 1,170.4 (83.3) -7.1% 1.2% 1.4%
Available-for-sale (AFS) investments 20.4 18.2 2.2 12.1% 0.0% 0.0%
Other noncurrent assets 4,431.2 3,220.4 1,210.8 37.6% 4.9% 4.0%
Total Noncurrent Assets 69,341.5 66,448.8 2,892.7 4.4% 77.0% 81.7%
TOTAL ASSETS 90,017.8 81,303.6 8,714.2 10.7% 100.0% 100.0%
LIABILITIES AND EQUITY
LIABILITIES
Current Liabilities
Loan payable - 175.0 (175.0) -100.0% 0.0% 0.2%
Trade and other payables 6,704.1 5,186.6 1,517.5 29.3% 7.4% 6.4%
Income tax payable 18.7 71.2 (52.5) -73.7% 0.0% 0.1%
Due to related parties 60.1 272.6 (212.5) -78.0% 0.1% 0.3%
Current portion of:
Long-term debts 2,249.5 1,527.2 722.3 47.3% 2.5% 1.9%
Royalty fee payable 287.6 254.2 33.4 13.1% 0.3% 0.3%
Total Current Liabilities 9,320.0 7,486.8 1,833.2 24.5% 10.3% 9.2%
Noncurrent Liabilities
Long-term debts - net of current portion 49,240.1 39,678.7 9,561.4 24.1% 54.7% 48.8%
Royalty fee payable - net of current portion - 300.6 (300.6) 100.0% 0.0% 0.4%
Net retirement and other post-employment benefits 1,054.2 1,307.1 (252.9) -19.3% 1.2% 1.6%
Provisions and other long-term liabilities 756.9 291.4 465.5 159.7% 0.8% 0.5%
Total Noncurrent Liabilities 51,051.2 41,577.8 9,473.4 22.8% 56.7% 51.2%
EQUITY
Equity Attributable to Equity Holders of the Parent
Preferred stock 93.8 93.8 - 0.0% 0.1% 0.1%
Common stock 18,750.0 18,750.0 - 0.0% 20.8% 23.1%
Common shares in employee trust account (372.3) (379.2) 6.9 -1.8% -0.4% -0.5%
Additional paid-in capital 6,266.9 6,266.1 0.8 0.0% 7.0% 7.7%
Equity reserve (3,706.4) (3,706.4) - 0.0% -4.0% -4.6%
Net accumulated unrealized gain on AFS investments 91.8 119.7 (27.9) -23.3% 0.1% 0.1%
Retained earnings 6,304.7 9,524.6 (3,219.9) -33.8% 7.0% 11.7%
Cumulative translation adjustment 0.6 1.3 (0.7) -53.8% 0.0% 0.0%
27,429.1 30,669.9 (3,240.8) -10.6% 30.5% 37.6%
Non-controlling interest 2,217.5 1,569.1 648.4 41.3% 2.5% 1.9%
Total Equity 29,646.6 32,239.0 (2,592.4) -8.0% 33.0% 39.5%
TOTAL LIABILITIES AND EQUITY 90,017.8 81,303.6 8,714.2 10.7% 100.0% 100.0%
HORIZONTAL
ANALYSIS
VERTICAL
ANALYSIS
Dec. 2011
(Restated)
Increase (Decrease)

60
The Company‘s total resources as of December 31, 2011, amounted to P90,017.8 million, 10.7% or
P8,714.2 million higher than the December 31, 2010 year-end level of P81,303.6 million. EDC‘s debt ratio
moved to 63:37 from 56:44 as of December 31, 2011 and December 31, 2010, respectively. This year‘s
current ratio of 2.22:1 was significantly higher than previous year‘s 1.98:1.
Cash and cash equivalents
This account consists mainly of cash on hand and in banks. Cash equivalents include money market
placements with maturities of less than three months.
Cash and cash equivalents increased by 102.9% or P6,335.5 million to P12,493.4 million as of
December 31, 2011 from the P6,157.9 million December 31, 2010 balance. The increase was primarily
accounted for by the following:
P13,350.0 million proceeds from US$300 million loan;
P9,783.9 million internal cash generation; and
P3,262.5 million proceeds from IFC 2 loan.
The above increases were mainly offset by the:
P10,718.5 million acquisition of property, plant and equipment and other noncurrent assets;
P4,758.3 million prepayment of 2010 OECF 9th, 18th, 19th and 21st loan;
P3,341.3 million payment of cash dividend; and
P1,698.6 million regular servicing of long-term debt.
Trade and other receivables
This account, consisting of receivables from NPC, contractors and employees, decreased by 25.9% or
P1,190.8 million to P3,411.3 million as of December 31, 2011 from the P4,602.1 million balance as of
December 31, 2010. The reduction was mainly due to the P1,034.9 million collection of the Parent Company
for the November 2010 regular billings and August 2010 inflation adjustments for Unified Leyte in January
2011.
Parts and supplies inventories
This account increased by 26.5% or P702.3 million to P3,355.8 million as of December 31, 2011, from the
P2,653.5 million balance as of December 31, 2010 mainly due to the procurement of drilling tubular products
and equipment spares.
Deferred tax assets
Deferred tax assets increased by 59.0% or P527.0 million to P1,420.7 million as of December 31, 2011 from
the P893.7 million as of December 31, 2010 mainly due to the full impairment provision of NNGP‘s asset
amounting to P4,998.6 million.
Exploration and evaluation assets
The 7.1% or P83.3 million decrease to P1,087.1 million as of December 31, 2011 from the P1,170.4 million
balance as of December 31, 2010 was primarily due to the reclassification of wind exploration costs to
intangibles offset by the expenses for Bacman‘s Rangas/Kayabon and Mindanao exploration projects.
AFS investments- noncurrent
The 12.1% or P2.2 million increase to P20.4 million as of December 31, 2011 from the P18.2 million balance
as of December 31, 2010 mainly pertains to realignment.

61
Other noncurrent assets
The 37.6% or P1,210.8 million increase to P4,431.2 million as of December 31, 2011 from the
P3,220.4 million as of December 31, 2010 was mainly due to the increase in input VAT.
Loan payable
This account decreased by 100.0% or P175.0 million due to full settlement.
Trade and other payables
This account increased by 29.3% or P1,517.5 million to P6,704.1 million as of December 31,2011 from the
P5,186.6 million as of December 31, 2010 primarily due to the increase of P1,252.9 million in accounts
payables and P157.8 million in accrued interest.
Income tax payable
The 73.7% or P52.5 million decrease to P18.7 million as of December 31, 2011 from the P71.2 million
December 31, 2010 balance was primarily due to lower taxable income in 2011.
Due to related parties
The 78.0% or P212.5 million decrease to P60.1 million as of December 31, 2011 from the P272.6 million
balance as of December 31, 2010 was mainly due to the settlement of liabilities to First Gen Corporation.
Current portion of long-term debts
This account increased by 47.3% or P722.3 million to P2,249.5 million as of December 31, 2011 from
P1,527.2 million balance as of December 31, 2010 primarily due to the reclassification of the current portion
of maturing P692.8 million on Fixed Coupon Rate Notes (FCRN) and P341.9 million on IFC debt obligation
in 2012 offset by P395.0 million prepayment of current portion of OECF 9th, 19th and 21st Yen loan.
Current portion of royalty fee payable
The 13.1% or P33.4 million increase to P287.6 million as of December 31, 2011 from the P254.2 million
balance as of December 31, 2010 was due to the P311.6 million reclassification from non-current portion of
outstanding royalty fees payable to DOE on 2012, P194.5 million royalty fee incurred during the year and
P20.4 million accretion on Day 1 gain recognized in 2011. These were offset by P493.0 million total royalty
fee payment for the year.
Long-term debts - net of current portion
Long-term debts, consisting of US$, PHP and JPY loans, increased by 24.1% or P9,561.4 million to
P49,240.1 million as of December 31, 2011, from P39,678.7 million as of December 31, 2010 due mainly to
the proceeds of P13,350.0 million from US$300.0 million notes and P3,262.5 million IFC 2 loan. These were
offset by the prepayment of the P4,232.1 million of OECF 21st Yen loan and P132.3 million of OECF 9th,
18th and 19th Yen, and reclassification to current portion of the P2,066.5 million for OECF 8th Yen, FCRN
and IFC 1 loans.
Royalty fee payable - net of current portion
This account decreased by 100% or P300.6 million as of December 31, 2011 mainly due to the reclassified
current portion of outstanding royalty fees to DOE.

62
Net retirement and other post-employment benefits
This account pertains to the Company‘s obligation to its defined retirement plan, maintained for all Parent
Company, GCGI and FG Hydro‘s permanent employees. The 19.3% or P252.9 million decrease to
P1,054.2 million as of December 31, 2011 from the P1,307.1 million as of December 31, 2010 was mainly
due to the Parent Company‘s contribution to the fund.
Provisions and other long-term liabilities
This account increased by 159.7% or P465.5 million to P756.9 million as of December 31, 2011 from the
P291.4 million balance as of December 31, 2010 mainly due to the P406.8 million provision for rehabilitation
and restoration costs recognized in 2011 that is related to the Company‘s obligation to dismantle any
installation in a contract area and restore such sites to their original condition upon termination of the
cooperation period.
Net accumulated unrealized gain on AFS investments
The 23.3% or P27.9 million decrease to P91.8 million as of December 31, 2011 from P119.7 million at end of
December 2010 was mainly due to the lower gain in market value of the bond investments.
Retained earnings
Retained earnings decreased by 33.8% or P3,219.9 million to P6,304.7 million as of December 31, 2011 from
P9,524.6 million as of December 31, 2010 mainly due to P3,007.5 million total cash dividend fully paid on
April 20, 2011 to stockholders as of March 29, 2011 record date and the net loss for the year of
P167.2 million.
Non-controlling interest
This account increased by 41.3% or P648.4 million, to P2,217.5 million as of December 31, 2011 from
P1,569.1 million balance as of December 31, 2010 due to this year‘s P781.9 million minority share in net
income and the P200.3 million reallocation from retained earnings to non-controlling interest pertaining to the
net income for the period prior to January 1, 2011 following the SEC approval of the amendment of the FG
Hydro articles of incorporation. These were offset by the P333.8 million payment of cash dividend in 2011.

63
CASH FLOWS
2012 vs. 2011
Net cash flows from operating activities increased by 29.0% or P2,837.5 million to P12,621.4 million in 2012
from P9,783.9 million in 2011 mainly due to the increase in revenues.
Net cash flows used in investing activities decreased by 22.5% or P2,370.8 million to P8,149.3 million in
December 31, 2012 as compared to the P10,520.1 million in 2011 primarily due to P2,567.3 million decrease
in capital expenditure.
The turnaround of P5,541.3 million net cash flows used in financing activities in December 31, 2012 as
compared to the P7,046.6 million net cash flows from financing activities in 2011 was mainly due to the
P9,677.7 million lower proceeds from long-term debts for the year. This was supplemented by the
P2,179.5 million higher payments of long-term debts and P1,153.7 million increase in cash dividends paid.
2011 vs. 2010
Net cash flows from operating activities decreased by 11.1% or P1,220.2 million to P9,783.9 million in 2011
from P11,004.1 million in 2010 mainly due to the decline in operating income of P1,348.6 million mainly
attributed to P1,425.6 million increase in cost of sales of electricity and steam.
Net cash flows used in investing activities increased by 40.5% or P3,030.1 million to P10,520.1 million in
December 31, 2011 as compared to the P7,490.0 million in 2010 primarily due to P3,377.0 million increase in
capital expenditure and P917.5 million increase in other noncurrent assets particularly on input VAT. The
increase was offset by the P1,279.7 million payment for acquisition of the Bacon-Manito Geothermal Power
Plants in 2010.
The turnaround of P7,046.6 million on net cash flows from financing activities in December 31, 2011 as
compared to the P8,545.5 million net cash flows used in financing activities in 2010 was mainly due to the
P13,147.4 million lower payment of long-term debts for the year. This was supplemented by the higher loan
proceeds of P3,553.8 million during the year attributable to the US$300,00 million notes issued in January
2011 and P3,262.5 millions loans issued in September 2011.

64
Selected Financial Data
Financial Statements
(Amounts in PHP millions) 2012 2011 2010
a) Cash and Cash Equivalents
Cash on hand and in bank (Peso) 2,257.3 608.4 266.1
Cash in bank (US$) 150.2 82.7 159.8
Cash in bank (CHP) 1.5 1.7 -
Marketable securities (Peso) 7,585.0 7,435.8 5,585.6
Marketable securities (US$) 1,426.1 4,364.8 146.4
Total 11,420.1 12,493.4 6,157.9
b) Accounts Receivables – Others
Non-trade accounts receivable 68.1 99.4 73.1
Loans and notes receivable 60.0 59.3 61.3
Advances to employees 62.8 37.9 30.4
Employee receivables 7.1 8.9 18.7
Claims receivable .2 0.2 0.1
Total 198.2 205.7 183.6
c) General and Administrative Expenses
Personnel costs 1,716.1 1,490.6 1,773.4
Purchased services and utilities 1,077.3 1,063.7 1,084.8
Rental, insurance and taxes 802.5 651.5 773.5
Business and related expenses 469.2 370.8 550.0
Depreciation and amortization 364.3 244.0 207.2
Provision for doubtful accounts 235.1 409.2 77.5
Parts and supplies issued 154.1 195.7 165.3
Repairs and maintenance 46.8 66.4 76.7
Provision (reduction) in allowance for
impairment of parts and supplies (83.5) 169.0 (15.0) Reversal of provision for doubtful accounts (0.9) (0.6) (2.4) Loss on direct write-off of receivables 0.2 - -
Total 4,781.2 4,660.3 4,691.0
d) Other Income, Interest Expense and Others
Interest income 364.6 390.2 347.7
Interest expense (3,703.6) (4,106.5) (3,708.5)
Loss on impairment of property, plant and
equipment – (4,998.6) (3,390.0)
Foreign exchange gains (losses) – net 1,053.5 (111.1) (15.8)
Derivatives gain (loss) – net – 108.3 437.0
Miscellaneous – net (161.7) (11.3) 1,257.3
Total (2,447.2) (8,729.0) (5,072.3)

65
DISCUSSION ON THE SUBSIDIARY COMPANIES
Green Core Geothermal Inc.
December 2012 vs. December 2011 Results
GCGI‘s revenues increased by 25.9% or P 2,176.5 million, to P10,563.8 million as of December 31, 2012
from P8,387.3 million for the same period in 2011 due to higher revenues from the sale of electricity as per
agreed contracts that became effective in mid-2011 and the additional power supply agreements that were
signed in December 2011.
Cost of sale of electricity decreased by 14.0% or P1,114.3 million, to P6,820.2 million in 2012 from
P7,934.5 million in 2011 due to lower cost of steam by an average cost of P0.65/kWh – net of the increase in
volume by 218.0 GWh (P747.1 million). The decrease is also due to lower repairs & maintenance of
P235.1 million and purchased services & utilities of P219.5 million offset by higher rental, insurance & taxes
of P77.8 million.
General and administrative expenses increased by 29.4% or P105.7 million, to P465.5 million in 2012 from
P359.8 million in 2011 due mainly to higher purchased services & utilities of P64.0 million and provision for
doubtful accounts of P28.6 million.
This year‘s other income - net consisted of foreign exchange gains (P50.7 million), miscellaneous income
(P21.3 million) and interest income (P18.0 million) while last year‘s other charges pertained mainly to
interest expense, none in 2012.
Provision for income tax - current and deferred of P319.7 million in 2012 was a reversal of P39.6 million
benefit from income tax - deferred in 2011.
Total current assets increased by 140.3% or P2,035.4 million, to P3,486.3 million in 2012 from P1,450.9
million in 2011 largely due to higher cash & cash equivalents of P1,795.0 million and trade & other
receivables of P276.3 million reduced by lower other current assets of P41.6 million.
Total noncurrent assets decreased by 1.9% or P190.7 million, to P9,793.4 million in 2012 from
P9,984.1 million in 2011 due to lower property, plant & equipment of P153.2 million and deferred tax asset of
P121.9 million offset by higher other noncurrent assets of P84.4 million.
(Amounts in PHP millions)
As of and for the years ended
December 31 2012 2011
Revenues 10,563.8 8,387.3 Cost of sale of electricity (6,820.2) (7,934.5) General and administrative expenses (465.5) (359.8) Other income (charges) - net 90.0 (485.0) Income (loss) before income tax 3,368.1 (392.0) Benefit from (provision for) income tax (319.7) 39.6 Net income (loss) 3,048.4 (352.4)
Total Current Assets 3,486.3 1,450.9 Total Non-Current Assets 9,793.4 9,984.1 Total Liabilities 1,419.3 2,623.0 Total Equity 11,860.4 8,812.0

66
Total liabilities decreased by 45.9% or P1,203.7 million, to P1,419.3 million in 2012 from P2,623.0 million in
2011 due to lower trade & other payables of P1,303.4 million.
Total equity increased by 34.6% or P3,048.4 million, to P11,860.4 million in 2012 from P8,812.0 million in
2011 due to the net income for the year.

67
Bac-Man Geothermal Inc.
(Amounts in PHP millions)
As of and for the periods ended
December 2012 December 2011
as Restated Revenues – 25.9 Expenses (445.0) (87.8) Other income 1.5 0.2 Operating loss (443.5) (61.7) Benefit from income tax 0.4 8.9 Net loss (443.1) (52.8)
Total Current Assets 722.7 252.2 Total Non-Current Assets 4,123.8 3,361.2 Total Current Liabilities 2,153.7 487.3 Total Non-Current Liabilities 9.7 – Total Equity 2,683.1 3,126.1
*BGI was incorporated in the Philippines on April 7, 2010.
As of December 31, 2012, BGI has yet to start commercial operations.
The increase in expenses pertains primarily to net purchases of electricity for the year amounting to
P=227.3 million, composed of P=3,242.1 million revenues and P=3,469.4 million replacement power costs;
increase in rental and insurance costs of P=59.3 million; and increase in purchased services and utilities of
P=23.5 million. Since BGI has yet to start commercial operations as of December 31, 2012, sales and purchases
of electricity are netted off in the financial statements.
The increase in current assets by 186.5% or P=470.5 million is due mainly to the increase in trade and other
receivables amounting to P=284.2 million resulting from the sale of electricity, as well as the increase in cash
and cash equivalents of P=177.8 million from collections from customers.
Non-current assets increased by 22.7% or P=762.6 million resulting mainly from the capitalized costs for the
rehabilitation of the power plants amounting to P=568.1 million. This amount is net of the P=520.4 million
income from testing and commissioning of the power plants as required by PAS16. The increase in input VAT
by P=149.2 million as a result of the increase in expenses also contributed to the overall increase in non-current
assets.
The increase in current liabilities of 342.0% or P=1,666.4 million is mainly due to the cost of rehabilitation.

68
FG Hydro
December 2012 vs December2011 Results
(Amounts in PHP millions)
As of and for the years ended
December 31 2012 2011
Operating revenues 4,753.3 2,407.5 Operating expenses* 927.2 746.0 Other expenses 434.6 453.2 Income before tax 3,391.5 1,208.3 Provision for (benefit from) income tax (12.2) 0.7 Net income 3,403.7 1,207.6
Total current assets 1,985.1 2,335.0 Total noncurrent assets 6,862.1 7,235.5 Total current liabilities 625.4 552.6 Total noncurrent liabilities 3,930.4 4,215.1 Total equity 4,291.4 4,802.8
*Includes Cost of Sales and General and Administrative Expenses
FG Hydro generated record high revenues of P4,753.3 million for the year ended December 31, 2012, 97.4%
higher than the revenues of P2,407.5 million for the same period in 2011. The favorable variance was mainly
on account of revenues earned from sale of electricity, as contingency and dispatchable reserves to National
Grid Corporation of the Philippines (―NGCP‖), amounting to P2,327.6 million, the temporary assumption of
BGI‘s Power Supply Agreements (PSAs) with Batangas Electric Cooperative II (―BATELEC II‖) 48MW and
Linde Philippines 6MW amounting to P377.1 million, and higher sales to WESM coupled with higher spot
prices. Revenues from contingency and dispatchable reserves in 2011 was only for a five-month billing period
while the PSA with BGI only commenced on December 26, 2011.
The unfavorable variance in operating expenses is mainly on account of higher operations and maintenance
expenses, depreciation and taxes and licenses in 2012. The unfavorable variances, however, were partly offset
by lower interest expense due to the continuous payout of the scheduled loan repayments and higher interest
income from short-term deposits of P53.3 million in 2012 versus P36.5 million in 2011. Overall, FG Hydro
posted a record net income of P3,403.7 million for the period ended December 31, 2012, P2,196.1 million
higher than the P1,207.6 million reported income for the same period in 2011.
Total assets as of December 31, 2012 stood at P8,847.2 million, P723.3 million or 7.5% lower than the 2011
level of P9,570.5 million. The unfavorable variance was mainly due to lower balances of cash, accounts
receivable trade, property, plant and equipment and water rights in 2012.
As of December 31, 2012, total liabilities stood at P4,556.0 million, P211.7 million or 4.4% lower than the
2011 level of P4,767.7 million. The decrease in liabilities was mainly due to the continuous pay-out of the
scheduled semi-annual loan repayments.
Total equity as of December 31, 2012 of P4,291.2 million is P511.6 million or 10.6% lower compared to the
December 31, 2011 level of P4,802.8 million.

69
Top Eight (8) Key Performance Indicators
Ratio
Dec – 12
Dec – 11
Current Ratio 1.92:1 2.22:1 Debt-to-Equity Ratio 1.38:1 1.74:1 Net Debt-to-Equity Ratio 1.06:1 1.32:1 Return on Assets (%) 11.3 0.7
6.0* Return on Equity (%) 31.9 2.0
16.5* Solvency Ratio 0.24 0.15 Interest Rate Coverage Ratio 3.67 2.32 Asset-to-Equity Ratio 2.66 3.04
*excludes provision for impairment of NNGP assets of P4,998.6 million in June 2011
Current Ratio – Total current assets divided by total current liabilities.
This ratio is a rough indication of a company‘s ability to pay its short-term obligations.
Generally, a current ratio above 1.00 is indicative of a company‘s greater capability to settle
its current obligations.
Debt-to-Equity Ratio – Total interest-bearing debts divided by stockholders‘ equity.
This ratio expresses the relationship between capital contributed by the creditors and the
owners. The higher the ratio, the greater the risk being assumed by the creditors. A lower
ratio generally indicates greater long-term financial safety.
Net-Debt-to-Equity Ratio – Total interest-bearing debts less cash & cash equivalents
divided by stockholders‘ equity.
This ratio measures the company‘s financial leverage and stability. A negative net debt-to-equity
ratio means that the total of cash and cash equivalents exceeds interest-bearing
liabilities.
Return on Assets – Net income (annual basis) divided by total assets (average).
This ratio indicates how profitable a company is relative to its total assets. This also gives an
idea as to how efficient management is at using its assets to generate earnings.
Return on Equity – Net income (annual basis) divided by total stockholders‘ equity (average).
This ratio reveals how much profit a company earned in comparison to the total amount of
shareholder equity found on the balance sheet. A business that has a high return on equity is
more likely to be one that is capable of internally generating cash. For the most part, the
company‘s return on equity is compared with an industry average. The company is
considered superior if its return on equity is greater than the industry average.
Solvency Ratio – Net income excluding depreciation and non-cash provisions divided by total debt
obligations.
This ratio gauges a company‘s ability to meet its long-term obligations.
Interest Rate Coverage Ratio – Earnings before interest and taxes of one period divided by interest expense
of the same period.
This ratio determines how easily a company can pay interest on outstanding debt.
Asset-to-Equity Ratio – Total assets divided by total stockholders‘ equity.
This ratio shows a company‘s leverage, the amount of debt used to finance the firm.
70
Foreign Exchange Rate Volatility
Any volatility in the peso-dollar exchange rate impacts on EDC, both in terms of revenues and its operating
and capital expenditures. As the peso depreciates, revenues increase as the bulk of the company‘s sales
agreements have included the peso-dollar rate in their inflator indices; and the cost of imported materials,
services and equipment increases. Conversely, as the peso appreciates, costs decrease and revenues also
decrease.
At the same time, 39.3% of EDC‘s total long-term debt as of December 31, 2012 are foreign currency-
denominated, all denominated in USD. Any USD movement therefore affects the debt portfolio of EDC.
Inflation and Interest Rates
The Philippines average inflation in 2012 slowed to 3.2 percent, from the 4.6 percent recorded in the previous
year. The slowdown in headline inflation was due largely to lower food prices, notably vegetables and oils, on
account of ample domestic supply. Lower non‐ food inflation was also recorded during the review period,
supported by lower inflation for electricity, gas and other fuels.
The central bank sees a slower rise in consumer prices at 3.1 percent in 2013 attributable partly to the
sustained appreciation of the peso.
The central bank‘s policy interest rate as of October 25, 2012 is 3.5%. The benign inflation outlook provided
room for the reduction in policy rates, which would help buffer domestic demand against ongoing global
economic strains.
On January 24, 2013, the monetary board decided to maintain the central bank's key policy interest rates to
3.50% for the overnight borrowing or reverse repurchase facility and 5.50% for the overnight lending or
repurchase facility. The interest rates on term reverse repurchase and repurchases were also maintained
accordingly. Meanwhile, the monetary board decided to set the interest rates on the special deposit account
facility at 3.00% regardless of tenor, effective immediately, consistent with the central bank‘s continuing
efforts to fine tune the operation of its monetary policy tools.
Any events that will trigger direct or contingent financial obligation that is material to the company,
including any default or acceleration of an obligation
EDC has outstanding long-term loans with different financial institutions for its various development projects
and working capital requirements.
On March 16, 2012, Majority Lenders of the Fixed Rate Corporate Notes approved the Parent Company‘s
request for amendments to the provisions of the Agreement which prohibit EDC from redeeming the Notes
before the Early Redemption Dates and on a non-interest payment date.
Changes requested are as follows:
1) The Issuer can redeem Series 1, 2 and 3 Notes in whole or in part after the lapse of two (2) years or
twenty-four (24) months from Issue Date.

71
2) Prepayment Penalty:
For the Series 1 and Series 3 Notes:
Early Redemption Date Prepayment Penalty
Beginning on the 24th month up to the end
of the 48th month from the Issue Date
0.500%
Beginning on the 49th month from the
Issue Date up to the day immediately
prior to the final Principal Repayment
Date
0.375%
For the Series 2 Notes:
Early Redemption Date Prepayment Penalty
Beginning on the 24th
month up to the end
of the 72nd
month from the Issue Date 0.500%
Beginning on the 73rd
month from the
Issue Date up to the day immediately
prior to the final Principal Repayment
Date
0.375%
3) Early redemption of the Notes, in whole or in part, may be made on a date other than an Interest
Payment Date.
The Company prepaid Series 1 & 3 Notes on April 26, 2012 and Series 2 Notes on May 3, 2012 using funds
from recently issued Fixed Rate Corporate Notes amounting to P7 billion.
The new P7 billion Fixed Rate Corporate Notes was closed and signed on April 4, 2012. The facility was
drawn in two tranches with rates of 6.6173% and 6.6108% respectively.
Under the agreement of the said notes, the Company is restricted from directly or indirectly creating liens
upon its assets and revenues, making capital expenditures and making loans or advances. In addition, the
Company is subject to the following covenants (tested semi-annually): a ratio of Financial Indebtedness to
total Equity of no more than 70 to 30; a ratio of Total Current Assets to Total Current Liabilities of at least 1.0
to 1.0; and a Debt Service Coverage ratio of a minimum of 1.2 to 1.0.
The loan agreement is also subject to cross-default and cross-acceleration in the event of a failure of payment,
a default or a violation of any obligation that would result in the acceleration of payment under any other
financial indebtedness of the Company, or one for which the Company has agreed to act as guarantor, surety
or accommodation party in the same amount or more. The agreement however is only subject to cross-default
and cross-acceleration if amount involved in the occurrence of one or more of the above events or breaches is
at least Ten Million U.S. Dollars (US$10,000,000.00).
In addition to the Fixed Rate Corporate Notes, the Company also has outstanding (a) P4.1 billion and
P 3.263 billion 15-year IFC loan; (b) five and a half year and seven year fixed rate retail bonds; (c) 5-year
transferable syndicated term loan facility and (d) 10-year US Dollar bonds.
Any significant elements of income or loss (from continuing operations)
There were no significant elements of income or loss from continuing operations.

72
Seasonal aspects that have material effect on the FS
There were no seasonal items that materially affected the financial statements.
All material off-balance sheet transactions, arrangements, obligations (including contingent
obligations), and other relationships of the company with unconsolidated entities or other persons
created during the reporting period
During the reporting period, there were no off-balance sheet transactions, obligations and arrangements with
unconsolidated entities or persons.
Material Commitments for Capital Expenditures
The Company has a total budget for capital expenditures of approximately P16,296 million for 2013. Out of
the total budget, 75.9% (P12,364 million) is allotted to the project development costs of the Burgos Wind
Power Project and Nasulo Geothermal Power Project while 11.4% (P1,855 million) is allocated for the power
plant rehabilitation costs of Green Core Geothermal Inc. and Bacman Geothermal Inc.
Information on Independent Accountant / External Auditor
Changes in and Disagreements with Accountants on Accounting and Financial Disclosures
Since 1987, the Commission on Audit of the Philippines had served as the independent auditor of the
Company to audit the Company‘s financial statements. With the full privatization of the Company in 2007, it
has engaged SGV & Co. as its external auditor for a period of five years. The Company has not had any
material disagreements on accounting matters or financial disclosure matters with both Commission on Audit
and SGV & Co.
Audit and Audit-Related Fees
The following table sets out the aggregate fees billed for each of the last three fiscal years for professional
services rendered by SGV & Co. from 2010 to 2012.
Year-ended December 31,
2012 2011 2010
Audit and Audit-Related Fees 5,948,975 5,680,000 5,424,500
All Other Fees1 100,000 100,000 895,273
6,048,975 5,780,000 6,319,773
Tax Fees
The professional services rendered by the external auditor for tax accounting, compliance, advice, planning
and any other form of tax services in 2010 amounted to P535,273 and are included under ―All Other Fees‖ in
the table above. There were no such professional services rendered in 2011 and 2012.
All Other Fees
Professional services relating to the conduct of seminars and various services were rendered by the external
1 For services relating to conduct of seminars.

73
auditor in 2012, 2011 and 2010. The fees for these services are included under ―All Other Fees‖ in the table
above.

74
Audit Committee Approval Policies and Procedures for the Above Services
All matters relating to the above audit and audit-related services that may be rendered by the Company‘s
external auditor are first reviewed by the Company‘s Audit and Governance Committee and thereafter
endorsed to the Board of Directors for approval.
Market Price of and Dividends on the Registrant’s Common Equity
MARKET INFORMATION
The Company‘s common equity was listed in the Philippine Stock Exchange last December 13, 2006 at an
Initial Public Offering price of P3.20 per share. The high and low share prices for 2011, 2012 and 2013
(January and February) are indicated in the following table:
Highest Close Lowest Close
Period Price (P) Date Price (P) Date
2011
1st Quarter 6.29 March 18, 2011 5.50 Feb. 10, 11 & 15,
2011
2nd Quarter 6.96 May 3, 2011 6.27 May 25, 2011
3rd Quarter 7.02 July 8, 2011 5.28 Sept. 26, 2011
4th Quarter 6.36 Dec. 16, 2011 5.42 Oct. 5, 2011
2012
1st Quarter 6.35 Jan 1, 2012 4.90 Feb. 27, 2012
2nd Quarter 6.10 April 17, 2012 5.60 May 16, 2012
3rd Quarter 6.27 July 3, 2012 5.70 Aug. 8 & 9, 2012
4th Quarter 7.09 Nov. 28, 2012 6.10 Oct. 1, 2012
2013
January 7.23 Jan. 29, 2013 6.73 Jan. 23, 2013
February 7.75 Feb. 26, 2013 7.20 Feb. 1, 2013
The total number of stockholders as of December 31, 2012 was 700. Price as of last trading day of the year,
December 28, 2012, was P6.75 per share. Public float level is 50.34% (or 9,439,425,489 common shares).
As of March 8, 2013, the total number of stockholders was 695 and price was P6.50 per share. Public float
level was at 50.17% (or 9,407,474,064 common shares).
List of Top 20 Stockholders as of March 8, 2013
Rank Name Nationality
Number of Shares
% Preferred Common Total
1 Red Vulcan Holdings Corporation Filipino 9,375,000,000 7,500,000,000 16,875,000,000 60.00
2 PCD Nominee Corporation Foreign - 6,698,795,196 6,698,795,196 35.73
3 PCD Nominee Corporation Filipino - 2,704,535,147 2,704,535,147 14.42
4 First Gen Corporation Filipino - 991,782,700 991,782,700 5.29
5 Northern Terracotta Power Corporation Filipino - 819,486,400 819,486,400 4.37
6 Peter D. Garrucho, Jr. Filipino - 5,670,000 5,670,000 0.02
7 Benjamin K. Liboro Filipino - 3,525,500 3,525,500 0.01
8 Arthur A. De Guia Filipino - 2,200,000 2,200,000 0.01
9 CROSLO Holdings Corporation Filipino - 1,700,000 1,700,000 0.01
10 Hi-Light Corporation Filipino - 1,577,500 1,577,500 0.01
11 Mapazon Corporation Filipino - 1,470,000 1,470,000 0.01
12 ALG Holdings Corporation Filipino - 875,000 875,000 0.00

75
Rank Name Nationality
Number of Shares
% Preferred Common Total
13 Raul I. Macatangay Filipino - 725,000 725,000 0.00
14 Rosalind Camara Filipino - 663,750 663,750 0.00
15 Rodolfo R. Waga, Jr. Filipino - 527,000 527,000 0.00
16 Emelita D. Sabella Filipino - 521,000 521,000 0.00
17 Peter Mar &/or Annabelle C. Mar Filipino - 500,000 500,000 0.00
18 Ma. Consuelo R. Lopez Filipino - 500,000 500,000 0.00
19 Guillermo N. Tantuco or Clarita C. Tantuco Filipino - 440,000 440,000 0.00
20 Virginia Maria D. Nicolas Filipino - 393,000 393,000 0.00
COMPANY’S SHARE CAPITAL
On October 12, 2009, the SEC approved the EDC‘s increase in authorized capital stock from
P15,075,000,000.00 divided into 15,000,000,000 common shares and 7,500,000,000 preferred shares with a
par value of P1.00 and P0.01 per share, respectively, to P30,150,000,000.00 divided into 30,000,000,000
common shares and 15,000,000,000 preferred shares with a par value of P1.00 and P0.01 per share,
respectively, by way of a common stock dividend (totaling 3,750,000,000 common shares with fractional
shares subscribed by the EDC Retirement Fund) and the subscription by the current preferred stockholders to
1,875,000,000 preferred shares, representing 25% of the increase in the preferred shares at par value. On
October 14, 2009, EDC reissued the 93,000,000 treasury shares to a Trust Fund with the BDO (for the
employee stock ownership plan). Total issued and outstanding stock as of December 31, 2012 consists of
18,750,000,000 common shares and 9,375,000,000 preferred shares.
Each common share is equal in all respects to every other common share. All the common shares have full
voting and dividend rights. The rights of EDC‘s shareholders include the right to notice of shareholders‘
meetings, the right of inspection of the Company‘s corporate books and other shareholders‘ rights contained
in the Corporation Code. Notice of shareholders‘ meetings is provided by mail or by hand.
Holders of common shares are entitled to receive annual cash dividends of at least 30% of the prior year‘s
recurring net income based on the recommendation of the Board of Directors. Such recommendation will take
into consideration factors such as current and prospective debt service requirements and loan covenants, the
implementation of business plans, operating expenses, budgets, funding for new investments and acquisitions,
appropriate reserves and working capital, among others. In this connection, covenants in certain loan
agreements entered into by the Company restrict the distribution of dividends to the Company‘s stockholders
if such distribution will impair the Company‘s ability to pay its obligations or if an event of default or a
prospective event of default (as defined in the loan agreement) has occurred and has not been remedied to the
satisfaction of the creditor(s).
The following are the terms of the preferred share issue:
1. Voting
2. Cumulative dividend rate of 8.0 % p.a.
3. Non-participating in any further dividends distributed to common shareholders
4. EDC may redeem at par in the event that restrictions on foreign share ownership are lifted
5. Non-convertible
6. No pre-emptive rights
7. Preference over common shares in case of liquidation or dissolution
8. Restrictions on transferability
76
CASH AND STOCK DIVIDENDS
On March 13, 2012, the BOD of the Parent Company approved the following cash dividends in favor of all
stockholders of record as of March 28, 2012 and payable on or before April 24, 2012:
cash dividend of P=0.0008 per share on the preferred shares; and
regular cash dividend of P=0.10 per share on the common shares.
On September 5, 2012, the BOD of the Parent Company approved the payment of special cash dividends of
P=0.04 per share on the common shares in favor of common stockholders of record as of
September 20, 2012, payable on or before October 16, 2012.
In March, May and October 2012, FG Hydro declared and paid cash dividends amounting to
P=88.5 million, P=1,254.0 million and P=520.0 million respectively.
On February 20, 2013, the BOD of the Parent Company approved the following cash dividends in favor of all
stockholders of record as of March 11, 2013 and payable on or before April 8, 2013:
cash dividend of P=0.0008 per share on the preferred shares; and
regular cash dividend of P=0.08 per share on the common shares.
Holders of common shares are entitled to receive annual cash dividends of at least 30% of the prior years‘
recurring net income based on the recommendation of the Board of Directors. Such recommendation will take
into consideration factors such as current and prospective debt service requirements and loan covenants, the
implementation of business plans, operating expenses, budgets, funding for new investments and acquisitions,
appropriate reserves and working capital, among others.
Holders of the preferred shares shall be entitled to receive out of the unrestricted retained earnings when and
as declared by the Board of Directors, cumulative dividends at the rate of eight percent (8%) of the par value
of preferred shares, before any dividends shall be allocated and paid to holders of the common shares.
Holders of the preferred shares shall not be entitled to participate with holders of the common shares in any
further dividends payable by the Company.
Exempt Securities and Exempt Transactions
On June 25, 2007, the SEC approved the increase of the Company‘s authorized capital stock by way of
creation and issuance of 7,500,000,000 preferred shares with a par value of P 0.01 per share. The preferred
shares are exempt securities.
On October 12, 2009, the SEC approved the increase of the Company‘s authorized capital stock from Fifteen
Billion Seventy Five Million Pesos (Php15,075,000,000.00) divided into (i) Fifteen Billion (15,000,000,000)
common shares with a par value of One Peso (Php1.00) per share, or an aggregate par value of Fifteen Billion
Pesos (Php15,000,000,000.00); and (ii) Seven Billion Five Hundred Million (7,500,000,000) preferred shares
with a par value of 1/100 Peso (Php0.01) per share, or an aggregate par value of Seventy Five Million Pesos
(Php75,000,000.00), to Thirty Billion One Hundred Fifty Million Pesos (Php30,150,000,000.00) divided into
(i) Thirty Billion (30,000,000,000) common shares with a par value of One Peso (Php1.00) per share, or an
aggregate par value of Thirty Billion Pesos (Php30,000,000,000.00); and (ii) Fifteen Billion (15,000,000,000)
preferred shares with a par value of 1/100 Peso (Php0.01) per share, or an aggregate par value of One Hundred
Fifty Million Pesos (Php150,000,000.00), by way of a common stock dividend (totaling 3,750,000,000
common shares with any fractional shares being subscribed by the EDC Retirement Fund and/or Trust for the
EDC Executive/Employee Stock Ownership Plan) and the subscription by the current preferred stockholders
to 1,875,000,000 preferred shares, representing 25% of the increase in the preferred shares at par value.

77
G. Compliance with Corporate Governance Practices
The 2012 CORPORATE GOVERNANCE REPORT
2012 saw the Company‘s unrelenting drive towards operational excellence, coupled with adherence to
corporate governance principles, and initiatives in furtherance thereof. This ensures that EDC maintains an
operational balance that will help sustain its momentum as it moves forward in the local and global arena.
OUR CORPORATE GOVERNANCE ACTIVITIES FOR 2012
EDC‘s corporate governance program has been revisited and realigned with corporate direction in order to
promote sustainability in the midst of the fast-paced development and organizational growth in 2012.
We continue to reach for new heights and accomplish new things on corporate governance while holding our
homegrown corporate governance values and corporate values close to our hearts. Progress with a soul.
Below are the Energy Development Corporation‘s CG activities and initiatives for 2012:
Sustainability is the Key. In 2012, EDC became the first Philippine Company to publish a GRI-
Certified sustainability report with a GRI-checked B+ rating. The report consists of an integration of
the financial and sustainability reports of the Company for 2011 which adhered to the stringent EUSS
(Electric Utilities Sector Supplement) reporting standards of the GRI, and duly-checked by the GRI
organization in Netherlands.
Change Management. In 2012, EDC began the process of initiating several strategic changes to make
the company more competitive, resilient and growth-capable in the years to come, with the SBU
(Strategic Business Unit) set-up at the forefront and as the cornerstone of the change agenda. With the
organization undergoing the change, the Board and Management ensured that the change initiatives
will be actualized and carried out to all levels in all project sites.
Anti-Sexual Harassment Policy.This policy prescribes the rules and regulations of the Company
towards the promotion of a work environment which values human dignity, and prescribes the
administrative process and disciplinary action for sexual harassment cases. The policy was circulated,
discussed and dissected in various labor-management council meetings, and finally signed and made
effective on December 7, 2012.
Institutionalization of Employee Consultation and Expanded Labor-Management Councils. In
view of the successful run of the EC/ELMC in 2011, the Company has decided to institutionalize this
feedback and interaction program for increased participation of employees on company concerns,
programs and developments. In 2012, the Company, through the HR Management Services (HRMS)
Sector, conducted a total of twenty-two (22) EC/ELMC sessions for every quarter in EDC‘s Head
Office and Project Sites.
Strategy Management. Part of improving the company‘s governance framework is the furtherance of
the strategy initiatives begun in the previous year. EDC‘s drive towards a highly professional and
world-class company in 2012 focused on the establishment of improved internal systems and business
processes. To this end, the Company undertook the establishment and maintenance of management
systems, e.g. ISO-based management systems, as well as the establishment and implementation of an
improved business process management framework. For 2012, EDC boasts the following
accomplishments in improving its management systems and management frameworks:

78
The successful completion of the third-party audit by SGS (Société Générale de Surveillance)
of EDC‘s Mount Apo Geothermal Project (MAGP), leading to a recommendation for ISO
14001:2004 certification;
The professionalization of the management systems with the seven (7) trained lead auditors
for the Environmental Management Systems (EMS); and
Enterprise-wide process inventory as part of the process improvement strategies of the
Company.
RECOGNITION AND AWARDS FOR EDC’S CORPORATE GOVERNANCE ACTIVITIES IN 2012
2012 brought EDC to a new milestone in its practice of good corporate governance when it was recognized
with both a Platinum Award and a Gold Award in May 2012 for corporate governance excellence from the
Institute of Corporate Directors (ICD), the SEC and PSE in the 2011 Corporate Governance Scorecard.
EDC‘s CG performance merited its third Gold Award in 2012 with a CG rating above 95%, which in turn,
warranted a Platinum Award for achieving Gold for three consecutive years.
This year‘s double CG recognition marked the 5thconsecutive year that EDC has been cited for excellence in
corporate governance programs and practices.
The Corporate Governance Scorecard rating of Energy Development Corporation is 96.44%, broken down as
follows: Rights of Shareholders 87.00%; Equitable Treatment of Shareholders 100.00%; Role of Stakeholders
100.00%; Disclosure and Transparency 98.00%; and Board Responsibility 96.00%
COMPLIANCE WITH POLICIES, RULES AND REGULATIONS ON CORPORATE
GOVERNANCE
―Compliance‖ to EDC means complete, accurate and timely submissions of governance disclosures, reports
and data to the SEC and PSE, such as, but not limited to:
Annual Compliance Officer‘s certification of compliance with the company‘s Corporate Governance
Manual under SEC Form MCG-2002;
Annual certification on Directors‘ Attendance in Board Meetings for 2012;
Structured reports to the SEC and PSE such as, but not limited to, SEC Forms 17-A, 17-C, 17-Q, 20-
IS, 23-A, 23-B, Public Ownership Reports, Top 100 Shareholders; Disclosure of unstructured reports,
such as material information and important events in the Company.
Annual Corporate Governance disclosure to the PSE pursuant to the PSE CG Guidelines; and
Report on the Audit and Governance Committee (AGC) Charter and Performance Assessment.
Likewise, other operational reports, permits and information required from the company by government and
industry regulators such as the DOE, ERC, DENR and DOLE, among others, are constantly monitored and
prepared for their timely submission and compliance. In order to further strategize their management and
prioritization, EDC has formally set-up in 2012 a Regulatory Team with members from all sectors of the
company headed by the Compliance Officer. It is assisted by a Steering Committee composed of all the Vice
Presidents as members and the President as Chairman to rationalize the operational compliance requirements
of the Company for improved governance.
THE CORPORATE GOVERNANCE MANUAL
Since the adoption of the EDC Corporate Governance Manual in November 15, 2006 in compliance with the
Corporate Governance Code of the SEC under SEC Memorandum Circular No. 2, series of 2002 dated April
5, 2002, the CG Manual has provided guidance to the Company, the Board and Management throughout the

79
years. With the amendments effected in compliance with the requirements of the new SEC Revised CG Code
under SEC memorandum Circular No. 6, series of 2009, the Corporate Governance Manual of EDC ensures
that there is full compliance by the Company on governance in relation to its day-to-day operational concerns.
In January 10, 2013, the Company‘s Senior Vice-President/Compliance Officer and the President/COO
certified to the Securities and Exchange Commission that for the year 2012, the Company, through its
Directors, Officers, Managers and employees, fully complied with all the leading practices and principles of
its duly-adopted Corporate Governance Manual.
EDC’S CORPORATE GOVERNANCE-RELATED POLICIES & ISSUANCES
Throughout 2012, EDC continued with its drive on improving its governance-related policies aimed at
enriching its overall corporate governance programs, by ensuring that information relating to these
governance-related policies are cascaded down to every member of the organization.
For the year, in addition to education efforts of the Company on existing governance-related issuances,
intensive information drives and caucuses were undertaken on the Company‘s new Anti-Sexual Harassment
Policy, to guide every employee of the rights and obligations of every member of the EDC Team on sexual
harassment issues.
THE BOARD OF DIRECTORS
Election of the EDC Board of Directors for the term 2012-2013
During the May 9, 2012 Annual Stockholders‘ Meeting held at the Philippine Stock Exchange
Auditorium in Pasig City, Philippines, eleven (11) highly-qualified and highly-experienced
professionals with exemplary backgrounds on business, local and international finance and energy
were elected by the stockholders to the Board of Directors of the Energy Development Corporation.
The eleven (11) members of the Board comprise of eight (8) regular directors and three (3)
independent directors. The regular directors are a good combination of executive and non-executive
directors. All the elected members of the Board have been screened and evaluated by the Nomination
and Compensation Committee of the Board to possess all the qualifications and none of the
disqualifications for directors under existing laws, rules, regulations and the Company‘s Corporate
Governance Manual.
The election of three (3) independent directors is the Company‘s compliance above and beyond the
legal and regulatory requirement. For the year 2012-2013, the following were the elected
Independent Directors in the EDC Board: Atty. Francis Ed. Lim, Mr. Edgar O. Chua, and Mr. Arturo
T. Valdez.
For their election as independent directors of EDC, the Company adhered to the definition of an
“Independent Director”:
An Independent Director is one who is independent of Management and who is free from
any business or other relationship with the Company which could, or could reasonably be
perceived to, materially interfere with the exercise of his independent judgment in carrying
out his responsibilities as a director of the Company.
An Independent Director is also one who possesses all the qualifications and none of the
disqualifications for an independent director under existing laws, government issuances,
rules or regulations.
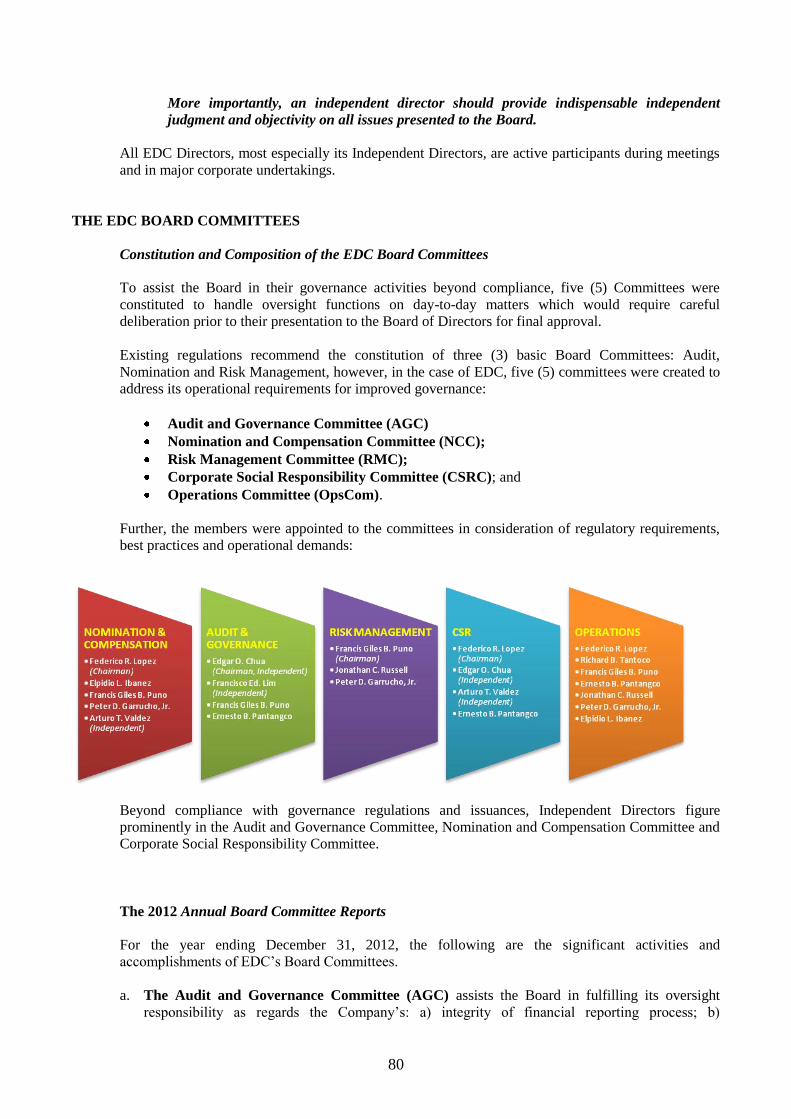
80
More importantly, an independent director should provide indispensable independent
judgment and objectivity on all issues presented to the Board.
All EDC Directors, most especially its Independent Directors, are active participants during meetings
and in major corporate undertakings.
THE EDC BOARD COMMITTEES
Constitution and Composition of the EDC Board Committees
To assist the Board in their governance activities beyond compliance, five (5) Committees were
constituted to handle oversight functions on day-to-day matters which would require careful
deliberation prior to their presentation to the Board of Directors for final approval.
Existing regulations recommend the constitution of three (3) basic Board Committees: Audit,
Nomination and Risk Management, however, in the case of EDC, five (5) committees were created to
address its operational requirements for improved governance:
Audit and Governance Committee (AGC)
Nomination and Compensation Committee (NCC);
Risk Management Committee (RMC);
Corporate Social Responsibility Committee (CSRC); and
Operations Committee (OpsCom).
Further, the members were appointed to the committees in consideration of regulatory requirements,
best practices and operational demands:
Beyond compliance with governance regulations and issuances, Independent Directors figure
prominently in the Audit and Governance Committee, Nomination and Compensation Committee and
Corporate Social Responsibility Committee.
The 2012 Annual Board Committee Reports
For the year ending December 31, 2012, the following are the significant activities and
accomplishments of EDC‘s Board Committees.
a. The Audit and Governance Committee (AGC) assists the Board in fulfilling its oversight
responsibility as regards the Company‘s: a) integrity of financial reporting process; b)

81
effectiveness and soundness of internal control environment; c) adequacy of audit functions, both
external and internal audits; and d) compliance with rules, policies, laws, regulations, contracts
and the code of conduct.
In fulfilling our responsibilities as stated in the AGC Charter, the Committee performed the
following activities:
a. Financial Reporting and Disclosures. The Committee reviewed with Management and
the external auditor (SGV & Co.) the annual and quarterly interim financial reports and
endorsed them for Board approval and release to regulatory agencies, stockholders and
creditors. Their review included discussions on the appropriateness of accounting policies
adopted by management, the reasonableness of estimates, assumptions and judgments
used in the preparation of financial statements, the impact of new accounting standards
and interpretations, and other key accounting issues and audit results as highlighted by the
external auditor.
Internal Control Environment. The AGC monitored the effectiveness of the internal
control environment through various measures such as: the review of the results of the
external audit regarding internal control issues; exercising functional responsibility over
Internal Audit and Compliance Office and receiving reports on work done in assessing
key governance, risk management and control components; discussion with management
on major control issues and recommendations to improve policies and processes; and
promoting a culture of integrity and ethical values in the company.
External and Internal Audit. The AGC likewise reviewed the overall scope and audit
plan of the external auditor. The Committee also reviewed and affirmed the management
evaluation on the performance of the external auditor (for the 2011 financial statements
audit) and approved the reengagement of SGV & Co. for another year (2012 audit) as
well as the non-audit services rendered by external auditors. The AGC also approved the
Internal Audit annual plan and ensured that independence is maintained, the scope of
work is sufficient and resources are adequate.
b. Compliance. The AGC likewise monitored the Company‘s compliance to laws,
regulations and policies, by approving the annual plans and programs of the Compliance
Office, taking steps to strengthen the governance framework such as: a) completion of the
corporate governance evaluation (i.e. Board self assessment and President/COO
evaluation), b) ensuring that all directors and senior executives comply with the corporate
governance training requirements, c) participation in the ASEAN Corporate Governance
Scorecard Project and the PSE Bell Awards, d) update of the corporate governance pages
in the EDC website, and e) receiving the ‗Platinum Award‘ for the 2011 Corporate
Governance Scorecard results as adjudged by the Institute of Corporate Directors.
c. Committee Meetings. The AGC conducted four (4) meetings in 2012, in which all
Committee members attended at least a majority of the meetings.
d. Assessment of Performance. In compliance with SEC memorandum Circular No. 4,
series of 2012, the AGC assessed its own performance based on the guidelines and
parameters set in SEC, and the results of which were reported to the SEC last October 4,
2012 (i.e. overall rating of ‗Very Satisfactory‘). Based on the results of the performance
evaluation, the Committee committed to take steps to address the identified areas for
improvement
b. Nomination and Compensation Committee (NCC)
In Compliance with the mandate under the Securities Regulation Code and the
Company‘s Corporate Governance Manual, the NCC reviewed the qualifications,
credentials and disqualifications of nominees for Regular and Independent Directors for
the 2012 Annual stockholders Meeting; and
The Committee likewise reviewed and evaluated the qualifications and disqualifications
of new EDC Vice-Presidents (Supply Chain, Power Generation and Project Development

82
Officer for EDC International) prior to their election by the Board, as well as the
appointments of other officers to new or different Sectors.
c. Risk Management Committee (RMC)
Business Continuity Management. To address Disaster Avoidance and Recovery Risk,
which is one of the strategic risks of EDC, the Business Continuity Management Project
was launched in 2012 in several locations company-wide, and targeted for completion in
2013.
Strategic Business Unit Risk Review. In August 2012, Management decided to operate
using strategic business units (SBUs) to support the company‘s vision to become a global
leader in geothermal energy. Relative to this, risk reviews were conducted to identify the
top risks of each SBU on (a) Steam availability and Sustainability, (b) FCRS Availability
and Reliability, (c) Power Plant Availability and Reliability, and (d) Corporate Social
Responsibility Projects, and the initiatives to address these top risks are scheduled for the
Risk Management Committee‘s review in January 2013.
Electric Cooperative Credit Risk Portfolio. A credit risk portfolio analysis of EDC‘s
customers was conducted to identify the credit default risk exposure of the Company,
focusing on their financial strength and creditworthiness.
Vendor Evaluation. Thirty-four (34) financial evaluations of suppliers and contractors
were conducted to review their financial performance and credit history. The purpose of
the evaluation was to provide EDC with an understanding of its suppliers‘ and
contractors‘ financial condition and related risks.
d. Corporate Social Responsibility Committee
The Corporate Social Responsibility (CSR) Committee of the EDC Board performed its oversight
function on EDC's CSR program policy and strategy on socioeconomic development of the
company's host communities and on the stewardship of the environment where EDC operates.
These programs have been guided by EDC's pursuit of corporate excellence that goes beyond
compliance and beyond the financial bottom line.
a. During the year, EDC Management embarked on a major CSR program shift to projects
that required detailed studies for an extended period of time. Having approved the CSR
road map for the Health, Education, Livelihood and Environment (HELEn) Program and
having established major Climate Change Program thrusts in December 2011, the
Committee allowed Management to develop the necessary projects under these initiatives
for the first half of 2012 and then conducted the review in the middle of the year. Outside
the CSR Committee, several meetings were then held thereafter by the CSR Committee
Chairman with EDC Management to review the progress on the directions given by the
CSR Committee.
e. Operations Committee
The Committee deliberated on seventy-two items which were approved or elevated to the
Board for final approval with a cumulative worth of about P39.35 Billion. Of these, more
than 40% of the items pertained to drilling activities while the bulk of the amount for
operational support activities pertained to the 2012 corporate budget of EDC and the
subsidiaries GCGI and BGI.
The items deliberated on by the Committee in 2012 are lower compared to the 86 items
passed upon by the Committee in 2011. The reduction was brought about by the increased
approval limits for the President/COO

83
Directors’ Board Meeting and Committee Meeting Attendance for the year ended December 31, 2012
All members of the EDC Board Committees diligently attend their respective Committee meetings to fully
perform their commitment to the Corporation, rendering a more effective Board governance framework.
From the Committee Meetings to the Annual Stockholders‘ Meeting of the Company, all Directors, especially
the Board Committee Chairpersons, are present. Disclosures filed at the SEC and the PSE show attendance of
the different Committee Chairpersons during the 2012 Annual Stockholders‘ Meeting of EDC.
For the year ended December 31, 2012, below are the tables showing the frequency of meetings and the
respective attendance of the members of EDC‘s Directors in Board Meetings and Committee Meetings:
Directors’ Attendance in Board Meetings and the Annual Stockholders’ Meeting for 2012
ASM ORG
Name of Directors 31-
Jan-12 24-
Feb-12
13-
Mar-
12
9-
May-
12
9-
May-
12
10-
Jul-12 5-Sep-
12 17-
Oct-12
20-
Nov-
12 OSCAR M. LOPEZ A RICHARD B.
TANTOCO
PETER D.
GARRUCHO, JR.
FEDERICO R.
LOPEZ
ERNESTO B.
PANTANGCO A
FRANCIS GILES
B. PUNO
JONATHAN C.
RUSSELL
FRANCIS ED.
LIM(Independent) A
EDGAR O. CHUA (Independent)
ELPIDIO L.
IBANEZ
ARTURO T.
VALDEZ (Independent)
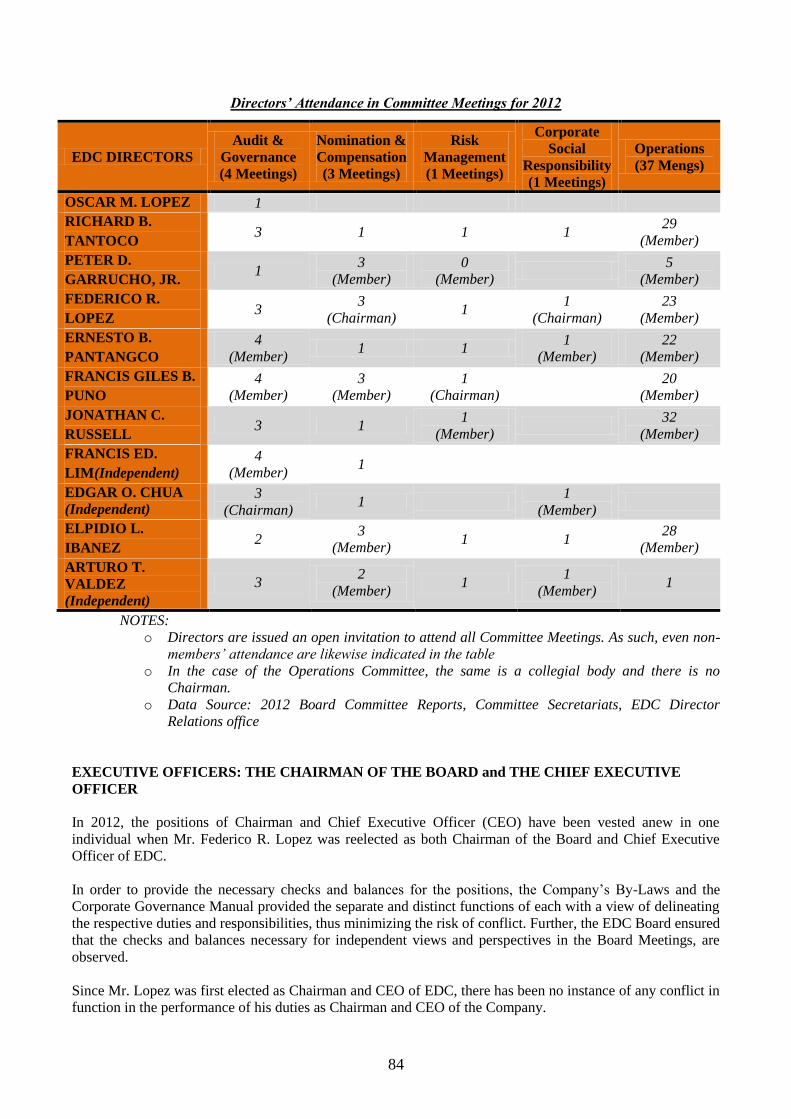
84
Directors’ Attendance in Committee Meetings for 2012
EDC DIRECTORS Audit &
Governance (4 Meetings)
Nomination &
Compensation (3 Meetings)
Risk
Management (1 Meetings)
Corporate
Social
Responsibility (1 Meetings)
Operations (37 Mengs)
OSCAR M. LOPEZ 1 RICHARD B.
TANTOCO 3 1 1 1
29 (Member)
PETER D.
GARRUCHO, JR. 1
3 (Member)
0 (Member)
5
(Member)
FEDERICO R.
LOPEZ 3
3 (Chairman)
1 1
(Chairman) 23
(Member)
ERNESTO B.
PANTANGCO 4
(Member) 1 1
1 (Member)
22 (Member)
FRANCIS GILES B.
PUNO 4
(Member) 3
(Member) 1
(Chairman)
20 (Member)
JONATHAN C.
RUSSELL 3 1
1 (Member)
32
(Member)
FRANCIS ED.
LIM(Independent) 4
(Member) 1
EDGAR O. CHUA (Independent)
3 (Chairman)
1 1
(Member)
ELPIDIO L.
IBANEZ 2
3 (Member)
1 1 28
(Member)
ARTURO T.
VALDEZ (Independent)
3 2
(Member) 1
1 (Member)
1
NOTES:
o Directors are issued an open invitation to attend all Committee Meetings. As such, even non-
members’ attendance are likewise indicated in the table
o In the case of the Operations Committee, the same is a collegial body and there is no
Chairman.
o Data Source: 2012 Board Committee Reports, Committee Secretariats, EDC Director
Relations office
EXECUTIVE OFFICERS: THE CHAIRMAN OF THE BOARD and THE CHIEF EXECUTIVE
OFFICER
In 2012, the positions of Chairman and Chief Executive Officer (CEO) have been vested anew in one
individual when Mr. Federico R. Lopez was reelected as both Chairman of the Board and Chief Executive
Officer of EDC.
In order to provide the necessary checks and balances for the positions, the Company‘s By-Laws and the
Corporate Governance Manual provided the separate and distinct functions of each with a view of delineating
the respective duties and responsibilities, thus minimizing the risk of conflict. Further, the EDC Board ensured
that the checks and balances necessary for independent views and perspectives in the Board Meetings, are
observed.
Since Mr. Lopez was first elected as Chairman and CEO of EDC, there has been no instance of any conflict in
function in the performance of his duties as Chairman and CEO of the Company.

85
CORPORATE GOVERNANCE EVALUATION
Since 2008, the Company has adopted an annual Board Self-assessment Evaluation and President‘s
Evaluation, with majority of the Board providing their inputs and insights on the Board‘s overall performance
as well as their assessment of the President‘s performance, leadership, operational management, working
relationship with the Board, and financial management.
In 2012, the Board conducted the Annual Self-Assessment and President‘s Evaluation, which rated their
performance based on several corporate governance criteria adopted from OECD principles. In addition to the
quantitative evaluation, the CG evaluation featured a new evaluation tool whereby respondents cited their
reasons for giving the highest and the lowest ratings. This new feature aimed to help the Board and
Management know the reasons behind the highest and lowest ratings in order to prepare programs and
activities for the enhancement of the Board‘s strengths and capabilities. Once the evaluation is complete, a
report is submitted to the Board of Directors, through the President and the Audit and Governance Committee.
For the Board‘s Self-Assessment, highest rating was given to the board‘s accountability and independence. A
comparison of the 2012 and 2011 results show a marked consistency on items relating to accountability,
independent-mindedness and stewardship. Further, on their recommendations for improvement, several
suggestions reiterate the need to focus more on strategy and strategic processes. On the other hand, for the
President‘s Evaluation, the 2012 cycle resulted in the highest evaluation rating for the Company President,
with the respondents citing that the President/COO‘S clear vision, strategies & directions, leadership,
management skills, financial expertise and capacity to cooperate and work closely with the board helped
achieve the company‘s strategic objectives.
DISCLOSURE AND TRANSPARENCY
The Company, through its Investor Relations Office, fully complied with the requirement of full, fair, accurate
and timely disclosures to the public via immediate disclosures with the Philippine Stock Exchange (PSE) and
the Securities and Exchange Commission (SEC).
Disclosures are likewise handled and submitted on time by the Office of the Corporate Secretary, the
Compliance Office and other concerned groups in coordination with the Investor Relations Office. Further, its
commitment to full disclosure is embodied in EDC‘s Corporate Governance Manual, to wit:
The Board shall, at all times commit to fully disclose material information and/or
transactions that could potentially affect the market price of the Company’s shares and such
other information which are required to be disclosed pursuant to the Securities Code and its
Implementing Rules and Regulations including, without limitation, earnings results,
acquisition or disposal of significant assets, off balance-sheet transactions, Board
membership changes, shareholdings of Directors and Officers and any changes thereto, and
remuneration of Directors and Officers and related party transactions.
For 2012, the EDC complied 100% with all required structured reports to the SEC, and a total of 37
unstructured reports and disclosures to both the SEC and PSE.
One of the strongest disclosure tools used by the Company is its website (www.energy.com.ph) which is kept
updated at all times with full, fair and accurate reports to comply with the disclosure requirements of the SEC
and PSE.
SHAREHOLDER AND STAKEHOLDER RIGHTS
As a company imbued with high public interest, EDC steadfastly commits to respect shareholder rights as
provided under existing laws, rules and regulations, as well as those rights it committed to observe under its
Corporate Governance Manual, such as voting rights, pre-emptive rights, right to information, right to

86
dividends and appraisal rights of the stockholders.
Further, EDC‘s commitment to promote stockholders‘ rights is embodied in the Corporate Governance
Manual which states:
It shall be the duty of the Board to promote stockholder’s rights, remove impediments to the
exercise thereof and allow possibilities of seeking redress for violation of such rights. The
Board shall encourage the exercise of stockholders’ voting rights and the collective action
towards solution of problems through appropriate mechanisms.
The Board should be transparent and fair in the conduct of the annual and special
stockholders’ meetings of the corporation. The stockholders should be encouraged to
personally attend such meetings. If they cannot attend, they should be appraised ahead of
time of their right to appoint a proxy. Subject of the requirements of the By-Laws, the
exercise of that right shall not be unduly restricted and any doubt about the validity of a
proxy should be resolved in stockholder’s favor.
They shall likewise be instrumental in removing excessive costs and other administrative or
practical impediments to stockholders participating in meetings and/or voting in person. The
Board shall pave the way for the electronic filing and distribution of stockholder information
necessary to make informed decisions in accordance with applicable laws, rules and
regulations.
PLANS TO IMPROVE
The Energy Development Corporation (EDC) recognizes the stockholders and other stakeholders‘
expectations of high standards of behavior and accountability from directors and officers, and firmly requires
strict adherence to the corporate governance principles of loyalty, fairness, accountability, transparency and
integrity. All Directors, Officers and employees of EDC are required and expected to carry out their respective
duties and responsibilities effectively and in compliance with these governance principles.
EDC is continually reviewing its policies and processes for further improvements in corporate governance
practices within the Company and to address the changes in government legislation, administrative regulations
and international best practices.
To this end, EDC has likewise strengthened its partnership with regulatory government agencies and SEC-
accredited corporate governance institutions.
Through the Compliance Office, EDC has likewise affiliated itself with corporate governance and ethics
advocates and practitioners in the Philippines composed of representatives from publicly-listed corporations
with known good corporate governance practices.
DEVIATIONS
There are no known significant deviations from the Company‘s Manual of Corporate Governance.
The Company will provide without charge to each person solicited, upon his written request, a copy of
the Company’s annual report on SEC Form 17-A duly filed with the Securities and Exchange
Commission. At the discretion of Management, a reasonable fee may be charged for the expense
incurred in providing a copy of the exhibits. All requests may be sent to the Company’s head office and
addressed to:
Attention: Mr. Erudito S. Recio
Senior Manager, Investor Relations

(A Subsidiary of Red Vulcan Holdings Corporation)
Consolidated Financial Statements December 31, 2012 and 2011
and Years Ended December 31, 2012, 2011 and 2010
and
Independent Auditors’ Report


*SGVMG300344*
INDEPENDENT AUDITORS’ REPORT The Stockholders and the Board of Directors Energy Development Corporation We have audited the accompanying consolidated financial statements of Energy Development Corporation (a subsidiary of Red Vulcan Holdings Corporation) and its Subsidiaries, which comprise the consolidated statements of financial position as at December 31, 2012 and 2011, and the consolidated statements of income, statements of comprehensive income, statements of changes in equity and statements of cash flows for each of the three years in the period ended December 31, 2012, and a summary of significant accounting policies and other explanatory information. Management’s Responsibility for the Consolidated Financial Statements
Management is responsible for the preparation and fair presentation of these consolidated financial statements in accordance with Philippine Financial Reporting Standards, and for such internal control as management determines is necessary to enable the preparation of consolidated financial statements that are free from material misstatement, whether due to fraud or error.
Auditors’ Responsibility
Our responsibility is to express an opinion on these consolidated financial statements based on our audits. We conducted our audits in accordance with Philippine Standards on Auditing. Those standards require that we comply with ethical requirements and plan and perform the audit to obtain reasonable assurance about whether the consolidated financial statements are free from material misstatement.
An audit involves performing procedures to obtain audit evidence about the amounts and disclosures in the consolidated financial statements. The procedures selected depend on the auditor’s judgment, including the assessment of the risks of material misstatement of the consolidated financial statements, whether due to fraud or error. In making those risk assessments, the auditor considers internal control relevant to the entity’s preparation and fair presentation of the consolidated financial statements in order to design audit procedures that are appropriate in the circumstances, but not for the purpose of expressing an opinion on the effectiveness of the entity’s internal control. An audit also includes evaluating the appropriateness of accounting policies used and the reasonableness of accounting estimates made by management, as well as evaluating the overall presentation of the consolidated financial statements.
We believe that the audit evidence we have obtained is sufficient and appropriate to provide a basis for our audit opinion.
SyCip Gorres Velayo & Co. 6760 Ayala Avenue 1226 Makati City Philippines
Phone: (632) 891 0307 Fax: (632) 819 0872 www.sgv.com.ph BOA/PRC Reg. No. 0001, December 28, 2012, valid until December 31, 2015 SEC Accreditation No. 0012-FR-3 (Group A), November 15, 2012, valid until November 16, 2015
A member firm of Ernst & Young Global Limited

*SGVMG300344*
- 2 -
Opinion
In our opinion, the consolidated financial statements present fairly, in all material respects, the financial position of Energy Development Corporation and its Subsidiaries as at December 31, 2012 and 2011, and their financial performance and their cash flows for each of the three years in the period ended December 31, 2012 in accordance with Philippine Financial Reporting Standards. SYCIP GORRES VELAYO & CO. Martin C. Guantes Partner CPA Certificate No. 88494 SEC Accreditation No. 0325-AR-2 (Group A), March 15, 2012, valid until March 14, 2015 Tax Identification No. 152-884-272 BIR Accreditation No. 08-001998-52-2012, April 11, 2012, valid until April 10, 2015 PTR No. 3669687, January 2, 2013, Makati City February 20, 2013
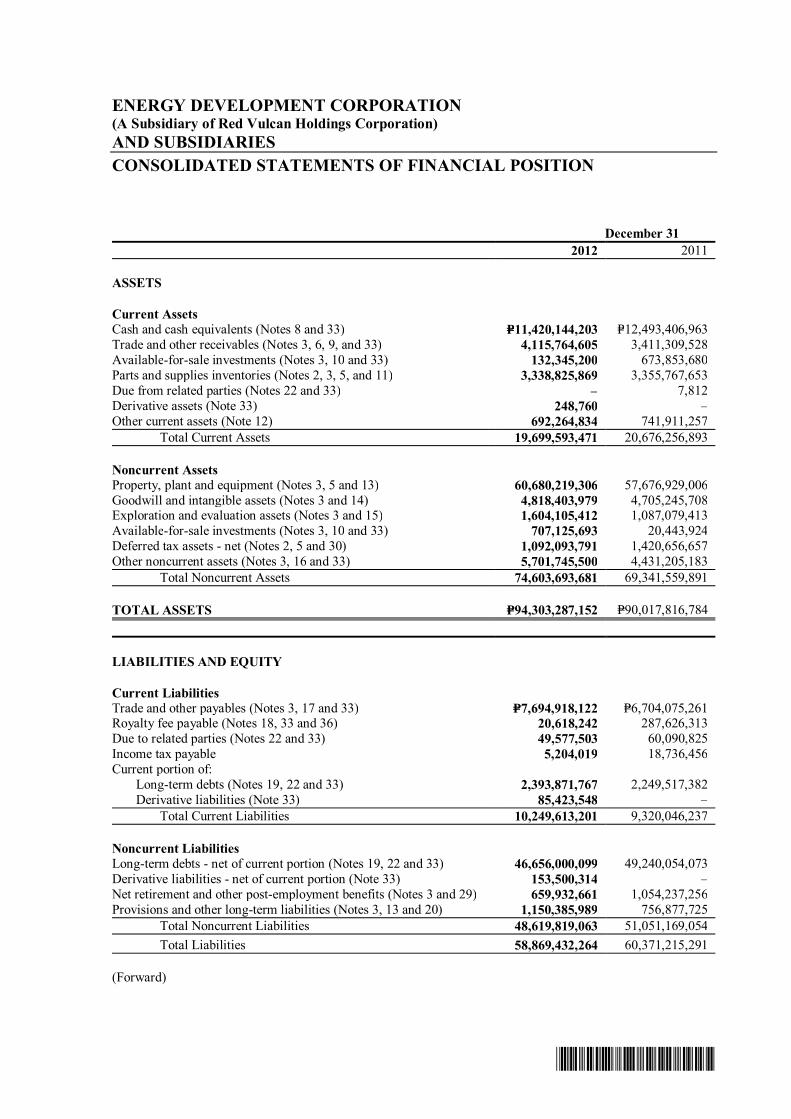
*SGVMG300344*
ENERGY DEVELOPMENT CORPORATION (A Subsidiary of Red Vulcan Holdings Corporation) AND SUBSIDIARIES CONSOLIDATED STATEMENTS OF FINANCIAL POSITION December 31 2012 2011
ASSETS
Current Assets Cash and cash equivalents (Notes 8 and 33) P=11,420,144,203 P=12,493,406,963 Trade and other receivables (Notes 3, 6, 9, and 33) 4,115,764,605 3,411,309,528 Available-for-sale investments (Notes 3, 10 and 33) 132,345,200 673,853,680 Parts and supplies inventories (Notes 2, 3, 5, and 11) 3,338,825,869 3,355,767,653 Due from related parties (Notes 22 and 33) – 7,812 Derivative assets (Note 33) 248,760 – Other current assets (Note 12) 692,264,834 741,911,257 Total Current Assets 19,699,593,471 20,676,256,893
Noncurrent Assets Property, plant and equipment (Notes 3, 5 and 13) 60,680,219,306 57,676,929,006 Goodwill and intangible assets (Notes 3 and 14) 4,818,403,979 4,705,245,708 Exploration and evaluation assets (Notes 3 and 15) 1,604,105,412 1,087,079,413 Available-for-sale investments (Notes 3, 10 and 33) 707,125,693 20,443,924 Deferred tax assets - net (Notes 2, 5 and 30) 1,092,093,791 1,420,656,657 Other noncurrent assets (Notes 3, 16 and 33) 5,701,745,500 4,431,205,183
Total Noncurrent Assets 74,603,693,681 69,341,559,891
TOTAL ASSETS P=94,303,287,152 P=90,017,816,784
LIABILITIES AND EQUITY
Current Liabilities Trade and other payables (Notes 3, 17 and 33) P=7,694,918,122 P=6,704,075,261 Royalty fee payable (Notes 18, 33 and 36) 20,618,242 287,626,313 Due to related parties (Notes 22 and 33) 49,577,503 60,090,825 Income tax payable 5,204,019 18,736,456 Current portion of: Long-term debts (Notes 19, 22 and 33) 2,393,871,767 2,249,517,382 Derivative liabilities (Note 33) 85,423,548 –
Total Current Liabilities 10,249,613,201 9,320,046,237
Noncurrent Liabilities Long-term debts - net of current portion (Notes 19, 22 and 33) 46,656,000,099 49,240,054,073 Derivative liabilities - net of current portion (Note 33) 153,500,314 – Net retirement and other post-employment benefits (Notes 3 and 29) 659,932,661 1,054,237,256 Provisions and other long-term liabilities (Notes 3, 13 and 20) 1,150,385,989 756,877,725
Total Noncurrent Liabilities 48,619,819,063 51,051,169,054 Total Liabilities 58,869,432,264 60,371,215,291
(Forward)

*SGVMG300344*
- 2 -
December 31 2012 2011
Equity Equity attributable to equity holders of the Parent Company:
Preferred stock (Note 21) P=93,750,000 P=93,750,000 Common stock (Note 21) 18,750,000,000 18,750,000,000 Common shares in employee trust account (Notes 21 and 32) (358,429,306) (372,272,723) Additional paid-in capital (Note 32) 6,277,865,786 6,266,966,828 Equity reserve (Note 21) (3,706,430,769) (3,706,430,769) Net accumulated unrealized gain on available-for-sale
investments (Note 10) 111,522,725 91,758,915 Cumulative translation adjustments (138,589,991) 592,534 Retained earnings (Notes 2 and 21) 12,331,621,322 6,304,695,114
33,361,309,767 27,429,059,899 Non-controlling interest (Note 21) 2,072,545,121 2,217,541,594
Total Equity 35,433,854,888 29,646,601,493
TOTAL LIABILITIES AND EQUITY P=94,303,287,152 P=90,017,816,784 See accompanying Notes to Consolidated Financial Statements.

*SGVMG300344*
ENERGY DEVELOPMENT CORPORATION (A Subsidiary of Red Vulcan Holdings Corporation) AND SUBSIDIARIES CONSOLIDATED STATEMENTS OF INCOME Years Ended December 31
2012
2011(As Adjusted,
Note 6)
2010(As Adjusted,
Note 6)
REVENUES Sale of electricity (Notes 3, 38, 39, 40 and 41) P=28,368,552,055 P=24,539,607,457 P=22,944,227,877 Sale of steam (Notes 3 and 37) – – 1,208,696,413 28,368,552,055 24,539,607,457 24,152,924,290
COSTS OF SALES OF ELECTRICITY AND STEAM (Notes 11, 13, 22, 23, 25 and 41) (10,125,177,154) (10,569,874,768) (9,465,844,724)
GENERAL AND ADMINISTRATIVE EXPENSES (Notes 9, 11, 13, 16, 22, 24 and 25) (4,781,244,120) (4,660,365,401) (4,691,040,150)
FINANCIAL INCOME (EXPENSE) Interest income (Notes 8, 26 and 33) 364,640,989 390,212,719 347,689,037 Interest expense (Notes 18, 19, 26 and 33) (3,703,648,469) (4,106,516,315) (3,708,457,266) (3,339,007,480) (3,716,303,596) (3,360,768,229)
OTHER INCOME (CHARGES) Foreign exchange gains (losses) - net (Note 27) 1,053,466,774 (111,052,329) (15,895,046) Derivative gains - net (Note 33) 36,160 108,319,377 436,998,854 Loss on impairment of property, plant and equipment
(Notes 3 and 13) – (4,998,608,008) (3,390,000,000) Miscellaneous - net (Notes 10, 13, and 28) (161,749,839) (11,320,264) 1,257,344,824 891,753,095 (5,012,661,224) (1,711,551,368)
INCOME BEFORE INCOME TAX FROM CONTINUING OPERATIONS 11,014,876,396 580,402,468 4,923,719,819
BENEFIT FROM (PROVISION FOR) INCOME TAX (Note 30)
Current (433,838,464) (421,569,578) (404,660,851) Deferred (302,826,491) 537,191,407 (297,961,636) (736,664,955) 115,621,829 (702,622,487)
NET INCOME FROM CONTINUING OPERATIONS 10,278,211,441 696,024,297 4,221,097,332
NET INCOME (LOSS) FROM DISCONTINUED OPERATIONS (Note 6) 97,495,445 (81,238,483) 173,978,533
NET INCOME P=10,375,706,886 P=614,785,814 P=4,395,075,865
Net income (loss) attributable to: Equity holders of the Parent Company P=8,659,426,208 (P=167,192,156) P=4,115,747,261 Non-controlling interest 1,716,280,678 781,977,970 279,328,604 P=10,375,706,886 P=614,785,814 P=4,395,075,865
Basic/Diluted Earnings (Loss) Per Share for:
Net Income (Loss) from Continuing Operations Attributable to Equity Holders of the Parent Company (Note 31) P=0.456 (P=0.005) P=0.210
Net Income (Loss) Attributable to Equity Holders of the Parent Company (Note 31) P=0.461 (P=0.009) P=0.219
See accompanying Notes to Consolidated Financial Statements.

*SGVMG300344*
ENERGY DEVELOPMENT CORPORATION (A Subsidiary of Red Vulcan Holdings Corporation) AND SUBSIDIARIES CONSOLIDATED STATEMENTS OF COMPREHENSIVE INCOME Years Ended December 31 2012 2011 2010
NET INCOME P=10,375,706,886 P=614,785,814 P=4,395,075,865
OTHER COMPREHENSIVE INCOME (LOSS) Cumulative translation adjustments on hedging
transactions, net of income tax amounting to P=16,047,386 in 2012 (Notes 30 and 33) (144,426,476) – –
Cumulative translation adjustments on foreign subsidiaries 5,243,951 (777,466) 1,370,000
Changes in fair value of available-for-sale investments recognized in equity (Notes 10 and 33) 19,763,810 (27,724,193) 6,541,474
Net unrealized gain removed from equity and recognized in profit or loss (Notes 10 and 33) – (235,689) –
(119,418,715) (28,737,348) 7,911,474
TOTAL COMPREHENSIVE INCOME P=10,256,288,171 P=586,048,466 P=4,402,987,339
Total comprehensive income (loss) attributable to: Equity holders of the Parent Company P=8,540,007,493 (P=195,929,504) P=4,123,658,735 Non-controlling interest 1,716,280,678 781,977,970 279,328,604 P=10,256,288,171 P=586,048,466 P=4,402,987,339 See accompanying Notes to Consolidated Financial Statements.

*SGVMG300344*
ENERGY DEVELOPMENT CORPORATION (A Subsidiary of Red Vulcan Holdings Corporation) AND SUBSIDIARIES CONSOLIDATED STATEMENTS OF CHANGES IN EQUITY FOR THE YEARS ENDED DECEMBER 31, 2012, 2011 AND 2010 Equity Attributable to Equity Holders of the Parent Company
Preferred Stock
(Note 21)
Common Stock
(Note 21)
Common Shares in
Employee Trust Account
(Note 21)
Additional Paid-in Capital
Equity Reserve
(Note 21)
Net Accumulated
Unrealized Gain on Available-
for-sale Investments
(Note 10)
Cumulative Translation
Adjustments Retained Earnings (Note 21) Subtotal
Non-controlling Interest
(Note 21) Total Equity
Balances, December 31, 2009 P=93,750,000 P=18,750,000,000 (P=391,643,364) P=6,262,027,052 (P=3,706,430,769) P=113,177,323 P=– P=7,669,894,141 P=28,790,774,383 P=1,529,761,117 P=30,320,535,500 Total comprehensive income: Net income – – – – – – – 4,115,747,261 4,115,747,261 279,328,604 4,395,075,865
Changes in fair value of available-for-sale investments recognized in equity (Notes 10 and 33) – –
– – – 6,541,474
–
– 6,541,474
– 6,541,474 Cumulative translation adjustment on
foreign subsidiaries – – – – – – 1,370,000 – 1,370,000 – 1,370,000 Total other comprehensive income – – – – – 6,541,474 1,370,000 – 7,911,474 – 7,911,474 – – – – – 6,541,474 1,370,000 4,115,747,261 4,123,658,735 279,328,604 4,402,987,339 Cash dividends (Note 21) – – – – – – – (2,256,333,333) (2,256,333,333) – (2,256,333,333)Cash dividends to non-controlling interest (Note 21) – –
– – – –
– – – (240,000,000) (240,000,000)
Share-based payment (Notes 22 and 32) – – 12,423,579 3,260,796 – – – – 15,684,375 – 15,684,375 Deferred tax effect of share-based payment (Notes 30 and 32) – – –
811,435 – – – – 811,435 – 811,435
Documentary stamp tax on: Preferred shares subscription – – – – – – – (131,250) (131,250) – (131,250)Common shares subscription – – – – – – – (4,573,009) (4,573,009) – (4,573,009)
Balances, December 31, 2010 P=93,750,000 P=18,750,000,000 (P=379,219,785) P=6,266,099,283 (P=3,706,430,769) P=119,718,797 P=1,370,000 P=9,524,603,810 P=30,669,891,336 P=1,569,089,721 P=32,238,981,057
(Forward)

- 2 -
*SGVMG300344*
Equity Attributable to Equity Holders of the Parent Company
Preferred Stock
(Note 21)
Common Stock
(Note 21)
Common Shares in
Employee Trust Account
(Note 21)
Additional Paid-in Capital
Equity Reserve
(Note 21)
Net Accumulated
Unrealized Gain on Available-
for-sale Investments
(Note 10)
Cumulative Translation
Adjustments Retained Earnings (Note 21) Subtotal
Non-controlling Interest
(Note 21) Total Equity Balances, January 1, 2011, as previously
reported P=93,750,000 P=18,750,000,000 (P=379,219,785) P=6,266,099,283 (P=3,706,430,769) P=119,718,797 P=1,370,000 P=9,524,603,810 P=30,669,891,336 P=1,569,089,721 P=32,238,981,057 Effect of voluntary change in accounting
policy (Note 2) – – – – – –
– 155,072,607 155,072,607 – 155,072,607
Balances, January 1, 2011, as restated 93,750,000 18,750,000,000 (379,219,785) 6,266,099,283 (3,706,430,769) 119,718,797 1,370,000 9,679,676,417 30,824,963,943 1,569,089,721 32,394,053,664 Total comprehensive income: Net income (loss) – – – – – – – (167,192,156) (167,192,156) 781,977,970 614,785,814
Changes in fair value of available-for-sale investments recognized in equity (Notes 10 and 33) – –
– – – (27,724,193)
–
– (27,724,193)
– (27,724,193)Cumulative translation adjustment on
foreign subsidiaries – – – – – – (777,466) – (777,466) – (777,466)Net unrealized gain removed from
equity and recognized in profit or loss (Notes 10 and 33) – –
– – – (235,689)
–
– (235,689)
– (235,689) Total other comprehensive income – – – – – (27,959,882) (777,466) – (28,737,348) – (28,737,348) – – – – – (27,959,882) (777,466) (167,192,156) (195,929,504) 781,977,970 586,048,466 Cash dividends (Note 21) – – – – – – – (3,007,500,000) (3,007,500,000) – (3,007,500,000)Cash dividends to non-controlling interest (Note 21) – –
– – – –
–
– – (333,815,244) (333,815,244)
Effect of subsidiary’s issuance of and declaration of dividends on preferred shares to non-controlling interest (Note 21) – –
– – – –
– (200,289,147) (200,289,147) 200,289,147 – Share-based payment (Notes 22 and 32) – – 6,947,062 1,859,813 – – – – 8,806,875 – 8,806,875 Deferred tax effect of share-based payment (Notes 30 and 32) – – – (992,268) – – – – (992,268) – (992,268)
Balances, December 31, 2011 P=93,750,000 P=18,750,000,000 (P=372,272,723) P=6,266,966,828 (P=3,706,430,769) P=91,758,915 P=592,534 P=6,304,695,114 P=27,429,059,899 P=2,217,541,594 P=29,646,601,493 (Forward)

- 3 -
*SGVMG300344*
Equity Attributable to Equity Holders of the Parent Company
Preferred Stock
(Note 21)
Common Stock
(Note 21)
Common Shares in
Employee Trust Account
(Note 21)
Additional Paid-in Capital
Equity Reserve
(Note 21)
Net Accumulated
Unrealized Gain on Available-
for-sale Investments
(Note 10)
Cumulative Translation
Adjustments
Retained Earnings (Note 21) Subtotal
Non-controlling Interest
(Note 21) Total Equity Balances, December 31, 2011 P=93,750,000 P=18,750,000,000 (P=372,272,723) P=6,266,966,828 (P=3,706,430,769) P=91,758,915 P=592,534 P=6,304,695,114 P=27,429,059,899 P=2,217,541,594 P=29,646,601,493
Total comprehensive income (loss): Net income – – – – – – – 8,659,426,208 8,659,426,208 1,716,280,678 10,375,706,886 Changes in fair value of available- for-sale investments recognized in equity (Notes 10 and 24) – – – – – 19,763,810 – – 19,763,810 – 19,763,810 Cumulative translation adjustments on hedging transactions, net of income tax amounting to P=16,047,386 (Note 33) – – – – – – (144,426,476) – (144,426,476) – (144,426,476) Cumulative translation adjustments on foreign subsidiaries – – – – – – 5,243,951 – 5,243,951 – 5,243,951 Total other comprehensive income – – – – – 19,763,810 (139,182,525) – (119,418,715) – (119,418,715) – – – – – 19,763,810 (139,182,525) 8,659,426,208 8,540,007,493 1,716,280,678 10,256,288,171 Cash dividends (Note 21) – – – – – – – (2,632,500,000) (2,632,500,000) – (2,632,500,000)Cash dividends to non-controlling
interest – – – – – – – – – (1,862,533,076) (1,862,533,076)Share-based payment (Notes 22 and 32) – – 13,843,417 10,898,958 – – – – 24,742,375 – 24,742,375 Investments from non-controlling shareholders in PT EDC Indonesia and PT EDC Panas Bumi Indonesia and EDC Quellaapacheta (Note 1) – – – – – – – –
–
1,255,925
1,255,925
Balances, December 31, 2012
P=93,750,000
P=18,750,000,000 (P=358,429,306)
P=6,277,865,786 (P=3,706,430,769)
P=111,522,725 (P=138,589,991)
P=12,331,621,322
P=33,361,309,767
P=2,072,545,121
P=35,433,854,888
See accompanying Notes to Consolidated Financial Statements.

*SGVMG300344*
ENERGY DEVELOPMENT CORPORATION (A Subsidiary of Red Vulcan Holdings Corporation) AND SUBSIDIARIES CONSOLIDATED STATEMENTS OF CASH FLOWS Years Ended December 31 2012 2011 2010
CASH FLOWS FROM OPERATING ACTIVITIES Income before income tax from continuing operations P=11,014,876,396 P=580,402,468 P=4,923,719,819 Income (loss) before income tax from discontinued operations (Note 6) 139,279,207 (89,224,109) 248,540,761 Adjustments for: Interest expense (Notes 6 and 26) 3,703,648,469 4,106,760,462 3,708,457,266 Depreciation and amortization (Notes 6, 13 14, 23 and 24) 3,578,627,171 3,441,874,497 3,445,004,630
Unrealized foreign exchange gains - net (Notes 5, 6 and 27) (1,217,556,247) (161,645,620) (168,978,452) Interest income (Notes 6, 8, 26 and 33) (364,640,989) (390,212,719) (347,695,016) Provision for doubtful accounts - net (Notes 16 and 24) 203,286,078 308,945,159 56,993,821
Loss (gain) on: Debt extinguishment (Notes 19 and 28) 188,145,763 197,898,124 – Disposals and retirements of property, plant and equipment
(Note 28) 455,016 19,962,107 401,388,002 Early redemption of available-for-sale investments
(Notes 10 and 28) – (271,292) – Loss on (recovery of) impairment on property, plant and equipment of NNGP (Notes 3, 13 and 28) (63,614,885) 4,998,608,008 3,390,000,000 Retirement and other post-employment benefits costs (income) [Notes 25 and 29] (42,858,229) 50,797,100 386,578,060 Share-based benefit cost (Notes 22 and 32) 24,742,375 8,806,875 15,601,571
Unwinding of discount on NNGP’s provision for rehabilitation and restoration costs (Note 12) 4,221,982 1,484,139 – Unrealized derivative losses (gains) - net (Note 33) (248,760) – 9,598,487
“Day 1” loss on security deposits – 7,552,372 – Recovery of impairment loss on input value-added tax (VAT) claims for refund/tax credits (Notes 16 and 28) – – (1,638,884,447)
Operating income before working capital changes 17,168,363,347 13,081,737,571 14,430,324,502 Decrease (increase) in: Trade and other receivables (721,533,010) 1,212,951,046 280,053,478
Due from related parties 7,812 (7,812) – Parts and supplies inventories 52,737,319 (529,996,999) (605,220,377) Other current assets 146,548,819 (37,849,179) (142,186,723) Increase (decrease) in: Trade and other payables 1,340,265,541 1,507,522,135 1,645,853,895 Royalty fee payable (277,953,101) (298,490,087) (312,323,998) Due to related parties (64,093,934) (275,559,659) (172,553,945) Retirement and other post-employment benefits contributions (Note 29) (351,446,366) (303,696,889) (327,566,659) Cash generated from operations 17,292,896,427 14,356,610,127 14,796,380,173 Interest and other financing charges paid (4,108,361,868) (4,128,372,948) (3,592,715,769) Income tax paid (563,089,655) (444,345,425) (199,551,244) Net cash flows from operating activities 12,621,444,904 9,783,891,754 11,004,113,160
(Forward)

*SGVMG300344*
- 2 - Years Ended December 31 2012 2011 2010
CASH FLOWS FROM INVESTING ACTIVITIES Acquisitions of property, plant and equipment (Note 13) (P=6,663,047,373) (P=9,230,304,828) (P=5,815,310,918) Proceeds from revenue generated from testing of property, plant and
equipment (Note 13) 520,417,469 37,981,304 – Interest received 365,288,722 381,250,687 346,163,528 Purchase of available-for-sale investments (162,093,722) – – Proceeds from retirement of property, plant and equipment 5,426,167 – – Proceeds from early redemption of available-for-sale investments
(Note 10) – 4,747,050 – Payments for acquisition of Bacon-Manito Geothermal Power Plants (Note 5) – – (1,279,725,000) Increase in: Exploration and evaluation assets (517,025,999) (187,531,880) (132,354,844) Other noncurrent assets (1,698,256,608) (1,526,225,270) (608,743,701) Net cash flows used in investing activities (8,149,291,344) (10,520,082,937) (7,489,970,935)
CASH FLOWS FROM FINANCING ACTIVITIES Payments of:
Long-term debts (Note 19) (8,287,843,366) (6,108,335,704) (19,255,755,199) Dividends (Note 21) (4,495,033,076) (3,341,315,244) (2,496,333,333)
Loan payable (Note 26) – (175,000,000) (452,950,000) Proceeds from: Long-term debts (Note 19) 6,934,833,050 16,612,500,000 13,058,750,000
Loan payable – – 638,840,000 Increase (decrease) in provisions and other long-term liabilities 306,762,368 58,744,924 (38,012,335) Net cash flows from (used in) financing activities (5,541,281,024) 7,046,593,976 (8,545,460,867)
NET INCREASE (DECREASE) IN CASH AND CASH EQUIVALENTS (1,069,127,464) 6,310,402,793 (5,031,318,642)
EFFECT OF FOREIGN EXCHANGE RATE CHANGES ON CASH AND CASH EQUIVALENTS (4,135,296) 25,079,038 (31,653,383)
CASH AND CASH EQUIVALENTS AT BEGINNING OF YEAR 12,493,406,963 6,157,925,132 11,220,897,157
CASH AND CASH EQUIVALENTS AT END OF YEAR (Note 8) P=11,420,144,203 P=12,493,406,963 P=6,157,925,132
See accompanying Notes to Consolidated Financial Statements.

*SGVMG300344*
ENERGY DEVELOPMENT CORPORATION (A Subsidiary of Red Vulcan Holdings Corporation) AND SUBSIDIARIES NOTES TO CONSOLIDATED FINANCIAL STATEMENTS 1. Corporate Information and Authorization for Issuance of the Consolidated Financial
Statements
Corporate Structure Energy Development Corporation (the “Parent Company” or “EDC”) is a subsidiary of Red Vulcan Holdings Corporation (Red Vulcan). The Parent Company and its subsidiaries (collectively hereinafter referred to as the “Company”), were separately incorporated and registered with the Philippine Securities and Exchange Commission (SEC), except for its foreign subsidiaries. Below are the Parent Company’s ownership interests in its subsidiaries: Percentage of Ownership December 31, 2012 December 31, 2011
Direct Indirect Direct Indirect
EDC Drillco Corporation (EDC Drillco) 100.00 – 100.00 –
EDC Geothermal Corp. (EGC) 100.00 – 100.00 – Green Core Geothermal Inc. (GCGI) – 100.00 – 100.00 Bac-Man Geothermal Inc. (BGI) – 100.00 – 100.00 Unified Leyte Geothermal Energy Inc. (ULGEI) – 100.00 – 100.00 Southern Negros Geothermal, Inc. (SNGI)*** – 100.00 – 100.00 EDC Mindanao Geothermal Inc. (EMGI)*** – 100.00 – 100.00 Bac-Man Energy Development Corporation (BEDC)*** –
100.00
–
100.00
Kayabon Geothermal, Inc. (KGI)*** – 100.00 – 100.00 Energy Development (EDC) Corporation Chile
Limitada [EDC Chile Limitada] 99.99
0.01 99.99
0.01
EDC Holdings International Limited (EHIL)** 100.00 – 100.00 – Energy Development Corporation Hong Kong Limited (EDC HKL) ** – 100.00 – 100.00
EDC Chile Holdings SPA* – 100.00 – – EDC Geotermica Chile* – 100.00 – –
EDC Peru Holdings S.A.C. * – 100.00 – – EDC Geotermica Peru S.A.C. * – 100.00 – –
EDC Quellaapacheta* – 70.00 – – PT EDC Indonesia* – 95.00 – – PT EDC Panas Bumi Indonesia* – 95.00 – –
EDC Wind Energy Holdings, Inc. (EWEHI) 100.00 – 100.00 – EDC Burgos Wind Power Corporation (EBWPC) – 100.00 33.33 66.67 EDC Pagudpud Wind Power Corporation
(EPWPC)* –
100.00 –
–
First Gen Hydro Power Corporation (FG Hydro) 60.00 – 60.00 – *Incorporated in 2012 and has not yet started commercial operations. **Incorporated in 2011and serves as an investment holding company. ***Incorporated in 2011 and has not yet started commercial operations.

- 2 -
*SGVMG300344*
History of Ownership Beginning December 13, 2006, the common shares of EDC were listed and traded in the Philippine Stock Exchange (PSE). Up to November 2007, EDC was controlled by the Philippine National Oil Company (PNOC), a government-owned and controlled corporation, and the PNOC EDC Retirement Fund.
On November 29, 2007, PNOC and PNOC EDC Retirement Fund sold their combined interests in EDC to Red Vulcan (a Philippine corporation). Red Vulcan was then a wholly owned subsidiary of First Gen Corporation (First Gen, a publicly listed Philippine corporation) through Prime Terracota Holdings Corporation (Prime Terracota, a Philippine corporation). First Gen’s indirect interest in EDC consists of 6.0 billion common shares and 7.5 billion preferred shares. Control was then established through First Gen’s 60% indirect voting interest in EDC. Meanwhile, First Philippine Holdings Corporation (First Holdings, a publicly listed Philippine corporation) directly owns 66.2% of the common shares of First Gen. Accordingly, First Holdings became then the ultimate parent of the Company.
On May 12, 2009, First Gen’s indirect voting interest in Red Vulcan was reduced to 45% with the balance taken up by Lopez Inc. Retirement Fund (40%) and Quialex Realty Corporation (15%) through the issuance of preferred shares by Prime Terracota. As a result of this transaction, Prime Terracota replaced First Holdings as the ultimate parent of EDC effective May 12, 2009.
Nature of Operations The Parent Company operates 12 geothermal energy projects in five Geothermal Service Contract (GSC) areas, namely: 1. Bacon-Manito Geothermal Project (BMGP); 2. Mt. Apo Geothermal Project (MGP); 3. Northern Negros Geothermal Project (NNGP); 4. Southern Negros Geothermal Project (SNGP); and 5. Tongonan Geothermal Project (TGP). These GSCs are entered into with the Department of Energy (DOE) pursuant to the provisions of Presidential Decree 1442 (P.D. 1442). These GSCs were replaced by Geothermal Renewable Energy Service Contracts (GRESCs) on October 23, 2009 in accordance with the provisions of R.A. 9513 or the Renewable Energy Act of 2008 (RE Law) [see Note 36].
Geothermal steam produced is delivered to the National Power Corporation (NPC) and fed to the Parent Company’s and subsidiary’s power plants to produce electricity. EDC sells steam and electricity to NPC under the Steam Sales Agreements (SSAs) and Power Purchase Agreements (PPAs), respectively (see Notes 37 and 38). Meanwhile, GCGI and BGI sells electricity to bilateral customers under the Power Supply Agreements (PSAs) [see Note 40].
Also, until October 2012, the Parent Company had drilling activities in Papua New Guinea (see Note 6).
Subsidiaries EDC Drillco EDC Drillco is a company incorporated on September 28, 2009 to act as an independent service contractor, consultant, specialized technical adviser for well construction and drilling, and other related activities. As of December 31, 2012, EDC Drillco remained non-operating.

- 3 -
*SGVMG300344*
EGC EGC, originally named as First Luzon Geothermal Energy Corporation, is a special-purpose company incorporated on April 9, 2008 to participate in the bid for another local power plant. The bid was won by and awarded to another local entity. Thereafter, EGC became an investment holding company of its wholly owned subsidiaries, namely GCGI, BGI, ULGEI, SNGI, EMGI, BEDC and KGI. EGC also has a 0.01% stake in EDC Chile Limitada.
On March 8, 2011, the Philippine SEC approved the change of its corporate name to EDC Geothermal Corp.
Further details on EGC’s wholly owned subsidiaries follow:
§ GCGI was incorporated on June 22, 2009 with primary activities on power generation, transmission, distribution, and other energy related businesses. GCGI is currently operating the 192.5 Megawatt (MW) Palinpinon and 112.5 MW Tongonan 1 geothermal power plants in Negros Oriental and Leyte, respectively, following its successful acquisition from the Power Sector Assets and Liabilities Management Corporation (PSALM) in 2009.
§ BGI was incorporated on April 7, 2010 primarily to carry on the general business of generating, transmitting, and/or distributing energy. BGI has successfully acquired the 150 MW Bac-Man Geothermal Power Plants (BMGPP) from PSALM in 2010. BMGPP is currently under rehabilitation to restore its capacity and reliability.
§ ULGEI is a company incorporated on June 23, 2010; SNGI and EMGI are companies incorporated on February 4, 2011; and BEDC and KGI are companies incorporated on September 22 and 28, 2011, respectively. These are Philippine companies incorporated to carry on the general business of generating, transmitting, and/or distributing energy derived from any and all forms, types and kinds of energy sources for lighting and power purposes and whole-selling the electric power to power corporations, public electric utilities and electric cooperatives. As of December 31, 2012, ULGEI, SNGI, EMGI, BEDC and KGI remained non-operating.
EHIL and EDC HKL EHIL was incorporated on August 17, 2011 in British Virgin Islands and will serve as an investment holding company of EDC’s international subsidiaries. Under EHIL is EDC HKL, which was incorporated on November 22, 2011 in Hong Kong. The following entities are the subsidiaries under EDC HKL: § EDC Chile Holdings SPA, which was incorporated on January 13, 2012 in Santiago,
Chile, is a wholly owned subsidiary of EDC HKL and is the holding company of EDC Geotermica Chile, a wholly owned foreign subsidiary that was also incorporated on January 13, 2012 in Santiago, Chile.
§ EDC Peru Holdings S.A.C., incorporated on January 19, 2012 in Lima, Peru is a 99.9%-
owned subsidiary of EDC HKL. EDC Peru Holdings S.A.C. holds 99.9% stake in EDC Geotermica Peru S.A.C., which was also incorporated on January 19, 2012 in Lima, Peru. EHIL owns the remaining 0.1% stake in EDC Peru Holdings S.A.C. and EDC Geotermica Peru S.A.C. On July 17, 2012, EDC Quellaapacheta was incorporated in Lima, Peru as a 70%-owned subsidiary of EDC Geotermica Peru S.A.C.

- 4 -
*SGVMG300344*
§ On July 9, 2012, PT EDC Indonesia and PT EDC Panas Bumi Indonesia were incorporated in Jakarta Pusat, Indonesia as 95%-owned subsidiaries of EDC HKL.
As of December 31, 2012, all subsidiaries of EDC HKL remained non-operating. EWEHI EWEHI is a holding company incorporated on April 15, 2010. The following entities are the wholly owned subsidiaries of EWEHI:
§ EBWPC is a company incorporated on April 13, 2010 to carry on the general business of generating, transmitting, and/or distributing energy. In September 2012, following EWEHI’s acquisition of 1,249,500 shares of EBWPC, representing 33.33% ownership interest, from EDC for P=141.4 million, EBWPC became a wholly owned subsidiary of EWEHI. EBPWC is currently developing the 86 MW wind energy concession in Burgos, Ilocos Norte.
§ EPWPC is a company incorporated on February 29, 2012 to carry on the general business of generating, transmitting, and/or distributing energy. As of December 31, 2012, EPWPC remained non-operating.
FG Hydro On October 20 and November 17, 2008, in line with its objective of focusing on renewable energy, the Parent Company acquired a total of 60% interest in FG Hydro from First Gen. FG Hydro operates the 132 MW Pantabangan and Masiway Hydro-Electric Power Plants (PAHEP/MAHEP) located in Nueva Ecija, Philippines. FG Hydro buys from and sells electricity to the Wholesale Electricity Spot Market (WESM) and to various privately-owned distribution utilities (DUs) under the PSAs and Power Supply Contracts (PSCs). EDC Chile Limitada EDC Chile Limitada is a limited liability company incorporated on February 11, 2010 in Santiago, Chile with the purpose of exploring, evaluating and extracting any mineral or substance to generate geothermal energy. The Chilean Ministry of Energy awarded to EDC Chile Limitada the geothermal exploration concessions of Newen on January 10, 2012, and of San Rafael and Batea, both on January 19, 2012.
Corporate Address In November 2011, the Parent Company changed its address to One Corporate Centre, Julia Vargas Avenue corner Meralco Avenue, Ortigas Centre, Pasig City from Merritt Road, Fort Bonifacio, Taguig City. Authorization for Issuance of the Consolidated Financial Statements The consolidated financial statements were reviewed and recommended for approval by the Audit and Governance Committee to the Board of Directors (BOD) on February 14, 2013. The same consolidated financial statements were also approved and authorized for issuance by the BOD on February 20, 2013.
2. Basis of Preparation
The consolidated financial statements have been prepared on a historical cost basis, except for derivative instruments and available-for-sale (AFS) investments that have been measured at fair value. The consolidated financial statements are presented in Philippine peso (Peso), which is the Parent Company’s functional currency. All values are rounded to the nearest Peso, except when otherwise indicated.

- 5 -
*SGVMG300344*
Statement of Compliance
The consolidated financial statements of the Company have been prepared in accordance with Philippine Financial Reporting Standards (PFRS) issued by the Financial Reporting Standards Council.
Changes in Accounting Policies The accounting policies adopted are consistent with those of the previous financial year except for the following amended PFRSs, which were adopted as of January 1, 2012:
• PFRS 7, Financial Instruments: Disclosures - Transfers of Financial Assets (Amendments)
The amendments require additional disclosures about financial assets that have been transferred but not derecognized to enhance the understanding of the relationship between those assets that have not been derecognized and their associated liabilities. In addition, the amendments require disclosures about continuing involvement in derecognized assets to enable users of financial statements to evaluate the nature of, and risks associated with, the entity’s continuing involvement in those derecognized assets. The amendments have no impact on the Company’s financial position or performance.
• Philippine Accounting Standards (PAS) 12, Income Taxes - Deferred Tax: Recovery of Underlying Assets (Amendments) This amendment to PAS 12 clarifies the determination of deferred tax on investment property measured at fair value. The amendment introduces a rebuttable presumption that the carrying amount of investment property measured using the fair value model in PAS 40, Investment Property, will be recovered through sale and, accordingly, requires that any related deferred tax should be measured on a ‘sale’ basis. The presumption is rebutted if the investment property is depreciable and it is held within a business model whose objective is to consume substantially all of the economic benefits in the investment property over time (‘use’ basis), rather than through sale. Furthermore, the amendment introduces the requirement that deferred tax on non-depreciable assets measured using the revaluation model in PAS 16, Property, Plant and Equipment, always be measured on a sale basis of the asset. The amendments have no impact on the Company’s financial position or performance.
Voluntary Change in Accounting Policy Prior to 2011, the Company accounted for rig consumables as direct expense upon purchase since these are primarily intended for immediate use. Over the years, the Company has accumulated a large stock of unused rig consumables. As a result, starting January 1, 2011, the Company adopted the policy of recognizing rig consumables as inventories. PAS 8, Accounting Policies, Changes in Accounting Estimates and Errors, requires retrospective application for a change in accounting policy, except when it is impracticable to determine period-specific effects. If retrospective application is impracticable, the entity shall apply the new accounting policy at the beginning of the earliest period for which retrospective application is practicable. Because prior to January 1, 2011, the Company does not monitor the unused portion of rig consumable, management determined that it is impracticable to establish the balance of rig consumables in prior years. Accordingly, the effect of the voluntary change in accounting policy was presented as an adjustment to the opening balance of 2011 retained earnings. As at January 1, 2011, the voluntary change in accounting policy resulted to an increase in parts and supplies inventories, retained earnings and deferred tax liability amounting to P=172.3 million, P=155.1 million and P=17.2 million, respectively (see Notes 11 and 30). The effect of the voluntary

- 6 -
*SGVMG300344*
change in accounting policy resulted to an increase in parts and supplies inventories and net income amounting to P=19.7 million and P=17.7 million, respectively, and decrease in loss per share by P=0.001 per share for the year ended December 31, 2011.
3. Significant Accounting Judgments, Estimates and Assumptions
The preparation of the consolidated financial statements requires management to make judgments, estimates and assumptions that affect the reported amounts of revenues, expenses, assets and liabilities, and the disclosure of contingent liabilities, at the financial reporting date. However, uncertainty about these assumptions and estimates could result in outcomes that could require material adjustments to the carrying amounts of the assets or liabilities in the future.
Judgments In the process of applying the Company’s accounting policies, management has made the following judgments, apart from those involving estimates, which have the most significant effect on the amounts recognized in the consolidated financial statements:
Functional Currency The Parent Company’s transactions are denominated or settled in various currencies such as the Peso, United States dollar (US$), and Japanese yen (JPY). The Parent Company has determined that its functional currency is the Peso, which is the currency that most faithfully represents the economic substance of its underlying transactions, events and conditions. Discontinued Operations In October 2012, the Company has completed its contract with Lihir Gold Ltd. (Lihir) in Papua New Guinea for the provision of drilling services. In line with its current strategy, the Company will no longer engage in drilling activities but will maintain its two major segments - electricity and steam. Management considered that the drilling operations met the definition of discontinued operations, which is a component that has been terminated and is comprised of operations and cash flows that can be clearly distinguished operationally and for financial reporting purposes, from the rest of the Company. Classification of Financial Instruments On initial recognition, the financial instruments, or its component parts, are classified either as a financial asset, a financial liability or an equity instrument in accordance with the substance of the contractual arrangement and the definition of a financial asset, a financial liability or an equity instrument. The substance of a financial instrument, rather than its legal form, governs its classification in the consolidated statement of financial position. In addition, the Company classifies financial assets by evaluating among others, whether the asset is quoted or not in an active market. Included in the evaluation on whether a financial asset is quoted in an active market is the determination on whether quoted prices are readily and regularly available, and whether those prices represent actual and regularly occurring market transactions on an arm’s-length basis.
The classification of financial assets and financial liabilities of the Company are presented in Note 33.
Deferred Revenue on Stored Energy Under its addendum agreements with NPC, the Parent Company has a commitment to NPC with respect to certain volume of stored energy that NPC may lift for a specified period, provided that the Parent Company is able to generate such energy over and above the nominated energy for each

- 7 -
*SGVMG300344*
given year in accordance with the related PPAs. The Company has made a judgment based on historical information that the probability of future liftings by NPC from the stored energy is remote and accordingly has not deferred any portion of the collected revenues. The stored energy commitments are, however, disclosed in Note 34 to the consolidated financial statements. Operating Leases The PPAs and SSAs of the Parent Company qualify as a lease on the basis that the Company sells all its outputs to NPC/PSALM and, in the case of the SSAs, the agreement calls for a take-or-pay arrangement where payment is made principally on the basis of the availability of the steam field facilities and not on actual steam deliveries. This type of arrangement is determined to be an operating lease where a significant portion of the risks and rewards of ownership of the assets are retained by the Company since it does not include transfer of the Company’s assets. Accordingly, the steam field facilities and power plant assets are recorded as part of the cost of property, plant and equipment and the capacity fees billed to NPC/PSALM are recorded as operating revenue based on the terms of the PPAs and SSAs. The Company has also entered into commercial property leases where it has determined that the lessor retains all the significant risks and rewards of ownership of these properties and has classified the leases as operating leases (see Note 34).
Estimates and Assumptions The key assumptions concerning the future and other key sources of estimation uncertainty at financial reporting date that have a significant risk of causing a material adjustment to the carrying amounts of assets and liabilities within the next financial year are discussed below: Estimation of Fair Value of Identifiable Net Assets of an Acquiree in a Business Combination In accounting for business combinations, the purchase consideration is allocated to the identifiable assets, liabilities and contingent liabilities (identifiable net assets) on the basis of fair value at the date of acquisition. The determination of fair values requires estimates of economic conditions and other factors. The Company’s transactions which qualified as business combinations are discussed in Note 5.
Fair Values of Financial Instruments
The fair values of financial instruments that are not quoted in active markets are determined using valuation techniques. Where valuation techniques are used to determine fair values, fair values are validated and periodically reviewed by qualified independent personnel. All models are reviewed before they are used, and models are calibrated to ensure that outputs reflect actual data and comparative market prices. To the extent practicable, models use only observable data; however, areas such as credit risk (both own and counterparty), volatilities and correlations require management to make estimates. Changes in assumptions about these factors could affect reported fair value of financial instruments (see Note 33).
Impairment of Receivables The Company maintains an allowance for doubtful accounts at a level that management considers adequate to provide for potential uncollectibility of its trade and other receivables. The Company evaluates specific balances where management has information that certain amounts may not be collectible. In these cases, the Company uses judgment, based on available facts and circumstances, and based on a review of the factors that affect the collectibility of the accounts including, but not limited to, the age and status of the receivables, collection experience and past loss experience. The review is made by management on a continuing basis to identify accounts to be provided with allowance. The specific allowance is re-evaluated and adjusted as additional information received affects the amount estimated.

- 8 -
*SGVMG300344*
In addition to specific allowance against individually significant receivables, the Company also provides a collective impairment allowance against exposures, which, although not specifically identified as requiring a specific allowance, have a greater risk of default than when originally granted. This collective allowance is based on historical default experience. The aggregate carrying amounts of current and noncurrent trade and other receivables are P=4,128.0 million and P=3,411.3 million as of December 31, 2012 and 2011 (Notes 9 and 16). The total amount of impairment losses recognized in 2012, 2011 and 2010 amounted to P=39.0 million, P=126.3 million and P=23.4 million, respectively (see Notes 9, 16 and 24). Impairment of AFS Investments The Company classifies certain financial assets as AFS investments and recognizes movements in their fair value in equity. When the fair value declines, management makes assumptions about the decline in value to determine whether it is an impairment that should be recognized in the consolidated statement of income.
A significant or prolonged decline in the fair value of an investment in an equity instrument below its cost is also being considered by the Company as an objective evidence of impairment. The determination of what is “significant” and “prolonged” requires judgment. The Company considers a decline significant and prolonged, whenever it reaches 20% or more and lasts longer than 12 months, respectively. The Company further evaluates other factors, such as volatility in share price for quoted equities and the discounted cash flows for unquoted equities in determining the amount to be impaired. No impairment loss on AFS investments were recognized in 2012, 2011 and 2010. The total carrying amount of current and noncurrent AFS investments was P=839.5 million and P=694.3 million as of December 31, 2012 and 2011, respectively (see Notes 10 and 33). Estimating Net Realizable Value of Parts and Supplies Inventories The Company measures inventories at net realizable value when such value is lower than cost due to damage, physical deterioration, obsolescence, changes in price levels or other causes. The carrying amounts of parts and supplies inventories as of December 31, 2012 and 2011 amounted to P=3,338.8 million and P=3,355.8 million, respectively (see Note 11). Provision for (reversal of) allowance for inventory obsolescence amounted to (P=88.7 million), P=169.0 million and (P=15.0 million) in 2012, 2011 and 2010, respectively (see Notes 11 and 24). Estimating Useful Lives of Property, Plant and Equipment and Water Rights The Company estimates the useful lives of property, plant and equipment and water rights based on the period over which each asset is expected to be available for use and on the collective assessment of industry practices, internal evaluation and experience with similar arrangements. The estimated useful life is revisited at the end of each financial reporting period and updated if expectations differ materially from previous estimates.
The carrying amount of the property, plant and equipment amounted to P=60,680.2 million and P=57,676.9 million as of December 31, 2012 and 2011, respectively (see Note 13). The carrying amount of water rights amounted to P=1,815.6 million and P=1,911.8 million as of December 31, 2012 and 2011, respectively (see Note 14).
Impairment of Non-financial Assets other than Goodwill and Intangible Asset not yet Available for Use The Company assesses whether there are any indicators of impairment for all non-financial assets, other than goodwill and intangible asset not yet available for use, at each financial reporting date.

- 9 -
*SGVMG300344*
These non-financial assets (property, plant and equipment, water rights and input VAT) are tested for impairment when there are indicators that the carrying amounts may not be recoverable. Where the collection of tax claims is uncertain based on the assessment of management and Company’s legal counsel, the Company provides an allowance for impairment for input VAT. Meanwhile, for the other non-financial assets, when value-in-use calculations are undertaken, management estimates the expected future cash flows from the asset or cash-generating unit (CGU) and discounts such cash flows using the sensitivity analysis of key assumptions to calculate the present value as of the financial reporting date.
In 2011, the Company fully impaired its NNGP assets. The recoverable amount of NNGP is determined based on a value-in-use calculation using the expected cash flow projections. The five-year cash flow projections of the Company used for impairment testing were based on the budget approved by the senior management. The Company uses the Perpetuity Growth Model to determine the terminal value, which accounts for the value of free cash flows that continue in perpetuity beyond the five-year period projection, growing at an assumed constant rate. The assumed growth rate was 4% in 2011 and 2010, which do not exceed the average annual demand growth of 6% and 5% in 2011 and 2010, respectively, for the Visayas power industry market where the unit operates. The pre-tax discount rates used were 10.1% in 2011 and 10.2% in 2010 computed based on the CGU’s weighted average cost of capital. Based on the foregoing, the Company recorded an impairment loss of P=4,998.6 million in 2011 and P=3,390.0 million in 2010 for NNGP’s property, plant and equipment (see Note 13). In February 2012, EDC transferred vacuum pumps from NNGP to the Palinpinon Power Plant owned by GCGI. Since these transferred assets can still be utilized and were included in the CGU of the Palinpinon Power Plant, the Company recognized a corresponding reversal of impairment loss amounting to P=63.6 million, representing the net book value of the assets transferred had no impairment loss been previously recognized (see Note 28). The Company also recorded a provision for impairment of input VAT of P=196.1 million, P=282.9 million and P=54.6 million in 2012, 2011 and 2010, respectively (see Notes 16 and 24).
The carrying amount of property, plant and equipment as of December 31, 2012 and 2011 amounted to P=60,680.2 million and P=57,676.9 million, respectively (see Note 13). The carrying amount of water rights as of December 31, 2012 and 2011 amounted to P=1,815.6 million and P=1,911.8 million, respectively (see Note 14). The carrying amount of input VAT as of December 31, 2012 and 2011 amounted to P=3,750.8 million and P=2,908.6 million, respectively (see Notes 16 and 24). Impairment of Goodwill The Company performs impairment review on goodwill, annually or more frequently, if events or changes in circumstances indicate that the carrying value may be impaired. This requires an estimation of the value-in-use of the CGUs to which goodwill is allocated. Estimating value-in-use requires the Company to estimate the expected future cash flows from the CGUs and discounts such cash flows using weighted average cost of capital to calculate the present value of those future cash flows. The recoverable amounts have been determined based on value-in-use calculation using cash flow projections based on financial budgets approved by senior management of FG Hydro and GCGI covering a five-year period. The post-tax discount rate applied to cash flow projections is 9.0% in 2012 and 9.2% in 2011 for FG Hydro and 8.8% in 2012 and 11.4% in 2011 for GCGI. The cash flows beyond the remaining term of the existing agreements are extrapolated using growth rates of

- 10 -
*SGVMG300344*
4.0% and 3.7% for the years ended December 31, 2012 and 2011, respectively, for FG Hydro and 4.0% for GCGI for the years ended December 31, 2012 and 2011.
Following are the key assumptions used:
• Budgeted Gross Margin
Budgeted gross margin is the average gross margin achieved in the year immediately before the budgeted year, increased for expected efficiency improvements.
• Discount Rate
Discount rate reflects the current market assessment of the risk specific to each CGU. The discount rate is based on the average percentage of the Company’s weighted average cost of capital. This rate is further adjusted to reflect the market assessment of any risk specific to the CGU for which future estimates of cash flows have not been adjusted.
No impairment loss on goodwill was recognized in the consolidated financial statements in 2012, 2011 and 2010. The carrying value of goodwill as of December 31, 2012 and 2011 amounted to P=2,535.1 million (see Note 14). Impairment of Intangible Asset not yet Available for Use The Company’s intangible asset not yet available for use pertains to its Burgos wind energy development costs. The Company performs impairment review on this asset annually irrespective of whether there is any indication of impairment by comparing its carrying amount with its recoverable amount. This impairment review requires an estimation of the value-in-use of the CGUs to which the intangible asset would provide future cash flow. Estimating value-in-use requires the Company to estimate the expected future cash flows from the CGUs and discounts such cash flows using weighted average cost of capital to calculate the present value of those future cash flows. The recoverable amounts have been determined based on value-in-use calculation using cash flow projections based on financial projections by the Business Development Group of EDC covering a 20-year period, which is based on the lower of the expected useful life of the turbines of 20 years and the existing 25-year service contract of the project (see Note 35). The pre-tax discount rate applied to cash flow projections is 8.4% and 11.3% in 2012 and 2011, respectively.
Following are the key assumptions used:
• Feed-in Tariff (FIT) Rate On July 27, 2012, the Energy Regulatory Commission approved the initial FIT rates that shall apply to generation of electricity from renewable energy sources. Particularly, for wind energy, the approved FIT rate amounted to P=8.5 per kwh. Accordingly, the Company used the new FIT rate in the impairment assessment of the Company’s wind energy project development costs. Prior to the issuance of the FIT rate, the Company used FIT rate of P=10.4 per kwh in its 2011 value-in-use estimates.
• Discount Rate
Discount rate reflects the current market assessment of the risk specific to each CGU. The discount rate is based on the average percentage of the weighted average cost of capital for the industry. This rate is further adjusted to reflect the market assessment of any risk specific to the CGU for which future estimates of cash flows have not been adjusted.

- 11 -
*SGVMG300344*
• Growth Rate
The Company used a 40% growth rate based on the Philippine Consumer Price Index (CPI) and 60% growth rate based on the change in dollar to Peso exchange rate. This is consistent with the Natural Resources and Environment Board’s proposed annual FIT escalation rate. The Company assumed an annual 4% increase of CPI based on Philippine average inflation factor as of 2012 and a steady dollar to Peso exchange rate for conservatism.
No impairment loss on intangible asset not yet available for use was recognized in the consolidated financial statements. The carrying value of the intangible asset not yet available for use amounted to P=467.7 million and P=258.4 million as of December 31, 2012 and 2011, respectively (see Note 14). Impairment of Exploration and Evaluation Assets Exploration and evaluation costs are recognized as assets in accordance with PFRS 6, Exploration for and Evaluation of Mineral Resources. Capitalization of these costs is based, to a certain extent, on management’s judgment of the degree to which the expenditure may be associated with finding specific geothermal reserve. The Company determines impairment of projects based on the technical assessment of its resident scientists in various disciplines or based on management’s decision not to pursue any further commercial development of its exploration projects. As of December 31, 2012 and 2011, the carrying amount of capitalized exploration and evaluation costs amounted to P=1,604.1 million and P=1,087.1 million, respectively (see Note 15). Retirement and Other Post-employment Benefits The cost of defined benefits retirement plan and other post-employment medical and life insurance benefits is determined using the projected unit credit method of actuarial valuations. The actuarial valuation involves making assumptions about discount rates, expected rates of return on assets, future salary increases, medical trend rate, mortality and disability rates and employee turnover rates. Due to the long-term nature of these plans, such estimates are subject to significant uncertainty. The net retirement and other post-employment benefits liability as of December 31, 2012 and 2011 amounted to P=659.9 million and P=1,054.2 million, respectively. The detailed information with respect to the Company’s net retirement and other post-employment benefits is presented in Note 29 to the consolidated financial statements.
Provision for Rehabilitation and Restoration Costs In 2009, with the conversion of its GSCs to GRESCs, the Company has made a judgment that the GRESCs are subject to the provision for restoration costs. In determining the amount of provisions for rehabilitation and restoration costs, assumptions and estimates are required in relation to the expected cost to rehabilitate and restore sites and infrastructure when such obligation exists. As of December 31, 2012 and 2011, the Company recognized provision for rehabilitation and restoration costs amounting to P=493.5 million and P=406.8 million, respectively, presented under “Provisions and other long-term liabilities” account in the consolidated statements of financial position (see Note 20).
Provision for Liabilities on Regulatory Assessments and Other Contingencies The Company has pending assessments from various regulatory agencies and pending legal cases. The Company’s estimate of the probable costs for the resolution of these assessments and legal cases has been developed in consultation with in-house and outside legal counsels and is based upon the analysis of the potential outcomes. It is possible, however, that future results of operations could be materially affected by changes in the estimates or in the effectiveness of strategies relating to these proceedings. As of December 31, 2012, provisions for these liabilities amounting to P=185.6 million and P=319.3 million are recorded under “Trade and other payables” (specifically under “Other payables”) account (see Note 17) and “Provision and other long-term

- 12 -
*SGVMG300344*
liabilities” (part of “Others”) account (see Note 20), respectively. Meanwhile, provisions for these liabilities as of December 31, 2011 amounting to P=366.9 million are recorded under “Provision and other long-term liabilities” (part of “Others”) account (see Note 17).
Interest on liability from litigation amounted to P=8.6 million, P=7.8 million and P=8.2 million for the years ended December 31, 2012, 2011 and 2010, respectively (see Note 26).
Shortfall Generation The Parent Company’s PPA with NPC requires the annual nomination of capacity that EDC shall deliver to NPC. EDC bills NPC based on the nominated capacity. At the end of the contract year, EDC’s fulfillment of the nominated capacity shall be determined and any shortfall would be reimbursed to NPC. The contract year for the Unified Leyte PPA is for fiscal period ending July 25 while the contract year for the Mindanao I and II PPAs is for fiscal period ending December 25 (see Note 38). Assessment is made at every reporting date whether the nominated capacity would be met based on management’s projection of electricity generation covering the entire contract year. If the occurrence of shortfall generation is determined to be probable, the amount of estimated reimbursement to NPC is accounted for as a deduction to revenue for the period and a corresponding liability is recognized. As of December 31, 2012 and 2011, the Company’s estimated liability arising from shortfall generation amounted to P=431.4 million and P=81.1 million, respectively shown under the “Trade and other payables” account, specifically under “Other payables” (see Note 17). Share-based Payments Expense The Company measures the cost of share-based payments granted to officers and employees by reference to the quoted price of the Parent Company’s shares listed in the PSE at the date at which the shares are granted. Share-based payments expense amounting to P=24.7 million, P=8.8 million and P=15.7 million were recognized in 2012, 2011 and 2010, respectively, in relation to the Parent Company’s stock grant plan (see Notes 22 and 32).
Deferred Tax Assets Deferred tax assets are recognized to the extent that it is probable that sufficient future taxable profits will be available against which the assets can be utilized. Significant management judgment is required to determine the amount of deferred tax assets that can be recognized. This includes the likely timing and level of future taxable profits together with future tax planning strategies. The carrying value of recognized deferred tax assets amounted to P=2,268.4 million and P=2,486.5 million as of December 31, 2012 and 2011, respectively (see Note 30).
4. Summary of Significant Accounting Policies
Basis of Consolidation Basis of consolidation starting January 1, 2010 The consolidated financial statements comprise the financial statements of the Parent Company and its subsidiaries as of December 31 of each year. Subsidiaries are fully consolidated from the date control is transferred to the Parent Company and cease to be consolidated from the date control is transferred out of the Parent Company. The financial statements of the subsidiaries are prepared for the same financial reporting year as the Parent Company using consistent accounting policies. All intercompany balances, transactions, income and expenses, and unrealized gains and losses resulting from intercompany transactions are eliminated in full.

- 13 -
*SGVMG300344*
Losses within a subsidiary are attributed to the NCI even if that results in a deficit balance. A change in the ownership interest of a subsidiary, without a loss of control, is accounted for as an equity transaction. If the Company loses control over a subsidiary, it derecognizes the carrying amounts of the assets (including goodwill) and liabilities of the subsidiary, carrying amount of any NCI (including any attributable components of other comprehensive income [OCI] recorded in equity), and recognizes the fair value of the consideration received, fair value of any investment retained, and any surplus or deficit recognized in the consolidated statement of income. The Company also reclassifies the Parent Company’s share of components previously recognized in OCI to profit or loss or retained earnings, as appropriate.
Basis of consolidation prior to January 1, 2010 The above-mentioned requirements were applied on a prospective basis. The difference, however, is carried forward in certain instances from the previous basis of consolidation. Losses incurred by the Company were attributed to the NCI until the balance was reduced to nil. Any further excess losses were attributed to the Parent Company, unless the NCI had a binding obligation to cover these. Losses prior to January 1, 2010 were not reallocated between NCI and the equity holders of the Parent Company. The accounts of FG Hydro have been included in the consolidated financial statements using the pooling-of-interests method beginning November 29, 2007, the date the Parent Company and FG Hydro came under common control of First Gen (see Note 1). NCI represents the portion of profit or loss and net assets in FG Hydro not held by the Parent Company and is presented in the consolidated statement of income, consolidated statement of comprehensive income, consolidated statement of changes in equity and within equity in the consolidated statement of financial position, separate from equity attributable to equity holders of the Parent Company. The acquisition of NCI is accounted for as an equity transaction. Business Combinations and Goodwill Business combinations starting January 1, 2010 Business combinations are accounted for using the acquisition method. The cost of an acquisition is measured as the aggregate of the consideration transferred, measured at acquisition date fair value and the amount of any NCI in the acquiree. For each business combination, the acquirer measures the NCI of the acquiree either at fair value or at the proportionate share of the acquiree’s identifiable net assets. Acquisition-related costs incurred are expensed and included in general and administrative expenses.
When the Company acquires a business, it assesses the financial assets and financial liabilities assumed for appropriate classification and designation in accordance with the contractual terms, economic circumstances and pertinent conditions as at the acquisition date. This includes the separation of embedded derivatives in host contracts by the acquiree. If the business combination is achieved in stages, the acquisition date fair value of the acquirer’s previously held equity interest in the acquiree is remeasured to fair value at the acquisition date and any gain or loss on remeasurement is recognized in the consolidated statement of income. Any contingent consideration to be transferred by the acquirer will be recognized at fair value at the acquisition date. Subsequent changes to the fair value of the contingent consideration which is deemed to be an asset or liability, will be recognized in accordance with PAS 39, Financial Instruments: Recognition and Measurement, either in the consolidated statement of income or as a change to OCI. If the contingent consideration is classified as equity, it should not be remeasured until it is finally settled within equity.

- 14 -
*SGVMG300344*
Goodwill is initially measured at cost being the excess of the aggregate of the consideration transferred and the amount recognized for NCI over the net identifiable assets acquired and liabilities assumed. If this consideration is lower than the fair value of the net assets of the subsidiary acquired, the difference is recognized in the consolidated statement of income. After initial recognition, goodwill is measured at cost less any accumulated impairment losses. For the purpose of impairment testing, goodwill acquired in a business combination is, from the acquisition date, allocated to each of the Company’s CGUs that are expected to benefit from the combination, irrespective of whether other assets or liabilities of the acquiree are assigned to those units. Where goodwill forms part of a CGU and part of the operation within that unit is disposed of, the goodwill associated with the operation disposed of is included in the carrying amount of the operation when determining the gain or loss on disposal of the operation. Goodwill disposed of in this circumstance is measured based on the relative values of the operation disposed of and the portion of the CGU retained.
Business combinations prior to January 1, 2010 Business combinations prior to January 1, 2010 were accounted for using the purchase method. Transaction costs directly attributable to the acquisition formed part of the acquisition costs. The NCI was measured at the proportionate share of the acquiree’s identifiable net assets. This involved recognizing identifiable assets and liabilities of the acquired business initially at fair value. If the acquirer’s interest in the net fair value of the identifiable assets and liabilities exceeds the cost of the business combination, the acquirer shall (a) reassess the identification and measurement of the acquiree’s identifiable assets and liabilities and the measurement of the cost of the combination; and (b) recognize immediately in the consolidated statement of income any excess remaining after that reassessment. When a business combination involves more than one exchange transaction, each exchange transaction shall be treated separately using the cost of the transaction and fair value information at the date of each exchange transaction to determine the amount of any goodwill associated with that transaction. This results in a step-by-step comparison of the cost of the individual investments with the Company’s interest in the fair value of the acquiree’s identifiable assets, liabilities and contingent liabilities at each exchange transaction. The fair values of the acquiree’s identifiable assets, liabilities and contingent liabilities may be different on the date of each exchange transaction. Any adjustments to those fair values relating to previously held interests of the Company is a revaluation to be accounted for as such and presented separately as part of equity. If the revaluation relates directly to an identifiable fixed asset, the revaluation will be transferred directly to retained earnings when the asset is derecognized in whole through disposal or as the asset concerned is depreciated or amortized. Goodwill represents the excess of the cost of an acquisition over the fair value of the Company’s share in the net identifiable assets of the acquired subsidiary at the date of acquisition. Goodwill on acquisitions of subsidiaries is recognized separately as a noncurrent asset.
Foreign Currency Translation of Foreign Operations The consolidated financial statements are presented in Peso, which is the Parent Company’s functional currency. Each entity or subsidiary in the Company determines its own functional currency and measures items included in their financial statements using that functional currency. Transactions in foreign currencies are initially recorded at the functional currency prevailing at the date of transaction. Monetary assets and monetary liabilities denominated in foreign currencies are translated at the closing rate of exchange prevailing at financial reporting date. Non-monetary

- 15 -
*SGVMG300344*
items that are measured in terms of historical cost in a foreign currency are translated using the exchange rates as at the dates of the initial transactions. Non-monetary items measured at fair value in a foreign currency are translated using the exchange rates at the date when the fair value was determined. Foreign exchange differences between the rate at transaction date and the rate at settlement date or financial reporting date are recognized in the consolidated statement of income.
The functional currency of the Company’s subsidiaries is Peso, except for the following subsidiaries:
Subsidiary Functional Currency EHIL United States dollar EDC HKL Hong Kong dollar EDC Chile Holdings SPA Chilean peso EDC Geotermica Chile - do - EDC Chile Limitada - do - EDC Peru Holdings S.A.C. Peruvian nuevo sol EDC Geotermica Peru S.A.C. - do - EDC Quellaapacheta - do - PT EDC Indonesia Indonesian rupiah PT EDC Panas Bumi Indonesia - do -
For subsidiaries whose functional currency is different from the presentation currency, the Company translates the results of their operations and financial position into the presentation currency. As at the financial reporting date, the assets and liabilities presented (including comparatives) are translated into the presentation currency at the closing rate of exchange prevailing at the financial reporting date while the capital stock and other equity balances are translated at historical rates of exchange. The income and expenses for the consolidated statement of income presented (including comparatives) are translated at the exchange rates at the dates of the transactions, where determinable, or at the weighted average rate of exchange during the year. The exchange differences arising on the translation to the presentation currency are recognized as a separate component of equity under the “Cumulative translation adjustment” account in the consolidated statement of financial position.
Foreign Currency-Denominated Transactions Transactions in foreign currencies are initially recorded at the functional currency rate at the date of the transaction. Monetary assets and monetary liabilities denominated in foreign currencies are retranslated using the functional currency rate of exchange as at financial reporting date. All differences are taken to the consolidated statement of income under “Foreign exchange gains (losses)” account. Nonmonetary items that are measured at historical cost in a foreign currency are translated using the exchange rate as at the date of the transactions. Nonmonetary items measured at fair value in a foreign currency are translated using the exchange rates at the date when the fair value is determined. Cash and Cash Equivalents Cash and cash equivalents in the consolidated statement of financial position comprise cash in banks and on hand and short-term deposits with original maturities of three months or less from dates of acquisition and that are subject to insignificant risk of changes in value.

- 16 -
*SGVMG300344*
Parts and Supplies Inventories Inventories are valued at the lower of cost and net realizable value. Cost includes the invoice amount, net of trade and cash discounts. Cost is calculated using the moving average method. Net realizable value represents the current replacement cost. Prepayments Prepayments are expenses paid in advance and recorded as asset before these are utilized. This account comprises prepaid expenses, withholding tax certificates, tax credit certificates and advances to contractors. The prepaid expenses are apportioned over the period covered by the payment and charged to the appropriate accounts in the consolidated statement of income when incurred; withholding tax certificates are deducted from income tax payable on the same year the revenue was recognized; and the advances to contractors are reclassified to the proper asset or expense account and deducted from the contractor’s billings as specified on the provision of the contract. Prepayments that are expected to be realized for a period of no more than 12 months after the financial reporting period are classified as current asset; otherwise, these are classified as other noncurrent asset.
Property, Plant and Equipment Property, plant and equipment, except land, is stated at cost less accumulated depreciation, amortization and impairment in value, if any. The initial cost of property, plant and equipment, consists of its purchase price and any directly attributable costs of bringing the asset to its working condition and location for its intended use and any estimated cost of dismantling and removing the property, plant and equipment item and restoring the site on which it is located to the extent that the Company had recognized the obligation to that cost. Such cost includes the cost of replacing part of the property, plant and equipment if the recognition criteria are met. When significant parts of property, plant and equipment are required to be replaced in intervals, the Company recognizes such parts as individual assets with specific useful lives, depreciation and amortization. All other repairs and maintenance costs are recognized in the consolidated statement of income as incurred. Land is carried at cost less accumulated impairment losses, if any. The income generated wholly and necessarily as a result of the process of bringing the asset into the location and condition for its intended use (e.g., net proceeds from selling any items produced while testing whether the asset is functioning properly) is credited to the cost of the asset. When the incidental operations are not necessary to bring an item to the location and condition necessary for it to be capable of operating in the manner intended by management, the income and related expenses of incidental operations are not offset against the cost of the asset but are recognized in profit or loss and included in their respective classifications of income and expense.
Depreciation and amortization are calculated on a straight-line basis over the economic lives of the assets as follows:
Number of years Power plants 15-30 Production wells 10-40 Fluid Collection and Recycling System (FCRS) 13-20 Buildings, improvements and other structures 5-35 Exploration, machinery and equipment 2-25 Transportation equipment 5-10 Furniture, fixtures and equipment 3-10 Laboratory equipment 5-10

- 17 -
*SGVMG300344*
Depreciation and amortization of an item of property, plant and equipment begin when it becomes available for use, i.e., when it is in the location and condition necessary for it to be capable of operating in the manner intended by management. Depreciation and amortization cease at the earlier of the date that the item is classified as held for sale (or included in a disposal group that is classified as held for sale) in accordance with PFRS 5, Non-current Assets Held for Sale and Discontinued Operations, and the date the asset is derecognized. Leasehold improvements are amortized over the lease term or the economic life of the related asset, whichever is lower.
An item of property, plant and equipment is derecognized upon disposal or when no future economic benefits are expected from its use or disposal. Any gain or loss arising on derecognition of the asset (calculated as the difference between the net disposal proceeds and the carrying amount of the asset) is included in the consolidated statement of income in the year the asset is derecognized. The residual values, useful lives and methods of depreciation and amortization are reviewed and adjusted, if appropriate, at each financial reporting date. Property, plant and equipment are recognized based on their significant parts. Each part of an item of property, plant and equipment with a cost that is significant in relation to the total cost of the item is depreciated separately. Property, plant and equipment also include the estimated rehabilitation and restoration costs of the Company’s steam fields and power plants contract areas for which the Company is constructively liable. These costs are included under “FCRS and production wells” account (see Note 13).
Construction in progress and major spares and surplus assets available for use are stated at cost and is not depreciated until such time that the assets are put into operational use.
Intangible Assets Intangible assets acquired separately are measured on initial recognition at cost. Following initial recognition, intangible assets are carried at cost less accumulated amortization and any accumulated impairment loss, if any. Internally-generated intangible assets, if any, excluding capitalized development costs, are not capitalized and expenditure is reflected in the consolidated statement of income in which the expenditure is incurred.
The useful lives of intangible assets are assessed to be either finite or indefinite. Intangible assets with finite lives are amortized over the useful economic life and assessed for impairment whenever there is an indication that the intangible asset may be impaired. The amortization period and amortization method for an intangible asset with a finite useful life is reviewed at least at each financial year end. Changes in the expected useful life or the expected pattern of consumption of future economic benefits embodied in the asset is accounted for by changing the amortization period or method, as appropriate, and treated as changes in accounting estimates. The amortization expense on intangible assets with finite lives is recognized in profit or loss in the expense category consistent with the function of the intangible asset. Intangible assets with indefinite useful lives and intangible assets not yet available for use are tested for impairment annually at the CGU level and are not amortized. The useful life of an intangible asset with an indefinite life is reviewed annually to determine whether indefinite useful life assessment continues to be supportable. If not, the change in the useful life assessment from indefinite to finite is made on a prospective basis.
Gains or losses arising from derecognition of an intangible asset are measured as the difference between the net disposal proceeds, if any, and the carrying amount of the asset and are recognized in the consolidated statement of income when the asset is derecognized.

- 18 -
*SGVMG300344*
Water Rights The cost of water rights of FG Hydro is measured on initial recognition at cost.
Following initial recognition of the water rights, the cost model is applied requiring the asset to be carried at cost less any accumulated amortization and accumulated impairment losses, if any. Water rights are amortized using the straight-line method over 25 years, which is the term of the agreement with the National Irrigation Administration (NIA).
Wind Energy Project Development Costs Project development costs are expensed as incurred until management determines that the project is technically, commercially and financially viable, at which time, project development costs are capitalized. Project viability generally occurs in tandem with management’s determination that a project should be classified as an advanced project, such as when favorable results of a system impact study are received, interconnected agreements are obtained and project financing is in place. Following initial recognition of the project development cost as an asset, the cost model is applied requiring the asset to be carried at cost less accumulated amortization and any accumulated impairment losses. Amortization of the asset begins when the development of wind farm assets is complete and the wind farm asset is available for use. It is amortized using the straight-line method over the period of expected future benefit. During the period in which the asset is not yet available for use, the project development costs are tested for impairment annually, irrespective of whether there is any indication of impairment.
Exploration and Evaluation Assets The Company follows the full cost method of accounting for its exploration costs determined on the basis of each service contract area. Under this method, all exploration costs relating to each service contract are accumulated and deferred under the “Exploration and evaluation assets” account in the consolidated statement of financial position pending the determination of whether the wells has proved reserves. Capitalized expenditures include costs of license acquisition, technical services and studies, exploration drilling and testing, and appropriate technical and administrative expenses. General overhead or costs incurred prior to having obtained the legal rights to explore an area are recognized as expense in the consolidated statement of income when incurred.
If tests conducted on the drilled exploratory wells reveal that these wells cannot produce proved reserves, the capitalized costs are charged to expense except when management decides to use the unproductive wells, for recycling or waste disposal. Once the technical feasibility and commercial viability of the project to produce proved reserves are established, the exploration and evaluation assets shall be reclassified to property, plant and equipment. Impairment of Non-financial Assets For non-financial assets such as property, plant and equipment, exploration and evaluation assets, water rights and input VAT claims for refund/tax credits, the Company assesses at each financial reporting date whether there is an indication that a non-financial asset may be impaired. If any such indication exists, the Company estimates the asset’s recoverable amount. Also, irrespective of whether there is any indication of impairment, the Company tests an intangible asset not yet available for use, such as wind energy project development cost, for impairment annually by comparing its carrying amount with its recoverable amount.

- 19 -
*SGVMG300344*
The recoverable amount is the higher of an asset’s or CGU’s fair value less costs to sell and its value-in-use and is determined for an individual asset, unless the asset does not generate cash inflows that are largely independent of those from other assets or group of assets. When the carrying amount of an asset exceeds its recoverable amount, the asset is considered impaired and is written down to its recoverable amount. In assessing value-in-use, the estimated future cash flows are discounted to their present value using a pre-tax discount rate that reflects current market assessments of the time value of money and the risks specific to the asset. In determining fair value less costs to sell, an appropriate valuation model is used. These calculations are corroborated by valuation multiples or other available fair value indicators.
Impairment losses are recognized in the consolidated statement of income in those expense categories consistent with the function of the impaired asset.
For non-financial assets excluding goodwill, an assessment is made at each financial reporting date as to whether there is any indication that previously recognized impairment losses may no longer exist or may have decreased. If such indication exists, the Company makes an estimate of recoverable amount. A previously recognized impairment loss is reversed only if there has been a change in the estimates used to determine the asset’s recoverable amount since the last impairment loss was recognized. In such instance, the carrying amount of the asset is increased to its recoverable amount. However, that increased amount cannot exceed the carrying amount that would have been determined, net of depreciation, had no impairment loss been recognized for the asset in prior years. Such reversal is recognized in the consolidated statement of income. Goodwill is reviewed for impairment, annually or more frequently, if events or changes in circumstances indicate that the carrying value may be impaired. Impairment is determined for goodwill by assessing the recoverable amount of the CGU or group of CGUs to which the goodwill relates. Where the recoverable amount of the CGU or group of CGUs is less than the carrying amount of the CGU or group of CGUs to which goodwill has been allocated, an impairment loss is recognized immediately in the consolidated statement of income. Impairment loss relating to goodwill cannot be reversed for subsequent increases in its recoverable amount in future periods.
Financial Instruments Financial instruments are recognized in the consolidated statement of financial position, when the Company becomes a party to the contractual provisions of the instrument. All regular way purchases and sales of financial assets are recognized on the trade date, which is the date when the Company commits to purchase the asset. Regular way purchases or sales are purchases or sales of financial assets that require delivery of assets within the period generally established by regulation or convention in the market place. Derivatives are also recognized on a trade date basis.
Financial instruments are recognized initially at fair value. Except for financial instruments at fair value through profit or loss (FVPL), the initial measurement of financial instruments includes transaction costs. The Company classifies its financial assets into the following categories: financial assets at FVPL, held-to-maturity (HTM) investments, AFS investments, and loans and receivables. For financial liabilities, the Company classifies them into financial liabilities at FVPL and other financial liabilities. The classification depends on the purpose for which the investments were acquired and whether they are quoted in an active market. Management determines the classification of its investments at initial recognition and, where allowed and appropriate, re-evaluates such designation at every financial reporting date.

- 20 -
*SGVMG300344*
Financial instruments are classified as liability or equity in accordance with the substance of the contractual arrangement. Interest, dividends, gains and losses relating to a financial instrument or a component that is a financial liability, are reported as expense or income. Distributions to holders of financial instruments classified as equity are charged directly to equity, net of any related income tax benefit.
Financial Assets and Financial Liabilities at FVPL Financial assets and financial liabilities at FVPL include those held for trading and those designated upon initial recognition as at FVPL. Financial assets and financial liabilities are classified as held for trading if they are acquired for the purpose of selling and repurchasing in the near term. Derivatives, including separated embedded derivatives, are also classified as held for trading unless they are designated as effective hedging instruments or a financial guarantee contract. Gains or losses on investments held for trading are recognized in the consolidated statement of income under “Other income (charges)” account.
Financial assets or financial liabilities may be designated at initial recognition as at FVPL if the following criteria are met: (a) the designation eliminates or significantly reduces the inconsistent treatment that would otherwise arise from measuring the assets or recognizing gains or losses on them on a different basis; or (b) the assets and liabilities are part of a group of financial assets, financial liabilities, or both, which are managed and their performance evaluated on a fair value basis, in accordance with a documented risk management strategy; or (c) the financial instrument contains an embedded derivative that would need to be separately recorded.
Where a contract contains one or more embedded derivatives, the entire hybrid contract may be designated as at FVPL, except where the embedded derivative does not significantly modify the cash flow or it is clear that separation of the embedded derivative is prohibited. Classified under financial instruments at FVPL are foreign currency forward contracts and foreign currency swap contracts as of December 31, 2012 and 2011 (see Note 33).
HTM Investments HTM investments are quoted non-derivative financial assets with fixed or determinable payments and fixed maturities for which the Company has the positive intention and ability to hold to maturity. Where the Company sells other than an insignificant amount of HTM investments, the entire category would be tainted and would have to be reclassified as AFS investments. Furthermore, the Company would be prohibited to classify any financial assets as HTM investments for the following two years. After initial measurement, HTM investments are measured at amortized cost using the effective interest method. Amortized cost is calculated by taking into account any discount or premium on acquisition and fees that are integral parts of the effective interest rate. Gains and losses are recognized in the consolidated statement of income when the HTM investments are derecognized or impaired, as well as through the amortization process. The effect of restatement of foreign-currency denominated HTM investments are also recognized in the consolidated statement of income.
The Company has no HTM investments as of December 31, 2012 and 2011.

- 21 -
*SGVMG300344*
Loans and Receivables Loans and receivables are non-derivative financial assets with fixed or determinable payments that are not quoted in an active market. After initial measurement, loans and receivables are carried at amortized cost using the effective interest method less any allowance for impairment. Gains and losses are recognized in the consolidated statement of income when the loans and receivables are derecognized or impaired, as well as through the amortization process.
Loans and receivables are classified as current assets if maturity is within 12 months from the financial reporting date. Otherwise, these are classified as noncurrent assets.
Classified under loans and receivables are cash and cash equivalents, trade and other receivables, amounts due from related parties and long-term receivables (see Notes 8, 9, 16, 22 and 33).
AFS Investments AFS investments are those non-derivative financial assets that are designated as such or are not classified as financial assets designated at FVPL, HTM investments or loans and receivables. They are purchased and held indefinitely, and may be sold in response to liquidity requirements or changes in market conditions.
After initial measurement, AFS investments are subsequently measured at fair value with unrealized gains and losses being recognized as other comprehensive income in the “Net accumulated unrealized gain (loss) on AFS investment” account until the investment is disposed of or is determined to be impaired, at which time the cumulative gain or loss previously recognized in equity are recognized in the consolidated statement of income. The Company uses the specific identification method in determining the cost of securities sold. Unquoted equity securities are carried at cost, net of impairment. Interest earned on the investments is reported as interest income using the effective interest rate method. Dividends earned on investment are recognized in the consolidated statement of income when the right to receive payment has been established.
AFS investments are classified as current if these are expected to be realized within 12 months from the financial reporting date. Otherwise, these are classified as noncurrent assets.
AFS investments include quoted and unquoted investments in government securities, proprietary and equity shares (see Notes 10 and 33).
Other Financial Liabilities This category pertains to financial liabilities that are not held for trading or not designated as at FVPL upon the inception of the liability. Other financial liabilities, which include trade and other payables, amounts due to related parties, long-term debts and royalty fee payable (see Notes 17, 18, 19, 22 and 33) are initially recognized at fair value of the consideration received less directly attributable transaction costs. After initial recognition, other financial liabilities are subsequently measured at amortized cost using the effective interest method.
Amortized cost is calculated by taking into account any related issue costs, discount or premium. Gains and losses are recognized in the consolidated statement of income when the liabilities are derecognized, as well as through the amortization process. Fair Value of Financial Instruments The fair value of financial instruments traded in active markets at financial reporting date is based on their quoted market price or dealer price quotations (bid price for long positions and ask price

- 22 -
*SGVMG300344*
for short positions), without deduction for transaction costs. When current bid and ask prices are not available, the price of the most recent transaction provides evidence of the current fair value as long as there has not been a significant change in economic circumstances since the time of the transaction.
For all other financial instruments not traded in an active market, the fair value is determined by using appropriate valuation techniques. Valuation techniques include net present value techniques, comparison to similar instruments for which observable market prices exist, and other relevant valuation models.
“Day 1” Differences Where the transaction price in a non-active market is different from the fair value of other observable current market transactions in the same instrument or based on a valuation technique whose variables include only data from observable market, the Company recognizes the difference between the transaction price and fair value (a “Day 1” difference) in the consolidated statement of income unless it qualifies for recognition as some other type of asset. In cases where use is made of data which is not observable, the difference between the transaction price and model value is only recognized in the consolidated statement of income when the inputs become observable or when the instrument is derecognized. For each transaction, the Company determines the appropriate method of recognizing the “Day 1” difference amount.
Derivative Financial Instruments Derivative instruments, including bifurcated embedded derivatives, are initially recognized at fair value on the date that a derivative transaction is entered into or bifurcated, and are subsequently re-measured at fair value. Changes in fair value of derivative instruments not accounted as hedges are recognized immediately in the consolidated statement of income. Derivatives are carried as assets when the fair value is positive and as liabilities when the fair value is negative. The Company assesses whether embedded derivatives are required to be separated from the host contracts when the Company first becomes party to the contract. An embedded derivative is separated from the hybrid or combined contract if all of the following conditions are met: (a) the economic characteristics and risks of the embedded derivative are not clearly and closely related to the economic characteristics and risks of the host contract; (b) a separate instrument with the same terms as the embedded derivative would meet the definition of a derivative; and (c) the hybrid instrument is not recognized at FVPL. Subsequent reassessment is prohibited unless there is a change in the terms of the contract that significantly modifies the cash flows that otherwise would be required under the contract, in which case reassessment is required. The Company determines whether a modification to cash flows is significant by considering the extent to which the expected future cash flows associated with the embedded derivative, the host contract or both have changed and whether the change is significant relative to the previously expected cash flows on the contract.
Impairment of Financial Assets The Company assesses at each financial reporting date whether a financial asset or group of financial assets is impaired. A financial asset or a group of financial assets is deemed to be impaired, if and only if, there is objective evidence of impairment as a result of one or more events that occurred after the initial recognition of the asset (an incurred loss event) and that loss event has an impact on the estimated future cash flows of the financial asset or a group of financial assets that can be reliably estimated. Objective evidence of impairment may include indications

- 23 -
*SGVMG300344*
that the borrower or a group of borrowers is experiencing significant financial difficulty, default or delinquency in interest or principal payments, the probability that they will enter bankruptcy or other financial reorganization and where observable data indicate that there is measurable decrease in the estimated future cash flows, such as changes in arrears or economic conditions that correlate with defaults.
Assets Carried at Amortized Cost For assets carried at amortized cost, the Company first assesses whether an objective evidence of impairment exists individually for financial assets that are individually significant, or collectively for financial assets that are individually and not individually significant. If the Company determines that no objective evidence of impairment exists for individually assessed financial asset, whether significant or not, it includes the asset in a group of financial assets with similar credit risk characteristics and collectively assesses for impairment. Those characteristics are relevant to the estimation of future cash flows for groups of such assets by being indicative of the debtors’ ability to pay all amounts due according to the contractual terms of the assets being evaluated. Assets that are individually assessed for impairment and for which an impairment loss is, or continues to be, recognized are not included in a collective assessment for impairment. If there is an objective evidence that an impairment loss has been incurred, the amount of loss is measured as the difference between the asset’s carrying value and the present value of the estimated future cash flows (excluding future credit losses that have not been incurred) discounted at the financial assets’ original effective interest rate which is the effective interest rate computed at initial recognition. The carrying value of the asset is reduced through the use of an allowance account and the amount of loss is recognized in the consolidated statement of income. If in case the receivable has proven to have no realistic prospect of future recovery, any allowance provided for such receivable is written off against the carrying value of the impaired receivable. If, in a subsequent year, the amount of the estimated impairment loss decreases because of an event occurring after the impairment was recognized, the previously recognized impairment loss is reduced by adjusting the allowance account. Any subsequent reversal of an impairment loss is recognized in the consolidated statement of income, to the extent that the carrying value of the asset does not exceed its amortized cost at reversal date. AFS Investments For AFS investments, the Company assesses at each financial reporting date whether there is objective evidence that a financial asset or group of financial assets is impaired.
In the case of equity investments classified as AFS, impairment indicators would include a significant or prolonged decline in the fair value of the investments below its cost. Where there is evidence of impairment, the cumulative loss, measured as the difference between the acquisition cost and the current fair value, less any impairment loss on that financial asset previously recognized in the consolidated statement of comprehensive income, is removed from equity and recognized in the consolidated statement of income. Impairment losses on equity investments are not reversed through the consolidated statement of income. Increases in fair value after impairment are recognized directly in the consolidated statement of comprehensive income.
In the case of debt instruments classified as AFS investments, impairment is assessed based on the same criteria as financial assets carried at amortized cost. Future interest income is based on the reduced carrying amount and is accrued based on the rate of interest used to discount future cash flows for the purpose of measuring impairment loss. Such accrual is recorded as part of “Interest income” in the consolidated statement of income. If, in a subsequent year, the fair value of a debt instrument increases and that increase can be objectively related to an event occurring after the impairment loss was recognized in the consolidated statement of income, the impairment loss is reversed through the consolidated statement of income.
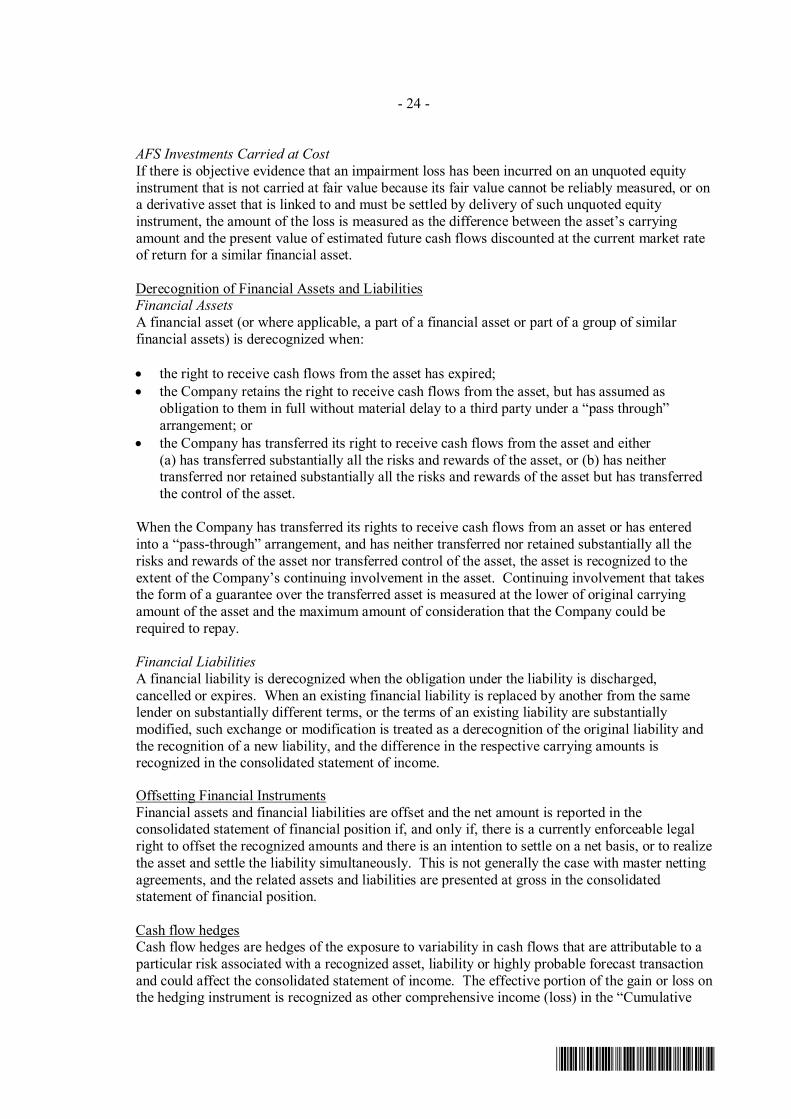
- 24 -
*SGVMG300344*
AFS Investments Carried at Cost If there is objective evidence that an impairment loss has been incurred on an unquoted equity instrument that is not carried at fair value because its fair value cannot be reliably measured, or on a derivative asset that is linked to and must be settled by delivery of such unquoted equity instrument, the amount of the loss is measured as the difference between the asset’s carrying amount and the present value of estimated future cash flows discounted at the current market rate of return for a similar financial asset.
Derecognition of Financial Assets and Liabilities Financial Assets A financial asset (or where applicable, a part of a financial asset or part of a group of similar financial assets) is derecognized when: • the right to receive cash flows from the asset has expired; • the Company retains the right to receive cash flows from the asset, but has assumed as
obligation to them in full without material delay to a third party under a “pass through” arrangement; or
• the Company has transferred its right to receive cash flows from the asset and either (a) has transferred substantially all the risks and rewards of the asset, or (b) has neither transferred nor retained substantially all the risks and rewards of the asset but has transferred the control of the asset.
When the Company has transferred its rights to receive cash flows from an asset or has entered into a “pass-through” arrangement, and has neither transferred nor retained substantially all the risks and rewards of the asset nor transferred control of the asset, the asset is recognized to the extent of the Company’s continuing involvement in the asset. Continuing involvement that takes the form of a guarantee over the transferred asset is measured at the lower of original carrying amount of the asset and the maximum amount of consideration that the Company could be required to repay.
Financial Liabilities A financial liability is derecognized when the obligation under the liability is discharged, cancelled or expires. When an existing financial liability is replaced by another from the same lender on substantially different terms, or the terms of an existing liability are substantially modified, such exchange or modification is treated as a derecognition of the original liability and the recognition of a new liability, and the difference in the respective carrying amounts is recognized in the consolidated statement of income.
Offsetting Financial Instruments Financial assets and financial liabilities are offset and the net amount is reported in the consolidated statement of financial position if, and only if, there is a currently enforceable legal right to offset the recognized amounts and there is an intention to settle on a net basis, or to realize the asset and settle the liability simultaneously. This is not generally the case with master netting agreements, and the related assets and liabilities are presented at gross in the consolidated statement of financial position.
Cash flow hedges Cash flow hedges are hedges of the exposure to variability in cash flows that are attributable to a particular risk associated with a recognized asset, liability or highly probable forecast transaction and could affect the consolidated statement of income. The effective portion of the gain or loss on the hedging instrument is recognized as other comprehensive income (loss) in the “Cumulative
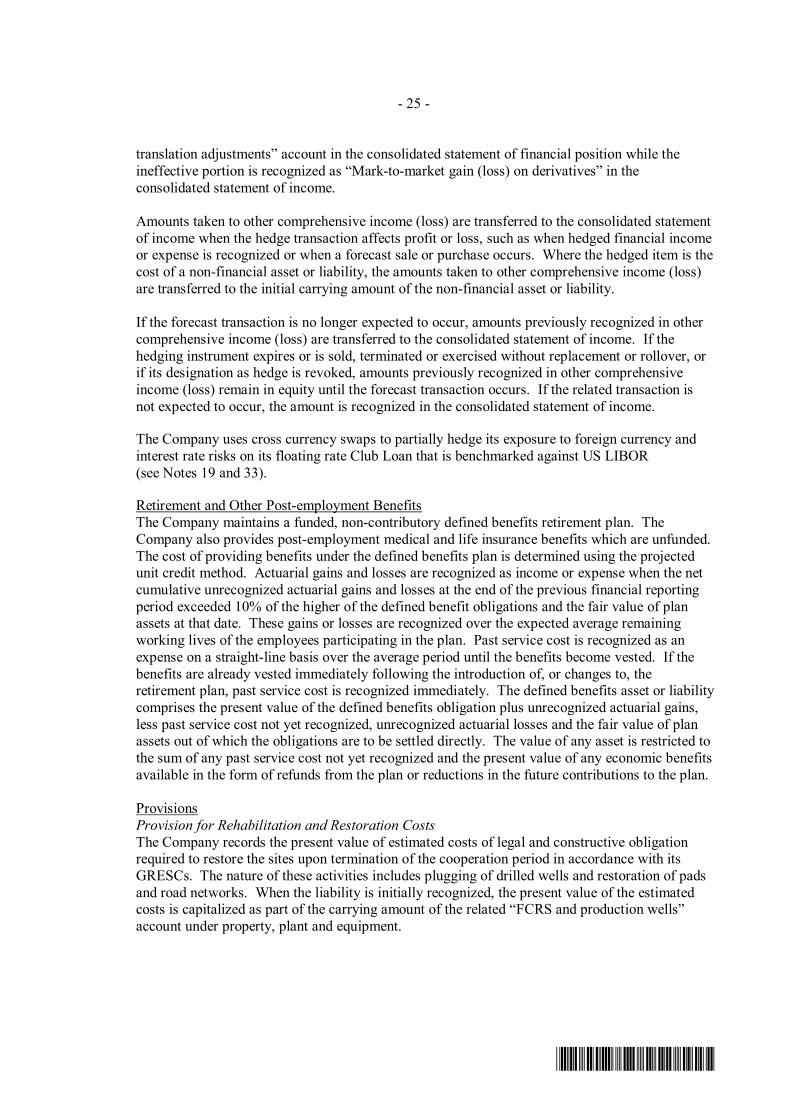
- 25 -
*SGVMG300344*
translation adjustments” account in the consolidated statement of financial position while the ineffective portion is recognized as “Mark-to-market gain (loss) on derivatives” in the consolidated statement of income. Amounts taken to other comprehensive income (loss) are transferred to the consolidated statement of income when the hedge transaction affects profit or loss, such as when hedged financial income or expense is recognized or when a forecast sale or purchase occurs. Where the hedged item is the cost of a non-financial asset or liability, the amounts taken to other comprehensive income (loss) are transferred to the initial carrying amount of the non-financial asset or liability. If the forecast transaction is no longer expected to occur, amounts previously recognized in other comprehensive income (loss) are transferred to the consolidated statement of income. If the hedging instrument expires or is sold, terminated or exercised without replacement or rollover, or if its designation as hedge is revoked, amounts previously recognized in other comprehensive income (loss) remain in equity until the forecast transaction occurs. If the related transaction is not expected to occur, the amount is recognized in the consolidated statement of income.
The Company uses cross currency swaps to partially hedge its exposure to foreign currency and interest rate risks on its floating rate Club Loan that is benchmarked against US LIBOR (see Notes 19 and 33).
Retirement and Other Post-employment Benefits The Company maintains a funded, non-contributory defined benefits retirement plan. The Company also provides post-employment medical and life insurance benefits which are unfunded. The cost of providing benefits under the defined benefits plan is determined using the projected unit credit method. Actuarial gains and losses are recognized as income or expense when the net cumulative unrecognized actuarial gains and losses at the end of the previous financial reporting period exceeded 10% of the higher of the defined benefit obligations and the fair value of plan assets at that date. These gains or losses are recognized over the expected average remaining working lives of the employees participating in the plan. Past service cost is recognized as an expense on a straight-line basis over the average period until the benefits become vested. If the benefits are already vested immediately following the introduction of, or changes to, the retirement plan, past service cost is recognized immediately. The defined benefits asset or liability comprises the present value of the defined benefits obligation plus unrecognized actuarial gains, less past service cost not yet recognized, unrecognized actuarial losses and the fair value of plan assets out of which the obligations are to be settled directly. The value of any asset is restricted to the sum of any past service cost not yet recognized and the present value of any economic benefits available in the form of refunds from the plan or reductions in the future contributions to the plan.
Provisions Provision for Rehabilitation and Restoration Costs The Company records the present value of estimated costs of legal and constructive obligation required to restore the sites upon termination of the cooperation period in accordance with its GRESCs. The nature of these activities includes plugging of drilled wells and restoration of pads and road networks. When the liability is initially recognized, the present value of the estimated costs is capitalized as part of the carrying amount of the related “FCRS and production wells” account under property, plant and equipment.

- 26 -
*SGVMG300344*
The amount of provision for rehabilitation and restoration costs in the consolidated statement of financial position is increased by the accretion expense recognized in the consolidated statement of income using the effective interest method. The periodic unwinding of the discount is recognized in the consolidated statement of income as “interest expense”. Additional costs or changes in rehabilitation and restoration costs are recognized as additions or charges to the corresponding assets and provision for rehabilitation and restoration costs when they occur. For closed sites or areas, changes to estimated costs are recognized immediately in the consolidated statement of income. Decrease in rehabilitation and restoration costs that exceeds the carrying amount of the corresponding rehabilitation asset is recognized immediately in the consolidated statement of income. Other Provisions Provisions are recognized when the Company has a present obligation (legal or constructive) as a result of a past event, it is probable that an outflow of resources embodying economic benefits will be required to settle the obligation and a reliable estimate can be made of the amount of the obligation. Where the Company expects some or all of a provision to be reimbursed, for example, under an insurance contract, the reimbursement is recognized as a separate asset but only when the reimbursement is virtually certain. The expense relating to any provision is presented in the consolidated statement of income, net of any reimbursement. If the effect of the time value of money is material, provisions are discounted using a pre-tax rate that reflects, where appropriate, the risks specific to the liability. Where discounting is used, the increase in the provision due to the passage of time is recognized as “Interest expense” in the consolidated statement of income.
Contingencies Contingent liabilities are not recognized in the consolidated financial statements. These are disclosed unless the possibility of an outflow of resources embodying economic benefits is remote. Contingent assets are not recognized in the consolidated financial statements but disclosed when an inflow of economic benefits is probable. Capital Stock Capital stock is measured at par value for all shares issued. When the Company issues more than one class of stock, a separate account is maintained for each class of stock and the number of shares issued. Capital stock includes common stock and preferred stock. When the shares are sold at premium, the difference between the proceeds and the par value is credited to the “Additional paid-in capital” account. When shares are issued for a consideration other than cash, the proceeds are measured by the fair value of the consideration received. In case the shares are issued to extinguish or settled the liability of the Company, the shares shall be measured either at the fair value of the shares issued or fair value of the liability settled, whichever is more reliably determinable. Direct costs incurred related to equity issuance, such as underwriting, accounting and legal fees, printing costs and taxes are debited to the “Additional paid-in capital” account. If additional paid-in capital is not sufficient, the excess is charged against an equity reserve account. Common Shares in Employee Trust Account Common shares in the employee trust account, which consist of common shares irrevocably assigned to the Banco de Oro Trust and Investment Group (BDO Trust) account, are recognized at the amount at which such common shares were reacquired by the Company for the purpose of its executive/employee stock option or such similar plans, and proportionately reduced upon vesting of the benefit to the executive/employee grantee of the related number of common shares.

- 27 -
*SGVMG300344*
This account is shown as a separate line item in the equity section of the consolidated statement of financial position.
Employee Stock Ownership Plan Awards granted under the employee stock option plan of the Company are accounted for as equity-settled transactions. The cost of equity-settled transaction is measured by reference to the fair value of the equity instruments at the date it is granted. Such cost, together with a corresponding increase in equity, is recognized over the period in which the performance and/or service conditions are fulfilled ending on the date on which the grantee becomes fully entitled to the award (“vesting date”). The cumulative expense recognized for equity-settled transactions at each balance sheet date until the vesting date reflects the extent to which the vesting period has expired, as well as the Company’s best estimate of the number of equity instruments that will ultimately vest. No expense is recognized for awards that do not ultimately vest, except for awards where vesting is conditional upon a market or non-vesting condition, in which, awards are treated as vesting irrespective of whether or not the market or non-vesting condition is satisfied, provided that all other performance conditions are satisfied. Where the terms of an equity-settled award are modified, the minimum expense recognized is the expense had the terms not been modified, if the original terms of the award are met. An additional expense is recognized for any modification which increases the total fair value of the share-based payment transaction or which is otherwise beneficial to the employee as measured at the date of modification. Where an equity-settled award is cancelled, it is treated as if it vested on the date of cancellation, and any expense not yet recognized for the award is recognized immediately. This includes any award where non-vesting conditions within the control of either the Company or the employee are not met. However, if a new award is substituted for the cancelled award and designated as a replacement award on the date that it is granted, the cancelled and new awards are treated as if they were a modification of the original award, as described in the previous paragraph.
Equity Reserve Equity reserve is the difference between the acquisition cost of an entity under common control and the Parent Company’s proportionate share in the net assets of the entity acquired as a result of a business combination accounted for using the pooling-of-interests method. Equity reserve is derecognized when the subsidiary is deconsolidated, which is the date on which control ceases. Retained Earnings Retained earnings represent the cumulative balance of periodic net income or loss, dividend contributions, prior period adjustments, effect of changes in accounting policy and other capital adjustments. Cash and property dividends are recognized as a liability and deducted from retained earnings when approved by the BOD. Stock dividends are treated as transfers from retained earnings to capital stock. Dividends for the year that are approved after the financial reporting date are dealt with as an event after the financial reporting date. Retained earnings include the earnings of subsidiaries which are not available for dividend declaration.

- 28 -
*SGVMG300344*
Leases The determination of whether an arrangement is, or contains a lease, is based on the substance of the arrangement at inception date of whether the fulfillment of the arrangement is dependent on the use of a specific asset or assets or the arrangement conveys a right to use the asset.
Operating lease payments are recognized as expense in the consolidated statement of income on a straight-line basis over the lease term.
Revenue Recognition Revenue is recognized to the extent that it is probable that the economic benefits will flow to the Company and the revenue can be measured reliably. Revenue is measured at the fair value of the consideration received or receivable, excluding discounts, rebates, and other sales taxes or duty. The Company assesses its revenue arrangements against specific criteria in order to determine if it is acting as principal or agent. The Company has concluded that it is acting as a principal in all its revenue arrangements. The following specific recognition criteria must also be met before revenue is recognized:
Sales of Electricity and Steam Sale of electricity using geothermal energy is consummated whenever the electricity generated by the Company is transmitted through the transmission line designated by the buyer, for a consideration. Sale of steam is recognized when the steam generated by the Company or its by-product passes to the flowmeters installed at the interface point for conversion by the buyer into power. Revenues from sale of electricity and steam are based on sales price. Sale of electricity using hydroelectric and geothermal power is composed of generation fees from spot sales to the WESM and PSA with various electric companies and is recognized monthly based on the actual energy delivered. Revenue from sale of electricity, as ancillary services, to the National Grid Corporation of the Philippines (NGCP) is recognized monthly based on the capacity scheduled and/or dispatched and provided.
Drilling Services Revenue is recognized as drilling services are rendered. The Company discontinued its drilling services in 2012 (see Note 6).
Interest Income Revenue is recognized as interest accrues, using the effective interest rate, which is the rate that exactly discounts estimated future cash receipts through the expected life of the financial instrument to the net carrying amount of the financial asset. Costs of Sales of Electricity and Steam, and Costs of Drilling Services These include expenses incurred by the departments directly responsible for the generation of revenues from steam, electricity and performance of drilling services (i.e., Plant Operations, Production, Maintenance, Transmission and Dispatch, Wells Drilling and Maintenance Department) at operating project locations. Costs of sales of electricity and steam and cost of drilling services are expensed when incurred. Costs of drilling services were included in the computation of net income from discontinued operations.

- 29 -
*SGVMG300344*
General and Administrative Expenses General and administrative expenses constitute cost of administering the business and normally include the expenses incurred by the departments in the Head Office (i.e., Management and Services, and Project Location’s Administrative Services Department). General and administrative expenses are expensed when incurred.
Borrowing Costs Borrowing costs directly attributable to the acquisition, construction or production of qualifying assets, are added to the cost of the assets, until such time that the assets are substantially ready for their intended use or sale, which necessarily take a substantial period of time. Income earned on temporary investment of specific borrowings, pending the expenditure on qualifying assets, is deducted from the borrowing costs eligible for capitalization. Borrowing costs include interest charges and other costs incurred in connection with the borrowing of funds, as well as exchange differences arising from foreign currency borrowings used to finance the project to the extent that they are regarded as an adjustment to interest costs. All other borrowing costs are recognized in the consolidated statement of income in the period in which they are incurred.
Taxes Current Tax Current tax assets and liabilities for the current and prior periods are measured at the amount expected to be recovered from or paid to the taxation authority. The tax rates and tax laws used to compute the amount are those that are enacted or substantively enacted as at the financial reporting date.
Deferred Tax Deferred tax is provided using the balance sheet liability method on temporary differences at the financial reporting date between the tax bases of assets and liabilities and their carrying amounts for financial reporting purposes. Deferred tax liabilities are recognized for all taxable temporary differences, except:
• where the deferred tax liability arises from the initial recognition of goodwill or of an asset or
liability in a transaction that is not a business combination and, at the time of the transaction, affects neither the accounting profit nor taxable profit or loss; and
• in respect of taxable temporary differences associated with investments in subsidiaries,
associates and interests in joint ventures, where the timing of the reversal of the temporary differences can be controlled and it is probable that the temporary differences will not reverse in the foreseeable future.
Deferred tax assets are recognized for all deductible temporary differences, carryforward benefits of unused tax credits and unused tax losses [i.e., net operating loss carry-over (NOLCO)], to the extent that it is probable that sufficient taxable profits will be available against which the deductible temporary differences, and the carryforward benefits of unused tax credits and unused tax losses can be utilized except:
• where the deferred tax asset relating to the deductible temporary difference arises from the initial recognition of an asset or liability in a transaction that is not a business combination and, at the time of the transaction, affects neither the accounting profit nor taxable profit or loss; and
- 30 -
*SGVMG300344*
• in respect of deductible temporary differences associated with investments in subsidiaries, associates and interests in joint ventures, deferred tax assets are recognized only to the extent that it is probable that the temporary differences will reverse in the foreseeable future and sufficient taxable profits will be available against which the temporary differences can be utilized.
The carrying amount of deferred tax assets is reviewed at each financial reporting date and reduced to the extent that it is no longer probable that sufficient future taxable profits will be available to allow all or part of the deferred income tax asset to be utilized. Unrecognized deferred tax assets are reassessed at each financial reporting date and are recognized to the extent that it has become probable that sufficient future taxable profits will allow the deferred tax asset to be recovered.
Deferred tax assets and liabilities are measured at the tax rates that are expected to apply to the year when the asset is realized or the liability is settled, based on tax rates (and tax laws) that have been enacted or substantively enacted as at the financial reporting date.
Deferred tax relating to items recognized directly in OCI is recognized in consolidated statement of comprehensive income. Deferred tax assets and deferred tax liabilities are offset, if a legally enforceable right exists to offset current tax assets against current tax liabilities and the deferred taxes relate to the same taxable entity and the same taxation authority.
VAT Revenues, expenses and assets are recognized, net of the amount of VAT except:
• where the VAT incurred on a purchase of assets or services is not recoverable from the tax authority, in which case the VAT is recognized as part of the cost of acquisition of the asset or as part of the expense item as applicable; and
• where receivables and payables are stated with the amount of VAT included.
The net amount of VAT recoverable from the taxation authority is recorded as “Input VAT” under the “Other noncurrent assets” account in the consolidated statement of financial position. Subject to approval of the taxation authority, input VAT can be claimed for refund or as tax credit for payment of certain types of taxes due to the Company. Input VAT claims granted by the taxation authority is separately presented as “Tax Credit Certificates” under the “Other noncurrent assets” account. Earnings (Loss) Per Share (EPS) Basic earnings (loss) per share is computed by dividing net income (loss) for the year attributable to common shareholders of the Parent Company with the weighted average number of common shares outstanding during the year, after giving retroactive effect to any stock dividends or stock splits, if any, declared during the year.
Diluted earnings (loss) per share is computed in the same manner, with the net income (loss) for the year attributable to common shareholders of the Parent Company and the weighted average number of common shares outstanding during the year, adjusted for the effect of all dilutive potential common shares.
As of December 31, 2012 and 2011, the Company does not have any dilutive potential common shares. Hence, diluted EPS is the same as basic EPS.
- 31 -
*SGVMG300344*
Operating Segment The Company’s operating businesses are organized and managed separately according to the nature of the services provided (see Note 7). Discontinued Operations Discontinued operations are excluded from the results of continuing operations and are presented as a single amount as net income (loss) from discontinued operations in the consolidated statement of income.
Events After the Financial Reporting Date Events after the financial reporting date that provide additional information about the Company’s financial position at the financial reporting date (adjusting events) are reflected in the consolidated financial statements. Events after the financial reporting period that are not adjusting events are disclosed in the notes to the consolidated financial statements. Future Changes in Accounting Policies The Company will adopt the following standards and interpretations and assess their impact when these become effective. Except as otherwise indicated, the Company does not expect the adoption of these standards and interpretations to have significant impact on its consolidated financial statements.
New and Amended Standards
• PFRS 7, Financial instruments: Disclosures - Offsetting Financial Assets and Financial Liabilities (Amendments) These amendments require an entity to disclose information about rights of set-off and related arrangements (such as collateral agreements). The new disclosures are required for all recognized financial instruments that are set off in accordance with PAS 32, Financial Instruments: Presentation. These disclosures also apply to recognized financial instruments that are subject to an enforceable master netting arrangement or ‘similar agreement’, irrespective of whether they are set-off in accordance with PAS 32. The amendments require entities to disclose, in a tabular format unless another format is more appropriate, the following minimum quantitative information. This is presented separately for financial assets and financial liabilities recognized at the end of the reporting period: a) The gross amounts of those recognized financial assets and recognized financial liabilities; b) The amounts that are set off in accordance with the criteria in PAS 32 when determining
the net amounts presented in the statement of financial position; c) The net amounts presented in the statement of financial position; d) The amounts subject to an enforceable master netting arrangement or similar agreement
that are not otherwise included in (b) above, including: i. Amounts related to recognized financial instruments that do not meet some or all of
the offsetting criteria in PAS 32; and ii. Amounts related to financial collateral (including cash collateral); and
e) The net amount after deducting the amounts in (d) from the amounts in (c) above.
The amendments to PFRS 7 are to be retrospectively applied and are effective for annual periods beginning on or after January 1, 2013. The amendments affect disclosures only and have no impact on the Company’s financial position or performance.

- 32 -
*SGVMG300344*
• PFRS 10, Consolidated Financial Statements PFRS 10 replaces the portion of PAS 27, Consolidated and Separate Financial Statements, that addresses the accounting for consolidated financial statements. It also includes the issues raised in Standing Interpretations Committee (SIC) 12, Consolidation - Special Purpose Entities. PFRS 10 establishes a single control model that applies to all entities including special purpose entities. The changes introduced by PFRS 10 will require management to exercise significant judgment to determine which entities are controlled, and therefore, are required to be consolidated by a parent, compared with the requirements that were in PAS 27. The standard becomes effective for annual periods beginning on or after January 1, 2013. A reassessment of control was performed by the Parent Company on all its subsidiaries in accordance with the provisions of PFRS 10. The Parent Company determined that there will be no change in the composition of subsidiaries currently included in the Company’s consolidated financial statements.
• PFRS 11, Joint Arrangements
PFRS 11 replaces PAS 31, Interests in Joint Ventures, and SIC 13, Jointly Controlled Entities - Non-Monetary Contributions by Venturers. PFRS 11 removes the option to account for jointly controlled entities using proportionate consolidation. Instead, jointly controlled entities that meet the definition of a joint venture must be accounted for using the equity method. The standard becomes effective for annual periods beginning on or after January 1, 2013.
• PFRS 12, Disclosure of Interests in Other Entities PFRS 12 includes all of the disclosures related to consolidated financial statements that were previously in PAS 27, as well as all the disclosures that were previously included in PAS 31 and PAS 28, Investments in Associates. These disclosures relate to an entity’s interests in subsidiaries, joint arrangements, associates and structured entities. A number of new disclosures are also required. The standard becomes effective for annual periods beginning on or after January 1, 2013.
The adoption of PFRS 12 will affect disclosures only and have no impact on the Company’s financial position or performance.
• PFRS 13, Fair Value Measurement
PFRS 13 establishes a single source of guidance under PFRSs for all fair value measurements. PFRS 13 does not change when an entity is required to use fair value, but rather provides guidance on how to measure fair value under PFRS when fair value is required or permitted. This standard should be applied prospectively as of the beginning of the annual period in which it is initially applied. Its disclosure requirements need not be applied in comparative information provided for periods before initial application of PFRS 13. The standard becomes effective for annual periods beginning on or after January 1, 2013. The Company does not anticipate that the adoption of this standard will have a significant impact on its financial position and performance.

- 33 -
*SGVMG300344*
• PAS 1, Presentation of Financial Statements - Presentation of Items of Other Comprehensive Income (Amendments) The amendments to PAS 1 change the grouping of items presented in OCI. Items that can be reclassified (or “recycled”) to profit or loss at a future point in time (for example, upon derecognition or settlement) will be presented separately from items that will never be recycled. The amendments affect presentation only and have no impact on the Group’s financial position or performance. The amendment becomes effective for annual periods beginning on or after July 1, 2012. The amendments will be applied retrospectively and will result to the modification of the presentation of items of OCI.
• PAS 19, Employee Benefits (Revised)
Amendments to PAS 19 range from fundamental changes such as removing the corridor mechanism and the concept of expected returns on plan assets to simple clarifications and rewording. The revised standard also requires new disclosures such as, among others, a sensitivity analysis for each significant actuarial assumption, information on asset-liability matching strategies, duration of the defined benefits obligation, and disaggregation of plan assets by nature and risk. The amendments become effective for annual periods beginning on or after January 1, 2013. Once effective, the Company has to apply the amendments retroactively to the earliest period presented.
The Company reviewed its existing employee benefits and determined that the amended standard has significant impact on its accounting for retirement benefits. The Company obtained the services of an external actuary to compute the impact to the financial statements upon adoption of the standard. The accounts below are expected to increase (decrease) as follows: Consolidated statements of financial position:
As at December 31,
2012
As at January 1,
2012 Net retirement and other post-employment benefits liability P=777,178,535 P=703,427,597 Deferred income tax assets 78,778,866 70,799,106 Retained earnings (696,914,252) (632,628,491) Non-controlling interest (1,229,863) (638,885)
Consolidated statements of income and statements of comprehensive income:
2012 2011 Net retirement benefits expense (P=381,134,316) (P=5,233,969) Interest cost (113,104,859) (118,552,925) Provision for deferred income tax (7,979,760) (46,127,091) Net income for the year: 343,009,251 4,688,543 Attributable to equity holders of the Parent Company 342,992,964 4,657,703 Attributable to non-controlling interests 16,287 30,840 Other comprehensive income (408,780,429) (415,268,904)

- 34 -
*SGVMG300344*
• PAS 27, Separate Financial Statements (as revised in 2011) As a consequence of the issuance of the new PFRS 10 and PFRS 12, what remains of PAS 27 is limited to accounting for subsidiaries, jointly controlled entities, and associates in the separate financial statements. The adoption of the amended PAS 27 will not have a significant impact on the separate financial statements of the entities in the Company. The amendment becomes effective for annual periods beginning on or after January 1, 2013.
• PAS 28, Investments in Associates and Joint Ventures (as revised in 2011) As a consequence of the issuance of the new PFRS 11 and PFRS 12, PAS 28, Investments in Associates, has been renamed PAS 28, Investments in Associates and Joint Ventures, and describes the application of the equity method to investments in joint ventures in addition to associates. The amendment becomes effective for annual periods beginning on or after January 1, 2013.
• Philippine Interpretation IFRIC 20, Stripping Costs in the Production Phase of a Surface Mine
This interpretation applies to waste removal costs (“stripping costs”) that are incurred in surface mining activity during the production phase of the mine (“production stripping costs”) and addresses the accounting for the benefit from the stripping activity. If the benefit from the stripping activity will be realized in the current period, an entity is required to account for the stripping activity costs as part of the cost of inventory. When the benefit is the improved access to ore, the entity should recognize these costs as a non-current asset, only if certain criteria are met (“stripping activity asset”). The stripping activity asset is accounted for as an addition to, or as an enhancement of, an existing asset. After initial recognition, the stripping activity asset is carried at its cost or revalued amount less depreciation or amortization and less impairment losses, in the same way as the existing asset of which it is a part. The Company expects that this interpretation will not have any impact on its financial position or performance. This interpretation becomes effective for annual periods beginning on or after January 1, 2013. This new interpretation is not relevant to the Company.
• PAS 32, Financial Instruments: Presentation - Offsetting Financial Assets and Financial
Liabilities (Amendments) These amendments clarify the meaning of “currently has a legally enforceable right to set-off” and also clarify the application of the PAS 32 offsetting criteria to settlement systems (such as central clearing house systems) which apply gross settlement mechanisms that are not simultaneous. The amendments affect presentation only and have no impact on the Company’s financial position or performance. The amendments to PAS 32 are to be retrospectively applied for annual periods beginning on or after January 1, 2014.
• PFRS 9, Financial Instruments PFRS 9, as issued, reflects the first phase on the replacement of PAS 39, and applies to the classification and measurement of financial assets and liabilities as defined in PAS 39. Work on impairment of financial instruments and hedge accounting is still ongoing, with a view to replacing PAS 39 in its entirety. PFRS 9 requires all financial assets to be measured at fair value at initial recognition. A debt financial asset may, if the fair value option (FVO) is not invoked, be subsequently measured at amortized cost if it is held within a business model that

- 35 -
*SGVMG300344*
has the objective to hold the assets to collect the contractual cash flows and its contractual terms give rise, on specified dates, to cash flows that are solely payments of principal and interest on the principal outstanding. All other debt instruments are subsequently measured at fair value through profit or loss. All equity financial assets are measured at fair value either through OCI or profit or loss. Equity financial assets held for trading must be measured at fair value through profit or loss. For FVO liabilities, the amount of change in the fair value of a liability that is attributable to changes in credit risk must be presented in OCI. The remainder of the change in fair value is presented in profit or loss, unless presentation of the fair value change in respect of the liability’s credit risk in OCI would create or enlarge an accounting mismatch in profit or loss. All other PAS 39 classification and measurement requirements for financial liabilities have been carried forward into PFRS 9, including the embedded derivative separation rules and the criteria for using the FVO. The adoption of the first phase of PFRS 9 might have an effect on the classification and measurement of the Company’s financial assets, but will potentially have no impact on the classification and measurement of financial liabilities.
PFRS 9 is effective for annual periods beginning on or after January 1, 2015. As of December 31, 2012, the Company did not conduct an evaluation of the impact of the Philippine Financial Reporting Standards (PFRS) 9, Financial Instruments: Classification and Measurement, in its financial statements. The Company did not early adopt PFRS 9 in its December 31, 2012 annual consolidated financial statements. The Company will assess the impact of PFRS 9 in its financial statements upon completion of all the phases of PFRS 9.
• Philippine Interpretation IFRIC 15, Agreements for the Construction of Real Estate
This interpretation covers accounting for revenue and associated expenses by entities that undertake the construction of real estate directly or through subcontractors. The SEC and the Financial Reporting Standards Council have deferred the effectivity of this interpretation until the final Revenue standard is issued by the International Accounting Standards Board and an evaluation of the requirements of the final Revenue standard against the practices of the Philippine real estate industry is completed. Adoption of the interpretation when it becomes effective will not have any impact on the consolidated financial statements of the Company.
Annual Improvements to PFRSs (2009-2011 cycle) The Annual Improvements to PFRSs (2009-2011 cycle) contain non-urgent but necessary amendments to PFRSs. The amendments are effective for annual periods beginning on or after January 1, 2013 and are applied retrospectively. Earlier application is permitted. • PFRS 1, First-time Adoption of PFRS - Borrowing Costs
The amendment clarifies that, upon adoption of PFRS, an entity that capitalized borrowing costs in accordance with its previous generally accepted accounting principles, may carry forward, without any adjustment, the amount previously capitalized in its opening statement of financial position at the date of transition. Subsequent to the adoption of PFRS, borrowing costs are recognized in accordance with PAS 23, Borrowing Costs. The amendment does not apply to the Company as it is not a first-time adopter of PFRS.

- 36 -
*SGVMG300344*
• PAS 1, Presentation of Financial Statements - Clarification of the requirements for comparative information The amendments clarify the requirements for comparative information that are disclosed voluntarily and those that are mandatory due to retrospective application of an accounting policy, or retrospective restatement or reclassification of items in the financial statements. An entity must include comparative information in the related notes to the financial statements when it voluntarily provides comparative information beyond the minimum required comparative period. The additional comparative period does not need to contain a complete set of financial statements. On the other hand, supporting notes for the third balance sheet (mandatory when there is a retrospective application of an accounting policy, or retrospective restatement or reclassification of items in the financial statements) are not required. The amendments affect disclosures only and have no impact on the Company’s financial position or performance.
• PAS 16, Property, Plant and Equipment - Classification of servicing equipment The amendment clarifies that spare parts, stand-by equipment and servicing equipment should be recognized as property, plant and equipment when they meet the definition of property, plant and equipment and should be recognized as inventory if otherwise. The Company is currently assessing the impact of this amendment.
• PAS 32, Financial Instruments: Presentation - Tax effect of distribution to holders of equity
instruments The amendment clarifies that income taxes relating to distributions to equity holders and to transaction costs of an equity transaction are accounted for in accordance with PAS 12. The Company expects that this amendment will not have any impact on its financial position or performance.
• PAS 34, Interim Financial Reporting - Interim financial reporting and segment information
for total assets and liabilities The amendment clarifies that the total assets and liabilities for a particular reportable segment need to be disclosed only when the amounts are regularly provided to the chief operating decision maker and there has been a material change from the amount disclosed in the entity’s previous annual financial statements for that reportable segment. The amendment affects disclosures only and has no impact on the Company’s financial position or performance.
5. Business Combinations Acquisition of BMGPP in 2010 On May 5, 2010, BGI acquired the 150 MW BMGPP in an auction conducted by PSALM where BGI submitted the highest offer price of US$28.3 million. This acquisition was accounted for using PFRS 3 (Revised). Located in Bacon, Sorsogon City and Manito, Albay in the Bicol region, the BMGPP package consists of two steam plant complexes. The Bac-Man I geothermal facility comprises two 55 MW turbines, which were both commissioned in 1993. Bac-Man II, on the other hand, consists of two 20 MW units namely, the Cawayan located in Barangay Basud and the Botong in Osiao, Sorsogon City. The Cawayan unit was commissioned in 1994 and the Botong unit in 1998. EDC supplies the steam that fuels these plants.

- 37 -
*SGVMG300344*
On September 3, 2010, BGI remitted to PSALM the amount of P=1,279.7 million representing the full payment of the Bac-Man power plants acquisition. The fair values of the identifiable assets that were recognized on acquisition date are as follows:
Fair Values Property, plant and equipment (Note 13) P=1,203,700,070 Parts and supplies inventories (Note 11) 76,024,930 Total assets 1,279,725,000 Percentage of ownership acquired 100% Share in assets acquired 1,279,725,000 Goodwill arising from acquisition – Total acquisition cost P=1,279,725,000
The valuation of the BMGPP including the identification and valuation of any other identifiable assets was adjusted in September 2011. The BMGPP is currently under rehabilitation to restore capacity and reliability. Accordingly, no depreciation expense and related deferred income tax were recognized for its assets and thus, no corresponding adjustment in the retained earnings was necessary in 2011 and 2010. The net loss of BGI from the acquisition date until December 31, 2010 amounted to P=32.5 million, which has been included in the Company’s results of operations in 2010. The net income (loss) of BMGPP for the year ended December 31, 2010, as though the acquisition date for the business combination had been as of January 1, 2010, is impracticable to determine since the Company has no access to PSALM’s records. The cash outflow related to the acquisition amounted to P=1,304.5 million which consists of the P=1,279.7 million acquisition cost and P=24.8 million transfer and documentary stamp taxes.
6. Discontinued Drilling Operations
In October 2012, the Company discontinued its drilling services to Lihir in Papua New Guinea. As of December 31, 2012, the remaining assets of the drilling component pertain to trade receivables only amounting to P=133.8 million (see Note 9). Equipment and other tools used in drilling operations were then being leased from third parties by the Parent Company.
Following are the results of the drilling component’s operations for the years ended December 31, 2012, 2011 and 2010:
2012 2011 2010 Revenue P=660,681,295 P=712,789,795 P=748,691,558 Cost of drilling services: Purchased services and utilities (242,739,844) (369,188,442) (235,337,900) Rental, insurances and taxes (150,270,290) (226,729,448) (23,632,853) Repairs and maintenance (64,518,763) (54,784,118) (71,808,060) Parts and supplies issued (34,198,258) (65,910,688) (29,104,021) Business and related expenses (3,614,955) (36,947,353) (39,200,965) (Forward)

- 38 -
*SGVMG300344*
2012 2011 2010 Depreciation (Note 3) (P=1,259,855) (P=1,110,041) (P=3,314,593) Personnel costs (Note 25) (310,177) (17,523,676) (53,688,297)
(496,912,142) (772,193,766) (456,086,689)General and administrative expenses: Depreciation (Note 3) (17,838,394) (17,801,118) (850,188) Purchased services and utilities (2,675,127) (5,047,925) (10,322,732) Parts and supplies issued (1,749,986) (3,058,955) (8,278,843) Personnel cost (Note 25) (1,285,920) (3,257,877) (16,753,694) Rental, insurances and taxes (886,126) (928,852) (3,440,640) Business and related expenses (575,725) (1,179,390) (2,612,674) Repairs and maintenance (137,900) (588,185) (3,700,696)
(25,149,178) (31,862,302) (45,959,467)
Financial income (expenses): Interest expense – (244,147) – Interest income – – 5,979
– (244,147) 5,979
Other income (charges): Foreign exchange gains 733,689 2,323,950 2,023,574 Others (74,457) (37,639) (134,194)
659,232 2,286,311 1,889,380 Income (loss) before income tax 139,279,207 (89,224,109) 248,540,761 Benefit from (provision for) income tax (Note 30) Current – – (73,141,019) Deferred (41,783,762) 7,985,626 (1,421,209)
(41,783,762) 7,985,626 (74,562,228)Net income (loss) from discontinued operations (Note 31) P=97,495,445 (P=81,238,483) P=173,978,533
Net income (loss) from discontinued operations is entirely attributable to equity holders of the Parent Company.
The net cash flows from (used in) the drilling component operations amounted to P=95.0 million, (P=38.6 million), and P=242.6 million, for the years ended December 31, 2012, 2011 and 2010, respectively. There were no cash flows related to financing and investing activities for each of the three years in the period ended December 31, 2012. The basic and diluted earnings per share for the discontinued operations are shown in Note 31.
7. Operating Segment Information The Company’s operating businesses are organized and managed separately according to the nature of the products and services provided, with each segment representing a strategic business unit that offers different products and serves different markets. The Company’s identified operating segments below are consistent with the segments reported to the BOD, which is the Chief Operating Decision Maker of the Company.
a. Electricity segment - This segment pertains to: (1) EDC’s power plants covered mainly by
long-term PPAs with NPC; (2) FG Hydro’s spot sales to the WESM and with various DUs covered by PSCs; and (3) GCGI’s sales to WESM and various NPC-assigned and new customers covered by PSCs and PSAs, respectively.

- 39 -
*SGVMG300344*
b. Steam segment - This segment relates to EDC’s sale of steam to GCGI and NPC covered by SSAs and GRESCs.
c. Drilling - This segment relates to segment performing drilling services for Lihir Gold Ltd. in
Papua New Guinea. The Company has one geographical segment since it derives principally all its revenues from domestic operations. Management monitors the operating results of the business segments separately for the purpose of making decisions about resources to be allocated and of assessing performance. Finance costs, finance income, income taxes and other charges and income are managed on a group basis. Segment performance is evaluated based on net income (loss) for the year and earnings (loss) before interest, taxes, and depreciation and amortization (EBITDA). Net income (loss) for the year is measured consistent with consolidated net income (loss) reported in the consolidated financial statements. EBITDA is calculated as total revenues minus costs of sales of electricity and steam and general and administrative expenses, excluding non-cash items such as depreciation and amortization, impairment loss on property, plant and equipment of NNGP, and loss on disposal of property, plant and equipment, among others.
NPC is the main customer for the electricity segment which comprised 46.0% and 55.5% of the total electricity revenue in 2012 and 2011, respectively.
Financial information on the operating segments are summarized as follows:
Electricity Steam Drilling Eliminations
Discontinued Operations Total
Year Ended December 31, 2012
Segment revenue from external customers P=28,368,552,055 P=– P=660,681,295
P=– (P=660,681,295) P=28,368,552,055
Intersegment revenue 377,058,607 5,649,638,220 – (6,026,696,827) – – Total segment revenue 28,745,610,662 5,649,638,220 660,681,295 (6,026,696,827) (660,681,295) 28,368,552,055 Segment expenses (16,742,876,329) (3,961,746,814) (522,061,320) 6,026,696,827 522,061,320 (14,677,926,316)Segment results P=12,002,734,333 P=1,687,891,406 P=138,619,975 P=– (P=138,619,975) 13,690,625,739 Unallocated expenses (228,494,958)Unallocated interest income 364,640,989 Unallocated interest expense (3,703,648,469)Unallocated other income - net 891,753,095 Unallocated provision for
income taxes (P=736,664,955)Net income from discontinuing
operations 97,495,445 Net income P=10,375,706,886 EBITDA P=15,239,493,650 P=2,160,465,340 P=157,718,224 P=– P=– P=17,557,677,214 Unallocated expenses (227,388,035) P=17,330,289,179

- 40 -
*SGVMG300344*
Electricity Steam Drilling Eliminations
Discontinued Operations Total
Year Ended December 31, 2011
Segment revenue from external customers P=24,539,607,457 P=– P=712,789,795
P=– (P=712,789,795) P=24,539,607,457
Intersegment revenue 217,305,612 6,396,696,182 – (6,614,001,794) – – Total segment revenue 24,756,913,069 6,396,696,182 712,789,795 (6,614,001,794) (712,789,795) 24,539,607,457 Segment expenses (22,439,521,583) (4,374,623,221) (804,056,068) 6,614,001,794 804,056,068 (20,200,143,010)Segment results P=2,317,391,486 P=2,022,072,961 (P=91,266,273) P=– P=91,266,273 4,339,464,447 Unallocated expenses (52,238,977)Unallocated interest income 390,212,719 Unallocated interest expense (4,106,516,315)Unallocated other income - net 9,480,594 Unallocated benefit from
income taxes 115,621,829 Net loss from discontinuing
operations (81,238,483) Net income P=614,785,814 EBITDA P=10,591,745,683 P=2,762,529,802 (P=75,801,534) P=– P=– P=13,278,473,951 Unallocated expenses (40,940,859) P=13,237,533,092
Electricity Steam Drilling Eliminations Discontinued
Operations Total Year Ended December 31,
2010
Segment revenue from external
customers P=22,944,227,877 P=1,208,696,413 P=748,691,558
P=– (P=748,691,558) P=24,152,924,290 Intersegment revenue 243,331,926 5,297,367,214 – (5,540,699,140) – – Total segment revenue 23,187,559,803 6,506,063,627 748,691,558 (5,540,699,140) (748,691,558) 24,152,924,290 Segment expenses (20,043,936,340) (3,425,076,908) (502,046,158) 5,540,699,140 502,046,158 (17,928,314,108)Segment results P=3,143,623,463 P=3,080,986,719 P=246,645,400 P=– (P=246,645,400) 6,224,610,182 Unallocated expenses (17,498,091)Unallocated interest income 347,689,037 Unallocated interest expense (3,708,457,266)Unallocated other income - net 2,077,375,953 Unallocated provision for
income taxes (702,622,483)Net income from discontinuing
operations 173,978,533 Net income P=4,395,075,865 EBITDA P=10,142,991,914 P=3,372,419,841 P=249,971,521 P=– P=– P=13,765,383,276 Unallocated expenses (17,475,297) P=13,747,907,979
Electricity Steam Drilling Eliminations Total As of and for the year ended December 31, 2012
Segment assets P=81,710,707,654 P=28,497,988,629 P=133,778,007 (P=32,476,936,892) P=77,865,537,398 Unallocated corporate assets 16,437,749,754 Total assets P=94,303,287,152
Segment liabilities P=38,269,810,409 P= 18,859,582,001 P=– (P=2,537,851,309) 54,591,541,101 Unallocated corporate liabilities 4,277,891,163 Total liabilities P=58,869,432,264
Capital expenditure P=3,566,320,958 P=1,524,917,687 P=– P=– P=5,091,238,645 Unallocated capital expenditure 1,840,291,120 Total capital expenditure
(Note 13) P=6,931,529,765
Depreciation and amortization (P=3,066,194,364) (P=492,227,636) (P=19,098,249) P=– (P=3,577,520,249)Unallocated depreciation and
amortization (1,106,922)Total depreciation and
amortization (Note 12) (P=3,578,627,171)

- 41 -
*SGVMG300344*
Electricity Steam Drilling Eliminations Total As of and for the year ended December 31, 2012
Other non-cash items (P=170,564,952) P=19,653,702 P=– P=– (150,911,250) Unallocated non-cash items – Total other non-cash items (P=150,911,250)
Electricity Steam Drilling Eliminations Total As of and for the year ended December 31, 2011
Segment assets P=63,312,247,695 P=12,376,428,799 P=79,242,187 P=– P=75,767,918,681 Unallocated corporate assets 14,249,898,103 Total assets P=90,017,816,784
Segment liabilities P=38,501,885,213 P=20,589,217,647 P=– P=– P=59,091,102,860 Unallocated corporate liabilities 1,280,112,431 Total liabilities P=60,371,215,291
Capital expenditure P=4,674,950,095 P=4,106,780,031 P=158,656,411 P=– P=8,940,386,537 Unallocated capital expenditure 596,087,897 Total capital expenditure
(Note 13) P=9,536,474,434
Depreciation and amortization (P=3,035,691,787) (P=386,991,348) (P=18,973,159) P=– (P=3,441,656,294) Unallocated depreciation and
amortization
(218,203) Total depreciation and
amortization (Note 13)
(P=3,441,874,497)
Impairment loss P=4,998,608,008 P=– P=– P=– P=4,998,608,008
Other non-cash items (P=305,215,436) (P=340,416,065) (P=198,180) P=– (P=645,829,681) Unallocated non-cash items 23,722,640 Total other non-cash items (P=622,107,041)
The following table shows the Company’s reconciliation of EBITDA to the consolidated net income for the years ended December 31, 2012, 2011 and 2010.
2012 2011 2010 EBITDA P=17,330,289,179 P=13,237,533,092 P=13,747,907,979 Add (Deduct):
Interest expense (Notes 6 and 26) (3,703,648,469) (4,106,760,462) (3,708,457,266) Depreciation and amortization (Notes 13, 14,
23 and 24) (3,578,627,172) (3,441,874,497) (3,445,004,630) Foreign exchange gains (losses) - net (Notes 6
and 27) 1,054,200,463 (108,728,379) (13,871,472) Benefit from (provision for) income tax
(Note 30) (778,448,716) 123,607,455 (777,184,715) Interest income 364,640,989 390,212,719 347,695,016
Provision for doubtful accounts (Notes 9, 16 and 24) (234,415,270) (408,598,578) (75,257,592)
Reversal of (provision for) impairment of parts and supplies inventories (Notes 3, 11 and 24) 83,504,018 (168,959,002) 15,039,061
Derivative gains - net (Note 33) 36,160 108,319,377 436,998,854 Impairment loss on property, plant and equipment of NNGP (Notes 3 and 13) – (4,998,608,008) (3,390,000,000)
Miscellaneous - net (Note 6 and 28) (161,824,296) (11,357,903) 1,257,210,630 Consolidated net income P=10,375,706,886 P=614,785,814 P=4,395,075,865

- 42 -
*SGVMG300344*
The Parent Company has intersegment revenue from/to GCGI for the sale of steam/electricity. Intersegment revenues are all eliminated in consolidation. Segment information is measured in conformity with the accounting policies adopted for preparing and presenting the consolidated financial statements. Intersegment revenue are made at normal commercial terms and conditions.
Unallocated expenses pertain to expenses of the corporate, technical and administrative support groups while unallocated corporate assets and liabilities which include among others certain cash and cash equivalents, property, plant and equipment, parts and supplies inventories, trade and other payables and retirement and post-retirement benefits, pertain to the Head Office and are managed on a group basis.
8. Cash and Cash Equivalents
2012 2011 Cash on hand and in banks P=2,409,061,954 P=692,764,092 Cash equivalents 9,011,082,249 11,800,642,871 P=11,420,144,203 P=12,493,406,963
Cash in banks earns interest at the respective bank deposit rates. Cash equivalents consist of money market placements, which are made for varying periods of up to three months depending on the immediate cash requirements of the Company. Total interest earned, net of final tax, amounted to P=316.4 million in 2012, P=376.1 million in 2011 and P=318.3 million in 2010 (see Notes 6 and 33).
9. Trade and Other Receivables
2012 2011 Trade (Note 6) P=3,993,189,878 P=3,336,433,682 Others: Non-trade accounts receivable 68,133,713 99,398,810 Advances to employees 62,787,120 37,934,595 Loans and notes receivables 59,983,898 59,331,933 Employee receivables 7,100,074 8,896,656 Claims receivables 172,672 153,322 198,177,477 205,715,316 4,191,367,355 3,542,148,998 Less allowance for doubtful accounts 75,602,750 130,839,470 P=4,115,764,605 P=3,411,309,528
Trade receivables are non-interest-bearing and are generally collectible in 30 to 60 days. Majority of the Company’s trade receivables came from revenues from sale of electricity to NPC. Past due trade receivables earn interest either based at a six-month US treasury rate plus 5% or average non-prime lending rate per annum (see Notes 26 and 33).
Non-trade receivables include accrued interest, receivable from suppliers and other receivables arising from transactions not in the usual course of the Company’s business such as disposal of property and equipment.

- 43 -
*SGVMG300344*
The rollforward analysis of allowance for doubtful accounts on trade receivables as presented below is based on specific impairment.
2012 2011 Balance at beginning of year P=130,839,470 P=30,606,792 Provision for doubtful accounts (Note 24) 31,775,230 100,232,678 Write-off (86,083,931) – Recovery (Note 24) (928,019) – Balance at end of year P=75,602,750 P=130,839,470
In 2012, the Company has directly written-off trade receivables amounting to P=282.0 thousand. 10. AFS Investments
2012 2011 Current - Quoted government debt securities
(Note 33) P=132,345,200 P=673,853,680 Noncurrent (Note 33): Quoted government debt securities 473,624,637 – Quoted equity securities (Note 22) 233,426,506 20,369,374 Unquoted equity securities 74,550 74,550 707,125,693 20,443,924 Total P=839,470,893 P=694,297,604
Quoted government debt securities consist of investments in Republic of the Philippines (ROP) bonds with maturities between 2013 and 2016 and interest rates ranging from 8.00% to 9.00% per annum. Such bonds were acquired at a discount.
Investments in equity securities consist mainly of shares traded in the PSE.
The movements of the unrealized gain or loss related to the foregoing investments are presented in the consolidated statements of comprehensive income with details as follows:
2012 2011 2010 Net accumulated unrealized gain
on AFS investments at beginning of year P=91,758,915 P=119,718,797 P=113,177,323
Changes in fair value recognized in equity (Note 33) 19,763,810 (27,724,193) 6,541,474
Net unrealized gain removed from equity and recognized in profit or loss (Note 33) – (235,689) –
19,763,810 (27,959,882) 6,541,474 Net accumulated unrealized gain
on AFS investments at end of year P=111,522,725 P=91,758,915 P=119,718,797
Changes in fair value recognized in the consolidated statements of comprehensive income refer to unrealized gains and losses during the period brought about by the temporary increase or decrease in the fair value of the debt and equity instruments.

- 44 -
*SGVMG300344*
In 2011, the issuer redeemed for P=4.75 million the Company’s investment in US$110,000 ROP global bond prior to its original maturity. The transaction resulted to gain on early redemption amounting to P=271.3 million (see Note 28).
11. Parts and Supplies Inventories
2012 2011 On hand:
Drilling tubular products and equipment spares P=1,631,165,807 P=1,648,876,310 Power plant spares 682,729,900 718,777,618 Pump, production/steam gathering system,
steam turbine, valves and valve spares 556,513,309 305,461,738 Electrical, cable, wire product and compressor
spares 114,077,988 83,543,105 Chemical, chemical products, gases and catalyst 107,332,094 113,397,104 Heavy equipment spares 63,100,607 90,293,956 Construction and hardware supplies, stationeries
and office supplies, hoses, communication and other spares and supplies 63,022,992 20,268,296
Automotive, mechanical, bearing, seals, v-belt, gasket, tires and batteries 48,468,361 39,385,963
Measuring instruments, indicators and tools, safety equipment and supplies 40,630,239 28,640,098
3,307,041,297 3,048,644,188 In transit 31,784,572 307,123,465
P=3,338,825,869 P=3,355,767,653
Inventories in transit include items not yet received but ownership or title to the goods has already passed to the Company.
Parts and supplies inventories include items that are carried at net realizable value amounting to P=328.7 million and P=260.8 million as of December 31, 2012 and 2011, respectively, and have a cost amounting to P=374.8 million and P=520.8 million, respectively. The rest of the parts and supplies inventories are carried at cost.
Provision for (reversal of) impairment of parts and supplies inventories amounted to (P=83.5 million) in 2012, P=169.0 million in 2011 and (P=15.0 million) in 2010 (see Note 24). The amount of inventory charged to expense amounted to P=958.5 million in 2012, P=1,180.2 million in 2011 and P=894.8 million in 2010 (see Notes 6, 23 and 24). Details of parts and supplies inventories issued are as follows:
2012 2011 2010 Cost of sales of electricity and
steam (Note 23) P=768,473,850 P=915,447,365 P=692,061,138 General and administrative
expenses (Note 24) 154,094,455 195,747,618 165,307,006 Discontinued drilling operations
(Note 6) 35,948,244 68,969,643 37,382,864 P=958,516,549 P=1,180,164,626 P=894,751,008

- 45 -
*SGVMG300344*
12. Other Current Assets
2012 2011 Withholding tax certificates P=389,256,730 P=225,008,549 Prepaid expenses 199,507,054 141,483,327 Tax credit certificates (Note 16) 63,000,000 300,000,000 Advances to contractors 40,261,234 74,966,065 Others 239,816 453,316
P=692,264,834 P=741,911,257
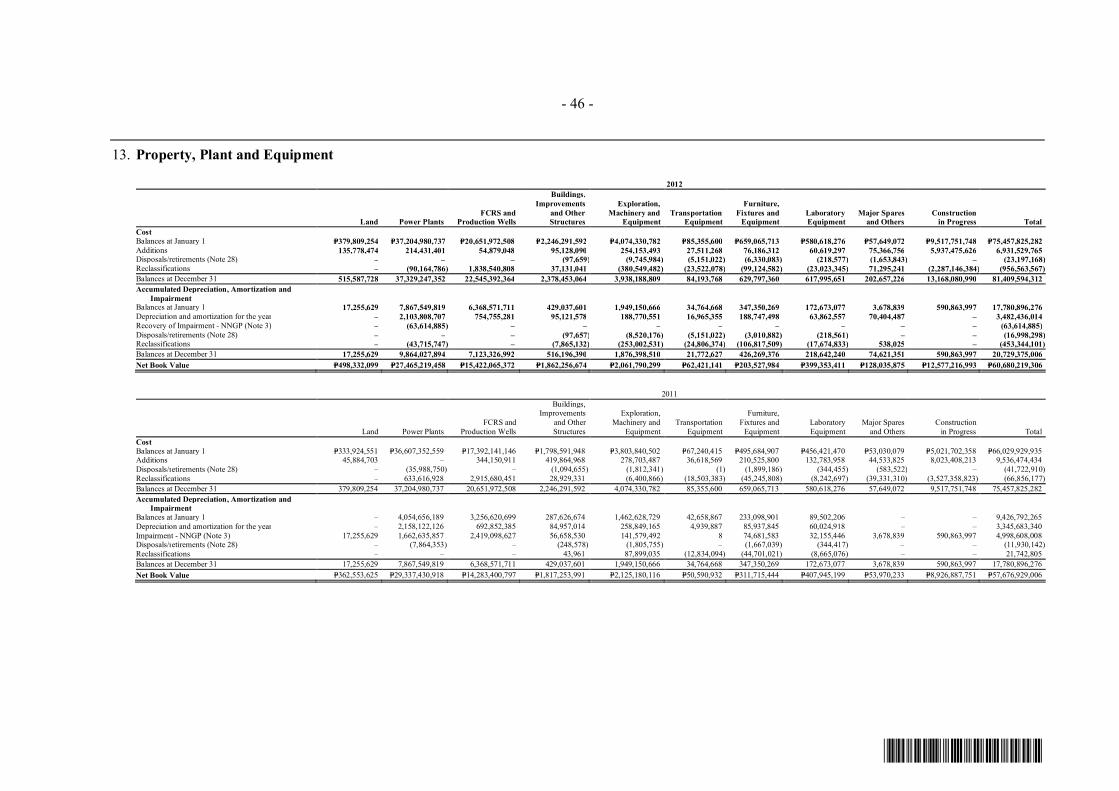
- 46 -
*SGVMG300344*
13. Property, Plant and Equipment
2012
Land Power Plants FCRS and
Production Wells
Buildings, Improvements
and Other Structures
Exploration, Machinery and
Equipment Transportation
Equipment
Furniture, Fixtures and
Equipment Laboratory Equipment
Major Spares and Others
Construction in Progress Total
Cost Balances at January 1 P=379,809,254 P=37,204,980,737 P=20,651,972,508 P=2,246,291,592 P=4,074,330,782 P=85,355,600 P=659,065,713 P=580,618,276 P=57,649,072 P=9,517,751,748 P=75,457,825,282 Additions 135,778,474 214,431,401 54,879,048 95,128,090 254,153,493 27,511,268 76,186,312 60,619,297 75,366,756 5,937,475,626 6,931,529,765 Disposals/retirements (Note 28) – – – (97,659) (9,745,984) (5,151,022) (6,330,083) (218,577) (1,653,843) – (23,197,168) Reclassifications – (90,164,786) 1,838,540,808 37,131,041 (380,549,482) (23,522,078) (99,124,582) (23,023,345) 71,295,241 (2,287,146,384) (956,563,567) Balances at December 31 515,587,728 37,329,247,352 22,545,392,364 2,378,453,064 3,938,188,809 84,193,768 629,797,360 617,995,651 202,657,226 13,168,080,990 81,409,594,312 Accumulated Depreciation, Amortization and
Impairment Balances at January 1 17,255,629 7,867,549,819 6,368,571,711 429,037,601 1,949,150,666 34,764,668 347,350,269 172,673,077 3,678,839 590,863,997 17,780,896,276 Depreciation and amortization for the year – 2,103,808,707 754,755,281 95,121,578 188,770,551 16,965,355 188,747,498 63,862,557 70,404,487 – 3,482,436,014 Recovery of Impairment - NNGP (Note 3) – (63,614,885) – – – – – – – – (63,614,885) Disposals/retirements (Note 28) – – – (97,657) (8,520,176) (5,151,022) (3,010,882) (218,561) – – (16,998,298) Reclassifications – (43,715,747) – (7,865,132) (253,002,531) (24,806,374) (106,817,509) (17,674,833) 538,025 – (453,344,101) Balances at December 31 17,255,629 9,864,027,894 7,123,326,992 516,196,390 1,876,398,510 21,772,627 426,269,376 218,642,240 74,621,351 590,863,997 20,729,375,006 Net Book Value P=498,332,099 P=27,465,219,458 P=15,422,065,372 P=1,862,256,674 P=2,061,790,299 P=62,421,141 P=203,527,984 P=399,353,411 P=128,035,875 P=12,577,216,993 P=60,680,219,306
2011
Land Power Plants FCRS and
Production Wells
Buildings, Improvements
and Other Structures
Exploration, Machinery and
Equipment Transportation
Equipment
Furniture, Fixtures and
Equipment Laboratory Equipment
Major Spares and Others
Construction in Progress Total
Cost Balances at January 1 P=333,924,551 P=36,607,352,559 P=17,392,141,146 P=1,798,591,948 P=3,803,840,502 P=67,240,415 P=495,684,907 P=456,421,470 P=53,030,079 P=5,021,702,358 P=66,029,929,935 Additions 45,884,703 – 344,150,911 419,864,968 278,703,487 36,618,569 210,525,800 132,783,958 44,533,825 8,023,408,213 9,536,474,434 Disposals/retirements (Note 28) – (35,988,750) – (1,094,655) (1,812,341) (1) (1,899,186) (344,455) (583,522) – (41,722,910) Reclassifications – 633,616,928 2,915,680,451 28,929,331 (6,400,866) (18,503,383) (45,245,808) (8,242,697) (39,331,310) (3,527,358,823) (66,856,177) Balances at December 31 379,809,254 37,204,980,737 20,651,972,508 2,246,291,592 4,074,330,782 85,355,600 659,065,713 580,618,276 57,649,072 9,517,751,748 75,457,825,282 Accumulated Depreciation, Amortization and
Impairment Balances at January 1 – 4,054,656,189 3,256,620,699 287,626,674 1,462,628,729 42,658,867 233,098,901 89,502,206 – – 9,426,792,265 Depreciation and amortization for the year – 2,158,122,126 692,852,385 84,957,014 258,849,165 4,939,887 85,937,845 60,024,918 – – 3,345,683,340 Impairment - NNGP (Note 3) 17,255,629 1,662,635,857 2,419,098,627 56,658,530 141,579,492 8 74,681,583 32,155,446 3,678,839 590,863,997 4,998,608,008 Disposals/retirements (Note 28) – (7,864,353) – (248,578) (1,805,755) – (1,667,039) (344,417) – – (11,930,142) Reclassifications – – – 43,961 87,899,035 (12,834,094) (44,701,021) (8,665,076) – – 21,742,805 Balances at December 31 17,255,629 7,867,549,819 6,368,571,711 429,037,601 1,949,150,666 34,764,668 347,350,269 172,673,077 3,678,839 590,863,997 17,780,896,276 Net Book Value P=362,553,625 P=29,337,430,918 P=14,283,400,797 P=1,817,253,991 P=2,125,180,116 P=50,590,932 P=311,715,444 P=407,945,199 P=53,970,233 P=8,926,887,751 P=57,676,929,006

- 47 -
*SGVMG300344*
Capitalization of Borrowing Cost As discussed in Note 5, BMGPP is currently under rehabilitation which started in September 2010. In 2012, the Company capitalized borrowing cost amounting to P=213.6 million from general borrowings using a capitalization rate of 6.15%. Impairment Assessment of NNGP In 2011, after the five-month shutdown of NNGP starting November 22, 2010, NNGP operated from April to June 2011 to complete its geothermal resource testing. Based on the subsequent technical assessment, the Company has come to a conclusion that the sustainable operation of NNGP is only at 5 to10 MW only.
The Company evaluates the assets on a CGU basis for any indication of impairment at each financial reporting date. The Company assessed that there continues to be an indication of impairment for NNGP and, based on its impairment testing, recognized an impairment loss amounting to nil in 2012, P=4,998.6 million in 2011 and P=3,390.0 million in 2010 (see Note 3).
In February 2012, EDC transferred vacuum pumps from NNGP to the Palinpinon Power Plant owned by GCGI. Since these transferred assets can still be utilized and were included in the CGU of the Palinpinon Power Plant, the Company recognized a corresponding reversal of impairment loss amounting to P=63.6 million, representing the net book value of the assets transferred had no impairment loss been previously recognized (see Note 28). As of December 31, 2012 and 2011, accumulated impairment loss of NNGP asset amounted to P=8,674.0 million and P=8,737.6 million, respectively. Estimated Rehabilitation and Restoration Costs FCRS and production wells include the estimated rehabilitation and restoration costs of the Company’s steam fields and power plants’ contract areas at the end of the contract period. These were based on technical estimates of probable costs, which may be incurred by the Company in the rehabilitation and restoration of the said steam fields and power plants’ contract areas from 2031 up to 2044, discounted using the Company’s risk-adjusted rate. Details of the cost and related accumulated amortization of estimated rehabilitation and restoration costs follow:
2012 2011 Cost P=399,029,959 P=344,150,911 Accumulated amortization 52,745,789 28,719,118 Net book value P=346,284,170 P=315,431,793
The corresponding provision for rehabilitation and restoration costs amounting to P=493.5 million in 2012 and P=406.8 million in 2011 is recorded under “Provisions and other long-term liabilities” account in the consolidated statements of financial position (see Note 20). Accretion expense amounted to P=27.6 million and P=61.1 million for the years ended December 31, 2012 and 2011, respectively (see Note 26). Subsequent to its full impairment, the unwinding of discount on NNGP provision for rehabilitation and restoration costs amounted to P=4.2 million and P=1.5 million for the years ended December 31, 2012 and 2011, respectively.
Revenue Generated during Testing Period Since 2010, BGI’s power plants are undergoing rehabilitation. In 2011, BGI performed testing procedures in preparation for its planned commercial operations. For the years ended

- 48 -
*SGVMG300344*
December 31, 2012 and December 31, 2011, the revenue from electricity generated during the testing period amounting to P=520.4 million and P=38.0 million, respectively, were offset against the cost of property, plant and equipment. Pantabangan Refurbishment and Upgrade Project Contract (PRUP) In accordance with the PRUP, FG Hydro completed the refurbishment and upgrade of Unit 1 of PAHEP in 2009 and Unit 2 in 2010 (see Note 42). The PRUP provides for the replacement and upgrade of significant parts and equipment of PAHEP. For the years ended December 31, 2012, 2011 and 2010, the cost, related accumulated depreciation and net book value of the property, plant and equipment that were replaced amounting to nil, P=29.0 million and P=398.9 million, respectively, were derecognized and the corresponding net book values were included in the “Miscellaneous - net” account in the consolidated statements of income (see Note 28). Depreciation and Amortization Details of depreciation and amortization charges recognized in the consolidated statements of income are shown below:
2012 2011 2010 Property, plant and equipment P=3,482,436,014 P=3,345,683,340 P=3,348,813,473 Intangible assets (Note 14) 96,191,157 96,191,157 96,191,157 P=3,578,627,171 P=3,441,874,497 P=3,445,004,630
Costs of sales of electricity and steam (Note 23) P=3,195,213,914 P=3,178,921,446 P=3,233,623,822
General and administrative expenses (Note 24) 364,315,008 244,041,892 207,216,027
Discontinued drilling operations (Note 6) 19,098,249 18,911,159 4,164,781
P=3,578,627,171 P=3,441,874,497 P=3,445,004,630
Reclassifications The reclassifications in the cost of property, plant and equipment include the capitalized depreciation charges amounting to P=57.9 million and P=86.4 million under construction in progress which relates to ongoing drilling of wells as of December 31, 2012 and 2011, respectively.
14. Goodwill and Intangible Assets
2012
Goodwill Water Rights
Other Intangible
Assets Total Cost Balances at January 1 P=2,535,051,530 P=2,404,778,918 P=258,394,939 P=5,198,225,387 Additions – – 209,349,428 209,349,428 Balances at December 31 2,535,051,530 2,404,778,918 467,744,367 5,407,574,815 Accumulated Amortization Balances at January 1 – 492,979,679 – 492,979,679 Amortization (Notes 13
and 23)
–
96,191,157
– 96,191,157 Balances at December 31 – 589,170,836 – 589,170,836 Net Book Value P=2,535,051,530 P=1,815,608,082 P=467,744,367 P=4,818,403,979

- 49 -
*SGVMG300344*
2011
Goodwill Water Rights Other
Intangible Assets Total Cost Balances at January 1 P=2,535,051,530 P=2,404,778,918 P=– P=4,939,830,448 Additions – – 258,394,939 258,394,939 Balances at December 31 2,535,051,530 2,404,778,918 258,394,939 5,198,225,387 Accumulated Amortization Balances at January 1 – 396,788,522 – 396,788,522 Amortization (Notes 13
and 23)
–
96,191,157
– 96,191,157 Balances at December 31 – 492,979,679 – 492,979,679 Net Book Value P=2,535,051,530 P=1,911,799,239 P=258,394,939 P=4,705,245,708 Goodwill On September 2, 2009, GCGI acquired the 192.5 MW Palinpinon (in Negros Oriental) and 112.5 MW Tongonan 1 (in Leyte) geothermal power plants in an auction conducted by PSALM where GCGI submitted the highest complying financial bid of US$220.0 million. This financial bid was subsequently reduced by US$6.7 million as PSALM agreed that the Company will directly assume the obligations to procure the equipment/services indicated in the Purchase Requisitions being processed by NPC under Schedule R-Purchase Orders in the Asset Purchase Agreement (APA). The total acquisition cost incurred by the Company amounted to P=10.7 billion resulting to goodwill of P=2,241.7 million.
On September 8, 2006, FG Hydro participated and won the bid for the 112 MW PAHEP/MAHEP facility conducted by PSALM in connection with the privatization of NPC assets. FG Hydro paid a total consideration of US$129.0 million (P=6.5 billion) and recognized goodwill amounting to P=293.3 million. Details of the impairment review for goodwill are shown in Note 3. Water rights
Water rights are amortized using the straight-line method over 25 years, which is the term of the Agreement with NIA. The remaining amortization period of water rights is 18.9 years as of December 31, 2012. Other intangible assets Other intangible assets pertain to the Company’s wind energy project development costs.
Goodwill, water rights and other intangible asset are not impaired as of December 31, 2012 and 2011 based on the assessments performed by management.
15. Exploration and Evaluation Assets
2012 2011 Balances at January 1 P=1,087,079,413 P=1,170,407,115 Additions 517,025,999 187,939,410 Transfers – (271,267,112) Balances at December 31 P=1,604,105,412 P=1,087,079,413

- 50 -
*SGVMG300344*
Details of exploration and evaluation assets per project are as follows:
2012 2011 Cabalian P=574,643,959 P=574,563,067 Mindanao III 485,749,683 361,289,046 Rangas/Kayabon 480,107,120 94,385,782 Dauin/Bacong 55,882,215 55,471,572 Others 7,722,435 1,369,946 P=1,604,105,412 P=1,087,079,413
16. Other Noncurrent Assets
2012 2011 Input VAT P=4,308,566,903 P=3,270,286,773 Tax credit certificates 1,567,371,054 1,338,884,447 Special deposits and funds 221,843,903 123,278,392 Prepaid expenses 86,057,057 32,745,755 Long-term receivables 79,452,797 61,062,125 Others 63,444,527 27,670,094 6,326,736,241 4,853,927,586 Less allowance for doubtful accounts 624,990,741 422,722,403 P=5,701,745,500 P=4,431,205,183
Input VAT Input VAT includes the outstanding input VAT claims of P=1,246.2 million as of December 31, 2012 and 2011. Input VAT claims for 2010 (P=583.2 million), 2009 (P=149.2 million), 2008 (P=131.6 million), 2007 (P=89.1 million) and 2006 (P=293.1 million) are still pending with the Bureau of Internal Revenue (BIR)/Court of Tax Appeals as of December 31, 2012. Tax credit certificates (TCCs) In April and June 2010, P=1,638.9 million TCCs were issued by the BIR to the Parent Company with respect to its input VAT claims on Build-Operate-Transfer (BOT) fees from 1998 and 1999 amounting to P=1,894.7 million. Such TCCs shall be utilized over a period of five years starting in 2011 to 2015 with a cap of P=300.0 million per year, except in 2015 where the remaining balance may be fully applied. The remaining balance of input VAT claims of P=255.8 million, which was disallowed by the BIR, was written off in 2010. On August 17, 2012, BIR issued TCC to the Parent Company amounting to P=26.5 million for the input VAT claims covering the period from January 1 to March 31, 2010. In 2012, P=35.0 million worth of TCCs were utilized for the payment of documentary stamp tax arising from the issuance of fixed rate note (see Note 19). TCCs that remain unutilized after five years from the date of original issuance are still valid provided that these are duly revalidated by the BIR within the period allowed by law.

- 51 -
*SGVMG300344*
Special deposits and funds The special deposits and funds mainly consist of escrow accounts in favor of terminated employees and security deposit for the Company’s new office in Ortigas Center, Pasig City (see Notes 33 and 34).
Allowance for doubtful accounts The rollforward analysis of the allowance for doubtful accounts pertaining to input VAT and long-term receivables is presented below.
2012 Input VAT NPC Others Total Beginning of year P=361,660,278 P=2,508,223 P=58,553,902 P=422,722,403 Provision for doubtful
accounts (Note 24) 196,105,738 – 7,180,340 203,286,078 Write-off – (1,017,740) – (1,017,740) End of year P=557,766,016 P=1,490,483 P=65,734,242 P=624,990,741
Specific impairment P=1,490,483 P=65,434,961 P=66,925,444 Collective impairment – 299,281 299,281 Total P=1,490,483 P=65,734,242 P=67,224,725
2011 Input VAT NPC Others Total Beginning of year P=78,788,997 P=3,087,482 P=32,480,024 P=114,356,503 Provision for doubtful
accounts (Note 24) 282,871,281 – 26,073,878 308,945,159 Reversal (Note 24) – (579,259) – (579,259) End of year P=361,660,278 P=2,508,223 P=58,553,902 P=422,722,403
Specific impairment P=2,508,223 P=– P=2,508,223 Collective impairment – 58,553,902 58,553,902 Total P=2,508,223 P=58,553,902 P=61,062,125
17. Trade and Other Payables
2012 2011 Accounts payable:
Third parties P=5,604,345,331 P=4,562,690,830 Related parties (Note 22) 254,142,815 145,511,330
Accrued interest on long-term debts 661,127,313 1,047,605,943 Withholding and other taxes payable 367,865,856 328,466,441 Deferred credits 35,760,703 22,095,129 SSS and other contributions payable 2,741,924 1,893,569 Other payables (Note 3) 768,934,180 595,812,019 P=7,694,918,122 P=6,704,075,261
Accounts payable are non-interest-bearing and are normally settled on a 30 to 60 days payment term.

- 52 -
*SGVMG300344*
“Other payables” account includes guarantee fees due to the Philippine Government (Government) arising from previous loans availed of by the Company, PNOC (the then parent company of EDC) and NPC (as primary borrower with sub-lending arrangements with EDC) from various international financial institutions. As of December 31, 2012 and 2011, the Company has P=10.9 billion and P=9.6 billion of unused credit facilities from various local banks, respectively, which may be available for future operating activities.
18. Royalty Fee Payable
Royalty fee payable consists of the following:
2012 2011 Due to DOE and Local Government Units (LGUs)
prescribed by the RE Law P=20,618,242 P=– Deferred royalty fee due to DOE – 287,626,313 P=20,618,242 P=287,626,313
Pursuant to the provisions of the RE Law, the Parent Company shall pay royalty fee equivalent to 1.5% of its gross income. Such fiscal incentive was applied by the Parent Company beginning February 1, 2009 retroactive to the effective date on January 30, 2009 of the RE Law (see Note 36). On May 8, 2012, upon execution of their respective Geothermal Operating Contracts with the DOE, GCGI and BGI also became subject to royalty fee of 1.5% of their gross income (see Note 36). Royalty fees are allocated between the DOE and LGUs where the geothermal resources are located and payable within 60 days after the end of each quarter. Royalty fee expense amounted to P=169.8 million, P=193.9 million and P=222.8 million for the years ended December 31, 2012, 2011 and 2010, respectively (see Note 23). Deferred royalty fee Prior to the implementation of the RE Law, the Parent Company’s service contracts with the DOE under P.D. 1442 granted the Parent Company the right to explore, development, and utilize the country’s geothermal resources subject to sharing of net proceeds with the Government. The 60% government share is comprised of royalty fees and income taxes. The royalty fees are shared by the Government through DOE (60%) and the LGUs (40%). On July 8, 2009, the Parent Company negotiated with the DOE for the payment of deferred royalty due to DOE amounting to P=1.4 billion covering the period from 1989 to 2008. As agreed with the DOE, the Parent Company will settle the deferred royalty fee for four years with a quarterly amortization of P=87.5 million or an annual payment of P=350.0 million. In accordance with PAS 39, “Day 1” gain amounting to P=168.3 million was recognized for the difference between the nominal/maturity value and present value of the royalty fee payable. Subsequent to initial recognition, royalty fee payable is accreted to its maturity value based on the effective interest rate determined on Day 1.
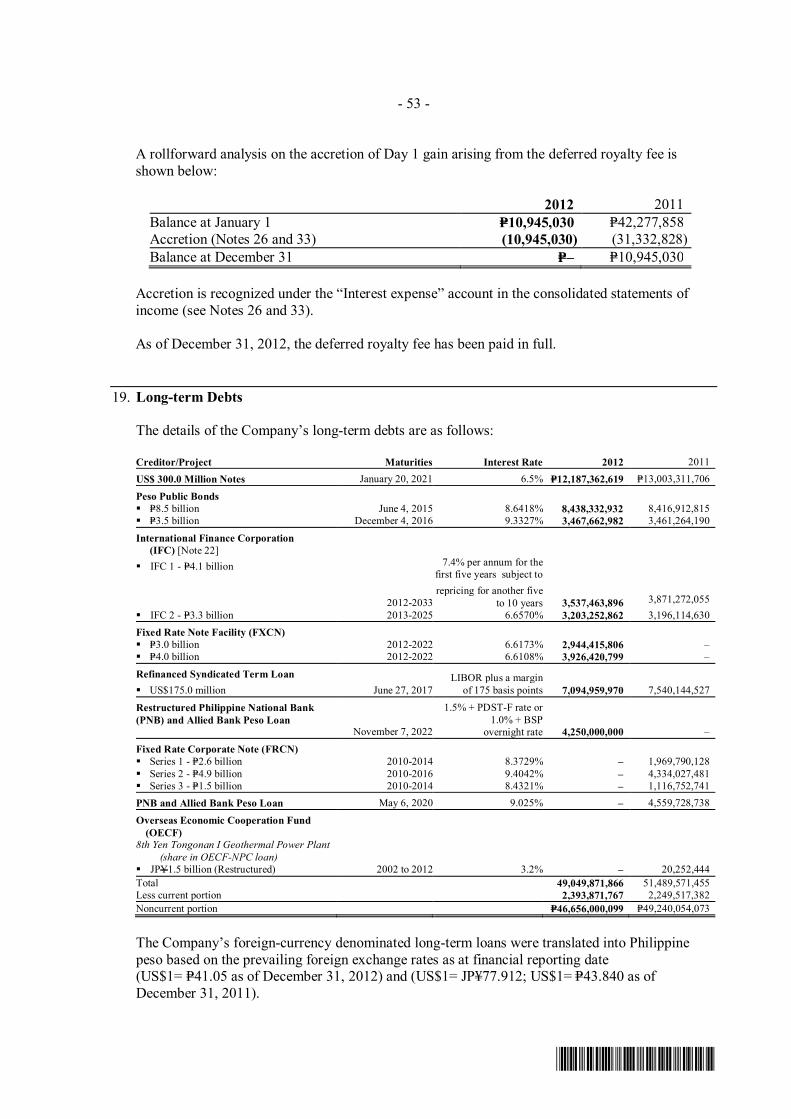
- 53 -
*SGVMG300344*
A rollforward analysis on the accretion of Day 1 gain arising from the deferred royalty fee is shown below:
2012 2011 Balance at January 1 P=10,945,030 P=42,277,858 Accretion (Notes 26 and 33) (10,945,030) (31,332,828) Balance at December 31 P=– P=10,945,030
Accretion is recognized under the “Interest expense” account in the consolidated statements of income (see Notes 26 and 33). As of December 31, 2012, the deferred royalty fee has been paid in full.
19. Long-term Debts The details of the Company’s long-term debts are as follows: Creditor/Project Maturities Interest Rate 2012 2011 US$ 300.0 Million Notes January 20, 2021 6.5% P=12,187,362,619 P=13,003,311,706
Peso Public Bonds § P=8.5 billion June 4, 2015 8.6418% 8,438,332,932 8,416,912,815 § P=3.5 billion December 4, 2016 9.3327% 3,467,662,982 3,461,264,190
International Finance Corporation (IFC) [Note 22]
§ IFC 1 - P=4.1 billion
2012-2033
7.4% per annum for the first five years subject torepricing for another five
to 10 years 3,537,463,896
3,871,272,055 § IFC 2 - P=3.3 billion 2013-2025 6.6570% 3,203,252,862 3,196,114,630 Fixed Rate Note Facility (FXCN) § P=3.0 billion 2012-2022 6.6173% 2,944,415,806 – § P=4.0 billion 2012-2022 6.6108% 3,926,420,799 –
Refinanced Syndicated Term Loan § US$175.0 million June 27, 2017
LIBOR plus a margin of 175 basis points 7,094,959,970 7,540,144,527
Restructured Philippine National Bank (PNB) and Allied Bank Peso Loan
November 7, 2022
1.5% + PDST-F rate or 1.0% + BSP
overnight rate 4,250,000,000 –
Fixed Rate Corporate Note (FRCN) § Series 1 - P=2.6 billion 2010-2014 8.3729% – 1,969,790,128 § Series 2 - P=4.9 billion 2010-2016 9.4042% – 4,334,027,481 § Series 3 - P=1.5 billion 2010-2014 8.4321% – 1,116,752,741 PNB and Allied Bank Peso Loan May 6, 2020 9.025% – 4,559,728,738
Overseas Economic Cooperation Fund (OECF)
8th Yen Tongonan I Geothermal Power Plant (share in OECF-NPC loan) § JPY1.5 billion (Restructured) 2002 to 2012 3.2%
–
20,252,444 Total 49,049,871,866 51,489,571,455 Less current portion 2,393,871,767 2,249,517,382 Noncurrent portion P=46,656,000,099 P=49,240,054,073
The Company’s foreign-currency denominated long-term loans were translated into Philippine peso based on the prevailing foreign exchange rates as at financial reporting date (US$1= P=41.05 as of December 31, 2012) and (US$1= JP¥77.912; US$1= P=43.840 as of December 31, 2011).

- 54 -
*SGVMG300344*
The long-term debts are presented net of unamortized transaction costs. A rollforward analysis of unamortized transactions costs follows:
2012 2011 Balance at January 1 P=649,610,989 P=626,140,912 Additions 100,166,950 382,328,678 Transaction costs derecognized due to
extinguishment of debt (Note 28) (101,553,355) (197,898,124) Amortization (Notes 26 and 33) (118,353,909) (158,790,979) Foreign exchange losses (gains) - net 749,645 (2,169,498) Balance at December 31 P=530,620,320 P=649,610,989
Parent Company Loans The Parent Company entered into unsecured long-term loan arrangements with domestic and international financial institutions for its various development projects and working capital requirements. US$ 300.0 Million Notes On January 20, 2011, the Parent Company issued a 10-year US$300.0 million notes (P=13,350.0 million) at 6.50% interest per annum which will mature in January 2021. The notes are intended to be used by the Company to support the business expansion plans, finance capital expenditures, service debt obligations and for general corporate purposes. Such notes were listed and quoted on the Singapore Exchange Securities Trading Limited (SGX-ST). Peso Public Bonds On December 4, 2009, the Company received P=12.0 billion proceeds from the issuance of fixed rate Peso public bonds - split into two tranches - P=8.5 billion, due after five years and six months and P=3.5 billion, due after seven years, paying a coupon of 8.6418% and 9.3327%, respectively. IFC (see Note 22) The Parent Company entered into a loan agreement with IFC, a shareholder of the Parent Company, on November 27, 2008 for US$100.0 million or its Peso equivalent of P=4.1 billion. On January 7, 2009, the Parent Company opted to draw the loan in Peso and received the proceeds amounting to P=4,048.8 million, net of P=51.5 million front-end fee. The loan is payable in 24 equal semi-annual installments after a three-year grace period at an interest rate of 7.4% per annum for the first five years subject to repricing for another five to 10 years. Under the loan agreement, the Parent Company is restricted from creating liens and is subject to certain financial covenants.
On May 20, 2011, the Parent Company signed a 15-year US$75.0 million loan facility with the IFC to fund its medium-term capital expenditures program. The loan was drawn in Peso on September 30, 2011, amounting to P=3,262.5 million. The loan is payable in 24 equal semi-annual installments after a three-year grace period at an interest rate of 6.657% per annum. The loan includes prepayment option which allows the Company to prepay all or part of the loan anytime starting from the date of the loan agreement until maturity. The prepayment amount is equivalent to the sum of the principal amount of the loan to be prepaid, redeployment cost and prepayment premium. Issuance of FXCN and Prepayment of FRCN On July 3, 2009, EDC received P=7,500.0 million proceeds from the issuance of FRCN split into two tranches. The first tranche of P=2,644.0 million will mature after 5 years and the second tranche of P=4,856.0 million will mature after 7 years with a coupon rate of 8.3729% and 9.4042% respectively. On September 3, 2009, EDC received P=1,500.0 million proceeds from the additional issuance of FRCN, a 5-year series paying a coupon of 8.4321%.

- 55 -
*SGVMG300344*
On April 4, 2012, EDC signed a 10-year FXCN facility agreement amounting to P=7,000.0 million which is divided into two tranches. The proceeds from the first tranche amounting to P=3,000.0 million were used to prepay in full its FRCN Series One and Series Three for P=1,774.3 million and P=1,007.1 million, respectively. Subsequently, on May 3, 2012, the FRCN Series Two was also prepaid in full for P=4,211.1 million using the proceeds from the second FXCN tranche amounting to P=4,000.0 million. The FXCN tranches 1 and 2 bears a coupon rate of 6.6173% and 6.6108% per annum, respectively. FRCN Series One and Series Three were originally scheduled to mature in July 2014 while FRCN Series Two was originally scheduled to mature in July 2016. EDC recognized loss amounting to P=114.7 million arising from early extinguishment of FRCN in 2012 (see Note 28). Debt issuance costs amounting to P=100.2 million was capitalized as part of the new FXCN. Amortization of transaction costs in 2012 amounting to P=6.0 million is included under the “Interest expense” account in the 2012 consolidated statement of income (see Note 26). Refinanced Syndicated Term Loan On June 17, 2011, the Parent Company had entered into a credit agreement for the US$175.0 million (P=7,630.0 million) transferable syndicated term loan facility with ANZ, The Bank of Tokyo-Mitsubishi UFJ, Ltd., Chinatrust (Philippines) Commercial Banking Corporation, ING Bank N.V., Manila Branch, Maybank Group, Mizuho Corporate Bank, Ltd. and Standard Chartered Bank as Mandated Lead Arrangers and Bookrunners. The purpose of the new loan is to refinance the old US$175.0 million syndicated term loan availed on June 30, 2010 with scheduled maturity of June 30, 2013. The new loan carries an interest of LIBOR plus a margin of 175 basis points and has installment repayment scheme to commence on June 27, 2013 until June 27, 2017.
The extinguished syndicated term loan had an interest rate of LIBOR plus a margin of 325 basis points. Loss on debt extinguishment amounting to P=197.9 million recognized as a result of the loan extinguishment is presented under “Miscellaneous - net” in the 2011 consolidated statement of income (see Note 28). Syndicated Term Loan In June 2010, the Parent Company signed a three-year US$175.0 million (P=8,058.7 million) syndicated term loan facility with Australia and New Zealand Banking Group Limited (ANZ) Manila Branch, Credit Agricole Corporate and Investment Bank, and Standard Chartered Bank as Mandated Lead Arrangers and Bookrunners. The loan carries an interest of LIBOR plus a margin of 325 basis points. Other Long-term Debts On January 31, 2012, the Parent Company fully settled its matured JP¥1.5 billion OECF 8th Yen loan amounting to P=20.3 million. On June 10, 2011, the Parent Company prepaid the OECH 19th Yen loan balance of JP¥218.6 million (P=117.4 million) originally scheduled to mature in December 2024. Also, on June 17, 2011, the Company has fully settled its OECF 9th Yen loan of JP¥207.7 million (P=111.5 million). On April 8, 2011, the Parent Company prepaid the JP¥8.1 billion (P=4,260.6 million) 21st Yen loan with Japan International Cooperation Agency (JICA), a successor institution of the OECF (Japan). The 21st Yen loan is originally scheduled to mature in March 2027.

- 56 -
*SGVMG300344*
On June 28, 2010, the Parent Company fully settled its JPY22.0 billion Miyazawa II loan (P=11,091.97 million).
In May 2010, the Parent Company fully settled the PNOC on-lent loans (IBRD and 5th yen loans) amounting to P=4,212.2 million. The loan covenants covering its outstanding debts include, among others, maintenance of certain level of current, debt-to-equity and debt-service ratios. As of December 31, 2012 and 2011, the Parent Company is in compliance with the loan covenants of all its outstanding debts.
FG Hydro Loan On May 7, 2010, FG Hydro signed a loan agreement for a 10-year P=5,000.0 million loan with PNB and Allied Bank, maturing on May 7, 2020. The loan is secured by a real estate and chattel mortgages on all present and future mortgageable assets of FG Hydro. The loan carries an interest rate of 9.025% subject to re-pricing after five years. Loan repayment is semi-annual based on increasing percentages yearly with the first payment made on November 8, 2010. The loan proceeds were used to finance the full payment of the Deferred Payment Facility and the PRUP, and fund general corporate and working capital requirements of FG Hydro. On November 7, 2012, FG Hydro’s outstanding loan amounting to P=4.3 billion was restructured by way of an amendment to the loan agreement. The amended agreement provided for a change in the determination of the applicable interest rates and extended the maturity date of the loan by two years with the last repayment to be made on November 7, 2022. FG Hydro has the option to select its new applicable interest rate between a fixed or a floating interest rate. FG Hydro opted to avail of the loan at the floating rate which is the higher of the 6-month PDST-F rate plus a margin of 1.50% per annum or the BSP overnight rate plus a margin of 1% per annum as determined on the interest rate setting date. For the first interest period, the applicable rate was determined as the BSP overnight rate of 3.5% plus 1% margin. The principal and interest on the loan are payable on a semi-annual basis. Interest rates are determined at the beginning of every interest period. FG Hydro has a one-time option to convert to a fixed interest rate any time after the amendment effectivity date. FG Hydro has assessed that the loan restructuring resulted to substantial modification of the terms of the original loan, hence, the original loan was considered extinguished. Amortization of the remaining transaction cost of the old loan amounting to P=49.0 million was accelerated and the transaction cost incurred for the restructured loan amounting to P=24.5 million was recognized as part of the loss on extinguishment of debt (see Note 28).
FG Hydro has been compliant to the covenants of its existing loans as of December 31, 2012 and 2011.
20. Provisions and Other Long-term Liabilities
2012 2011 Provision for rehabilitation and restoration
costs (Notes 3 and 13) P=493,524,946 P=406,779,140 Accrued sick leave 200,960,606 212,808,197 Accrued vacation leave 131,848,883 135,507,434 Others (Note 3) 324,051,554 1,782,954 P=1,150,385,989 P=756,877,725

- 57 -
*SGVMG300344*
Provision for rehabilitation and restoration costs Provision for rehabilitation and restoration costs pertains to the present value of estimated costs of legal and constructive obligations required to restore all the existing sites upon termination of the cooperation period. The nature of these restoration activities includes dismantling and removing structures, rehabilitating wells, dismantling operating facilities, closure of plant and waste sites, and restoration, reclamation and re-vegetation of affected areas. The obligation generally arises when the asset is constructed or the ground or environment at the site is disturbed. When the liability is initially recognized, the present value of the estimated costs is capitalized as part of the carrying amount of the related FCRS and production wells (see Note 13). Details of the movement of provision for rehabilitation and restoration costs are as follows:
2012 2011 Beginning of the year P=406,779,140 P=– Addition (Note 13) 54,879,048 344,150,911 Accretion of interest (Note 26) 27,644,866 61,144,090 Unwinding of discount of NNGP 4,221,892 1,484,139 P=493,524,946 P=406,779,140
Accrued sick leave and accrued vacation leave Sick and annual vacation leave with pay are given to active employees subject to certain requirements set by the Company. These leaves are convertible into cash upon separation of the employees. At the end of the year, any remaining unused sick and vacation leave are accrued up to maximum allowed number of leave credits which is based on the employees’ length of service with the Company. Vacation and sick leave credits exceeding the maximum allowed for accrual are forfeited.
21. Equity Capital Stock
As required under the Philippine Constitution, the Parent Company is subject to the nationality requirement that at least 60% of its capital stock must be owned by Filipino citizens since it is engaged in the exploration and exploitation of the country’s energy resources. The Parent Company is compliant with the said nationality requirement. Beginning December 13, 2006, the 15.0 billion common shares of the EDC were listed and traded on the Philippine Stock Exchange (PSE) at an Initial Public Offering (IPO) price of P=3.2 per share. After the initial IPO, there are no subsequent listings of shares by the Parent Company. The common shares are majority held by Filipino citizens, with Red Vulcan holding 6.0 billion shares or an equivalent of 40% interest.
The ownership of the Parent Company’s preferred shares is limited to Filipino citizens. The preferred shares have voting rights and subject to 8% cumulative interest (Note 31). Red Vulcan holds the entire 9.4 billion preferred shares equivalent to 20% voting interest in EDC. The combined interest of Red Vulcan entitles it to 60% voting interest and 40% economic interest in EDC.

- 58 -
*SGVMG300344*
The number of stockholders of the Parent Company as of December 31, 2012, 2011 and 2010 are as follows:
2012 2011 2010 Preferred shares 1 1 1 Common shares 700 702 715
Details of the number of common and preferred shares as of December 31, 2012, 2011 and 2010 are as follows:
Preferred Common Par value P=0.01 P=1.00 Number of shares: Authorized 15,000,000,000 30,000,000,000 Issued and outstanding 9,375,000,000 18,750,000,000
Common Shares in Employee Trust Account On March 25, 2008, the BOD of the Parent Company approved a share buyback program involving up to P=4.0 billion worth of the Parent Company’s common shares, representing approximately 4% of the Parent Company’s market capitalization as of the date of the approval. The buyback program was carried out within a two-year period which commenced on March 26, 2008 and ended on March 25, 2010. The Parent Company intends to implement an executive/employee stock option ownership plan through options, grants, purchases, or such other equivalent methods. In 2008, the Parent Company acquired a total of 93,000,000 common shares for a total cost of P=404.2 million.
In 2009, a total of 93,000,000 common shares held in treasury that were acquired in 2008 at the cost of P=404.2 million, have been issued irrevocably by the Parent Company to BDO Trust for the benefit of the executive/employee grantees under the Parent Company’s Employee Stock Grant Plan (ESGP). The BDO Trust is an independent and separate legal entity. EDC has neither control nor discretion over the administration and investment activity on the common shares in executive/employee benefit trust held by BDO Trust. These shares are part of the issued and outstanding common shares and are entitled to vote and receive dividend. These shares will not revert to EDC even if the planned stock grant plan or other such plan is terminated. Any fruits or interests of these shares shall be for the sole and exclusive benefit of the officers and employees of EDC who are identified grantees of such stock plans. Any capital appreciation or decline in value, dividends, or other benefits declared on these shares shall accrue to the trust account and EDC shall not have any claim thereon. The issuance of the common shares to BDO Trust was recognized under the “Common shares in employee trust account” account in the consolidated statement of financial position (see Note 32).
Equity Reserve On October 16, 2008, EDC, First Gen and FG Hydro entered into a Share Purchase and Investment Agreement (SPIA), whereby EDC shall own 60% of the outstanding equity of FG Hydro, which was then a wholly owned subsidiary of First Gen prior to the SPIA. FG Hydro and EDC were subsidiaries of First Gen at that time and were, therefore, under common control of First Gen. The acquisition was accounted for similar to a pooling-of-interests method since First Gen controlled FG Hydro and EDC before and after the execution of the SPIA. EDC recognized equity reserve amounting to P=3,706.4 million pertaining to the difference between the acquisition cost and EDC’s proportionate share in the paid-in capital of FG Hydro.

- 59 -
*SGVMG300344*
Retained Earnings Declaration date
Record date
Payment date
Shareholders
Description
Dividend per share
Total amount
2012:
September 5, 2012 September 20, 2012 September 30, 2012 Common Special P=0.04 P=750,000,000 March 13, 2012 March 28, 2012 April 24, 2012 Preferred Regular 0.0008 7,500,000 - do - - do - - do - Common Regular 0.10 1,875,000,000 P=2,632,500,000
2011:
March 15, 2011 March 29, 2011 April 20, 2011 Preferred Regular P=0.0008 P=7,500,000 - do - - do - - do - Common Regular 0.16 3,000,000,000 P=3,007,500,000
NCI On May 9, 2011, the Philippine SEC approved the amendment of the articles of incorporation of FG Hydro reclassifying its unissued redeemable preferred shares into redeemable preferred “A” and “B” shares. Features of the preferred shares Series B includes the right to earn cumulative dividends from January 1, 2009 up to December 31, 2013, as may be declared and paid from time to time in amounts and on such dates as may be declared by FG Hydro’s BOD, subject to the availability of FG Hydro’s retained earnings and cap at nil in 2009, US$8.0 million in 2010 and US$14.0 million thereafter up to 2013. As a result of the issuance of FG Hydro’s preferred shares Series B, P=200.3 million was reallocated from retained earnings attributable to the equity holders of the Parent Company to NCI which amount pertains to the portion of FG Hydro net income allocable to preferred shares Series B stockholders for the period January 1, 2010 to December 31, 2010. In June 2011, FG Hydro declared and paid cash dividends to its preferred shares amounting to P=333.8 million. In March and May 2012, FG Hydro declared and paid cash dividends to its preferred and non-controlling common shareholders amounting to P=494.1 million and P=848.5 million, respectively. In October 2012, FG Hydro declared and paid cash dividends to its non-controlling common shareholders amounting to P=520.0 million.
22. Related Party Transactions
Parties are considered to be related if one party has the ability, directly or indirectly, to control the other party or exercise significant influence over the other party in making financial and operating decisions. Parties are also considered to be related if they are subject to common control or common significant influence.
a. Following are the amounts of transactions and outstanding balances as of and for the years ended December 31, 2012 and 2011:
Transactions for the years ended
December 31 Net amounts due from/to related
parties as at December 31 Related Party Nature of Transaction Terms 2012 2011 2012 2011
Due from related parties
First Gen Interest-free advances Unsecured and will be settled in cash P=– P=3,437 P=– P=3,437
First Gen Northern Energy Corp.
Interest-free advances
- do - – 2,511 – 2,511
First GES Interest-free advances - do - – 1,864 – 1,864 P=– P=7,812 P=– P=7,812
(Forward)

- 60 -
*SGVMG300344*
The purchases from related parties are made at normal commercial terms and conditions. The amounts outstanding are unsecured and will be settled in cash. The Company has not recognized any impairment losses on receivables from related parties as of December 31, 2012 and 2011.
i. First Gen
First Gen provides financial consultancy, business development and other related services to the Parent Company under a consultancy agreement beginning September 1, 2008. Such agreement is for a period of three years up to August 31, 2011. Under the terms of the agreement, billings for consultancy services shall be P=8.7 million per month plus applicable taxes. This was increased to P=11.8 million per month plus applicable taxes effective September 2009 to cover the cost of additional officers and staff assigned to the Parent Company.
The consultancy agreement was subsequently extended for another 16 months from September 1, 2011 to December 31, 2012. The consultancy agreement was extended for another two years from January 1, 2013 to December 31, 2014. Total consultancy services amounted to P=165.6 million, P=161.6 million and P=170.8 million in 2012, 2011 and 2010, respectively, and were included in the “Costs of sales of electricity and steam” under “Purchased services and utilities” account (see Note 23). In addition, First Gen charged
Transactions for the years ended
December 31 Net amounts due from/to related
parties as at December 31 Related Party Nature of Transaction Terms 2012 2011 2012 2011
Due to related parties
First Gen Consultancy fee Unsecured and will be settled in cash P=165,619,598 P=161,590,588 P=41,379,949 P=53,863,530
Interest-free advances - do - 26,095,569 62,587,201 8,166,941 6,061,620 Lopez Group Foundation,
Inc.
Donation to support the Group’s Corporate Social Responsibility efforts
- do - 1,095,000 838,400 – –First Gas Power
Corporation Interest-free advances
- do - 147,794 626,755
30,613 165,675
Bauang Private Power Corporation
Acquisition of one unit MVA transformer - do - 57,330 – – –
Eugenio Lopez Foundation, Inc.
Donation to Lopez Museum
- do - – 2,400,000
– –
P=193,015,291 P=228,042,944 P=49,577,503 P=60,090,825
Trade and other payables (Note 17)
Thermaprime
Drilling and other related services
- do - P=1,155,169,743 P=994,573,343 P=171,699,140 P=101,171,006
First Balfour Inc.
Steam augmentation and other services
- do - 192,687,664 158,696,338 73,339,568 38,989,273
First Philec Manufacturing Technologies Corp
Purchase of services and utilities
- do - 3,696,180 625,000 2,077,482 328,720
Adtel Purchase of services and utilities - do - 3,272,208 – 1,452,277 –FEDCOR Purchase of services and utilities - do - 2,930,000 – – –ABS-CBN Publishing, Inc. Purchase of services and utilities - do - 1,284,110 47,500 – –FPRC Purchase of services and utilities - do - 1,190,822 2,435,646 – 458,150Bayantel Purchase of services and utilities - do - 531,781 1,090,465 5,038,978 4,524,811Goldlink Security and
Investigative Services Inc.
Purchase of services and utilities
- do - 494,787 458,603 – –Securities Transfer
Services, Inc. Purchase of services and utilities
- do - 129,920 159,884 39,370 39,370
ABS-CBN Corp. Purchase of services and utilities - do - 118,878 70,000 496,000 –Rockwell Land Corporation Purchase of services and utilities - do - 70,000 – – –First Philippine Industrial
Corporation Purchase of services and utilities
- do - 1,488 – – –
Sky Cable Purchase of services and utilities - do - – 12,100 – – P=1,361,577,581 P=1,158,168,879 P=254,142,815 P=145,511,330Long-term debt IFC (Note 19) Interest-bearing loans - do - P=519,860,137 P=4,223,815,201 P=6,740,716,758 P=7,067,386,685

- 61 -
*SGVMG300344*
P=236.4 million in 2010 for the reimbursement of the employee costs of its seconded personnel to the Company and was included in the general and administrative expenses under “Business and related expenses” account (see Note 24). There were no similar charges in 2012 and 2011.
In 2012, the Parent Company purchased 5.4 million shares of First Gen with acquisition cost of P=77.1 million recorded as AFS investments (Note 10).
ii. IFC
IFC is a shareholder of the Parent Company that has approximately 5% ownership interest in the Parent Company. On May 20, 2011, the Parent Company signed a 15-year US$75.0 million loan facility with IFC. The loan was drawn in Peso on September 30, 2011, amounting to P=3,262.5 million. As of December 31, 2012 and 2011, the outstanding balance of the loan amounting to P=3,203.3 million and P=3,196.1 million, respectively, is included under the “Long-term debts” account in the consolidated statement of financial position (see Note 19).
On November 27, 2008, the Parent Company entered into a loan agreement with IFC for US$100.0 million or its Peso equivalent of P=4.1 billion. On January 7, 2009, the Parent Company opted to draw the loan in Peso and received the proceeds amounting to P=4,048.8 million, net of P=51.3 million front-end fee. The loan is payable in 24 equal semi-annual installments after a three-year grace period at an interest rate of 7.4% per annum for the first five years subject to repricing for another five to 10 years. Under the loan agreement, the Parent Company is restricted from creating liens and is subject to certain financial covenants. As of December 31, 2012 and 2011, the outstanding loan amounted to P=3,537.5 million and P=3,871.3 million, respectively, net of unamortized transaction costs of P=49.6 million and P=57.8 million, respectively. This loan is included under the “Long-term debts” account in the consolidated statement of financial position (see Note 19).
iii. First Balfour, Inc. (First Balfour)
Following the usual bidding process in 2010, the Company awarded to First Balfour procurement contracts amounting to P=217.7 million for various works such as Palinpinon 1 zero condensate disposal system, civil, structural and mechanical/piping works in Leyte and Bac-Man and refurbishment of BGI’s geothermal power plants.
As of December 31, 2012 and 2011, the outstanding balance amounted to P=73.3 million and P=39.0 million, respectively, recorded under “Trade and other payables” account in the consolidated financial statements (see Note 17).
First Balfour is a wholly owned subsidiary of First Holdings.
iv. Other Related Parties
• Bauang Private Power Corporation is a subsidiary of First Private Power Corporation, an associate of First Gen. First Gas Holdings Corporation and First Gas Power Corporation are subsidiaries of First Gen. First Holdings, parent company of First Gen, is an associate of Lopez Holdings Corporation (formerly Benpres Holdings Corporation).
• Bayan Telecommunications Inc. (Bayantel) is 97.3%-owned by Bayantel Holdings on which Lopez Holdings Corporation has 47.3% ownership.

- 62 -
*SGVMG300344*
• Sky Cable Corporation (Sky Cable) is 80.7%-owned by ABS-CBN Corp. on which Lopez Holdings Corporation has 57.3% interest. ABS-CBN Publishing, Inc. is a wholly owned subsidiary of ABS-CBN Corp.
• Rockwell Land Corporation is 86.79% owned by First Holdings.
• First Electro Dynamics Corporation (FEDCOR) is a wholly owned subsidiary of First Holdings.
• Adtel Inc. is a wholly owned Lopez Incorporated entity.
• Lopez Group Foundation, Inc. is the coordinative hub for the corporate social responsibility initiatives of Lopez Holdings Corporation.
• First Philec Manufacturing Technologies Corp., Securities Transfer Services, Inc. and First Philippine Realty Corp. (FPRC), formerly known as INAEC Development Corp, are wholly owned subsidiaries of First Holdings.
• Thermaprime Well Services, Inc. (Thermaprime) is a subsidiary of First Balfour, a wholly owned subsidiary of First Holdings. Thermaprime provides drilling services such as, but not limited to, rig operations, rig maintenance, well design and engineering.
• First Gen Energy Solutions (First GES) and First Gen Northern Energy Corp. are wholly owned subsidiaries of First Gen.
• First Philippine Industrial Corp. is 60% owned by First Holdings.
b. Intercompany Guarantees EDC Chile Limitada, EDC’s subsidiary in Chile, is participating in the bids for geothermal concession areas by the Chilean government. The bid rules call for the provision of proof of EDC Chile Limitada’s financial capability to participate in said bids or evidence of financial support from its Parent Company. Letters of credit amounting to US$80.0 million were issued by EDC in favor of EDC Chile Limitada as evidence of its financial support.
Except for the letters of credit issued by the Parent Company in favor of EDC Chile Limitada as mentioned above, there were no guarantees that have been given to or/and received from any other related party in 2012 and 2011.
c. Remuneration of Key Management Personnel
The remuneration of the directors and other members of key management personnel by benefit type are as follows: 2012 2011 2010 Short-term employee benefits P=118,627,463 P=94,076,334 P=126,184,215 Post-employment benefits
(Note 29) 262,855,984 239,439,200 192,690,000 Share-based payments (Note 32) 24,742,375 8,806,875 15,684,375 P=406,225,822 P=342,322,409 P=334,558,590

- 63 -
*SGVMG300344*
23. Costs of Sales of Electricity and Steam 2012 2011 2010 Depreciation and amortization
(Notes 13 and 14) P=3,195,213,914 P=3,178,921,446 P=3,233,623,822 Personnel costs (Notes 25, 29
and 32) 1,982,097,751 1,454,616,847 1,728,719,810 Purchased services and utilities
(Note 22) 1,729,664,759 1,994,234,596 1,274,882,583 Repairs and maintenance (Note 41) 1,214,445,888 1,652,594,246 1,486,178,615 Rental, insurance and taxes
(Note 34) 1,005,291,154 1,033,018,600 899,085,485 Parts and supplies issued (Note 11) 768,473,850 915,447,365 692,061,138 Royalty fees (Note 18) 169,752,256 193,856,068 222,831,401 Business and related expenses 166,168,972 147,185,600 57,467,333 Proceeds from insurance claims (105,931,390) – (129,005,463) P=10,125,177,154 P=10,569,874,768 P=9,465,844,724
Purchased services and utilities includes professional and technical services, purchased services, purchased utilities, hauling and handling costs, rig mobilization charges, contractual personnel costs and other services and utilities expense.
Business and related expenses covers the expenses incurred by the Company for local and foreign travel, , company meeting expenses and advertising, among other business expenses.
Proceeds from insurance claims are shown as a separate line item under the costs of sales of electricity and steam. The Parent Company charges to expense outright any costs incurred relating to restoring or rehabilitating facilities or land improvements damaged by typhoons or by other factors. Insurance proceeds from the insurance claims are subsequently recognized upon receipt.
24. General and Administrative Expenses
2012 2011 2010 Personnel costs (Notes 25, 29
and 32) P=1,684,795,405 P=1,490,582,928 P=1,773,383,949 Purchased services and utilities 1,108,600,474 1,063,662,026 1,084,750,032 Rental, insurance and taxes
(Notes 34 and 41) 802,484,066 651,513,045 773,467,311 Business and related expenses
(Note 22) 469,171,599 370,829,003 550,000,926 Depreciation and amortization
(Note 13) 364,315,008 244,041,892 207,216,027 Provision for doubtful accounts (Notes 9 and 16) 235,061,308 409,177,837 77,575,943 Parts and supplies issued (Note 11) 154,094,455 195,747,618 165,307,006 Provision for (reversal of)
impairment of parts and supplies inventories (Notes 3 and 11) (83,504,018) 168,959,002 (14,999,238)
Repairs and maintenance 46,871,861 66,431,309 76,744,056 (Forward)

- 64 -
*SGVMG300344*
2012 2011 2010 Reversal of provision for doubtful
accounts (Notes 9 and 16) (P=928,019) (P=579,259) (P=2,405,862) Loss on direct write-off of
receivables 281,981 – – P=4,781,244,120 P=4,660,365,401 P=4,691,040,150
25. Personnel Costs
2012 2011 2010 Salaries and other benefits (Note 32) P=3,732,671,291 P=3,014,227,692 P=3,322,197,742 Net retirement and other
post-employment benefit costs (income) [Note 29] (42,858,229) 50,797,100 397,606,557
Social security costs 36,584,471 36,701,697 38,791,600 P=3,726,397,533 P=3,101,726,489 P=3,758,595,899
Personnel costs amounting to P=57.9 million, P=135.8 million and P=186.1 million were capitalized under property, plant and equipment, and intangible assets in 2012, 2011 and 2010, respectively (see Notes 13 and 14).
2012 2011 2010 Costs of sales of electricity and
steam (Note 23) P=1,982,097,751 P=1,454,616,847 P=1,728,719,810 General and administrative
expenses (Note 24) 1,684,795,405 1,490,582,928 1,773,383,949 Discontinued drilling operations
(Note 6) 1,596,097 20,781,553 70,441,991 Capitalized personnel costs 57,908,280 135,745,161 186,050,149 P=3,726,397,533 P=3,101,726,489 P=3,758,595,899
26. Interest Income and Interest Expense
Interest income consists of the following:
2012 2011 2010 Interest income on cash equivalents
(Notes 8 and 33) P=354,778,763 P=369,729,747 P=311,947,757 Interest income on cash in banks
(Notes 8 and 33) 3,596,543 6,388,430 6,330,518 Interest income on employee and
other receivables (Notes 9 and 33) 3,338,547 8,909,082 22,329,156
Interest income on AFS investments (Notes 10 and 33) 1,131,160 1,099,376 1,073,692
Interest income on trade receivables (Notes 9 and 33) 693,922 2,983,715 6,007,914
Others 1,102,054 1,102,369 – P=364,640,989 P=390,212,719 P=347,689,037

- 65 -
*SGVMG300344*
Interest expense consists of the following:
2012 2011 2010 Interest on long-term debts
including amortization of transaction costs (Notes 19 and 33) P=3,656,390,728 P=4,005,331,916 P=3,643,864,967
Interest accretion on provision for rehabilitation and restoration costs (Notes 3, 13 and 20) 27,644,866 61,144,090 –
Interest accretion of “Day 1” gain (Notes 18 and 33) 10,945,030 31,332,828 56,102,861
Interest on liability from litigation (Note 3) 8,608,023 7,811,107 8,185,077
Interest on loan payable and others (Note 33) 59,822 896,374 304,361
P=3,703,648,469 P=4,106,516,315 P=3,708,457,266
Interest accretion of “Day 1” gain pertains to deferred royalty fee payable (see Note 18) while interest on liability from litigation is related to expropriation cases (see Note 3). Interest on loan payable in 2011 and 2010 pertains to an unsecured short-term borrowing amounting to P=175.0 million at 2.20% interest rate per annum obtained from a local bank on December 21, 2010 for the Parent Company’s working capital requirements. The loan matured on January 20, 2011 and was rolled over for another 29 days, with new maturity date on February 18, 2011 at 2.3% interest rate per annum. On February 18, 2011, a partial payment was made on the principal amounting to P=85.0 million and the balance of P=90.0 million was rolled over for 31 days to mature on March 21, 2011 at 2.30% interest rate per annum. The loan was fully settled on March 21, 2011.
27. Foreign Exchange Gains (Losses)
2012 2011 2010 Realized foreign exchange gains (losses) - net (P=169,333,424) (P=270,373,999) (P=182,849,924) Unrealized foreign exchange gains - net 1,222,800,198 159,321,670 166,954,878
Net foreign exchange gains (losses) P=1,053,466,774 (P=111,052,329) (P=15,895,046)
This account pertains to foreign exchange adjustments realized on repayment of loans and unrealized on restatement of outstanding balances of foreign currency-denominated loans, trade receivables and payables, short-term placements and cash in banks. Following are the exchange rates used to restate outstanding balances at financial reporting date:
Peso Equivalent of 1 Unit of Foreign Currency Currency 2012 2011
2010 2010
US dollar P=41.050 P=43.840 P=43.840 Japanese yen 0.477 0.562 0.537 Singaporean dollar 33.703 – – (Forward)

- 66 -
*SGVMG300344*
Peso Equivalent of 1 Unit of Foreign Currency Currency 2012 2011
2010 2010
Euro P=54.530 P=– P=– New Zealand dollar 33.659 – – Sweden kroner – 6.363 6.865
28. Miscellaneous Income (Charges)
2012 2011 2010 Loss on debt extinguishment
(Notes 19 and 33) (P=188,145,763) (P=197,898,124) P=– Recovery on impairment loss on
property, plant and equipment (Note 13) 63,614,885 – –
Loss on disposal of property, plant and equipment (Note 13) – (28,970,474) (398,927,321)
Reversals of long-outstanding payables – 189,613,624 1,946,165
Gain on early redemption of AFS investment (Note 10) – (271,292)
–
Recovery of impairment loss on input VAT claims for refund/tax credits (Note 16) – – 1,638,884,447
Others - net (37,218,961) 26,206,002 15,441,533 (P=161,749,839) (P=11,320,264) P=1,257,344,824
The Parent Company recognized recovery of impairment loss on input VAT claims amounting to P=1,638.9 million on account of the tax credit certificates issued by the BIR in May and June 2010 (see Note 16).
29. Net Retirement and Other Post-employment Benefits
The Parent Company has a funded, non-contributory, defined benefit retirement plan. The plan covers all permanent employees and is administered by trustee bank. The Parent Company also provides post-employment medical and life insurance benefits which are unfunded. In 2012, 2011 and 2010 BGI, GCGI and FG Hydro, respectively, have set up a funded, non-contributory, defined benefit retirement plans which were included in the consolidated financial statements.
The following tables summarize the components of net benefit expense (income) recognized in the consolidated statement of income and the funded status and amounts recognized in the consolidated statements of financial position:
2012 2011 2010 Current service cost P=228,899,603 P=213,069,058 P=187,139,907 Interest cost on benefit obligation 213,132,871 215,470,088 273,393,511 Expected return on plan assets (100,092,796) (112,728,687) (142,453,424) Net actuarial loss recognized 368,122,254 520,800 86,988,383 (Forward)

- 67 -
*SGVMG300344*
2012 2011 2010 Curtailment gain (P=752,920,161) (P=265,534,159) (P=14,676,220) Past service cost – – 7,214,400 Net retirement expense (income)
(Note 25) (P=42,858,229) P=50,797,100 P=397,606,557
Actual return on plan assets P=234,293,144 P=165,125,261 P=324,216,027
2012 2011 Present value of defined benefits obligations P=3,281,316,791 P=3,759,487,214 Fair value of plan assets (1,844,120,175) (2,001,855,915) 1,437,196,616 1,757,631,299 Net unrecognized actuarial losses (777,263,955) (703,394,043) Net retirement and other post-employment benefits P=659,932,661 P=1,054,237,256
Changes in the present value of the defined benefit obligation are as follows:
2012 2011 Defined benefits obligation at January 1 P=3,759,487,214 P=3,434,199,212 Current service cost 228,899,603 213,069,058 Interest cost on benefit obligation 213,132,871 215,470,088 Benefits paid (743,475,250) (344,916,381) Actuarial losses on obligation 576,192,514 507,199,396 Curtailment gain (752,920,161) (265,534,159) Defined benefits obligation at December 31 P=3,281,316,791 P=3,759,487,214
Changes in the fair value of plan assets are as follows:
2012 2011 Fair value of plan assets at January 1 P=2,001,855,915 P=1,877,950,146 Expected return on plan assets 100,092,796 112,728,687 Contributions by employer 351,446,366 303,696,889 Benefits paid (743,475,250) (344,916,381) Actuarial gains on plan assets 134,200,348 52,396,574 Fair value of plan assets at December 31 P=1,844,120,175 P=2,001,855,915
EDC’s retirement benefits fund is maintained by the Bank of the Philippine Islands Asset Management and BDO Trust while GCGI and BGI’s retirement benefits funds are maintained by BDO Trust. The major categories of the Company’s plan assets as a percentage of the fair value of total plan assets are as follows:
2012 2011 Cash and cash equivalents 4.18% 18.38%Investment in debt securities 60.46% 71.86%Investment in equity securities 33.85% 8.50%Others 1.51% 1.26% 100.00% 100.00%

- 68 -
*SGVMG300344*
Cash and cash equivalents include savings and time deposits. Investment in debt securities pertain to ROP bonds/government securities while investment in equity securities pertain to listed shares of stock.
The carrying value of the plan assets is equal to its fair value as of December 31, 2012 and 2011. The Company expects to contribute P=349.0 million to its defined benefit retirement plan in 2013.
The principal actuarial assumptions used in determining retirement and other post-employment benefits as of December 31 of each year are as follows:
2012 2011 EDC GCGI FG Hydro BGI EDC GCGI FG Hydro Discount rate 5.65% 5.65% 5.73% 5.70% 5.65% 5.65% 8.61% Expected rate on return
on assets 6.00%
5.00%
7.00%
– 6.00%
5.00%
7.00% Future salary increase rate 6.00% 6.00% 12.00% 6.00% 6.00% 6.00% 12.00% Medical trend rate 7.00% 7.00% – 7.00% 7.00% 7.00% –
The assumption on the discount rate is based on the long-term government bond rates approximating the expected average remaining working life of the employees. The assumption on the expected rate of return on plan assets is based on the asset allocation.
Plan deficit and experience adjustments on plan assets and liabilities for the current year and previous four years are as follows:
2012 2011 2010 2009 2008 Defined benefit
obligation P=3,281,316,791 P=3,759,487,214 P=3,434,199,212 P=3,265,217,548 P=3,179,147,273 Plan assets (1,844,120,175) (2,001,855,915) (1,877,950,146) (2,035,048,917) (1,792,770,559) Deficit 1,437,196,616 1,757,631,299 1,556,249,066 1,230,168,631 1,386,376,714 Experience
adjustment on plan assets 134,200,348 52,396,574 181,762,603 89,549,657 (48,570,370)
Experience adjustment on plan liabilities 343,315,395 279,779,927 293,915,499 10,310,861 62,109,785
A one percentage point change in the assumed rate of increase in medical costs of the Company would have the following effects:
2012 2011 Increase Decrease Increase Decrease Effect on the aggregate current service cost and interest cost P=1,185,073 P=1,185,073 P=709,657 P=616,486 Effect on the defined benefits obligation 7,417,445 7,417,445 4,864,356 4,465,907
In 2012, 2011 and 2010, the Company recognized termination expense amounting to P=605.2 million, P=386.7 million and P=140.7 million, respectively.

- 69 -
*SGVMG300344*
30. Income Tax
a. The components of the Company’s deferred tax assets and liabilities follow:
2012
Beginning of Year Charged to
Income Charged to
Equity End of Year Deferred income tax assets on: Unrealized foreign exchange losses - BOT power plants
P=1,018,787,247 (P=105,320,740)
P=–
P=913,466,507
Impairment loss on property, plant and equipment
873,760,801 (6,632,190)
–
867,128,611
Differences in fair value versus cost of Tongonan and Palinpinon property, plant and equipment 210,790,422 (19,743,203) – 191,047,219 Allowance for doubtful accounts 55,917,298 8,729,499 – 64,646,797 Provision for rehabilitation and restoration costs 40,677,914 9,134,366 – 49,812,280 Revenue generated during testing period of BGI power plant 3,798,130 36,406,581 – 40,204,711 NOLCO 126,855,340 (103,751,757) – 23,103,583 Provision for impairment of parts and supplies inventories 31,606,692 (15,057,001)
– 16,549,691
Unrealized foreign exchange losses 1,773,101 (1,038,809) – 734,292 Others 122,486,889 (36,781,363) 16,047,386 101,752,912 2,486,453,834 (234,054,617) 16,047,386 2,268,446,603 Deferred income tax liabilities on: Differences in fair value versus cost of property, plant and equipment
973,445,491
47,749,278
–
925,696,213
Capitalized rehabilitation and restoration costs 31,543,179 (3,889,988) – 35,433,167 Difference in fair value versus cost of inventories 18,252,554 1,493,705 – 16,758,849 Unrealized foreign exchange gains 15,073,462 (135,642,799) – 150,716,261 Others 27,482,491 (20,265,832) – 47,748,323 1,065,797,177 (110,555,636) – 1,176,352,813 P=1,420,656,657 (P=344,610,253) P=16,047,386 P=1,092,093,790
2011
Beginning of
Year
Effect of Voluntary Change in
Accounting Policy
Charged to Income
Charged to OCI/Equity End of Year
Deferred income tax assets on: Unrealized foreign exchange losses - BOT power plants
P=1,124,107,987
P=–
(P=105,320,740)
P=–
P=1,018,787,247
Impairment loss on property, plant and equipment
373,900,000
–
499,860,801
–
873,760,801
Allowance for doubtful accounts 16,655,667 – 39,261,631 – 55,917,298 Unrealized foreign exchange losses 46,081,980 – (44,308,879) – 1,773,101 Others 452,000,391 – 85,207,264 (992,268) 536,215,387 2,012,746,025 – 474,700,077 (992,268) 2,486,453,834 Deferred income tax liability on: Differences in fair value versus cost of property, plant and equipment
1,070,440,486 –
96,994,995 –
973,445,491
Unrealized foreign exchange gains – – (15,073,462) – 15,073,462 Others 48,603,357 (17,230,290) (11,444,577) – 77,278,224 1,119,043,843 (17,230,290) 70,476,956 – 1,065,797,177 P=893,702,182 (P=17,230,290) P=545,177,033 (P=992,268) P=1,420,656,657

- 70 -
*SGVMG300344*
Portion of deferred income tax charged to income amounting to P=41.8 million, P=8.0 million and P=1.4 million in 2012, 2011 and 2010, respectively pertains to discontinued operations.
b. As of December 31, 2012, the Company has NOLCO that can be claimed as deductions against
future taxable income as follows:
Inception Year NOLCO Application Available Balance Expiry Year 2010 P=746,441,380 (P=746,441,380) P=– 2013 2011 637,555,873 (593,800,133) 43,755,740 2014 2012 524,543,368 – 524,543,368 2015 (P=1,340,241,513) P=568,299,108
In 2012, no DTA was recognized for NOLCO of P=337.3 million pertaining to losses subject to the 30% tax regime, as management does not expect any taxable income at the 30% tax regime where the applicable NOLCO can be claimed as a deduction.
c. A numerical reconciliation between provision for income tax and the product of accounting
income multiplied by the tax rates of 10% or 30% , as applicable, follows:
2012 2011 2010 Income before income tax from: Continuing operations P=11,014,876,396 P=580,402,468 P=4,923,719,819 Discontinued operations 139,279,207 (89,224,109) 248,540,761 P=11,154,155,603 P=491,178,359 P=5,172,260,580
Income tax at statutory tax rates (10%/30%) P=2,113,826,730 P=192,498,041 P=614,035,636
Adjustments for: Income tax holiday incentives (1,040,160,497) (358,607,011) (281,870,518) Effect of RE Law and effect of
change in tax rate (206,819,310) 97,013,916 109,954,650 Dividend income (205,273,615) – – Unrecognized deferred tax asset on
NOLCO 73,383,756 – – Interest income - net of final tax (43,558,738) (45,442,819) (95,440,903) Non-deductible provisions/
(non-taxable recovery) - net 15,333,535 (24,117,578) 339,748,508 Non-deductible interest expense 16,263,341 18,099,925 15,477,353 Movement of temporary differences
reversing during income tax holiday 27,955,021 1,472,641 81,103,236 Difference of regular corporate
income tax (RCIT) and optional standard deduction (OSD) computation – (486,932) –
Non-taxable/non-deductible foreign exchange loss (gains) on
ROP bonds (533,579) (104,190) 9,635,830 Others 28,032,073 (3,933,448) (15,459,077) Provision for (benefit from) income tax P=778,448,717 (P=123,607,455) P=777,184,715 (Forward)
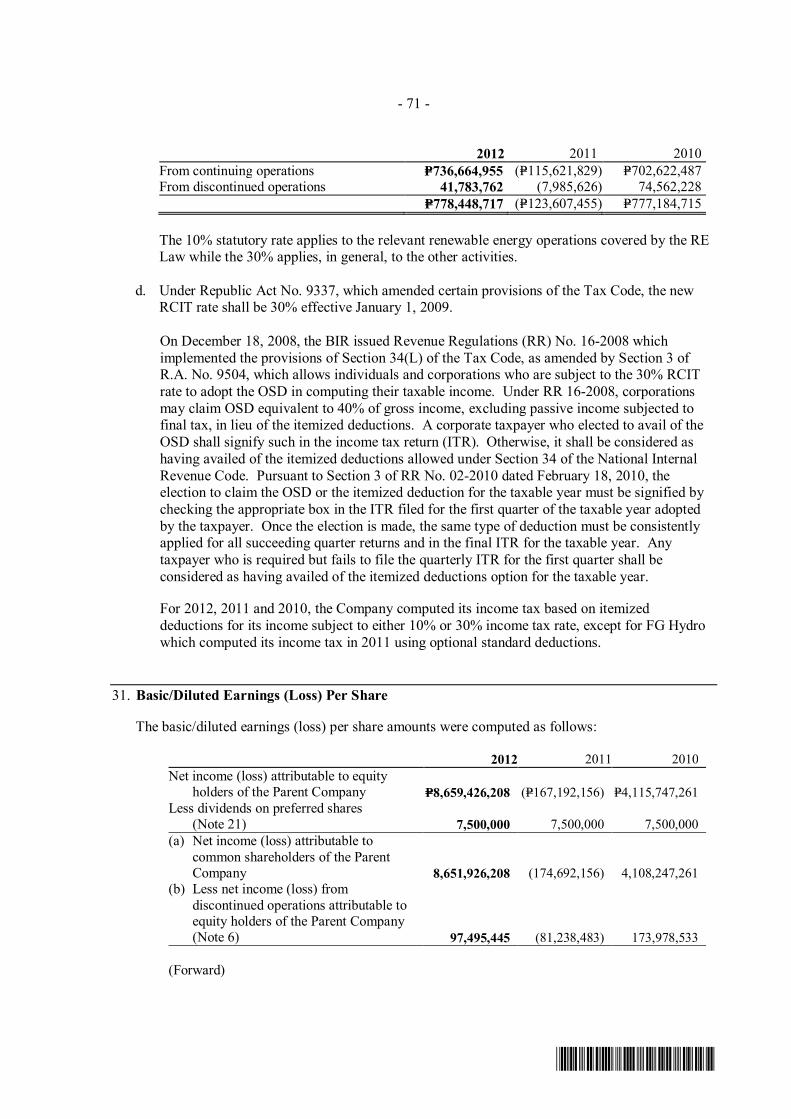
- 71 -
*SGVMG300344*
2012 2011 2010 From continuing operations P=736,664,955 (P=115,621,829) P=702,622,487 From discontinued operations 41,783,762 (7,985,626) 74,562,228 P=778,448,717 (P=123,607,455) P=777,184,715
The 10% statutory rate applies to the relevant renewable energy operations covered by the RE Law while the 30% applies, in general, to the other activities.
d. Under Republic Act No. 9337, which amended certain provisions of the Tax Code, the new
RCIT rate shall be 30% effective January 1, 2009. On December 18, 2008, the BIR issued Revenue Regulations (RR) No. 16-2008 which implemented the provisions of Section 34(L) of the Tax Code, as amended by Section 3 of R.A. No. 9504, which allows individuals and corporations who are subject to the 30% RCIT rate to adopt the OSD in computing their taxable income. Under RR 16-2008, corporations may claim OSD equivalent to 40% of gross income, excluding passive income subjected to final tax, in lieu of the itemized deductions. A corporate taxpayer who elected to avail of the OSD shall signify such in the income tax return (ITR). Otherwise, it shall be considered as having availed of the itemized deductions allowed under Section 34 of the National Internal Revenue Code. Pursuant to Section 3 of RR No. 02-2010 dated February 18, 2010, the election to claim the OSD or the itemized deduction for the taxable year must be signified by checking the appropriate box in the ITR filed for the first quarter of the taxable year adopted by the taxpayer. Once the election is made, the same type of deduction must be consistently applied for all succeeding quarter returns and in the final ITR for the taxable year. Any taxpayer who is required but fails to file the quarterly ITR for the first quarter shall be considered as having availed of the itemized deductions option for the taxable year.
For 2012, 2011 and 2010, the Company computed its income tax based on itemized deductions for its income subject to either 10% or 30% income tax rate, except for FG Hydro which computed its income tax in 2011 using optional standard deductions.
31. Basic/Diluted Earnings (Loss) Per Share
The basic/diluted earnings (loss) per share amounts were computed as follows:
2012 2011 2010 Net income (loss) attributable to equity
holders of the Parent Company P=8,659,426,208 (P=167,192,156) P=4,115,747,261 Less dividends on preferred shares
(Note 21) 7,500,000 7,500,000 7,500,000 (a) Net income (loss) attributable to
common shareholders of the Parent Company 8,651,926,208 (174,692,156) 4,108,247,261
(b) Less net income (loss) from discontinued operations attributable to equity holders of the Parent Company (Note 6) 97,495,445 (81,238,483) 173,978,533 (Forward)

- 72 -
*SGVMG300344*
2012 2011 2010 (c) Net income (loss) from continuing operations attributable to common shareholders of the Parent Company P=8,554,430,763 (P=93,453,673) P=3,934,268,728 (d) Weighted average number
of common shares outstanding 18,750,000,000 18,750,000,000 18,750,000,000 Basic/diluted earnings (loss) per
share (a/d) P=0.461 (P=0.009) P=0.219 From continuing operations (c/d) 0.456 (0.005) 0.210 From discontinued operations (b/d) 0.005 (0.004) 0.009
The Parent Company does not have dilutive common share equivalents.
32. Share-Based Payment
On January 23, 2009, the BOD of the Parent Company approved the ESGP. The ESGP is an integral part of the Parent Company’s total rewards program for its officers and employees and is intended to provide an opportunity for participants to have real and personal direct interest in the Parent Company.
On December 1, 2009, the Nomination and Compensation Committee (the Committee) granted 7,000,000 shares representing the Parent Company common shares authorized under the ESGP which were transferred to the BDO Trust. These shares were part of the 93,000,000 common shares issued to the BDO Trust and recorded under “Common shares in employee trust account”. BDO Trust will administer the issuance of the common shares to the employee grantees under the Parent Company’s ESGP (see Note 21).
The stock grants are given in lieu of cash incentives and bonuses. The grant of shares under the ESGP does not require an exercise price to be paid by the awardees. The granted shares will vest over a three-year period as follows: 20% after the first anniversary of the Grant date; 30% after the second anniversary of the Grant date; and the remaining 50% after the third anniversary of the Grant date. Awardees that resign or are terminated will lose any right to unvested shares. There are no cash settlement alternatives.
The ESGP covers officers and employees of the Parent Company or other individuals whom the Committee may decide to include. The Committee shall maintain the sole discretion over the selection of individuals to whom awards may be granted for any given calendar year. Stock awards granted by the Committee to officers and employees of EDC are shown below:
Grant Date
Number of Shares
Granted
Fair Value Per Share
at Grant Date Vested UnvestedDecember 18, 2009 7,000,000 P=4.20 7,000,000 – June 18, 2010 2,625,000 4.70 1,312,500 1,312,500June 18, 2011 2,625,000 6.75 525,000 2,100,000June 18, 2012 2,625,000 5.84 – 2,625,000

- 73 -
*SGVMG300344*
There were no stock awards cancelled, expired or forfeited in 2012, 2011 and 2010.
Total compensation expense recognized in 2012, 2011 and 2010 amounted to P=24.7 million, P=8.8 million and P=15.7 million, respectively (see Note 22). A corresponding decrease in the “Common shares in employee trust account” amounting to P=13.8 million, P=7.0 million and P=12.4 million and increase in the “Additional paid-in capital” account amounting to P=10.9 million, P=1.9 million and P=3.3 million was recorded for the years ended December 31, 2012, 2011 and 2010, respectively.
33. Financial Risk Management Objectives and Policies
The Company’s financial instruments consist mainly of cash and cash equivalents, AFS investments and long-term debts. The main purpose of these financial instruments is to finance the Company’s operations and accordingly manage its exposure to financial risks. The Company has various financial assets and liabilities such as trade receivables, trade payables and other liabilities, which arise directly from operations.
Financial Risk Management Policy The main financial risks arising from the Company’s financial instruments are credit risk, foreign currency risk, interest rate risk and liquidity risk. The Company’s policies for managing the aforementioned risks are summarized hereinafter below.
Credit Risk The Company’s geothermal and power generation business trades with only one major customer, NPC, a government-owned-and-controlled corporation. Any failure on the part of NPC to pay its obligations to the Company would significantly affect the Company’s business operations. As a practice, the Company monitors closely its collection from NPC and charges interest on delayed payments following the provision of its respective SSAs and PPAs. Receivable balances are monitored on an ongoing basis to ensure that the Company’s exposure to bad debts is not significant. The maximum exposure of trade receivable is equal to its carrying amount. With respect to credit risk arising from other financial assets of the Company, which comprise cash and cash equivalents excluding cash on hand, other receivables, amounts due from related parties and AFS investments, the Company’s exposure to credit risk arises from default of the counterparty, with a maximum exposure equal to the carrying amount of these instruments before taking into account any collateral and other credit enhancements. The following tables show the aging analysis of the Company’s financial assets as of December 31, 2012 and 2011: 2012 Past Due but Not Impaired
Neither Past
Due nor Impaired
Less than 30 Days
31 Days to 1 Year
Over 1 Year up to
3 Years Over
3 Years
Past Due and
Impaired Total (In Thousand Pesos) Loans and receivables: Cash and cash
equivalents (excluding cash on hand) P=11,420,013 P=– P=– P=– P=– P=– P=11,420,013
Trade receivables 3,600,571 150,636 166,380 – – 75,603 3,993,190 (Forward)

- 74 -
*SGVMG300344*
2012 Past Due but Not Impaired
Neither Past
Due nor Impaired
Less than 30 Days
31 Days to 1 Year
Over 1 Year up to
3 Years Over
3 Years
Past Due and
Impaired Total (In Thousand Pesos) Non-trade receivables P=12,093 P=37,927 P=18,104 P=10 P=– P=– P=68,134 Advances to
employees 57,410 3,214 227 1,936 – – 62,787 Loans and notes
receivables 59,984 – – – – – 59,984 Employee
receivables* 12,210 – – – – – 12,210 Long-term
receivables 12,228 – – – – 67,225 79,453 AFS investments: Debt investments 605,970 – – – – – 605,970 Financial assets at
FVPL: Derivative assets 249 – – – – – 249 Total P=15,780,728 P=191,777 P=184,711 P=1,946 P=– P=142,828 P=16,301,990
*Includes noncurrent portion of employee receivables included under other noncurrent assets - others.
2011 Past Due but Not Impaired
Neither Past Due nor
Impaired Less than
30 Days 31 Days
to 1 Year
Over 1 Year up to
3 Years Over
3 Years
Past Due and
Impaired Total (In Thousand Pesos) Loans and receivables: Cash and cash
equivalents (excluding cash on hand) P=12,486,732 P=– P=– P=– P=– P=– P=12,486,732
Trade receivables 2,942,461 75,181 150,377 37,576 – 130,839 3,336,434 Non-trade receivables 54,130 6,792 38,477 – – – 99,399 Loans and notes
receivables 59,332
– –
– –
– 59,332 Advances to
employees 26,025
1,416 7,727 2,767 –
– 37,935 Employee
receivables* 19,949
– –
– –
– 19,949 Long-term
receivables – – – – – 61,062 61,062 Due from related
parties 8 – – – – – 8 AFS investments: Debt investments 673,854 – – – – – 673,854 Total P=16,262,491 P=83,389 P=196,581 P=40,343 P=– P=191,901 P=16,774,705
*Includes noncurrent portion of employee receivables included under other noncurrent assets - others.
Credit Quality of Financial Assets Financial assets are classified as high grade if the counterparties are not expected to default in settling their obligations. Thus, the credit risk exposure is minimal. These counterparties normally include customers, banks and related parties who pay on or before due date. Financial assets are classified as a standard grade if the counterparties settle their obligation with the Company with tolerable delays. Low grade accounts are accounts, which have probability of impairment based on historical trend. These accounts show propensity of default in payment despite regular follow-up actions and extended payment terms.

- 75 -
*SGVMG300344*
As of December 31, 2012 and 2011, financial assets categorized as neither past due nor impaired are viewed by management as high grade, considering the collectability of the receivables and the credit history of the counterparties. Meanwhile, past due but not impaired financial assets are classified as standard grade.
Foreign Currency Risk The Company’s exposure to foreign currency risk is mainly from the financial assets and liabilities that are denominated in US dollar (US$). This primarily arises from future payments of foreign currency-denominated loans and other commercial transactions and the Company’s investment in ROP Bonds.
The Company’s exposure to foreign currency risk to some degree is mitigated by some provisions in the Company’s GRESCs (formerly GSCs), SSAs and PPAs. The service contracts allow full cost recovery while the sales contracts include billing adjustments covering the movements in Philippine peso and the US$ rates, US Price and Consumer Indices, and other inflation factors.
To mitigate further the effects of foreign currency risk, the Company will prepay, refinance or hedge its foreign currency-denominated loans, whenever deemed feasible.
The Company’s foreign currency-denominated financial assets and liabilities (translated into Peso) as of December 31, 2012 and 2011 are as follows:
2012 Original Currency
US$ Japanese yen
(JP¥)
Singaporean dollar(SGD) Euro (EUR)
New Zealand dollar (NZD)
Peso Equivalent1
Financial Assets Loans and receivables: Cash equivalents 34,740,000 − − − − P=1,426,077,000 Cash on hand and in banks 3,092,834 − − − − 126,960,850 Trade receivables 50,449,149 − − − − 2,070,937,566 AFS investments: Debt investments 13,569,553 − − − − P=605,969,837 Financial assets at FVPL: Derivative assets 6,060 − − − − 248,760 Total financial assets 101,857,596 − − − − P=4,230,194,013 Financial Liabilities Liabilities at amortized cost: Accounts payable 15,842,877 16,494,900 230,186 965,226 261,141 P=727,400,439 Long-term debt 469,727,712 − − − − 19,282,322,589 Accrued interest on long-term
debts 8,824,142 −
−
−
− 362,231,029 Other payables - guarantee fees 1,405,947 51,773,878 − − − 82,412,430
Derivatives designated as cash flow hedges:
Derivative liabilities 5,820,313 − − − − 238,923,862 Total financial liabilities 501,620,991 68,268,778 230,186 965,226 261,141 P=20,693,290,349
1 US$1= P=41.050, JP¥1=P=0.477, SGD1=P=33.703, EUR1=P=54.530 and NZD1=P=33.659 as of December 31, 2012 (see Note 27).
2011 Original Currency
US$ JP¥ Sweden kroner
(SEK) Peso
Equivalent1 Financial Assets Loans and receivables: Cash equivalents 99,562,576 − − P=4,364,823,332 Cash on hand and in banks 1,909,007 125,208 − 83,761,320 Trade receivables 1,802,580 − − 79,025,107 AFS investments: Debt investments 15,370,750 − − 673,853,680 Total financial assets 118,644,913 125,208 − 5,201,463,439 (Forward)

- 76 -
*SGVMG300344*
2011 Original Currency
US$ JP¥ Sweden kroner
(SEK) Peso
Equivalent1 Financial Liabilities Liabilities at amortized cost: Accounts payable 69,067,270 53,561,520 10,776,022 P=3,126,615,268 Accrued interest on long-term debts 8,808,888 482,792 − 386,441,946 Other payables - guarantee fees 1,405,947 51,773,878 − 90,733,635 Long-term debts 468,600,735 35,992,417 − 20,563,708,655 Total financial liabilities 547,882,840 141,810,607 10,776,022 P=24,167,499,504
1US$1= P=43.840, JP¥1=P=0.562 and SEK1=P=6.363 as of December 31, 2011 (see Note 27).
The following tables demonstrate the sensitivity to a reasonably possible change in the exchange rates of relevant foreign currencies, with all other variables held constant, of the Company’s income before income tax for 2012 and 2011 and equity as of December 31, 2012 and 2011. The impact on the Company’s income before income tax is due to revaluation of monetary assets and monetary liabilities while the impact on equity arises from changes in the fair value of cross currency swaps designated as cash flow hedges.
2012
Foreign Currency Appreciates
(Depreciates) By Effect on Income
Before Income Tax Effect on Equity USD 10% or P=4.105 (P=1,617,161,228) (P=249,654,621) (10% or P=4.105) 1,617,161,228 257,077,605 JPY 10% or P=0.04770 (P=3,256,421) – (10% or P=0.04770) 3,256,421 – SGD 10% or P=3.37032 (775,800) – (10% orP=3.37032) 775,800 – EUR 10% or P=5.45300 (5,263,377) – (10% or P=5.45300) 5,263,377 – NZD 10% or P=3.36591 (878,977) –
(10% or P=3.36591) 878,977 –
2011
Foreign Currency Appreciates
(Depreciates) By Effect on Income
Before Income Tax Effect on Equity USD 10% or P=4.38 (P=1,880,062,120) – (10% or P=4.38) 1,880,062,120 – JPY 10% or P=0.06252 (8,858,171) – (10% or P=0.05115) 7,247,208 –
SSEK 10% or P=0.6363 (6,856,783) – (10% or P=0.6363) 6,856,783 –
Interest Rate Risk The Company’s exposure to the risk of changes in market interest rates relates primarily to the Company’s long-term debt obligations with floating interest rates and AFS debt investments.
The interest rates of some of the Company’s long-term borrowings and AFS debt investments are fixed at the inception of the loan agreement.
The Company regularly evaluates its interest rate risk by taking into account the cost of qualified borrowings being charged by its creditors. Prepayment, refinancing or hedging the risks are undertaken when deemed feasible and advantageous to the Company.

- 77 -
*SGVMG300344*
Interest Rate Risk Table The following tables provide for the effective interest rates and interest payments by period of maturity of the Company’s long-term debts:
2012
Interest Rates
Within 1 Year
More than 1 year but less than 4 years
More than 4 Years but
less than 5 Years
More than 5 Years
Total Fixed Rate US$ 300.0 million Notes 6.50% P=800,475 P=2,401,425 P=800,475 P=2,801,663 P=6,804,038 Peso Public Bonds Series 1 8.64% 734,553 1,101,830 – – 1,836,383 Series 2 9.33% 326,645 979,934 – – 1,306,579 (Forward) IFC 1 7.40% P=262,700 P=634,697 P=160,080 P=422,094 P=1,479,571 IFC 2 6.66% 227,506 546,583 148,129 575,002 1,497,220 FXCN P=3.0 billion
6.62%
197,030
579,179
189,089
826,335
1,791,633
P=4.0 billion 6.61% 262,449 771,480 251,871 1,100,698 2,386,498 Floating Rate PNB and Allied Bank 1.5% +
PDST-F rate or 1.0% +
BSP overnight
rate
379,664
881,147
192,044
231,911
1,684,766 US$ 175.0 million Refinanced Syndicated Term Loan
1.75% + LIBOR
138,125
294,676
36,055
–
468,856
2011
Interest Rates
Within 1 Year
More than 1 year but less than 4 years
More than 4 Years but
less than 5 Years
More than 5 Years
Total Fixed Rate US$ 300 million Notes 6.50% P=854,880 P=2,564,640 P=854,880 P=3,846,960 P=8,121,360 Peso Public Bonds Series 1 8.64% 734,553 1,836,383 – – 2,570,936 Series 2 9.33% 326,645 979,934 326,645 – 1,633,224 IFC 1 7.40% 289,163 711,135 186,262 582,174 1,768,734 IFC 2 6.66% 273,799 608,541 165,548 723,131 1,771,019 FRCN Series 1
8.37%
180,117
207,851
–
–
387,968
Series 2 9.40% 423,750 816,579 92,983 – 1,333,312 Series 3 8.43% 102,907 118,752 – – 221,659 PNB and Allied Bank 9.03% 416,291 1,014,291 246,520 423,956 2,101,058 OECF 3.20% 327 – – – 327 (Forward)

- 78 -
*SGVMG300344*
2011
Interest Rates
Within 1 Year
More than 1 year but less than 4 years
More than 4 Years but
less than 5 Years
More than 5 Years
Total Floating Rate US$ 175.0 million Refinanced Syndicated Term Loan
1.75% + LIBOR
P=155,724
P=372,675
P=89,541
P=38,506
P=656,446 The following tables demonstrate the sensitivity to a reasonably possible change in interest rates, with all other variables held constant, of the Company’s income before income tax in 2012 and 2011 and equity as of December 31, 2012 and 2011. The impact on the Company’s equity is due to changes in the fair value of AFS investments and cross currency swaps designated as cash flow hedges.
2012 Effect on Equity
Increase/Decrease in Basis Points
Effect on Income Before Income Tax
Change in Fair Value of AFS Investments
Cumulative Translation Adjustment
+100 (P=45,157,053) (P=4,424,970) P=78,880,941 -100 45,157,053 4,864,677 (89,796,217)
2011
Effect on Equity Increase/Decrease
in Basis Points Effect on Income
Before Income Tax Change in Fair Value of
AFS Investments Cumulative Translation
Adjustment +100 (P=76,720,000) (P=8,929,578) P=– -100 76,720,000 19,217,468 –
Liquidity Risk The Company’s objective is to maintain a balance between continuity of funding and sourcing flexibility through the use of available financial instruments. The Company manages its liquidity profile to meet its working capital and capital expenditure requirements and service debt obligations. As part of the liquidity risk management program, the Company regularly evaluates and considers the maturity of both its financial investments and financial assets (e.g., trade receivables and other financial assets) and resorts to short-term borrowings whenever its available cash or matured placements is not enough to meet its daily working capital requirements. To ensure immediate availability of short-term borrowings, the Company maintains credit lines with banks on a continuing basis. Liquidity risk arises primarily when the Company has difficulty collecting its receivables from its major customer, NPC. Other instances that contribute to its exposure to liquidity risk are when the Company finances long-term projects with internal cash generation and when there is credit crunch especially at times when the Company has temporary funding gaps.

- 79 -
*SGVMG300344*
The tables below show the maturity profile of the Company’s financial assets used for liquidity purposes based on contractual undiscounted cash flows as of December 31, 2012 and 2011.
December 31, 2012
On Demand Less than 3
Months 3 to
6 Months >6 to
12 Months >1 to
5 Years More than
5 Years Total
(In Thousand Pesos) Loans and receivables - Cash equivalents P=– P=9,011,083 P=– P=– P=– P=– P=9,011,083 AFS investments - Debt investments 605,970 – – – – – 605,970 P=605,970 P=9,011,083 P=– P=– P=– P=– P=9,617,053
December 31, 2011
On Demand Less than 3
Months 3 to
6 Months >6 to
12 Months >1 to
5 Years More than
5 Years Total
(In Thousand Pesos) Loans and receivables - Cash equivalents P=– P=11,800,643 P=– P=– P=– P=– P=11,800,643 AFS investments - Debt investments 673,854 – – – – – 673,854 P=673,854 P=11,800,643 P=– P=– P=– P=– P=12,474,497
The tables below summarize the maturity analysis of the Company’s financial liabilities as of December 31, 2012 and 2011 based on contractual undiscounted payments:
2012 On
Demand Less than 3 Months
3 to 6 Months
>6 to 12 Months
>1 to 5 Years
More than 5 Years Total
(In Thousand Pesos) Liabilities at amortized
cost: Accounts payable* P=− P=5,665,070 P=− P=− P=− P=− P=5,665,070 Accrued interest on
long-term debts − 360,213 300,914 − − − 661,127 Other payables 82,412 7,257 − − − − 89,669 Due to related parties 49,578 − − − − − 49,578 Royalty fee payable − 20,618 − − − − 20,618 Long-term debts − 75,879 2,217,278 2,168,742 33,285,188 30,479,342 68,226,429 Derivatives designated as
cash flow hedges: Derivative liabilities − 85,424 − − 153,500 − 238,924 Total P=131,990 P=6,214,461 P=2,518,192 P=2,168,742 P=33,438,688 P=30,479,342 P=74,951,415
*Excluding other liabilities which pertain to statutory liabilities to the Government.
2011 On
Demand Less than 3 Months
3 to 6 Months
>6 to 12 Months
>1 to 5 Years
More than 5 Years Total
(In Thousand Pesos) Liabilities at amortized
cost: Accounts payable* P=− P=4,731,730 P=− P=− P=− P=− P=4,731,730 Accrued interest on
long-term debts − 713,620 243,217 − − − 956,837 Other payables 90,734 3,518 − 81,092 − − 175,344 Due to related parties 60,091 − − − − − 60,091 Royalty fee payable − 133,228 87,500 136,573 − − 357,301 Long-term debts − 924,581 1,140,510 3,030,619 37,322,968 29,329,707 71,748,385 Total P=150,825 P=6,506,677 P=1,471,227 P=3,248,284 P=37,322,968 P=29,329,707 P=78,029,688
*Excluding other liabilities which pertain to statutory liabilities to the Government.

- 80 -
*SGVMG300344*
Financial Assets and Financial Liabilities Set out below is a comparison of carrying amounts and fair values of the Company’s financial instruments as of December 31, 2012 and 2011.
2012 2011
Carrying Amounts Fair Values
Carrying Amounts Fair Values
Financial Assets Loans and receivables: Cash and cash equivalents P=11,420,144,203 P=11,420,144,203 P=12,493,406,963 P=12,493,406,963 Trade receivables 3,917,587,128 3,917,587,128 3,205,594,212 3,205,594,212 Non-trade receivables 68,133,713 66,133,713 99,398,810 99,398,810 Advances to employees 62,787,120 62,787,120 37,934,595 37,934,595 Loans and notes receivables 59,983,898 59,983,898 59,331,933 59,331,933 Employee receivables 12,209,689 12,209,689 19,948,544 19,948,544 Due from related parties − − 7,812 7,812 Long-term receivables 12,228,071 10,808,592 − − AFS investments: Debt investments 605,969,837 605,969,837 673,853,680 673,853,680 Equity investments 233,501,056 233,501,056 20,443,924 20,443,924 Financial assets at FVPL: Derivative assets 248,760 248,760 − − P=16,392,793,475 P=16,389,373,996 P=16,609,920,473 P=16,609,920,473
Financial Liabilities Financial liabilities at amortized
cost: Accounts payable* P=5,665,070,305 P=5,665,070,305 P=4,731,729,893 P=4,731,729,893 Accrued interest and guarantee
fees 661,127,313 661,127,313 1,047,605,943 1,047,605,943 Other payables 89,669,356 89,669,356 175,343,680 175,343,680 Due to related parties 49,577,503 49,577,503 60,090,825 60,090,825 Royalty fee payable 20,618,242 20,618,242 287,626,313 290,907,188 Long-term debts 49,049,871,866 55,036,160,776 51,489,571,455 59,055,715,275 Derivative liabilities designated
as cash flow hedges 238,923,862 238,923,862 − − P=55,774,858,447 P=61,761,147,357 P=57,791,968,109 P=65,361,392,804
*Excluding other liabilities which pertain to statutory liabilities to the Government.
The methods and assumptions used by the Company in estimating the fair value of its financial instruments are:
Cash and Cash Equivalents Carrying amounts approximate fair values due to their short-term nature. Trade and Other Receivables, Royalty Fee Payable, Amounts Due from and to Related Parties, Trade and Other Payables These are instruments with relatively short maturity ranging from one to three months. Carrying amounts approximate their fair values.
Long-term Receivables The fair value of long-term receivables was computed by discounting the expected cash flow using the applicable rate of 3.13% in 2012.
AFS Investments Fair values of quoted debt and equity securities are based on quoted market prices. For equity investments that are not quoted, the investments are carried at cost less allowance for impairment losses due to the unpredictable nature of future cash flows and the lack of suitable methods of arriving at a reliable fair value.

- 81 -
*SGVMG300344*
Long-term Debts The fair values for the Company’s long-term debts are estimated using the discounted cash flow methodology with the applicable rates ranging from 1.75% to 8.56% in 2012 and 1.91% to 10.88% in 2011. The following tables show the fair value information of financial instruments classified under FVPL and AFS investments analyzed by source of inputs on fair valuation as follows:
• Quoted prices in active markets for identical assets or liabilities (Level 1); • Those involving inputs other than quoted prices included in Level 1 that are observable for the
asset or liability, either directly (as prices) or indirectly (derived from prices) (Level 2); and • Those with inputs for the asset or liability that are not based on observable market data
(unobservable inputs) (Level 3).
2012 Total Level 1 Level 2 Level 3 At Cost Financial asset at FVPL: Derivative asset P=248,760 P=− P=248,760 P=− P=− AFS investments: Debt investments 605,969,837 605,969,837 − − − Equity investments 233,501,056 233,426,506 − − 74,550 Derivatives designated as cash flow hedges: Derivative liabilities 238,923,862 − 238,923,862 − −
2011 Total Level 1 Level 2 Level 3 At Cost AFS investments: Debt investments P=673,853,680 P=673,853,680 P=− P=− P=− Equity investments 20,443,924 20,369,374 − − 74,550
During 2012 and 2011, there were no transfers between Level 1 and Level 2 fair value measurements and no transfers into and out of Level 3 fair value measurements.
The Company classifies its financial instruments in the following categories:
2012
Loans and Receivables
AFS Investments
Liabilities at Amortized
Cost
Financial Assets at
FVPL
Derivatives Designated as
Cash Flow Hedges Total
(In Thousand Pesos)
Financial Assets Cash and cash equivalents P=11,420,144 P=− P=− P=− P=− P=11,420,144 Trade receivables 3,917,587 − − − − 3,917,587 Non-trade receivables 68,134 − − − − 68,134 Advances to employees 62,787 − − − − 62,787 Loans and notes receivables 59,984 − − − − 59,984 Employee receivables 12,210 − − − − 12,210 Long-term receivables 12,228 − − − − 12,228 AFS - debt investments − 605,970 − − − 605,970 AFS - equity investments − 233,501 − − − 233,501 Derivative asset − − − 249 − 249 Total financial assets P=15,553,074 P=839,471 P=− P=249 P=− P=16,392,794 (Forward)

- 82 -
*SGVMG300344*
2012
Loans and Receivables
AFS Investments
Liabilities at Amortized
Cost
Financial Assets at
FVPL
Derivatives Designated as
Cash Flow Hedges Total
(In Thousand Pesos)
Financial Liabilities Accounts payable P=− P=− P=5,665,070 P=− P=− P=5,665,070 Accrued interest on long-
term debts − − 661,127 − − 661,127 Other payables − − 89,669 − − 89,669 Due to related parties − − 49,578 − − 49,578 Royalty fee payable − − 20,618 − − 20,618 Long-term debts − − 49,049,872 − − 49,049,872 Derivative liabilities − − − − 238,923 238,923 Total financial
liabilities P=− P=− P=55,535,934 P=− P=238,923 P=55,774,857
2011
Loans and Receivables
AFS Investments
Liabilities at Amortized
Cost Total (In Thousand Pesos)
Financial Assets Cash and cash equivalents P=12,493,407 P=− P=− P=12,493,407 Trade receivables 3,205,594 − − 3,205,594 Non-trade receivables 99,399 − − 99,399 Loans and notes receivables 59,332 − − 59,332 Advances to employees 37,935 − − 37,935 Employee receivables 19,949 − − 19,949 Due from related parties 8 − − 8 AFS - debt investments − 673,854 − 673,854 AFS - equity investments − 20,444 − 20,444 Total financial assets P=15,915,624 P=694,298 P=− P=16,609,922
Financial Liabilities Accounts payable P=− P=− P=4,798,971 P=4,798,971 Accrued interest on long-term debts − − 1,047,606 1,047,606 Other payables − − 175,344 175,344 Due to related parties − − 60,091 60,091 Royalty fee payable − − 287,626 287,626 Long-term debts − − 51,489,571 51,489,571 Total financial liabilities P=− P=− P=57,859,209 P=57,859,209
The following table demonstrates the income, expense, gains or losses of the Company’s financial
instruments for the years ended December 31, 2012, 2011 and 2010:
2012 2011 2010
Effect on
Profit or Loss Effect
on Equity Effect on
Profit or Loss Effect
on Equity Effect on
Profit or Loss Effect
on Equity
Increase
(Decrease) Increase
(Decrease) Increase
(Decrease) Increase
(Decrease) Increase
(Decrease) Increase
(Decrease)
Loans and receivables Interest income on: Cash in banks (Note 8) P=3,596,543 P=– P=6,388,430 P=– P=6,336,497 P=– Cash equivalents (Note 8) 312,797,929 – 369,729,747 – 311,947,757 – Trade receivables 693,922 – 2,983,715 – P=6,007,914 – Employee and other receivables 3,338,547 – 8,909,082 – 22,329,156 – Provision for doubtful
accounts - trade receivables (31,775,230) – (100,232,678) – (21,008,910) – P=288,651,711 P=– P=287,778,296 P=– P=325,612,414 P=–
(Forward)

- 83 -
*SGVMG300344*
2012 2011 2010
Effect on
Profit or Loss Effect
on Equity Effect on
Profit or Loss Effect
on Equity Effect on
Profit or Loss Effect
on Equity
Increase
(Decrease) Increase
(Decrease) Increase
(Decrease) Increase
(Decrease) Increase
(Decrease) Increase
(Decrease) AFS investments Equity investments: Net gain (loss) recognized in equity P=– (P=3,648,940) P=– P=2,277,570 P=– P=2,777,926 Debt investments: Net gain (loss) recognized
in equity – 23,412,750 – (30,001,763) – 3,763,548 Interest income on
government debt securities 43,111,994 – 1,099,376 – 1,073,692 –
Net unrealized gain removed from equity and recognized in profit or loss (Note 10) – – 235,689 – – –
Gain on early redemption of AFS investment (Note 10) – – 271,292 – – –
P=43,111,994 P=19,763,810 P=1,606,357 (P=27,724,193) P=1,073,692 P=6,541,474 Financial assets at FVPL Net fair value changes of
forward contracts P=4,131,240 P=– P=108,319,377 P=– P=446,597,342 P=– Unrealized loss on fair value
on changes of embedded currency options – – – – (9,598,487) –
P=4,131,240 P=– P=108,319,377 P=– P=436,998,855 P=– Derivatives designated as
cash flow hedges Cumulative translation
adjustment P=– (P=144,426,476) P=– P=– P=– P=– Financial liabilities at
amortized cost Interest expense on (Note 26): Long-term debts including
amortization of transaction costs (P=3,656,390,728) P=– (P=4,005,331,916) P=– (P=3,643,864,967) P=–
Royalty fee payable (10,945,030) – (31,332,828) – (56,102,861) – Loan payable and others (59,822) – (1,140,521) – (304,361) – Loss on extinguishment of debt
(Note 28) (188,145,763) – (197,898,124) – – – (P=3,855,541,343) P=– (P=4,235,703,389) P=– (P=3,700,272,189) P=–
Derivative Financial Instruments The Company engages in derivative transactions, particularly foreign currency forwards, foreign currency swaps and cross-currency swaps, to manage its foreign currency risk and/or interest rate risk arising from its foreign-currency denominated loans. These derivatives are accounted for either as derivatives designated as accounting hedges or derivatives not designated as accounting hedges.

- 84 -
*SGVMG300344*
The table below shows the derivative financial instruments of the Company as of December 31, 2012.
Derivative
Assets Derivative Liabilities
Derivatives designated as accounting hedges: Cross-currency swaps P=– P=238,923,862 Derivatives not designated as accounting hedges:
Foreign currency forwards 248,760 – Total derivatives P=248,760 P=238,923,862 Presented as: Current P=248,760 P=85,423,548 Noncurrent – 153,500,314 Total derivatives P=248,760 P=238,923,862
The Company has no outstanding derivative contracts as of December 31, 2011.
Derivatives Not Designated as Accounting Hedges Foreign Currency Swap Contracts A foreign currency swap is an agreement to exchange amounts in different currencies based on the spot rate at trade date and to re-exchange the same currencies at a future date based on an agreed rate. In 2012 and 2011, the Company entered into a total of 6 and 36 foreign currency swap contracts, respectively, with terms as follows:
December 31, 2012 December 31, 2011
Position
Aggregate notional amount
(in million)
Average forward rate
Aggregate
notional amount (in million)
Average forward rate
Sell US$ - buy PHP= US$44.50 P=41.42 US$701.00 P=43.32 Sell JP¥ - buy PHP= - - JP¥12,450.00 P=0.53 Sell JP¥ - buy US$ - - JP¥2,075.00 JP¥81.00
For the years ended December 31, 2012 and 2011, the Company recognized P=4.1 million loss and P=40.1 million gain, respectively, from the fair value changes of these currency swap contracts. These are recorded under “Derivative gains (losses) - net” in the consolidated statements of income.
Foreign Currency Forward Contracts These are contractual agreements to buy or sell a foreign currency at an agreed rate on a future date.

- 85 -
*SGVMG300344*
In 2011, the Company entered into a total of 38 foreign currency forward contracts. These include six deliverable buy JP¥ - sell US$, 16 non-deliverable buy US$ - sell PHP= and 16 non-deliverable sell US$ - buy PHP= forward contracts. The aggregate notional amounts and weighted average forward rates of these foreign currency forward contracts as are as follows:
December 31, 2011
Position Aggregate notional amount Average
forward rate Buy JP¥ - sell US$ JP¥2,441.00 million JP¥83.00 Buy US$ - sell PHP= US$255.00 million P=43.12 Sell US$ - buy PHP= US$255.00 million P=43.34
For the year ended December 31, 2011, the Company recognized P=68.3 million gain from fair value changes of these foreign currency forwards contracts. Such amount is recorded under “Derivative gains - net” in the consolidated statements of income. The Company did not enter into any foreign currency forward transaction in 2012. Derivatives Designated as Accounting Hedges In 2012, the Company entered into 6 non-deliverable cross-currency swap (NDCCS) agreements with an aggregate notional amount of US$65.00 million to partially hedge the foreign currency and interest rate risks on its Refinanced Syndicated Term Loan that is benchmarked against US LIBOR and with flexible interest reset feature that allows the Company to select what interest reset frequency to apply (i.e., monthly, quarterly or semi-annually). As it is the Company’s intention to reprice the interest rate on the hedged loan quarterly, the Company utilizes NDCCS with quarterly interest payments and receipts. Under the NDCCS agreements, the Company receives floating interest based on 3-month US LIBOR plus 175 basis points and pays fixed peso interest. On specified dates, the Company also receives specified USD amounts in exchange for specified peso amounts based on the agreed swap rates. These USD receipts correspond with the expected interest and fixed principal amounts due on the hedged loan. Effectively, the 6 NDCCS converted 37.14% of hedged USD loan into a fixed rate peso loan.
Pertinent details of the NDCCS are as follows:
Notional amount (in
million)
Trade Date
Effective
Date
Maturity
Date
Swap
rate
Fixed
rate
Variable rate US$15.00 03/26/12 03/27/12 06/17/17 P43.05 4.87% 3-month LIBOR + 175 bps US$10.00 04/18/12 06/27/12 06/17/17 42.60 4.92% 3-month LIBOR + 175 bps US$10.00 05/03/12 06/27/12 06/17/17 42.10 4.76% 3-month LIBOR + 175 bps US$10.00 06/15/12 06/27/12 06/17/17 42.10 4.73% 3-month LIBOR + 175 bps US$10.00 07/17/12 09/27/12 06/17/17 41.25 4.58% 3-month LIBOR + 175 bps US$10.00 10/29/12 12/27/12 06/17/17 41.19 3.44% 3-month LIBOR + 175 bps
The maturity date of the six NDCCS coincides with the maturity date of the hedged loan. As of December 31, 2012, the outstanding aggregate notional amount of the Company’s NDCCS amounted to US$65.00 million. The aggregate fair value changes on these NDCCS amounting to P=144.4 million loss was recognized by the Company under “Cumulative Translation Adjustment” account.

- 86 -
*SGVMG300344*
Hedge Effectiveness Results Since the critical terms of the hedged loan and the NDCCS match, except for one to two days timing difference on the interest reset dates, the hedges were assessed to be highly effective. As such, the aggregate fair value changes on these NDCCS amounting to P=238.9 million loss was recognized by the Company under “Cumulative Translation Adjustment” account in the consolidated statements of financial position. No ineffectiveness was recognized in the consolidated statement of income for the year ended December 31, 2012. The net movement of changes made to “Cumulative Translation Adjustment” account for the Company’s cash flow hedges is as follows:
Balance at beginning of year P=– Changes in fair value of the cash flow hedges 272,353,423 272,353,423 Less: Transferred to consolidated statement of income
Foreign exchange loss 78,450,000 Interest expense 33,429,561
111,879,561 Balance before tax 160,473,862 Less: Tax 16,047,386 Balance at end of year P=144,426,476
Fair Value Changes of Derivatives The tables below summarize the net movement in fair values of the Company’s derivatives as of December 31, 2012 and 2011.
December 31, 2012 December 31, 2011 Balance at beginning of year P=– P=– Net changes in fair value of derivatives: Designated as accounting hedges (272,353,423) – Not designated as accounting
hedges (4,131,240) (108,319,377) (276,484,663) (108,319,377) Fair value of settled instruments: Designated as accounting hedges 33,429,561 – Not designated as accounting
hedges 4,380,000 108,319,377 37,809,561 – Balance at end of year (P=238,675,102) P=–
Presented as: Derivative assets P=248,760 P=– Derivative liabilities (238,923,862) – (P=238,675,102) P=–
The effective portion of the changes in the fair value of the NDCCS designated as accounting hedges were deferred in equity under “Cumulative Translation Adjustment” account.

- 87 -
*SGVMG300344*
Capital Management The primary objective of the Company’s capital management is to ensure that it maintains a healthy capital ratio in order to comply with its financial loan covenants and support its business operations.
The Company manages and makes adjustment to its capital structure as it deems necessary. To maintain or adjust its capital structure, the Company may increase the levels of capital contributions from its creditors and owners/shareholders through debt and new shares issuance, respectively. No significant changes have been made in the objectives, policies and processes of the Company from the previous years.
The Company monitors capital using the debt ratio, which is long-term liabilities divided by long-term liabilities plus equity. The Company’s policy is to keep the debt ratio at not more than 70:30. The Company’s long-term liabilities include both the current and long-term portions of long-term debts. Equity includes all items presented in the equity section of the consolidated statement of financial position. The table below shows the total capital considered by the Company and its debt ratio as of December 31, 2012 and 2011.
2012 2011 Long-term liabilities P=49,049,871,866 P=51,489,571,455 Equity 35,433,854,888 29,646,601,493 Total P=84,483,726,754 P=81,136,172,948
Debt ratio 58.1% 63.5% As of December 31, 2012 and 2011, the Company is able to meet its capital management objectives.
34. Commitments and Contingencies
Stored Energy In 1996 and 1997, the Parent Company entered into Addendum Agreements to the PPA related to the Unified Leyte power plants where any excess generation above the nominated energy or take-or-pay volume will be credited against payments made by NPC for the periods it was not able to take electricity (see Note 38). As of December 31, 2012 and 2011, the commitments for stored energy is equivalent to 4,326.6 GWH.
Lease Commitments Future minimum lease payments under the operating leases as of December 31, 2012 and 2011 are as follows:
2012 2011 Within one year P=86.5 million P=78.4 million After one year but not more than five years 271.1 million 320.9 million After five years – 1.5million Total P=357.6 million P=400.8 million

- 88 -
*SGVMG300344*
The Parent Company’s lease commitments pertain to the drilling rigs and various office space and warehouse rentals.
On October 1, 2010, the lease contract for the use of the new office buildings at Ortigas Center was entered into between the Company and Amberland Corporation with the rental rate of P=6.05 million per month, inclusive of VAT, subject to a five percent yearly increase beginning July 13, 2013. The lease covers the use of office space from 36th to 42nd floors of the One Corporate Centre Office Condominium with a total area of 11,598.2 sq.m and 176 parking spaces located at the basement level of the Building. This contract commenced on December 1, 2011 and will expire on December 1, 2016, subject to pre-termination in case of violation by either party of the terms of the lease and renewal upon mutual agreement by both parties.
The lease contract for the use of the office buildings at Fort Bonifacio was entered into between the Parent Company and PNOC with the rental rate of P=4.18 million per month, inclusive of VAT. The lease contract covers the use of office space of Building 2, Building 3, Building 4A, Building 4B, Computer Center, Laboratory, Wellness Center/PEGEA Office, and Motorpool/Storage, with a total area of 11,824.24 sq.m. This contract commenced on June 1, 2009 and was set to expire on November 30, 2011. The lease contract covering the Laboratory is extended up to April 30, 2013.
Other lease contracts pertain to various office space and warehouse being rented by steam/electricity projects in Leyte, Northern Negros, Bacman, Southern Negros and Mindanao.
Purchase Commitments Total purchase commitments for capital items as of December 31, 2012 and 2011 amounted to P=156.9 million and P=233.4 million, respectively, of which, contractual commitments for the acquisitions of property, plant and equipment amounted to P=60.5 million and P=218.8 million as December 31, 2012 and 2011, respectively. These are expected to be settled in the next financial year.
Legal Claims The Company is contingently liable for lawsuits or claims filed by third parties, including labor related cases, which are pending decision by the courts, the outcomes of which are not presently determinable. In the opinion of management and its legal counsel, the eventual total liability from these lawsuits or claims, if any, will not have a material effect on the consolidated financial statements (see Notes 3 and 20).
35. Wind Energy Service Contracts
On September 14, 2009, the Parent Company entered into Wind Energy Service Contract (WESC) 2009-09-004 with the DOE granting the Parent Company the right to explore and develop the Burgos Wind Project for a period of 25 years from the effective date. The pre-development stage under the WESC shall be two years extendible for another year if the Parent Company has not been in default in its exploration or work commitments and has provided a work program for the extension period upon confirmation by the DOE. Within the pre-development stage, the Parent Company shall undertake exploration, assessment and other studies of wind resources in the contract area. Upon declaration of commerciality, as confirmed by the DOE, the WESC shall remain in force for the balance of the 25-year period for the development/commercial stage.

- 89 -
*SGVMG300344*
The DOE shall approve the extension of the WESC for another 25 years under the same terms and conditions, provided the Company is not in default of any material obligations under the contract and has submitted a written notice to the DOE for the extension of the contract not later than one year prior to the expiration of the original 25-year period. Further, the WESC provide that all materials, equipment, plant and other installations erected or placed on the contract area by the Parent Company shall remain the property of the Parent Company throughout the term of the contract and after its termination.
In 2010, the Parent Company has entered into five WESCs with the DOE for the following contract areas: 1. Pagudpud Wind Project,
Under DOE Certificate of Registration No. WESC 2010-02-040 (expiring in 2035) 2. Camiguin Wind Project,
Under DOE Certificate of Registration No. WESC 2010-02-041 (expiring in 2035) 3. Taytay Wind Project,
Under DOE Certificate of Registration No. WESC 2010-02-042 (expiring in 2035) 4. Dinagat Wind Project,
Under DOE Certificate of Registration No. WESC 2010-02-043 (expiring in 2035)
5. Siargao Wind Project, Under DOE Certificate of Registration No. WESC 2010-02-044 (expiring in 2035)
On May 26, 2010, the BOD of EDC approved the assignment and transfer to EBWPC of all the contracts, assets, permits and licenses relating to the establishment and operation of the Burgos Wind Power Project under DOE Certificate of Registration No. WESC 2009-09-004. As of December 31, 2012, the filing for the declaration of commerciality of the Burgos Wind Power Project is still under review by the DOE. On December 19, 2011, the Parent Company has submitted a letter of surrender for the Taytay, Dinagat and Siargao contract areas and thus, will not pursue these project areas further. Per Section 4.2 of the WESC, the surrender will take effect 30 days upon the RE Developer’s submission of a written notice to the DOE.
36. Geothermal Service Concession Contracts Geothermal Service Contracts Under P.D. 1442, all geothermal resources in public and/or private lands in the Philippines, whether found in, on or under the surface of dry lands, creeks, rivers, lakes, or other submerged lands within the waters of the Philippines, belong to the State, inalienable and imprescriptible, and their exploration, development and exploitation. Furthermore, the Government may enter into service contracts for the exploration, development and exploitation of geothermal resources.
Pursuant to P.D. 1442, the Parent Company had entered into the following Geothermal Service Contracts (GSCs) with the Government of the Republic of the Philippines (represented by the DOE) for the exploration, development and production of geothermal fluid for commercial utilization:
a. Tongonan, Leyte, dated May 14, 1981 b. Southern Negros, dated October 16, 1981 c. Bac-Man, Sorsogon, dated October 16, 1981 d. Mt. Apo, Kidapawan, Cotabato, dated March 24, 1992

- 90 -
*SGVMG300344*
e. Mt. Labo, Camarines Norte and Sur, dated March 19, 1994 f. Northern Negros, dated March 24, 1994 g. Mt. Cabalian, Southern Leyte, dated January 13, 1997
The exploration period under the service contracts shall be five years from the effective date, renewable for another two years if the Parent Company has not been in default in its exploration, financial and other work commitments and obligations and has provided a work program for the extension period acceptable to the Government. Where geothermal resource in commercial quantity is discovered during the exploration period, the service contracts shall remain in force for the remainder of the exploration period or any extension thereof and for an additional period of 25 years thereafter, provided that, if the Parent Company has not been in default in its obligations under the contracts, the Government may grant an additional extension of 15 to 20 years. Under P.D. 1442, the right granted by the Government to the Company to explore, develop, and utilize the country’s geothermal resource is subject to sharing of net proceeds with the Government. The net proceeds is what remains after deducting from the gross proceeds the allowable recoverable costs, which include development, production and operating costs.
The allowable recoverable costs shall not exceed 90% of the gross proceeds. The Parent Company pays 60% of the net proceeds as Government share and retains the remaining 40%. The 60% government share is comprised of royalty fees and income taxes. The royalty fees are shared by the Government through DOE (60%) and the LGU (40%).
Geothermal Renewable Energy Service Contracts and Geothermal Operating Contracts R.A. 9513, otherwise known as the Renewable Energy Act of 2008 (RE Law) and which became effective in January 2009, mandates the conversion of existing GSCs under P.D. 1442 into Geothermal Renewable Energy Service Contracts (GRESCs) so companies may avail of the incentives under the RE Law. Aside from the tax incentives, the significant terms of the service concessions under the GRESCs are similar to the GSCs except that the Parent Company has control over any significant residual interest over the steam fields, power plants and related facilities throughout the concession period and even after the concession period.
On September 10, 2009, the Parent Company was granted the Provisional Certificate of Registration as an RE Developer for the following existing projects: (1) GSC No. 01 - Tongonan, Leyte, (2) GSC No. 02 - Palinpinon, Negros Oriental, (3) GSC No. 03 - Bacon-Manito, Sorsogon/Albay, (4) GSC No. 04 - Mt. Apo, North Cotabato, and (5) GSC No. 06 - Northern Negros. With the receipt of the certificates of provisional registration as geothermal RE Developer, the fiscal incentives of the RE Law were availed of by the Parent Company retroactive from the effective date of such law on January 30, 2009. Fiscal incentives include, among others, change in the applicable corporate tax rate from 30% to 10% for RE-registered activities.
On October 23, 2009, the Parent Company received from DOE the Certificate of Registration as an RE Developer for the following geothermal projects: a. Tongonan Geothermal Project, Under DOE Certificate of Registration No.
GRESC 2009-10-001 b. Southern Negros Geothermal Project, Under DOE Certificate of Registration No.
GRESC 2009-10-002 c. Bacon-Manito Geothermal Project, Under DOE Certificate of Registration No.
GRESC 2009-10-003

- 91 -
*SGVMG300344*
d. Mt. Apo Geothermal Project, Under DOE Certificate of Registration No. GRESC 2009-10-004
e. Northern Negros Geothermal Project, Under DOE Certificate of Registration No. GRESC 2009-10-005
On February 19, 2010, the Parent Company’s GSC in Mt. Labo in Camarines Norte and Sur was converted to GRESC 2010-02-020.
On March 24, 2010, the DOE issued to the Parent Company a new GRESC of Mainit Geothermal Project under DOE Certificate of Registration No. GRESC 2010-03-021.
The remaining service contract of the Parent Company covered by P.D. 1442 as of December 31, 2012 is the Mt. Cabalian in Southern Leyte with a term of 25 years from the effective date of the contract on January 31, 1997 and for an additional period of 25 years if the Parent Company has not been in default in its obligations under the GSC. The Company also holds geothermal resource service contracts for the following prospect areas: (i) Ampiro Geothermal Project (with a five-year pre-development period expiring in 2017, 25-
year contract period expiring in 2037) (ii) Mandalagan Geothermal Project (with a five-year pre-development period expiring in 2017,
25-year contract period expiring in 2037) (iii) Mt. Zion Geothermal Project (with a five-year pre-development period expiring in 2017, 25-
year contract period expiring in 2037) (iv) Lakewood Geothermal Project (with a five-year pre-development period expiring in 2017, 25-
year contract period expiring in 2037) (v) Balingasag Geothermal Project (with a five-year pre-development period expiring in 2017, 25-
year contract period expiring in 2037) Under the GRESCs, the Parent Company pays the Government royalty fee equivalent to 1.5% of the gross income from the sale of geothermal steam produced and such other income incidental to and arising from generation, transmission, and sale of electric power generated from geothermal energy within the contract areas (see Note 18). Under the GRESCs, gross income derived from business is an amount equal to gross sales less sales returns, discounts and allowances, and cost of goods sold. Cost of goods sold includes all business expenses directly incurred to produce the steam used to generate power under a GRESC. The RE Law also provides that the exclusive right to operate geothermal power plants shall be granted through a Renewable Energy Operating Contract with the Government through the DOE. Accordingly, on May 8, 2012, the Company, through its subsidiaries Green Core Geothermal Inc. and Bac-Man Geothermal Inc. secured three Geothermal Operating Contracts (GOCs) covering the following power plant operations:
(i) Tongonan Geothermal Power Plant under DOE Certificate of Registration No. GOC 2012-04-
038 (with a twenty-five (25) year contract period expiring in 2037, renewable for another twenty-five (25) years)
(ii) Palinpinon Geothermal Power Plant under DOE Certificate of Registration No. GOC 2012-04-037 (with a twenty-five (25) year contract period expiring in 2037, renewable for another twenty-five (25) years)
(iii) Bacon-Manito Geothermal Power Plant under DOE Certificate of Registration No. GOC No. 2012-04-039 (with a twenty-five (25) year contract period expiring in 2037, renewable for another twenty-five (25) years)

- 92 -
*SGVMG300344*
The Government share, presented as “Royalty fees” under the “Costs of electricity and steam” account, for both the GRESCs and GOCs are allocated between the DOE (60%) and the LGUs (40%) within the applicable contract area.
Total outstanding royalty fees due to DOE and LGUs, and the related expense are shown in Notes 18 and 23, respectively.
37. Steam Sales Agreements
Prior to the acquisition of BGI of the BMGPP on May 2010, the Parent Company supplied and sold steam to NPC under the SSA. Details follow:
a. Bacon-Manito-I The SSA for the Bac-Man geothermal resources entered in November 1988 provides, among others, that NPC shall pay the Parent Company a base price per kilowatt-hour of gross generation, subject to inflation adjustments and based on a guaranteed take-or-pay rate at 75% plant factor. The SSA is for a period of 25 years, which commenced in May 1993.
b. Bacon-Manito-II Bac-Man II’s SSA with NPC was signed in June 1996 for its two 20-MW capacity modular plants - Cawayan and Botong. The terms and conditions under the contract contain, among others, NPC’s commitment to pay the Parent Company a base price per kilowatt-hour of gross generation, subject to inflation adjustments and based on a guaranteed take-or-pay rate, commencing from the established commercial operation period, using the following plant factors: 50% for the first year, 65% for the second year and 75% for the third and subsequent years. The SSA is for a period of 25 years, which commenced in March 1994 for Cawayan and December 1997 for Botong.
In 2010, EDC secured a temporary waiver of billings and collections from PSALM effective until (a) the execution of the deed of assignment of SSA from NPC/PSALM to BGI; or (b) such time that the Bac-Man power plants resumes operations (see Note 5).
The Company’s revenue from SSAs in 2010 amounted to P=1,208.70 million.
38. Power Purchase Agreements
The Parent Company sells electricity to NPC pursuant to the following PPAs:
588.4 MW Unified Leyte The PPA provides, among others, that NPC shall pay the Parent Company a base price per kilowatt-hour of electricity delivered subject to inflation adjustments. The PPA stipulates a contracted annual energy of 1,370 gigawatt-hours (GWH) for Leyte-Cebu and 3,000 GWH for Leyte-Luzon throughout the cooperation period. It also stipulates a nominated energy of not lower than 90% of the contracted annual energy.
52.0 MW Mindanao I The PPA provides, among others, that NPC shall pay the Parent Company a base price per kilowatt-hour of electricity delivered subject to inflation adjustments. The PPA stipulates a minimum offtake energy of 330 GWH for the first year and 390 GWH per year for the succeeding years. The contract is for a period of 25 years, which commenced in March 1997.

- 93 -
*SGVMG300344*
54.0 MW Mindanao II The PPA provides, among others, that NPC shall pay the Parent Company a base price per kilowatt-hour of electricity delivered subject to inflation adjustments. The PPA stipulates a minimum energy offtake of 398 GWH per year. The contract is for a period of 25 years, which commenced in June 1999. Revenue from sale of electricity covered by PPAs amounted to P=13,051.52 million, P=13,621.66 million and P=13,715.33 million for the years ended December 31, 2012, 2011 and 2010, respectively.
39. Electricity Sales Agreement
In October 2006, the Parent Company entered into an Electricity Sales Agreement (ESA) with Iloilo I Electric Cooperative, Inc. (ILECO I). Under the agreement, which has a five-year term, the Parent Company agreed to sell specified amount of electric energy or contract energy to ILECO I each year from its NNGP Plant. As the purchaser of electric energy, ILECO I agreed to pay for the energy supplied by the Parent Company. ILECO I is required to pay the Parent Company, calculated on a monthly basis, either the contract energy per month or the actual energy metered and delivered to ILECO I, whichever is higher, multiplied by the electricity price. In August 2011, the Parent Company assigned its ESA to GCGI. On July 25, 2012, the ESA with ILECO I expired. Revenue from sale of electricity covered by ESA amounted to P=289.34 million, P=470.0 million and P=533.96 million for the years ended December 31, 2012, 2011 and 2010, respectively.
40. GCGI’s Power Supply Contracts/Power Supply Agreements
With GCGI’s takeover of the Palinpinon and Tongonan power plants effective October 23, 2009, Schedule X of the APA with PSALM provides for the assignment to GCGI of 12 NPC’s PSCs. As of December 31, 2012, the following PSCs remained effective:
Customers Contract Expiration Dynasty Management & Development Corp. (DMDC) March 25, 2016 Philippine Foremost Milling Corp. (PFMC) March 25, 2016
Since the Company’s takeover of the power plants, 23 new PSAs have been signed as follows:
Customers Contract Start Contract Expiration Leyte
Don Orestes Romualdez Electric Cooperative, Inc. (DORELCO)* December 26, 2010 December 25, 2020 Leyte II Electric Cooperative, Inc. (LEYECO II)* December 26, 2010 December 25, 2020 LEYECO II* December 26, 2011 December 25, 2021 Leyte III Electric Cooperative, Inc. (LEYECO III)* December 26, 2011 December 25, 2021 Leyte IV Electric Cooperative, Inc. (LEYECO IV) December 26, 2012 December 25, 2017 Leyte V Electric Cooperative, Inc. (LEYECO V)* December 26, 2010 December 25, 2020 Philippine Associated Smelting and Refining Corp. (PASAR) Philippine Phosphate Fertilizer Corporation (PHILPHOS)
October 24, 2009 December 26, 2011
December 25, 2015 December 25, 2016
(Forward)

- 94 -
*SGVMG300344*
Customers Contract Start Contract Expiration
Cebu Visayan Electric Company, Inc. (VECO)* December 26, 2010 December 25, 2015 VECO* December 26, 2011 December 25, 2016 Balamban Enerzone Corporation (BEZ) December 26, 2010 December 25, 2015
Negros Central Negros Electric Cooperative, Inc. (CENECO)* December 26, 2011 December 25, 2021 Negros Occidental Electric Cooperative, Inc. (NOCECO)* December 26, 2010 December 25, 2020 Negros Oriental I Electric Cooperative, Inc. (NORECO I)* December 26, 2010 December 25, 2020
(Forward) Negros Oriental II Electric Cooperative, Inc. (NORECO II)* December 26, 2010 December 25, 2020 V.M.C. Rural Electric Service Cooperative, Inc. (VRESCO)* December 26, 2010 December 25, 2020 Dumaguete Coconut Mills, Inc. (DUCOM) October 26, 2010 October 25, 2020
Panay Aklan Electric Cooperative, Inc. (AKELCO)* March 26, 2010 December 25, 2020 Capiz Electric Cooperative, Inc. (CAPELCO)* January 27, 2010 December 25, 2020 Iloilo I Electric Cooperative, Inc. (ILECO I)* March 26, 2010 December 25, 2022 Iloilo II Electric Cooperative, Inc. (ILECO II)* December 26, 2010 December 25, 2020 Iloilo III Electric Cooperative, Inc. (ILECO III) December 26, 2012 December 25, 2022 Guimaras Electric Cooperative, Inc. (GUIMELCO) December 26, 2012 December 25, 2022
*With Provisional Authority from the Energy Regulatory Commission (ERC).
Coordination with ERC is ongoing to secure the Final Authority for the filed applications for the approval of the PSAs with distribution-utility customers. Preparations are ongoing for the filing with the ERC of the applications for the approval of the PSAs with LEYECO IV, ILECO III and GUIMELCO. On December 13, 2012, the PSA between the Company and PASAR was assigned to BGI effective December 26, 2012. Revenue from sale of electricity under the PSCs and PSAs amounted to P=9,429.54 million, P=7,428.96 million and P=6,798.7 million in 2012, 2011 and 2010, respectively. Under Section 30 of the Electric Power Industry Reform Act of 2011, the ERC may authorize other similar entities to become eligible members, either directly or indirectly, of the Wholesale Electricity Spot Market (WESM). All generating companies, distribution utilities, suppliers, bulk consumers/end-users and other similar entities authorized by the ERC, whether direct or indirect members of the WESM, shall be bound by the WESM spot market rules with respect to transactions in the market. GCGI as a direct WESM member sells/buys in the WESM directly. Total revenue recognized by GCGI from sale of electricity to WESM amounted to P=843.21 million, P=591.62 million and nil in 2012, 2011 and 2010, respectively
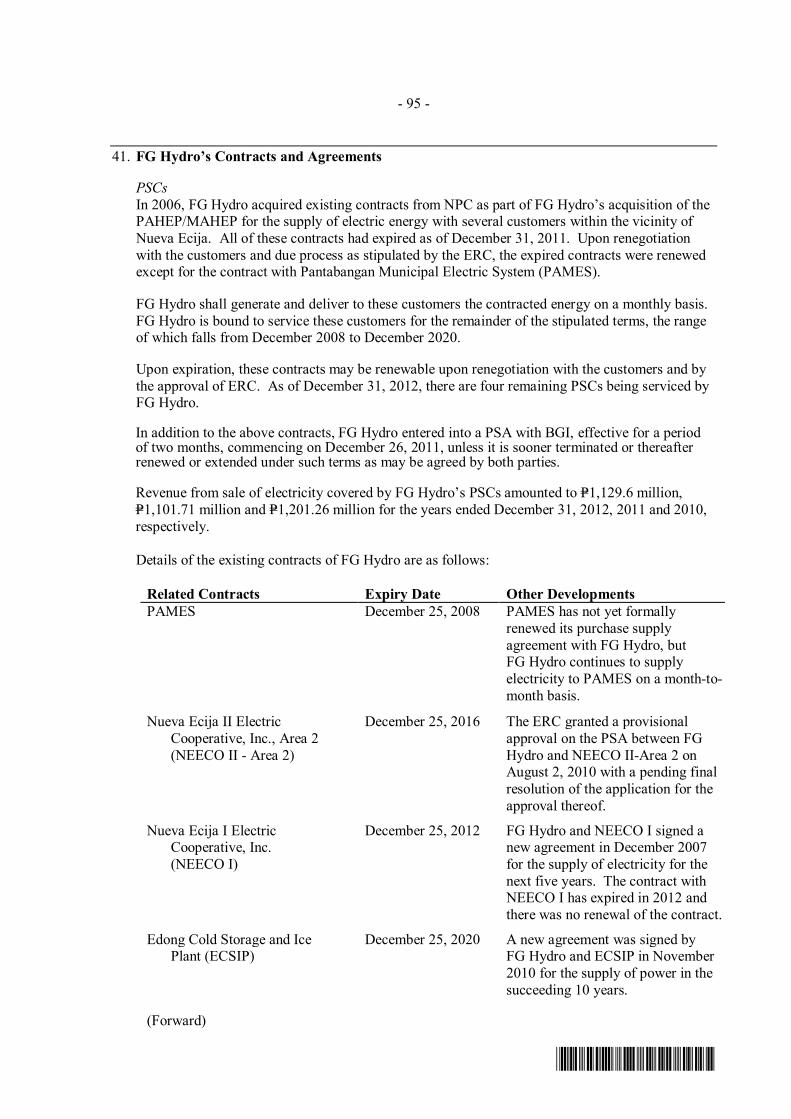
- 95 -
*SGVMG300344*
41. FG Hydro’s Contracts and Agreements PSCs In 2006, FG Hydro acquired existing contracts from NPC as part of FG Hydro’s acquisition of the PAHEP/MAHEP for the supply of electric energy with several customers within the vicinity of Nueva Ecija. All of these contracts had expired as of December 31, 2011. Upon renegotiation with the customers and due process as stipulated by the ERC, the expired contracts were renewed except for the contract with Pantabangan Municipal Electric System (PAMES). FG Hydro shall generate and deliver to these customers the contracted energy on a monthly basis. FG Hydro is bound to service these customers for the remainder of the stipulated terms, the range of which falls from December 2008 to December 2020. Upon expiration, these contracts may be renewable upon renegotiation with the customers and by the approval of ERC. As of December 31, 2012, there are four remaining PSCs being serviced by FG Hydro. In addition to the above contracts, FG Hydro entered into a PSA with BGI, effective for a period of two months, commencing on December 26, 2011, unless it is sooner terminated or thereafter renewed or extended under such terms as may be agreed by both parties. Revenue from sale of electricity covered by FG Hydro’s PSCs amounted to P=1,129.6 million, P=1,101.71 million and P=1,201.26 million for the years ended December 31, 2012, 2011 and 2010, respectively.
Details of the existing contracts of FG Hydro are as follows:
Related Contracts Expiry Date Other Developments PAMES December 25, 2008 PAMES has not yet formally
renewed its purchase supply agreement with FG Hydro, but FG Hydro continues to supply electricity to PAMES on a month-to-month basis.
Nueva Ecija II Electric Cooperative, Inc., Area 2 (NEECO II - Area 2)
December 25, 2016 The ERC granted a provisional approval on the PSA between FG Hydro and NEECO II-Area 2 on August 2, 2010 with a pending final resolution of the application for the approval thereof.
Nueva Ecija I Electric Cooperative, Inc. (NEECO I)
December 25, 2012 FG Hydro and NEECO I signed a new agreement in December 2007 for the supply of electricity for the next five years. The contract with NEECO I has expired in 2012 and there was no renewal of the contract.
Edong Cold Storage and Ice Plant (ECSIP)
December 25, 2020 A new agreement was signed by FG Hydro and ECSIP in November 2010 for the supply of power in the succeeding 10 years.
(Forward)

- 96 -
*SGVMG300344*
Related Contracts Expiry Date Other Developments
NIA-Upper Pampanga River Integrated Irrigation System (UPRIIS)
October 25, 2020 FG Hydro and NIA-UPRIIS signed a new agreement in October 2010 for the supply of power in the succeeding 10 years.
Operation and Maintenance Agreement (O&M Agreement) In 2006, FG Hydro entered into an O&M Agreement with NIA, with the conformity of the NPC. Under the O&M Agreement, NIA will manage, operate, maintain and rehabilitate the Non-Power Components of the PAHEP/MAHEP in consideration for a service fee based on actual cubic meter of water used by FG Hydro for power generation.
In addition, FG Hydro will provide for a trust fund amounting to P=100.0 million within the first two years of the O&M Agreement. The amortization for the Trust Fund is payable in 24 monthly payments starting November 2006 and is billed by NIA in addition to the monthly service fee. The Trust Fund has been fully funded as of October 2008.
The O&M Agreement is effective for a period of 25 years commencing on November 18, 2006 and renewable for another 25 years under the terms and conditions as may be mutually agreed upon by both parties.
Memorandum of Agreement (MOA) PSALM entered into a MOA with the Protected Area Management Board (PAMB). Under the MOA, PAMB granted FG Hydro the right to use the Masiway land, where the MAHEP power plant is situated in consideration for an annual user’s fee. The MOA will be effective for 25 years and renewable for a similar period subject to terms and conditions as may be mutually agreed upon by both parties.
FG Hydro incurred annual user’s fee amounting to P=0.1 million in 2012, 2011 and 2010. The user’s fee is included under “General and administrative expenses” account in the consolidated statements of income, specifically “Rental, insurance and taxes” account (see Note 24).
PRUP Contract On January 24, 2008, FG Hydro signed the Letter of Acceptance (LOA) for the PRUP with VA TECH HYDRO GmbH, now known as Andritz Hydro GmbH (Contractor), an Austrian company.
The contract provides that the Contractor will undertake the engineering, procurement, installation, testing and commissioning of the PRUP. The technical scope of the PRUP agreed upon by FG Hydro and the Contractor includes the following:
i. Refurbishment and upgrade of Pantabangan main and auxiliary plant which includes:
• Turbine and wicket gate replacement; headcover modification • Draft tube repair and modification • Generator rewind and refurbishment • Replacement of key auxiliary systems
ii. Power increase from 50 MW to 59.4 MW per unit

- 97 -
*SGVMG300344*
The total updated contract price of the PRUP amounts to €31.4 million (US$46.3 million), including the Contract Options (CO) that will be exercised by FG Hydro. The contract provides that payments to the Contractor are made in accordance with the Milestone Schedule as provided in the Contract. FG Hydro has the option to make any payments to the Contractor in US$, at an exchange rate fixed by reference to the European Central Bank fixing rate for converting Euro to US$ as at the date of the LOA, plus a premium of US$0.0028 per Euro. Similarly, with respect to the CO’s, FG Hydro also has the option to make any payments to the Contractor in US$, at an exchange rate fixed by reference to the European Central Bank fixing rate for converting Euro to US$ as at the date of the relevant option notice, plus a premium of US$0.0028 per Euro.
Commissioning of the first unit commenced in December 2009 and was successfully completed in early 2010. Consequently, the final taking over of the refurbished and upgraded plant and equipment was achieved on January 29, 2010. The power generation capacity of the upgraded and refurbished unit was increased by 10 MW.
Commissioning of the second unit commenced in November 2010 and was successfully completed on December 8, 2010. Contract options and variations and closure of punchlist items, however, were completed in early 2011. The completion of the refurbishment of the second unit increased power generation capacity by another 10 MW bringing total plant capacity to 132 MW.
Ancillary Services Procurement Agreement (ASPA) FG Hydro entered into an agreement with the NGCP on February 23, 2011 after being certified and accredited by NGCP as capable of providing Contingency Reserve Service, Dispatchable Reserve Service, Reactive Power Support Service and Black Start Service. Under the agreement, FG Hydro shall provide any of the stated Ancillary Services to NGCP. Total revenue from ancillary services with NGCP amounted toP=2,361.3 million in 2012 and P=1,106.17 million in 2011. The ASPA is effective for a period of three years commencing on February 23, 2011 and shall be automatically renewed for another three (3) years after the end of the original term subject to certain conditions as provided in the ASPA.
Memorandum of Agreement with NGCP (MOA with NGCP) In 2011, FG Hydro entered into a MOA with NGCP for the performance of services on the operation of the PAHEP 230 kV switchyard and its related appurtenances (Switchyard). NGCP shall pay FG Hydro a monthly fixed operating cost of P=0.1 million and monthly variable charges representing energy consumed at the Switchyard. The MOA is effective for a period of five years and renewable for another three years under such terms as maybe agreed by both parties.
WESM Transactions FG Hydro as a direct WESM member sells/buys in the WESM. Total revenue from the sale of electricity amounted to P=918.31 million, P=183.14 million and P=938.28 million in 2012, 2011 and 2010, respectively.

- 98 -
*SGVMG300344*
42. Event After the Financial Reporting Date
On February 20, 2013, EDC declared cash dividends amounting to P=1.5 billion to its common shareholders and P=7.5 million to its preferred shareholders of record as of March 11, 2013 payable on or before April 8, 2013.


Exhibit 2
ENERGY DEVELOPMENT CORPORATION AND SUBSIDIARIES
INDEX TO SUPPLEMENTARY SCHEDULESForm 17-A, Item 7
Supplementary Schedules
A. Financial Assets
B. Amounts Receivable from Directors, Officers, Employees, and Principal Stockholders (Other than Related Parties)
C. Amounts Receivable from Related Parties which are Eliminatedduring the Consolidation of Financial Statements
D. Intangible Assets - Other Assets
E. Long-Term Debt
F. Indebtedness to Related Parties*
G. Guarantees of Securities of Other Issuers*
H. Capital Stock
I. Reconciliation of Retained Earnings for Dividend Declaration**
J. Financial Soundness Indicator**
* Not Applicable ** Addendum

ENERGY DEVELOPMENT CORPORATION AND SUBSIDIARIES
SCHEDULE A - FINANCIAL ASSETS
As of December 31, 2012
FINANCIAL ASSETS Name of Issuing Entity & association of each useAmount shown in the
balance sheet
Income received and
accrued
Loans and receivables:
Cash and cash equivalents N/A 11,420,144,203 316,394,473
Trade receivables N/A 3,917,587,128 693,922
Non-trade receivables N/A 68,133,713 -
Advances to employees N/A 62,787,120 -
Loans and notes receivables N/A 59,983,898 -
Employee receivables N/A 12,209,689 42,961
Long-term receivables N/A 12,228,071
AFS investments:
Debt investments ING Bank 605,969,837 43,111,994
Equity Investments First Gen 120,847,647
Debt investments RCBC Retail Treasury Bonds 60,000,000
Debt investments BDP Fixed Rate Treasury Note 25,000,000
Equity Investments Wack Wack Golf & Country Club Share 17,500,000 -
Equity Investments Alabang Country Club Share 4,050,000 -
Equity Investments Sta. Elena Golf Club Share 3,000,000 -
Equity Investments Baguio Country Club Share 800,000 -
Equity Investments Phil. Long Distance Telephone Company 664,040 -
Equity Investments Canlubang Golf & Country Club Share 510,000 -
Equity Investments Manila Southwoods Golf & Country Club Share 370,000 -
Equity Investments Orchard Golf & Country Club Share 210,000 -
Equity Investments Petron Corp. 184,368 -
Equity Investments Metropolitan Club Share 150,000 -
Equity Investments Club Filipino Share 140,000 -
Equity Investments Capitol Hills Golf & Country Club Share 75,000 -
Derivative Assets N/A 248,760
TOTAL 16,392,793,474 360,243,350

ENERGY DEVELOPMENT CORPORATION
SCHEDULE B - AMOUNTS RECEIVABLE FROM DIRECTORS, OFFICERS, EMPLOYEES AND PRINCIPAL STOCKHOLDERS (OTHER THAN RELATED PARTIES)
As of December 31, 2012
Name and
Designation of
Debtor
Balance at Beginning of
Period Additions
Amounts
Collected
Accounts
Written-off Current Not Current
Balance at
End of Period
Employees 79,280,477 88,738,963 95,825,853 - 67,083,973 5,109,614 72,193,587
Directors
TOTAL 79,280,477 88,738,963 95,825,853 - 67,083,973 5,109,614 72,193,587
Note: The Company keeps the information on the name & designation of employees and other details confidential. As per written agreement
with the concerned employees, any outstanding balance at the time of retirement shall be deducted from the retirement benefit proceeds.

ENERGY DEVELOPMENT CORPORATION
SCHEDULE C - Amounts Receivable from Related Parties which are Eliminated during the Consolidation of Financial Statements
As of December 31, 2012
Name of Subsidiary Balance at January 1,
2012 Additions Amounts Collected Reclassification
Amounts
Written-offCurrent Non- Current Amount Eliminated
EDC Drillco Corporation 76,601 78,198 154,799 154,799
EDC Geothermal Corp. 4,581,845 88,560 4,670,406 4,670,406
Green Core Geothermal Inc. 3,144,829 1,822,113,411 (1,751,258,835) 73,999,405 73,999,405
Bac-Man Geothermal Inc. 281,437,168 1,479,809,224 (412,500,000) 1,348,746,392 1,348,746,392
EDC Wind Energy Holdings Inc. 176,096 81,272 257,368 257,368
EDC Burgos Wind Power Corporation 137,997,792 200,673,176 338,670,969 338,670,969
EDC Pagudpud Wind Power Corporation - 17,143 17,143 17,143
First Gen Hyrdro Corporation (0) 2,500,954 (1,614,249) 886,704 886,704
Unified Leyte Geothermal Energy Inc. 47,384 18,729 66,113 66,113
Southern Negros Geothermal, Inc. - 1,335 1,335 1,335
EDC Mindanao Geothermal Inc. 6,194 1,335 7,528 7,528
Bac-Man Energy Development Corporation - 1,335 1,335 1,335
Kayabon Geothermal, Inc. - 1,335 1,335 1,335
Energy Development (EDC) Corporation Chile Limitada 6,677,466 143,390,848 150,068,314 150,068,314
EDC Holdings International Limited 6 83,920 83,926 83,926
Energy Development Corporation Hong Kong Limited - 42,870 42,870 42,870
EDC Chile Holdings SPA 184,680 184,680 184,680
EDC Geotermica Chile SPA - 16,705,984 16,705,984 16,705,984
EDC Peru Holdings S.A.C. - 41,481,025 41,481,025 41,481,025
EDC Geotermica Peru S.A.C. - 7,150,799 7,150,799 7,150,799
Energy Development Corporation - - -
TOTAL 434,145,382 3,714,426,131 (2,165,373,084) - - 1,983,198,428 - 1,983,198,428
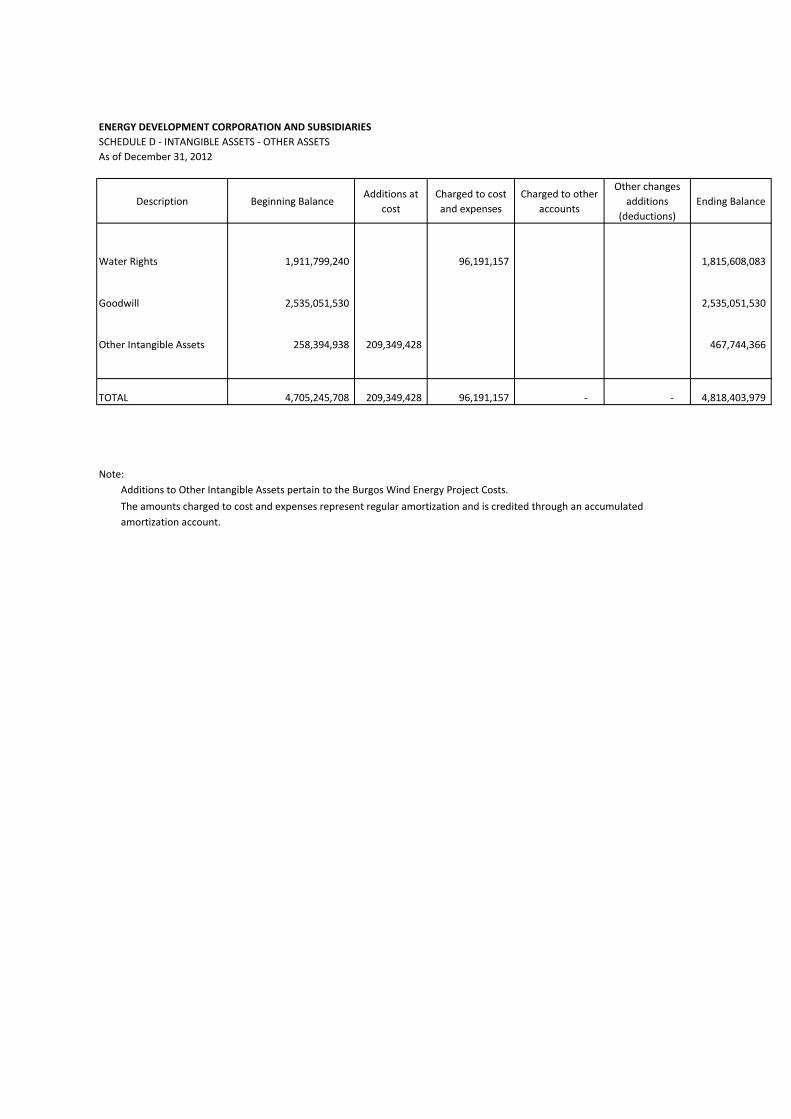
ENERGY DEVELOPMENT CORPORATION AND SUBSIDIARIES
SCHEDULE D - INTANGIBLE ASSETS - OTHER ASSETS
As of December 31, 2012
Description Beginning Balance Additions at
cost
Charged to cost
and expenses
Charged to other
accounts
Other changes
additions
(deductions)
Ending Balance
Water Rights 1,911,799,240 96,191,157 1,815,608,083
Goodwill 2,535,051,530 2,535,051,530
Other Intangible Assets 258,394,938 209,349,428 467,744,366
TOTAL 4,705,245,708 209,349,428 96,191,157 - - 4,818,403,979
Note:
Additions to Other Intangible Assets pertain to the Burgos Wind Energy Project Costs.
The amounts charged to cost and expenses represent regular amortization and is credited through an accumulated
amortization account.

ENERGY DEVELOPMENT CORPORATION AND SUBSIDIARIES
SCHEDULE E - LONG-TERM DEBT
(In PhP) (In PhP) (In PhP) (In PhP) (Approx in PhP) Periodic
Payments
Foreign Loans:
USD 175M Club Loan Facility $ 175,000,000 8,114,750,000 $ 172,837,027 7,094,959,969 $ 34,378,595 1,411,241,337 $ 138,458,432 5,683,718,631 1.75% + LIBOR $ 175,000,000 41.05000 7,183,750,000 bullet payment June 17, 2017
USD300 Million Bonds $ 300,000,000 13,152,000,000 $ 296,890,685 12,187,362,619 $ - - $ 296,890,685 12,187,362,619 6.50% $ 300,000,000 41.05000 12,315,000,000 bullet payment January 20, 2021
-
Domestc Loans: -
PNB Peso loan P 3,500,000,000 3,500,000,000 P 2,975,000,000 2,975,000,000 P 238,000,000 238,000,000 P 2,737,000,000 2,737,000,000 1.5% + PDST-F- rate
or 1.0% + BSP
overnight rate
(ave) P 175,000,000 175,000,000 20 semi-annual
payments
November 7, 2022
Allied Bank Peso Loan P 1,500,000,000 1,500,000,000 P 1,275,000,000 1,275,000,000 P 102,000,000 102,000,000 P 1,173,000,000 1,173,000,000 1.5% + PDST-F- rate
or 1.0% + BSP
overnight rate
(ave) P 75,000,000 75,000,000 20 semi-annual
payments
November 7, 2022
FXCN - Series 2 P 4,000,000,000 4,000,000,000 P 2,944,415,806 2,944,415,806 P 27,837,609 27,837,609 P 2,916,578,198 2,916,578,198 6.61% (ave) P 200,000,000 20,000,000 20 semi-annual
payments
April 19, 2022
FXCN - Series 1 P 3,000,000,000 3,000,000,000 P 3,926,420,799 3,926,420,799 P 36,967,811 36,967,811 P 3,889,452,988 3,889,452,988 6.62% (ave) P 150,000,000 15,000,000 20 semi-annual
payments
April 19, 2022
PESO PUBLIC BOND 5.5 YEAR P 8,500,000,000 8,500,000,000 P 8,438,332,932 8,438,332,932 P - - P 8,438,332,932 8,438,332,932 8.64% P 8,500,000,000 8,500,000,000 bullet payment June 4, 2015
PESO PUBLIC BOND 7 YEAR P 3,500,000,000 3,500,000,000 P 3,467,662,982 3,467,662,982 P - - P 3,467,662,982 3,467,662,982 9.33% P 3,500,000,000 3,500,000,000 bullet payment December 4, 2016
IFC 1 P 4,100,000,000 4,100,000,000 P 3,537,463,896 3,537,463,896 P 334,285,224 334,285,224 P 3,203,178,672 3,203,178,672 7.40% (ave) P 170,833,333 170,970,000 24 semi-annual
payments
April 15, 2023
IFC 2 P 3,262,500,000 3,262,500,000 P 3,203,252,862 3,203,252,862 P 243,539,786 243,539,786 P 2,959,713,076 2,959,713,076 6.66% (ave) P 125,480,769 125,606,250 26 semi-annual
payments
October 15, 2025
TOTAL 52,629,250,000 49,049,871,866 2,393,871,767 46,656,000,099
Title of Issue and Type of ObligationAmount Authorized by Indenture
(In original currency)
Balance at December 31, 2012
(In original currency)
Amount and Number of Periodic Payments Maturity Date
(In original currency) (In original currency)
Long-Term Debt (Net of Current Portion) Interest Rate
Current Portion of Long-Term Debt
(In original currency)

ENERGY DEVELOPMENT CORPORATION AND SUBSIDIARIES
SCHEDULE F - INDEBTEDNESS TO RELATED PARTIES
As of December 31, 2012
Name of Related Parties Balance at beginning of periodBalance at end of
period
NOT APPLICABLE

ENERGY DEVELOPMENT CORPORATION AND SUBSIDIARIES
SCHEDULE G - GUARANTEES OF SECURITIES OF OTHER ISSUERS
As of December 31, 2012
Name of issuing entity of securities
guaranteed by the company for which
this statement is filed
Title of issue of each class of
securities guaranteed
Total amount
guaranteed and
outstanding
Amount owned by
person for which
statement is filed
Nature of guarantee
NOT APPLICABLE

ENERGY DEVELOPMENT CORPORATION AND SUBSIDIARIES
SCHEDULE H - CAPITAL STOCK
As of December 31, 2012
Title of IssueNumber of shares
authorized
Number of shares
issued and
outstanding
Number of shares
reserved for
options,
warrants,
conversion and
other rights
Number of shares
held by related
parties
Number of shares
held by Directors
and key executive
officers
Common 30,000,000,000 18,750,000,000 - 7,500,000,000 28,881,711
Stock (40%) 0.154%
991,782,700
(4%)
470,447,800
(2%)
Preferred 15,000,000,000 9,375,000,000 - 9,375,000,000 -
Stock (100%)
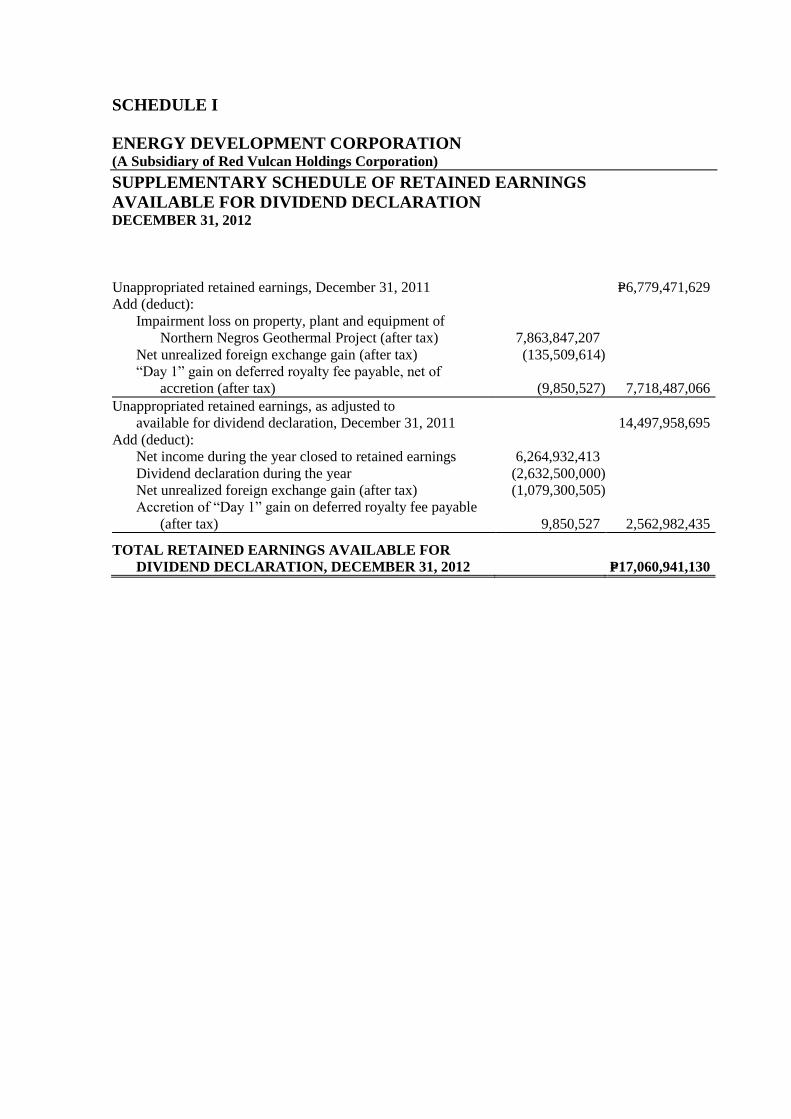
SCHEDULE I
ENERGY DEVELOPMENT CORPORATION (A Subsidiary of Red Vulcan Holdings Corporation)
SUPPLEMENTARY SCHEDULE OF RETAINED EARNINGS
AVAILABLE FOR DIVIDEND DECLARATION DECEMBER 31, 2012
Unappropriated retained earnings, December 31, 2011 P=6,779,471,629
Add (deduct):
Impairment loss on property, plant and equipment of
Northern Negros Geothermal Project (after tax)
7,863,847,207
Net unrealized foreign exchange gain (after tax) (135,509,614)
“Day 1” gain on deferred royalty fee payable, net of
accretion (after tax) (9,850,527) 7,718,487,066
Unappropriated retained earnings, as adjusted to
available for dividend declaration, December 31, 2011 14,497,958,695
Add (deduct):
Net income during the year closed to retained earnings 6,264,932,413
Dividend declaration during the year (2,632,500,000)
Net unrealized foreign exchange gain (after tax) (1,079,300,505)
Accretion of “Day 1” gain on deferred royalty fee payable
(after tax) 9,850,527 2,562,982,435
TOTAL RETAINED EARNINGS AVAILABLE FOR
DIVIDEND DECLARATION, DECEMBER 31, 2012 P=17,060,941,130

ENERGY DEVELOPMENT CORPORATION AND SUBSIDIARIES SCHEDULE J – SUPPLEMENTARY SCHEDULE OF FINANCIAL SOUNDNESS INDICATORS
Ratio December 31
2012 2011
Current 1.92:1.00 2.22:1.00
Asset-to-equity 2.66:1.00 3.04:1.00
Debt-to-equity 1.38:1.00 1.74:1.00
Solvency 0.24 0.15
Interest rate coverage 3.67:1.00 2.32:1.00
Return on assets (%) 11.3 0.7 6.0*
Return on equity (%) 31.9 2.0 16.5*
*Exclude the effect of loss on impairment of property, plant and equipment of the Northern Negros Geothermal Project amounting to P=4,998.6 million for the year ended December 31, 2011.

EDC Geothermal Corporation (EGC)
First Gen Hydro PowerCorporation (FGHPC)
EDC Wind EnergyHoldings Inc.
(EWEHI)
EDC Holdings International Limited
(EHIL)
EDC Drillco Corporation(EDC Drillco)
• Green Core Geothermal Inc. (GCGI)
• Bac-Man Geothermal Inc. (BGI)
• Unified Leyte Geothermal Energy Inc. (ULGEI)
• Southern Negros Geothermal, Inc. (SNGI)
• EDC Mindanao Geothermal Inc. (EMGI)
• Bac-Man Energy Development Corporation
(BEDC)• Kayabon Geothermal, Inc.
(KGI)
Energy Development (EDC) Corporation Chile Limitada
EDC Pagudpod Wind PowerCorporation (EPWPC)
Energy Development Corporation Hong Kong
Limited(EDC HKL)
Prime TerracottaHoldings Corporation
Red Vulcan Holdings Corporation
ID: 100%
D: 100% D: 100%D: 100%D: 100%D: 60%
ID: 100%D: 99.99%ID: 0.01%
Legend:D – Direct OwnershipID – Indirect OwnershipE – Economic InterestV – Voting Interest
E: 40%V: 60%
E: 100%V: 100%
PT EDC IndonesiaEDC Peru
Holdings S.A.C.EDC Chile
Holdings SPAPT EDC Panas Bumi
Indonesia
EDC Geotermica Chile SPA
EDC GeotermicaPeru S.A.C.
EDC Quellaapacheta
ID: 100% ID: 100%
ID: 70%
ID: 95% ID: 95% ID: 100%ID: 100%
EDC Burgos Wind PowerCorporation (EBWPC)
ID: 100%ID: 100%

Energy Development Corporation
First-time Adoption of Philippine Financial Reporting
Standards ✓
Amendments to PFRS 1 and PAS 27: Cost of an Investment
in a Subsidiary, Jointly Controlled Entity or Associate
Amendments to PFRS 1: Additional Exemptions for First-
time Adopters
Amendment to PFRS 1: Limited Exemption from
Comparative PFRS 7 Disclosures for First-time Adopters
Amendments to PFRS 1: Severe Hyperinflation and Removal
of Fixed Date for First-time Adopters
Amendments to PFRS 1: Government Loans
Share-based Payment ✓
Amendments to PFRS 2: Vesting Conditions and
Cancellations ✓
Amendments to PFRS 2: Group Cash-settled Share-based
Payment Transactions
PFRS 3 (Revised) Business Combinations ✓
Insurance Contracts
Amendments to PAS 39 and PFRS 4: Financial Guarantee
Contracts
PFRS 5 Non-current Assets Held for Sale and Discontinued
Operations ✓
PFRS 6 Exploration for and Evaluation of Mineral Resources ✓
Financial Instruments: Disclosures ✓
Amendments to PFRS 7: Transition ✓
Amendments to PAS 39 and PFRS 7: Reclassification of
Financial Assets ✓
Amendments to PAS 39 and PFRS 7: Reclassification of
Financial Assets - Effective Date and Transition ✓
Amendments to PFRS 7: Improving Disclosures about
Financial Instruments ✓
Amendments to PFRS 7: Disclosures - Transfers of Financial
Assets ✓
Amendments to PFRS 7: Disclosures – Offsetting Financial
Assets and Financial Liabilities
Amendments to PFRS 7: Mandatory Effective Date of PFRS
9 and Transition Disclosures
PFRS 8 Operating Segments ✓
Financial Instruments
Amendments to PFRS 9: Mandatory Effective Date of PFRS
9 and Transition Disclosures
PFRS 10 Consolidated Financial Statements
PFRS 11 Joint Arrangements
PFRS 12 Disclosure of Interests in Other Entities
PFRS 13 Fair Value Measurement
Presentation of Financial Statements ✓
Amendment to PAS 1: Capital Disclosures ✓
Amendments to PAS 32 and PAS 1: Puttable Financial
Instruments and Obligations Arising on Liquidation
Amendments to PAS 1: Presentation of Items of Other
Comprehensive Income
PAS 2 Inventories ✓
PAS 7 Statement of Cash Flows ✓
PAS 8 Accounting Policies, Changes in Accounting Estimates and
Errors ✓
PAS 10 Events after the Balance Sheet Date ✓
PAS 11 Construction Contracts ✓
Income Taxes ✓
Conceptual Framework Phase A: Objectives and qualitative characteristics
PFRSs Practice Statement Management Commentary
PHILIPPINE FINANCIAL REPORTING STANDARDS AND
Effective as of December 31, 2012
Adopted Not Adopted Not Applicable
Framework for the Preparation and Presentation of Financial Statements
PFRS 2
✓
PFRS 4 ✓
✓
Philippine Financial Reporting Standards
PFRS 1 (Revised)
✓
✓
✓
✓
✓
Not early adopted
Not early adopted
Not early adopted
Not early adopted
PFRS 9
PFRS 7
Not early adopted
Not early adopted
Not early adopted
Not early adopted
PAS 12
Philippine Accounting Standards
PAS 1 (Revised)
✓
EXHIBIT 4
Not early adopted

PHILIPPINE FINANCIAL REPORTING STANDARDS AND
Effective as of December 31, 2012
Adopted Not Adopted Not Applicable
Framework for the Preparation and Presentation of Financial Statements Amendment to PAS 12 - Deferred Tax: Recovery of
Underlying Assets ✓
PAS 16 Property, Plant and Equipment ✓
PAS 17 Leases ✓
PAS 18 Revenue ✓
PAS 19 Employee Benefits ✓
Amendments to PAS 19: Actuarial Gains and Losses, Group
Plans and Disclosures ✓
PAS 19 (Amended) Employee Benefits
PAS 20 Accounting for Government Grants and Disclosure of
Government Assistance
The Effects of Changes in Foreign Exchange Rates ✓
Amendment: Net Investment in a Foreign Operation ✓
PAS 23 (Revised) Borrowing Costs ✓
PAS 24 (Revised) Related Party Disclosures ✓
PAS 26 Accounting and Reporting by Retirement Benefit Plans
PAS 27 (Amended) Separate Financial Statements
PAS 28 (Amended) Investments in Associates and Joint Ventures
PAS 29 Financial Reporting in Hyperinflationary Economies
PAS 31 Interests in Joint Ventures
Financial Instruments: Disclosure and Presentation ✓
Amendments to PAS 32 and PAS 1: Puttable Financial
Instruments and Obligations Arising on Liquidation
Amendment to PAS 32: Classification of Rights Issues
Amendments to PAS 32: Offsetting Financial Assets and
Financial Liabilities
PAS 33 Earnings per Share ✓
PAS 34 Interim Financial Reporting ✓
PAS 36 Impairment of Assets ✓
PAS 37 Provisions, Contingent Liabilities and Contingent Assets
✓
PAS 38 Intangible Assets ✓
Financial Instruments: Recognition and Measurement ✓
Amendments to PAS 39: Transition and Initial Recognition
of Financial Assets and Financial Liabilities
✓
Amendments to PAS 39: Cash Flow Hedge Accounting of
Forecast Intragroup Transactions
Amendments to PAS 39: The Fair Value Option ✓
Amendments to PAS 39 and PFRS 4: Financial Guarantee
Contracts ✓
Amendments to PAS 39 and PFRS 7: Reclassification of
Financial Assets ✓
Amendments to PAS 39 and PFRS 7: Reclassification of
Financial Assets – Effective Date and Transition ✓
Amendments to Philippine Interpretation IFRIC–9 and PAS
39: Embedded Derivatives ✓
Amendment to PAS 39: Eligible Hedged Items ✓
PAS 40 Investment Property
PAS 41 Agriculture
IFRIC 1 Changes in Existing Decommissioning, Restoration and
Similar Liabilities ✓
IFRIC 2 Members' Share in Co-operative Entities and Similar
Instruments
IFRIC 4 Determining Whether an Arrangement Contains a Lease
✓
IFRIC 5 Rights to Interests arising from Decommissioning,
Restoration and Environmental Rehabilitation Funds
IFRIC 6 Liabilities arising from Participating in a Specific Market -
Waste Electrical and Electronic Equipment
IFRIC 7 Applying the Restatement Approach under PAS 29 Financial
Reporting in Hyperinflationary Economies
IFRIC 8 Scope of PFRS 2 ✓
Reassessment of Embedded Derivatives ✓
Amendments to Philippine Interpretation IFRIC–9 and PAS
39: Embedded Derivatives ✓
PAS 12
PAS 21
Not early adopted
PAS 39
✓
✓
✓
✓
PAS 32
✓
✓
Not early adopted
Not early adopted
Not early adopted
Philippine Interpretations
✓
IFRIC 9
✓
✓
✓
✓
✓
✓

PHILIPPINE FINANCIAL REPORTING STANDARDS AND
Effective as of December 31, 2012
Adopted Not Adopted Not Applicable
Framework for the Preparation and Presentation of Financial Statements IFRIC 10 Interim Financial Reporting and Impairment ✓
IFRIC 11 PFRS 2- Group and Treasury Share Transactions ✓
IFRIC 12 Service Concession Arrangements
IFRIC 13 Customer Loyalty Programmes
The Limit on a Defined Benefit Asset, Minimum Funding
Requirements and their Interaction
Amendments to Philippine Interpretations IFRIC- 14,
Prepayments of a Minimum Funding Requirement
IFRIC 16 Hedges of a Net Investment in a Foreign Operation
IFRIC 17 Distributions of Non-cash Assets to Owners
IFRIC 18 Transfers of Assets from Customers
IFRIC 19 Extinguishing Financial Liabilities with Equity Instruments
IFRIC 20 Stripping Costs in the Production Phase of a Surface Mine
SIC-7 Introduction of the Euro
SIC-10 Government Assistance - No Specific Relation to Operating
Activities
Consolidation - Special Purpose Entities
Amendment to SIC - 12: Scope of SIC 12
SIC-13 Jointly Controlled Entities - Non-Monetary Contributions by
Venturers
SIC-15 Operating Leases - Incentives
SIC-21 Income Taxes - Recovery of Revalued Non-Depreciable
Assets
SIC-25 Income Taxes - Changes in the Tax Status of an Entity or its
Shareholders
SIC-27 Evaluating the Substance of Transactions Involving the Legal
Form of a Lease
SIC-29 Service Concession Arrangements: Disclosures.
SIC-31 Revenue - Barter Transactions Involving Advertising
Services
SIC-32 Intangible Assets - Web Site Costs
SIC-12
✓
✓
✓
IFRIC 14
✓
✓
✓
Not early adopted
✓
✓
✓
✓
✓
✓
✓
✓
✓
✓
✓
✓
✓
✓