novel function of vitamin e in regulation of zebrafish ... · 1 novel function of vitamin e in...
TRANSCRIPT

1
Novel function of vitamin E in regulation of zebrafish (Danio rerio) brain lysophospholipids
discovered using lipidomics
Jaewoo Choi1,2, Scott W. Leonard1, Katherine Kasper1,4, Melissa McDougall1,4, Jan F. Stevens1,2,5,
Robert L. Tanguay3,5, Maret G. Traber *1,4,5
1Linus Pauling Institute; 2College of Pharmacy; 3Environmental and Molecular Toxicology; 4College
of Public Health and Human Sciences; 5Environmental Health Sciences Center; Oregon State
University, Corvallis, OR, 97331. Address Correspondence to:
Maret G. Traber, PhD
Linus Pauling Institute, 307 Linus Pauling Science Center, Oregon State University, Corvallis,
OR 97331, USA
Tel: +1-541-737-7977
Email: [email protected]
Abbreviations: 1-hexadecanoyl-2-docosahexaenoyl-sn-glycero-3-phosphocholine (PC 38:6, DHA-PC), α-tocopherol
deficient (E-), α-tocopherol sufficient (E+), arachidonic acid (AA), ceramide (Cer), docosahexaenoic acid
(DHA), lysophosphospholipid (LysoPL), lysophosphatidylcholine (LPC), lysophosphatidylethanolamine
(LPE) and lysophosphatidylserine (LPS), lysophosphatidylinositol (LPI), major facilitator superfamily
d2a (MFSD2a), phosphatidylcholine (PC), PC 16:0/22:6-OH (16:0/HDoHE-PC),
phosphatidylethanolamine (PE), phosphatidylglycerol (PG), phosphatidylinositol (PI), phosphatidylserine
(PS), phospholipase A (PLA), principal component analysis-discriminant analysis (PCA-DA),
sphingomyelin (SM), time of flight (TOF), triacylglyceride (TAG), triple quadrupole mass spectrometer
(LC-MS/MS), ultra performance liquid chromatography (UPLC).
by guest, on July 2, 2018w
ww
.jlr.orgD
ownloaded from
2
Abstract
We hypothesized that brains from vitamin E-deficient (E-) zebrafish (Danio rerio) would undergo
increased lipid peroxidation because they contain highly polyunsaturated fatty acids, thus susceptible
lipids could be identified. Brains from zebrafish fed for 9 months defined diets without (E-) or with added
vitamin E (E+, 500 mg RRR-α-tocopheryl acetate/kg diet) were studied. Using an untargeted approach, 1-
hexadecanoyl-2-docosahexaenoyl-sn-glycero-3-phosphocholine (DHA-PC 38:6, PC 16:0/22:6) was the
lipid that showed the most significant and greatest fold-differences between groups. DHA-PC
concentrations were approximately 1/3 lower in E- (4.3 ± 0.6) compared with E+ brains (6.5 ± 0.9 mg/g,
mean ± SEM, n=10/group, P=0.04). Using lipidomics, 155 lipids in brain extracts were identified. Only
four PL were different (P<0.05) between groups; they were lower in E- brains and contained DHA with
DHA-PC 38:6 at the highest abundances. Moreover, hydroxy-DHA-PC 38:6 was increased in E- brains
(P=0.0341) supporting the hypothesis of DHA peroxidation. More striking was the depletion in E- brains
of nearly 60% of 19 different lysoPL (combined P=0.0003), which are critical for membrane PL
remodeling. Thus, E- brains contained less DHA-PL, more hydroxy-DHA-PC and fewer lyso-PLs,
suggesting that lipid peroxidation depletes membrane DHA-PC and homeostatic mechanisms to repair the
damage result in lyso-PL depletion.
Keywords
α-tocopherol; 1-hexadecanoyl-2-docosahexaenoyl-sn-glycero-3-phosphocholine;
lysophospholipids; lipidomics; zebrafish; brain
by guest, on July 2, 2018w
ww
.jlr.orgD
ownloaded from

3
Introduction
Vitamin E was discovered because it is critical during pregnancy to prevent fetal resorption in rodents (1).
We have used zebrafish to characterize molecular consequences of vitamin E deficiency because
zebrafish require dietary α-tocopherol, especially during embryonic development (2). Zebrafish also
express the α-tocopherol transfer protein, which facilitates hepatic α-tocopherol secretion into the
circulation in humans (3) and likely facilitates α-tocopherol delivery from the yolk to the developing
zebrafish embryo (4). Importantly, when the α-tocopherol transfer protein (α-TTP) was knocked down in
zebrafish embryos by 12-15 h post-fertilization the embryonic brain and eyes failed to form appropriately
(4), indicating that α-tocopherol is necessary for nervous system development. Further, during embryonic
growth over 72 h both docosahexaenoic acid (DHA, 22:6) and arachidonic acid (AA, 20:4) decreased at
faster rates in vitamin E-deficient compared with E-sufficient zebrafish embryos (5). Moreover, adequate
dietary ascorbic acid was necessary to prevent accelerated α-tocopherol deficiency and tissue damage (5).
We hypothesized that the devastating effects of severe α-tocopherol deficiency in zebrafish embryos (4)
are a result of depletion and alteration of critical brain lipids. Hypothetically, the brain, which is highly
enriched in DHA yet cannot synthesize DHA to meet its needs (6), is highly susceptible to lipid
peroxidation in the α-tocopherol-deficient state. It has been recognized for decades in humans that
vitamin E deficiency causes a progressive, spinocerebellar ataxia (7). Moreover, Ulatowski et al (8) have
shown that vitamin E is necessary for preservation of purkinje cells in brains from α-TTP knockout mice.
The specific lipids depleted during vitamin E deficiency, however, are not known.
The objective of this study is to elucidate molecular consequences of vitamin E deficiency on lipids in
zebrafish brains. However, embryonic brains are too small for rigorous analysis; therefore, we used adult
brains vitamin E-deficient compared with E-sufficient zebrafish to evaluate changes in lipid composition
and abundance and applied a combination of targeted and untargeted methods to enable a comprehensive
profiling of brain lipids to test this hypothesis. We chose zebrafish nearly 1 y of age because long-term
vitamin E deficiency causes severe depletion of tissue α-tocopherol, resulting in behavioral and
by guest, on July 2, 2018w
ww
.jlr.orgD
ownloaded from

4
physiological damage (5, 9). It should be noted that the diets fed were adequate in ascorbic acid, but
restricted in long chain PUFA. These year-old zebrafish are equivalent to middle aged (10, 11), but not
elderly adult humans, eating a low vitamin E diet (12).
by guest, on July 2, 2018w
ww
.jlr.orgD
ownloaded from
5
Materials and Methods
Materials
1-hexadecanoyl-2-docosahexaenoyl-sn-glycero-3-phosphocholine (DHA-PC, PC 16:0/22:6) and 1,2-
ditridecanoyl-sn-glycero-3-phosphocholine (DTD-PC, PC 13:0/13:0) were obtained from Avanti Polar
Lipids Inc. (Alabaster, AL) and used without further purification.
Zebrafish housing and feeding
This study was performed in strict accordance with the recommendations in the Guide for the Care and
Use of Laboratory Animals of the National Institutes of Health. The Institutional Animal Care and Use
Committee of Oregon State University approved the protocol (ACUP Number: 4344). Every effort was
made to minimize suffering; prior to sampling, all fish were euthanized by an overdose of tricaine (MS
222, Argent Chemical Laboratories, Inc., Redmond, WA).
Tropical 5D strain zebrafish were housed in the Sinnhuber Aquatic Research Laboratory. Adult zebrafish
were kept under standard laboratory conditions at 28.5°C with a 14 h light/10 h dark cycle. For 9 months
beginning at 50 days post-fertilization, zebrafish were fed defined diets, which contained only fatty acids
shorter than 18 carbons with 2 or 3 double bonds (2, 5, 9), were prepared in 300-g batches with the
vitamin C source as StayC (500 mg/kg, Argent Chemical Laboratories Inc., Redmond, WA) without (E-)
or with added vitamin E (E+, 500 mg RRR-α-tocopheryl acetate/kg diet, ADM, Decatur, IL), as described
previously (5). Diets were stored at -20°C until fed to the zebrafish.
Using high pressure liquid chromatography with electrochemical detection, α-tocopherol was measured in
diets, brains, and the matching bodies (without brain), as described (13); vitamin C was measured in diet
as described (14). Measured α-tocopherol concentrations in the E- and E+ diets were 1.6 ± 0.1 and 334 ±
12 mg/kg, respectively; vitamin C was 143±16 mg ascorbic acid/kg. This level of dietary vitamin C has
been found to be adequate for the zebrafish (5, 15).
by guest, on July 2, 2018w
ww
.jlr.orgD
ownloaded from

6
Zebrafish tissue extraction and lipidomic analysis by MSMSALL TM
For survey experiments using MSMSALL TM, the head was removed just behind the eye from whole, frozen
zebrafish (n=5/group). The heads were weighed, then homogenized in methanol:water (80:20, v/v).
Samples were extracted using a modified Bligh and Dyer solvent system (16); the final ratio was
chloroform:methanol:water (2:2:1.8). Samples were mixed vigorously for 20 sec, and then centrifuged at
1000×g for 10 min, the top layer was removed by aspiration and discarded. The bottom layer was
collected and evaporated under nitrogen, then stored at -80 oC less than 24 h until MSMSALL TM analysis.
MS/MSALL TM analysis was performed using the Triple-time of flight (TOF) 5600 Mass spectrometer with
direct infusion into ESI source (ABSciex, Framingham, MA). Each sample was reconstituted with 400 µL
methanol:chloroform (1:2, v/v) containing 5 mM ammonium formate. Samples were delivered to the
source at 15 µL/min using an isocratic flow of methanol:isopropanol (3:1, v/v) with 5 mM ammonium
formate. A second isocratic pump delivered a solution of 98% isopropanol and 2% methanol containing 5
mM ammonium formate, as a make-up flow to the source through a T-junction at a rate of 60 µL/min.
Total flow was 75 µL/min at point of entry into the ESI source. Source parameters included nebulizing
gases GS1 at 20 psi, GS2 at 15 psi, curtain gas at 20 psi, positive mode ion spray voltage at 5500 V,
negative mode ion spray voltage at -4000 V, declustering potential at 40 V, and at an ESI source
operating temperature of 400 °C. Collision energy for each MS/MS step was 50 ± 30 eV and −40 ± 30 eV
respectively for positive and negative ion mode experiments.
A fully automatic workflow was developed using the infusion MS/MSALL TM technique on the TripleTOF
5600 system with a flow injection sample introduction strategy. The MS/MSALL TM infusion method (17)
allowed automated collection of TOF MS and TOF MS/MS of all lipids, using a step-wise sampling of
precursor ions selected at unit resolution (1 amu) in quadrupole (Q1), followed by fragmentation in Q2,
and then product ions were detected simultaneously using TOF. High resolution TOF MS/MS spectra
were collected with an accumulation time of 250 ms from lipid precursors from mass range m/z 200.050
to 1200.049, followed by 1,000 product ion experiments with 1,000 precursors evenly spaced from m/z
by guest, on July 2, 2018w
ww
.jlr.orgD
ownloaded from

7
200.050 to m/z 1,200.049. The data were accumulated for 100 ms for each fragment and collected in order
from low to high m/z. The total time to carry out the MS/MSALL TM acquisition for one sample was 5.48
min. Each sample was run in positive and negative modes. To obviate carry-over, there was a washing
time (5 min) between samples. Sample carryover was assessed during the wash step by injecting sample
blanks containing only solvent.
Brain tissue extraction for DHA-PC analysis by triple quadrupole LC-MS/MS
The brains from E- and E+ zebrafish (n= 10 per group) were dissected and weighed. Brains were
transferred individually to Eppendorf tubes, homogenized under 4 oC and extracted individually by
adding in the following order: 250 µL methanol:water (1:1, v/v), DTD-PC as an internal standard (2.5 µg
in 5 µL methanol), and 750 µL methylene chloride:isopropanol: methanol (25:10:65, v/v/v). Solvents
were all at 4o C. Samples were mixed vigorously for 20 sec, and then centrifuged at 13,000×g for 10 min.
The extracts were transferred to a new tube and were stored less than 24 h at -80o C until analysis.
Liquid chromatography (LC) was carried out using a Shimadzu high pressure-LC system (Columbia, MD)
with LC elution conditions as described previously (18). The system was coupled to an Applied
Biosystems API 3000 triple quadrupole mass spectrometer with a TurboIon Spray source operated with
both mass analyzers set at unit resolution in positive mode (LC-MS/MS, Applied Biosystems/MDS Sciex
API 3000, Foster City, CA). Nebulizer, curtain, and collision (CAD) gas parameters were set at 8, 10, and
2 psi, respectively. Heater gas was supplied at 6 L/min at 425 ºC. All gases were high purity nitrogen
supplied by a custom liquid nitrogen system (Polar Cryogenics, Portland, OR). The ionizing voltage was
5,000 V, and the declustering, focusing, entrance, and exit potentials were 50, 200, 10, 35, and 12 V,
respectively.
Multiple reaction monitoring (MRM) was used to quantify PC 38:6, which was identified as 1-
hexadecanoyl-2-docosahexaenoyl-sn-3-phosphocholine in brain extracts. Analytes were detected using
MRM, which allowed for simultaneous quantification of specific isomers based upon unique transitions
by guest, on July 2, 2018w
ww
.jlr.orgD
ownloaded from

8
between the mass-to-charge ratio of the precursor ion [M+H]+ in the positive mode and characteristic
product ions for each species, as well as their characteristic LC retention times. Authentic standards of
DHA-PC and DTD-PC eluted at 14.6 min and 11.2 min, respectively. Measurements of DHA-PC limit of
detection (LOD) and limit of quantitation (LOQ) were assessed using the area ratio of DHA-PC to DTD-
PC. The LOD and the LOQ were defined as the concentrations with a signal-to-noise (S/N) ratio of at
least 3 and 10, respectively. The DHA-PC detection limit was 0.59 pmol/injection and the quantitation
limit was 1.76 pmol/injection. The LC-MRM standard curves relating peak area ratios of DHA-PC/DTD-
PC versus known authentic DHA-PC amounts (0.2 to 10 µg injected) were used to quantitate DHA-PC;
values are expressed per brain weight.
UPLC-TOF-MS/MS lipidomic analyses
The brain tissue extraction procedure for untargeted lipidomics was same as the extraction for DHA-PC,
as described above. Brain weights were not significantly different between groups (E- 2.3 ± 0.3 compared
with E+ 2.2 ± 0.4 g). To identify lipid metabolites, LC was performed using a 1.8 µm particle 100 × 2.1
mm id HSS T3 column (Waters, Milford, MA) coupled to a quadrupole time-of-flight mass spectrometer
(AB SCIEX, Triple TOF 5600) operated in information dependent MS/MS acquisition mode. The column
was heated to 50 oC in the column oven. A gradient system was used consisting of mobile phases (A)
60:40 acetonitrile:water containing 10 mM ammonium formate and (B) 90:10:5 (v/v/v)
isopropanol:acetonitrile:water with 10 mM ammonium formate with sample analysis performed over 17
min total run time. The initial starting conditions were 50% A and 50% B, then for 10 min the gradient
was ramped in a linear fashion to 100% B and held at 100% B for 2 min. Subsequently, the system was
switched to the initial ratio for 1 min, and equilibrated at the initial ratio for additional 4 min. The flow
rate was 0.4 mL/min and the injection volume was 10 µL. TOF MS acquisition time was 0.25 seconds,
and MS/MS acquisition time was 0.1 seconds. The scan range was m/z 70–1200 for TOF MS and m/z 50–
1200 for MS/MS. Source parameters included nebulizing gases GS1 at 45, GS2 at 50, curtain gas at 35,
positive mode ion spray voltage at 5500 V, negative mode ion spray voltage at -4000 V, declustering
potential at 80 V, and at an ESI source operating temperature of 500 °C. Collision energy for each
by guest, on July 2, 2018w
ww
.jlr.orgD
ownloaded from

9
MS/MS step was 35±10 eV and −35±10 eV respectively for positive and negative ion mode experiments.
Data were generated from the UPLC separation of the lipid extract of individual brains, TOF accurate
mass detection, and MS/MS fragment characterization.
Data processing and statistical analyses
The data acquired during the Infusion MS/MSALL TM and LC-MS/MS experiments were processed in batch
mode using LipidView Software Ver 1.2 (AB SCIEX) for automated identification and quantitation of
lipid species. The processed LipidView data files were imported into MarkerView software (AB SCIEX)
for initial data processing, including feature detection, peak integration, principal component analysis
(PCA), and discriminant analysis (DA).
Student’s t-test comparisons were carried out between the two diet groups using MarkerView. Statistical
significance was set at p< 0.05. To discover significant features with the greatest changes between the E-
and E+ diet groups (n = 5/group), the resulting p-values (Student’s t-tests) were plotted against fold
change (log 10), calculated by MarkerView. Features with both the largest fold-changes and smallest p-
values were selected for identification.
For quantitative data from the LC-MS/MS experiments, statistical analyses of DHA-PC concentrations
were performed using GraphPad Prism software (GraphPad, La Jolla, CA). Significance (p < 0.05) was
determined using logarithmically transformed data by a one-way analysis of variance followed by a
Tukey post-hoc test. To estimate overall significance of lysophospholipids (lysoPLs), the responses for
each individual were summed and the sums compared using a t-test.
The data from UPLC-TOF-MS/MS lipidomic analyses were imported into PeakView software for relative
quantification and lipid identification. Lipid species were confirmed by high resolution MS, MS/MS
fragmentation, and isotopic distribution, and then compared using the PeakView database. Peak
intensities were used for relative quantification between E+ and E- zebrafish brains and were corrected
by guest, on July 2, 2018w
ww
.jlr.orgD
ownloaded from

10
for added internal standard (DTD-PC) and brain weight of each brain. Statistical differences between
lipids were assessed as described for LC-MS/MS experiments.
by guest, on July 2, 2018w
ww
.jlr.orgD
ownloaded from

11
Results
Discovery of differentiating lipidomic metabolites and identification by MSMSALL ™ analysis
We used an untargeted, shotgun lipidomics method consisting of the ordered acquisition of high
resolution, accurate mass, time of flight (TOF) detection to identify several characteristic lipid species,
including phosphatidylcholine (PC), lysophosphatidylcholine (LPC), phosphatidylethanolamine (PE),
sphingomyelin (SM), phosphatidylglycerol (PG) and triacylglycerides (TG). Principal component
analysis - discriminant analysis (PCA-DA) revealed significant differences between the lipid profiles of
the extracts of E- and E+ zebrafish heads. The score plot provides a visual distribution of the features and
degree of discrimination between the E- and E+ extracts (Fig. 1A), while the loading plot shows a number
of lipids that lead to sample clustering (Fig. 1B). PC 38:6 was selected for further analysis because it both
decreased in E- extracts (P < 0.05) and showed large fold-differences between the two groups (Fig. 1C).
Brain DHA-PC (PC 16:0/22:6) and vitamin E concentrations
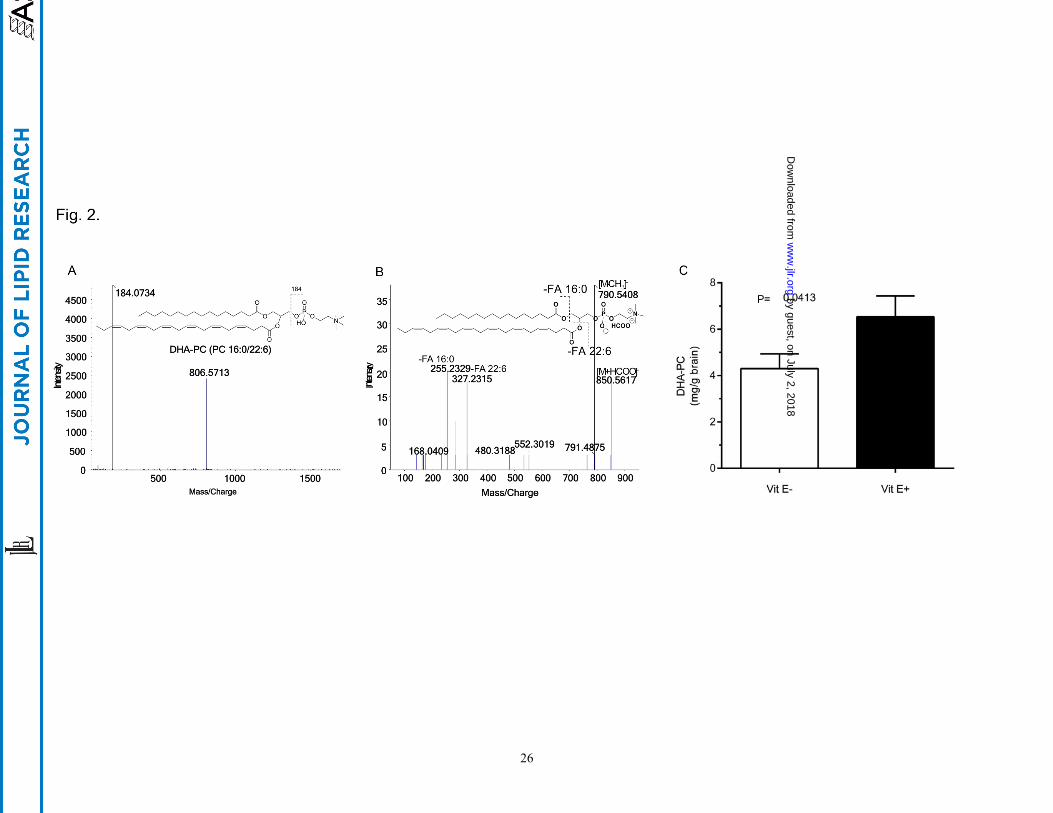
Brains were excised from individual fish; extracts were analyzed for PC 38:6, which was identified as 1-
hexadecanoyl-2-docosahexaenoyl-sn-3-phosphocholine (DHA-PC (Fig. 2A and B)). Brain PC 38:6
identification was based upon the retention time of an authentic standard and the detection of protonated
molecular ion of m/z 806.7 [M+H]+ (data not shown). Moreover, the collision-induced dissociation (CID)
of molecular ion m/z 806.7 produced a characteristic fragment ion of m/z 184 corresponding to the
phosphatidyl choline moiety (19). DTD-PC, the internal standard, also showed the same fragment ion of
m/z 184 (Fig. 2A). The fragment ion, m/z 790.5408 shows loss of a –CH3 group from PC; the fragment
ion, m/z 480.31882 is characteristic of 1-hexadecanoyl-sn-glycerophosphocholine (Fig. 2B). Additionally,
the fragment ion peaks at m/z 225.2329 and 327.2315 are the fatty acyls 16:0 and 22:6, respectively. Thus,
we confirmed the identification of DHA-PC.
Quantitatively E- brains contained 30% less DHA-PC than did E+ brains (P<0.05, Fig. 2C). Additionally,
α-tocopherol concentrations in E- brains (3.4 ± 0.1 nmol/g, mean ± SEM) were 70 times lower than in the
E+ brains (243 ± 32 nmol/g); α-tocopherol concentrations in E- bodies without brains (2.3 ± 0.3 nmol/g)
by guest, on July 2, 2018w
ww
.jlr.orgD
ownloaded from

12
were 60 times lower than in E+ bodies without brains (137 ± 13 nmol/g; 2-way ANOVA: main effect of
diet P<0.0001, main effect of body part P = 0.0014). α-Tocopherol concentrations in E- brains (3.4 ± 0.1
nmol/g) were higher than in the rest of the body (2.3 ± 0.3 nmol/g, P<0.05); as were α-tocopherol
concentrations in E+ brains (234 ± 32 nmol/g) compared with E+ bodies without brains (137 ± 13 nmol/g,
<0.05, paired t-test).
Untargeted lipidomics identifies alterations in brain lipids
To further examine alterations in lipid distribution and relative abundances between E+ and E- zebrafish
brains, we used an UPLC lipidomics technique (Fig. 3A and B). Four lipid classes including 13 lipid
species with 155 specific lipids were identified (Fig. 3C). Lipid classes were detected in both positive
[PC, ceramide (Cer), sphingomyelin (SM), PE, lysophosphatidylcholine (LPC),
lysophosphatidylethanolamine (LPE), and TG] and in negative ion modes [phosphatidylserine (PS) and
lysophosphatidylserine (LPS), phosphatidylglycerol (PG), phosphatidylinositol (PI), and
lysophosphatidylinositol (LPI)]; PC and PE were detected in both modes. E+ zebrafish brains contained
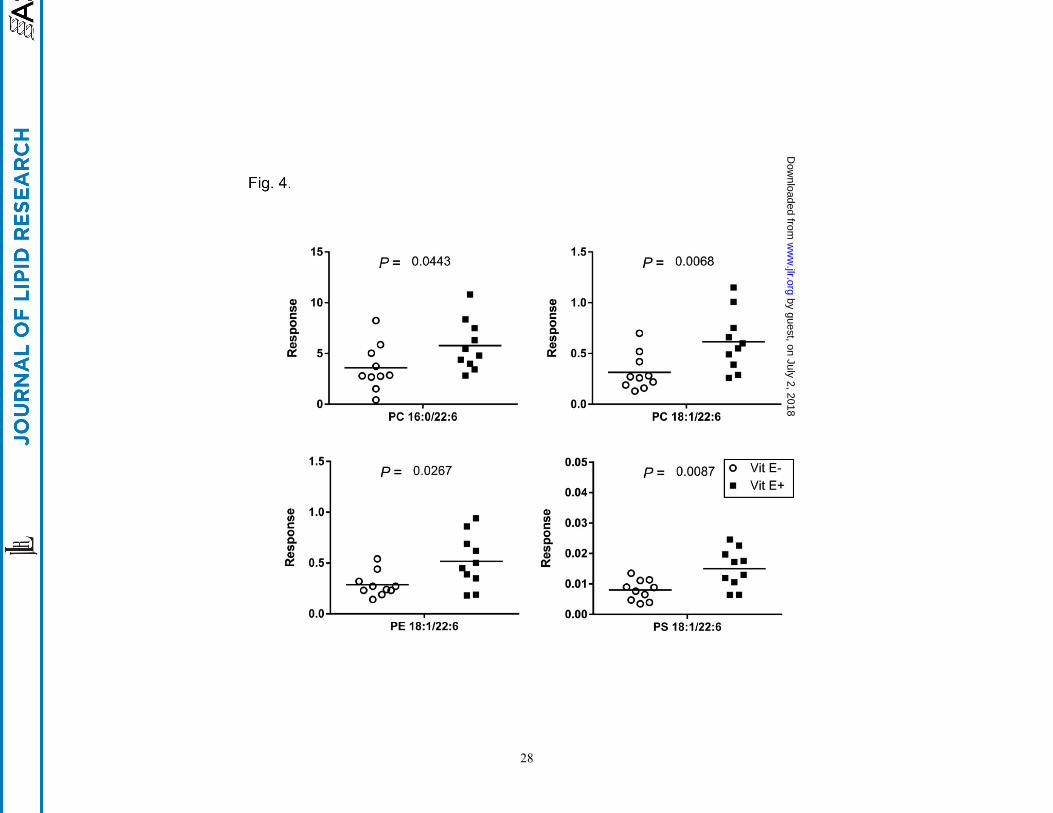
several lipids (PC, LPC, LPE, LPS, LPI and PS) at greater concentrations (p < 0.05) than in E- brains. PC
38:6 (16:0/22:6) was present at the highest intensities of any of the lipids that were significantly different
between groups (Fig. 4). Additionally, three PL containing both DHA and oleic acid (18:1) (PC 40:7, PE
40:7 and PS 40:7) were significantly different between the two groups (Fig. 4).
To determine whether loss of PC 38:6 (16:0/22:6) in E- brains could be a result of lipid peroxidation, the
relative abundances of oxidized-DHA-PC in the extracts were assessed (Fig. 5). 1-hexadecanoyl-2-
(hydroxydocosahexaenoyl)-sn-glycero-3-phosphocholine (PC 16:0/22:6(OH)) was identified by the
fragment ion, m/z 804.5548, which shows loss of a [H2O] group from the DHA fatty acyl chain and the
fragment ion, m/z 184.0733, which is characteristic of PC. The increased hydroxy-DHA-PC
concentrations in E- brains (P = 0.0341) support the hypothesis of greater DHA peroxidation.
by guest, on July 2, 2018w
ww
.jlr.orgD
ownloaded from

13
Remarkably, 19 lysoPLs were present at significantly higher concentrations in the E+ compared with E-
brains (Fig. 6). These lysoPLs have been identified and confirmed using exact mass matching and
MS/MS fragment patterns. Depending upon collision energy, a head group and/or one or more fatty acid
chains were lost from the lipid molecules, which allowed us to identify the lipid class and fatty acid
chains. PE generated the characteristic losses of 43 and 140 Da known to be associated with PE-head
group losses; PS showed -87 and -184 Da loss. The lysoPL abundances varied with regard to fatty acid,
but were uniformly higher in E+ brains. LysoPLs that were significantly higher in E+ and present at the
highest abundances included LPC 16:0, LPC 22:6 and LPE 22:6 (top row, Fig. 6). There were several
lysoPLs s with saturated fatty acids significantly higher in E+ compared with E- brains; these not only
included LPC 16:0, but also LPC 18:0, LPE 18:0, and LPS 18:0 and at lower abundances LPE 16:0 and
LPE 20:0. Overall, the lysoPLs s decreased in E- brains by nearly 60% (P= 0.0003).
by guest, on July 2, 2018w
ww
.jlr.orgD
ownloaded from
14
Discussion
Our discoveries in zebrafish show that low brain α-tocopherol concentrations are associated with a nearly
60% depletion of a total of 19 brain lysoPLs (combined P=0.0003). The wide variety of lysoPLs that are
depleted suggests that the entire lysoPL population is affected. LysoPLs are needed for PL remodeling
during membrane synthesis, repair, and replacement (20, 21). Since rates of DHA synthesis in the brain
are insufficient to meet brain DHA requirements (6, 22, 23), it has been proposed that the brain acquires
DHA as docosahexaenoyl-sn-glycero-3-phosphocholine (lyso-DHA-PC) (24). Recently, a transporter
from the major facilitator superfamily, MFSD2a, which has high specificity towards lyso-DHA-PC (25),
was shown to function as a DHA delivery mechanism facilitating brain docosahexaenoyl-sn-glycero-3-
phospholipid (lyso-DHA-PL) uptake (25). Additionally, the MFSD2a transporter is critical to maintain
the blood brain barrier (26).
These major effects of vitamin E status on brain lysoPLs are surprising because lysoPLs with both
saturated and unsaturated fatty acids are depleted in the E- brains. Generally, PL have saturated fatty or
monounsaturated acids located at the sn-1-acyl moiety and polyunsaturated fatty acids are located at the
sn-2-acyl moiety; the latter are released by phospholipase A2 (PLA2) (27). Hypothetically, an oxidized
DHA would be released by this mechanism, generating a lysoPL with a saturated or monounsaturated
fatty acid. This mechanism would explain a higher level of lysoPLs with saturated fatty acids in E- brains;
however, we observed the opposite, lower levels in E- brains of all the lysoPLs that were different
between the two groups. An alternative explanation is the involvement of PLA1 enzymes releasing the sn-
1-acyl moiety of PL (28). Kuge et al (29) investigated the role of PLA1 in regulating the localized
distribution of PL species in the plasma membrane of cultured neurons and suggest that PLA1 may also
contribute to the dynamic remodeling of the neural membrane.
Although our lipidomics analyses do not allow determination of the position of the fatty acids, we found
three DHA-containing lysoPLs (LPC, LPE, and LPS) that were present at significantly lower
concentrations in the E- brains. In dogs, supplements of fish oil (0.45%, 0.9% or 1.35% fat) or vitamin E
by guest, on July 2, 2018w
ww
.jlr.orgD
ownloaded from

15
(dl-α-T-acetate, 640 IU/kg diet) increased serum 1-docosahexaenoyl-sn-glycero-3-phosphocholine
concentrations (30). This finding of DHA specifically in the sn-1-position further supports our findings of
decreases in LPC-DHA in E- adult zebrafish brains, and the role of lyso-DHA-PC, as the form DHA is
transported from the liver to the brain (25).
DHA-PC was the lipid that showed the largest fold-differences between brains from E+ and E- zebrafish.
Independent quantitation of DHA-PC showed that it was 30% lower in E- brains. Moreover, hydroxy-
DHA-PC was elevated (Fig. 5). We have not identified whether the hydroxy-DHA was in the 1 or the 2
position because we lack authentic compounds; however, the high accuracy mass spectrometry data
supports the identification of hydroxy-DHA-PC. Based on the relative responses of DHA-PC (16:0/22:6,
Fig 4) and hydroxy-DHA-PC (Fig 5C), hydroxy-DHA-PC is less than 0.2% of the DHA-PC.
Our findings suggest that increased lipid peroxidation due to inadequate α-tocopherol leads to the
depletion of a highly abundant brain phospholipid, DHA-PC, as well as three other PL containing both
DHA and oleic acid (18:1) (PC, PE and PS, Fig. 4). Given α-tocopherol’s role as a peroxyl radical
scavenger (31), it is expected that PL containing the highly unsaturated DHA would be depleted from the
E-deficient brains. For example, Xu et al (32) reported the rate constants for autoxidation of the
propagation of several unsaturated lipids in benzene solution, showing that the rate of DHA oxidation
(334 M-1 s-1) is far greater than that of arachidonic acid (AA, 197 M-1 s-1). Previously, we identified a
more rapid depletion of both DHA and AA from E- zebrafish embryos (5), but in these adult brains we
found little evidence for AA depletion. This difference may be a result of the greater likelihood for
oxidation of DHA (32). Alternatively, the brain may be able to synthesize sufficient AA, but not DHA,
for its needs (33). Additionally, 7-dehydrocholesterol a intermediate in cholesterol synthesis, is more
highly oxidizable than either of these fatty acids, but using our lipidomics data we did not detect either 7-
dehydrocholesterol or its oxidation product. It is likely that adult brain does not synthesize cholesterol
extensively and therefore 7-dehydrocholesterol was not detectable.
by guest, on July 2, 2018w
ww
.jlr.orgD
ownloaded from

16
Neural membrane PL remodeling liberates both AA and DHA, which serve as precursors for lipid
mediators and signaling molecules. For example, AA can be metabolized to inflammatory eicosanoids via
cyclooxygenases to yield prostaglandins and thromboxanes or via lipoxygenases to yield leukotrienes (34).
By contrast, DHA can be metabolized to the anti-inflammatory docosanoids via lipoxygenase enzymes to
yield D-series resolvins and other neuroprotective compounds (e.g. neuroprotectin D1) (35). Given the
high brain DHA concentrations, as well as DHA’s role in supporting neurological health across the
lifespan (36, 37), it is remarkable that PL-containing DHA, but not AA, were different between adult E-
and E+ zebrafish brains. These results suggest that α-tocopherol is required within the nervous system to
protect DHA and thereby maintain the brain’s homeostatic balance between anti-inflammatory and
inflammatory compounds. These results also show that there was not artefactual, non-specific lipid
peroxidation of the E- samples.
We are pursuing vitamin E deficiency effects in development of zebrafish embryos. Notably, Huang et al
(38) have published that PC38:6 is decreased in 24 and 48 h embryos compared with earlier time points.
These findings suggest that PC 38:6 is an important target to evaluate in the vitamin E deficient embryo.
We report herein that α-tocopherol deficiency depletes four DHA-containing PL and a 19 lysoPLs. A
unique biological role has been proposed for vitamin E in membrane repair (39). Potentially, the
alterations in lysoPLs we observed in the E- brains are a result of a depletion of DHA-containing PL and
increased requirements for DHA for PL synthesis and lysoPLs for remodeling for membrane repair (Fig
7). Presumably, inadequate α-tocopherol concentrations allow lipid peroxidation to deplete not only brain
DHA-PC, but DHA throughout the body, thereby limiting DHA delivery to the brain. Our data delineate
that critical lipids are protected by α-tocopherol and suggest why α-tocopherol is needed as a vitamin.
by guest, on July 2, 2018w
ww
.jlr.orgD
ownloaded from

17
Acknowledgments
Carrie L. Barton and Jane La Du provided excellent technical assistance. This work was supported by
National Institutes of Health grants S10RR027878, NICHD HD062109 (MGT and RLT) and NIEHS
ES000210.
by guest, on July 2, 2018w
ww
.jlr.orgD
ownloaded from

18
References
1. Evans, H. M., and K. S. Bishop. 1922. On the Existence of a Hitherto Unrecognized Dietary
Factor Essential for Reproduction. Science 56: 650-651.
2. Miller, G. W., E. M. Labut, K. M. Lebold, A. Floeter, R. L. Tanguay, and M. G. Traber. 2012.
Zebrafish (Danio rerio) fed vitamin E-deficient diets produce embryos with increased
morphologic abnormalities and mortality. J Nutr Biochem 23: 478-486.
3. Traber, M. G. 2013. Mechanisms for the prevention of vitamin E excess. J Lipid Res 54: 2295-
2306.
4. Miller, G. W., L. Ulatowski, E. M. Labut, K. M. Lebold, D. Manor, J. Atkinson, C. L. Barton, R.
L. Tanguay, and M. G. Traber. 2012. The alpha-tocopherol transfer protein is essential for
vertebrate embryogenesis. PLoS One 7: e47402.
5. Lebold, K. M., C. V. Lohr, C. L. Barton, G. W. Miller, E. M. Labut, R. L. Tanguay, and M. G.
Traber. 2013. Chronic vitamin E deficiency promotes vitamin C deficiency in zebrafish leading to
degenerative myopathy and impaired swimming behavior. Comp Biochem Physiol C Toxicol
Pharmacol 157: 382-389.
6. Rapoport, S. I., and M. Igarashi. 2009. Can the rat liver maintain normal brain DHA metabolism
in the absence of dietary DHA? Prostaglandins Leukot Essent Fatty Acids 81: 119-123.
7. Ulatowski, L., and D. Manor. 2013. Vitamin E trafficking in neurologic health and disease. Annu
Rev Nutr 33: 87-103.
8. Ulatowski, L., R. Parker, G. Warrier, R. Sultana, D. A. Butterfield, and D. Manor. 2014. Vitamin
E is essential for Purkinje neuron integrity. Neuroscience 260: 120-129.
9. Lebold, K. M., D. B. Jump, G. W. Miller, C. L. Wright, E. M. Labut, C. L. Barton, R. L.
Tanguay, and M. G. Traber. 2011. Vitamin E deficiency decreases long-chain PUFA in zebrafish
(Danio rerio). J Nutr 141: 2113-2118.
10. Kishi, S., J. Uchiyama, A. M. Baughman, T. Goto, M. C. Lin, and S. B. Tsai. 2003. The zebrafish
as a vertebrate model of functional aging and very gradual senescence. Exp Gerontol 38: 777-
786.
by guest, on July 2, 2018w
ww
.jlr.orgD
ownloaded from

19
11. Keller, E. T., and J. M. Murtha. 2004. The use of mature zebrafish (Danio rerio) as a model for
human aging and disease. Comp Biochem Physiol C Toxicol Pharmacol 138: 335-341.
12. Traber, M. G. 2014. Vitamin E Inadequacy in Humans: Causes and Consequences. Advances in
Nutrition: An International Review Journal 5: 503-514.
13. Podda, M., C. Weber, M. G. Traber, and L. Packer. 1996. Simultaneous determination of tissue
tocopherols, tocotrienols, ubiquinols, and ubiquinones. J Lipid Res 37: 893-901.
14. Frei, B., L. England, and B. N. Ames. 1989. Ascorbate Is an Outstanding Antioxidant in Human-
Blood Plasma. Proc Natl Acad Sci U S A 86: 6377-6381.
15. Kirkwood, J. S., K. M. Lebold, C. L. Miranda, C. L. Wright, G. W. Miller, R. L. Tanguay, C. L.
Barton, M. G. Traber, and J. F. Stevens. 2012. Vitamin C deficiency activates the purine
nucleotide cycle in zebrafish. J Biol Chem 287: 3833-3841.
16. Bligh, E. G., and W. J. Dyer. 1959. A rapid method of total lipid extraction and purification. Can
J Biochem Physiol 37: 911-917.
17. Simons, B., E. Duchoslav, L. Burton, and R. Bonner. 2011. Molecular Characterization and
Quantitation of Lipids with High Resolution Accurate Mass Tandem MS Techniques. In. AB
SCIEX, Framingham, MA.
18. Monette, J. S., L. A. Gomez, R. F. Moreau, B. A. Bemer, A. W. Taylor, and T. M. Hagen. 2010.
Characteristics of the rat cardiac sphingolipid pool in two mitochondrial subpopulations. Biochem
Biophys Res Commun 398: 272-277.
19. Hsu, F. F., and J. Turk. 2003. Electrospray ionization/tandem quadrupole mass spectrometric
studies on phosphatidylcholines: the fragmentation processes. J Am Soc Mass Spectrom 14: 352-
363.
20. Shindou, H., D. Hishikawa, T. Harayama, M. Eto, and T. Shimizu. 2013. Generation of
membrane diversity by lysophospholipid acyltransferases. J Biochem 154: 21-28.
21. Hishikawa, D., T. Hashidate, T. Shimizu, and H. Shindou. 2014. Diversity and function of
membrane glycerophospholipids generated by the remodeling pathway in mammalian cells. J
Lipid Res 55: 799-807.
by guest, on July 2, 2018w
ww
.jlr.orgD
ownloaded from

20
22. Igarashi, M., L. Chang, K. Ma, and S. I. Rapoport. 2013. Kinetics of eicosapentaenoic acid in
brain, heart and liver of conscious rats fed a high n-3 PUFA containing diet. Prostaglandins
Leukot Essent Fatty Acids 89: 403-412.
23. Rapoport, S. I., M. Igarashi, and F. Gao. 2010. Quantitative contributions of diet and liver
synthesis to docosahexaenoic acid homeostasis. Prostaglandins Leukot Essent Fatty Acids 82:
273-276.
24. Lagarde, M., N. Bernoud, N. Brossard, D. Lemaitre-Delaunay, F. Thies, M. Croset, and J. Lecerf.
2001. Lysophosphatidylcholine as a preferred carrier form of docosahexaenoic acid to the brain. J
Mol Neurosci 16: 201-204; discussion 215-221.
25. Nguyen, L. N., D. Ma, G. Shui, P. Wong, A. Cazenave-Gassiot, X. Zhang, M. R. Wenk, E. L.
Goh, and D. L. Silver. 2014. Mfsd2a is a transporter for the essential omega-3 fatty acid
docosahexaenoic acid. Nature 509: 503-506.
26. Ben-Zvi, A., B. Lacoste, E. Kur, B. J. Andreone, Y. Mayshar, H. Yan, and C. Gu. 2014. Mfsd2a
is critical for the formation and function of the blood-brain barrier. Nature 509: 507-511.
27. Dennis, E. A., J. Cao, Y. H. Hsu, V. Magrioti, and G. Kokotos. 2011. Phospholipase A2
enzymes: physical structure, biological function, disease implication, chemical inhibition, and
therapeutic intervention. Chem Rev 111: 6130-6185.
28. Richmond, G. S., and T. K. Smith. 2011. Phospholipases A(1). Int J Mol Sci 12: 588-612.
29. Kuge, H., K. Akahori, K. Yagyu, and K. Honke. 2014. Functional compartmentalization of the
plasma membrane of neurons by a unique acyl chain composition of phospholipids. J Biol Chem
289: 26783-26793.
30. Hall, J. A., J. A. Brockman, and D. E. Jewell. 2011. Dietary fish oil alters the lysophospholipid
metabolomic profile and decreases urinary 11-dehydro thromboxane B(2) concentration in
healthy Beagles. Vet Immunol Immunopathol 144: 355-365.
31. Traber, M. G., and J. Atkinson. 2007. Vitamin E, antioxidant and nothing more. Free Radic Biol
Med 43: 4-15.
by guest, on July 2, 2018w
ww
.jlr.orgD
ownloaded from

21
32. Xu, L., T. A. Davis, and N. A. Porter. 2009. Rate constants for peroxidation of polyunsaturated
fatty acids and sterols in solution and in liposomes. J Am Chem Soc 131: 13037-13044.
33. Lin, L. E., C. T. Chen, K. D. Hildebrand, Z. Liu, K. E. Hopperton, and R. P. Bazinet. 2015.
Chronic dietary n-6 PUFA deprivation leads to conservation of arachidonic acid and more rapid
loss of DHA in rat brain phospholipids. J Lipid Res 56: 390-402.
34. Frisardi, V., F. Panza, D. Seripa, T. Farooqui, and A. A. Farooqui. 2011. Glycerophospholipids
and glycerophospholipid-derived lipid mediators: a complex meshwork in Alzheimer's disease
pathology. Prog Lipid Res 50: 313-330.
35. Bazan, N. G. 2009. Cellular and molecular events mediated by docosahexaenoic acid-derived
neuroprotectin D1 signaling in photoreceptor cell survival and brain protection. Prostaglandins
Leukot Essent Fatty Acids 81: 205-211.
36. Kim, H. Y. 2007. Novel metabolism of docosahexaenoic acid in neural cells. J Biol Chem 282:
18661-18665.
37. Andre, A., P. Juaneda, J. L. Sebedio, and J. M. Chardigny. 2006. Plasmalogen metabolism-related
enzymes in rat brain during aging: influence of n-3 fatty acid intake. Biochimie 88: 103-111.
38. Huang, S. M., F. Xu, S. H. Lam, Z. Gong, and C. N. Ong. 2013. Metabolomics of developing
zebrafish embryos using gas chromatography- and liquid chromatography-mass spectrometry.
Mol Biosyst 9: 1372-1380.
39. Howard, A. C., A. K. McNeil, and P. L. McNeil. 2011. Promotion of plasma membrane repair by
vitamin E. Nat Commun 2: 597.
by guest, on July 2, 2018w
ww
.jlr.orgD
ownloaded from

22
Figure Legends
Fig. 1. Identification of PC 38:6 as significantly depleted in heads from E- zebrafish
For 9 months beginning at 50 days post-fertilization, zebrafish were fed defined diets (E+ or E-), which
contained only fatty acids shorter than 18 carbons with 2 or 3 double bonds. For survey experiments using
MSMSALL TM, the head was removed just behind the eye from whole, frozen zebrafish (n=5/group). The
heads were weighed, then homogenized in methanol:water (80:20, v/v). Samples were extracted using a
modified Bligh and Dyer solvent system (16); the final ratio was chloroform:methanol:water (2:2:1.8).
Samples were mixed vigorously for 20 sec, and then centrifuged at 1000×g for 10 min, the top layer was
removed by aspiration and discarded. The bottom layer was collected and evaporated under nitrogen, then
stored at -80 oC less than 24 h until MSMSALL TM analysis. (A) Score plot provides a visual distribution of
the features and degree of discrimination between individuals in E- compared with E + groups. (B)
Loading plot shows the lipids that lead to sample clustering. Positive % loading shows higher and
negative % loading shows lower intensities of lipid metabolites in the E + group. (C) Volcano plot of the
Student’s t-test versus the log fold-change between groups. * PC 38:6 was significantly decreased in E-
extracts.
Fig. 2. Quantitation of PC 38:6 from E- and E+ brains
Fish were fed, as described in Figure 1. The brains from E- and E+ zebrafish (n= 10 per group) were
dissected, weighed, and extracted individually at 4o C by adding in the following order: 250 µL
methanol:water (1:1, v/v), DTD-PC as an internal standard (2.5 µg in 5 µL methanol), and 750 µL
methylene chloride:isopropanol: methanol (25:10:65, v/v/v). Samples were mixed vigorously for 20 sec,
and then centrifuged at 13,000×g for 10 min. The extracts were transferred to a new tube and were stored
less than 24 h at -80o C until analysis. (A) Chemical structure and positive fragmentation ion of DHA-PC
based on MS/MSALL, (B) negative fragmentation ions of DHA-PC based on the TOF-MS/MS spectrum,
(C) Quantitation of DHA-PC (mg/g brain) in zebrafish brain extracts by LC-MS/MS in E- (open bar) and
E+ (solid bar) (n=10/group). Error bars= SEM.
by guest, on July 2, 2018w
ww
.jlr.orgD
ownloaded from

23
Fig. 3. Lipid identification from UPLC-TOF MS chromatograms
UPLC-TOF MS chromatograms of zebrafish brain extracts (n=10/group) with precise separations during
a run time of 15 minutes using (A) positive and (B) negative ion mode; different lipid classes elute in
different elution time windows. PC: Phosphatidylcholine, lyso-PC: LysoPC, PE:
Phosphatidylethanolamine, SM: Sphingomyelin, TG: Triglyceride, CholE: Cholesterol ester, PI:
Phosphatidyl inositol, PS: Phosphatidylserine. (C) 13 lipid species and 155 individual lipids were
identified in extracts of zebrafish brains, example of chromatogram.
Fig. 4. Four specific phospholipids containing DHA are significantly lower in E- brains.
Data were generated from the UPLC separation of the lipid extracts of individual brains from E- and E+
fish, extracted as described in figure 2. Lipid species were confirmed by high resolution MS, MS/MS
fragmentation, and isotopic distribution, and then compared using the PeakView database; PeakView
software was also used for relative quantification and lipid identification. Peak intensities were used for
relative quantification between E+ and E- zebrafish brains. Shown are the individual values (E-, circles;
E+, squares; n=10/group) with the median indicated with a line.
Fig. 5. Identification and quantitation of oxidized PC (16:0/22:6(OH))
Data were generated from the UPLC separation of the lipid extracts of individual brains from E- and E+
fish, shown in figure 4. (A) UPLC-TOF MS chromatogram and (B) MS/MS spectrum of zebrafish brain
extract using positive ion mode, (C) Hydroxy-DHA-PC, shown are individual values of PC
(16:0/22:6(OH)) in zebrafish brain extracts analyzed, corrected for internal standard and brain weight
(P=0.0341). [An outlier value in E- brains was excluded (Grubbs’, P<0.05) from E- data set; otherwise P=
0.0175.]
Fig. 6. Lyso-PLs are significantly depleted in E- zebrafish brains
Data were generated from the UPLC separation of the lipid extracts of individual brains from E- and E+
fish, , shown in figure 4. Shown are the individual lysoPLs species (Vit E-, circles; Vit E+, squares),
which were significantly different between groups with the medians indicated (n=10/group). The data are
by guest, on July 2, 2018w
ww
.jlr.orgD
ownloaded from

24
displayed with those lysoPLs present at the highest abundances near the top of the figure, and the lowest
near the bottom. LPC: Lysophosphatidylcholine, LPE: lysophosphatidylethanolamine, LPI:
lysophosphatidylinositol, LPS: lysophosphatidylserine; fatty acid present in the lysoPL are indicated on
the x-axis, position could not be determined by this analysis.
Fig. 7. Hypothesis linking lyso-PL, DHA-PC and vitamin E deficiency in zebrafish brains
To maintain the membranes in the brain, lyso-PL, especially lyso-DHA-PC (with DHA in the 1 position),
are transported into the brain from the circulation via a transporter, likely MFSD2a DHA (25), where
these lyso-PL are converted via the Lands’ cycle and Kennedy pathway to various PL, including DHA-PC
with (with DHA in the 2 position). A peroxyl radical (ROO�) attacks a membrane PL (e.g. 1-
hexadecanoyl-2-docosahexaenoyl-sn-glycero-3-phosphocholine (DHA-PC), likely forming an
intermediate (DHA-(OOH)-PC), which is reduced to DHA-(OH)-PC (hydroxy-DHA-PC was detected in
this study). α-Tocopherol (α-T) limits this process. Inadequate vitamin E allows lipid peroxidation to
damage the membrane, which must be repaired. In the face of inadequate α-T, more lyso-PL are needed
for membrane repair, but sufficient amounts, especially of lyso-DHA-PC, may not be available (possibly
due to increased lipid peroxidation in the rest of the body). The increased membrane remodeling depletes
various lyso-PL in the brains of E- zebrafish.
by guest, on July 2, 2018w
ww
.jlr.orgD
ownloaded from