novel insights into bacterial dimethylsulfoniopropionate ... · 1 novel insights into bacterial...
TRANSCRIPT
1
Novel insights into bacterial dimethylsulfoniopropionate catabolism 1
in the East China Sea 2
Jingli Liu 1,2†, Ji Liu1,2†, Sheng-Hui Zhang3, Jinchang Liang1, Heyu Lin1, Delei Song1, 3
Gui-Peng Yang3,4, Jonathan D. Todd2*, Xiao-Hua Zhang1,4* 4 5 1 College of Marine Life Sciences, Ocean University of China, Qingdao, China. 6 2 School of Biological Sciences, University of East Anglia, Norwich Research Park, Norwich, UK. 7 3 College of Chemistry and Chemical Engineering, Ocean University of China, Qingdao, China. 8 4 Laboratory for Marine Ecology and Environmental Science, Qingdao National Laboratory for 9
Marine Science and Technology, Qingdao, China. 10
†These authors contributed equally to this work. 11
12
*Correspondence: 13
Dr. Xiao-Hua Zhang, [email protected]; Dr. Jonathan D. Todd, [email protected] 14
15
Keywords: DMSP catabolism, DMS, methanthiol (MeSH), bacteiral community, the East 16
China Sea 17
18
Running title: DMSP catabolism in the East China Sea 19
20
SUPPLEMENTARY MATERIAL: Three supplementary Figures and nine supplementary Tables 21
are available with this paper. 22
2
SUMMARY 23
The compatible solute Dimethylsulfoniopropionate (DMSP), made by many marine organisms, is 24
one of Earth’s most abundant organosulfur molecules. Many marine bacteria import DMSP and 25
can degrade it as a source of carbon and/or sulfur via DMSP cleavage or DMSP demethylation 26
pathways, which can generate the climate active gases dimethyl sulfide (DMS) or methanthiol 27
(MeSH), respectively. Here we used culture-dependent and -independent methods to study 28
bacteria catabolising DMSP in East China Sea (ECS). Of bacterial isolates, 42.11% showed 29
DMSP-dependent DMS (Ddd+) activity, and 12.28% produced detectable levels of MeSH. 30
Interestingly, although most Ddd+ isolates were Alphaproteobacteria (mainly Roseobacters), 31
many gram-positive Actinobacteria were also shown to cleave DMSP producing DMS. The 32
mechanism by which these Actinobacteria cleave DMSP is unknown, since no known functional 33
ddd genes have been identified in genome sequences of Ddd+ Microbacterium and Agrococcus 34
isolates or in any other sequenced Actinobacteria genomes. Gene probes to the DMSP 35
demethylation gene dmdA and the DMSP lyase gene dddP demonstrated that these 36
DMSP-degrading genes are abundant and widely distributed in ECS seawaters. dmdA was present 37
in relatively high proportions in both surface (19.53% ± 6.70%) and bottom seawater bacteria 38
(16.00% ± 8.73%). In contrast, dddP abundance positively correlated with chlorophyll a, and 39
gradually decreased with the distance from land, which implies that the bacterial DMSP lyase 40
gene dddP might be from bacterial groups that closely associate with phytoplankton. Bacterial 41
community analysis showed positive correlations between Rhodobacteraceae abundance and 42
concentrations of DMS and DMSP, further confirming the link between this abundant bacterial 43
class and the environmental DMSP cycling.44
3
INTRODUCTION 45
The tertiary sulfonium compound dimethylsulfoniopropionate (DMSP) is made in prodigious 46
amounts (several petagrams, worldwide annually) in marine environments (Ksionzek et al., 2016). 47
DMSP is synthesised by many marine microalgae, e.g. coccolithophores, dinoflagellates and 48
diatoms (Curson et al., 2018; Kageyama et al., 2018), macroalgae (Reed, 1983), a few 49
angiosperms (Otte et al., 2004) and some corals (Raina et al., 2013). Recently, heterotrophic 50
bacteria have also been reported to synthesize DMSP (Curson et al., 2017). In these organisms 51
DMSP may function in e.g., storage of excess sulfur and carbon (Stefels, 2000), cryoprotection, 52
oxidative damage protection (Sunda et al., 2002), signaling pathways acting as chemoattractant 53
(Seymour et al., 2010) and enhancing the prodution of quorum-sensing molecules (Johnson et al., 54
2016). The major ecological significance of DMSP lies in it being an important nutrient for 55
marine microorganisms (Curson et al., 2011b) providing carbon, sulfur and/or energy to microbes 56
catabolising it. Microbial DMSP catabolism can generate environmentally important catabolites 57
including the climate active gases dimethylsulfide (DMS) and methanethiol (MeSH). DMS, 58
largely derived from DMSP catabolism, is the most significant biogenic sulfur compound 59
transferred from oceans to the atmosphere (~3 x 10⁸ tonnes, worldwide annually; (Andreae, 1990), 60
where its oxidative products act as cloud condensation nuclei (CCN) affecting cloud cover and 61
thus the radiation reaching Earth’s surface (Vallina and Simó, 2007). 62
63
Although many marine phytoplankton can catabolise DMSP (Alcolombri et al., 2015; Johnston, 64
2015), it is believed that marine bacteria are significant contributors to global DMSP catabolism 65
once this molecule is released into the dissolved pool of DMSP in seawater (Curson et al., 2011b). 66
Indeed, DMSP supports 1% – 13% of the bacterial carbon demand in surface seawater (Kiene and 67
Linn, 2000) and it is especially important as a reduced organic sulfur source, e.g., for the 68
dominant heterotrophic bacteria SAR11, which require exogenous sources of reduced sulfur for 69
growth (Tripp et al., 2008). A wide variety of marine microorganism import (Vila et al., 2004; 70
Howard et al., 2008) and catabolise DMSP via two enzymatic pathways: demethylation and 71
cleavage (Curson et al., 2011b; Moran et al., 2012). Demethylation is believed to be the 72
predominant DMSP catabolic pathway, converting ~75% dissolved DMSP into 73
3-methylmercaptopropionate (MMPA), further into MeSH, and then into microbial biomass 74
(Kiene and Linn, 2000). This pathway does not liberate DMS. The maker gene for DMSP 75
demethylation ‘dmdA’ is only found in bacteria and is prevalent in the SAR11 lineage and another 76
abundant marine Alphaproteobacteria lineage known as the Roseobacters (Howard et al., 2006; 77
Reisch et al., 2011). The dmdA genes can be grouped into five clades and 14 subclades based on 78
their nucleotide and amino acid sequences (Howard et al., 2006, 2008; Varaljay et al., 2010). 79
80
By comparison, there is far more biodiversity in the DMSP cleavage pathway where DMSP lyase 81
enzymes generate DMS from DMSP in bacteria, some fungi and phytoplankton (Curson et al., 82
2011b; Alcolombri et al., 2015; Sun et al., 2016). To date, eight different DMSP lyase genes, 83
dddD, dddL, dddP, dddQ, dddW, dddY, dddK and Alma1, encoding distinct polypeptides in 84
various protein families, have been identified in a wide range of microbes, demonstrating a high 85
level of biochemical and genetic diversity in DMSP lyase enzymes (Curson et al., 2011b; 86
Alcolombri et al., 2015; Johnston, 2015; Johnston et al., 2016; Sun et al., 2016). With the 87
4
exception of dddY, the bacterial ddd genes are common in Roseobacters (Curson et al., 2011b), 88
which can account for up to 30% of bacterioplankton cells (González and Moran, 1997) in 89
eutrophic coastal regions where DMS emission is intense and likely exerts influence on climate, 90
e.g. the East China Sea (ECS). Of the identified bacterial DMSP lyases, the DMSP lyase genes 91
dddP and dddQ are by far the most prevalent in ocean microbial reference gene catalogue 92
(OM-RGC) metagenomic and Tara Oceans metatranscriptomic datasets apportioned mainly to 93
marine bacteria (Curson et al., 2018). 94
95
The ECS is the largest marginal sea of the western Pacific (Figure 1). It is influenced by the 96
Yangtze River effluent and the Kuroshio water current, and acts as a transition zone where 97
terrigenous and anthropogenic materials are discharged from the mainland to the ocean. A 98
previous study of the ECS in the summer of 2011 found the surface waters to contain moderate 99
concentrations of DMSP, DMS and chlorophyll a (28.25 nmol L-1, 5.64 nmol L-1 and 0.84 mg L-1, 100
respectively) (Yang et al., 2011). To date, our understanding of microbial DMSP metabolism in 101
marine environments comes mainly from studies conducted in open sea, salt marsh and estuarine 102
environments (e.g., Ansede et al., 2001) or with phytoplankton-attached bacteria (e.g., Hatton et 103
al., 2012). Studies on the spatial and temporal distribution of bacterial DMSP-degrading genes 104
have been carried out in the Sargasso Sea (Levine et al., 2012), the Pacific Ocean (Varaljay et al., 105
2012; Cui et al., 2015) and the Arctic Kongsfjorden (Zeng et al., 2016). However, studies of the 106
abundance and diversity of bacterial DMSP catabolism in marginal sea environments are limited. 107
In this study, we collected and characterised seawater samples from seven ECS sites for their 108
oceanographic parameters and DMSP compositions. Culture-dependent methods were used to 109
study DMSP catabolising bacteria in samples from two of these sites and led to the identification 110
of novel DMSP catabolising bacterial taxa. Culture-independent methods were used to explore the 111
spatial distribution and diversity of key DMSP catabolic genes in a transect of five ECS stations 112
from inshore to the offshore waters, and the results further demonstrate the importance of 113
bacterial DMSP-catabolism in the ECS. 114
115
MATERIAL AND METHODS 116
Sampling and Environmental Parameters 117
Surface seawater (SW) and Bottom seawater (BW) samples were collected onboard the R/V 118
‘Dong Fang Hong 2’ in the ECS during two cruises from 14 July to 1 August 2013 (two sites, 119
ME3 located near the continent and P11 further from the land) and 19 October to 2 November 120
2015 (five sites, P03, P05, P07, P10 and P12; along a transect from coast to the ocean), 121
respectively (Figure 1 and Table 1). Seawater was collected by Niskin bottles equipped on a 122
standard conductivity-temperature-depth rosette (CTD). One litre of each sample was 123
immediately filtered through 0.22 µm pore size polycarbonate membranes filters (Millipore 124
Corporation, Billerica, MA, USA). Filters from 2013 cruise were soaked in sterile 0.85% (w/v) 125
saline supplemented with 15% (v/v) glycerol before stored at −80°C until in-lab bacterial 126
isolation. Filters from 2015 cruise were stored in liquid nitrogen onboard and at −80°C in lab for 127
nucleic acid extraction. Salinity, temperature and dissolved oxygen were recorded with a Seabird 128
911 conductivity-temperature-depth (CTD). 129
5
130
DMS and DMSP concentrations in the seawater samples were measured as described by Zhang et 131
al. (2014). DMS samples were measured onboard immediately after sampling using a modified 132
purge and trap method. Briefly, a sample of 2 mL was collected into a glass bubbling chamber 133
through a GF/F filter. Sulfur gases were sparged from the seawater with nitrogen and trapped in a 134
loop of Teflon tubing immersed in liquid nitrogen. The trapped gases were desorbed with hot 135
water (90 °C) and analysed on a Shimadzu GC-2014 gas chromatograph equipped with a flame 136
photometric detector. A 3 m × 3 mm glass column packed with 10% DEGS on Chromosorb 137
W-AW-DMCS was used to separate sulfur gases at 70 °C. 138
139
Gravity filtering of samples for dissolved DMSP (DMSPd) was conducted as described by Kiene 140
and Slezak (2006) with the following modifications. Total DMSP (DMSPt) and DMSPd samples 141
were fixed with 50% sulfuric acid and stored on ship at room temperature for 2 d. For DMSPd 142
samples, the first few drops of filtrate was discarded, and a 4 mL sample was transferred to a glass 143
vial containing 40 µL of concentrated sulfuric acid and sealed. For DMSPt samples, 100 µL of 144
50% sulfuric acid was directly added to 10 mL of unfiltered seawater samples and then sealed. 145
When analysed, 300 µL of 10 mol L−1 KOH was injected into 2 mL of the preserved DMSP 146
sample and incubated in the dark at 4 °C for at least 24 h, allowing for complete conversion of 147
DMSP into DMS and acrylate. The liberated DMS was measured using the method described 148
above. 149
150
For chlorophyll a (Chl a) analysis, the seawater samples were filtered through 47 mm Whatman 151
GF/F filters. The filters were soaked in 10 ml of 90% acetone and then stored in the dark at 4 °C. 152
After 24 h, the concentration of Chl a was measured using a F4500 (Hitachi) fluorometer 153
(Parsons et al., 1984). 154
155
Bacteria Isolation and Phylogenetic Analysis 156
Filters from the 2013 cruise were rinsed with sterile 0.85% (w/v) saline supplemented with 15% 157
(v/v) glycerol. The cells were resuspended by vortexing, spread on Marine Agar (MA) plates and 158
incubated at 28°C for 1 week. Single colonies were picked randomly and purified three times on 159
fresh plates prior to further studies. Genomic DNA of the isolates was extracted by 160
phenol/chloroform extraction, and the 16S rRNA genes were amplified using the 27F/1492R 161
primer set (Lane, 1991) and sequenced to determine their taxonomy. Calculation of pairwise 162
similarity values for the 16S rRNA gene of the cultivated strains and the most closely related type 163
strains were achieved from the Ezbiocloud server (http://www.ezbiocloud.net/identify). The 16S 164
rRNA gene sequences of representative cultivated bacterial strains and the most closely related 165
type strains were aligned using the CLUSTAL_X program (Thompson et al., 1997). Phylogenetic 166
trees based on the neighbour-joining (NJ) algorithms were constructed by MEGA version 5.0 167
(Tamura et al., 2011) with K2+G model. The tree topology was checked by 1000 bootstrap 168
replicates. 169
6
Sole Carbon Source Test 170
Fifty-seven representative bacterial isolates were selected and tested for their growth on MBM 171
minimal medium (Baumann and Baumann, 1981) with DMSP (2 mM; TCI, Japan) as sole carbon 172
source. The same medium lacking a carbon source (negative control) or supplied with glucose 173
(2mM), succinate (2mM), sucrose (2mM), pyruvic acid sodium salt (2mM) and glycerol (2mM) 174
as the carbon source was used. Briefly, cells were grown in Marine Broth (MB; Becton Dickinson) 175
and harvested after incubation at 28°C for 2 days, and then washed three times with 3% (w/v) 176
NaCl saline. Washed cells were diluted to OD600nm = 0.4 – 0.6, then 1% (w/v) were inoculated in 177
triplicate into the media supplied with DMSP or mixed carbon source. Cells added to MBM 178
medium without any carbon source were set up as non-carbon control. Growth was measured 179
spectrophotometrically (OD600nm) after one week. Significance was determined using a Student’s 180
t-test (P < 0.05). 181
DMSP Catabolism Assay 182
To measure DMSP catabolism of cultivated bacteria, bacterial strains were grown overnight in 183
MB at 28 °C. Cells were washed twice in MAMS media (Table S1) and diluted to OD600 = 0.3 184
prior to 1 in 10 dilution into vials (CNW, China) containing MAMS media supplied with 0.45% 185
glycerol (v/v) and 0.05% glucose (w/v) as the mixed carbon source and 1 µM, 0.5 mM or 5 mM 186
DMSP as the catabolism substrate to get a final volume of 2 ml. After gas-tight sealing and 187
incubation at 28°C for ~36 h, the 2 ml cultures were directly assayed for DMS and MeSH 188
production as described above. Ratified DMSP degrading strains, Roseovarius nubinhibens ISM 189
and Ruegeria pomeroyi DSS-3, which can produce both DMS and MeSH from DMSP (González 190
et al., 1999, 2003), were used as positive controls. Abiotic media controls of MAMS media 191
supplied with the same concentration of DMSP were set up and incubated under the same 192
conditions to monitor the background chemical lysis of DMSP to DMS. Bacterial Ddd production 193
was calculated by subtracting the abiotically generated DMS from the total detected 194
DMSP-dependent DMS in the bacterial cultures. 195
196
An eight-point (2.06 nM – 103 nM) calibration curve was made with a gradient DMS 197
concentrations to calculate the DMSP dependent DMS production rate of tested bacterial strains. 198
The detection limit for the purge and trap GC analysis of DMS was 0.8 pmol DMS, and the 199
square root of the DMS peak area was linear to the DMS concentration. Total protein 200
concentration in the cells was estimated using Bradford assays (Bio-Rad). The rate of DMS 201
production was expressed in nmol DMS per mg protein per hour. 202
203
A similar eight-point (10 µM – 0.1 mM) calibration curve was constructed for MeSH as was done 204
for DMS, see above. However, unlike DMS, the detected peak area of MeSH was not linear with 205
MeSH concentration. The detection limit for the purge and trap GC analysis of MeSH was 0.1 206
µmol. Thus, MeSH assays carried out here, as described above, are considered as only qualitative 207
and not quantitative for DMSP dependent MeSH production. 208
209
Strains that could use DMSP as sole carbon source were tested for their DMSP dependent DMS 210
and MeSH production with and without the addition of mixed carbon source to MBM media (as 211
7
above) to test whether the addition of extra carbon source significantly affected MeSH and/or 212
DMS production from DMSP. 213
214
BLASTp Analysis of Ddd and DmdA Homologues 215
The bacterial genome sequences of the strains that are of the same genus as our 57 representative 216
isolates were retrieved from the NCBI database as reference genomes 217
(https://www.ncbi.nlm.nih.gov/assembly, Table S2). Ratified DMSP lyases, i.e. DddD, DddL, 218
DddP, DddQ, DddY and DddW and demethylase DmdA (Table S3) were used to interrogate the 219
putative proteins in all reference genome sequences, using the BLASTp program (E-value ≤ 1e-5), 220
and then the produced sequences were manually curated with the thresholds of identity ≥ 40%, 221
coverage ≥ 70% and length difference ≤ 20%. 222
Degenerate dddP Primer Design, PCR Amplification and Sequencing of ddd and dmdA genes 223
of DMSP-degrading Isolates. 224
DMSP lyase coding genes dddD, dddL and dmdA were PCR amplified using the published primer 225
pairs dddDf/dddDr, dddLf/dddLr (Raina et al., 2009) and dmdA primers for subclade A/1, A/2, 226
B/3 and E/2 which contain culturable bacterial dmdA sequences (Varaljay et al., 2010), while the 227
degenerate primer set DddPUf (ATGTTCGACCCGATGAACathmgntaygc) and DddPUr 228
(CCGCACTCCTGGAACcanggrttngt) (Table S4) for dddP were acquired by the j-CODEHOPE 229
designer (Rose et al., 2003; Boyce et al., 2009) based on the ratified DddP sequences in Table S3 230
and the validity of their dddP-targeting property was verified on Ruegeria pomeroyi DSS-3 and 231
Roseovarius nubinhibens ISM as positive controls and sequenced marine strains without dddP in 232
their genomes as negative controls. The PCR system included 250 µM of each 233
deoxyribonucleotide triphosphate and 5 µl of 10 x rTaq buffer containing MgCl2, 0.4 µM of each 234
primer, 1 U of rTaq DNA polymerase of TaKaRa (5 U/µL), ~50 ng bacterial genomic DNA and 235
nuclease-free water to adjust to a final volume of 50 µl. The reaction conditions for dddD and 236
dddL were the same as used by Raina et al. (2009) except that two rounds of PCR (using the 237
product of the first round as template for the second round) were performed to enhance the 238
intensity of the product. For dddP, two rounds of PCR were also performed and the reaction 239
condition for each round was as follows: 95°C for 5 min; followed by 30 cycles of 95°C for 1 min, 240
58°C for 1 min, and 72°C for 40 s; and then a final extension of 72°C for 10 min. PCR products 241
were visualized by electrophoresis on 1% agarose gel, purified by TIANgel Mini Purification Kit 242
(TIANGEN Biotech, Beijing), then cloned into the pUCm-T (TaKaRa) and sequenced by M13F 243
primer (Table S4) using an automated DNA sequencer (model ABI3730; Applied BioSystems) at 244
BGI, Qingdao, China. All PCR amplicons were subjected to BLASTx analysis against the RefSeq 245
database and hits were counted as encoding functional Ddd or DmdA sequence if the they were 246
most similar, ≥ 68% amino acid identity, to ratified Ddd or DmdA enzymes. 247
Genomic sequencing of two representative Actinobacteria 248
Genomic DNA of Microbacterium sp. ZYF042 and Agrococcus sp. LZB059 were extracted using 249
E.Z.N.A. Bacterial DNA kit (Omega). Genome sequencing was performed by Shanghai Majorbio 250
Bio-Pharm Technology Co. (China) using the Illumina HiSeq 2000 sequencer system with a 500 251
8
bp pair-end library. The reads were assembled using SOAPdenovo v2.04. The genome coverages 252
for strains ZYF042 and LZB059 were 247× and 450×, respectively. Putative genes were 253
identified using Glimmer 3.02. Annotation was performed with BLAST+2.2.24, searching against 254
the National Center for Biotechnology Information (NCBI) Non-Redundant Proteins (NR), 255
Clusters of Orthologous Groups of Proteins (COG), the Kyoto Encyclopedia of Genes and 256
Genomes (KEGG) and Gene ontology (GO) databases, respectively. Ddd and DmdA homologue 257
searching was performed by BLASTP analysis with verified Ddd sequences as query sequences, 258
as above (Table S3). 259
Cloning and Expression of Predicted ddd-like genes 260
The predicted dddL gene of Ahrensia LZD062 and dddD-like gene of Microbacterium ZYFD042 261
were amplified from their genomic DNA and ligated into the pET24a (+) vector (Novagen), 262
transformed into E.coli BL21 (DE3) and incubated at 37oC in Luria-Bertani (LB) complete 263
medium (Sambrook et al., 1989) supplemented with 100 µg ml-1 kanamycin. At the 264
mid-exponential growth phase, isopropyl β-D-1-thiogalactopyranoside (IPTG) was added at a 265
final concentration of 0.1 mM. Cultivation was continued at 16oC and 150 rpm until the cell 266
density reached an OD600 of 1.2. To measure Ddd+ of recombinant E. coli cells, IPTG-induced 267
culture was washed twice by M9 medium (Sambrook et al., 1989), then resuspended in M9 268
medium containing a final concentration of 500 nM DMSP and mixed carbon source as above, 269
following by incubation with shaking in vials at 37°C. After 2 h, DMS was quantified by GC as 270
described above. 271
272
Environmental DNA Extraction, Pyrosequencing and Data Analysis 273
Total DNA of seawater samples were extracted using the method described by Yin et al. (2013) 274
with a modified step to maximize the output, in which a Fast Prep-24 Homogenization System 275
(MP Biomedicals, Irvine, CA, USA) was used to intensify cell lysis at maximum speed for 1 min. 276
The V4-V5 regions of bacterial 16S rRNA gene were amplified with primer sets 515F/907R 277
(Chen et al., 2016) in triplicate and pooled. Pyrosequencing was performed on Illumina MiSeq 278
PE300 platform at Majorbio Bio-Pharm Technology Co., Ltd., Shanghai, China. Chimeras were 279
excluded during assigning OTUs based on 97% similarity level. Taxonomic assignment was 280
against the SILVA database (Release 123) with 80% similarity threshold. Archaeal 16S rRNA 281
gene sequences were removed. After rarefaction to the minimum sequence number for each 282
sample, estimators such as Chao 1’, Shannon indexes, and Good’s coverage were calculated 283
(Table S5). All above analyses were performed via Qiime pipelining (Caporaso et al., 2010). 284
Quantification of dddP, dmdA and 16S rRNA Genes 285
qPCR was performed on StepOne ABI (Applied Biosystems, Foster City, CA, USA). The 286
abundance of dddP was quantified with primer sets dddP_874F/dddP_971R (Table S4) targeting 287
Roseobacter clade (Levine et al., 2012). Seven primer sets designed to target different dmdA 288
subclades (A/1, A/2, B/3, D/1, D/3, C/2, E/2) were used for dmdA quantification (Varaljay et al., 289
2010). Environmental sample SW of P03 were subjected to Sanger sequencing to confirm dmdA 290
and dddP gene specificity. The abundance of 16S rRNA gene was quantified using the primer set 291

9
Eub338F/518R (Yin et al., 2013) (Table S4). All PCR reactions were performed in triplicates in 292
20 µl system using 10 µl 2 × SYBR Premix Ex Taq II (Takara Bio Inc.), 0.4 µl 50 × ROX 293
reference dye, 0.2 – 0.4 µM each primer, 2 µl 1/10 diluted template DNA. The PCR reaction 294
conditions referred to the primer designers. Amplification efficiencies for each gene ranged from 295
0.70 to 0.93, with all R2 values higher than 0.99. The relative abundance of bacterial 296
DMSP-degrading genes was acquired by normalising their copy numbers to the copy number of 297
bacterial 16S rRNA gene. Pearson’s correlation analysis was conducted among environmental 298
parameters, DMSP-degrading gene relative abundance and 16S rRNA gene abundance in 299
pyrosequencing data using R’s Hmisc package. Statistical significance of the differences of 300
functional gene relative abundance and 16S rRNA gene abundance between SW and BW samples 301
were tested by Student t-test. 302
Construction and Analyses of dddP Clone Libraries 303
To study the diversity of dddP, dddP amplicons from different samples with primers designed by 304
Peng et al. (2012) (Table S4) were used to construct clone libraries and the insertions in the vector 305
were sequenced. The procedures were essentially as what described by Yin et al. (2013). The 306
OTUs of dddP was determined with nucleotide similarity of 80% by Mothur. Estimators like 307
Shannon, Simpson indexes and Good’s coverage were calculated (Table S6). Representative 308
sequences of each OTU were translated into protein sequences and used for phylogenetic tree 309
construction as described above with Poisson model. 310
Data Availability 311
Bacterial 16S rRNA gene sequences and accompanying metadata produced from pyrosequencing 312
were deposited in the NCBI Short Read Archive database under accession number SRP138803. 313
Partial 16S rRNA genes of cultivated bacterial isolates were under the GenBank accession 314
numbers KP639130 to KP639182; partial sequences of dddP gene from clone libraries were under 315
accession numbers MH193618 to MH193931; amplified partial dddL genes from cultivated 316
strains were under accession numbers MH193936 to MH193939, amplified dddP genes from 317
cultivated strains were under accession numbers MH193932 to MH193935, amplified dmdA 318
genes from cultivated isolates were under accession numbers MH193940 to MH193947. The 319
Whole Genome Shotgun project of Microbacterium ZYFD042, Agrococcus sp. LZB059 have 320
been deposited at DDBJ/ENA/GenBank under the accession RBZY00000000 and 321
RBZZ00000000 respectively. 322
RESULTS 323
Environmental Characteristics of The ECS Seawater 324
The oceanographic parameters, environmental factors and DMSP/DMS concentrations of the 325
seawater samples were recorded (Table 1). As expected, SW samples had higher Chl a, DMSP 326
and DMS concentrations than BW samples. Coincidently, bacterial numbers, estimated by 16S 327
rRNA gene quantitative PCR (qPCR), were also much higher in SW than in BW samples 328
(three-fold higher in average) (Table S7 and Figure S1). Chl a concentration ranged from 0.03 329
10
µg/L to 5.28 µg/L (average 0.65 µg/L) and showed a negative correlation with longitude/distance 330
from shore (r = -0.78, P < 0.01) and salinity (r = -0.84, P < 0.05) (Figure S2). The average total 331
DMSP (DMSPt) concentration in SW samples was 31.17 nM (ranging from 10.23 nM to 88.42 332
nM), which was ca. four times higher than that in BW samples (average 7.90 nM). Particulate 333
DMSP (DMSPp) accounted for 55.31% to 94.75% (75.76% on average) of the DMSPt. DMS 334
concentrations ranged from 0.89 nM to 5.54 nM (3.06 nM in SW and 1.46 nM in BW on average). 335
These results are consistent with the higher light levels in SW over BW favouring photosynthetic 336
algae which are thought to be the major producers of DMSP. This would in turn result in the 337
higher levels of DMSP substrate observed in SW and ultimately higher microbial DMSP 338
dependent DMS production. 339
Isolation of Marine Bacteria from the ECS Seawater 340
Heterotrophic marine bacteria from sites ME3 and P11 seawater were isolated on MA plates. 341
There was no additional selective pressure applied during the incubation and isolation processes, 342
enabling us to later assess the proportion of cultivable marine bacteria that could catabolise DMSP. 343
In total 211 bacterial strains were isolated and identified from their 16S rRNA gene sequences. 344
These isolates belonged to the phyla Proteobacteria, Actinobacteria, Bacteroidetes or Firmicutes, 345
comprising 37 genera and 54 species (Figure 2). Alphaproteobacteria comprised the largest 346
percentage of bacterial isolates, accounting for 60.66% of the total cultivated bacterial community 347
(73.60% in ME3 and 41.86% in P11). Not surprisingly, Roseobacters were well represented 348
within the isolates, accounting for 29.86% (35.20% in ME3 and 22.09% in P11), while 349
Gammaproteobacteria accounted for 5.2% of the total bacterial isolates (6.40% in ME3 and 350
3.49% in P11). In addition, Actinobacteria (22.33% in total, 12.80% in ME3 and 36.05% in P11), 351
Bacteroidetes (9.95% in total, 4.00% in ME3 and 18.60% in P11), and Firmicutes (1.90% in total, 352
3.20% in ME3 and none in P11) were also represented. Very little is known about DMSP 353
catabolism in any Bacteroidetes, Actinobacteria or Firmicutes and, to our knowledge, none of 354
these bacteria are known to contain functional dmdA or any DMSP lyase genes. 355
DMSP Catabolism by Cultivated Bacterial Strains and their ddd and dmdA genes 356
Fifty-seven representative isolates from the different genera were screened for their ability to 357
utilise DMSP as sole carbon source (Figure 2 and Table S2). Of these bacterial isolates, only 358
alphaproteobacterial strains of the genera Sulfitobacter and Ahrensia, and gammaproteobacterial 359
Halomonas could use DMSP as sole carbon source (Table S8). Some Halomonas isolates, e.g., 360
HTNK1 are known to use DMSP as sole carbon source, cleave DMSP and contain the CoA 361
transferase family DMSP lyase DddD (Todd et al., 2010). We also tested the ability of these 362
strains to degrade DMSP with and without a mixed carbon source. The strains of genera Ahrensia 363
and Halomonas, which only produced DMS from DMSP, had much higher DMS production when 364
only supplied with DMSP as sole carbon source compared to the presence of the mixed carbon 365
sources (Figure S3). The same was true for Sulfitobacter sp. LZD018, which produced 366
comparatively higher levels of MeSH when DMSP was used as sole carbon source. Note the 367
MeSH could not be accurately quantified by the GC method used here, likely due to the highly 368
reactive properties of MeSH. These observations implied that the ability of these strains to 369
11
catabolise DMSP is likely underestimated if catabolism is assayed in the presence of other carbon 370
sources. 371
It is well known that many bacteria containing functional ddd and/or dmdA genes are not able to 372
utilise DMSP as a sole carbon source under lab conditions (Curson et al., 2011b). For this reason, 373
all the representative isolates were tested for their DMSP-dependent DMS (Ddd) and MeSH 374
production (Ddm) when grown in the presence of mixed ‘regular’ carbon sources (0.45% [v/v] 375
glycerol and 0.05% [w/v] glucose). Under this condition, 24 (42.11%) of the tested isolates 376
showed Ddd+ activity (Figure 2, Table 2 and Table S2). 377
378
As expected, the majority of Ddd+ isolates were Proteobacteria of which Alphaproteobacteria 379
dominated (66.67%), including many Roseobacters (accounting for 33.33% of all tested Ddd+ 380
isolates), i.e. Donghicola, Ruegeria, Oceanicola, Paracoccus and Sulfitobacter isolates; some 381
non-Roseobacter strains, like strains of known Ddd+ genera Ahrensia and Labrenzia; and of many 382
other unreported Ddd+ alphaproteobacterial genera Aurantimonas, Erythrobacter, Jiella and 383
Oceanicaulis. Surprisingly, only one gammaproteobacterial strain of Halomonas was shown to be 384
Ddd+, while another Halomonas isolate was not. 385
386
Interestingly, the second largest group (12.28%) of cultivated Ddd+ isolates was Actinobacteria. 387
These included Agrococcus, Brevibacterium, Kytococcus, Microbacterium, Micrococcus and 388
Phycicoccus genera which together accounted for 3.79% of total bacterial isolates. Until now, 389
only members of Rhodococcus and Clostridium genera of gram-positive bacteria isolated from 390
fresh water had been reported to be Ddd+ (Yoch et al., 2001). Furthermore, no functional ddd or 391
dmdA genes have been identified in any gram-positive bacteria. 392
393
Under our conditions, strains of Ahrensia, Oceanicola, Ruegeria, Sulfitobacter, Agrococcus, 394
Micrococcus and Microbacterium showed similar or higher Ddd production rates (> 40 nmol 395
DMS per mg protein per hour) when compared to the positive control strains, i.e. Roseovarius 396
nubinhibens ISM, which contains functional dddQ and dddP genes (Todd et al., 2011), and 397
Oceanimonas doudoroffii J495, which contains functional dddP and dddD genes (Curson et al., 398
2012). The other Ddd+ isolates showed relatively low Ddd production levels (Table 2). 399
400
In contrast to the high proportion isolates shown to be Ddd+, only two alphaproteobacterial strains, 401
Donghicola sp. ZYFB040 (a Roseobacter) and Erythrobacter sp. LZB006, showed detectable 402
Ddm production activity when tested with 1 µM DMSP concentration (Table 2). To exclude the 403
possibility that DMSP added to the ECS isolates was insufficient to produce detectable MeSH 404
levels, incubations with higher DMSP concentrations were conducted (0.5 mM and 5 mM). When 405
exposed to higher DMSP levels, most strains likely to contain dmdA (i.e. dmdA was amplified 406
from their genomic DNA or closely related strains have dmdA homologues in their genomes, see 407
below) showed detectable MeSH production, including Rhodobacteraceae strains Loktanella sp. 408
LZD013, Oceanicola LZD026, Ruegeria ZYFB035 and Sulfitobacter LZD018 and LZD014 409
(Table 2 and Table S2). These strains were considered as DMSP demethylating bacteria. However, 410
alphaproteobacterial strains of Aurantimonas ZYFD019 and Henriciella ZYFB017, and the 411
gram-positive strains of Mycobacterium LZB054 and ZYFD013 (which were shown to contain 412
dmdA by PCR) had no Ddm+ activity even with the increased DMSP concentrations. We tried to 413
quantify the disappearance of DMSP of these strains in addition to the production of MeSH, but 414
12
only R. nubinhibens ISM, the positive control, showed a statistically significant reduction in 415
DMSP levels (P < 0.05) (Table S9). It is possible that these cells were degrading very low levels 416
of DMSP via demethylation, but the MeSH produced from DMSP was quickly incorporated into 417
biomass during the incubation, leaving a MeSH concentration below the MeSH detection limit 418
used here. Thus, the absence of detectable DMSP dependent MeSH production does not 419
necessarily indicate that a strain cannot demethylate DMSP. A similar situation could exist for 420
Ddd in bacteria where DMS produced from DMSP is rapidly transformed, e.g. oxidized to 421
dimethylsulfoxide. It would be interesting to see if the dmdA and/or ddd genes are functional 422
and/or transcribed in strains that contain them but which show no detectable Ddd or Ddm 423
phenotype. 424
425
To further investigate the potential molecular mechanisms of the Ddd and Ddm production in our 426
isolates, we used published dddD, dddL, dmdA primers (Raina et al., 2009; Varaljay et al., 2010) 427
and our newly designed and ratified dddP degenerate primers (Table S4) to screen for the 428
presence of these functional DMSP lyase and demethylase genes in all representative strains 429
(Table 2 and Table S2). dddL homologues were amplified from genomic DNA of Ddd+ 430
Oceanicola sp. LZD010 and LZD026, Sulfitobacter sp. LZD014 and Labrenzia sp. LZB033, 431
displaying 52.90% to 100% amino acid identity to the cupin-containing DddL from Sulfitobacter 432
EE36 (Curson et al., 2008). As expected, dddP homologues were amplified from Ddd+ 433
Sulfitobacter sp. LZD018, Ruegeria sp. ZYFB035 and Donghicola sp. ZYFB040 with 79.68% to 434
88.24% amino acid identity to R. nubinhibens ISM DMSP lyase DddP (Todd et al., 2009). 435
Labrenzia sp. LZB033 possessed DddP homologues, with 35.16% identity to O. doudoroffii J495 436
DddP2 (Curson et al., 2012). For the other isolates, no ddd gene could be amplified by the primers 437
we used. 438
439
When probing the ECS isolates for DMSP demethylase gene dmdA using the published universal 440
dmdA primer sets dmdAU (Varaljay et al., 2010), only Loktanella sp. LZD013, a strain that 441
showed no detectable Ddm+ activity, gave the correct PCR product (Table S2). Given far more of 442
the isolates were expected to contain dmdA, primers specifically targeting dmdA subclades (A/1, 443
A/2, B/3, E/2) were also used (Varaljay et al., 2010). Using these primers, 12.28 % of the 444
representative isolates were shown to contain dmdA and thus the genetic potential to demethylate 445
DMSP (Table S2). dmdA A/2 amplicons likely encoding functional enzymes were detected in 446
Oceanicola, Loktanella, Sulfitobacter and Henriciella isolates, which are genera of 447
Rhodobacteraceae, and surprisingly, dmdA A/2 was also present in one actinobacterium of the 448
genus Mycobacterium. Indeed, a recent metagenomic study suggested that some Actinobacteria 449
can catabolise DMSP via the demethylation pathway and contain dmdA (Mizuno et al., 2015). 450
Gammaproteobacterial E/2 subclade-targeting primers gave no PCR products with any 451
gammaproteobacterial isolate but did from one alphaproteobacterial Aurantimonas strain and 452
another actinobacterium of the genus Mycobacterium. 453
454
Using BLASTp, we interrogated the available genomes of closely related strains that are in the 455
same genera as our 57 representative strains with ratified Ddd lyase sequences (Table S3). DddD, 456
DddL, DddP, DddQ and DddW homologues were found in many of the alphaproteobacterial 457
strains (Table S2). However, no known Ddd homologues were identified in the genomes of 458
bacteria most closely related to the Ddd+ actinobacterial isolates or alphaproteobacterial 459
13
Erythrobacter, Aurantimonas, Jiella and Oceanicaulis isolates. DmdA homologues were present 460
in sequenced genomes of Ahrensia, Labrenzia, Oceanicola, Ruegeria and Sulftobacter strains, but 461
none of our isolates in these genera showed detectable levels of Ddm+ activity. 462
463
Bacterial Community Structure 464
Microbial community analysis was carried out by analysing the diversity of 16S rRNA genes in 465
SW and BW samples from five ECS sites across a transect from inshore to offshore waters. Based 466
on 97% nucleotide identity level at the 16S rRNA gene level, a total of 3089 operational 467
taxonomic units (OTUs) were obtained from 11 seawater samples. In all seawater samples, 468
Alphaproteobacteria (34.31% ± 6.46%) and Gammaproteobacteria (17.70% ± 8.19%), were the 469
most abundant classes (Figure 3). 470
471
The ECS Alphaproteobacteria largely comprised SAR11 clade and Rhodobacterales bacteria 472
which together constituted 79.09% ± 5.25% of total Alphaproteobacteria. SAR11 dominated in 473
almost all sampling sites (22.40% ± 6.88% of the total bacteria) except P03 where 474
Rhodobacterales constituted 26.36% and 12.92% of total bacteria in SW and BW respectively. 475
The relative abundance of Rhodobacterales showed positive correlations with DMS, DMSPt and 476
DMSPp concentrations (r = 0.89, P < 0.01), and Chl a concentration (r = 0.70, P < 0.05). Of all 477
annotated Rhodobacterales, the genera Ruegeria, Sulfitobacter, Paracoccus and Labrenzia, which 478
we find to be Ddd+, represented on average 0.84% ± 0.57%, 0.70 ± 0.41%, 0.70 ± 0.59% and 0.05 479
± 0.04% of the total bacteria (Table 2). The genus Roseovarius, a member of which is also known 480
to catabolise DMSP (González et al., 2003), was also identified and represented 0.63% ± 0.43% 481
of the total bacteria. Consistent with the cultivation results, the above Ddd+ genera represented a 482
large proportion (19.2% to 54.1%) of total Rhodobacteraceae. The Ddd+ genus Aurantimonas 483
was found in most samples (represented 0.04% ± 0.01% of total bacteria) except P05 and BW of 484
P03. Erythrobacter, which had Ddd+ representatives, made up 0.01% to 0.80% of total bacteria 485
(Table 2). Although not isolated in this study, the most abundant genus of SAR11 was Candidatus 486
Pelagibacter, representing 59.17% ± 17.89% of SAR11 clade (10.94% ± 5.65% of total bacteria). 487
SAR11 bacteria contain dmdA and demethylate DMSP (Howard et al., 2006) and many SAR11 488
bacteria also contain dddK and cleave DMSP (Sun et al., 2016). 489
490
Of ECS Gammaproteobacteria, Oceanospirillales (7.37% ± 3.78% of total bacteria) and 491
Alteromonadales (4.70% ± 3.67% of total bacteria) were the dominant orders representing 492
67.76% ± 15.73% of total Gammaproteobacteria. Correspondingly, Halomonas from 493
Oceanospirillales and Alteromonas from Alteromonadales were the most abundant genera 494
representing 0.08% to 1.33%% (1.11% on average) and 0.42% to 3.44% (2.03% on average) of 495
total bacteria, respectively. Halomonas representatives from both our ECS bacterial isolates and 496
an isolate from the macroalgae Ulva lactuca are known to have Ddd+ activity (Todd et al., 2010). 497
However, to our knowledge no Alteromonas isolates have been shown to catabolise DMSP or 498
contain know ddd or dmdA genes. 499
500
Cyanobacteria which are known to import DMSP (Vila-Costa et al., 2006), were abundant in SW 501
14
samples (5.65% to 26.16 %) and were positively correlated with longitude (r = 0.94, P < 0.05). As 502
expected, their abundance decreased in BW samples (ranged from 0.37% to 6.20%) with 503
decreased light levels. At the genus level, Synechococcus made up 9.35% ± 7.58% of total 504
bacteria in SW samples and was the second most abundant genera. To our knowledge, no 505
Cyanobacteria has been shown to catabolise DMSP. Only one sequenced cyanobacterial strain, 506
Synechococcus sp. KORDI-100, and one metagenome assembled Synechococcus genome 507
(Synechococcus sp. TMED20) (Lei et al., 2017) have a putative DMSP lyase gene, this being 508
dddY-like gene. Thus, Cyanobacteria are not believed to be significant DMSP catabolisers. In 509
contrast to Cyanobacteria, Deltaproteobacteria were always more abundant in BW (8.01% ± 510
2.19%) compared to SW samples (2.67% ± 0.95%). Although no Ddd+ or Ddm+ 511
Deltaproteobacteria were isolated in this study likely due to the isolation conditions, 512
Desulfovibrio acrylicus is known to contain a DMSP lyase, likely DddY, and cleave DMSP (Der 513
Maarel et al., 1996; Curson et al., 2011a). 514
The Abundance and Diversity of dmdA and dddP in the ECS Samples 515
The dmdA and dddP genes are the most abundant environmental indicators of DMSP 516
demethylation and cleavage (Curson et al., 2018) and qPCR primers targeting these genes have 517
been designed (Varaljay et al., 2010). These primer sets were used to investigate the abundance of 518
dddP and dmdA in ECS samples. It should be noted that the dmdA primer sets only target about 519
half of known dmdA sequences. 520
521
The relative abundance of DMSP-degrading genes (normalizing ddd and dmdA gene copy 522
numbers to that of the bacterial 16S rRNA gene copy numbers) are shown in Figure 4. As 523
expected, dmdA was abundant in the ECS seawaters, with the total relative abundances of all the 524
dmdA subclades ranging from 2.89 % to 29.88 % (Figure 4A). Apart from BW sample of P12 525
(999 m in depth), the total relative abundance of dmdA subclades was 19.57% on average, and 526
had no significant difference (P > 0.05) between the SW and BW samples, but was positively 527
correlated with temperature (r = 0.72, P < 0.05) (Figure S2). Within samples excluding BW 528
sample of P12, dmdA SAR11 subclades D/1 (2.51 × 10⁶ to 6.56 × 10⁸ copies L-1) and D/3 (1.69 × 529
106 to 4.68 × 10⁸ copies L-1) were the most abundant; SAR11 subclade C/2 (6.89 × 10⁵ to 4.30 × 530
107 copies L-1) was comparatively abundant in the offshore site P12, particularly in the SW and 531
100 m depth samples (with relative abundance of 5.56% and 8.12%, respectively). On average, 532
the relative abundances of Roseobacter subclades A/1 and A/2 were 0.98% and 0.82%, 533
respectively in SW samples, and 0.41% and 1.35%, respectively in BW samples. The relative 534
abundance of Gammaproteobacteria-derived subclade E/2 showed a decreasing trend along the 535
transection from inshore (3.04%) to offshore (0.36%), and negatively correlated with longitude (r 536
= -0.75, P < 0.01) (Figure S2). The dmdA subclade B/3 that is represented by the SAR116 group 537
member ‘Candidatus Puniceispirillum marinum’ (Oh et al., 2010) was more abundant in BW 538
samples (relative abundance of 2.61% on average) than in SW samples (relative abundance of 539
0.94% on average), with P < 0.05. 540
541
It was clear that the genetic potential to cleave DMSP via the DddP DMSP lyase is far less 542
prominent in the ECS samples than that for DMSP demethylation (Figure 4B). This is expected 543
15
and fits with previous metagenomic predictions (Moran et al., 2012). The abundance of dddP 544
ranged from 1.91 × 10⁴ to 2.34 × 10⁸ copies L-1, with an average of 6.03 × 10⁷ copies L-1. Unlike 545
dmdA, the dddP gene was significantly more abundant in all SW samples than in BW samples (P 546
< 0.05). This fits with DMSP cleaving bacteria being most abundant in SW where DMSP 547
concentrations are higher. The relative abundance of dddP was highest in the SW of P03 site 548
(2.95%) and steadily decreased as the sites moved away from land (to 0.244 % in BW of P12), 549
showing a negative correlation with longitude (r = -0.7, P < 0.05), and a positive correlation with 550
Chl a concentration (r = 0.68, P < 0.05) (Figure S2). This data implies that dddP may be more 551
prominent in bacteria that closely associate with phytoplankton, like Rhodobacteraceae. DMS 552
concentration in ECS samples positively correlated with the proportion of the dddP gene in the 553
total DMSP-degrading genes (dddP/total dmdA + dddP) (r = 0.94, P < 0.01) (Figure S2). 554
Although this value does not include other prominent DMSP lyase genes, correlation still implies 555
the competing relationship between DMSP demethylation and cleavage. 556
557
Clone libraries of dddP were constructed from samples of P11, ME3, P03, P05, P10 and P12 558
(except BW samples of ME3 and P12, since no PCR amplicon could be achieved). In total 314 559
clones were sequenced and classified into 13 OTUs (Table S6), among which OTU1, OTU2 and 560
OTU3 were dominant. Most representative OTU sequences were clustered with functional DddP 561
sequences of Roseobacter clade bacteria (Figure 5), except those affiliated in cluster 4 in which 562
representative OTUs were clustered with DddP homologues from uncultured bacteria, including 563
OTU2 (represented 31.53% of total sequences). This implies that uncultured bacteria, likely of the 564
Rhodobacteraceae, make a significant contribution to bacterial DMSP cleavage in the ECS, 565
highlighting the need to combine culture dependent and independent techniques. 566
567
DISCUSSION 568
Bacterial demethylation and lysis of DMSP are important and well-established components of the 569
sulfur cycle in marine environment. This study found that a relatively high proportion (42.11%) 570
of the tested cultivated heterotrophic bacteria had the capacity to cleave DMSP generating DMS. 571
Of course, this is not necessarily reflecting the total bacterial community since the composition of 572
the tested cultivable bacteria is not wholly reflecting the composition of the total cultivable 573
isolates, and moreover, we cannot reliably predict the proportion of uncultivated Ddd+ bacteria via 574
the methods used here. Curson et al. (2018) predicted that ~20% of total bacteria in the OM-RGC 575
metagenomic dataset, mainly apportioned surface ocean bacteria, contain known ddd homologues 576
and thus the genetic potential to cleave DMSP. Although this value is relatively lower than the 577
culture-dependent work presented here, both methods confirmed that Ddd+ bacteria are abundant 578
in the natural marine environment. 579
580
Many of the ECS Ddd+ isolates are of genera whose members have been demonstrated to cleave 581
DMSP and contain known DMSP lyases, including the alphaproteobacterial Ruegeria, Labrenzia, 582
Donghicola, Sulfitobacter, Oceanicola and gammaproteobacterial Halomonas (Curson et al., 583
2008, 2011b). Every Ddd+ roseobacterial isolate and the Labrenzia isolate were found to contain 584
either DddL and/or DddP DMSP lyases that were all very closely related to functionally ratified 585
DMSP lyases (Curson et al., 2008; Todd et al., 2009). The Ahrensia DddL proteins predicted 586
16
from the genome sequence of LZD062 (Liu et al., 2016) was only 46.98% to that of Sulfitobacter 587
EE-36 (Curson et al., 2008), but was cloned and shown to encode a functional DMSP lyase by 588
heterogenous expression in Escherichia coli BL21 (DE3) (140.01 ± 14.63 nmol DMS mg 589
protein-1 h-1). These data extend our knowledge as to what constitutes a functional DddL DMSP 590
lyase protein. 591
592
The Ddd+ alphaproteobacterial isolates in the genera of Jiella and Aurantimonas are in the same 593
Aurantimonadaceae family as Ddd+ Fulvimarina pelagi that contains DddL (Curson et al., 2008). 594
However, both Jiella and Aurantimonas isolates gave no products when probed for dddL, dddP 595
and dddD primers, thus we do not know the identity of the DMSP lyase in these isolates. The 596
Ddd+ Halomonas isolate which could use DMSP as sole carbon source did not give a product 597
with dddD or any other ddd primer sets used. Since Halomonas HTNK1 has dddD, uses DMSP as 598
sole carbon source (Todd et al., 2010), and other sequenced bacteria of this genera contain DddP 599
homologues, it is most likely that the dddD and/or dddP genes in the ECS Halomonas were not 600
captured by the primer sets used. However, it cannot be ruled out that the ECS Halomonas isolate 601
contains other known ddd genes, like dddL, dddQ, dddY or dddW, or even novel ddd gene(s). 602
603
Many Ddd+ isolates from ECS were of genera not reported or even suspected to catabolise DMSP, 604
including Erythrobacter isolates in order Sphingomonadales and many gram-positive 605
Actinobacteria isolates of the Agrococcus, Brevibacterium, Kytococcus, Microbacterium, 606
Micrococcus and Phycicoccus genera. This is the first report of any gram-positive marine 607
actinobacteria making DMS from DMSP. None of the Ddd+ actinobacterial isolates gave any 608
products with the dddL, dddP or dddD primer sets, nor were there any Ddd homologues in the 609
sequenced genomes of closely related bacteria. We sequenced the genomes of two Ddd+ 610
Actinobacteria (Microbacterium ZYFD042 and Agrococcus sp. LZB059, which grew well in 611
MAMS media and also showed relatively high Ddd+ levels), finding only dddD-like gene in the 612
genome of ZYFD042, with 35.64% amino acid similarity to DddD of Marinomonas sp. MWYL1 613
(Todd et al., 2007). When cloned and expressed it in E. coli, this DddD-like enzyme did not 614
cleave DMSP. Thus, it is most likely these bacteria contain novel DMSP lyase enzymes. Future 615
molecular work is required to identify the novel DMSP lyase gene(s). 616
617
In comparison to e.g., SAR11 and Roseobacter bacteria, Ddd+ genera of Actinobacteria were not 618
abundant in the ECS samples and were not detected in all samples (Table 2). Brevibacterium was 619
only seen in SW of P05 (0.01%) and BW of P12 (0.02%). Microbacterium was found in most 620
samples (representing 0.06% ± 0.08% of total bacteria) except in the BW of P03, P05 and P07. 621
Micrococcus was only found in BW and comprised less than 0.01% of total bacteria on average. It 622
is unlikely these Ddd+ Actinobacteria constitute major contributors to DMS production in these 623
environments. Further molecular work on these bacteria is required test these hypotheses. 624
625
Quantification of dmdA subclade genes (normalized to 16S rRNA gene copy numbers) indicated 626
their abundant distribution in both SW (19.53% ± 6.70%) and BW (16.00% ± 8.73%) ECS 627
samples (Figure 4A), although at lower levels than previously reported (~ 60% of bacteria) in the 628
GOS metagenomic data (Howard et al., 2008). This discrepancy may partly be due to the 629
limitation of primer sets that do cover all the dmdA subclades and/or to the selection of 16S rRNA 630
gene as the normalizing gene, since some bacteiral genomes have multiple copies of 16S rRNA 631
17
gene (Cui et al., 2015). Nethertheless, this work confirms that the genetic potential for the 632
bacteiral DMSP demethylation is prevalent in the ECS. Culture dependent work, showed that in 633
the majority of cases where dmdA was found in a bacterium, the said bacterium had detectable 634
MeSH production when grown in the presence of DMSP. However, this was not always the case. 635
Further work involving RNA and/or proteomics on the environmental and pure cultures is 636
required to establish why bacteria, e.g. Aurantimonas ZYFD019, Henriciella ZYFB017, and the 637
gram-positive strains of Mycobacterium LZB054 and ZYFD013, that contain dmdA homologues 638
but do not generate MeSH from DMSP. 639
640
In the transect of ECS studied here, we found that the concentrations of Chl a, DMS and DMSP 641
(in the surface seawater) gradually decreased with the distance to the land (longitude), while the 642
salinity and temperature showed increasing trends (Table 1and Figure S2), which provided us 643
natural environmental gradients to study correlations between bacterial DMSP degradation and 644
environmental factors. The predicted major DMSP-degrading bacterial groups, Rhodobacteraceae 645
and SAR11, showed contradictory changes in relative abundances based on the 16S rRNA gene 646
amplicon sequencing data (Figure S2 H) and had different correlations with Chl a, DMSPt and 647
DMS concentrations (Figure S2). Rhodobacteraceae are normally abundant in coastal 648
environments and associated with oceanic algal blooms (Gonzalez and Moran, 1997; Moran et al., 649
2004; Simo et al., 2000). Their positive correlations with DMS and DMSPt concentrations 650
implied that Rhodobacteraceae might be the major DMS producer from DMSP in the ECS study 651
sites. However, since some phytoplankton directly cleave DMSP to DMS, the correlations might 652
also be due to the association of Rhodobacteraceae and phytoplankton (Figure S2 I-K). SAR11 653
bacteria are widely distributed in marine seawaters and particularly abundant in the open ocean 654
where relatively low DMSP concentrations exist (Giovannoni, 2005, 2017). SAR11 bacteria lack 655
a sulfur reductase and require reduced organosulfur compounds, like DMSP, in surrounding 656
seawater (Tripp et al., 2008). The negative correlation between SAR11 and DMS, DMSPt 657
concentrations implies that SAR11 are not significant contributions to DMS production from 658
DMSP in the studied areas of the ECS (Figure S2 L-N). Although, it should be noted that standing 659
stock concentrations of DMSP and DMS are not always good indicators of activity. The positive 660
correlation between DMS and DMSP concentrations with the total relative abundance of dmdA 661
SAR11 subclade D1 and D3 (r = 0.72, P < 0.05) (Figure S2 O) implies that SAR11 might degrade 662
DMSP mainly through the demethylation pathway. 663
664
Overall, using culture-dependent methods, we identify DMSP catabolising bacterial taxa in the 665
ECS, many of which are novel gram-positive DMSP-cleaving Actinobacteria. This further 666
extends the phylogenetic territory of marine microorganisms that can carry out this globally 667
influential process. The work provides necessary model organisms to discover novel pathway(s) 668
and gene(s) for DMSP degradation. Also, through culture-independent methods, we find a high 669
proportion of ECS bacteria have the genetic potential to catabolise DMSP, and highlight 670
heterotrophic Alphaproteobacteria, particularly SAR11 and Roseobacter bacteria, as key 671
degraders. Further work studying the activity and regulation of key DMSP lyase and demethylase 672
genes in this environment will shed light on the relative contribution of these two competing 673
pathways. 674
18
ACKNOWLEDGEMENTS 675
We thank all the scientists and crew members on the R/V ‘Dong Fang Hong 2’ during the 676
expeditions for their great efforts and help in sample collection. This work was financially 677
supported by the National Natural Science Foundation of China (91751202, 41521064 and 678
41730530), the National Key Research and Development Program of China (2016YFA0601303) 679
in XZ’s lab, and the NE/N002385/1 and NE/P012671/1 NERC-funded grants in JT’s lab. 680
AUTHOR CONTRIBUTIONS 681
XZ and JT designed the experiments and wrote the manuscript. JLL and JL collected samples, 682
performed experiments and wrote the manuscript. SZ, GY performed experiments (DMS 683
measurement on GC, Chl a concentration measurement). JCL helped to performed experiments 684
(qPCR and clone library construction). HL conducted BLASTp analysis of DmdA and Ddd 685
homologues in genomes of taxonomically related strains to Ddd+ bacterial isolates. DS performed 686
the PCR amplicon of ddd and dmdA from genomic DNA of all the tested bacterial isolates. 687
REFERENCES 688
Alcolombri, U., Ben-Dor, S., Feldmesser, E., Levin, Y., Tawfik, D.S., and Vardi, A. (2015). 689
Identification of the algal dimethyl sulfide-releasing enzyme: A missing link in the marine 690
sulfur cycle. Science 348, 1466–1469. doi:10.1126/science.aab1586. 691
Andreae, M. O. (1990). Ocean-atmosphere interactions in the global biogeochemical sulfur cycle. 692
Mar. Chem. 30, 1–29. doi:10.1016/0304-4203(90)90059-L. 693
Ansede, J. H., Friedman, R., and Yoch, D. C. (2001). Phylogenetic analysis of culturable dimethyl 694
sulfide-producing bacteria from a spartina-dominated salt marsh and estuarine water. Appl. 695
Environ. Microbiol. 67, 1210–1217. doi:10.1128/AEM.67.3.1210-1217.2001. 696
Baumann, P. and Baumann, L. (Springer, 1981). The Prokaryotes: A Handbook on Habitats, 697
Isolation and Identification of Bacteria (eds Starr, M. P., Stolp, H., Trüper, H. G., Balows, A. 698
& Schlegel, H. G.) 1302–1331. 699
Boyce, R., Chilana, P., and Rose, T. M. (2009). iCODEHOP: a new interactive program for 700
designing COnsensus-DEgenerate Hybrid Oligonucleotide Primers from multiply aligned 701
protein sequences. Nucleic Acids Res. 37, W222–W228. doi:10.1093/nar/gkp379. 702
Caporaso, J. G., Kuczynski, J., Stombaugh, J., Bittinger, K., Bushman, F. D., Costello, E. K., et al. 703
(2010). QIIME allows analysis of high-throughput community sequencing data. Nat. 704
Methods 7, 335–336. doi:10.1038/nmeth.f.303. 705
Chen, H., Zhang, H., Xiong, J., Wang, K., Zhu, J., Zhu, X., et al. (2016). Successional trajectories 706
of bacterioplankton community over the complete cycle of a sudden phytoplankton bloom in 707
the Xiangshan Bay, East China Sea. Environ. Pollut. 219, 750–759. 708
doi:10.1016/J.ENVPOL.2016.07.035. 709
Cui, Y., Suzuki, S., Omori, Y., Wong, S.-K., Ijichi, M., Kaneko, R., et al. (2015). Abundance and 710
distribution of dimethylsulfoniopropionate degradation genes and the corresponding 711
bacterial community structure at dimethyl sulfide hot spots in the tropical and subtropical 712
pacific ocean. Appl. Environ. Microbiol. 81, 4184–4194. doi:10.1128/AEM.03873-14. 713
19
Curson, A. R. J., Fowler, E. K., Dickens, S., Johnston, A. W. B., and Todd, J. D. (2012). Multiple 714
DMSP lyases in the γ-proteobacterium Oceanimonas doudoroffii. Biogeochemistry 110, 715
109–119. doi:10.1007/s10533-011-9663-2. 716
Curson, A. R. J., Liu, J., Bermejo Martínez, A., Green, R. T., Chan, Y., Carrión, O., et al. (2017). 717
Dimethylsulfoniopropionate biosynthesis in marine bacteria and identification of the key 718
gene in this process. Nat. Microbiol. 2, 17009. doi:10.1038/nmicrobiol.2017.9. 719
Curson, A. R. J., Rogers, R., Todd, J. D., Brearley, C. A., and Johnston, A. W. B. (2008). 720
Molecular genetic analysis of a dimethylsulfoniopropionate lyase that liberates the 721
climate-changing gas dimethylsulfide in several marine α-proteobacteria and Rhodobacter 722
sphaeroides. Environ. Microbiol. 10, 757–767. doi:10.1111/j.1462-2920.2007.01499.x. 723
Curson, A. R. J., Sullivan, M. J., Todd, J. D., and Johnston, A. W. B. (2011a). DddY, a 724
periplasmic dimethylsulfoniopropionate lyase found in taxonomically diverse species of 725
Proteobacteria. ISME J. 5, 1191–1200. doi:10.1038/ismej.2010.203. 726
Curson, A. R. J., Todd, J. D., Sullivan, M. J., and Johnston, A. W. B. (2011b). Catabolism of 727
dimethylsulphoniopropionate: microorganisms, enzymes and genes. Nat. Rev. Microbiol. 9, 728
849–859. doi:10.1038/nrmicro2653. 729
Curson, A. R. J., Williams, B. T., Pinchbeck, B. J., Sims, L. P., Martínez, A. B., Rivera, P. P. L., 730
et al. (2018). DSYB catalyses the key step of dimethylsulfoniopropionate biosynthesis in 731
many phytoplankton. Nat. Microbiol. 3, 430–439. doi:10.1038/s41564-018-0119-5. 732
Der Maarel, M. J. E. C., Aukema, W., and Hansen, T. A. (1996). Purification and characterization 733
of a dimethylsulfoniopropionate cleaving enzyme from Desulfovibrio acrylicus. FEMS 734
Microbiol. Lett. 143, 241–245. doi:10.1111/j.1574-6968.1996.tb08487.x. 735
Giovannoni, S. J. (2005). Genome Streamlining in a Cosmopolitan Oceanic Bacterium. Science 736
(80-. ). 309, 1242–1245. doi:10.1126/science.1114057. 737
Giovannoni, S. J. (2017). SAR11 Bacteria: The Most Abundant Plankton in the Oceans. Ann. Rev. 738
Mar. Sci. 9, 231–255. doi:10.1146/annurev-marine-010814-015934. 739
González, J. M., Covert, J. S., Whitman, W. B., Henriksen, J. R., Mayer, F., Scharf, B., et al. 740
(2003). Silicibacter pomeroyi sp. nov. and Roseovarius nubinhibens sp. nov., 741
dimethylsulfoniopropionate-demethylating bacteria from marine environments. Int. J. Syst. 742
Evol. Microbiol. 53, 1261–1269. doi:10.1099/ijs.0.02491-0. 743
González, J.M., Kiene, R.P., and Moran, M.A. (1999) Transformation of Sulfur Compounds by 744
an Abundant Lineage of Marine Bacteria in the α-Subclass of the ClassProteobacteria. Appl. 745
Environ. Microbiol. 65: 3810–3819. 746
Gonzalez, J. M., and Moran, M. A. (1997). Numerical dominance of a group of marine bacteria in 747
the alpha-subclass of the clas Proteobacteria in coastal seawater. Appl. Environ. Microbiol. 748
63, 4237–4242. 749
Hatton, A. D., Shenoy, D. M., Hart, M. C., Mogg, A., and Green, D. H. (2012). Metabolism of 750
DMSP, DMS and DMSO by the cultivable bacterial community associated with the 751
DMSP-producing dinoflagellate Scrippsiella trochoidea. Biogeochemistry 110, 131–146. 752
doi:10.1007/s10533-012-9702-7. 753
Howard, E. C., Henriksen, J. R., Buchan, A., Reisch, C. R., Bürgmann, H., Welsh, R., et al. 754
(2006). Bacterial taxa that limit sulfur flux from the ocean. Science 314, 649–652. 755
doi:10.1126/science.1130657. 756
Howard, E. C., Sun, S., Biers, E. J., and Moran, M. A. (2008). Abundant and diverse bacteria 757
involved in DMSP degradation in marine surface waters. Environ. Microbiol. 10, 2397–2410. 758
20
doi:10.1111/j.1462-2920.2008.01665.x. 759
Johnston, A. W. B. (2015). Who can cleave DMSP? Science 348, 1430–1431. 760
doi:10.1126/science.aac5661. 761
Johnson, W.M., Kido Soule, M.C., and Kujawinski, E.B. (2016) Evidence for quorum sensing 762
and differential metabolite production by a marine bacterium in response to DMSP. ISME J. 763
10: 2304–2316. doi:10.1038/ismej.2016.6. 764
Johnston, A. W., Green, R. T., and Todd, J. D. (2016). Enzymatic breakage of 765
dimethylsulfoniopropionate — a signature molecule for life at sea. Curr. Opin. Chem. Biol. 766
31, 58–65. doi:10.1016/J.CBPA.2016.01.011. 767
Kageyama, H., Tanaka, Y., Shibata, A., Waditee-Sirisattha, R., and Takabe, T. (2018). 768
Dimethylsulfoniopropionate biosynthesis in a diatom Thalassiosira pseudonana: 769
Identification of a gene encoding MTHB-methyltransferase. Arch. Biochem. Biophys. 645, 770
100–106. doi:10.1016/J.ABB.2018.03.019. 771
Kiene, R. P., and Linn, L. J. (2000). The fate of dissolved dimethylsulfoniopropionate (DMSP) in 772
seawater: tracer studies using 35S-DMSP. Geochim. Cosmochim. Acta 64, 2797–2810. 773
doi:10.1016/S0016-7037(00)00399-9. 774
Kiene, R. P., and Slezak, D. (2006). Low dissolved DMSP concentrations in seawater revealed by 775
small-volume gravity filtration and dialysis sampling. Limnol. Oceanogr. Methods 4, 80–95. 776
doi:10.4319/lom.2006.4.80. 777
Ksionzek, K. B., Lechtenfeld, O. J., McCallister, S. L., Schmitt-Kopplin, P., Geuer, J. K., Geibert, 778
W., et al. (2016). Dissolved organic sulfur in the ocean: Biogeochemistry of a petagram 779
inventory. Science 354, 456–459. doi:10.1126/science.aaf7796. 780
Lane, D. J. (1991). 16S/23S rRNA sequencing. Nucleic acid Tech. Bact. Syst. Available at: 781
https://ci.nii.ac.jp/naid/10005795102/ [Accessed April 15, 2018]. 782
Lei, L., Alcolombri, U., and Tawfik, D. S. (2017). DddY is a bacterial 783
dimethylsulfoniopropionate lyase representing a new cupin enzyme superfamily with 784
unknown primary function. bioRxiv, 161257. doi:10.1101/161257. 785
Levine, N. M., Varaljay, V. A., Toole, D. A., Dacey, J. W. H., Doney, S. C., and Moran, M. A. 786
(2012). Environmental, biochemical and genetic drivers of DMSP degradation and DMS 787
production in the Sargasso Sea. Environ. Microbiol. 14, 1210–1223. 788
doi:10.1111/j.1462-2920.2012.02700.x. 789
Liu, J., Wang, Y., Liu, Y., and Zhang, X.-H. (2016). Ahrensia marina sp. nov., a 790
dimethylsulfoniopropionate-cleaving bacterium isolated from seawater, and emended 791
descriptions of the genus Ahrensia and Ahrensia kielensis. Int. J. Syst. Evol. Microbiol. 66, 792
874–880. doi:10.1099/ijsem.0.000805. 793
Mizuno, C. M., Rodriguez-Valera, F., and Ghai, R. (2015). Genomes of planktonic 794
Acidimicrobiales: widening horizons for marine Actinobacteria by metagenomics. MBio 6, 795
e02083-14. doi:10.1128/mBio.02083-14. 796
Moran, M. A., Buchan, A., González, J. M., Heidelberg, J. F., Whitman, W. B., Kiene, R. P., et al. 797
(2004). Genome sequence of Silicibacter pomeroyi reveals adaptations to the marine 798
environment. Nature 432, 910–913. doi:10.1038/nature03170. 799
Moran, M. A., Reisch, C. R., Kiene, R. P., and Whitman, W. B. (2012). Genomic Insights into 800
Bacterial DMSP Transformations. Annu. Rev. Mar. Sci 4, 523–42. 801
doi:10.1146/annurev-marine-120710-100827. 802
Oh, H.-M., Kwon, K. K., Kang, I., Kang, S. G., Lee, J.-H., Kim, S.-J., et al. (2010). Complete 803
21
genome sequence of "Candidatus Puniceispirillum marinum" IMCC1322, a 804
representative of the SAR116 clade in the Alphaproteobacteria. J. Bacteriol. 192, 3240–3241. 805
doi:10.1128/JB.00347-10. 806
Otte, M. L., Wilson, G., Morris, J. T., and Moran, B. M. (2004). Dimethylsulphoniopropionate 807
(DMSP) and related compounds in higher plants. J. Exp. Bot. 55, 1919–1925. 808
doi:10.1093/jxb/erh178. 809
Parsons, T., Maita, Y., and Lalli, C. (1984) Manual of chemical and biological methods for 810
seawater analysis. Oxford: Pergamon Press. 811
Peng, M., Xie, Q., Hu, H., Hong, K., Todd, J. D., Johnston, A. W. B., et al. (2012). Phylogenetic 812
diversity of the dddP gene for dimethylsulfoniopropionate-dependent dimethyl sulfide 813
synthesis in mangrove soils. Can. J. Microbiol. doi:10.1139/w2012-019. 814
Raina, J.-B., Tapiolas, D.M., Forêt, S., Lutz, A., Abrego, D., Ceh, J., et al. (2013). DMSP 815
biosynthesis by an animal and its role in coral thermal stress response. Nature 502, 677–680. 816
doi :10.1038/nature12677. 817
Raina, J.-B., Tapiolas, D., Willis, B. L., and Bourne, D. G. (2009). Coral-associated bacteria and 818
their role in the biogeochemical cycling of sulfur. Appl. Environ. Microbiol. 75, 3492–3501. 819
doi:10.1128/AEM.02567-08. 820
Reed, R. H. (1983). Measurement of osmotic significance of beta-dimethylsulphoniopropionate in 821
marine macroalgae. Mar. Biol. Lett. 822
Reisch, C. R., Moran, M. A., and Whitman, W. B. (2011). Bacterial Catabolism of 823
Dimethylsulfoniopropionate (DMSP). Front. Microbiol. 2, 172. 824
doi:10.3389/fmicb.2011.00172. 825
Rose, T., Henikoff, J. G., and Henikoff, S. (2003). CODEHOP (COnsensus-DEgenerate Hybrid 826
Oligonucleotide Primer) PCR primer design. Nucleic Acids Res. 31, 3763–3766. 827
doi:10.1093/nar/gkg524. 828
Sambrook, J., Fritsch, E. F. and Maniatis, T. (1989). Molecular Cloning, A Laboratory Manual 829
2nd edn, Vol. 3. Cold Spring Harbor Laboratory Press. 830
Schlitzer, R. (2002). Interactive analysis and visualization of geoscience data with Ocean Data 831
View. Comput. Geosci. 28, 1211–1218. doi:10.1016/S0098-3004(02)00040-7. 832
Seymour, J. R., Simó, R., Ahmed, T., and Stocker, R. (2010). Chemoattraction to 833
dimethylsulfoniopropionate throughout the marine microbial food web. Science 329, 834
342–345. doi:10.1126/science.1188418. 835
Simo, R., Casamayor, E. O., Pedro, C., and Moran, M. a N. N. (2000). Bacterial community 836
structure associated with a North Atlantic algal bloom. Appl. Environ. Microbiol. 66, 837
4237–4246. doi:10.1128/AEM.66.10.4237-4246. 838
Stefels, J. (2000). Physiological aspects of the production and conversion of DMSP in marine 839
algae and higher plants. J. Sea Res. 43, 183–197. doi:10.1016/S1385-1101(00)00030-7. 840
Sun, J., Todd, J. D., Thrash, J. C., Qian, Y., Qian, M. C., Temperton, B., et al. (2016). The 841
abundant marine bacterium Pelagibacter simultaneously catabolizes 842
dimethylsulfoniopropionate to the gases dimethyl sulfide and methanethiol. Nat. Microbiol. 843
1, 16065. doi:10.1038/nmicrobiol.2016.65. 844
Sunda, W., Kieber, D. J., Kiene, R. P., and Huntsman, S. (2002). An antioxidant function for 845
DMSP and DMS in marine algae. Nature 418, 317–320. doi:10.1038/nature00851. 846
Tamura, K., Peterson, D., Peterson, N., Stecher, G., Nei, M., and Kumar, S. (2011). MEGA5: 847
Molecular Evolutionary Genetics Analysis Using Maximum Likelihood, Evolutionary 848
22
Distance, and Maximum Parsimony Methods. Mol. Biol. Evol. 28, 2731–2739. 849
doi:10.1093/molbev/msr121. 850
Thompson, J., Gibson, T. J., Plewniak, F., Jeanmougin, F., and Higgins, D. G. (1997). The 851
CLUSTAL_X windows interface: flexible strategies for multiple sequence alignment aided 852
by quality analysis tools. Nucleic Acids Res. 25, 4876–4882. doi:10.1093/nar/25.24.4876. 853
Todd, J. D., Curson, A. R. J., Dupont, C. L., Nicholson, P., and Johnston, A. W. B. (2009). The 854
dddP gene, encoding a novel enzyme that converts dimethylsulfoniopropionate into dimethyl 855
sulfide, is widespread in ocean metagenomes and marine bacteria and also occurs in some 856
Ascomycete fungi. Environ. Microbiol. 11, 1376–1385. 857
doi:10.1111/j.1462-2920.2009.01864.x. 858
Todd, J. D., Curson, A. R. J., Kirkwood, M., Sullivan, M. J., Green, R. T., and Johnston, A. W. B. 859
(2011). DddQ, a novel, cupin-containing, dimethylsulfoniopropionate lyase in marine 860
roseobacters and in uncultured marine bacteria. Environ. Microbiol. 13, 427–438. 861
doi:10.1111/j.1462-2920.2010.02348.x. 862
Todd, J. D., Curson, A. R. J., Nikolaidou-Katsaraidou, N., Brearley, C. A., Watmough, N. J., 863
Chan, Y., et al. (2010). Molecular dissection of bacterial acrylate catabolism - unexpected 864
links with dimethylsulfoniopropionate catabolism and dimethyl sulfide production. Environ. 865
Microbiol. 12, 327–343. doi:10.1111/j.1462-2920.2009.02071.x. 866
Todd, J. D., Rogers, R., Li, Y. G., Wexler, M., Bond, P. L., Sun, L., et al. (2007). Structural and 867
regulatory genes required to make the gas dimethyl sulfide in bacteria. Science 315, 666–9. 868
doi:10.1126/science.1135370. 869
Tripp, H. J., Kitner, J. B., Schwalbach, M. S., Dacey, J. W. H., Wilhelm, L. J., and Giovannoni, S. 870
J. (2008). SAR11 marine bacteria require exogenous reduced sulphur for growth. Nature 452, 871
741–744. doi:10.1038/nature06776. 872
Vallina, S. M., and Simó, R. (2007). Strong relationship between DMS and the solar radiation 873
dose over the global surface ocean. Science 315, 506–508. doi:10.1126/science.1133680. 874
Varaljay, V. A., Gifford, S. M., Wilson, S. T., Sharma, S., Karl, D. M., and Moran, M. A. (2012). 875
Bacterial dimethylsulfoniopropionate degradation genes in the oligotrophic north pacific 876
subtropical gyre. Appl. Environ. Microbiol. 78, 2775–2782. doi:10.1128/AEM.07559-11. 877
Varaljay, V. A., Howard, E. C., Sun, S., and Moran, M. A. (2010). Deep sequencing of a 878
dimethylsulfoniopropionate-degrading gene (dmdA) by using PCR primer pairs designed on 879
the basis of marine metagenomic data. Appl. Environ. Microbiol. 76, 609–617. 880
doi:10.1128/AEM.01258-09. 881
Vila-Costa, M., Simó, R., Harada, H., Gasol, J. M., Slezak, D., and Kiene, R. P. (2006). 882
Dimethylsulfoniopropionate uptake by marine phytoplankton. Science 314, 652–654. 883
doi:10.1126/science.1131043. 884
Vila, M., Simó, R., Kiene, R. P., Pinhassi, J., González, J. M., Moran, M. A., et al. (2004). Use of 885
microautoradiography combined with fluorescence in situ hybridization to determine 886
dimethylsulfoniopropionate incorporation by marine bacterioplankton taxa. Appl. Environ. 887
Microbiol. 70, 4648–4657. doi:10.1128/AEM.70.8.4648-4657.2004. 888
Wolfe, G. V., Steinke, M., and Kirst, G. O. (1997). Grazing-activated chemical defence in a 889
unicellular marine alga. Nature 387, 894–897. doi:10.1038/43168. 890
Yang, G.-P., Zhang, H.-H., Zhou, L.-M., and Yang, J. (2011). Temporal and spatial variations of 891
dimethylsulfide (DMS) and dimethylsulfoniopropionate (DMSP) in the East China Sea and 892
the Yellow Sea. Cont. Shelf Res. 31, 1325–1335. doi:10.1016/J.CSR.2011.05.001. 893
23
Yin, Q., Fu, B., Li, B., Shi, X., Inagaki, F., and Zhang, X.-H. (2013). Spatial Variations in 894
Microbial Community Composition in Surface Seawater from the Ultra-Oligotrophic Center 895
to Rim of the South Pacific Gyre. PLoS One 8, e55148. doi:10.1371/journal.pone.0055148. 896
Yoch, D. C., Carraway, R. H., Friedman, R., and Kulkarni, N. (2001). Dimethylsulfide (DMS) 897
production from dimethylsulfoniopropionate by freshwater river sediments: phylogeny of 898
Gram-positive DMS-producing isolates. FEMS Microbiol. Ecol. 37, 31–37. 899
doi:10.1111/j.1574-6941.2001.tb00850.x. 900
Zeng, Y.-X., Qiao, Z.-Y., Yu, Y., Li, H.-R., and Luo, W. (2016). Diversity of bacterial 901
dimethylsulfoniopropionate degradation genes in surface seawater of Arctic Kongsfjorden. 902
Sci. Rep. 6, 33031. doi:10.1038/srep33031. 903
Zhang, S.-H., Yang, G.-P., Zhang, H.-H., and Yang, J. (2014). Spatial variation of biogenic sulfur 904
in the south Yellow Sea and the East China Sea during summer and its contribution to 905
atmospheric sulfate aerosol. Sci. Total Environ. 488–489, 157–167. 906
doi:10.1016/J.SCITOTENV.2014.04.074. 907
908
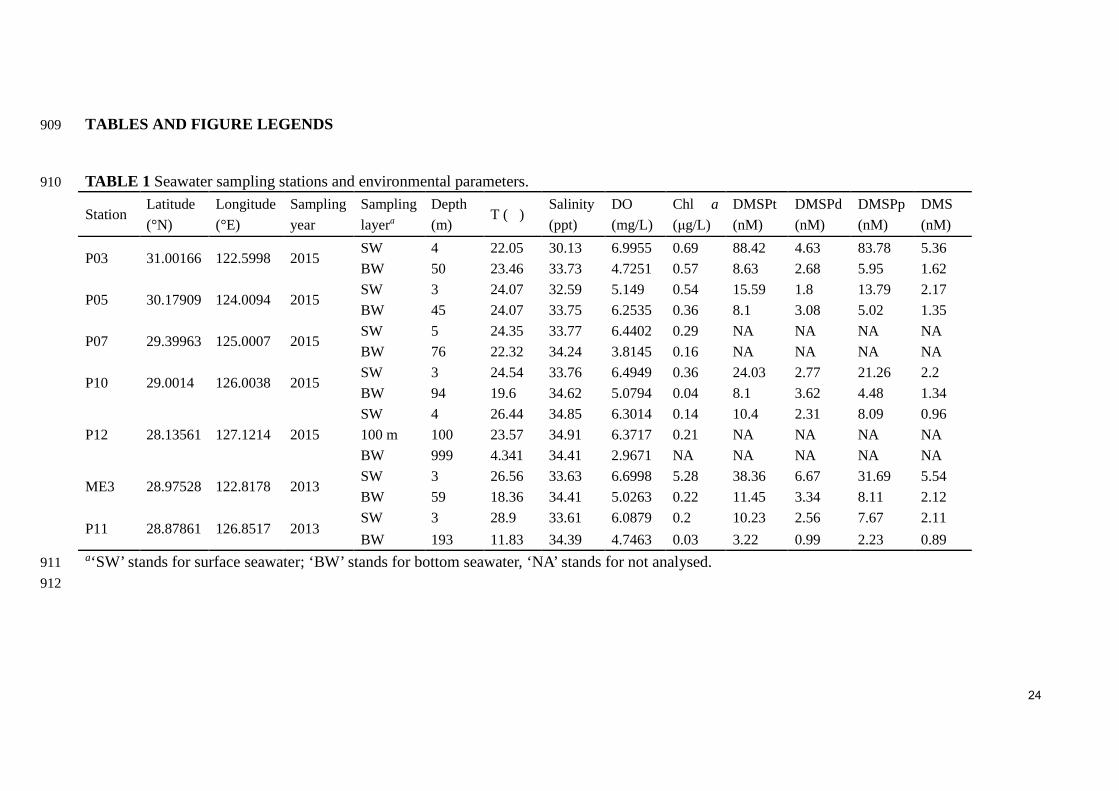
24
TABLES AND FIGURE LEGENDS 909
TABLE 1 Seawater sampling stations and environmental parameters. 910
Station Latitude
(°N)
Longitude
(°E)
Sampling
year
Sampling
layera
Depth
(m) T (℃)
Salinity
(ppt)
DO
(mg/L)
Chl a
(µg/L)
DMSPt
(nM)
DMSPd
(nM)
DMSPp
(nM)
DMS
(nM)
P03 31.00166 122.5998 2015 SW 4 22.05 30.13 6.9955 0.69 88.42 4.63 83.78 5.36
BW 50 23.46 33.73 4.7251 0.57 8.63 2.68 5.95 1.62
P05 30.17909 124.0094 2015 SW 3 24.07 32.59 5.149 0.54 15.59 1.8 13.79 2.17
BW 45 24.07 33.75 6.2535 0.36 8.1 3.08 5.02 1.35
P07 29.39963 125.0007 2015 SW 5 24.35 33.77 6.4402 0.29 NA NA NA NA
BW 76 22.32 34.24 3.8145 0.16 NA NA NA NA
P10 29.0014 126.0038 2015 SW 3 24.54 33.76 6.4949 0.36 24.03 2.77 21.26 2.2
BW 94 19.6 34.62 5.0794 0.04 8.1 3.62 4.48 1.34
P12 28.13561 127.1214 2015
SW 4 26.44 34.85 6.3014 0.14 10.4 2.31 8.09 0.96
100 m 100 23.57 34.91 6.3717 0.21 NA NA NA NA
BW 999 4.341 34.41 2.9671 NA NA NA NA NA
ME3 28.97528 122.8178 2013 SW 3 26.56 33.63 6.6998 5.28 38.36 6.67 31.69 5.54
BW 59 18.36 34.41 5.0263 0.22 11.45 3.34 8.11 2.12
P11 28.87861 126.8517 2013 SW 3 28.9 33.61 6.0879 0.2 10.23 2.56 7.67 2.11
BW 193 11.83 34.39 4.7463 0.03 3.22 0.99 2.23 0.89 a‘SW’ stands for surface seawater; ‘BW’ stands for bottom seawater, ‘NA’ stands for not analysed. 911
912
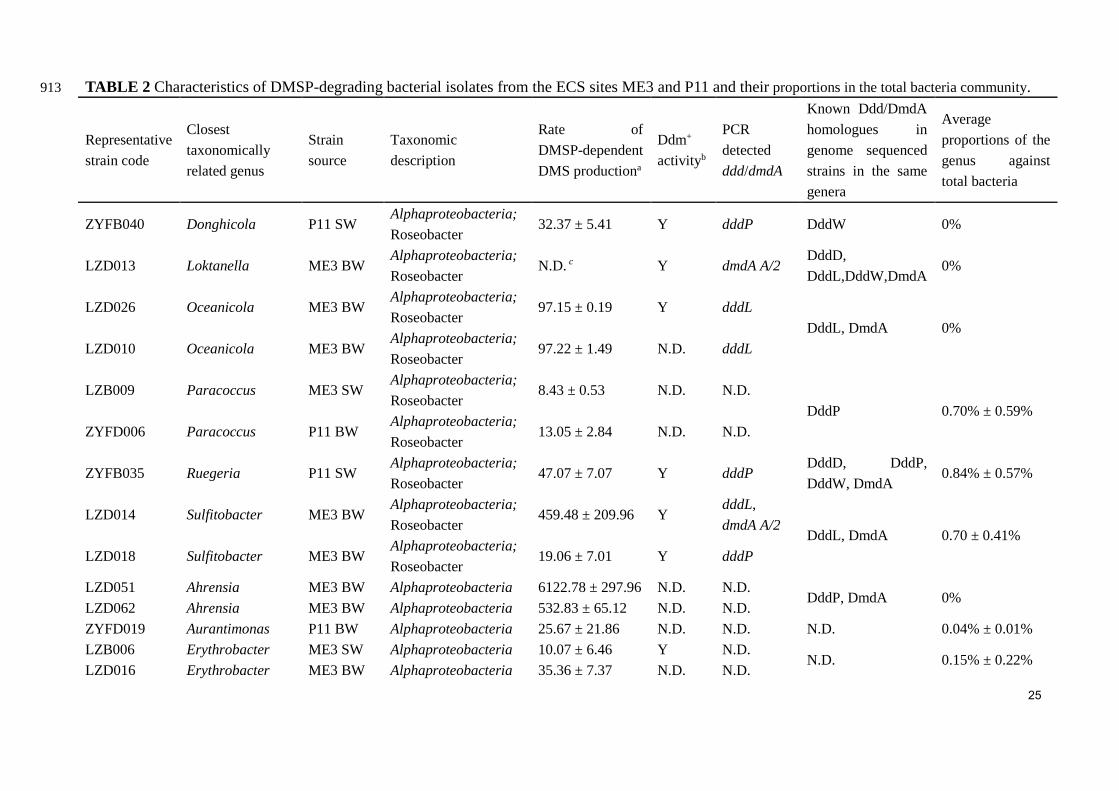
25
TABLE 2 Characteristics of DMSP-degrading bacterial isolates from the ECS sites ME3 and P11 and their proportions in the total bacteria community. 913
Representative
strain code
Closest
taxonomically
related genus
Strain
source
Taxonomic
description
Rate of
DMSP-dependent
DMS productiona
Ddm+
activityb
PCR
detected
ddd/dmdA
Known Ddd/DmdA
homologues in
genome sequenced
strains in the same
genera
Average
proportions of the
genus against
total bacteria
ZYFB040 Donghicola P11 SW Alphaproteobacteria;
Roseobacter 32.37 ± 5.41 Y dddP DddW 0%
LZD013 Loktanella ME3 BW Alphaproteobacteria;
Roseobacter N.D. c Y dmdA A/2
DddD,
DddL,DddW,DmdA 0%
LZD026 Oceanicola ME3 BW Alphaproteobacteria;
Roseobacter 97.15 ± 0.19 Y dddL
DddL, DmdA 0%
LZD010 Oceanicola ME3 BW Alphaproteobacteria;
Roseobacter 97.22 ± 1.49 N.D. dddL
LZB009 Paracoccus ME3 SW Alphaproteobacteria;
Roseobacter 8.43 ± 0.53 N.D. N.D.
DddP 0.70% ± 0.59%
ZYFD006 Paracoccus P11 BW Alphaproteobacteria;
Roseobacter 13.05 ± 2.84 N.D. N.D.
ZYFB035 Ruegeria P11 SW Alphaproteobacteria;
Roseobacter 47.07 ± 7.07 Y dddP
DddD, DddP,
DddW, DmdA 0.84% ± 0.57%
LZD014 Sulfitobacter ME3 BW Alphaproteobacteria;
Roseobacter 459.48 ± 209.96 Y
dddL,
dmdA A/2 DddL, DmdA 0.70 ± 0.41%
LZD018 Sulfitobacter ME3 BW Alphaproteobacteria;
Roseobacter 19.06 ± 7.01 Y dddP
LZD051 Ahrensia ME3 BW Alphaproteobacteria 6122.78 ± 297.96 N.D. N.D. DddP, DmdA 0%
LZD062 Ahrensia ME3 BW Alphaproteobacteria 532.83 ± 65.12 N.D. N.D.
ZYFD019 Aurantimonas P11 BW Alphaproteobacteria 25.67 ± 21.86 N.D. N.D. N.D. 0.04% ± 0.01%
LZB006 Erythrobacter ME3 SW Alphaproteobacteria 10.07 ± 6.46 Y N.D. N.D. 0.15% ± 0.22%
LZD016 Erythrobacter ME3 BW Alphaproteobacteria 35.36 ± 7.37 N.D. N.D.
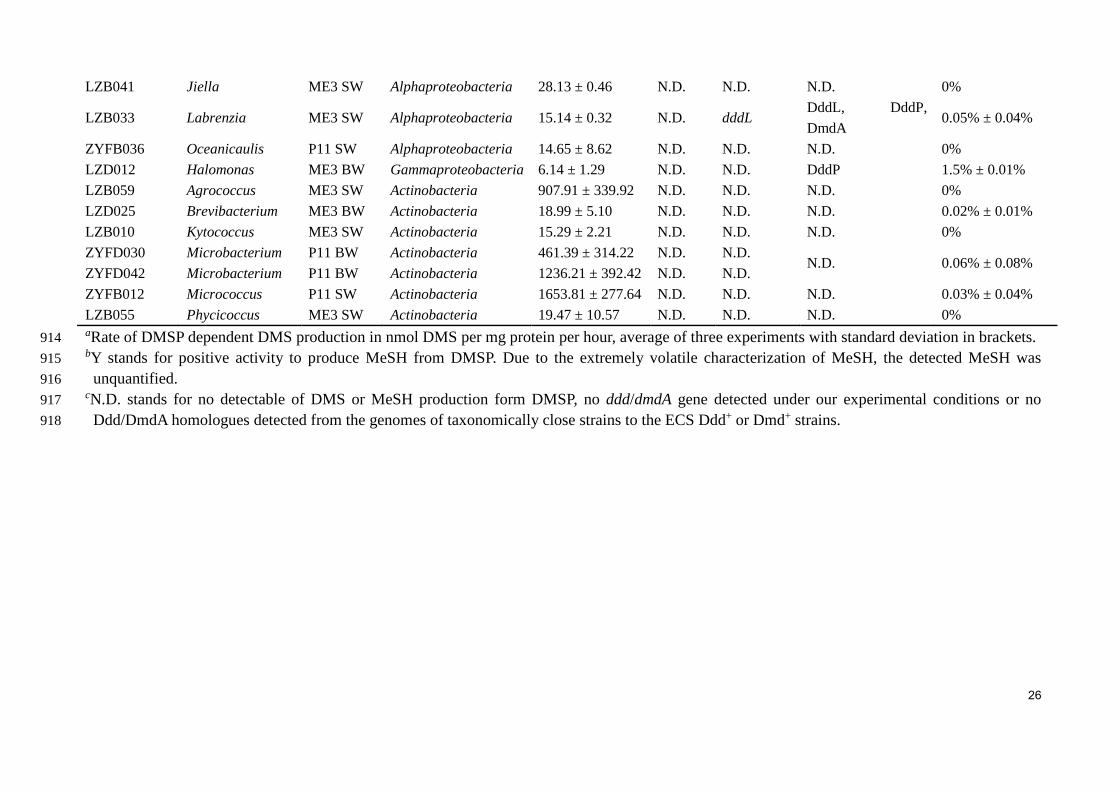
26
LZB041 Jiella ME3 SW Alphaproteobacteria 28.13 ± 0.46 N.D. N.D. N.D. 0%
LZB033 Labrenzia ME3 SW Alphaproteobacteria 15.14 ± 0.32 N.D. dddL DddL, DddP,
DmdA 0.05% ± 0.04%
ZYFB036 Oceanicaulis P11 SW Alphaproteobacteria 14.65 ± 8.62 N.D. N.D. N.D. 0%
LZD012 Halomonas ME3 BW Gammaproteobacteria 6.14 ± 1.29 N.D. N.D. DddP 1.5% ± 0.01%
LZB059 Agrococcus ME3 SW Actinobacteria 907.91 ± 339.92 N.D. N.D. N.D. 0%
LZD025 Brevibacterium ME3 BW Actinobacteria 18.99 ± 5.10 N.D. N.D. N.D. 0.02% ± 0.01%
LZB010 Kytococcus ME3 SW Actinobacteria 15.29 ± 2.21 N.D. N.D. N.D. 0%
ZYFD030 Microbacterium P11 BW Actinobacteria 461.39 ± 314.22 N.D. N.D. N.D. 0.06% ± 0.08%
ZYFD042 Microbacterium P11 BW Actinobacteria 1236.21 ± 392.42 N.D. N.D.
ZYFB012 Micrococcus P11 SW Actinobacteria 1653.81 ± 277.64 N.D. N.D. N.D. 0.03% ± 0.04%
LZB055 Phycicoccus ME3 SW Actinobacteria 19.47 ± 10.57 N.D. N.D. N.D. 0% aRate of DMSP dependent DMS production in nmol DMS per mg protein per hour, average of three experiments with standard deviation in brackets. 914 bY stands for positive activity to produce MeSH from DMSP. Due to the extremely volatile characterization of MeSH, the detected MeSH was 915
unquantified. 916 cN.D. stands for no detectable of DMS or MeSH production form DMSP, no ddd/dmdA gene detected under our experimental conditions or no 917
Ddd/DmdA homologues detected from the genomes of taxonomically close strains to the ECS Ddd+ or Dmd+ strains.918
27
FIGURE 1 Locations of the sampling sites in the ECS. The red triangles indicate sites from 2013 919
cruise, and the blue circles indicate sites from 2015 cruise. Stations plotted in Ocean Data View 920
(Schlitzer, 2002). 921
922
FIGURE 2 Neighbour-joining tree of 16S rRNA gene sequences of 57 representative cultivated 923
strains. Solid circle represents Ddd+ strains. Triangle represents Ddm+ strains. The genera shown 924
in bold represents bacteria which only showed Ddm+ activity when 0.5 and 5 mM DMSP was 925
added. Bootstrap coefficients below 50% were not shown. Scale bar 0.02 substitutions per 926
nucleotide position. 927
928
FIGURE 3 Relative abundance of top 10 dominant classes in seawater samples from 2015 cruise. 929
‘SW’ stands for surface seawater, ‘BW’ stands for bottom seawater. 930
931
FIGURE 4 The relative abundance of bacterial DMSP-degrading genes in ECS seawater samples. 932
The dddP and dmdA genes were normalized against bacterial 16S rRNA copy numbers. A) Seven 933
different subclades of dmdA; B) dddP. ‘SW’ stands for surface seawater; ‘BW’ stands for bottom 934
seawater; ‘100’ stands for seawater of 100 m depth. 935
936
FIGURE 5 Amino acid tree of representative DddP OTU sequences and their top-hit sequences in 937
Genebank. Xaa-Pro aminopeptidase sequences were used as the out group. Stars represent the 938
DddPs which have been experimentally ratified to be functional. The neighbor-joining tree was 939
made with Passion model.940
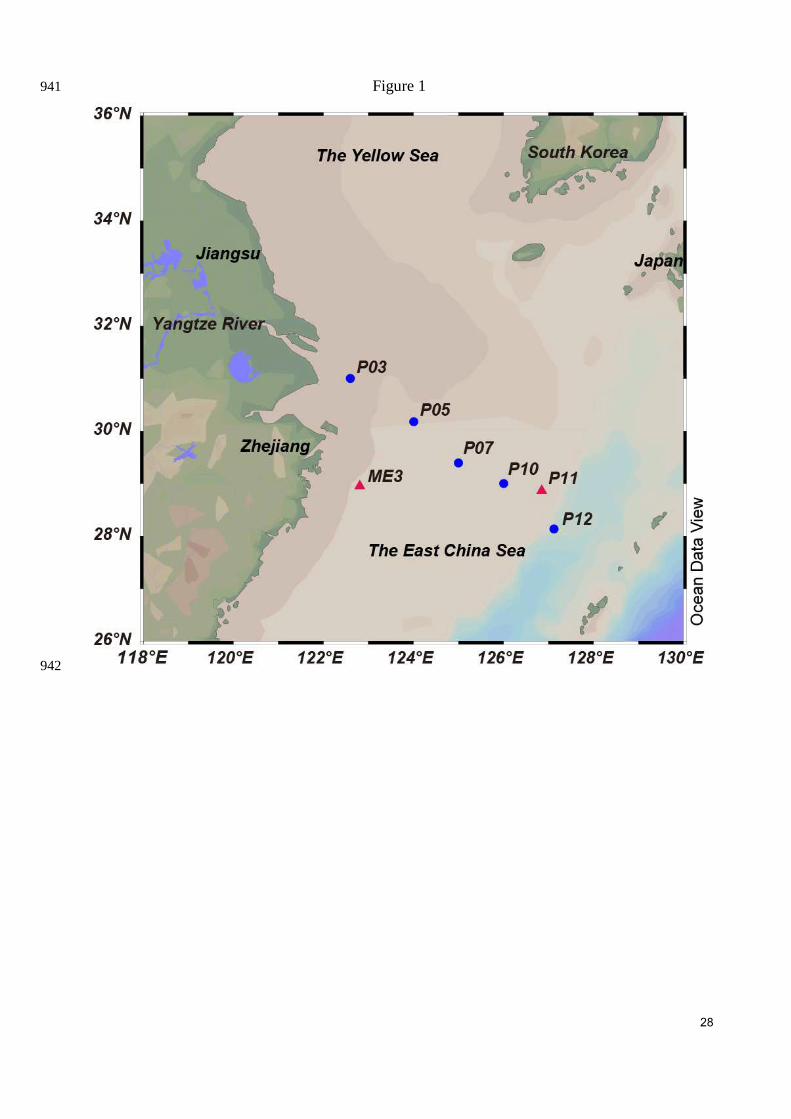
28
Figure 1 941
942
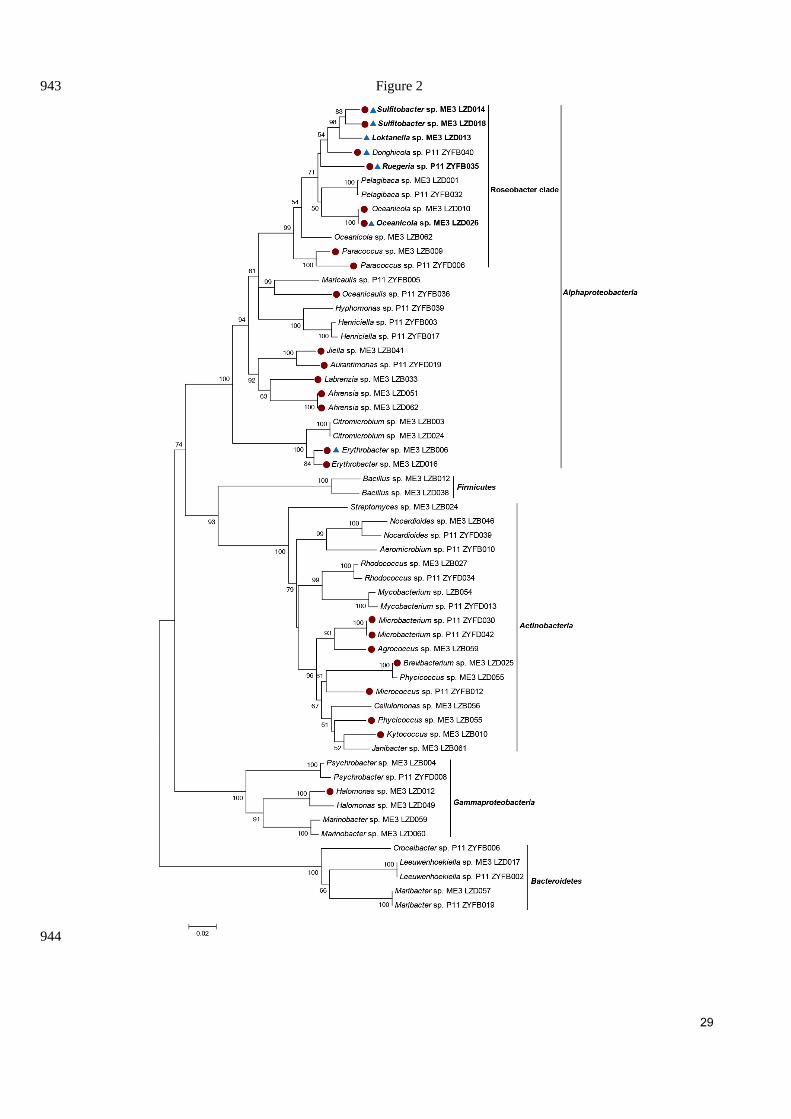
29
Figure 2 943
944
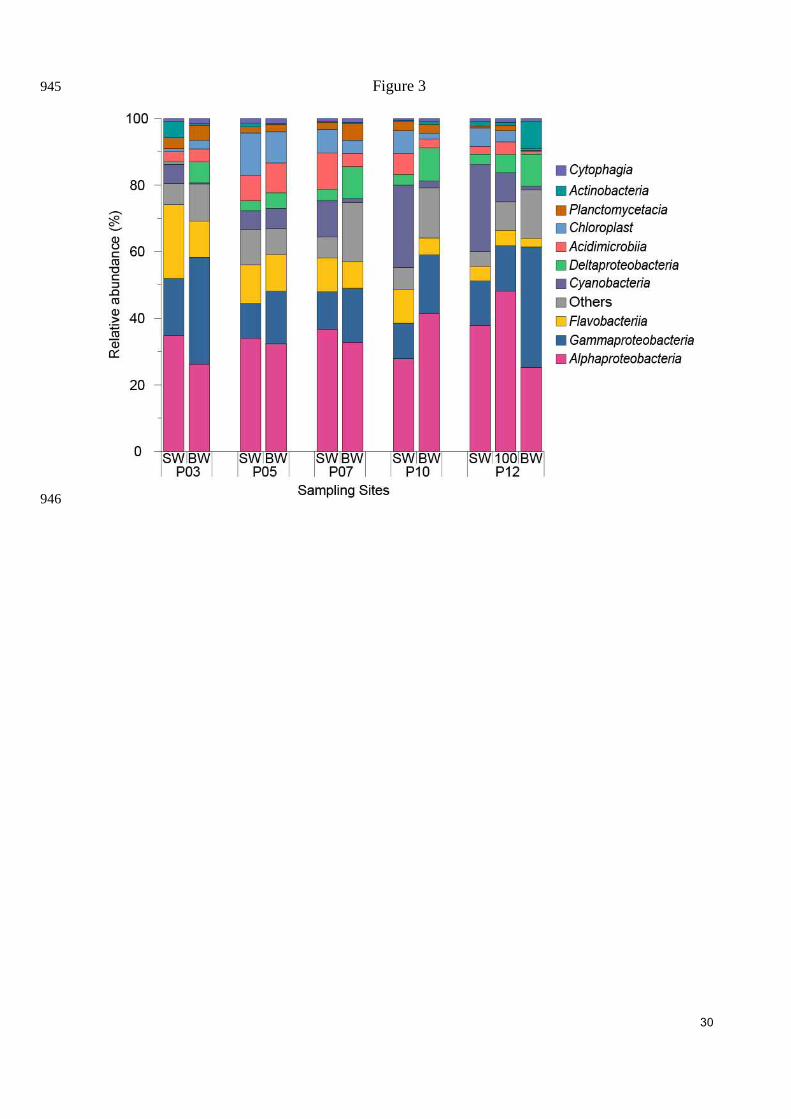
30
Figure 3 945
946

31
Figure 4 947
948
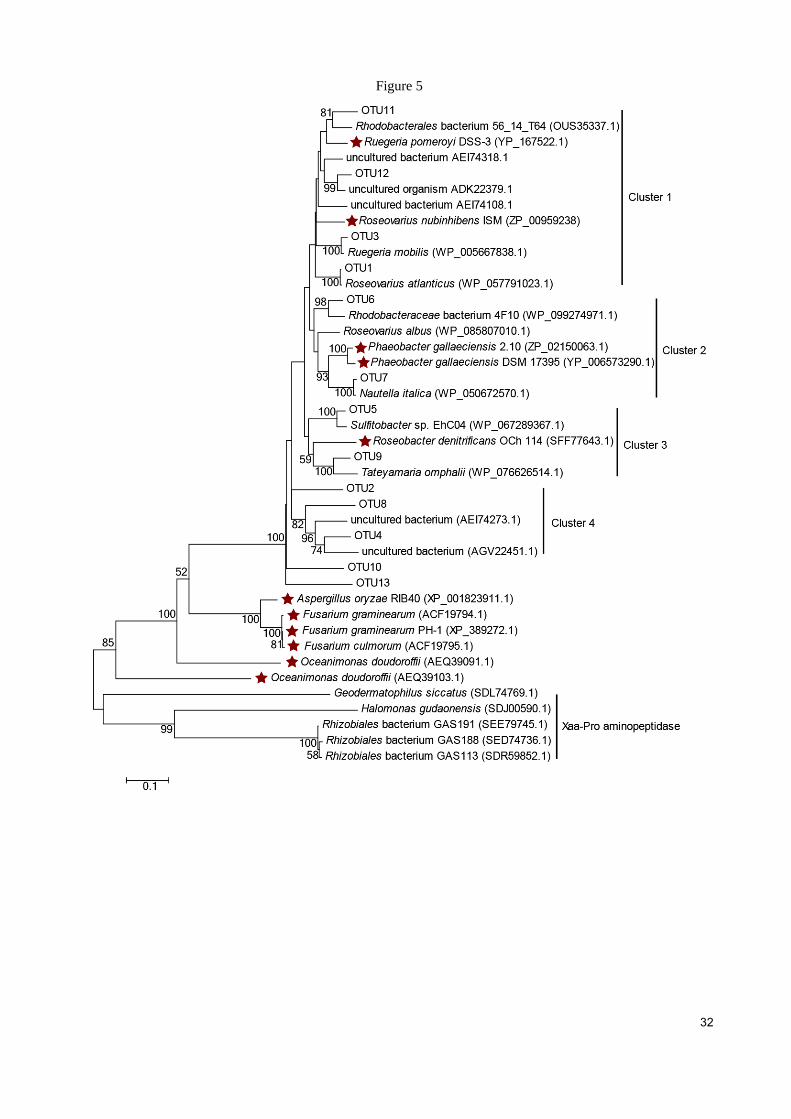
32
Figure 5
33
Supplementary Material
Novel insights into bacterial dimethylsulfoniopropionate catabolism
in the East China Sea
Jingli Liu 1,2†, Ji Liu1,2†, Sheng-Hui Zhang3, Jinchang Liang1, Heyu Lin1, Delei Song1, Gui-Peng Yang3,4, Jonathan D. Todd2*, Xiao-Hua Zhang1,4* 1 College of Marine Life Sciences, Ocean University of China, Qingdao, China. 2 School of Biological Sciences, University of East Anglia, Norwich Research Park, Norwich, UK.
3 College of Chemistry and Chemical Engineering, Ocean University of China, Qingdao, China.
4 Laboratory for Marine Ecology and Environmental Science, Qingdao National Laboratory for Marine Science and Technology, Qingdao, China. †These authors contributed equally to this work.
*Correspondence: Dr. Xiao-Hua Zhang, [email protected]; Dr. Jonathan D. Todd, [email protected]
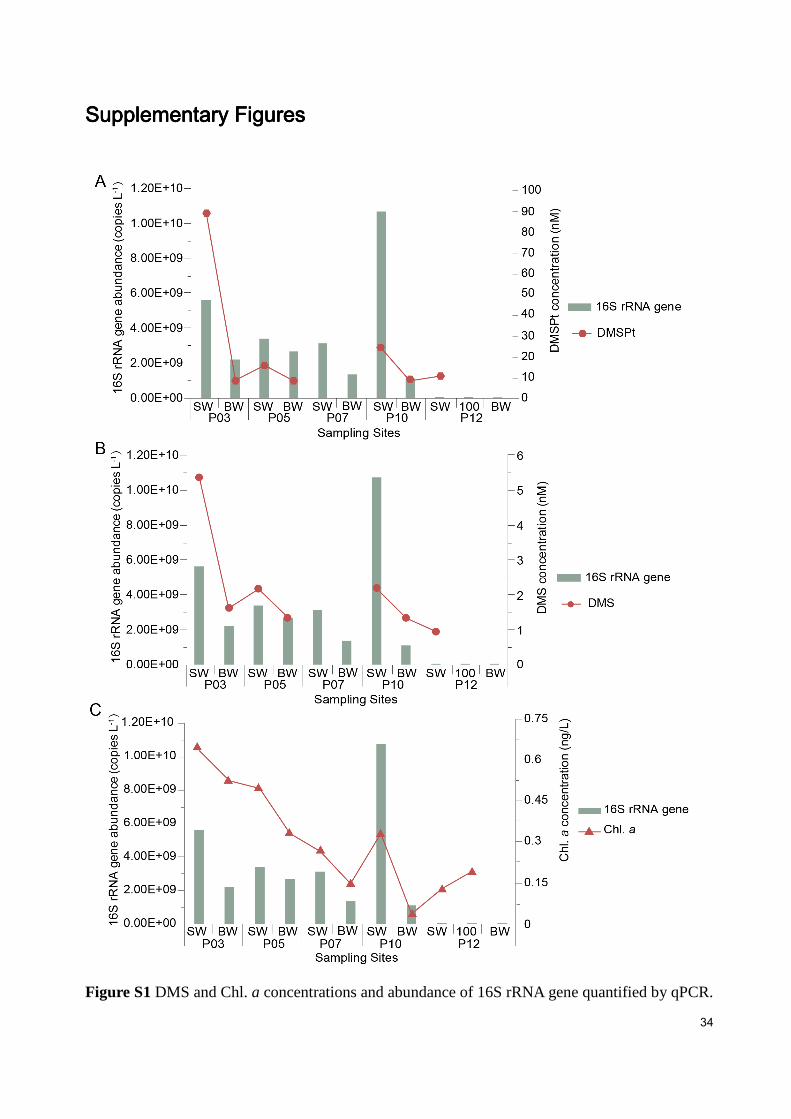
34
SupplementarySupplementarySupplementarySupplementary FiguresFiguresFiguresFigures
Figure S1 DMS and Chl. a concentrations and abundance of 16S rRNA gene quantified by qPCR.
35
Bar: gene copies number of 16S rRNA gene, solid pentagon: DMSPt concentration; circles: DMS concentration; solid triangles: Chl. a concentration.
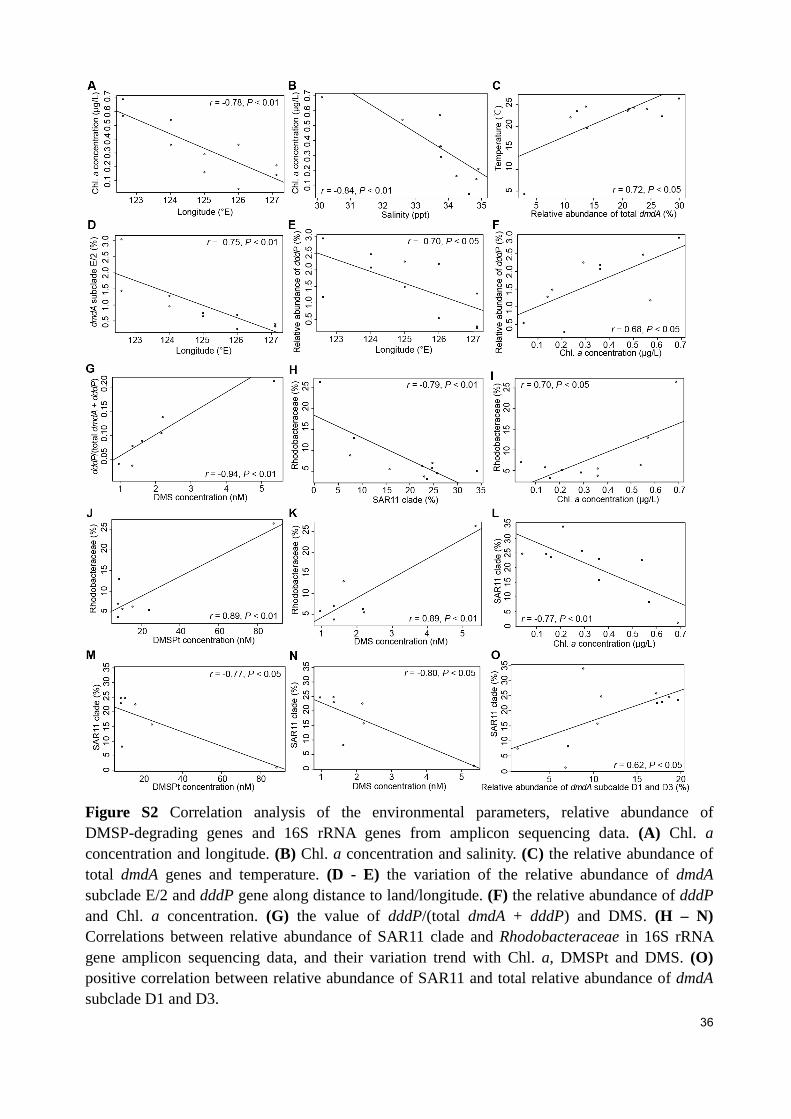
36
Figure S2 Correlation analysis of the environmental parameters, relative abundance of DMSP-degrading genes and 16S rRNA genes from amplicon sequencing data. (A) Chl. a concentration and longitude. (B) Chl. a concentration and salinity. (C) the relative abundance of total dmdA genes and temperature. (D - E) the variation of the relative abundance of dmdA subclade E/2 and dddP gene along distance to land/longitude. (F) the relative abundance of dddP and Chl. a concentration. (G) the value of dddP/(total dmdA + dddP) and DMS. (H – N) Correlations between relative abundance of SAR11 clade and Rhodobacteraceae in 16S rRNA gene amplicon sequencing data, and their variation trend with Chl. a, DMSPt and DMS. (O) positive correlation between relative abundance of SAR11 and total relative abundance of dmdA subclade D1 and D3.
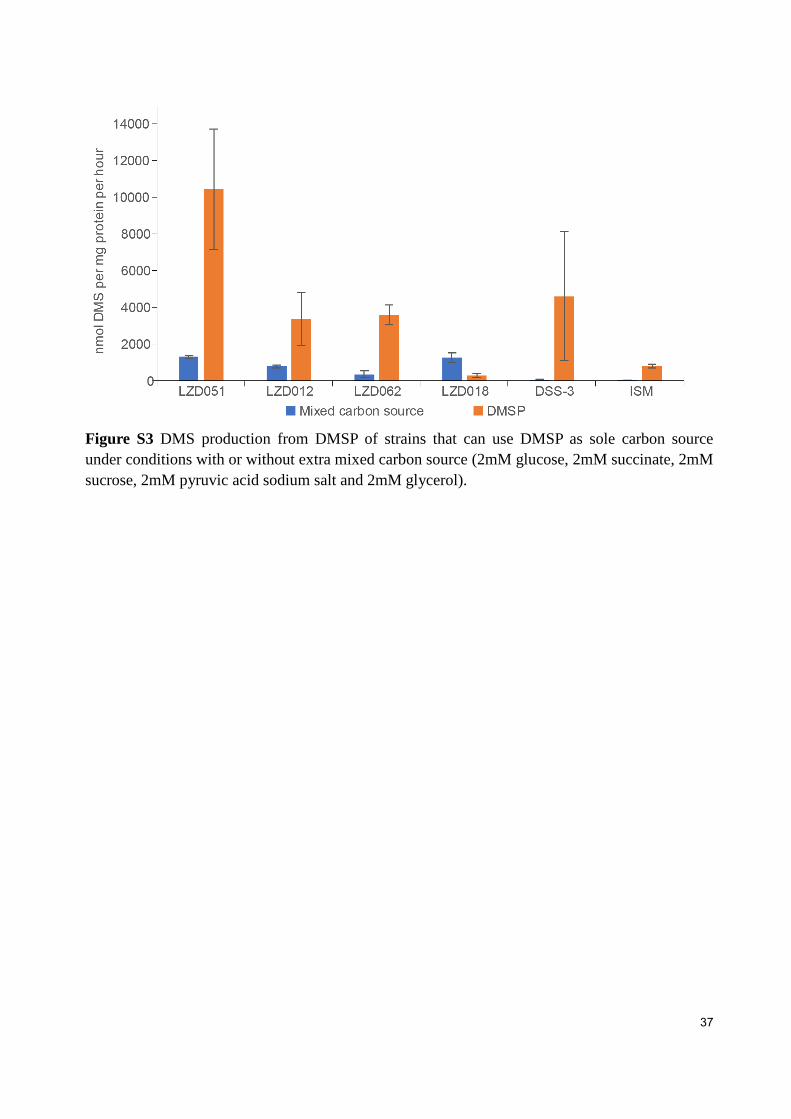
37
Figure S3 DMS production from DMSP of strains that can use DMSP as sole carbon source under conditions with or without extra mixed carbon source (2mM glucose, 2mM succinate, 2mM sucrose, 2mM pyruvic acid sodium salt and 2mM glycerol).
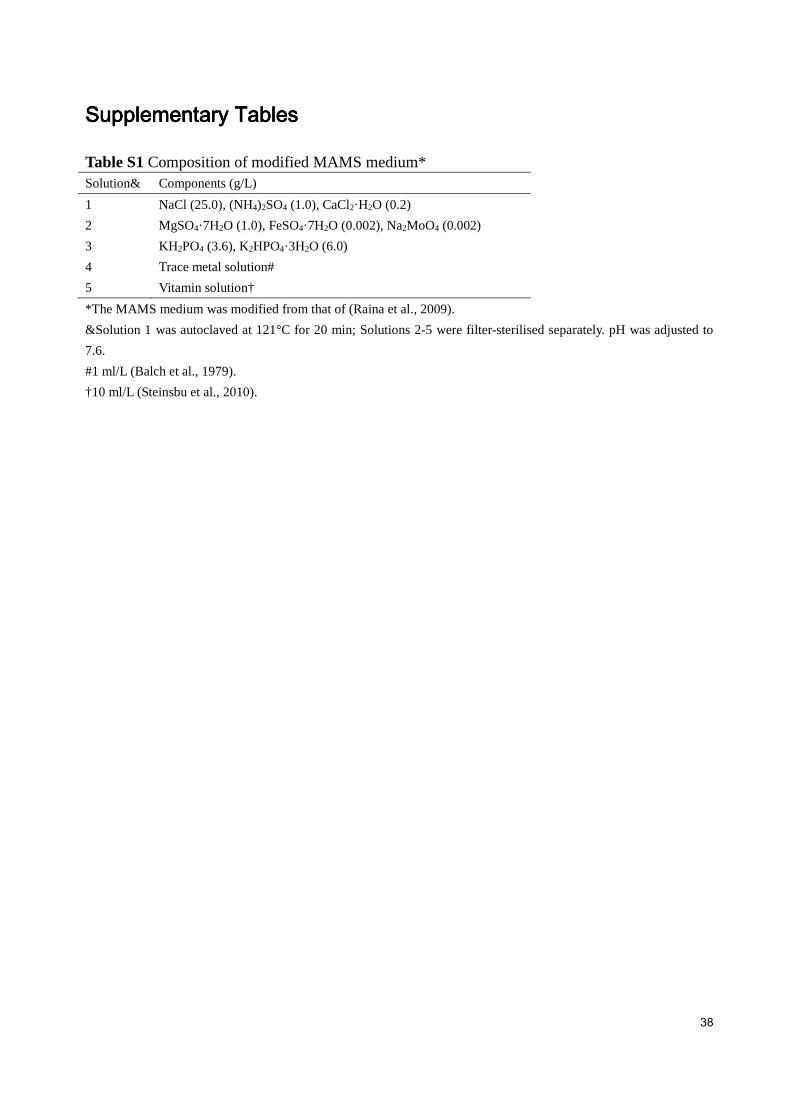
38
SupplementarySupplementarySupplementarySupplementary TablesTablesTablesTables
Table S1 Composition of modified MAMS medium* Solution& Components (g/L)
1 NaCl (25.0), (NH4)2SO4 (1.0), CaCl2·H2O (0.2)
2 MgSO4·7H2O (1.0), FeSO4·7H2O (0.002), Na2MoO4 (0.002)
3 KH2PO4 (3.6), K2HPO4·3H2O (6.0)
4 Trace metal solution#
5 Vitamin solution†
*The MAMS medium was modified from that of (Raina et al., 2009).
&Solution 1 was autoclaved at 121°C for 20 min; Solutions 2-5 were filter-sterilised separately. pH was adjusted to
7.6.
#1 ml/L (Balch et al., 1979).
†10 ml/L (Steinsbu et al., 2010).
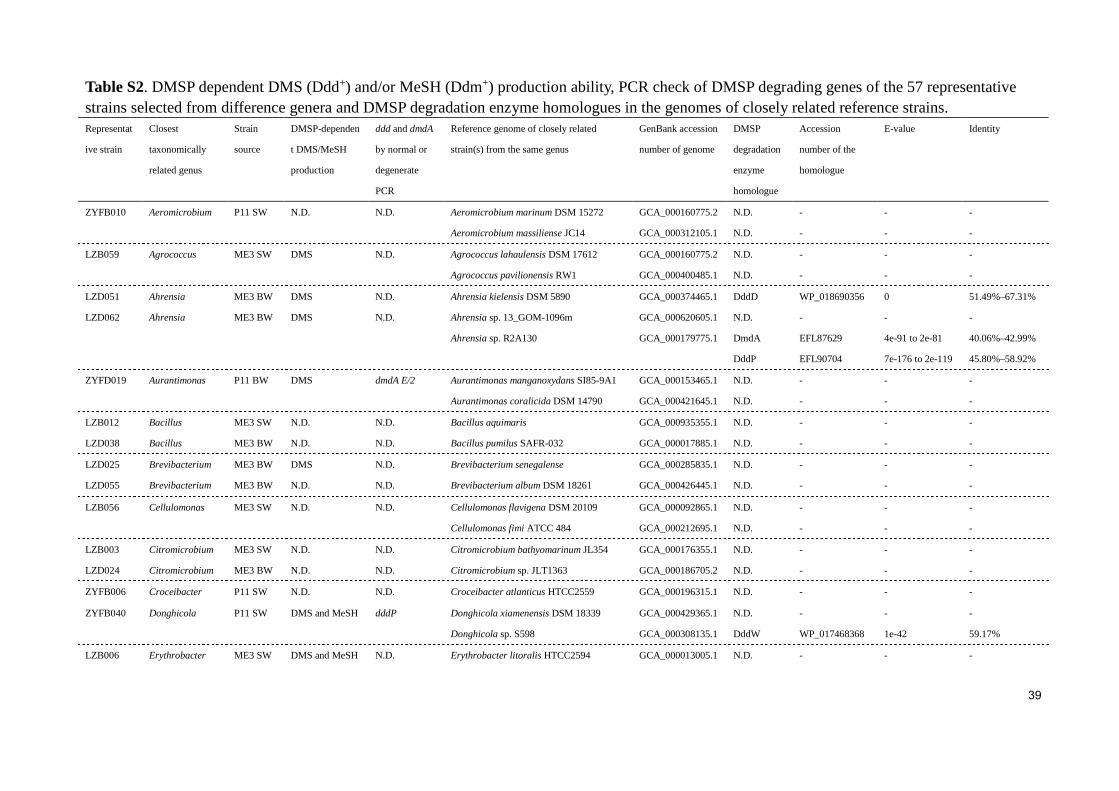
39
Table S2. DMSP dependent DMS (Ddd+) and/or MeSH (Ddm+) production ability, PCR check of DMSP degrading genes of the 57 representative strains selected from difference genera and DMSP degradation enzyme homologues in the genomes of closely related reference strains. Representat
ive strain
Closest
taxonomically
related genus
Strain
source
DMSP-dependen
t DMS/MeSH
production
ddd and dmdA
by normal or
degenerate
PCR
Reference genome of closely related
strain(s) from the same genus
GenBank accession
number of genome
DMSP
degradation
enzyme
homologue
Accession
number of the
homologue
E-value Identity
ZYFB010 Aeromicrobium P11 SW N.D. N.D. Aeromicrobium marinum DSM 15272
Aeromicrobium massiliense JC14
GCA_000160775.2
GCA_000312105.1
N.D.
N.D.
-
-
-
-
-
-
LZB059 Agrococcus ME3 SW DMS N.D. Agrococcus lahaulensis DSM 17612
Agrococcus pavilionensis RW1
GCA_000160775.2
GCA_000400485.1
N.D.
N.D.
-
-
-
-
-
-
LZD051
LZD062
Ahrensia
Ahrensia
ME3 BW
ME3 BW
DMS
DMS
N.D.
N.D.
Ahrensia kielensis DSM 5890
Ahrensia sp. 13_GOM-1096m
Ahrensia sp. R2A130
GCA_000374465.1
GCA_000620605.1
GCA_000179775.1
DddD
N.D.
DmdA
DddP
WP_018690356
-
EFL87629
EFL90704
0
-
4e-91 to 2e-81
7e-176 to 2e-119
51.49%–67.31%
-
40.06%–42.99%
45.80%–58.92%
ZYFD019 Aurantimonas P11 BW DMS dmdA E/2 Aurantimonas manganoxydans SI85-9A1
Aurantimonas coralicida DSM 14790
GCA_000153465.1
GCA_000421645.1
N.D.
N.D.
-
-
-
-
-
-
LZB012
LZD038
Bacillus
Bacillus
ME3 SW
ME3 BW
N.D.
N.D.
N.D.
N.D.
Bacillus aquimaris
Bacillus pumilus SAFR-032
GCA_000935355.1
GCA_000017885.1
N.D.
N.D.
-
-
-
-
-
-
LZD025
LZD055
Brevibacterium
Brevibacterium
ME3 BW
ME3 BW
DMS
N.D.
N.D.
N.D.
Brevibacterium senegalense
Brevibacterium album DSM 18261
GCA_000285835.1
GCA_000426445.1
N.D.
N.D.
-
-
-
-
-
-
LZB056 Cellulomonas ME3 SW N.D. N.D. Cellulomonas flavigena DSM 20109
Cellulomonas fimi ATCC 484
GCA_000092865.1
GCA_000212695.1
N.D.
N.D.
-
-
-
-
-
-
LZB003
LZD024
Citromicrobium
Citromicrobium
ME3 SW
ME3 BW
N.D.
N.D.
N.D.
N.D.
Citromicrobium bathyomarinum JL354
Citromicrobium sp. JLT1363
GCA_000176355.1
GCA_000186705.2
N.D.
N.D.
-
-
-
-
-
-
ZYFB006 Croceibacter P11 SW N.D. N.D. Croceibacter atlanticus HTCC2559 GCA_000196315.1 N.D. - - -
ZYFB040 Donghicola P11 SW DMS and MeSH dddP Donghicola xiamenensis DSM 18339
Donghicola sp. S598
GCA_000429365.1
GCA_000308135.1
N.D.
DddW
-
WP_017468368
-
1e-42
-
59.17%
LZB006 Erythrobacter ME3 SW DMS and MeSH N.D. Erythrobacter litoralis HTCC2594 GCA_000013005.1 N.D. - - -
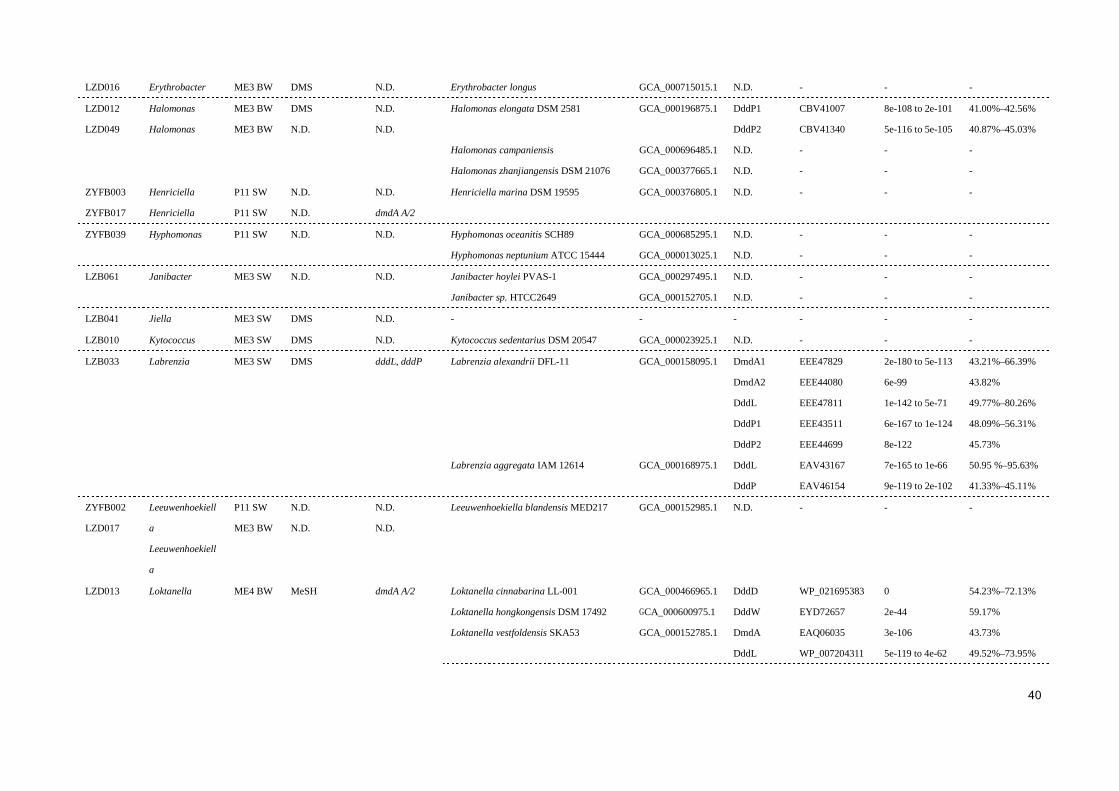
40
LZD016 Erythrobacter ME3 BW DMS N.D. Erythrobacter longus GCA_000715015.1 N.D. - - -
LZD012
LZD049
Halomonas
Halomonas
ME3 BW
ME3 BW
DMS
N.D.
N.D.
N.D.
Halomonas elongata DSM 2581
Halomonas campaniensis
Halomonas zhanjiangensis DSM 21076
GCA_000196875.1
GCA_000696485.1
GCA_000377665.1
DddP1
DddP2
N.D.
N.D.
CBV41007
CBV41340
-
-
8e-108 to 2e-101
5e-116 to 5e-105
-
-
41.00%–42.56%
40.87%–45.03%
-
-
ZYFB003
ZYFB017
Henriciella
Henriciella
P11 SW
P11 SW
N.D.
N.D.
N.D.
dmdA A/2
Henriciella marina DSM 19595 GCA_000376805.1 N.D. - - -
ZYFB039 Hyphomonas P11 SW N.D. N.D. Hyphomonas oceanitis SCH89
Hyphomonas neptunium ATCC 15444
GCA_000685295.1
GCA_000013025.1
N.D.
N.D.
-
-
-
-
-
-
LZB061 Janibacter ME3 SW N.D. N.D. Janibacter hoylei PVAS-1
Janibacter sp. HTCC2649
GCA_000297495.1
GCA_000152705.1
N.D.
N.D.
-
-
-
-
-
-
LZB041 Jiella ME3 SW DMS N.D. - - - - - -
LZB010 Kytococcus ME3 SW DMS N.D. Kytococcus sedentarius DSM 20547 GCA_000023925.1 N.D. - - -
LZB033 Labrenzia ME3 SW DMS dddL, dddP Labrenzia alexandrii DFL-11
Labrenzia aggregata IAM 12614
GCA_000158095.1
GCA_000168975.1
DmdA1
DmdA2
DddL
DddP1
DddP2
DddL
DddP
EEE47829
EEE44080
EEE47811
EEE43511
EEE44699
EAV43167
EAV46154
2e-180 to 5e-113
6e-99
1e-142 to 5e-71
6e-167 to 1e-124
8e-122
7e-165 to 1e-66
9e-119 to 2e-102
43.21%–66.39%
43.82%
49.77%–80.26%
48.09%–56.31%
45.73%
50.95 %–95.63%
41.33%–45.11%
ZYFB002
LZD017
Leeuwenhoekiell
a
Leeuwenhoekiell
a
P11 SW
ME3 BW
N.D.
N.D.
N.D.
N.D.
Leeuwenhoekiella blandensis MED217 GCA_000152985.1 N.D. - - -
LZD013 Loktanella ME4 BW MeSH dmdA A/2 Loktanella cinnabarina LL-001
Loktanella hongkongensis DSM 17492
Loktanella vestfoldensis SKA53
GCA_000466965.1
GCA_000600975.1
GCA_000152785.1
DddD
DddW
DmdA
DddL
WP_021695383
EYD72657
EAQ06035
WP_007204311
0
2e-44
3e-106
5e-119 to 4e-62
54.23%–72.13%
59.17%
43.73%
49.52%–73.95%
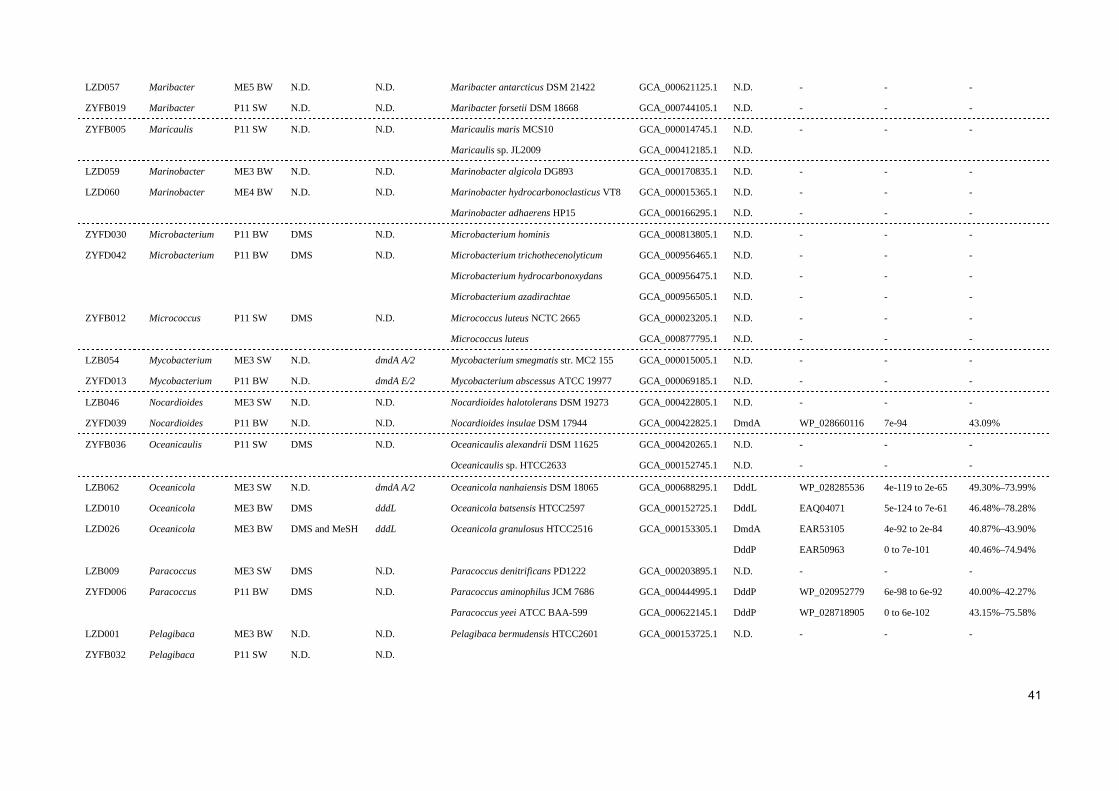
41
LZD057
ZYFB019
Maribacter
Maribacter
ME5 BW
P11 SW
N.D.
N.D.
N.D.
N.D.
Maribacter antarcticus DSM 21422
Maribacter forsetii DSM 18668
GCA_000621125.1
GCA_000744105.1
N.D.
N.D.
-
-
-
-
-
-
ZYFB005 Maricaulis P11 SW N.D. N.D. Maricaulis maris MCS10
Maricaulis sp. JL2009
GCA_000014745.1
GCA_000412185.1
N.D.
N.D.
- - -
LZD059
LZD060
Marinobacter
Marinobacter
ME3 BW
ME4 BW
N.D.
N.D.
N.D.
N.D.
Marinobacter algicola DG893
Marinobacter hydrocarbonoclasticus VT8
Marinobacter adhaerens HP15
GCA_000170835.1
GCA_000015365.1
GCA_000166295.1
N.D.
N.D.
N.D.
-
-
-
-
-
-
-
-
-
ZYFD030
ZYFD042
Microbacterium
Microbacterium
P11 BW
P11 BW
DMS
DMS
N.D.
N.D.
Microbacterium hominis
Microbacterium trichothecenolyticum
Microbacterium hydrocarbonoxydans
Microbacterium azadirachtae
GCA_000813805.1
GCA_000956465.1
GCA_000956475.1
GCA_000956505.1
N.D.
N.D.
N.D.
N.D.
-
-
-
-
-
-
-
-
-
-
-
-
ZYFB012 Micrococcus P11 SW DMS N.D. Micrococcus luteus NCTC 2665
Micrococcus luteus
GCA_000023205.1
GCA_000877795.1
N.D.
N.D.
-
-
-
-
-
-
LZB054
ZYFD013
Mycobacterium
Mycobacterium
ME3 SW
P11 BW
N.D.
N.D.
dmdA A/2
dmdA E/2
Mycobacterium smegmatis str. MC2 155
Mycobacterium abscessus ATCC 19977
GCA_000015005.1
GCA_000069185.1
N.D.
N.D.
-
-
-
-
-
-
LZB046
ZYFD039
Nocardioides
Nocardioides
ME3 SW
P11 BW
N.D.
N.D.
N.D.
N.D.
Nocardioides halotolerans DSM 19273
Nocardioides insulae DSM 17944
GCA_000422805.1
GCA_000422825.1
N.D.
DmdA
-
WP_028660116
-
7e-94
-
43.09%
ZYFB036 Oceanicaulis P11 SW DMS N.D. Oceanicaulis alexandrii DSM 11625
Oceanicaulis sp. HTCC2633
GCA_000420265.1
GCA_000152745.1
N.D.
N.D.
-
-
-
-
-
-
LZB062
LZD010
LZD026
Oceanicola
Oceanicola
Oceanicola
ME3 SW
ME3 BW
ME3 BW
N.D.
DMS
DMS and MeSH
dmdA A/2
dddL
dddL
Oceanicola nanhaiensis DSM 18065
Oceanicola batsensis HTCC2597
Oceanicola granulosus HTCC2516
GCA_000688295.1
GCA_000152725.1
GCA_000153305.1
DddL
DddL
DmdA
DddP
WP_028285536
EAQ04071
EAR53105
EAR50963
4e-119 to 2e-65
5e-124 to 7e-61
4e-92 to 2e-84
0 to 7e-101
49.30%–73.99%
46.48%–78.28%
40.87%–43.90%
40.46%–74.94%
LZB009
ZYFD006
Paracoccus
Paracoccus
ME3 SW
P11 BW
DMS
DMS
N.D.
N.D.
Paracoccus denitrificans PD1222
Paracoccus aminophilus JCM 7686
Paracoccus yeei ATCC BAA-599
GCA_000203895.1
GCA_000444995.1
GCA_000622145.1
N.D.
DddP
DddP
-
WP_020952779
WP_028718905
-
6e-98 to 6e-92
0 to 6e-102
-
40.00%–42.27%
43.15%–75.58%
LZD001
ZYFB032
Pelagibaca
Pelagibaca
ME3 BW
P11 SW
N.D.
N.D.
N.D.
N.D.
Pelagibaca bermudensis HTCC2601 GCA_000153725.1 N.D. - - -
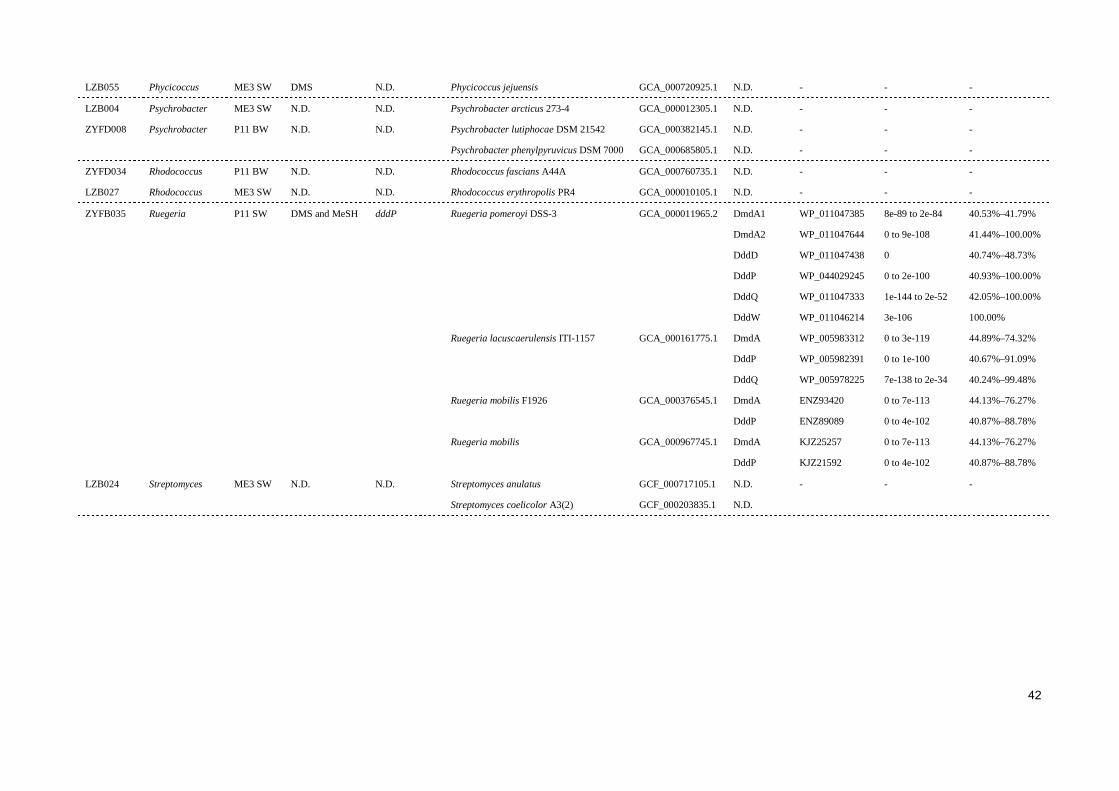
42
LZB055 Phycicoccus ME3 SW DMS N.D. Phycicoccus jejuensis GCA_000720925.1 N.D. - - -
LZB004
ZYFD008
Psychrobacter
Psychrobacter
ME3 SW
P11 BW
N.D.
N.D.
N.D.
N.D.
Psychrobacter arcticus 273-4
Psychrobacter lutiphocae DSM 21542
Psychrobacter phenylpyruvicus DSM 7000
GCA_000012305.1
GCA_000382145.1
GCA_000685805.1
N.D.
N.D.
N.D.
-
-
-
-
-
-
-
-
-
ZYFD034
LZB027
Rhodococcus
Rhodococcus
P11 BW
ME3 SW
N.D.
N.D.
N.D.
N.D.
Rhodococcus fascians A44A
Rhodococcus erythropolis PR4
GCA_000760735.1
GCA_000010105.1
N.D.
N.D.
-
-
-
-
-
-
ZYFB035 Ruegeria P11 SW DMS and MeSH dddP Ruegeria pomeroyi DSS-3
Ruegeria lacuscaerulensis ITI-1157
Ruegeria mobilis F1926
Ruegeria mobilis
GCA_000011965.2
GCA_000161775.1
GCA_000376545.1
GCA_000967745.1
DmdA1
DmdA2
DddD
DddP
DddQ
DddW
DmdA
DddP
DddQ
DmdA
DddP
DmdA
DddP
WP_011047385
WP_011047644
WP_011047438
WP_044029245
WP_011047333
WP_011046214
WP_005983312
WP_005982391
WP_005978225
ENZ93420
ENZ89089
KJZ25257
KJZ21592
8e-89 to 2e-84
0 to 9e-108
0
0 to 2e-100
1e-144 to 2e-52
3e-106
0 to 3e-119
0 to 1e-100
7e-138 to 2e-34
0 to 7e-113
0 to 4e-102
0 to 7e-113
0 to 4e-102
40.53%–41.79%
41.44%–100.00%
40.74%–48.73%
40.93%–100.00%
42.05%–100.00%
100.00%
44.89%–74.32%
40.67%–91.09%
40.24%–99.48%
44.13%–76.27%
40.87%–88.78%
44.13%–76.27%
40.87%–88.78%
LZB024 Streptomyces ME3 SW N.D. N.D. Streptomyces anulatus
Streptomyces coelicolor A3(2)
GCF_000717105.1
GCF_000203835.1
N.D.
N.D.
- - -
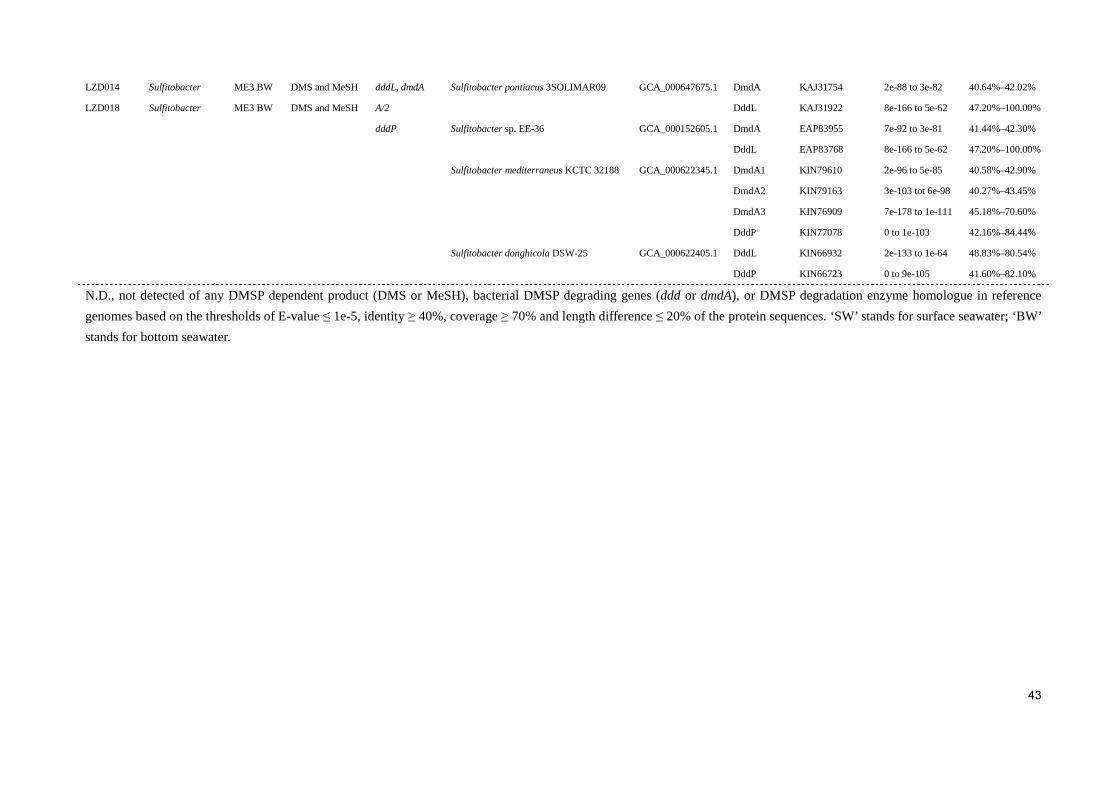
43
LZD014
LZD018
Sulfitobacter
Sulfitobacter
ME3 BW
ME3 BW
DMS and MeSH
DMS and MeSH
dddL, dmdA
A/2
dddP
Sulfitobacter pontiacus 3SOLIMAR09
Sulfitobacter sp. EE-36
Sulfitobacter mediterraneus KCTC 32188
Sulfitobacter donghicola DSW-25
GCA_000647675.1
GCA_000152605.1
GCA_000622345.1
GCA_000622405.1
DmdA
DddL
DmdA
DddL
DmdA1
DmdA2
DmdA3
DddP
DddL
DddP
KAJ31754
KAJ31922
EAP83955
EAP83768
KIN79610
KIN79163
KIN76909
KIN77078
KIN66932
KIN66723
2e-88 to 3e-82
8e-166 to 5e-62
7e-92 to 3e-81
8e-166 to 5e-62
2e-96 to 5e-85
3e-103 tot 6e-98
7e-178 to 1e-111
0 to 1e-103
2e-133 to 1e-64
0 to 9e-105
40.64%–42.02%
47.20%–100.00%
41.44%–42.30%
47.20%–100.00%
40.58%–42.90%
40.27%–43.45%
45.18%–70.60%
42.16%–84.44%
48.83%–80.54%
41.60%–82.10%
N.D., not detected of any DMSP dependent product (DMS or MeSH), bacterial DMSP degrading genes (ddd or dmdA), or DMSP degradation enzyme homologue in reference
genomes based on the thresholds of E-value ≤ 1e-5, identity ≥ 40%, coverage ≥ 70% and length difference ≤ 20% of the protein sequences. ‘SW’ stands for surface seawater; ‘BW’
stands for bottom seawater.

44
Table S3 Reference protein sequences of the ratified DMSP demethylation and cleavage enzymes Protein Source Accession Number Reference
DmdA Ruegeria pomeroyi DSS-3 AAV95190 Howard et al., 2006
Pelagibacter ubique HTCC1062 WP_011281570 Howard et al., 2006
Dinoroseobacter shibae DFL 12 WP_012178987 Howard et al., 2008
marine gammaproteobacterium
HTCC2080
WP_007233625 Howard et al., 2008
Candidatus Pelagibacter sp. HTCC7211 WP_008546106 Howard et al., 2011
Candidatus Puniceispirillum marinum
IMCC1322
WP_013044947 Howard et al., 2011
DddD Marinomonas sp. MWYL1 ABR72937 Todd et al., 2007
Oceanimonas doudoroffii AEQ39135 Curson et al., 2012
Psychrobacter sp. J466 ACY02894 Curson et al., 2010
Halomonas sp. HTNK1 ACV84065 Todd et al., 2010
Sinorhizobium fredii NGR234 AAQ87407 Todd et al., 2007
Burkholderia ambifaria AMMD WP_011659284 Todd et al., 2007
Pseudomonas sp. J465 ACY01992 Curson et al., 2010
DddL Sulfitobacter sp. EE-36 ADK55772 Curson et al., 2008
Rhodobacter sphaeroides 2.4.1 YP_351475 Curson et al., 2008
Labrenzia aggregata LZB033 KP639184 Curson et al., 2017
Ahrensia marina LZD062 KP639183 This study
DddP Roseovarius nubinhibens ISM EAP77700 Todd et al., 2009
Ruegeria pomeroyi DSS-3 WP_044029245 Todd et al., 2011
Phaeobacter inhibens DSM 17395 AFO91571 Burkhardt et al.,
2017
Oceanimonas doudoroffii DSM 7028 AEQ39091 Curson et al., 2012
Oceanimonas doudoroffii DSM 7028 AEQ39103 Curson et al., 2012
Aspergillus oryzae RIB40 BAE62778 Todd et al., 2009
Fusarium graminearum PH-1 XP_389272 Todd et al., 2009
Candidatus Puniceispirillum marinum WP_013046297 Choi et al., 2015
DddQ Ruegeria pomeroyi DSS-3 WP_011047333 Todd et al., 2011
Roseovarius nubinhibens ISM EAP76002 Todd et al., 2011
Roseovarius nubinhibens ISM EAP76001 Todd et al., 2011
Ruegeria lacuscaerulensis ITI1157 WP_005978225 Li et al., 2014
GOS databases ECW91654 Todd et al., 2011
GOS databases EBP74803 Todd et al., 2011
GOS databases ECX82089 Todd et al., 2011
DddW Ruegeria pomeroyi DSS-3 AAV93771 Todd et al., 2012
DddY Alcaligenes faecalis M3A ADT64689 Curson et al., 2011
Shewanella putrefaciens CN-32 ABP77243 Curson et al., 2011
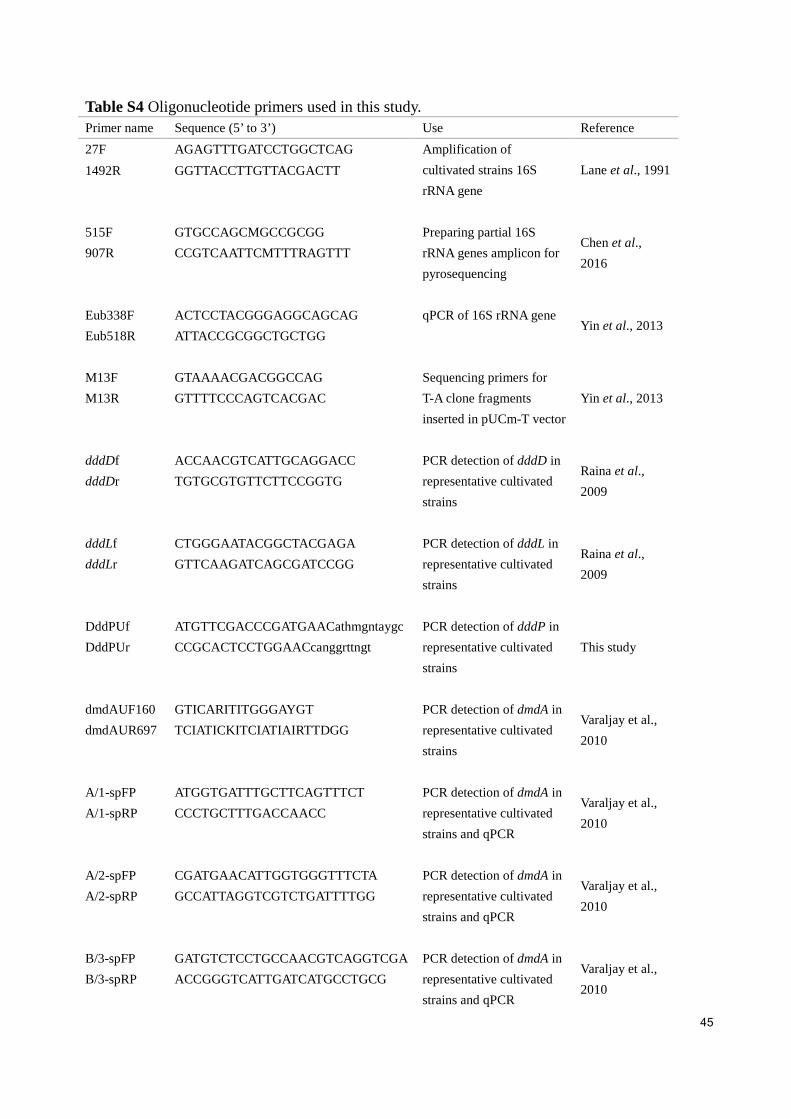
45
Table S4 Oligonucleotide primers used in this study. Primer name Sequence (5’ to 3’) Use Reference
27F AGAGTTTGATCCTGGCTCAG Amplification of
cultivated strains 16S
rRNA gene
Lane et al., 1991 1492R GGTTACCTTGTTACGACTT
515F GTGCCAGCMGCCGCGG Preparing partial 16S
rRNA genes amplicon for
pyrosequencing
Chen et al.,
2016 907R CCGTCAATTCMTTTRAGTTT
Eub338F ACTCCTACGGGAGGCAGCAG qPCR of 16S rRNA gene Yin et al., 2013
Eub518R ATTACCGCGGCTGCTGG
M13F GTAAAACGACGGCCAG Sequencing primers for
T-A clone fragments
inserted in pUCm-T vector
Yin et al., 2013 M13R GTTTTCCCAGTCACGAC
dddDf ACCAACGTCATTGCAGGACC PCR detection of dddD in
representative cultivated
strains
Raina et al.,
2009 dddDr TGTGCGTGTTCTTCCGGTG
dddLf CTGGGAATACGGCTACGAGA PCR detection of dddL in
representative cultivated
strains
Raina et al.,
2009 dddLr GTTCAAGATCAGCGATCCGG
DddPUf ATGTTCGACCCGATGAACathmgntaygc PCR detection of dddP in
representative cultivated
strains
This study DddPUr CCGCACTCCTGGAACcanggrttngt
dmdAUF160 GTICARITITGGGAYGT PCR detection of dmdA in
representative cultivated
strains
Varaljay et al.,
2010 dmdAUR697 TCIATICKITCIATIAIRTTDGG
A/1-spFP ATGGTGATTTGCTTCAGTTTCT PCR detection of dmdA in
representative cultivated
strains and qPCR
Varaljay et al.,
2010 A/1-spRP CCCTGCTTTGACCAACC
A/2-spFP CGATGAACATTGGTGGGTTTCTA PCR detection of dmdA in
representative cultivated
strains and qPCR
Varaljay et al.,
2010 A/2-spRP GCCATTAGGTCGTCTGATTTTGG
B/3-spFP GATGTCTCCTGCCAACGTCAGGTCGA PCR detection of dmdA in
representative cultivated
strains and qPCR
Varaljay et al.,
2010 B/3-spRP ACCGGGTCATTGATCATGCCTGCG
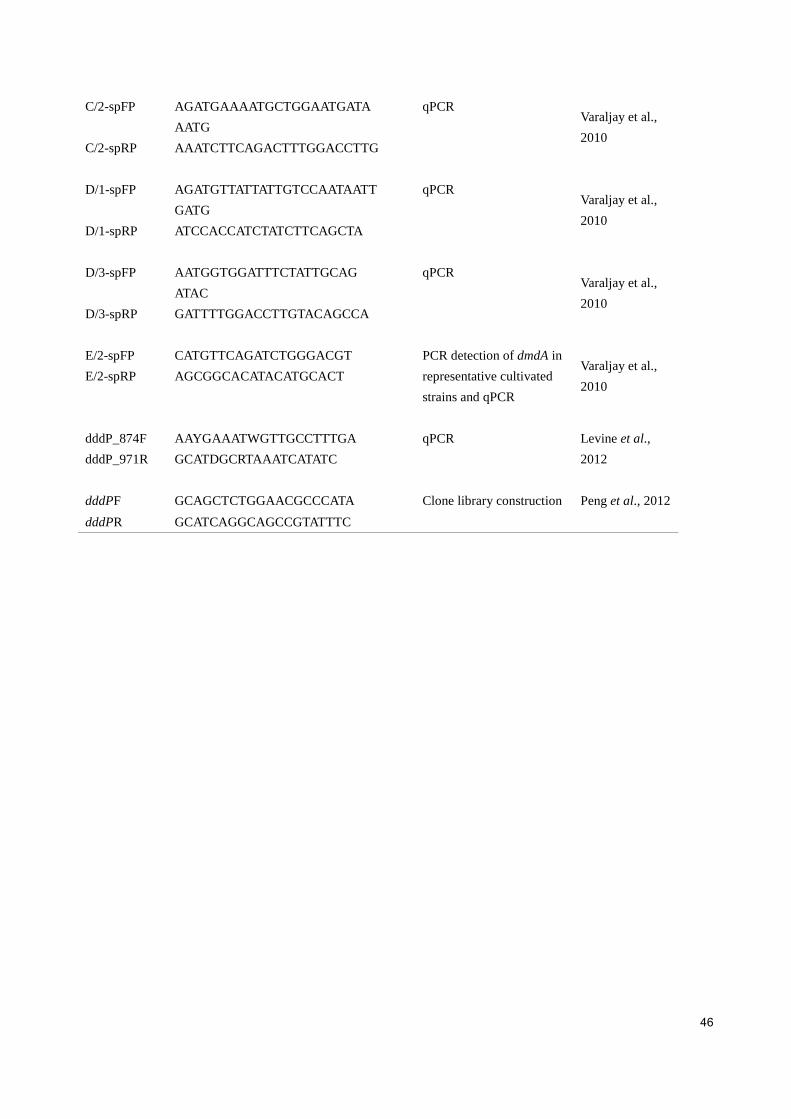
46
C/2-spFP AGATGAAAATGCTGGAATGATA
AATG
qPCR Varaljay et al.,
2010 C/2-spRP AAATCTTCAGACTTTGGACCTTG
D/1-spFP AGATGTTATTATTGTCCAATAATT
GATG
qPCR Varaljay et al.,
2010 D/1-spRP ATCCACCATCTATCTTCAGCTA
D/3-spFP AATGGTGGATTTCTATTGCAG
ATAC
qPCR Varaljay et al.,
2010 D/3-spRP GATTTTGGACCTTGTACAGCCA
E/2-spFP CATGTTCAGATCTGGGACGT PCR detection of dmdA in
representative cultivated
strains and qPCR
Varaljay et al.,
2010 E/2-spRP AGCGGCACATACATGCACT
dddP_874F AAYGAAATWGTTGCCTTTGA qPCR Levine et al.,
2012 dddP_971R GCATDGCRTAAATCATATC
dddPF GCAGCTCTGGAACGCCCATA Clone library construction Peng et al., 2012
dddPR GCATCAGGCAGCCGTATTTC
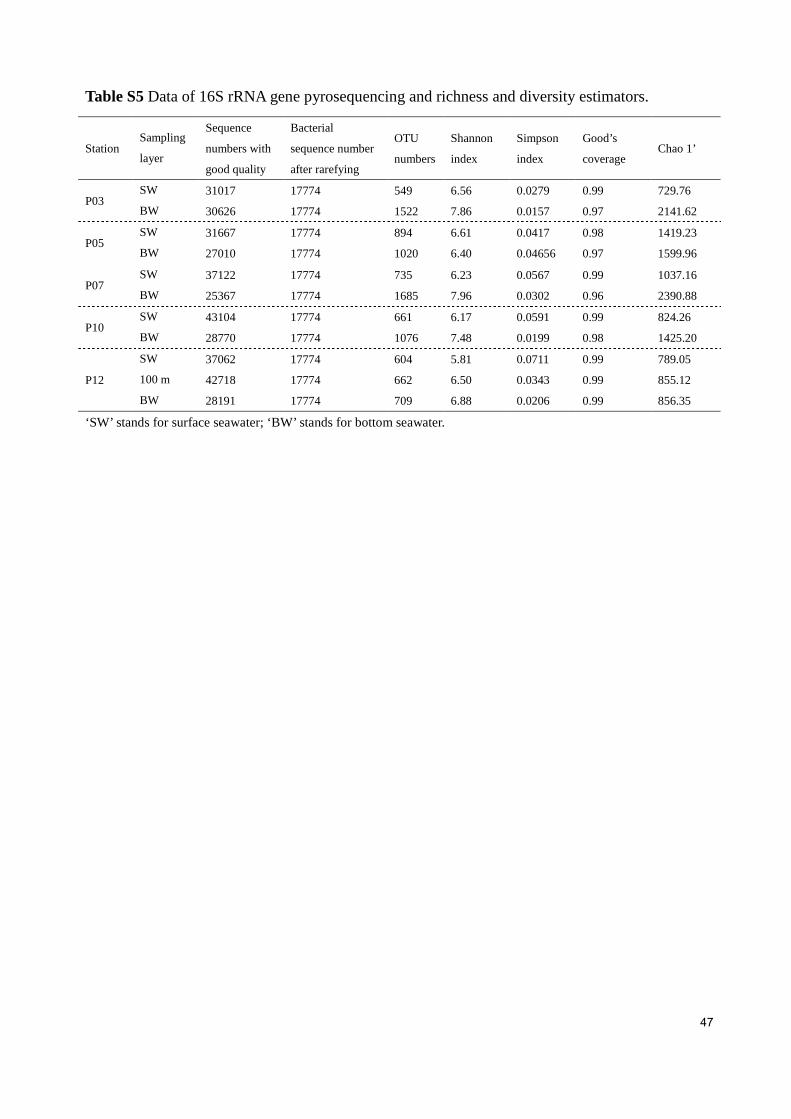
47
Table S5 Data of 16S rRNA gene pyrosequencing and richness and diversity estimators.
Station Sampling
layer
Sequence
numbers with
good quality
Bacterial
sequence number
after rarefying
OTU
numbers
Shannon
index
Simpson
index
Good’s
coverage Chao 1’
P03 SW 31017 17774 549 6.56 0.0279 0.99 729.76
BW 30626 17774 1522 7.86 0.0157 0.97 2141.62
P05 SW 31667 17774 894 6.61 0.0417 0.98 1419.23
BW 27010 17774 1020 6.40 0.04656 0.97 1599.96
P07 SW 37122 17774 735 6.23 0.0567 0.99 1037.16
BW 25367 17774 1685 7.96 0.0302 0.96 2390.88
P10 SW 43104 17774 661 6.17 0.0591 0.99 824.26
BW 28770 17774 1076 7.48 0.0199 0.98 1425.20
P12
SW 37062 17774 604 5.81 0.0711 0.99 789.05
100 m 42718 17774 662 6.50 0.0343 0.99 855.12
BW 28191 17774 709 6.88 0.0206 0.99 856.35
‘SW’ stands for surface seawater; ‘BW’ stands for bottom seawater.
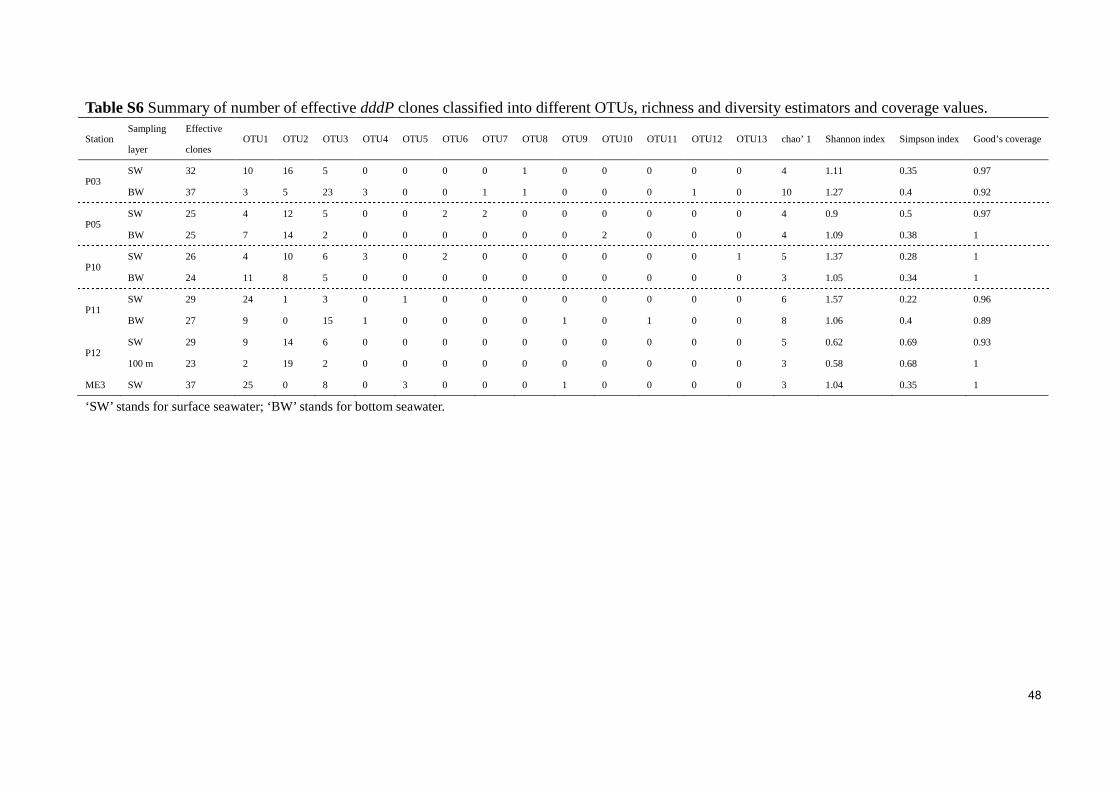
48
Table S6 Summary of number of effective dddP clones classified into different OTUs, richness and diversity estimators and coverage values.
Station Sampling
layer
Effective
clones OTU1 OTU2 OTU3 OTU4 OTU5 OTU6 OTU7 OTU8 OTU9 OTU10 OTU11 OTU12 OTU13 chao’ 1 Shannon index Simpson index Good’s coverage
P03 SW 32 10 16 5 0 0 0 0 1 0 0 0 0 0 4 1.11 0.35 0.97
BW 37 3 5 23 3 0 0 1 1 0 0 0 1 0 10 1.27 0.4 0.92
P05 SW 25 4 12 5 0 0 2 2 0 0 0 0 0 0 4 0.9 0.5 0.97
BW 25 7 14 2 0 0 0 0 0 0 2 0 0 0 4 1.09 0.38 1
P10 SW 26 4 10 6 3 0 2 0 0 0 0 0 0 1 5 1.37 0.28 1
BW 24 11 8 5 0 0 0 0 0 0 0 0 0 0 3 1.05 0.34 1
P11 SW 29 24 1 3 0 1 0 0 0 0 0 0 0 0 6 1.57 0.22 0.96
BW 27 9 0 15 1 0 0 0 0 1 0 1 0 0 8 1.06 0.4 0.89
P12 SW 29 9 14 6 0 0 0 0 0 0 0 0 0 0 5 0.62 0.69 0.93
100 m 23 2 19 2 0 0 0 0 0 0 0 0 0 0 3 0.58 0.68 1
ME3 SW 37 25 0 8 0 3 0 0 0 1 0 0 0 0 3 1.04 0.35 1
‘SW’ stands for surface seawater; ‘BW’ stands for bottom seawater.
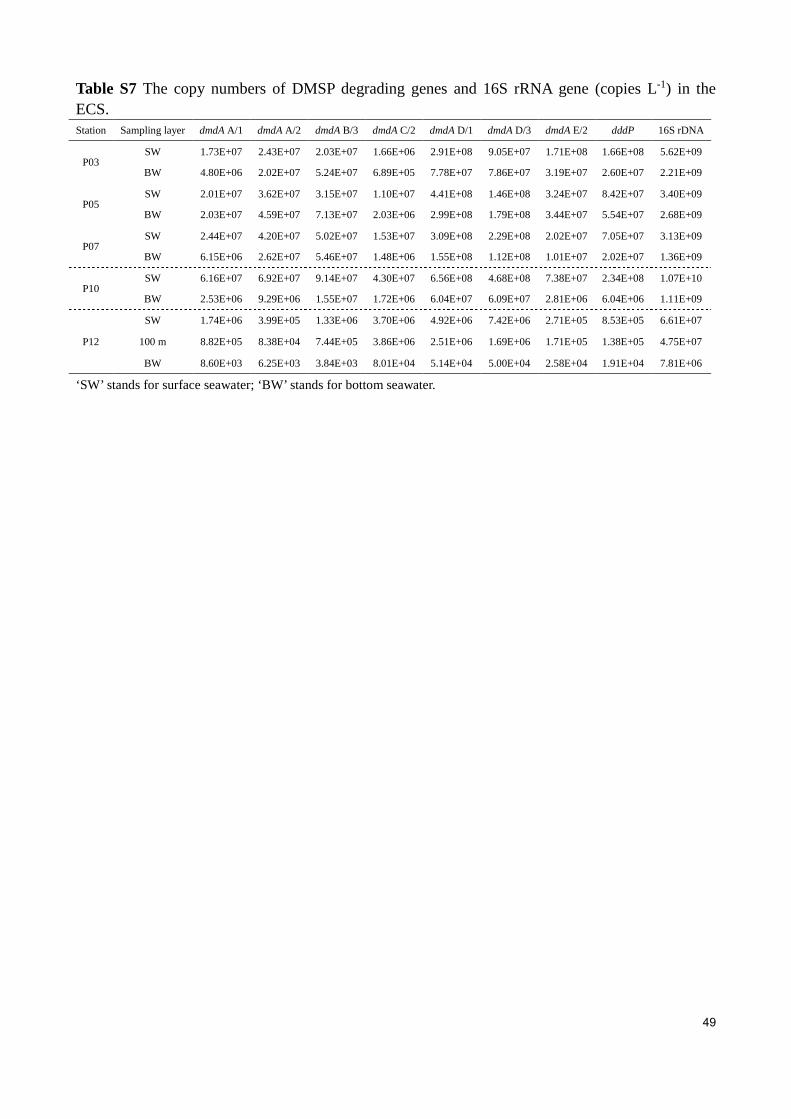
49
Table S7 The copy numbers of DMSP degrading genes and 16S rRNA gene (copies L-1) in the ECS. Station Sampling layer dmdA A/1 dmdA A/2 dmdA B/3 dmdA C/2 dmdA D/1 dmdA D/3 dmdA E/2 dddP 16S rDNA
P03 SW 1.73E+07 2.43E+07 2.03E+07 1.66E+06 2.91E+08 9.05E+07 1.71E+08 1.66E+08 5.62E+09
BW 4.80E+06 2.02E+07 5.24E+07 6.89E+05 7.78E+07 7.86E+07 3.19E+07 2.60E+07 2.21E+09
P05 SW 2.01E+07 3.62E+07 3.15E+07 1.10E+07 4.41E+08 1.46E+08 3.24E+07 8.42E+07 3.40E+09
BW 2.03E+07 4.59E+07 7.13E+07 2.03E+06 2.99E+08 1.79E+08 3.44E+07 5.54E+07 2.68E+09
P07 SW 2.44E+07 4.20E+07 5.02E+07 1.53E+07 3.09E+08 2.29E+08 2.02E+07 7.05E+07 3.13E+09
BW 6.15E+06 2.62E+07 5.46E+07 1.48E+06 1.55E+08 1.12E+08 1.01E+07 2.02E+07 1.36E+09
P10 SW 6.16E+07 6.92E+07 9.14E+07 4.30E+07 6.56E+08 4.68E+08 7.38E+07 2.34E+08 1.07E+10
BW 2.53E+06 9.29E+06 1.55E+07 1.72E+06 6.04E+07 6.09E+07 2.81E+06 6.04E+06 1.11E+09
P12
SW 1.74E+06 3.99E+05 1.33E+06 3.70E+06 4.92E+06 7.42E+06 2.71E+05 8.53E+05 6.61E+07
100 m 8.82E+05 8.38E+04 7.44E+05 3.86E+06 2.51E+06 1.69E+06 1.71E+05 1.38E+05 4.75E+07
BW 8.60E+03 6.25E+03 3.84E+03 8.01E+04 5.14E+04 5.00E+04 2.58E+04 1.91E+04 7.81E+06
‘SW’ stands for surface seawater; ‘BW’ stands for bottom seawater.

50
Table S8 Growth of the representative isolates which can grow with DMSP as the sole carbon source or with mixed carbon source* Bacterial strains DMSP Mixed carbon source
Alphaproteobacteria
Sulfitobacter sp. LZD018 + +
Ahrensia sp. LZD051 w +
Ahrensia sp. LZD062 + +
Gammaproteobacteria
Halomonas sp. LZD012 + +
*Only the strains which are able to grow on DMSP as sole carbon source are listed; for total 57 representative
information, see Table S3.
+, Positive growth; w, weak growth. Growth was considered positive (P < 0.01) or weak (P < 0.05) where the
averages of maximal absorbance of triplicate wells were significantly greater (Student’s t-test) than those of no
organic carbon source controls.
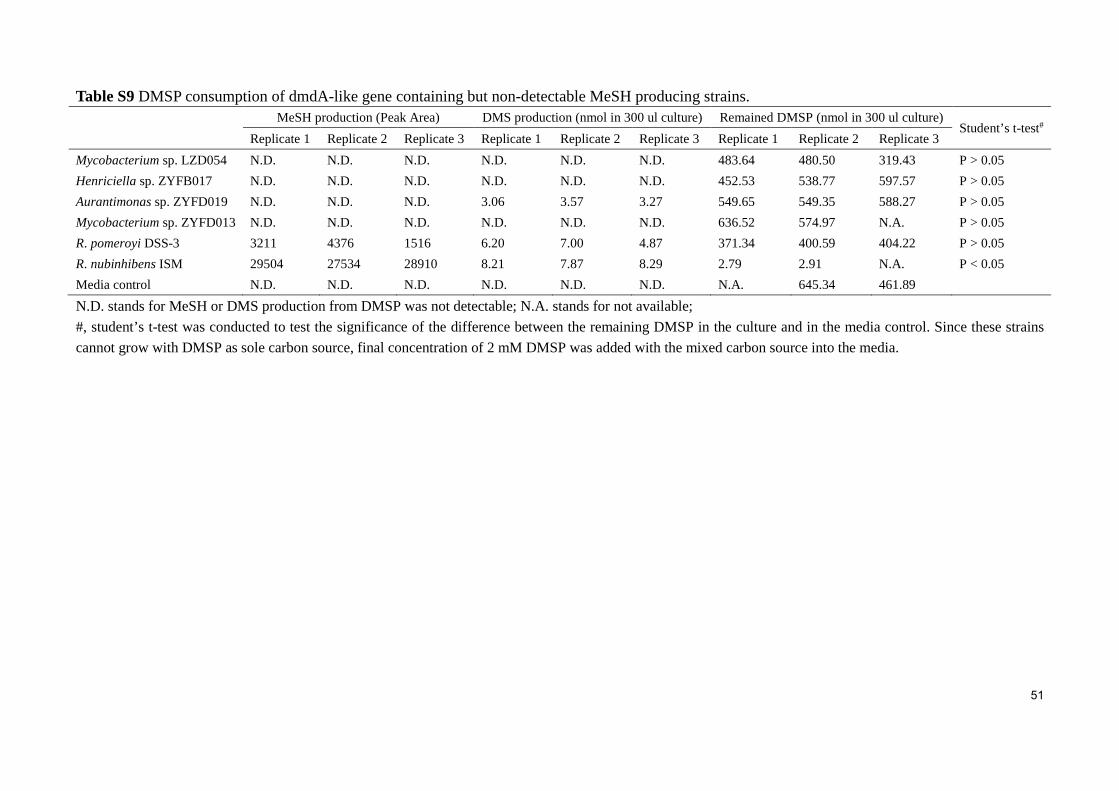
51
Table S9 DMSP consumption of dmdA-like gene containing but non-detectable MeSH producing strains.
MeSH production (Peak Area) DMS production (nmol in 300 ul culture) Remained DMSP (nmol in 300 ul culture) Student’s t-test#
Replicate 1 Replicate 2 Replicate 3 Replicate 1 Replicate 2 Replicate 3 Replicate 1 Replicate 2 Replicate 3
Mycobacterium sp. LZD054 N.D. N.D. N.D. N.D. N.D. N.D. 483.64 480.50 319.43 P > 0.05
Henriciella sp. ZYFB017 N.D. N.D. N.D. N.D. N.D. N.D. 452.53 538.77 597.57 P > 0.05
Aurantimonas sp. ZYFD019 N.D. N.D. N.D. 3.06 3.57 3.27 549.65 549.35 588.27 P > 0.05
Mycobacterium sp. ZYFD013 N.D. N.D. N.D. N.D. N.D. N.D. 636.52 574.97 N.A. P > 0.05
R. pomeroyi DSS-3 3211 4376 1516 6.20 7.00 4.87 371.34 400.59 404.22 P > 0.05
R. nubinhibens ISM 29504 27534 28910 8.21 7.87 8.29 2.79 2.91 N.A. P < 0.05
Media control N.D. N.D. N.D. N.D. N.D. N.D. N.A. 645.34 461.89
N.D. stands for MeSH or DMS production from DMSP was not detectable; N.A. stands for not available;
#, student’s t-test was conducted to test the significance of the difference between the remaining DMSP in the culture and in the media control. Since these strains
cannot grow with DMSP as sole carbon source, final concentration of 2 mM DMSP was added with the mixed carbon source into the media.
52
Reference for supplementary materials 1
Balch, W. E., Fox, G. E., Magrum, L. J., Woese, C. R., and Wolfe, R. S. (1979). Methanogens: 2
reevaluation of a unique biological group. Microbiol. Rev. 43, 260–96. Available at: 3
http://www.ncbi.nlm.nih.gov/pubmed/390357 [Accessed April 14, 2018]. 4
Burkhardt, I., Lauterbach, L., Brock, N. L., and Dickschat, J. S. (2017). Chemical differentiation 5
of three DMSP lyases from the marine Roseobacter group. Org. Biomol. Chem. 15, 6
4432–4439. doi:10.1039/C7OB00913E. 7
Chen, H., Zhang, H., Xiong, J., Wang, K., Zhu, J., Zhu, X., et al. (2016). Successional trajectories 8
of bacterioplankton community over the complete cycle of a sudden phytoplankton bloom in 9
the Xiangshan Bay, East China Sea. Environ. Pollut. 219, 750–759. 10
doi:10.1016/J.ENVPOL.2016.07.035. 11
Choi, D. H., Park, K.-T., An, S. M., Lee, K., Cho, J.-C., Lee, J.-H., et al. (2015). Pyrosequencing 12
Revealed SAR116 Clade as Dominant dddP-Containing Bacteria in Oligotrophic NW Pacific 13
Ocean. PLoS One 10, e0116271. doi:10.1371/journal.pone.0116271. 14
Curson, A. R. J., Fowler, E. K., Dickens, S., Johnston, A. W. B., and Todd, J. D. (2012). Multiple 15
DMSP lyases in the γ-proteobacterium Oceanimonas doudoroffii. Biogeochemistry 110, 16
109–119. doi:10.1007/s10533-011-9663-2. 17
Curson, A. R. J., Liu, J., Bermejo Martínez, A., Green, R. T., Chan, Y., Carrión, O., et al. (2017). 18
Dimethylsulfoniopropionate biosynthesis in marine bacteria and identification of the key 19
gene in this process. Nat. Microbiol. 2, 17009. doi:10.1038/nmicrobiol.2017.9. 20
Curson, A. R. J., Rogers, R., Todd, J. D., Brearley, C. A., and Johnston, A. W. B. (2008). 21
Molecular genetic analysis of a dimethylsulfoniopropionate lyase that liberates the 22
climate-changing gas dimethylsulfide in several marine α-proteobacteria and Rhodobacter 23
sphaeroides. Environ. Microbiol. 10, 757–767. doi:10.1111/j.1462-2920.2007.01499.x. 24
Curson, A. R. J., Sullivan, M. J., Todd, J. D., and Johnston, A. W. B. (2010). Identification of 25
genes for dimethyl sulfide production in bacteria in the gut of Atlantic Herring (Clupea 26
harengus). ISME J. 4, 144–146. doi:10.1038/ismej.2009.93. 27
Curson, A. R. J., Sullivan, M. J., Todd, J. D., and Johnston, A. W. B. (2011). DddY, a periplasmic 28
dimethylsulfoniopropionate lyase found in taxonomically diverse species of Proteobacteria. 29
ISME J. 5, 1191–1200. doi:10.1038/ismej.2010.203. 30
Howard, E. C., Henriksen, J. R., Buchan, A., Reisch, C. R., Bürgmann, H., Welsh, R., et al. 31
(2006). Bacterial taxa that limit sulfur flux from the ocean. Science 314, 649–652. 32
doi:10.1126/science.1130657. 33
Howard, E. C., Sun, S., Biers, E. J., and Moran, M. A. (2008). Abundant and diverse bacteria 34
involved in DMSP degradation in marine surface waters. Environ. Microbiol. 10, 2397–2410. 35
doi:10.1111/j.1462-2920.2008.01665.x. 36
Howard, E. C., Sun, S., Reisch, C. R., del Valle, D. A., Bürgmann, H., Kiene, R. P., et al. (2011). 37
Changes in dimethylsulfoniopropionate demethylase gene assemblages in response to an 38
induced phytoplankton bloom. Appl. Environ. Microbiol. 77, 524–31. 39
doi:10.1128/AEM.01457-10. 40
Lane, D. J. (1991). 16S/23S rRNA sequencing. Nucleic acid Tech. Bact. Syst. Available at: 41
https://ci.nii.ac.jp/naid/10005795102/ [Accessed April 15, 2018]. 42
Levine, N. M., Varaljay, V. A., Toole, D. A., Dacey, J. W. H., Doney, S. C., and Moran, M. A. 43
(2012). Environmental, biochemical and genetic drivers of DMSP degradation and DMS 44
53
production in the Sargasso Sea. Environ. Microbiol. 14, 1210–1223. 45
doi:10.1111/j.1462-2920.2012.02700.x. 46
Li, C.-Y., Wei, T.-D., Zhang, S.-H., Chen, X.-L., Gao, X., Wang, P., et al. (2014). Molecular 47
insight into bacterial cleavage of oceanic dimethylsulfoniopropionate into dimethyl sulfide. 48
Proc. Natl. Acad. Sci. U. S. A. 111, 1026–31. doi:10.1073/pnas.1312354111. 49
Peng, M., Xie, Q., Hu, H., Hong, K., Todd, J. D., Johnston, A. W. B., et al. (2012). Phylogenetic 50
diversity of the dddP gene for dimethylsulfoniopropionate-dependent dimethyl sulfide 51
synthesis in mangrove soils. Can. J. Microbiol. doi:10.1139/w2012-019. 52
Raina, J.-B., Tapiolas, D., Willis, B. L., and Bourne, D. G. (2009). Coral-associated bacteria and 53
their role in the biogeochemical cycling of sulfur. Appl. Environ. Microbiol. 75, 3492–3501. 54
doi:10.1128/AEM.02567-08. 55
Steinsbu, B. O., Thorseth, I. H., Nakagawa, S., Inagaki, F., Lever, M. A., Engelen, B., et al. 56
(2010). Archaeoglobus sulfaticallidus sp. nov., a thermophilic and facultatively 57
lithoautotrophic sulfate-reducer isolated from black rust exposed to hot ridge flank crustal 58
fluids. Int. J. Syst. Evol. Microbiol. 60, 2745–2752. doi:10.1099/ijs.0.016105-0. 59
Todd, J. D., Curson, A. R. J., Dupont, C. L., Nicholson, P., and Johnston, A. W. B. (2009). The 60
dddP gene, encoding a novel enzyme that converts dimethylsulfoniopropionate into dimethyl 61
sulfide, is widespread in ocean metagenomes and marine bacteria and also occurs in some 62
Ascomycete fungi. Environ. Microbiol. 11, 1376–1385. 63
doi:10.1111/j.1462-2920.2009.01864.x. 64
Todd, J. D., Curson, A. R. J., Kirkwood, M., Sullivan, M. J., Green, R. T., and Johnston, A. W. B. 65
(2011). DddQ, a novel, cupin-containing, dimethylsulfoniopropionate lyase in marine 66
roseobacters and in uncultured marine bacteria. Environ. Microbiol. 13, 427–438. 67
doi:10.1111/j.1462-2920.2010.02348.x. 68
Todd, J. D., Curson, A. R. J., Nikolaidou-Katsaraidou, N., Brearley, C. A., Watmough, N. J., 69
Chan, Y., et al. (2010). Molecular dissection of bacterial acrylate catabolism - unexpected 70
links with dimethylsulfoniopropionate catabolism and dimethyl sulfide production. Environ. 71
Microbiol. 12, 327–343. doi:10.1111/j.1462-2920.2009.02071.x. 72
Todd, J. D., Kirkwood, M., Newton-Payne, S., and Johnston, A. W. B. (2012). DddW, a third 73
DMSP lyase in a model Roseobacter marine bacterium, Ruegeria pomeroyi DSS-3. ISME J. 74
6, 223–226. doi:10.1038/ismej.2011.79. 75
Todd, J. D., Rogers, R., Li, Y. G., Wexler, M., Bond, P. L., Sun, L., et al. (2007). Structural and 76
regulatory genes required to make the gas dimethyl sulfide in bacteria. Science 315, 666–9. 77
doi:10.1126/science.1135370. 78
Varaljay, V. A., Howard, E. C., Sun, S., and Moran, M. A. (2010). Deep sequencing of a 79
dimethylsulfoniopropionate-degrading gene (dmdA) by using PCR primer pairs designed on 80
the basis of marine metagenomic data. Appl. Environ. Microbiol. 76, 609–617. 81
doi:10.1128/AEM.01258-09. 82
Yin, Q., Fu, B., Li, B., Shi, X., Inagaki, F., and Zhang, X.-H. (2013). Spatial Variations in 83
Microbial Community Composition in Surface Seawater from the Ultra-Oligotrophic Center 84
to Rim of the South Pacific Gyre. PLoS One 8, e55148. doi:10.1371/journal.pone.0055148. 85
86