novel magnetic resonance probes - tdl
TRANSCRIPT

NOVEL MAGNETIC RESONANCE PROBES
by
Zohreh Hashami
APPROVED BY SUPERVISORY COMMITTEE:
___________________________________________
Zoltan Kovacs, Co-Chair
___________________________________________
John W. Sibert, Co-Chair
___________________________________________
Warren J. Goux
___________________________________________
Paul Pantano

Copyright 2018
Zohreh Hashami
All Rights Reserved

To my loving family
NOVEL MAGNETIC RESONANCE PROBES
by
Zohreh Hashami, BS, MS
DISSERTATION
Presented to the Faculty of
The University of Texas at Dallas
in Partial Fulfillment
of the Requirements
for the Degree of
DOCTOR OF PHILOSOPHY IN
CHEMISTRY
THE UNIVERSITY OF TEXAS AT DALLAS
May 2018

v
ACKNOWLEDGMENTS
I would like to acknowledge my research advisor, Dr. Zoltan Kovacs, for his constant
support, training and encouragement during my research. Without his help I could not have made
it this far. I would like to thank Dr. John W. Sibert, my Co-Chair, for all his support and advice.
Thanks to my committee members, Dr. Paul Pantano and Dr. Warren Goux, for their helpful
suggestions and advice. It has been an honor to have you all on my committee.
I also thank Dr. Andre Martins, for sharing his NIR lanthanides expertise with me and for his
enlightening discussions and advice. Also, I want to thank Dr. Alex Funk and Dr. Veronica
Clavijo Jordan for their help with MR imaging. Thanks to Dr. Charlie Khemtong and Nesmine
Maptue for their assistance with hyperpolarization experiments.
I would also like to acknowledge our collaborators Dr. Svetlana Eliseeva and Stephane Petoud at
the Centre de Biophysique Moléculaire, France for their contribution involving the optical
characterization of the lanthanide complexes. A special thank you goes out to Dr. Dean Sherry
for giving me the opportunity to work the AIRC.
Most importantly, I would like to thank my family for the encouragement, love and constant
support.
“So that in all things God may be glorified.”
January 2018
vi
NOVEL MAGNETIC RESONANCE PROBES
Zohreh Hashami, PhD
The University of Texas at Dallas, 2018
ABSTRACT
Supervising Professors: Zoltan Kovacs, Co-Chair
John W. Sibert, Co-Chair
The goal of my first project was the synthesis and characterization of novel DOTA (1,4,7,10-
tetraazacyclododecane-1,4,7,10-tetraacetic acid) based ligands with one and two chromophoric
tropone coordinating sidearms for the construction of lanthanide based magnetic
resonance/optical imaging probes. Lanthanide ions have nearly identical coordination chemistry
properties and therefore, the same ligand can be applied to the entire lanthanide series. The
development of dual magnetic resonance/optical imaging probes is an exciting current trend in
the research area of lanthanide based imaging agents because these probes could combine the
high spatial resolution of MRI with the high sensitivity of optical detection. The challenge in the
design of these agents is that the requirements for an efficient MR agent (presence of an inner
sphere water molecule) are seemingly incompatible with those of optical agents (absence of
inner sphere water molecules). Three ligands were synthesized: 1,4,7,10-tetraazacyclododecane-
1,4,7-tris(acetic acid)-10-(2-tropone) (1), 1,4,7,10-tetraazacyclododecane-1,7-bis(acetic acid)-
4,10-bis(2-tropone), (2) and 1,4,7,10-tetraazacyclododecane-1,4,7-tris(aceticacid)-10-[2-(4-
isopropyl)-tropone) (3) . Ln3+complexes of these ligands were found to have one inner-sphere

vii
water molecule. The 𝑟1 relaxivity of Gd3+ complexes was found to be similar to that of the
commercial Gd-based MRI agents. Relaxivity measurements in the presence of human serum
albumin (HSA) showed that the Gd3+ complexes weakly bind to HSA. Variable temperature 17O
NMR measurements revealed that the neutral O-donor atom of the tropone moiety slows down
the water exchange rate of the Gd3+ complexes compared to that for GdDOTA. In vivo MR
imaging experiments with Gd1 and Gd3 in mice revealed that the agents were excreted by the
kidneys and the liver. The complexes did not show any toxicity at the injected doses (0.1
mmol/kg). The photophysical properties of the Gd3+, Nd3+ and Yb3+ complexes of ligand 1 and 2
were studied by recording the absorption, excitation and emission spectra. The Nd3+ and Yb3+
complexes were found to exhibit bright NIR emission even in aqueous solutions, which indicates
that the tropone unit is an efficient sensitizer for these Ln3+ions. The favorable relaxivity of the
Gd3+ complexes and the bright NIR luminescence of the Nd3+ and Yb3+ complexes demonstrate
that the tropone chromophore combined with the DOTA framework offers a useful platform for
the design of lanthanide-based dual MR/optical imaging agents for in vivo applications.
My second project is related to hyperpolarized 13C magnetic resonance
spectroscopy/imaging. The goal of this project was the synthesis of monoethyl [4-13C]-
oxaloacetate and its evaluation in dissolution dynamic nuclear polarization NMR experiments as
a metabolic probe. Monoethyl [4-13C]-oxaloacetate disodium salt was successfully synthesized.
Perfused liver experiments revealed that the compound was taken up by the liver, and
metabolized to maleate, citrate and aspartate. Dynamic nuclear polarization to enhance the 13C
spin polarization was successfully performed, however, the T1 relaxation time of the 13C label at

viii
the C4 position was very short (about 14 s), which precluded its in vivo application as a
hyperpolarized 13C metabolic probe.

ix
TABLE OF CONTENTS
ACKNOWLEDGMENTS ...............................................................................................................v
ABSTRACT .................................................................................................................................. vi
LIST OF FIGURES ...................................................................................................................... xi
LIST OF TABLES ....................................................................................................................... xiv
LIST OF SCHEMES......................................................................................................................xv
CHAPTER 1 INTRODUCTION .................................................................................................1
CHAPTER 2 EFFICIENT DUAL MR/NIR IMAGING PROBES IN AQUEOUS
MEDIUM ...............................................................................................................9
2.1 INTRODUCTION .................................................................................................................9
2.1.1 Prediction of the Solomon Bloembergen Morgen Theory ...............................14
2.1.2 PARACEST agents ..........................................................................................18
2.1.3 Safety of lanthanides based contrast agents .....................................................19
2.1.4 Luminescence .................................................................................................20
2.1.5 Magnetic resonance/Optical Imaging .............................................................25
2.2 PROJECT GOAL ................................................................................................................27
2.3 EXPERIMENTAL ...............................................................................................................30
2.3.1 Synthesis…………………………………………………………………….30
2.3.2 Relaxivity measurements……………………………………………………31
2.3.3 17O NMR measurements……………………………………………………39
2.3.4 Data analysis………………………………………………………………...42
2.3.5 In vivo experiment…………………………………………………………..43
2.3.6 Photophysical measurement………………………….. ..................................43

x
2.4 RESULT AND DISCUSSION ............................................................................................44
2.4.1 Structural characterization .............................................................................44
2.4.2 High resolution of 1H NMR spectra...............................................................47
2.4.3 Determination of number of inner sphere water molecule ............................52
2.4.4 Relaxivity measurements at 1.4T and 0.47 ....................................................52
2.4.5 Relaxivity measurements in presence of HAS ...............................................60
2.4.6 In vivo imaging ..............................................................................................64
2.4.7 Near Infrared (NIR) luminescence .................................................................68
2.5 CONCLUSION ....................................................................................................................75
CHAPTER 3 HYPERPOLARIZED 13C LABELED OXALOACETATE
DERIVATIVES AS POTENTIAL MR PROBE FOR METABOLIS ................76
3.1 INTRODUCTION ...............................................................................................................76
3.1.1 The mechanism of dynamic nuclear polarization (DNP) ..............................78
3.1.2 The effect of nuclear spin lattice T1 relaxation on Polarization .....................81
3.1.3 The dependence of polarization build-up on microwave frequency,
power, temperature and free radical concentration ........................................82
3.1.4 The HyperSense DNP polarizer .....................................................................82
3.1.5 The impact and significance of the liquid state DNP NMR ..........................85
3.2 PROJECT GOAL.................................................................................................................87
3.3 EXPERIMENTAL ...............................................................................................................92
3.3.1 Synthesis .......................................................................................................92
3.3.2 Data analyses ................................................................................................93
3.3.3 Liver perfusion ..............................................................................................94
3.3.4 Perchloric acid (PCA) extraction ..................................................................96

xi
3.4 RESULT AND DISSCUSSION ..........................................................................................97
3.4.1 Synthesis .......................................................................................................97
3.4.2 Isolated, perfused liver experiment ...............................................................98
3.4.3 In vivo DNP-NMR studies of oxaloacetate .................................................100
3.4.4 Liver perfusion experiment with hyperpolarized[4-13C] monoethyl
oxaloacetate disodium salt ..........................................................................102
3.5 CONCLUSION ..................................................................................................................103
REFERENCES ............................................................................................................................104
BIOGRAPHICAL SKETCH .......................................................................................................115
CURRICULUM VITAE

xii
LIST OF FIGURES
Figure 1.1 The Larmor precession. The direction of the precession is determined by
the right hand rule (ω = -γB0) ..................................................................................2
Figure 1.2 The spin-lattice or longitudinal (T1) relaxation time ................................................4
Figure 1.3 The spin-spin or transverse relaxation time (T2) ......................................................5
Figure 1.4 Basic spin echo (SE) pulse sequence for MR imaging .............................................7
Figure 1.5 The SPINLab DNP polarizer at the UT Southwestern Medical Center for
clinical applications. The DNP polarizer is shown on the left while the
computer and quality control unit is on the right .....................................................8
Figure 2.1 Structure of Gd-DOTA showing the inner sphere water molecule,
(DOTA=1,4,7,10-tetraazacyclododecane-1,4,7,10-tetraacetic acid) .....................10
Figure 2.2 Physical parameters influencing the relaxation efficiency of MRI contrast
agents at the molecular level ...................................................................................11
Figure 2.3 The dependence of r1 relaxivity on by τM and τR at 1.5 T and assuming an
electronic relaxation time (T1e) of 10 ns of the Gd3+ ..............................................14
Figure 2.4 Sensitizing lanthanide ions by an organic chromophore .........................................22
Figure 2.5 MR and NIR optical sentinel lymph node imaging of breast cancer in a mouse are
shown ......................................................................................................................26
Figure 2.6 Structure of DOTA, tropolone, and the DOTA-tropone derivatives
discussed in this work .............................................................................................29
Figure 2.7 Model of LnDOTA –type chelate............................................................................48
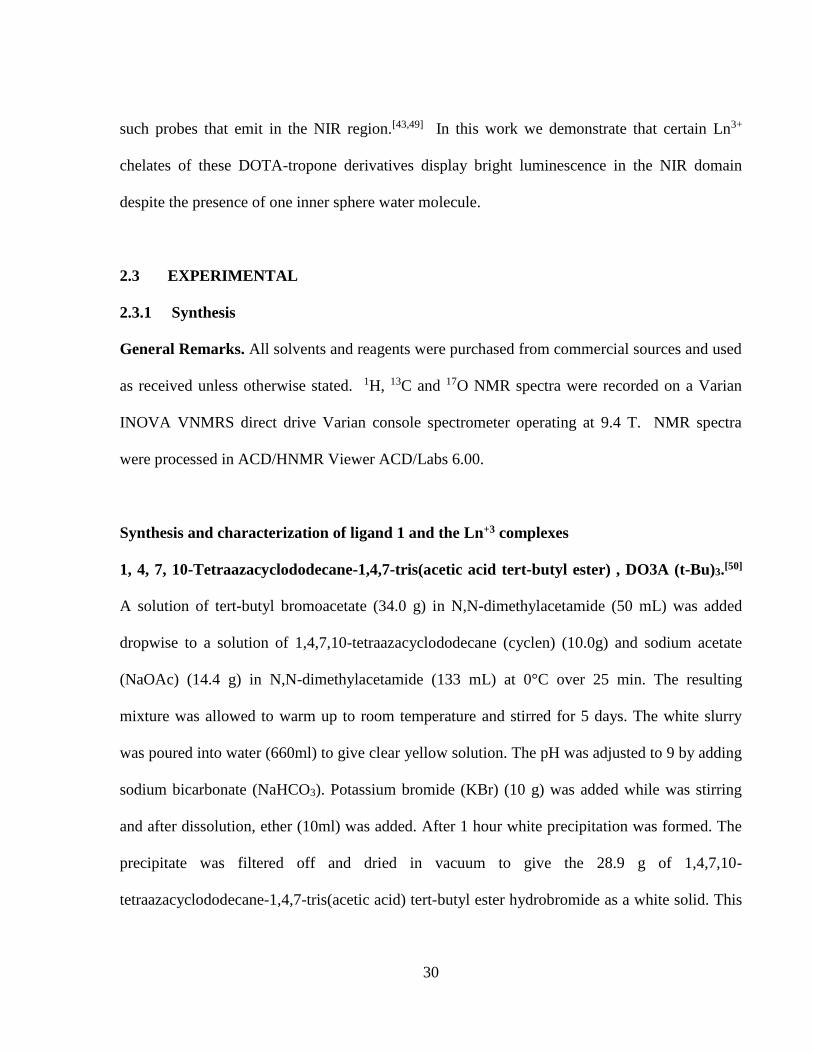
Figure 2.8a 1H NMR spectra of Nd1 ..........................................................................................49
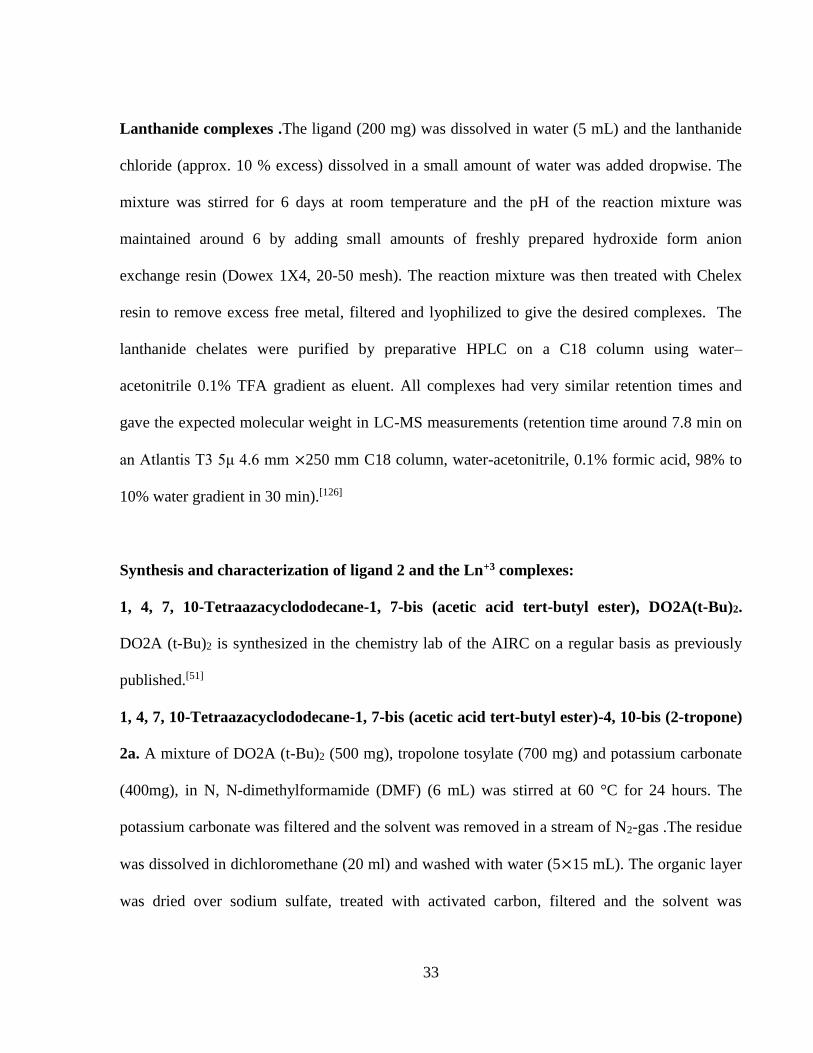
Figure 2.8b 1H NMR spectra of Yb1 ..........................................................................................49
Figure 2.8c 1H NMR spectra of Eu1 ...........................................................................................50
Figure 2.9a 1H NMR spectra of Nd2 ..........................................................................................50
Figure 2.9b 1H NMR spectra of Yb2 ..........................................................................................51
xiii
Figure 2.9c 1H NMR spectra of Eu2 .........................................................................................51
Figure 2.10 Plot of relaxation rate of Gd1 versus concentration at 0.47T &1.4T ....................53
Figure 2.11 Plot of relaxation rate of Gd2 versus concentration at 0.47T &1.4T ....................54
Figure 2.12 Plot of relaxation rate of Gd3 versus concentration at 0.47T &1.4T ....................54
Figure 2.13 Commercially available linear (open chain) and macrocyclic Gd containing MRI
contrast agents that do not bind to serum albumin ...............................................55
Figure 2.14 Temperature dependence of the17O linewidth (points) of the bulk water of
a Gd[DOTA] (red), Gd3 (black) Gd1 (blue) and Gd2 (green) solution in
H2O containing 2 % H217O at 9.4 T ......................................................................58
Figure 2.15 The effect of the tropone sidearm on the water exchange rate of lanthanide
complexes in DOTA based ligands in comparison to other coordinating
groups ....................................................................................................................59
Figure 2.16 Peripheral vascular enhancement in the thighs of healthy volunteer. The
image was recorded at 1.5 T using a gradient echo pulse sequence. The
dose of the agent was 0.05 mmol/kg .....................................................................61
Figure 2.17 Proton relaxation enhancement data to assess HSA binding Gd1, Gd2
and Gd3 complexes:E-titration at 0.1 mM Gd-complex as a function of
increasing [HSA] ..................................................................................................62
Figure 2.18 Commercially available Gd-based MRI agents that bind to HAS ........................63
Figure 2.19 Axial T1 weighted images of mice after injection of Gd1 .....................................65
Figure 2.20 Axial T1 weighted images of mice after injection of Gd1 .....................................66
Figure 2.21 Axial T1 weighted images of mice after injection of Gd .......................................67
Figure 2.22 Absorption spectra of aqueous solutions of Ln1 and Ln 2 chelates;
300 µM solutions in HEPES buffer (pH =7.4), room temperature ......................68
Figure 2.23 Phosphorescence spectrum (a) Gd1, (b) Gd2; under excitation at 340 nm
at 77K ....................................................................................................................69
Figure 2.24 Excitation and emission spectra of the Nd (a, b) and Yb (c, d) complexes
recorded in 300 µM solutions in H2O and D2O, at 25 °C ........................……….71
xiv
Figure 2.25 Luminescence decay curves for Nd1 and Yb1 (top) and Nd2 and Yb2
(bottom) in H2O (black) and D2O (red)……………………………………….....74
Figure 3.1 Paramagnetic species used as DNP polarizing agents………………...................78
Figure 3.2 Mechanism of DNP at 1.4K and 3.35T…………………………………………..80
Figure 3.3 Commercially available Hypersense DNP polarizer at UTSW……......................81
Figure 3.4 The structure of dissolution DNP polarizers……………………………………..83
Figure 3.5 DNP spectra of different radicals recorded in the HyperSense polarizer
(40ml) aliquots of 1:1 [1-13C] pyruvic acid: sulfolane glass doped with
different radicals……………...…………………………………………………..84
Figure 3.6 13C MR imaging of lactate pool with hyperpolarized [1-13C]-Pyruvate in
rats with implanted p22 tumors……….…………………………………..……...85
Figure 3.7 Measuring mitochondrial PDH activity in heart muscle using
hyperpolarized (HP) [1-13C] pyruvate…………………………………………....86
Figure 3.8 Pyruvate is involved in several important metabolic processes……………….....88
Figure 3.9 The metabolic role of oxaloacetate……………………………………………….91
Figure 3.10 The conversion of [4-13C]-monoethyl oxaloacetate to [1-13C]-citrate,
[4-13C]-malate and [4-13C]-aspartate in the TCA cycle……………………….....98
Figure 3.11 Full 13C NMR spectrum at 600 MHz of a mouse liver extract after
perfusion with that [4-13C]-monoethyl oxaloacetate………………...….………..99
Figure 3.12 The 174 - 186 ppm region of the above 13C NMR spectrum showing the
metabolites of [4-13C]-monoethyl oxaloacetate……………………….................99
Figure 3.13 T1 decay of hyperpolarized magnetization of [[4-13C] monoethyl
oxaloacetate disodium salt after dissolution in KH buffer………..…................101
Figure 3.14 13C NMR spectrum (sum of 20 FIDs) of isolated mouse liver perfused with
perfused with 0.2 mM hyperpolarized [4-13C]- monoethyl oxaloacetate
disodium salt and 0.2 mM octanoate……………………………………….…..102

xv
LIST OF TABLES
Table 2.1 Luminescent transitions of Ln(III) aqua ions .........................................................23
Table 2.2 Summarized relaxivity data at different magnetic field……………….................55
Table 2.3 Fitting results of the water exchange rates for GdDOTA , Gd3, Gd1 and
Gd2at 9.4 T in 2 % 17O water ................................................................................59
Table 2.4 Parameters obtained from relaxometric titrations of Gd-complexes with
human serum albumin (0.47 T, 310 K) ………………………………………….63
Table 2.5 Summarized quantum yields data in H2O and D2O………………………………72

xvi
LIST OF SCHEMES
Scheme 2.1 Synthesis of ligand 1 and its complexes…………………………………………45
Scheme 2.2 Synthesis of ligand 2 and its complexes…………………………………………46
Scheme 2.3 Synthesis of ligand 3 and its complexes…………………………………………47
Scheme 3.1 Synthesis of [4-13C] monoethyl oxaloacetate……………………………………97

1
CHAPTER 1
INTRODUCTION
In this introductory chapter a brief overview of the basic principles of nuclear magnetic
resonance (NMR) and magnetic resonance imaging (MRI) is given to aid further discussions.
Spin is an intrinsic property of all particles. According to the classic picture, spin is associated
with the intrinsic spin of the particle. The intrinsic spin is related to an intrinsic angular
momentum (�� = 𝛾 𝑗 ). The magnitude of magnetic momentum µ is directly proportional to the
gyromagnetic ratio 𝛾 and its spin angular momentum J which can be define in a terms of
dimensionless spin I ( J= ℏI).
μ = γℏI (1.1)
where ℏ is the reduced Plank’s constant (h/2π), (6.626×10⁻³⁴ Js) and 𝛾 is gyromagnetic ratio.
Spin is quantized, and therefore, it can have values I= 0,1/2, 3/2,… In the absence of an external
magnetic field, degenerate spins occupy the same energy level. However, in the presence of an
external B0 magnetic field the degeneracy is broken giving rise to (2I+1) energy levels varying
from –I to +I. This phenomenon known as the Zeeman effect. For a spin ½ nucleus Iz = -1/2,
+1/2. Thus, in the presence of an external B0 magnetic field, the Zeeman splitting gives rise to
two energy levels (E1,2 = ±½µB0).[1] Since energy is a scalar quantity, it is defined by the dot or
scalar product of the magnetic moment and the B0 field,
Energy =µ·B0 =γℏI B0 (1.2)
where (I =𝐼𝑥 + 𝐼𝑦 + 𝐼𝑧) and since there are no x and y components, the energy can be written as
Energy =γℏ𝐼𝑧 B0 (1.3)
2
The magnetic energy is highest when the magnetic moment is opposite to the B0 field. The
difference between the two levels is then given as:
ΔE = E2 - E1 = ½ γħB0 - (-½ γħB0) = γħB0 (1.4)
where γ is the gyromagnetic ratio. This energy difference corresponds to the energy of a photon
with frequency ν:
γħB0 = hν = ħ2πν = ħω (1.5)
from this, the basic equation of nuclear magnetic resonance can be written as:
ω = γB0 (1.6)
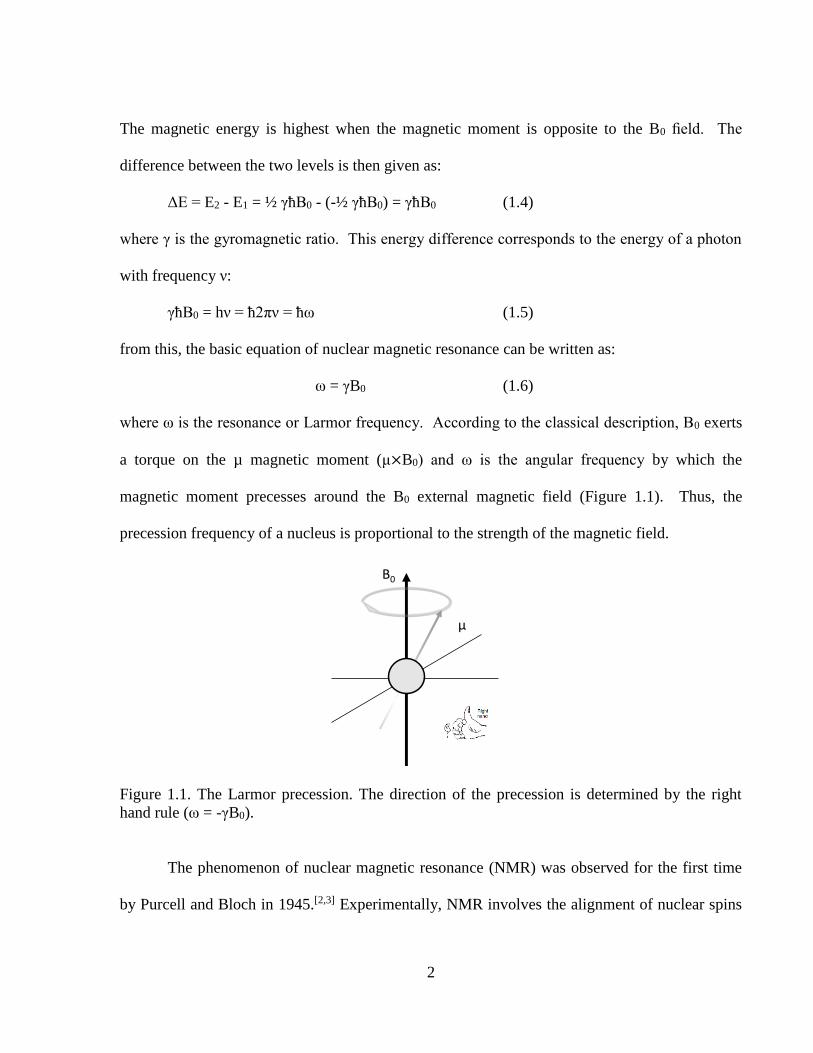
where ω is the resonance or Larmor frequency. According to the classical description, B0 exerts
a torque on the µ magnetic moment (μ×B0) and ω is the angular frequency by which the
magnetic moment precesses around the B0 external magnetic field (Figure 1.1). Thus, the
precession frequency of a nucleus is proportional to the strength of the magnetic field.
Figure 1.1. The Larmor precession. The direction of the precession is determined by the right
hand rule (ω = -γB0).
The phenomenon of nuclear magnetic resonance (NMR) was observed for the first time
by Purcell and Bloch in 1945.[2,3] Experimentally, NMR involves the alignment of nuclear spins
µ
B0
3
in an external magnetic field (B0) followed by the perturbation of the spin ensemble by a B1
rotating magnetic field (radiofrequency pulse) perpendicular to B0 .The B1 field is generated by a
radiofrequency coil positioned in the xy plane and an electric signal is detected by the same coil
(receiver coil) in the same direction. In the absence of external magnetic field, all nuclear spins
are randomly oriented and no net magnetization will be observed in the sample. In presence of an
external magnetic field (B0), the ensemble of nuclear spins gives rise to a bulk magnetization
(Mz) in the sample parallel to the external magnetic field. The B1 magnetic field (radiofrequency
pulse) applied perpendicular to the B0 field rotates the Mz magnetization towards the xy plane
when its frequency matches the Larmor frequency. This process generates a rotating Mxy
component that induces a current in the receiver coil (free induction decay). The degree by which
the magnetization is tipped towards the xy plane depends on the duration of B1. A 90◦
radiofrequency pulse will tip the magnetization entirely into the xy plane (Mz = 0) .When B1 is
turned off, the magnetization returns to its equilibrium state in B0 field. The time constant
characterizing the return of Mz component to its equilibrium value is called the spin-lattice or
longitudinal (T1) relaxation time. This process relies on energy exchange between the nuclear
spin system and its environment (lattice) hence the name spin-lattice relaxation. The inverse of
T1 is the relaxation rate (R1). After applying the radiofrequency pulse, all nuclear spins will
precess in phase in the xy plane.
However, due to spin-spin interactions there are small differences in Larmor frequency of
the spins and they will precess individually with slightly different angular velocity in the xy
plane. This causes the loss of their phase coherency over time. This process is known as spin-

4
spin or transverse relaxation and it is characterized by the transverse relaxation time (T2). There
is no energy loss during dephasing.
Figure 1.2. The spin-lattice or longitudinal (T1) relaxation time.
Local field inhomogeneity also significantly contributes to dephasing and the measured
relaxation time T2* is usually much shorter than T2. It should be mentioned that the electric
signal (free induction decay, FID) generated by the Mxy component of magnetization decays
according to the T2*. An interesting feature of dephasing is that it can be reversed multiple times
before complete decay by applying a 180 degree pulse, which will lead to refocusing (spin-echo).
This has special importance for imaging.[4] NMR forms the basis of magnetic resonance imaging
(MRI), which has become one of the most important medical imaging modalities.[1,5] Magnetic
resonance imaging (MRI) is a non-invasive diagnostic tool widely used in clinical medicine that
can provide high-resolution images of soft tissues. A conventional MR image is a map of 1H
z
x
y
Mz
Mxy
z
x y
Mz
Mxy
After a 90 pulse
z
x
y
Mz
Mxy
T1 relaxation
Mz = M0(1-e-t/T1)

5
NMR signal intensities, which primarily depends on the proton density, the longitudinal (spin-
lattice or T1) and transversal (spin-spin or T2) relaxation times in tissues.
Figure 1.3. The spin-spin or transverse relaxation time (T2).
Image contrast originates from differences in these parameters as shown in the following
equation:
Signal intensity ∼ p (1 −𝑒−𝑇𝑅/𝑇1) 𝑒−𝑇𝐸/𝑇2 (1.7)
Where p is proton density, T1 and T2 are the longitudinal and transverse relaxation times
respectively, TR is the repetition time (the interval between two successive excitations of the
same slice) and TE is the echo time (the interval between application of the initial excitation
radiofrequency pulse and the maximum of the spin echo). Very briefly, short T1 regions have
high intensity (bright) when short TR and short TE is used (T1 weighted image), while short T2
regions have low intensity (dark) when long TR and long TE is used (T2 weighted image). About
3/4 of the human body consist of water; therefore, the major contribution to the MRI signal
comes from water protons in tissues. Image contrast arises from variations of water density and
z
x
y
Mz
Mxy
z
x
y
Mz
Mxy
z
x
y
Mz
Mxy
Mxy = Mxy(0)e-t/T2

6
proton relaxation times in tissues. There are large differences in relaxation times between
different tissues and more importantly, between normal and diseased tissues. It has been known
since 1971 that malignant tissues have longer T1 and T2 than normal tissues.[4] Any agent or
process that affects the p, T1 and T2 will also alter image contrast. For example, paramagnetic
species such as metal ions and free radicals enhance contrast by shortening the relaxation
times.[6] To obtain 3D MRI images that are used in the clinical practice, MR scanners are
equipped with gradient coils that generate magnetic field gradients in x,y and z directions. The
gradient fields superimpose on the B0 field and are applied to change the frequency and phase of
the nuclear spins. The gradient along the z-axis is used for slice selection. The other two
gradients separate signals within the slice, by frequency encoding along the x-axis and phase
encoding along the y- axis.[1]
The Hahn spin echo sequence forms the basis for the most commonly used MRI pulse
sequences. The spin system is exited with a 90° rf pulse and then one or more 180° pulses are
applied to refocus the spins to achieve spin echoes. These refocus the spins and recover
transverse magnetization. For slice selection, the z-gradiens (Gz) are turned on for the duration
of the rf pulses. Before readout (signal acquisition), the Gy gradients are turned on to generate
phase shifts (phase encoding). The Gx gradients are applied during acquisition to achieve
frequency encoding by varying the resonance frequency in the direction of the frequency-
encoding gradient Gx. The spin coherence can also be reformed by gradient echo, in this case,
one rf pulse is applied followed by gradient reversal, which refocuses the spins (gradient
echo).The main advantage of gradient echo (GRE) over spin echo (SE) sequences is that the use
of only one rf pulse leads to shorter TE echo time, which facilitates faster signal acquisition.

7
However, conventional NMR suffers from low sensitivity which can be problematic for nuclei
with low natural abundance and/or small gyromagnetic ratio. This is the main reason why
magnetic resonance spectroscopy/imaging of nuclei other than 1H is not performed in the clinical
practice despite the fact that observing 13C, for example, would be potentially very informative.
Figure 1.4. Basic spin echo (SE) pulse sequence for MR imaging.
The low sensitivity of NMR originates from the low nuclear polarization at currently used
magnetic fields (around 3T) and physiological temperatures (37 ºC). The nuclear spins populate
the Zeeman levels according to the Boltzmann distribution as given by
𝑁−
𝑁+ = 𝑒−∆𝐸 𝑘𝐵𝑇⁄ (1.8)
where ΔE is energy difference between two states (γħB0), 𝑘𝐵 is Boltzmann constant and T is
temperature in Kelvin. Since at room temperature ΔE is much smaller than the thermal energy
(kB), the population difference is very small. This fact has major implications in NMR because

8
the detectable NMR signal is proportional to the relative population difference (polarization, P)
between the two states. The polarization can be expressed using the Brillouine fuction:
P = (N+ - N-)/(N+ + N-) = tanh(μB0/kBT) (1.9)
Because at or near room temperature the thermal equilibrium polarization is quite low (only
about 50 ppm at 7 T for 13C), NMR has an inherently low sensitivity.
Obviously, the low sensitivity problem could be overcome by creating a non-equilibrium spin
distribution on the Zeeman levels. Increasing the nuclear spin polarization can be achieved by
several approaches; these are usually referred to as hyperpolarization techniques.[7,8] The most
versatile method to enhance NMR sensitivity is based on dynamic nuclear polarization (DNP).
Fast dissolution DNP technology, invented in 2003, [9] is capable of producing solutions of
highly hyperpolarized 13C substrates than can be directly administered (i. v.) for diagnostic
purpose. [10,11] Commercial dissolution DNP polarizers are now available and the technology has
advanced into clinical trials.[12]
Figure 1.5. The SPINLab DNP polarizer at the UT Southwestern Medical Center for clinical
applications. The DNP polarizer is shown on the left while the computer and quality control unit
is on the right.

9
CHAPTER 2
EFFICIENT DUAL MAGNETIC RESONANCE /NEAR INFRARED IMAGING
PROBES IN AQUEOUS MEDIUM
2.1 INTRODUCTION
Most MRI contrast agents are paramagnetic species that shorten the longitudinal and
transverse relaxation processes.[6] Agents which shorten the longitudinal relaxation time (T1)
increase the intensity of water signal and generate positive contrast. On the other hand, agents
that decrease transverse relaxation time (T2) cause darkening the image (negative contrast).
Among the paramagnetic transition metal and lanthanide ions Gd3+ has the most favorable
properties for shortening the T1 longitudinal relaxation time of water protons. It has seven
unpaired f electrons and a symmetric electronic ground state (8S7/2), which leads to slow
electronic relaxation rate. Gadolinium is a heavy metal and free Gd3+ is toxic, therefore, it has to
be complex by an organic ligand to eliminate toxicity. Being a lanthanide, the preferred
coordination number of Gd3+ is 8 or 9. Ligands that are used for the construction of Gd-based
MRI contrast agents are usually octa- or heptadentate, and the resulting complexes have one or
two inner sphere water molecules bound to the Gd3+ ion.[13,14]
The 1H NMR relaxation rate (R) of the water protons in a solution of a Gd-complex has two
components: the diamagnetic and paramagnetic contribution. [15]
𝑅𝑖 =1
𝑇𝑖=
1
𝑇𝑖 𝑑𝑖𝑎+
1
𝑇𝑖 𝑝𝑎𝑟𝑎 𝑖 = 1,2 (2.1)

10
Where 1
𝑇𝑖 𝑑𝑖𝑎 , is the relaxation rate of the solvent (water) nuclei and
1
𝑇𝑖 𝑝𝑎𝑟𝑎 is relaxation rate of
paramagnetic component which is proportional to the concentration of the paramagnetic species.
1
Ti para= Ri para=ri[M] 𝑖 = 1,2 (2.2)
Where ri is the relaxivity. In the following sections the discussions will be restricted to r1 as it is
more relevant to Gd-based complex agents.
Figure 2.1. Structure of Gd-DOTA showing the inner sphere water molecule, (DOTA = 1,4,7,10-
tetraazacyclododecane-1,4,7,10-tetraacetic acid).
However, similar considerations are valid for r2. The r1 relaxivity expresses how efficiently a
complex enhances the R1 relaxation rate and is defined and measured as the slope of the observed
relaxation rate of the water protons ( 𝑅1𝑜𝑏𝑠) in solution of the Gd-complex versus the Gd-L
concentration, equation (2.3):
Inner sphere water molecule directly
coordinated to the Gd3+-ion
r1=
∆𝑅1[𝑐𝑜𝑛𝑐𝑒𝑛𝑡𝑟𝑎𝑡𝑖𝑜𝑛]
(2.3)
11
Thus, the observed paramagnetic relaxation enhancement of the bulk water is a composite of
three effects: the inner sphere, the second sphere and the outer sphere contribution:
r1para = r1inner + r1second + r1outer (2.4)
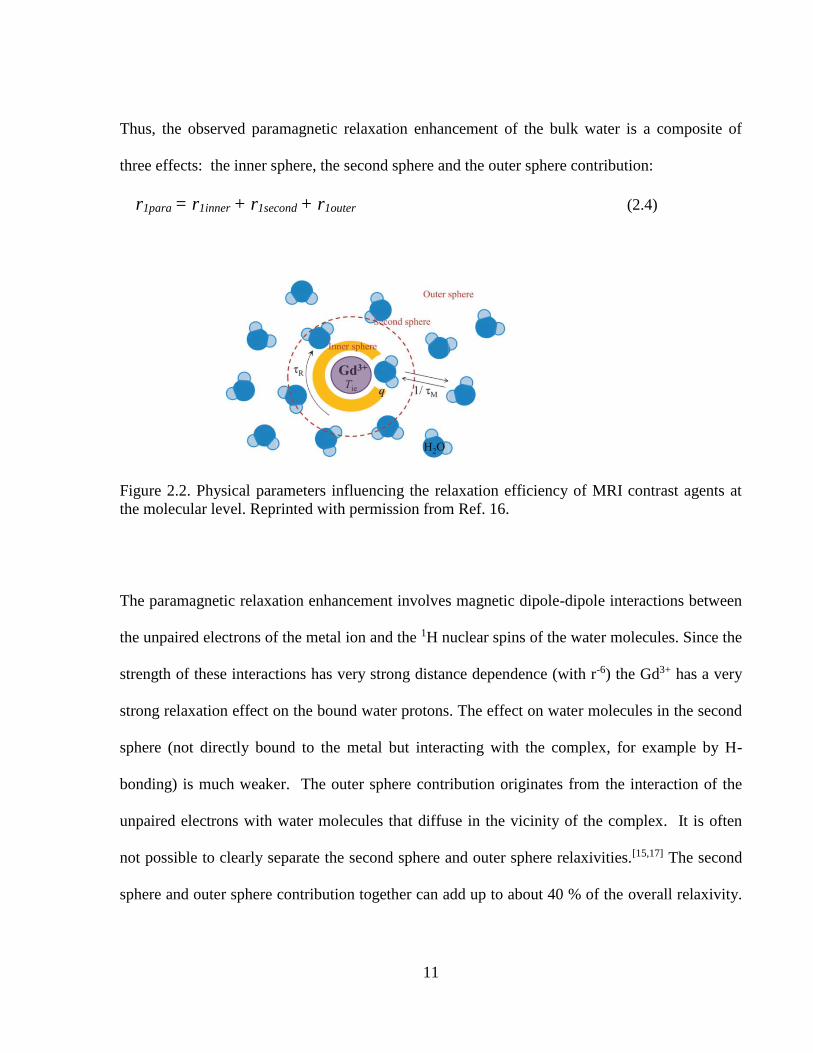
Figure 2.2. Physical parameters influencing the relaxation efficiency of MRI contrast agents at
the molecular level. Reprinted with permission from Ref. 16.
The paramagnetic relaxation enhancement involves magnetic dipole-dipole interactions between
the unpaired electrons of the metal ion and the 1H nuclear spins of the water molecules. Since the
strength of these interactions has very strong distance dependence (with r-6) the Gd3+ has a very
strong relaxation effect on the bound water protons. The effect on water molecules in the second
sphere (not directly bound to the metal but interacting with the complex, for example by H-
bonding) is much weaker. The outer sphere contribution originates from the interaction of the
unpaired electrons with water molecules that diffuse in the vicinity of the complex. It is often
not possible to clearly separate the second sphere and outer sphere relaxivities.[15,17] The second
sphere and outer sphere contribution together can add up to about 40 % of the overall relaxivity.
12
As already mentioned, the exchange of the inner sphere water molecule with the bulk water
molecules transfers the paramagnetic relaxation enhancement felt by the bound water protons
into the bulk of the solvent. Thus, the observed paramagnetic relaxation rate ( 1
T1IS) can be
expressed (Equation 2.5) ,with the relaxation time of the metal bound water protons (T1m) and
the average time, the water molecule stays bound to the metal ion(𝜏𝑚) and Pm (the mole fraction
of the bound water ):
1
T1IS =
qPm
T1m+τm (2.5)
where q is number of inner sphere water. The paramagnetic relaxation effect can have several
mechanisms such as dipole-dipole interactions, scalar coupling between the electrons of the
metal ion and the 1H nuclear spins and the Curie relaxation. However, for Gd-chelates at the
currently used magnetic fields (1.5 - 3 Tesla) the dipole-dipole relaxation is dominant. A
complete theoretical description of relaxivity originating from dipole-dipole interactions between
the unpaired electrons of the Gd3+ and the 1H nuclear spins is given by the Solomon
Bloembergen Morgan theory.[18] Without going into details, the Equations (2.6) and (2.7)
describing the T1m relaxation time of the metal bound water protons due to dipole-dipole
interactions with the unpaired electrons of a Gd3+ are:
1
𝑇1𝑚=
2
15
𝛾𝐻2 𝑔𝑒
2𝜇𝐵2 𝑆(𝑆+1)
𝑟𝐺𝑑𝐻6 [
7𝜏𝑐2
1+𝜔𝑆2𝜏𝑐2
2 + 3𝜏𝑐1
1+𝜔𝐻2 𝜏𝐶1
2 ] (2.6)
1
𝜏𝑐𝑖
=1
𝜏𝑚+
1
𝜏𝑅+
1
𝑇𝑖𝑒 ; i=1,2 (2.7)

13
Where 𝛾 is gyromagnetic ratio, the isotopic Landé g factor, μB represents Bohr magneton, 𝑟𝐺𝑑𝐻 is
electron spin –proton distance, correlation times (𝜏𝑐𝑖) and ω is chemical shift. These equations
express the effect of fluctuating magnetic fields that induce nuclear spin transitions and
therefore, are responsible for nuclear spin relaxation. These fluctuating fields are generated by
several processes such as the rotation of the paramagnetic complex, the movement of the 1H
spins in and out of the vicinity of the paramagnetic center (water exchange) and the electronic
relaxation of the unpaired electrons.[19] The contribution of each of these processes to the overall
paramagnetic relaxation enhancement is strongly fielded dependent. These fluctuating fields are
characterized by the composite correlation times𝜏𝑐𝑖, as shown in equation 2.7.
However, as a practical guideline for the design of new ligand systems for Gd-based contrast
agents, the predictions of the Solomon Bloembergen Morgan theory can be summarized as
follows. The relaxivity of an agent is determined by four factors: the number of bound water
molecules (q), the bound water lifetime (𝜏𝑚 = 1/kex, where kex is the water exchange rate in s-1),
the rotational correlation time (𝜏𝑅) of the complex and the electronic relaxation times ( 𝑇𝑖𝑒) of the
unpaired electrons at a given external magnetic field.[20] However, out of these factors, only the
number of bound water molecules (q), the bound water lifetime (𝜏𝑀 = 1/kex), the rotational
correlation time (𝜏𝑅) can be influenced by the ligand structure. Most of the clinically used
contrast agents have low relaxivity ranging from 4 to10 mM-1s-1, which is much lower than the
theoretically calculated maximum value ( 100 mM-1s-1 at clinically relevant magnetic fields) as
predicted by the Solomon, Bloembergen, and Morgan (SBM) theory.[21] Therefore, these contrast
agents must be administrated to the body in high doses, which poses a health risk. This dose
could significantly be reduced if the relaxivity of the agent could be increased. The development

14
of high relaxivity agents is an active field of research. The relaxivity is usually improved by
optimizing the above mentioned key parameters as discussed in the following sections. [17]
2.1.1 Predictions of the Solomon Bloembergen Morgan Theory
According to the Solomon Bloembergen Morgan theory at the clinically relevant fields
(1.5- 3 T), the relaxivity will essentially be determined by 𝜏𝑀 and 𝜏𝑅 .
Figure 2.3. The dependence of r1 relaxivity on by 𝜏𝑀 and 𝜏𝑅 at 1.5 T and assuming an electronic
relaxation time (T1e) of 10 ns of the Gd3+. Reproduced with permission from Ref. 6.
As seen in Figure 2.3, increasing 𝜏𝑅 has a strongly field-dependent effect on the inner sphere
relaxivity. At around 1.5 T, there is a significant relaxivity improvement even when 𝜏𝑀 is not
optimal. However, the effect levels off at higher field. The optimal value of 𝜏𝑀 is also field-
dependent and is between 10 to 50 ns for a q = 1 gadolinium complex to attain maximum inner-

15
sphere relaxivity at clinically relevant fields. It is important to note that in case of rapidly
tumbling small molecular weight complexes like Gd3+-DOTA or Gd3+-DTPA (𝜏𝑅 < 100 ps),the
relaxivity is limited by τR and slower than optimal water exchange rate (𝜏𝑀 values up to about 1
s) would not affect the relaxivity unless the tumbling rate of the complex is slowed down.[6,22]
Optimizing the rotational correlation time, 𝝉𝑹
For spherical molecules, rotational correlation time is given by the Debye-Stokes equation:
𝜏𝑅 =4𝜋𝜂𝑎3
3𝑘𝑏𝑇 (2.8)
where η is viscosity and “a“ is molecular radius. Commercially available contrast agents have
𝜏𝑅 value of around 0.1 ns. Increasing 𝜏𝑅 can easily be achieved by covalently or non-covalently
binding the complex to macromolecules (polymers, dendrimers, proteins, viral capsids, various
nanoparticles). Another approach involves incorporating the chelates into self-assembling
systems. The most important of these strategies is the non-covalent binding to proteins. The
increase in relaxivity is known as receptor-induced magnetization enhancement (RIME).
Relaxation enhancement occurs only upon binding to the target protein and the effect is localized
to areas where the receptor is present. The most important implementation of this concept
involves binding to human serum albumin (HSA). Albumin binding agents such as the clinically
approved Ablavar (gadofosveset) is used to generate high quality angiographic images of the
vasculature.[4,23]
Optimizing the residence time of water molecule, 𝝉𝑴
The residence life time of the bound water molecule, 𝜏𝑀, is of the most important parameters
that influences the relaxivity. It is the inverse of the water exchange rate. The optimal value of
16
𝜏𝑀 at clinically relevant fields is around 20 ns and at higher magnetic field, even smaller. To
reach maximum relaxivity, the value of both 𝜏𝑀 and 𝜏𝑅 must be optimized. The 𝜏𝑀 of usual
polyaminopolycarboxylate-based monohydrated (q = 1) Gd3+-complexes is longer than optimal
(around 200 ns) and the design and synthesis of Gd-chelates that have faster water exchange rate
has been the focus of intensive research. As a result of these efforts the steric and electronic
factors that influence the water exchange rate in lanthanide complexes are well known. The
water exchange of monohydrated Gd3+-chelates (q = 1) proceed by a dissociative mechanism in
which the bound water leaves before the incoming one can bind. In these complexes, the
exchange rate can be accelerated by increasing the steric compression around the exchange site.
This is usually accomplished by inserting an extra methylene group into the polyamine backbone
or the sidearm of the ligand. The steric compression around the water coordination site can be
significantly different in coordination isomers. Lanthanide chelates of DOTA and related ligands
exist in two diastereomeric coordination isomers, SAP (square antiprism with a N4/O4 twist angle
of approximately 39°) and TSAP (twisted square antiprism with a twist angle of around -29°).
The N4 and O4 squares are closer to one other in the SAP isomer than in the TSAP. The inner
sphere water molecule is in a capping position above the O4 square and experiences higher steric
compression in the less compact TSAP isomer. Consequently, the water exchange rate 𝜏𝑀 is
nearly two orders of magnitude faster in this isomer than in the SAP one. These two
coordination isomers are interconverting into each other, forming an equilibrium mixture but the
rate of interconversion is usually slow on the NMR timescale. They can easily distinguished
from each other by 1H NMR spectroscopy since the SAP isomer has much larger lanthanide-
induced 1H NMR shifts of the ligand proton signals. Since the interaction between the Ln3+ ion

17
and the bound water molecule is mainly ionic, the water exchange rate can be influenced by the
electron deficiency around the central lanthanide ion. [24,25] Electronic factors provide a
convenient way to fine-tune the water exchange rate. Neutral donor atoms are less capable of
electron donation to the lanthanide ion and therefore, they slow down the water exchange
compared to the negatively charged carboxylate oxygen. It was shown that the water exchange
rate of the Gd3+-DOTA derivatives in which only one coordinating sidearm was varied decreased
in the following order: phosphonate > acetate > amide. In general, negatively charged complexes
have faster water exchange than neutral or positively charged ones. [26]
Hydration number, q
The relaxivity linearly depends on the number of water molecules directly bound to the
paramagnetic center; therefore, an increase in the number of inner sphere water molecules will
increase the relaxivity. However, this will also decrease the thermodynamic stability and the
kinetic inertness of complex. Another issue is that in q=2 complexes the water molecules can be
displaced with bioligands such as phosphate, bicarbonate or citrate. These will bind to the
chelate as bidentate ligands and the resulting ternary complex will not have a bound water
molecule, which will result in a substantial decrease in relaxivity. Therefore, currently all
commercially available contrast agents have only one inner sphere water molecules. In general,
increasing q is not a viable way to increase the relaxivity.[15]
Gadolinium–water distance
Another parameter which can alter the relaxivity is the distance (𝑟𝐻) between protons of
the metal bound water molecule and paramagnetic center. This distance is around 0.30 nm for
Gd(III) complexes. Since the inner sphere relaxivity is dependent on the inverse of the 6th power
18
of this distance, small differences in 𝑟𝐻 can lead to large changes in the relaxivity. To increase
the relaxivity, distance between bound water and paramagnetic metal center should be decreased.
On the other hand, there are indications that speeding up the water exchange by increasing the
steric compression can lead to longer 𝑟𝐻 thereby limiting the gain in relaxivity.[15]
2.1.2 Paramagnetic chemical exchange saturation transfer (PARACEST) agents
Another approach to enhance MR contrast is based on the transfer of saturated spins
between two exchanging pools of 1H nuclear spins. The technique is known as chemical
exchange saturation transfer. The transfer of saturated spins from a small pool of proton spins to
the bulk will result in the decrease of net magnetization, which generates negative contrast in the
MR image. The saturation of the small pool is achieved by applying a presaturation pulse
covering the resonance frequency of the small pool proton spins. [27] The condition for CEST to
be observed is that the exchange rate (kex) must be smaller or equal than the frequency difference
between two pools, Δ𝜔.
∆𝜔 ≥ 𝑘𝑒𝑥 (2.9)
Originally, the exchange of -OH and -NH protons of various biomolecues with bulk water was
used for generating CEST (diamagnetic CEST, DIACEST).[28] However, it is difficult to
selectively saturate the small pool because of the small chemical shift difference between the two
pools. This problem can be overcome by using paramagnetic lanthanide complexes in which the
bound water protons or some exchangeable ligand protons represent the small pool
(PARACEST). In this case, the Δω can be as large as several hundred ppm because these protons
experience the dipolar field of the lanthanide ion, which results in large pseudocontact shifts of

19
the 1H NMR signal. The most commonly used PARACEST agents are Eu3+ complexes of
DOTA-tetraamides largely because they have slow water exchange rate that satisfies the slow to
intermediate requirement for CEST.[29]
2.1.3 Safety of lanthanide based contrast agents
In recent years, the safety of metal based MR agents has become a major concern due
to nephrogenic systemic fibrosis, a devastating disease associated with the in vivo dissociation of
Gd3+-based MR agents in patients with kidney failure.[30] Furthermore, there is mounting
evidence that Gd3+-deposition occurs in the brain and bones of patients who have normal kidney
function after multiple injections of Gd3+-agents. Therefore, in vivo toxicity must be considered
in the design new contrast agents. Toxicity in general is caused by the release of free metal from
the complex. In vivo stability of a metal complex is dependent on the thermodynamic stability
constant as well as the kinetic rate constant that characterizes the dissociation of the complex
into its components.[31] Thermodynamic stability is given by the equilibrium constant of the
complex formation:
𝐾𝑠𝑡 =[𝐺𝑑𝐿]
[𝐺𝑑3+][𝐿] (2.10)
The kinetic inertness is usually given as the half-life of the complex under certain conditions, e.g.
at a given pH and/or in the presence of certain metal ions (Zn2+ or Cu2+). In vivo dissociation or
macrocyclic Gd3+-complexes occurs by acid catalyzed dissociation. This process is extremely
slow at pH 7, thus, these complexes have high kinetic inertness under biological conditions. On
the other hand, linear Gd-chelates such as Gd-DTPA dissociate in transmetallation reactions with
endogenous metal ions (Zn2+ and Cu2+). This process is relatively fast and therefore, linear

20
contrast agents have significantly lower kinetic inertness than the macrocyclic ones. In vivo
toxicity data clearly indicate that open chain agents (diethylenetriaminepentaacetic acid (DTPA)
derivatives) have much lower stability in vivo than the macrocyclic chelates (DOTA derivatives).
Therefore, future development of MR agents should be based solely on macrocyclic design
platform (DOTA). As of April, 2017, the European Medicine Agency’s Pharmacovigilance and
Risk Assessment Committee (PRAC) has recommended the withdrawal of four linear
gadolinium contrast agents from the market due to in vivo release of Gd3+.[31]
2.1.4 Luminescence
The chemical properties of the lanthanide ions are very similar due to the effective
shielding of the f-orbitals by the 5s25p6 shell. As a consequence, the ligand field effects in
lanthanide complexes are very small and the f-f transitions are similar to those in the free metal
ion. These transitions, however, are Laporte-forbidden, and therefore, their intensity is very low
and direct excitation generally requires a very intense light source (laser). The intensity of
lanthanide emission depends on how well the excited states can be populated and how much the
non-radiative deactivation can be suppressed. The first objective can be achieved by
sensitization with an organic chromophore. [32] The non-radiative deactivation is the deactivation
of the luminescence by vibrational energy transfer usually involving high-energy vibrations of
solvent molecules. The efficiency of this process basically depends on the energy difference
between the lowest lying excited state and the highest sublevel of the ground state of the
lanthanide ion. If this energy gap is small then it is easy to quench it by the solvent vibrational
modes. O-H oscillators present in the inner sphere water molecules have the strongest

21
deactivating effect because quenching through coupling with oscillators is strongly distance
dependent (with r-6). Therefore, Gd3+ would be the best choice in this respect, followed by Tb3+
and Eu3+ because the energy differences are 32,200 cm-1 (6P7/2 → 8S7/2), 14,800 cm-1 (5D4 → 7F0)
and 12,300 cm-1 (5D0 → 7F6), respectively. However, the 6P7/2 → 8S7/2 emission of Gd3+ is in the
UV range so Gd3+ luminescence is not useful for biological applications.[32,33]
Generally, the energy levels of lanthanide (III) can be defined by Russell-Saunders coupling
scheme, (2s+1) LJ, where s=total spin, L= total orbital angular momentum and J = total angular
momentum. The electronic energy levels are split by electron- electron repulsion, and then
divided to energy levels by spin orbit coupling and these J states further split by crystal field
(ligand field) effect.
Sensitizing lanthanide ions by chromophores (the antenna effect)
The conventional description of sensitizing a lanthanide ion by an organic chromophore
located in the vicinity of the metal ion is outlined in Figure 2.4. It is generally assumed that the
chromophore absorbs a photon and then the short lived single state is converted to triplet state by
intersystem crossing, which has a longer lifetime. The energy transfer occurs from the triplet
state to the metal ion. While the chromophore may be directly coordinated to the lanthanide ion,
this is not an absolute requirement. [34]
The energy transfer can happen by two main mechanisms. The Forster mechanism, also known
as fluorescence resonance energy transfer (FRET) involves electric dipole-dipole interactions
between the donor (chromophore) and the acceptor (Ln3+). The Forster energy transfer occurs
through space and depends on the r-6 where r is the distance between the chromophore and the
Ln3+ ion.

22
Figure 2.4. Sensitizing lanthanide ions by an organic chromophore (Antenna effect).
The Dexter mechanism involves electron exchange between the donor and acceptor, in which the
excited electron moves from the donor to the acceptor.[35] The mechanism requires orbital
overlap between the chromophore and the Ln3+. Its efficiency is proportional to𝑒−𝑟. It is
therefore, obvious that for efficient sensitization of luminescent lanthanide ions, the ligand must
have a chromophore in the close vicinity of the metal ion and triplet state energy level of the
chromophore should match the excited state energy level of the lanthanide ion.
In addition, the ligand should also shield the lanthanide ion from solvent O-H oscillators to
prevent non-radiative deactivation.[36] However, there are exceptions to this last requirement as
will be discussed later.

23
Table 2.1. Luminescent transitions of lanthanide aqua ions.[33]
Ln3+
Configuration
Emissive transition
Wavelength (nm)
Color
Pr3+ 4f2 1G4 → 3HJ
1D2 → 3FJ
3P0 → 3HJ
1300
890, 1060
525-680
NIR
NIR
Orange
Nd3+ 4f3 4F3/2 → 4IJ 880, 1060,
1340
NIR
Sm3+ 4f5 4G5/2 → 6HJ 590 Orange
Eu3+ 4f6 5D0 → 7FJ 615 Red
Gd3+ 4f7 6P7/2 → 8S7/2 312 UV
Tb3+ 4f8 5D4 → 7FJ 545 Green
Dy3+ 4f9 4F9/2 → 6HJ 570 Yellow
Ho3+ 4f10 5F5 → 5IJ
5S2 → 5IJ
970, 1050
540
NIR
Green
Er3+ 4f11 4S3/2 → 4IJ
4I13/2 → 4I15/2
1530 NIR
Tm3+ 4f12 1G4 → 3HJ
3F4 → 3H6
480,
810
Blue
NIR
Yb3+ 4f13 2F5/2 → 2F7/2 980 NIR
24
Lanthanide chelates as luminescent probes
Visible light (400–700 nm) can only penetrate about 5 mm deep in tissue before being
completely absorbed by physiological chromophores such as hemoglobin and melanin.
However, near infrared light (700-2500 nm) has much better tissue penetration, up to several cm,
enabling in vivo optical imaging in this range. NIR photons have minimum absorption by blood
and water in the 650 to 1350 nm wavelength range, and therefore, luminescent probes that emit
in this range are potentially very useful for biological detection. While there are a large number
of organic fluorophores that work reasonably well in the visible or NIR range, luminescent
lanthanide chelates can offer some advantages over organic fluorophores. The favorable optical
properties of lanthanide complexes include the narrow emission bands, large Stokes shifts, the
lack of photobleaching, and long excited state lifetimes. This last property is particularly useful
since it allows the use of time gated luminescence techniques to eliminate background
autofluorescence from biological tissue. However, there are several obstacles that have to be
overcome before lanthanide based luminescent complexes can make a successful transition from
in vitro to in vivo. For example, the excitation and/or emission wavelengths for most complexes
fall into a range where tissue penetration is weak. The quantum yield has to be improved to
achieve better sensitivity, especially in aqueous media. Finally, for in vivo applications, the
complexes must have satisfactory in vivo stability. Some of these issues will be addressed in this
present work. It is worth mentioning that several lanthanide ions have emissions in the NIR
domain and multiphoton excitation techniques now make it possible to excite Ln-complexes in
or close to the NIR range.[37]

25
2.1.5 Magnetic Resonance / Optical Bimodal Imaging
Bimodal imaging is an emerging field within biomedical imaging. Bimodal imaging
combines two different imaging modalities to take advantage of their strengths and eliminate
their weaknesses.[38] The most common bimodal imaging modality is PET / CT in which
anatomical images recorded by the computed tomography (CT) scanner are combined with the
positron emission tomography (PET) images that contain metabolic or other functional
information (for example, glucose uptake). These images then can be co-registered
(superimposed) so that the functional imaging data can be precisely localized with regard to the
anatomy (skeletal structure). Commercially available PET / CT scanners allow the recording of
these images in one imaging session. Bimodal imaging techniques in which one of the modalities
is MRI are still in the developmental stage and largely considered as a research tool rather than a
clinical imaging method. Nevertheless, bimodal techniques such as MRI / PET and MRI / optical
combine MRI, which can provide high resolution anatomical images of soft tissues, with an
imaging modality that yields functional or molecular imaging data .This, however, poses special
technical problems. MRI is inherently a 3D imaging technique as the spatial position of the
voxel from which the signal originates is encoded in the frequency and phase of the signal.
Optical imaging, however, is essentially a projection type imaging.
Contrast agents intended for MRI / optical bimodal imaging also have to meet special criteria.
First of all, they must be able to be detected by both modalities. The same (or very similar)
chemical entity should be used as bimodal contrast agent to ensure co-localization. This is very
difficult, if not impossible, to achieve with a purely organic dye as no organic paramagnetic
species (free radicals such as nitroxides) can match the efficiency of Gd-chelates as relaxation

26
agents. Therefore, Gd-complexes conjugated to organic fluorescent dyes are sometimes used as
MRI /optical bimodal contrast agents.[39,40] However, lanthanides provide an easy solution to this
problem. The Ln3+ ions have nearly identical chemical properties and thus, the biodistribution is
determined by the ligand, so a mixture of Gd3+ and another, luminescent lanthanide complex
with the same ligand will have identical biodistribution and pharmacokinetics.
Figure 2.5. MR and NIR optical sentinel lymph node imaging of breast cancer in a mouse are
shown. As depicted in this schema, generation-6 PAMAM dendrimer-based dual labeled contrast
agents of approximately 10 nm in diameter containing 172 Gd ions and 2 Cy5.5 fluorophores.
Reprinted with permission from Ref. 39.
Another major problem is the several orders of magnitude difference between the sensitivity of
MRI and optical detection. This difference can be at least partially compensated by adjusting the
ratio of Gd3+ / luminescent Ln3+ to match the sensitivity difference of the two imaging modality.
Because of the much lower sensitivity of MRI, the complexes are often conjugated to Nano sized
carriers in order to improve the relaxivity of the Gd-chelate component.
27
2.2 PROJECT GOAL
Lanthanide ions have found widespread applications as components of magnetic resonance
and optical imaging agents as a result of their distinctive magnetic and optical properties.[41,42]
Gadolinium complexes are well established as the preferred MR imaging contrast agents[13]
while several other lanthanide ions have been explored for their luminescent emission properties
in the visible or near infra-red (NIR) range. [32] Lanthanide based luminescent probes have
several favorable properties including narrow emission bands, large Stokes shifts and long
excited state lifetimes, which allows the use of time gated luminescence techniques to eliminate
background autofluorescence from biological tissue.[32] Lanthanide ions share similar
coordination chemistry properties, thus one can explore the lanthanide series with the same
chelating ligand. This versatility makes it possible to construct bimodal MR/optical agents that
contain Gd3+ for MRI and another lanthanide, such as Nd3+ or Yb3+ for NIR optical detection.
Recent reports show that the similarity of the lanthanide chelates allows perfect co-localization
of the MR and optical images due to identical biodistributions.[43] MR/optical bimodal imaging is
particularly advantageous because it combines the high spatial resolution of MRI with the high
sensitivity of optical detection.[43,44] The ligand in these bimodal agents plays multiple roles: it
eliminates the toxicity associated with the free metal ion, provides a mechanism for the efficient
paramagnetic relaxation enhancement of the bulk water and sensitizes the lanthanide ion
emission (antenna effect). This last point is particularly important since the Laporte-forbidden f-
f transitions of Ln3+ ions are otherwise difficult to directly excite. However, if the ligand has an
appropriately positioned chromophore with compatible excited energy levels that match the

28
excited state of the lanthanide, then efficient energy transfer can easily occur upon indirect
excitation.[32,43]
The goal of this project was to develop a novel class of ligands in which one or two tropone
(cyclohepta-2,4,6-trien-1-one) sidearms are appended on a DO3A (1,4,7,10-
tetraazacyclodoecane-1,4,7-triacetic acid) or DO2A (1,4,7,10-tetraazacyclodoecane-1,4,7-
bisacetic acid) unit (Figure 2.6). Tropolone (2-hydroxytropone) is a seven membered, non-
benzenoid aromatic compound.[45,46] Its protonation constant (pKa = -logKa) is around 7 and the
tropolonate anion can act as a bidentate ligand capable of forming complexes with several
alkaline earth, transition metal and lanthanide ions.[45,47] In addition, the favorable energy level of
the tropolonate ion’s triplet state makes it an efficient sensitizer for near infrared emitting
lanthanide ions.[37] However, the stability of lanthanide tropolonate complexes is not high
enough for in vivo applications.[47] In order to develop Ln3+-based MRI and optical agents for in
vivo use, it is important to understand the ligand’s role in determining the thermodynamic
stability and kinetic inertness of the complex. It is well documented that lanthanide chelates of
DOTA (1,4,7,10-tetraazacyclododecane-1,4,7,10-tetraacetic acid) and related ligands have high
thermodynamic stability as well as kinetic inertness (slow dissociation) and are frequently
selected for various biomedical applications.[31,44] In this project, the advantageous photophysical
properties of the tropone coordinating unit is combined with the favorable in vivo stability of the
DOTA framework. Furthermore, based on structural analogies it was anticipated that the
lanthanide complexes of these ligands would have one inner sphere (metal ion bound) water
molecule.[126] The presence of at least one rapidly exchanging inner sphere water molecule in the
Gd3+ complex is necessary for efficient relaxation of bulk water protons by Gd3+ but it is

29
seemingly incompatible with the design of optical agents because the O-H vibrators in the metal
bound water molecule can efficiently quench the lanthanide excited state by non-radiative
deactivation.[43]
Figure2.6. Structure of DOTA, tropolone, and the DOTA-tropone derivatives discussed in this
work.
The O-H oscillators present in the inner sphere water molecules have stronger deactivating effect
than the solvent because quenching through coupling with the O-H oscillators is strongly
distance dependent (with r-6).[48] It was shown previously that pyridine based chromophores can
sensitize the lanthanide to such an extent that it can overpower the non-radiative deactivation by
inner sphere water molecules.[49] Nevertheless, there are only a very few reported examples of
30
such probes that emit in the NIR region.[43,49] In this work we demonstrate that certain Ln3+
chelates of these DOTA-tropone derivatives display bright luminescence in the NIR domain
despite the presence of one inner sphere water molecule.
2.3 EXPERIMENTAL
2.3.1 Synthesis
General Remarks. All solvents and reagents were purchased from commercial sources and used
as received unless otherwise stated. 1H, 13C and 17O NMR spectra were recorded on a Varian
INOVA VNMRS direct drive Varian console spectrometer operating at 9.4 T. NMR spectra
were processed in ACD/HNMR Viewer ACD/Labs 6.00.
Synthesis and characterization of ligand 1 and the Ln+3 complexes
1, 4, 7, 10-Tetraazacyclododecane-1,4,7-tris(acetic acid tert-butyl ester) , DO3A (t-Bu)3.[50]
A solution of tert-butyl bromoacetate (34.0 g) in N,N-dimethylacetamide (50 mL) was added
dropwise to a solution of 1,4,7,10-tetraazacyclododecane (cyclen) (10.0g) and sodium acetate
(NaOAc) (14.4 g) in N,N-dimethylacetamide (133 mL) at 0°C over 25 min. The resulting
mixture was allowed to warm up to room temperature and stirred for 5 days. The white slurry
was poured into water (660ml) to give clear yellow solution. The pH was adjusted to 9 by adding
sodium bicarbonate (NaHCO3). Potassium bromide (KBr) (10 g) was added while was stirring
and after dissolution, ether (10ml) was added. After 1 hour white precipitation was formed. The
precipitate was filtered off and dried in vacuum to give the 28.9 g of 1,4,7,10-
tetraazacyclododecane-1,4,7-tris(acetic acid) tert-butyl ester hydrobromide as a white solid. This

31
product was dissolved in acetonitrile (200 mL) and potassium carbonate (16 g) was added. The
mixture was heated to 50°C and stirred overnight. The temperature was raised to 60°C and the
mixture was stirred for 4 more hours. The inorganic solids were filtered and the solvent was
removed by rotary evaporation. The resultant compound was dissolved in ether and washed with
water 8 times and dried over sodium sulfate. The solution was filtered and solvent was removed
and the residue was dried in vacuum. 1H NMR (400 MHz, CDCl3), δ, ppm = 3.21 (s, 6H,
NCH2CO), 2.63 (s, 4H, ringCH2), 2.44 (s, 6H, ring CH2), 1.34 (s, 27H, CH3).13C NMR (100
MHz, CDCl3), δ, ppm = 171.09 (COOCH2), 80.47(CO (CH)3), 56.90( NCH2CO), 52.2 (ring
CH2), 50.51 (ring CH2), 47.41 (ring CH2), 28.0 (CH3).
1, 4, 7, 10-Tetraazacyclododecane-1,4,7-tris(acetic acid tert-butyl ester)-10-(2-tropone) 1a.
To the solution of 1, 4, 7, 10-tetraazacyclododecane-1, 4, 7-tris (acetic acid tert-butyl ester)
[(DO3A(t-Bu)3] (1.0 g) in N,N-dimethylformamide (5ml), potassium carbonate (K2CO3) (550
mg) and tropolone tosylate (550 mg) were added. The reaction mixture was stirred at 60°C for 2
days. The solvent was removed in a stream of dry nitrogen gas. The yellow residue was
dissolved in ether (10 mL) and washed with water (5×5 mL). The organic layer was dried over
sodium sulfate and treated with activated carbon (50 mg) for 1 day. It was filtered and the
solvent was removed by rotary evaporation to give the desired product as yellow oil (1.12g,
91%). 1H NMR (400 MHz, CDCl3, 25ºC, TMS), δ, ppm = 6.96 (dd, J(H,H) = 11.32 Hz, 8.61 Hz,
1H; tropone CH), 6.92 (t, J(H,H) = 10.45 Hz, 1H; tropone CH), 6.76 (d, J(H,H) = 11.35Hz, 1H;
tropone CH), 6.50 (d, J(H,H) = 10.96Hz, 1H; tropone CH), 6.40 (t, J(H,H) = 9.00Hz, 1H;
tropone CH), 3.78 (t, J(H,H) = 5.48 Hz), 4H; macrocyclic NCH2), 3.29 (s, 2H; acetate CH2), 3.26
(s, 4H; acetate CH2), 3.07 (br t, 4H; macrocyclic NCH2), 2.75 (br, 4H; macrocyclic NCH2) 2.72

32
(br, 4H; macrocyclic NCH2), 1.41 (s, 9H; t-Bu), 1.40 (s, 18H; t-Bu). 13C NMR (100 MHz,
CDCl3, 25ºC, TMS), δ, ppm = 180.49 (tropone CO,), 170.78 (COO), 157.70 (tropone C), 134.75
(tropone C), 133.71 (tropone C), 130.33 (tropone C), 121.08 (tropone C), 111.74 (tropone C),
80.68 (COOC(CH)3), 57.68 (NCH2COO), 55.04 (NCH2COO), 52.65 (macrocyclic NCH2), 52.55
(macrocyclic NCH2), 52.00 (macrocyclic NCH2), 51.31 (macrocyclic NCH2), 28.12 (CH3), 28.06
(CH3). MS (ESI+), m/z, Found: 619.25, Calcd. for [M+H]: 619.41.
1,4,7,10-Tetraazacyclododecane-1,4,7-tris(acetic acid)-10-(2-tropone) 1: Compound 1a (300
mg) was dissolved in dichloromethane (5ml) and most of the solvent was removed with N2 gas.
The residue was dissolved in trifluoroacetic acid (TFA) (5ml) and the solution was stirred at
room temperature and overnight. The TFA was removed in a stream of nitrogen gas. The
product was treated with ether, decanted, and the solid residue was washed with ether (20 ml)
three times and dried under vacuum. It was dissolved in water (10 mL), acidified with dilute
HCl solution and lyophilized to give the desired product (200 mg, 80%). 1H NMR (400 MHz,
D2O, 25ºC, TMS), δ, ppm = 7.56 (br t, J(H,H) = 9.20 Hz, 1H; tropone CH), 7.46 (br d, J(H,H) =
9.39 Hz, 1H; tropone CH), 7.39-7.28 (broad overlapping multiplets, 3H; tropone CH), 4.09 (br s,
4H; macrocyclic NCH2), 3.76-3.44 (broad overlapping multiplets, 14 H; macrocyclic NCH2 and
acetate CH2), 3.22 (br, 2H; macrocyclic NCH2), 3.06 (br, 2H; macrocyclic NCH2). 13C NMR
(100 MHz, D2O, 25ºC, TMS), δ, ppm = 185.12 (tropone CO), 171.39 (COOH), 168.47 (COOH),
155.05, 138.84, 138.61, 133.87, 133.72, 128.75 (tropone carbons), 55.38, 52.27 (acetate CH2),
51.37, 51.31, 47.70, 45.81 (macrocyclic NCH2). MS (ESI+), m/z, Found: 451.11, Calcd. for
[M+H]: 451.22.
33
Lanthanide complexes .The ligand (200 mg) was dissolved in water (5 mL) and the lanthanide
chloride (approx. 10 % excess) dissolved in a small amount of water was added dropwise. The
mixture was stirred for 6 days at room temperature and the pH of the reaction mixture was
maintained around 6 by adding small amounts of freshly prepared hydroxide form anion
exchange resin (Dowex 1X4, 20-50 mesh). The reaction mixture was then treated with Chelex
resin to remove excess free metal, filtered and lyophilized to give the desired complexes. The
lanthanide chelates were purified by preparative HPLC on a C18 column using water–
acetonitrile 0.1% TFA gradient as eluent. All complexes had very similar retention times and
gave the expected molecular weight in LC-MS measurements (retention time around 7.8 min on
an Atlantis T3 5μ 4.6 mm ×250 mm C18 column, water-acetonitrile, 0.1% formic acid, 98% to
10% water gradient in 30 min).[126]
Synthesis and characterization of ligand 2 and the Ln+3 complexes:
1, 4, 7, 10-Tetraazacyclododecane-1, 7-bis (acetic acid tert-butyl ester), DO2A(t-Bu)2.
DO2A (t-Bu)2 is synthesized in the chemistry lab of the AIRC on a regular basis as previously
published.[51]
1, 4, 7, 10-Tetraazacyclododecane-1, 7-bis (acetic acid tert-butyl ester)-4, 10-bis (2-tropone)
2a. A mixture of DO2A (t-Bu)2 (500 mg), tropolone tosylate (700 mg) and potassium carbonate
(400mg), in N, N-dimethylformamide (DMF) (6 mL) was stirred at 60 °C for 24 hours. The
potassium carbonate was filtered and the solvent was removed in a stream of N2-gas .The residue
was dissolved in dichloromethane (20 ml) and washed with water (5×15 mL). The organic layer
was dried over sodium sulfate, treated with activated carbon, filtered and the solvent was

34
removed by rotary evaporation to give the desired product (620 mg, 81%). 1H NMR (400 MHz,
CDCl3) ,δ, ppm = 7.88 (2H, s, Trop), 7.76 (2H, s, Trop), 6.88 (4H, m, Trop) , 6.75 (2H, s, Trop),
3.50 (4H, s, NCH2CO), 3.18 (2H, s, NCH2CO), 2.94 (6H, s, ring CH2), 2.83 (2H, s, ring CH2),
2.75 (2H, s, ring CH2) , 2.20 (2H, s, ringCH2), 1.31 (4H, s, ring CH2). 13C NMR (100 MHz,
CDCl3, 25ºC), δ, ppm = 181.7 (C=O Trop) , 170.3 (COOCH2), 157.9 (CN, Trop), 135.06 (Trop),
133.4 (Trop), 132.3 (Trop), 123.1 (Trop), 115.0 (Trop), 81.1 (CO(CH3)3), 57.3 (NCH2), 54.1
(ring CH2), 51.7 (ring CH2), 28.0 (CH3). MS (ESI+), m/z, Found: 608.41, Calcd. for
[M+H]:608.78.
1, 4, 7, 10-Tetraazacyclododecane-1,7-bis(acetic acid)-4,10-bis(2-tropone), 2. Compound 2a
(600mg) was dissolved in HCl (6 mL, 20%) and was allowed to stand for 1 day. The dark brown
solution was treated with activated carbon (50mg) for 12 hours. The solution was filtered and
freeze-dried to give 0.525g of yellow solid (88%). 1H NMR (400 MHz, D2O), δ, ppm= 9.15
(COOH), 7.50 (2H, s, Trop), 7.43 (2H, s, Trop), 7.35 (4H, m, Trop), 7.26 (2H, s, Trop), 7.10
(1H, m Trop), 4.0 (4H, s, NCH2CO), 3.66 (2H, s, NCH2CO), 3.54 (6H, s, ring CH2), 2.26 (2H, s,
ring CH2).13C NMR (100 MHZ, D2O) ,δ, ppm = 182.8 (COOH), 167.2 (CO Trop), 154.21 (CN,
Trop), 139.04 (Trop), 138.30 (Trop), 134.37 (Trop), 129.55 (Trop), 123.1 (Trop), 69.46
(CH2ON), 54.99 (ring CH2), 51.04 (ring CH2). MS (ESI+), m/z, Found: 497.12, Calcd. for
[M+H]: 469.56.
Lanthanide complexes. The lanthanide complexes were obtained by reacting the ligand with
freshly prepared Ln (OH)3. Preparation of Ln (OH)3. The LnCl3 (0.5 mmol), was dissolved in
water (40 mL) and NaOH (2M, 1.2 ml) was added with stirring resulting in the formation of a
precipitate. The mixture was centrifuged and the clear solution was decanted. Water (40 mL)

35
was added to the solid residue, stirred up, centrifuged and the clear solution was again decanted.
This procedure was repeated until the pH of the supernatant reached to 8. Complexation . Ligand
2 (100mg) was dissolved in water (5 mL) and the solution was added to the freshly prepared
solid Ln (OH)3. The mixture was stirred for several days while pH was periodically checked and
adjusted to 7 by NaOH (2M). When the pH stabilized, it was brought to 9 and centrifuged in
order to remove excess free lanthanide ions in the form of insoluble hydroxide. The resulting
solution was tested for free Ln3+ (xylenol orange probe) and small amount (5 mg) of extra ligand
was added if needed. The solution was then lyophilized. The lanthanide chelates were purified by
preparative HPLC on a C18 column using water–acetonitrile 0.1% TFA gradient as eluent. All
complexes had very similar retention times and gave the expected molecular weight in LC-MS
measurements (retention time around 5.8 min on an Atlantis T3 5μ 4.6 mm × 250 mm C18
column, water-acetonitrile, 0.1% formic acid, 98% to 10% water gradient in 30 min). Product
(Gd [bis-tropolone]) confirm by the mass spectroscopy (ESMS, ESI+), m/z 651.83 (100%,
[M+H] +), Calcd. 652.14.
Synthesis and characterization of ligand 3 and the Ln+3 complexes:
β-Thujaplicin tosylate. β-Thujaplicin (1.0 g) was dissolved in pyridine (2.5 mL). The solution
was cooled in an ice bath and tosyl chloride (1.5 g) was added slowly in ice bath and stirred for
20 min. The resulting solution allowed to warm up to room temperature and stirred overnight.
The solution was diluted by dichloromethane (10 mL) and washed three times with water. The
organic layer was dried over sodium sulfate and treated with activated carbon (50 mg) for 1 hour.
It was filtered and the solvent was removed by rotary evaporation and the oily residue was dried

36
in vacuum. The resulting oil solidified on standing (1.76 g, 91%). 1H NMR (400 MHz, CDCl3,
25ºC, TMS), δ, ppm =7.83 (br, 5H, tropone CH), 7.69 (m, 1H, ring CH), 7.11(br, 1H, ring CH),
7.0 (s, 1H, tropone CH), 6.94 (s, 1H, tropone CH) , 6.85 (br, 1H, tropone CH), 2.68 (br, 3H, ring
CH3), 2.37 (s, 8H, (CH3)2CHC), 1.12 (br, 14H, CH3CH). 13C NMR (100 MHz, CDCl3, 25ºC,
TMS), δ, ppm = 179.15 (tropone CO) , 157.50 ( tropone CO) , 152.26 ( tropone CH), 145.49
(ring C), 137.72 (tropone CH), 136.78 (tropone CCH(CH3)2), 130.69 (ring CH), 129.67 (ring
CH), 128.53 (tropone CH), 38.37 (CH (CH3)2 ), 22.70 (CH3).
1, 4, 7, 10-Tetraazacyclododecane-1, 4, 7-tris (acetic acid tert-butyl ester)-10-[2-(4-
isopropyl) –tropone] 3a. To a solution of 1, 4, 7, 10-tetraazacyclododecane-1, 4, 7-tris (acetic
acid tert-butyl ester) [(DO3A (t-Bu)3] (514 mg) in acetonitrile (5ml), potassium carbonate
(K2CO3) (300 mg) and β-thujaplicin tosylate (320 mg) were added. The reaction mixture was
stirred at 60°C for 5 days. The solvent was removed in a stream of dry nitrogen gas. The yellow
residue was dissolved in ether (10 mL) and washed with water (5×5 mL). The organic layer was
dried over sodium sulfate and treated with activated carbon (50 mg) for 1 day. It was filtered and
the solvent was removed by rotary evaporation to give the desired product as yellow oil (1.12g,
91%). 1H NMR (400 MHz, CDCl3, 25ºC, TMS), δ, ppm = 7.93 (br, 1H, tropone CH), 7.36 (br,
1H tropone CH), 6.87 (br ,1H tropone CH), 6.38 (br, 2H, tropone CH), (tropone CH), 3.29 (br,
2H, macrocyclic NCH2), 2.79 (br, 3H, macrocyclic CH2), 2.45 (br, 1H, CH(CH3)2), 2.31 (br, 1H,
macrocyclic NCH2 ), 1.44 (s, 9H; t-Bu), 1.21 (br,3H, CH3). 13C NMR (100 MHz, CDCl3, 25ºC,
TMS), δ, ppm = 180.9 (tropone CO,), 171.13 (COO), 157.59 (tropone CH), 155.28 (tropone C),
138.06 (tropone CH), 135.44 (tropone C), 133.12 (tropone CH), 129.81 (tropone CH), 81.55 (t-
Bu), 57.88 (NCH2COO), 55.45 (NCH2COO), 53.14 (macrocyclic NCH2), 51.62 (macrocyclic

37
NCH2), 51.31 (macrocyclic NCH2), 37.93(CH(CH3)), 28.24( t-Bu), 21.36 (CH3). MS (ESI+),
m/z, Found: 676.25, Calcd. for [M+H]: 676.94.
1, 4, 7, 10-Tetraazacyclododecane-1, 4, 7-tris (aceticacid)-10-[2-(4-isopropyl)-tropone] 3.
Compound 3a (300 mg) was dissolved in dichloromethane (5 mL) and most of the solvent was
removed with N2 gas. The residue was dissolved in trifluoroacetic acid (TFA) (8 mL) and the
solution was stirred overnight at room temperature. The TFA was removed in a stream of
nitrogen gas. The residue was treated with ether, decanted (3×20 mL), and the solid residue was
dried under vacuum. It was dissolved in water (10 mL), acidified with dilute HCl solution and
lyophilized to give the desired product (200 mg, 80%). 1H NMR (400 MHz, D2O, 25ºC, TMS),
δ, ppm = 7.42 (br , 1H; tropone CH), 7.26-7.15 (broad overlapping multiplets, 3H; tropone CH),
7.07(d, 1H, tropone CH) ,4.05 (br s, 4H; macrocyclic NCH2), 3.64-3.43 (broad overlapping
multiplets, 14 H; macrocyclic NCH2 and acetate CH2), 3.12 (br, 2H; macrocyclic NCH2), 3.08
(br, 2H; macrocyclic NCH2), 2.81(d, 1H, C(CH3)), 1.15(d,4H, CH3). 13C NMR (100 MHz, D2O,
25ºC), δ, ppm = 184.57 (tropone CO), 174.54 (COOH), 169.09 (COOH), 154.37, 139.54, 135.79,
132.85, 130.52, 127.90 (tropone carbons), 55.02, 53.05 (acetate CH2), 51.50, 49.06, 47.63, 45.90
(macrocyclic NCH2), 37.96 (C(CH3)2), 22.19(CH3) . MS (ESI+), m/z, Found: 504.11, Calcd. for
[M+H]: 505.59.
Lanthanide complexes. 200 mg of ligand was dissolved in 5 ml water .To the solution
lanthanide chloride (approx. 10 % excess) dissolved in a small amount of water was added
dropwise . The mixture was stirred for 6 days at room temperature and the pH of the reaction
mixture was maintained around 6 by adding small amounts of freshly prepared hydroxide form
anion exchange resin (Dowex 1X4, 20-50 mesh). The reaction mixture was then treated with

38
Chelex resin to remove excess free metal, filtered and lyophilized to give the desired complexes.
The lanthanide chelates were purified by preparative HPLC on a C18 column using water–
acetonitrile 0.1% TFA gradient as eluent. All complexes had very similar retention times and
gave the expected molecular weight in LC-MS measurements (retention time around 10.6 min on
an Atlantis T3 5μ 4.6 mm × 250 mm C18 column, water-acetonitrile, 0.1% formic acid, 98% to
10% water gradient in 30 min). Product confirmed by the mass spectroscopy (ESMS, ESI+), m/z
661.83 (100%, [M+H] +), Calcd. 662.84.
Characterization of metal complexes
The first step in characterization of metal complex is metal content analysis. For biomedical
applications, the required dosage is determined based on the metal content. It should be
emphasized that excess inorganic salts, free ligand and water present in the samples can
significantly increase the apparent molecular weight. The Gd3+-content is generally measured by
inductively coupled plasma atomic emission spectroscopy (ICP-AES), also known as inductively
coupled plasma optical emission spectrometry (ICP-OES) or inductively coupled plasma mass
spectrometry (ICP-MS).[126] Several companies offer metal content analysis ICM-AES and MS
service.
2.3.2 Relaxivity measurements
The relaxivity measurements were performed on a Bruker Minispec MQ60 and MRS-6
instrument operating at 1.4 T and 0.47T, respectively. Using an inversion –recovery pulse
sequence (180-𝜏-90). Relaxivity of Gd3+ complexes of ligand 1, ligand 2 and ligand 3 were

39
determined by the linear regression analysis of the relaxation rates of a set of solutions ranging in
concentration from 0.3 to 3 mM solution.
Relaxivity measurement with Human Serum Albumin (HSA)
Affinity constants to HSA were assessed by proton relaxation enhancement (PRE) measurements
according to published procedures. The proton relaxation rates at increasing concentrations of
protein were measured with a MRS-6 NMR analyzer (20 MHz, 310 K). For the enzyme titration
(E-titration), the concentration of GdL complex (0.1 mM) was kept constant, while the protein
concentration was varied from 0 to 0.5 mM. The data were fitted to equation (2.11), where r1f
and r1c are the proton relaxivities of the free and the bound state, cHSA and c1 are the
concentration of HSA and of the complex, respectively, and n is the number of binding sites on
the protein. [52]
1
211
11
1111
31
...4..
2
1.
10
CcnKccnKccn
rrcr
R
HSAAHSAAHSA
fcf
pobs
(2.11)
2.3.3 17O NMR measurements
17O NMR experiments were performed at 9.4 T on a Bruker AVANCE III NMR
spectrometer. The temperature was varying from 293 to 350 K to estimate the water exchange
rates. The samples ([Gd] approximately 15 mM) were prepared in 17O enriched water (2%) with
the pH being maintained at 7.4 with 100 mM HEPES buffer. The sample was loaded into an 18
µL spherical bulb (Wilmad-Lab Glass, Vineland, NJ) and placed inside a 5 mm NMR tube
containing 400 µL of water to eliminate any susceptibility effects. Temperatures were calibrated

40
using ethylene glycol solution. The temperature dependence of the 17O linewidths were fitted
using nonlinear least-squares MATLAB fit using the following equations. The equations and
parameters are explained in detail in analysis section. [53]
Determination of the number of inner-sphere bound water molecules by 17O NMR
Experiment performed in 9.4 T NMR , 200 μl of the 20 mM Gd complexes in 17O
enriched H2O as solvent and 5μl of tert-butal was added to the solution as an internal reference
was placed in the 5mm NMR tube. After equilibration of the temperature at 70 C in the
spectrometer, the 17O chemical shift of the water resonance was determined. Another sample of
pure 17O enriched H2O (200μl) with 5μl tert-butanol was prepared as reference and chemical
shift was recorded with the same spectrometer setting. Data were fitted to the questions to obtain
the number of inner sphere bound water (q).[54]
17O NMR analysis
From the measured 17O NMR relaxation rates and angular frequencies of the
paramagnetic solutions, 1/T2 and ω, and of the acidified water reference, 1/T2A and 𝜔𝐴, one can
calculate the reduced relaxation rates and chemical shifts, 1/T2r and Δωr, which may be written in
Equations (2.12)-(2.13), where, 1/T2m is the relaxation rate of the bound water and Δωm is the
chemical shift difference between bound and bulk water molecules, τm is the mean residence time
or the inverse of the water exchange rate kex and Pm is the mole fraction of the bound water. [31,55]
osm
-
m
-
m
mm
-
m
-
m
mAmr T+
+Δ)+T(τ
+ΔT+τT
τ=
TTP=
T 2
221
2
1
2
12
12
2
222
111111
(2.12)
os
mm
-
mm
mA
m
r +ΔΔω+τ)T+τ(
Δω)=ω(ω
P=Δω
2221
21
1
(2.13)

41
The outer sphere contributions to the 17O relaxation rates 1/T2OS are being neglected according to
previous studies.[45] Therefore, Equations (2.12-2.13) can be further simplified to Equation
(2.14):
mm
m
r τ T
pq
T
22
1 (2.14)
The exchange rate obeys the Eyring Equation (2.15). In Equation (2.15) ΔS‡ and ΔH‡ are the
entropy and enthalpy of activation for the water exchange process, and kex298 is the exchange rate
at 298.15 K.
T.R
ΔH
.
Tk=
RT
ΔH
R
ΔS
h
Tk==k
τ
‡
ex
‡‡
Bex
m
1
15298
1exp
15298exp
1298
(2.15)
In the transverse relaxation, the scalar contribution, 1/T2sc, is the most relevant [Equation (2.16)].
1/τs1 is the sum of the exchange rate constant and the electron spin (S) relaxation rate [Equation
(2.17)].
2
21 2 2
2m 2sc 2
1 1 ( 1)
3 1
ss
S s
S S A
T T
(2.16)
ems T+
τ=
τ 11
111
(2.17)
In Equation (2.13) the chemical shift of the bound water molecule, Δωm, depends on the
hyperfine interaction between the Gd3+ electron spin and the 17O nucleus and is directly
proportional to the scalar coupling constant, A/ħ, as expressed in Equation (2.18).[46]
A
Tk
)BS(S+μg=Δω
B
BLm
3
1 (2.18)

42
The isotopic Landé g factor is equal to 2.0 for the Gd3+, μB represents the dipolar magnetic
moment, and kB is the Boltzmann constant. The outer-sphere contribution to the chemical shift is
assumed to be linearly related to Δωm by a constant Cos [Equation (2.19)].[37]
mosos Δω=CΔω
(2.19)
2.3.4 Data analysis
In the 17O NMR data fitting for the Gd3+ complexes, rGdO has been fixed to 2.50 Å, based
on available crystal structures and recent electron spin-echo envelope modulation (ESEEM)
results[56]. The quadrupolar coupling constant, χ (1+ɳ2/3)1/2, has been set to the value for pure
water, 7.58 MHz. The parameters characterizing the electron spin relaxation, such as the
correlation time for the modulation of the zero-field-splitting, τv298, and its activation energy, Ev,
and the mean-square zero-field-splitting energy, Δ2 were fixed with [GdDOTA(H2O)]- to 11 ps, 1
kJ mol-1 and 0.16 × 10⁻²⁰ s-1, respectively, for simpler analogy as reported for various Gd-DOTA
derivatives.[57] The empirical constant describing the outer sphere contribution to the 17O
chemical shift, Cos, was also fitted for the all Gd complexes (0.1 ± 0.01) otherwise small A/ħ
values were obtained.[57] Inner sphere water molecules were adjusted to the values calculated by
17O NMR for each complex.[6]
2.3.5 In vivo experiments
All animal experiments were conducted according to the standard of the University of
Texas Southwestern Medical Center Institutional Animal Care and Use Committee. Male

43
C57/blk6 mice of 6-10 weeks of age (approximately 30 g) were used for imaging. Animals were
anesthetized with isoflurane (1-2% in medical oxygen) and probes were places on the skin to
monitor temperature and on the chest to monitor respiration. Each animal experiment was
performed three times. Gd1 (15 mM, 100 μL, 0.05 mmol/kg and 30 mM, 100 μL, 0.1 mmol/kg
doses) and Gd2 (30 mM, 100 μL, 0.1 mmol/kg doses) were administered by i.v. injection. T1-
weighted imaging was performed on a 9.4T imaging system using a ge3D sequence. [126] The
following parameters were used: TR 3.6 ms, TE 1.8ms, FOV 35 × 75 ×75 mm3, flip angle 20°,
data matrix 128*128*128, 4 averages. Where the TR, TE and FOV are repetition time, echo time
and filed of view respectively.
2.3.6 Photophysical measurements
Photophysical data were collected on samples in solution (HEPES buffer at pH 7.4 or
D2O) placed in 2.4 mm i.d. quartz capillaries or quartz Suprasil cells. Absorption spectra were
acquired on a Jasco V670 spectrophotometer. Emission and excitation spectra were measured on
a custom-designed Horiba Scientific Fluorolog 3 spectrofluorimeter equipped with a visible
photomultiplier tube (PMT) (220–850 nm, R928P; Hamamatsu), a NIR solid-state InGaAs
detector cooled to 77 K (800–1600 nm, DSS-IGA020L; Horiba Scientific), or a NIR PMT (950–
1650 nm, H10330-75; Hamamatsu). Excitation and emission spectra were corrected for the
instrumental functions. Luminescence lifetimes were determined under an excitation at 355 nm
provided by a Nd:YAG laser (YG 980; Quantel). Signals were detected in the NIR by a
Hamamatsu H10330-75 PMT. Output signals from the detector were fed into a 500 MHz
bandpass digital oscilloscope (TDS 754C; Tektronix), transferred to a PC for data processing

44
with the software Origin 8®. Luminescence lifetimes are averages of at least three independent
measurements. Quantum yields were determined with a Fluorolog 3 spectrofluorimeter based on
an absolute method with the use of an integration sphere (Model G8, GMP SA, Renens,
Switzerland).[58] Each sample was measured several times under comparable experimental
conditions, varying the position of samples. Estimated experimental error for the quantum yield
determination is 10 %. [58,126]
2.4 RESULT AND DISCUSSION
2.4.1 Structural characterization
The synthesis of ligands 1-3 are outlined in Scheme 2.1, 2.2 and 2.3. Tropones with a
leaving group (Cl, Br or OTs) at position 2 easily undergo aromatic nucleophilic substitution. [45]
We have chosen the commercially available tropolone-p-toluenesulfonate (tropolone tosylate)
for the synthesis of ligand 1 and 2. This reagent reacted cleanly with DO3A-tris (tert-butyl ester)
and DO2A-bis (tert-butyl ester) to give the expected tert-butyl protected products (Scheme 2.1
and 2.2). DO3A (t-Bu)3 and DO2A(t-Bu)2 are convenient starting materials that are frequently
used for the synthesis of mixed sidearm DOTA derivatives compounds. Finally, for
photophysical meaurements and in vivo imaging, the complexes were purified by preparative
HPLC using a reversed phase C18 column and water–acetonitrile 0.1% TFA gradient as eluent,
which removed inorganic salts along with other unwanted impurities. [126]
Acid hydrolysis of the tert-butyl groups gave the desired ligands as free acid in good yield. For
the synthesis of ligand 3 the isopropyl derivative β-thujaplicin tosylate was easily obtained by

45
reacting the commercially available β-thujaplicin (2-hydroxy-4-isopropyl-2,4,6-cycloheptatrien-
1-one,4-isopropyl tropolone) with tosyl chloride in the presence of pyridine as base.
Scheme 2.1. Synthesis of ligand 1 and its complexes.[126]
The neutral lanthanide complexes of ligand 1 and 3 were prepared by adding LnCl3 solutions (Ln
= Gd, Eu, Nd and Yb) and (Ln=Gd) respectively to the ligand at pH 6 in the presence of OH-
form anion exchange resin as a base. The use of anion exchanger minimized the presence of
inorganic salts in the final product. Ligand 2 forms positively charged lanthanide complexes and
in this case, the lanthanide complexes were prepared by adding Ln (OH)3 solution (Ln = Gd, Eu,
Nd and Yb ) the ligand at pH 7. A slight excess of metal ion was employed to ensure complete
complexation of the ligands. After complexation, the excess of metal was removed by raising the
pH above 8 where Ln3+ ions form insoluble hydroxide. Traces of metal ion were removed by
treatment with Chelex resin, which has free iminodiacetic acid moieties for metal binding.

46
Scheme 2.2. Synthesis of ligand 2 and its complexes.
The absence of free metal was confirmed by the xylenol orange test. The resulting solutions were
lyophilized to yield the compounds. Finally, for photophysical measurements and in vivo
imaging, the complexes were purified by preparative HPLC using a reversed phase C18 column
and water–acetonitrile 0.1% TFA gradient as eluent, which removed inorganic salts along with
other unwanted impurities.

47
Scheme 2.3. Synthesis of ligand 3 and its complexes
2.4.2 High resolution of 1H NMR spectra
Lanthanide chelates of DOTA and related ligands exist as mixtures of interconverting
coordination isomers. These isomers differ in the twist angle of the N4/O4 squares. The square
antiprism (SAP) isomer has a N4/O4 twist angle of approximately 39° while the twisted square
antiprism (TSAP) isomer has a twist angle of around 27°. The N4 and O4 squares are closer to
each other in the SAP isomer than in the TSAP, and therefore, the former has a more compact
structure. [24,25] This is clearly illustrated by the much larger lanthanide-induced 1H NMR shifts
of the ligand proton signals. The inner sphere water molecule occupies a capping position above

48
the O4 square and so in the more compact structure of the SAP isomer it is located closer to the
metal ion. The shorter Ln-O distance means the SAP isomer generally has slower water
exchange. Thus, the existence of these isomers is important for the design of MRI contrast agents
because of the differences in water exchange rates of these forms. Due to the more open cavity of
the TSAP form, the larger (lighter) lanthanide ions (Ce3+, Pr3+ and Nd3+) usually prefer the TSAP
geometry while the smaller (heavier) lanthanides (Tb3+ and above) prefer the more compact SAP
geometry.
Figure 2.7. Model of LnDOTA-type chelate. The macrocyclic ring adopts a square conformation
with a carbon atom at each corner. The four nitrogen donor atoms of the ring coordinate to one
face of the metal ion while the four oxygen atoms of the pendant arm carboxylates coordinate to
the opposite face. The coordination is completed by a capping water molecule. The DOTA-type
chelates may adopt one of two coordination geometries, a capped square antiprism, SAP or
capped twisted square antiprism, TSAP, defined by the torsion angle between the two
coordination planes. Reprinted with permission from Ref. 24, 25. Copyright 2012 American
Chemical Society.
Complexes of the medium sized Ln3+ ions such as Sm3+, Eu3+ and Gd3+ exist as an equilibrium
mixture of both isomers. The coordination geometry can easily be determined by 1H NMR
spectroscopy because the Ln3+ induced dipolar shifts of the ligand protons are quite different in
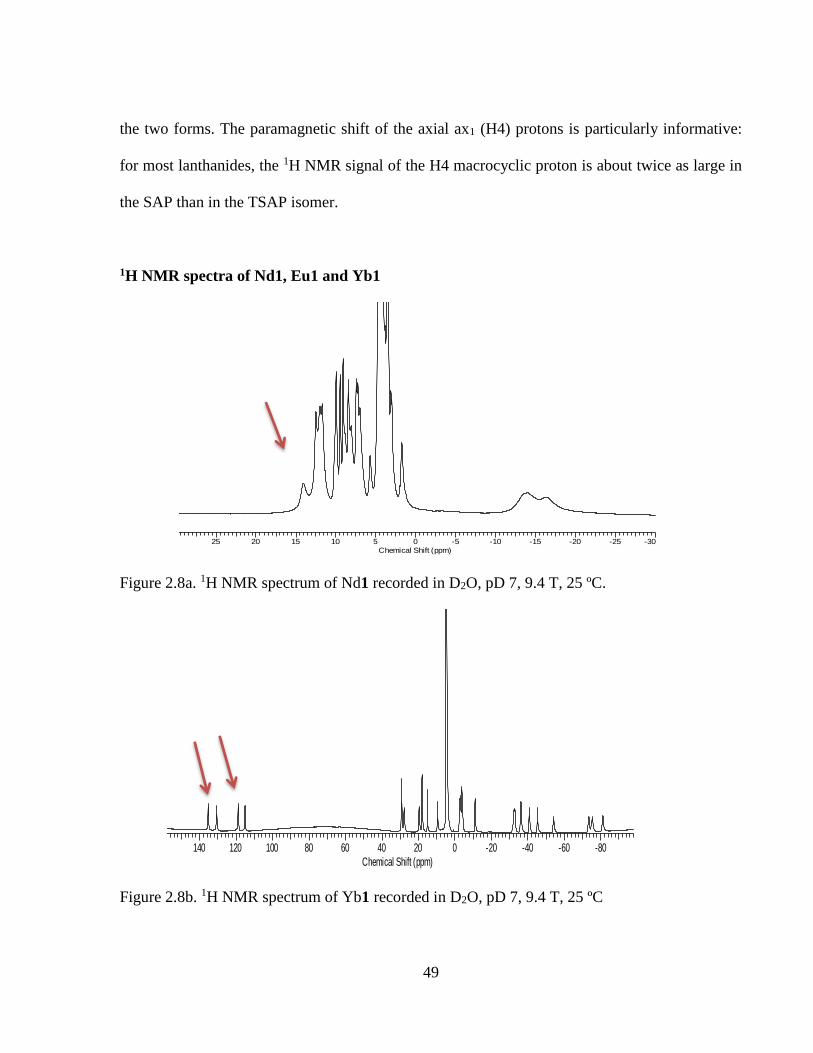
49
the two forms. The paramagnetic shift of the axial ax1 (H4) protons is particularly informative:
for most lanthanides, the 1H NMR signal of the H4 macrocyclic proton is about twice as large in
the SAP than in the TSAP isomer.
1H NMR spectra of Nd1, Eu1 and Yb1
1H_Nd_Mono_afterHPLC_05242017
25 20 15 10 5 0 -5 -10 -15 -20 -25 -30
Chemical Shift (ppm)
0.005
0.010
0.015
0.020
0.025
0.030
0.035
0.040
0.045
0.050
0.055
0.060
0.065
Norm
aliz
ed In
tensi
ty
Figure 2.8a. 1H NMR spectrum of Nd1 recorded in D2O, pD 7, 9.4 T, 25 ºC.
1H_Yb_mono_afterHPLC
140 120 100 80 60 40 20 0 -20 -40 -60 -80
Chemical Shift (ppm)
0.05
0.10
0.15
0.20
0.25
0.30
0.35
0.40
0.45
Norm
alized Inte
nsity
4.7
5
Figure 2.8b. 1H NMR spectrum of Yb1 recorded in D2O, pD 7, 9.4 T, 25 ºC

50
1H_ex90_d2o_EuCl3_010416
40 35 30 25 20 15 10 5 0 -5 -10 -15 -20 -25
Chemical Shift (ppm)
0.05
0.10
0.15
0.20
0.25
0.30
0.35
0.40
0.45
0.50
0.55
0.60
0.65
Norm
alized Inte
nsity
4.7
5
Figure 2.8c. 1H NMR spectrum of Eu1 recorded in D2O, pD 7, 9.4 T, 25 ºC.
1H NMR spectra of Nd2, Eu2 and Yb2
1H_ex125_b1_3rd_Nd_04072017
30 25 20 15 10 5 0 -5 -10 -15 -20 -25 -30
Chemical Shift (ppm)
0.01
0.02
0.03
0.04
0.05
0.06
0.07
0.08
0.09
0.10
0.11
0.12
0.13
0.14
0.15
0.16
Nor
mal
ized
Inte
nsity
Figure 2.9a. 1H NMR spectrum of Nd2 recorded in D2O, pD 7, 9.4 T, 25 ºC.

51
ex32_bis_b2_Yb_2nd_d2o_04072017
150 100 50 0 -50 -100 -150
Chemical Shift (ppm)
0.05
0.10
0.15
Norm
alized Inte
nsity
Figure 2.9b. 1H NMR spectrum of Yb2 recorded in D2O, pD 7, 9.4 T, 25 ºC.
1H_ex100_b1_07122017
48 40 32 24 16 8 0 -8 -16 -24 -32 -40 -48
Chemical Shift (ppm)
0.05
0.10
0.15
0.20
0.25
Norm
alized Inte
nsity
Figure 2.9c. 1H NMR spectrum of Eu2 recorded in D2O, pD 7, 9.4 T, 25 ºC.

52
Thus, the shifts of the H4 protons in the 1H NMR spectrum of Nd1 (Figure 2.8a) indicates that
this complex exclusively adopted the twisted square antiprism (TSAP) geometry. Eu1 exists in
solution predominantly as the square antiprism (SAP) isomer with about 20 % of the TSAP form
while and Yb3+ chelate exclusively formed the SAP isomer. 1H NMR spectra of ligand 2
indicated that the Nd+3 complexes (Figure 2.9a) adopted the twisted square antiprism (TSAP)
geometry. Eu2 exists in solution as the square antiprism (SAP) isomer and Yb3+ chelate
exclusively formed the SAP isomer. This behavior is analogous to that of the corresponding
DOTA complexes. [56]
2.4.3 Determination of the number of inner sphere water molecules in the Gd complexes
The number of inner sphere water molecules in Gd1, Gd2 and Gd3 complexes were
measured by 17O NMR bulk magnetic susceptibility water shift measurements The determination
of the number of coordinated water molecules in Ln(III) complexes by 17O NMR spectroscopy
was performed as described previously by Djanashvily et al. Gd3+ complexes (in D2O) were
used for these studies, since at the fast exchange regime (high temperatures) the 17O chemical
shifts of water bound to these lanthanide ions are mostly of contact contribution. The
calculations performed provided q(Gd3+) = 1.4±0.2 .
2.4.4 Relaxivity measurements at 1.4 T and 0.47 T
As discussed previously, the 𝑟1 relaxivity characterizes how efficiently a contrast agent can
shorten the nuclear T1 relaxation time of the bulk water protons. It is generally measured as the
slope of R1 relaxation rate vs the concentration of the agent at 37 °C. Figure 2.10, 2.11 and 2.12

53
shows the experimental data for Gd1, Gd2 and Gd3 measured at two different fields (0.47 T and
1.4 T). The 𝑟1 values are summarized in Table 2.2, along with literature data reported for some
other Gd complexes. These values fall in the range that is expected for a small molecular weight
complex with one metal bound water molecule. [13,59] The slightly higher 𝑟1 values at lower field
are also in agreement with theoretical predictions. Not surprisingly, Gd3 had the highest
relaxivity among the studied complexes, very likely because of its slower rotational correlation
time (tumbling rate) and somewhat faster water exchange rate (see following section).
The paramagnetic relaxation effect between the Gd3+ ion and the 1H nuclei is mediated through
magnetic dipole-dipole interactions between the electron and nuclear spins. The strength of
these dipole-dipole interactions has a r-6 distance dependence.
(a) (b)
Figure 2.10. Plot of the relaxation rate of Gd1 versus concentration at (a) 0.47 T, (b) 1.4 T; 37 ºC
in water at pH 7.
y = 3.7615xR² = 0.9992
0
2
4
6
8
10
12
14
16
18
0 1 2 3 4 5[Gd1]/mM
R1/s
-1
y = 3.4577xR² = 0.9965
0
2
4
6
8
10
12
0 1 2 3 4
R1/ s
-1
[Gd1] /mM
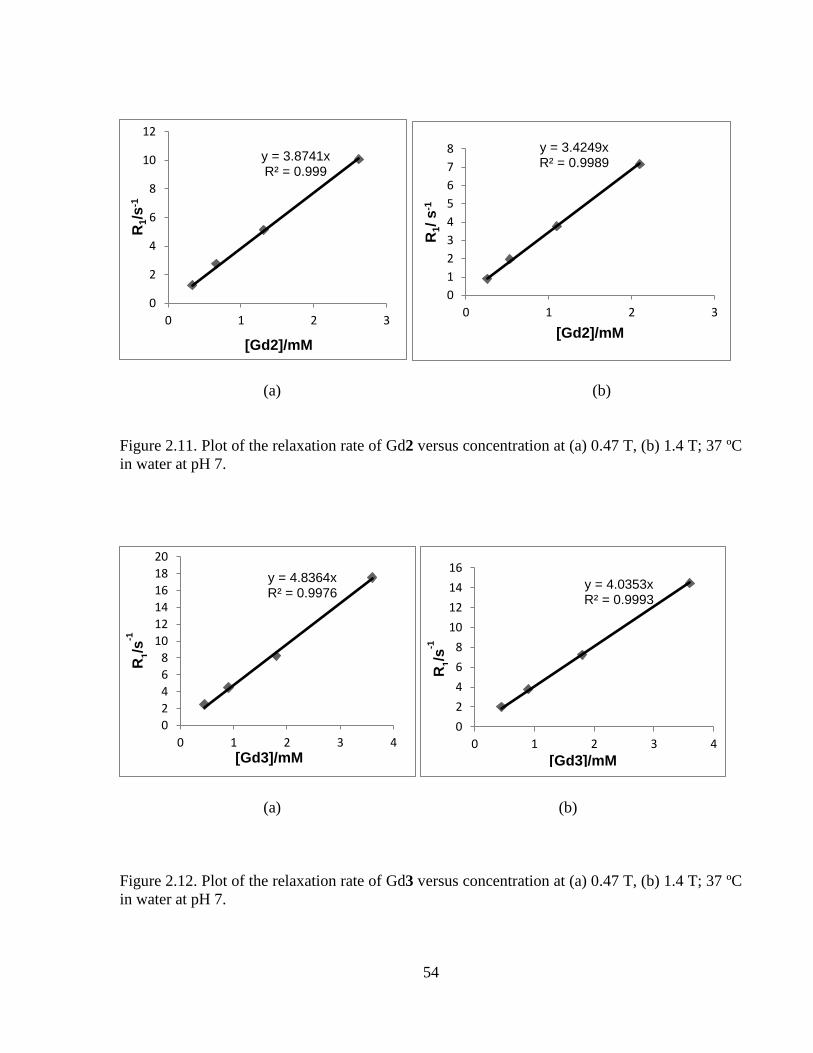
54
(a) (b)
Figure 2.11. Plot of the relaxation rate of Gd2 versus concentration at (a) 0.47 T, (b) 1.4 T; 37 ºC
in water at pH 7.
(a) (b)
Figure 2.12. Plot of the relaxation rate of Gd3 versus concentration at (a) 0.47 T, (b) 1.4 T; 37 ºC
in water at pH 7.
y = 3.8741xR² = 0.999
0
2
4
6
8
10
12
0 1 2 3
[Gd2]/mM
R1/s
-1
y = 3.4249xR² = 0.9989
0
1
2
3
4
5
6
7
8
0 1 2 3
R1/ s
-1
[Gd2]/mM
y = 4.8364xR² = 0.9976
0
2
4
6
8
10
12
14
16
18
20
0 1 2 3 4[Gd3]/mM
y = 4.0353xR² = 0.9993
0
2
4
6
8
10
12
14
16
0 1 2 3 4
R1/s
-1
R1/s
-1
[Gd3]/mM

55
Table 2.2. Summary of relaxivity data at different magnetic fields
Agent r1 at 0.47 T r1 at 1.4 T References
Gd1 3.8 3.5 This work [126]
Gd2 3.9 3.4 This work
Gd3 4.8 4.0 This work
Magnevist 3.4 3.3 Ref.[60]
Omniscan 5.3 4.7 Ref.[60]
Prohance 3.1 2.9 Ref.[60]
Dotarem 3.4 2.9 Ref.[60]
Gadovist 3.7 3.3 Ref.[60]
Figure 2.13. Commercially available linear (open chain) and macrocyclic Gd containing MRI
contrast agents that do not bind to serum albumin Reprinted with permission from Ref. 60.

56
Therefore, the paramagnetic relaxation enhancement is the strongest on the 1H nuclei of the
water molecules that are directly bound to the Gd3+ ion. The paramagnetic effect of the Gd3+ is
transferred to the bulk water protons by the exchange of the inner-sphere water molecule. In
order to have efficient relaxation of the bulk water proton spins, the bulk water protons of the
solvent must be in rapid exchange with the inner sphere water protons ( directly bound to the
lanthanide) of the Gd 3+ complex. However, it is important to emphasize that there is an optimal
range for the water exchange. The maximum 𝑟1value cannot be achieved, if the water exchange
is too fast or too slow. Based on SBM theory, for Gd3+ complexes with q=1, the 𝑟1value depends
on the molecular tumbling correlation time,𝜏𝑐 , bound water lifetime (𝜏𝑀 ) and magnetic field. If
𝜏𝑀 is too short (<1 ns), the water molecule does not spend enough time bound with the
lanthanide center to get fully relaxed. On the other hand, if 𝜏𝑀 is too long (>1μs), the fewer bulk
water molecules exchange with the inner sphere water molecule and the paramagnetic relaxation
effect of the Gd3+-ion is not efficiently transferred to the bulk. Therefore, 𝜏𝑀 must be optimal to
have maximal r1 value at any imaging field strength.
Thus, the exchange rate (kex) of the metal bound water is an especially important parameter in
the design and optimization of MR agents. The kex is frequently discussed as residence lifetime
(𝜏𝑀 = 1/kex). Based on SBM theory, for optimal relaxivity, 𝑘𝑒𝑥 value should be around 108 s-1.
Water exchange rates of current Gd3+ complexes based on a polyazapolycarboxylate framework
are slower (𝑘𝑒𝑥≈ 106 s-1), than the optimal value which is predicted by the SBM theory. [61] As
described previously, the steric and electronic factors that influence water exchange rate in
lanthanide complexes are now well known. Generally, increasing steric crowding around the
lanthanide ion as well as increasing negative charge tends to accelerate the water exchange rate.
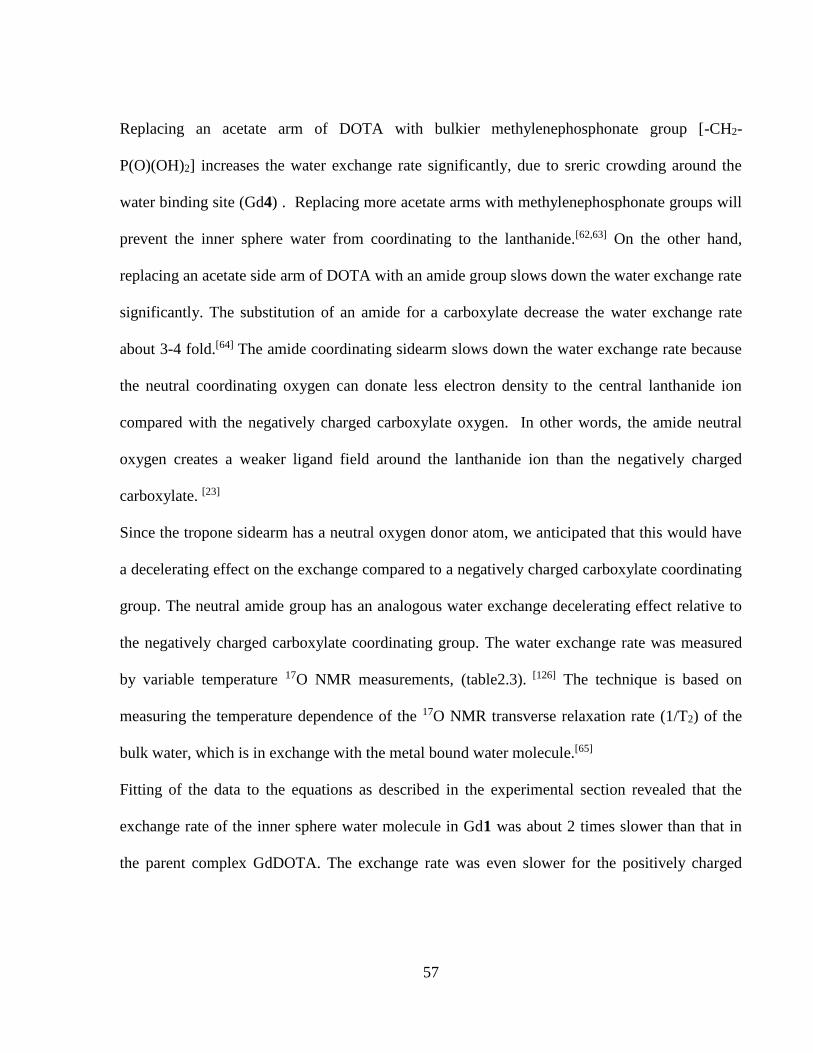
57
Replacing an acetate arm of DOTA with bulkier methylenephosphonate group [-CH2-
P(O)(OH)2] increases the water exchange rate significantly, due to sreric crowding around the
water binding site (Gd4) . Replacing more acetate arms with methylenephosphonate groups will
prevent the inner sphere water from coordinating to the lanthanide.[62,63] On the other hand,
replacing an acetate side arm of DOTA with an amide group slows down the water exchange rate
significantly. The substitution of an amide for a carboxylate decrease the water exchange rate
about 3-4 fold.[64] The amide coordinating sidearm slows down the water exchange rate because
the neutral coordinating oxygen can donate less electron density to the central lanthanide ion
compared with the negatively charged carboxylate oxygen. In other words, the amide neutral
oxygen creates a weaker ligand field around the lanthanide ion than the negatively charged
carboxylate. [23]
Since the tropone sidearm has a neutral oxygen donor atom, we anticipated that this would have
a decelerating effect on the exchange compared to a negatively charged carboxylate coordinating
group. The neutral amide group has an analogous water exchange decelerating effect relative to
the negatively charged carboxylate coordinating group. The water exchange rate was measured
by variable temperature 17O NMR measurements, (table2.3). [126] The technique is based on
measuring the temperature dependence of the 17O NMR transverse relaxation rate (1/T2) of the
bulk water, which is in exchange with the metal bound water molecule.[65]
Fitting of the data to the equations as described in the experimental section revealed that the
exchange rate of the inner sphere water molecule in Gd1 was about 2 times slower than that in
the parent complex GdDOTA. The exchange rate was even slower for the positively charged
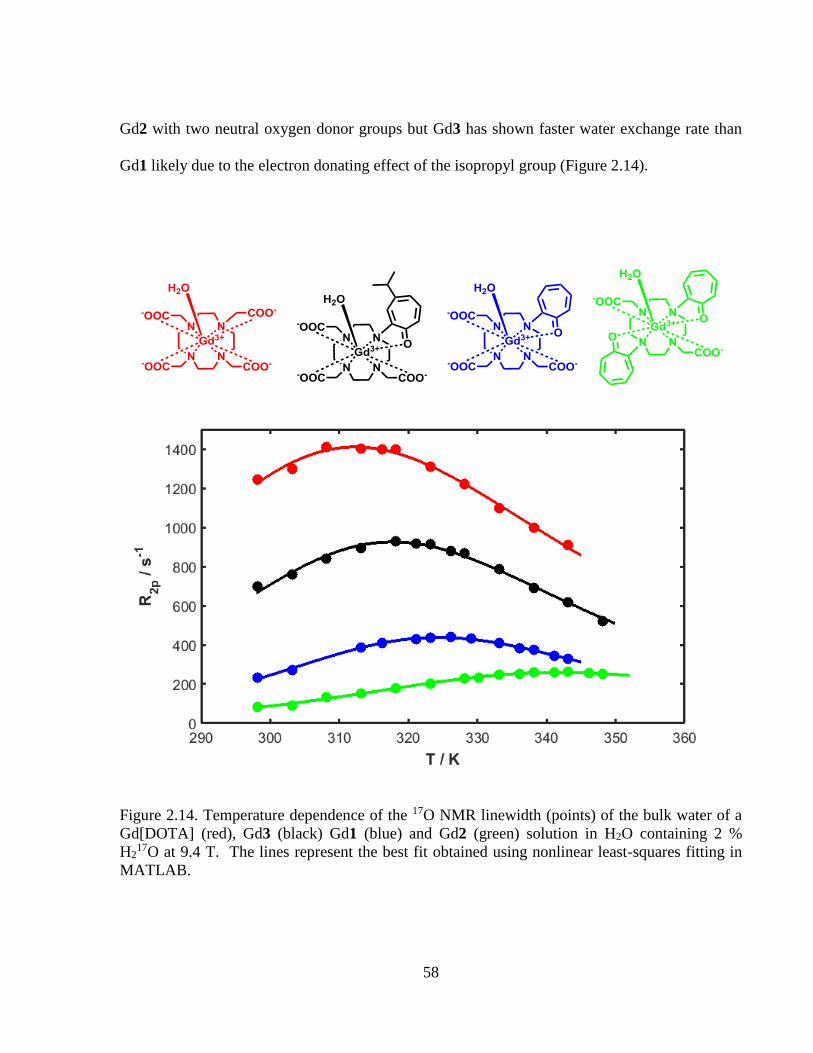
58
Gd2 with two neutral oxygen donor groups but Gd3 has shown faster water exchange rate than
Gd1 likely due to the electron donating effect of the isopropyl group (Figure 2.14).
Figure 2.14. Temperature dependence of the 17O NMR linewidth (points) of the bulk water of a
Gd[DOTA] (red), Gd3 (black) Gd1 (blue) and Gd2 (green) solution in H2O containing 2 %
H217O at 9.4 T. The lines represent the best fit obtained using nonlinear least-squares fitting in
MATLAB.

59
Table 2.3. Fitting results of the water exchange rates for GdDOTA , Gd3, Gd1 and Gd2 at 9.4 T
in 2 % 17O water. The water lifetime, τm, and the activation enthalpy of the exchange, ΔHm, was
varied. The estimated fitting error is below 20 % in all fitted parameters.
Parameters q kex (s-1) τM298 (ns) ΔHM (J mol-1) Refrences
GdDOTA 1 4.1× 10⁶ 244 49000 Ref.[23,67]
Gd3 1 3.17×10⁶ 320 34325 This work
Gd1 0.8 2.01×10⁶ 500 39461 This work
Gd2 0.8 1.12×10⁶ 890 35301 This work
Figure 2.15.The effect of the tropone sidearm on the water exchange rate of lanthanide
complexes in DOTA based ligands in comparison to other coordinating groups.
Fast Slow
kex (106 s-1)
25 4.1 3.17 2.01 1.52 1.12

60
While these exchange rates are slower than optimal, they did not affect the 𝑟1 considerably
because they are still in the range where the relaxivity is limited by the short rotational
correlation time of the complex.[66] In comparison to other coordinating groups, the tropone
sidearm have a water exchange slowing effect similar to, but somewhat weaker than the amide
group and it nicely fills the gap between the acetate and the amide (Figure 2.15).
Thus, the tropone sidearm could be used to fine tune the water exchange rate of a lanthanide
complex for applications where slow water exchange is preferred (e. g. paraCEST).
2.4.5 Relaxivity in Presence of Human Serum Albumin (HSA)
Human serum albumin (HSA) is the most abundant blood protein (0.6 mM) with multiple
binding sites which is providing a depot for different substrates. Binding to HSA is also
important factor for developing MRI contrast agents. Generally, albumin binding increase the
lifetime of the complexes in the blood pool, and could retain the contrast agent in blood pool
longer to provide enough time period and allows radiologist to obtain multiple imaging. It is well
known that a variety of substrates compounds can bind to HSA via site I and II (Sudlow’s sites)
on the protein. Site II preferred mostly by the aromatic carboxylates. The location of the HSA
binding sites can be determined by using fluorescent probes such as dansyl-L-asparagine and
dansylsacrosine, which bind to Sudlow’s site I and II, respectively.[68] Metal complexes with
aromatic groups can also interact with albumin. When a paramagnetic substrate interacts with a
protein the relaxation rate of the bulk solvent protons is increased due to the slower rotation of
the paramagnetic complex. Assuming that the complex binds to only one site, the association and
dissociation constants are defined as shown below:
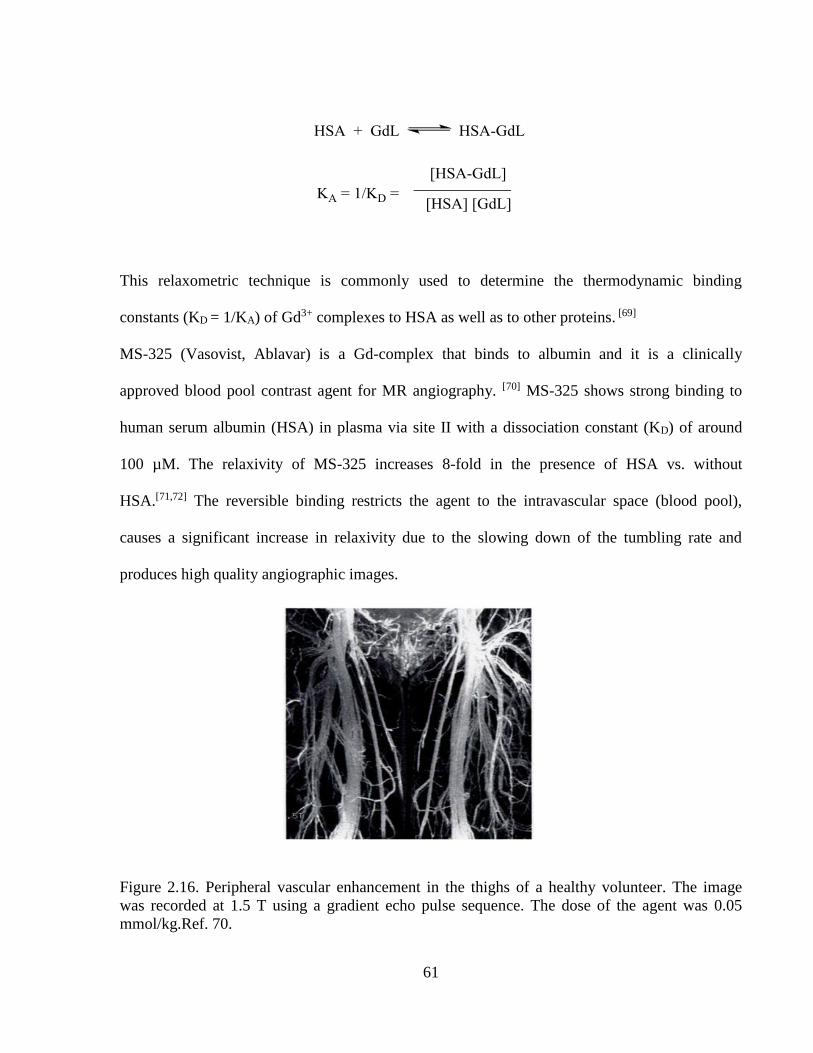
61
This relaxometric technique is commonly used to determine the thermodynamic binding
constants (KD = 1/KA) of Gd3+ complexes to HSA as well as to other proteins. [69]
MS-325 (Vasovist, Ablavar) is a Gd-complex that binds to albumin and it is a clinically
approved blood pool contrast agent for MR angiography. [70] MS-325 shows strong binding to
human serum albumin (HSA) in plasma via site II with a dissociation constant (KD) of around
100 µM. The relaxivity of MS-325 increases 8-fold in the presence of HSA vs. without
HSA.[71,72] The reversible binding restricts the agent to the intravascular space (blood pool),
causes a significant increase in relaxivity due to the slowing down of the tumbling rate and
produces high quality angiographic images.
Figure 2.16. Peripheral vascular enhancement in the thighs of a healthy volunteer. The image
was recorded at 1.5 T using a gradient echo pulse sequence. The dose of the agent was 0.05
mmol/kg.Ref. 70.
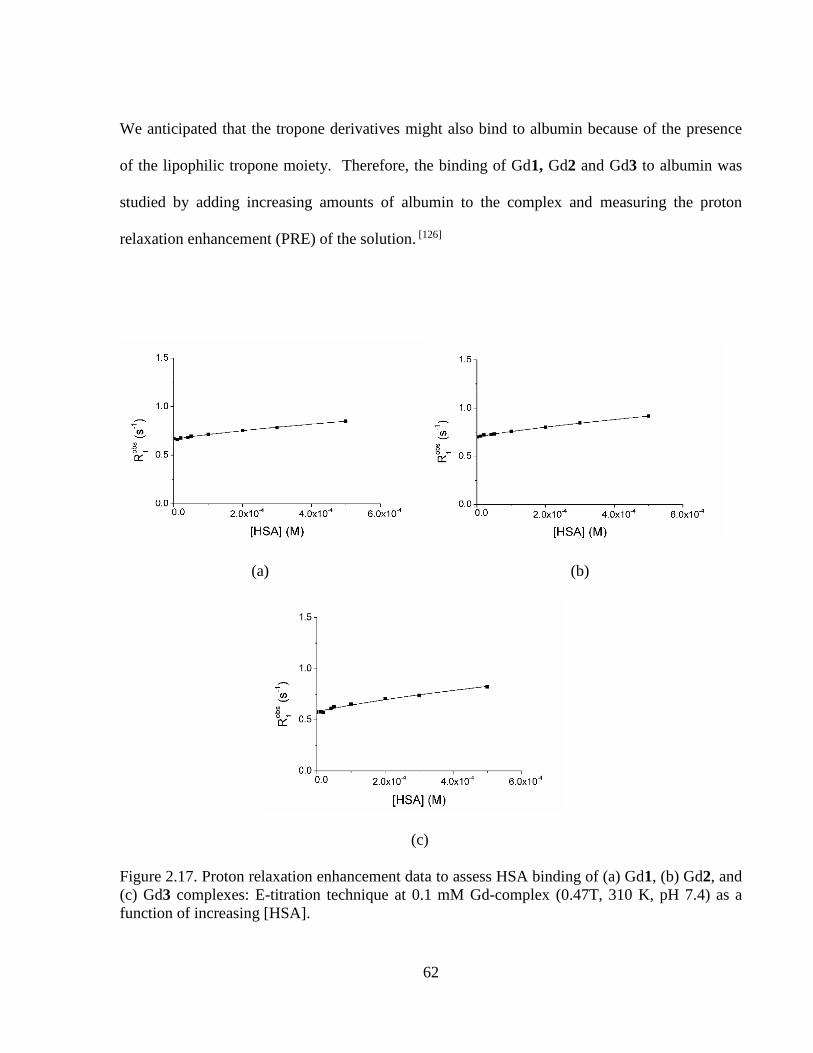
62
We anticipated that the tropone derivatives might also bind to albumin because of the presence
of the lipophilic tropone moiety. Therefore, the binding of Gd1, Gd2 and Gd3 to albumin was
studied by adding increasing amounts of albumin to the complex and measuring the proton
relaxation enhancement (PRE) of the solution. [126]
(a) (a) (b)
(c)
Figure 2.17. Proton relaxation enhancement data to assess HSA binding of (a) Gd1, (b) Gd2, and
(c) Gd3 complexes: E-titration technique at 0.1 mM Gd-complex (0.47T, 310 K, pH 7.4) as a
function of increasing [HSA].

63
Table 2.4. Parameters obtained from relaxometric titrations of Gd-complexes with human serum
albumin (0.47 T, 310 K).
Complex KD (mM) n r1c (s-1 mM-1) r1
f (s-1 mM-1) references
Gd1 1.63 ±0.08 1 16 ± 2 3.5 ± 0.1 This work
Gd2 1.39±0.07 1 14 ±2 3.4±0.1 This work
Gd3 1.29±0.08 1 15±2 4.0±0.1 This work
Gd(BOPTA)
Multihance
0.667
1
43
5.2
[39,44]
Gd(EOB-DTPA)
Primovist/Eovist
0.667
1
37
6.0
[73]
MS-325
(Vasovist, Ablavar)
0.164
1
49
5.6
[69,72]
Figure 2.18. Commercially available Gd-based MRI agents that bind to HSA.

64
Assuming that Gd-complexes only bind to one binding site in HSA (n = 1), we were able to
determine the KD values using Equation 2.11 as described in the experimental (Table 2.4).[52] The
binding of the complexes resulted in increased relaxivities as expected, but the r1 values did not
improve dramatically in the presence of albumin. Fitting of the data revealed a weak binding to
HSA with a dissociation constant of KD = 1.6, 1.4 and 1.3 mM-1 for Gd1, [126] Gd2 and Gd3
respectively, which does not significantly increase the 𝑟1 value of the complex in the
concentration range relevant for MR imaging. The affinity constant KA = 1/KD, obtained for all
tropone complexes were about an order of magnitude lower than that of MS-325. The lower
binding affinity can be explained by the fact that the aromatic tropone moiety is sterically not as
available for binding to HSA as the phenyl groups of MS-325.
2.4.6 In vivo imaging
Paramagnetic lanthanide complexes, in particular, Gd3+ chelates, have made a great
impact in diagnostic medicine as magnetic resonance imaging (MRI) probes. A large variety of
gadolinium complexes have been synthesized and tested as MRI contrast agents. All Gd-
complexes approved for clinical use are based on either the linear diethylenetriamine pentaacetic
acid (DTPA) or the macrocyclic 1, 4, 7, 10- tetraazacyclodecane -1,4,7,10-tetraacetic acid
(DOTA) ligand. Of these, the DOTA based complexes should be the preferred ones for in vivo
use because they have much higher kinetic inertness and therefore, in vivo stability, than the
linear complexes. The goal of our in vivo imaging studies was to demonstrate that the tropone
complexes show contrast enhancement in vivo and, perhaps even more importantly, they do not
have toxicity. In vivo imaging experiments were performed with the neutral Gd1 and Gd3

65
complexes but not with the positively charged Gd2, which is presumed to be toxic based on
previous data. The complexes were administered by i.v. injection at doses usually used in MRI,
ranging from 0.05 to 0.1 mmol /kg in male mice. The images (Figures 2.19 and 2.20) were
acquired up to 50 min. and the animals were monitored for several days for any adverse effects.
T1-weighted imaging was performed on a 9.4T small animal imaging system using a standard
gradient echo pulse sequence.
Figure 2.19. Axial T1 weighted images of mice after injection of Gd1 (15mM, 100μL, 0.1
mmol/kg). [126] The images show clearance by the kidneys and the liver (yellow arrows).
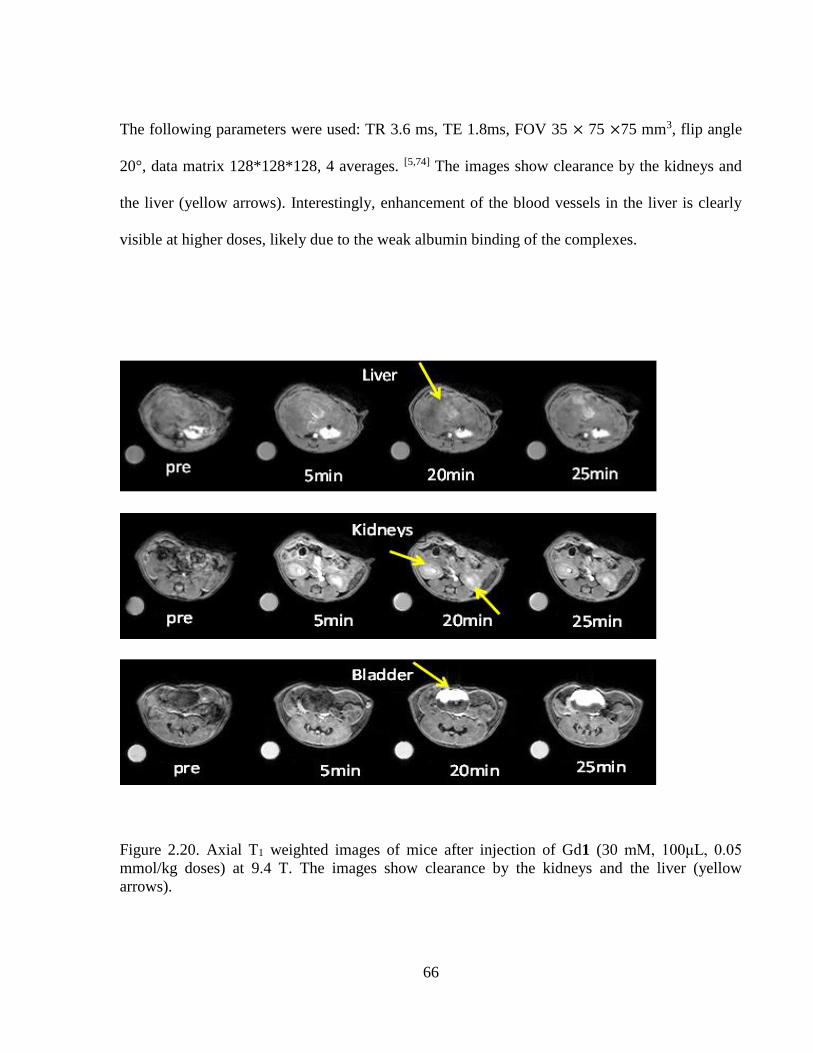
66
The following parameters were used: TR 3.6 ms, TE 1.8ms, FOV 35 × 75 ×75 mm3, flip angle
20°, data matrix 128*128*128, 4 averages. [5,74] The images show clearance by the kidneys and
the liver (yellow arrows). Interestingly, enhancement of the blood vessels in the liver is clearly
visible at higher doses, likely due to the weak albumin binding of the complexes.
Figure 2.20. Axial T1 weighted images of mice after injection of Gd1 (30 mM, 100μL, 0.05
mmol/kg doses) at 9.4 T. The images show clearance by the kidneys and the liver (yellow
arrows).

67
Figure 2.21. Axial T1 weighted images of mice after injection of Gd3 (30mM, 100μL, 0.1
mmol/kg doses) at 9.4 T. The images show clearance by the kidneys and the liver (yellow
arrows).
Mass spectrometric analysis of a urine sample taken from one of the mice injected with Gd1
indicated the presence of the intact complex in the urine. Gd3 imaging showed more contrast
Liver
pre 5min 20min 25min
Intestine
pre 5min 20min 25min
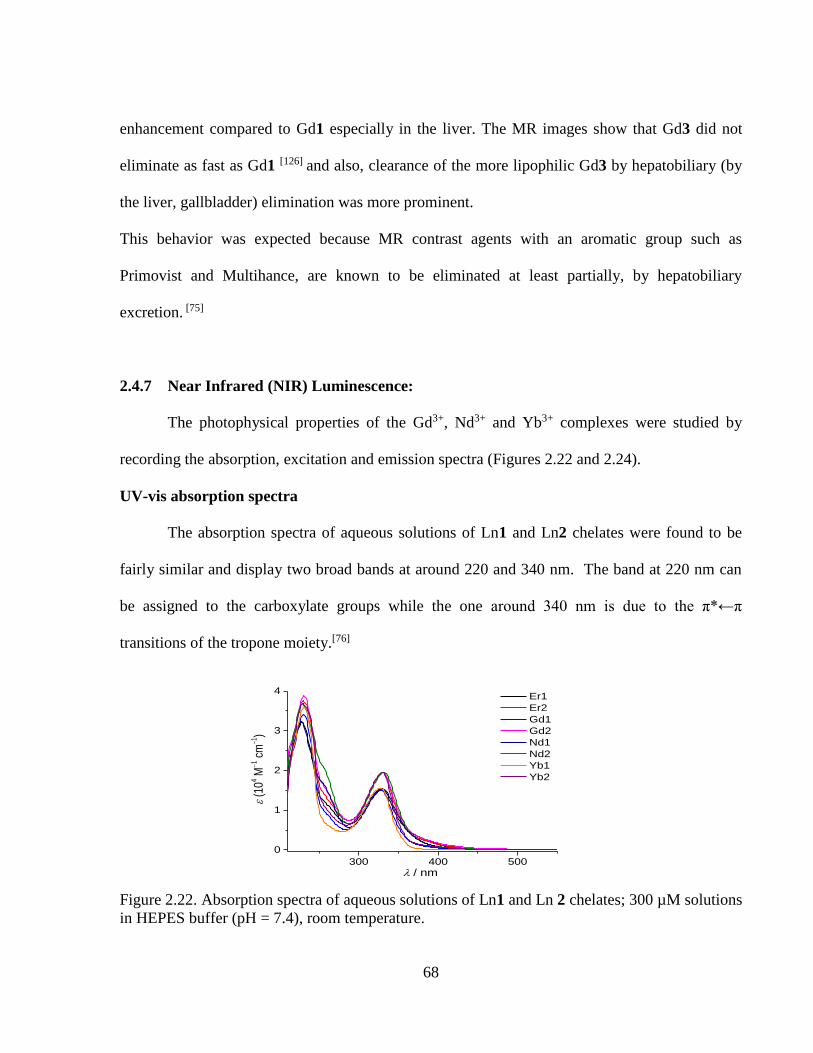
68
enhancement compared to Gd1 especially in the liver. The MR images show that Gd3 did not
eliminate as fast as Gd1 [126] and also, clearance of the more lipophilic Gd3 by hepatobiliary (by
the liver, gallbladder) elimination was more prominent.
This behavior was expected because MR contrast agents with an aromatic group such as
Primovist and Multihance, are known to be eliminated at least partially, by hepatobiliary
excretion. [75]
2.4.7 Near Infrared (NIR) Luminescence:
The photophysical properties of the Gd3+, Nd3+ and Yb3+ complexes were studied by
recording the absorption, excitation and emission spectra (Figures 2.22 and 2.24).
UV-vis absorption spectra
The absorption spectra of aqueous solutions of Ln1 and Ln2 chelates were found to be
fairly similar and display two broad bands at around 220 and 340 nm. The band at 220 nm can
be assigned to the carboxylate groups while the one around 340 nm is due to the π*←π
transitions of the tropone moiety.[76]
Figure 2.22. Absorption spectra of aqueous solutions of Ln1 and Ln 2 chelates; 300 µM solutions
in HEPES buffer (pH = 7.4), room temperature.
300 400 500
0
1
2
3
4
(1
04 M1
cm
1)
/ nm
Er1
Er2
Gd1
Gd2
Nd1
Nd2
Yb1
Yb2
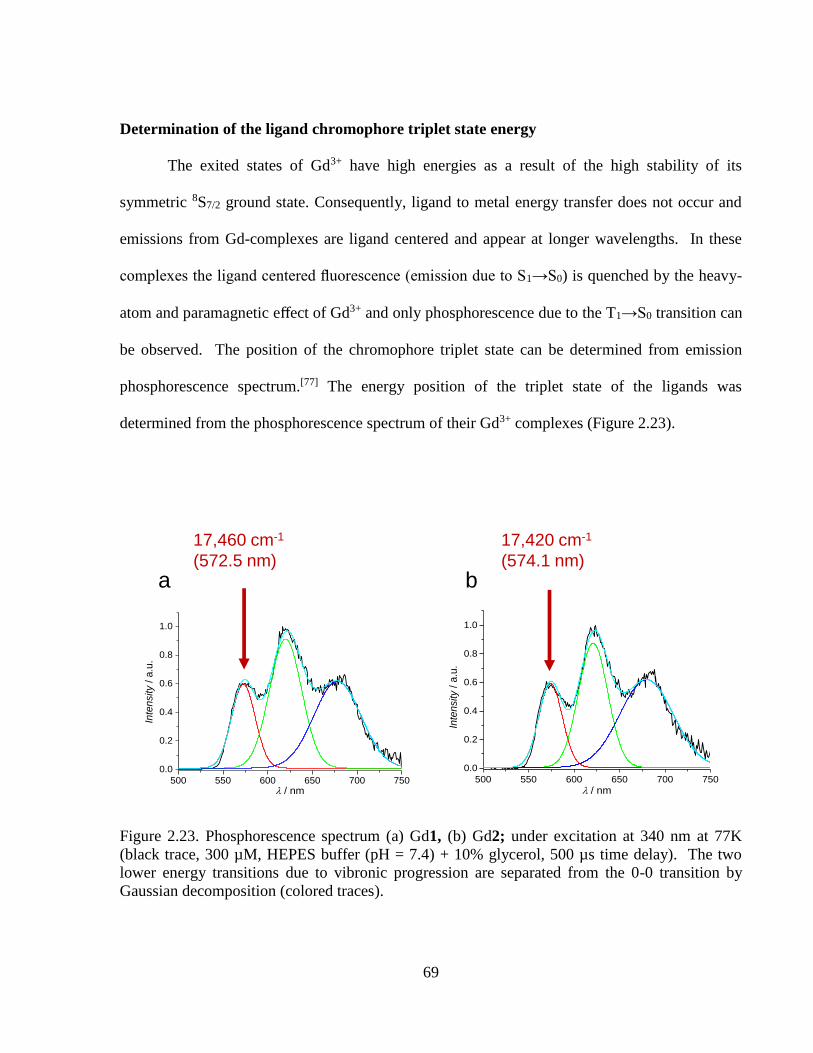
69
Determination of the ligand chromophore triplet state energy
The exited states of Gd3+ have high energies as a result of the high stability of its
symmetric 8S7/2 ground state. Consequently, ligand to metal energy transfer does not occur and
emissions from Gd-complexes are ligand centered and appear at longer wavelengths. In these
complexes the ligand centered fluorescence (emission due to S1→S0) is quenched by the heavy-
atom and paramagnetic effect of Gd3+ and only phosphorescence due to the T1→S0 transition can
be observed. The position of the chromophore triplet state can be determined from emission
phosphorescence spectrum.[77] The energy position of the triplet state of the ligands was
determined from the phosphorescence spectrum of their Gd3+ complexes (Figure 2.23).
Figure 2.23. Phosphorescence spectrum (a) Gd1, (b) Gd2; under excitation at 340 nm at 77K
(black trace, 300 µM, HEPES buffer (pH = 7.4) + 10% glycerol, 500 µs time delay). The two
lower energy transitions due to vibronic progression are separated from the 0-0 transition by
Gaussian decomposition (colored traces).
500 550 600 650 700 750
0.0
0.2
0.4
0.6
0.8
1.0
Inte
nsity / a
.u.
/ nm
17,460 cm-1
(572.5 nm)
500 550 600 650 700 750
0.0
0.2
0.4
0.6
0.8
1.0
Inte
nsity / a
.u.
/ nm
17,420 cm-1
(574.1 nm)
a b

70
The emission displayed three maxima at 572-574, 620-621 and 678-680 nm due to vibronic
progression. Gaussian decomposition of the phosphorescence spectrum allowed the
determination of the position of the triplet state as a 0-0 transition at 17,460 cm-1 (572.5 nm) and
17,420 cm-1 (574.1 nm) of Gd1 [126]and Gd2 respectively. These values are slightly higher but
still quite comparable to the reported value for tropolone, 16,800 cm-1. Therefore, the energy of
the triplet state is located higher than the corresponding emitting levels of ENd (4F3/2) = 11,460
cm-1, and EYb (2F5/2) = 10,300 cm-1, [57] which facilitates energy transfer from the ligand triplet
state to the metal. [126]
Excitation and emission spectra
The excitation spectra of Yb1, Yb2 and Nd1, Nd2 recorded upon monitoring the main transitions
at 980 and 1064 nm, respectively, displayed broad bands in the range 250-400 nm. This confirms
that the sensitization of these ions occurs through the ligand-centered levels (antenna effect).[58]
Upon excitation of the ligand-centered bands at 340 nm, the Yb3+ and Nd3+ complex exhibited
characteristic emission in the NIR arising from the 2F5/2→2F7/2 and 4F3/2 →4IJ (J = 9/2, 11/2,
13/2) transitions, respectively.[126]
250 300 350 400 450 500 550
Nd2 (D2O)
Nd2 (H2O)
Nd1 (D2O)
Inte
nsity
(a.u
.)
Wavelength (nm)
Nd1 (H2O)
850 950 1050 1150 1250 1350 1450
Wavelength (nm)
Inte
nsity
(a.u
.)
Nd1 (H2O)
Nd1 (D2O)
Nd2 (H2O)
Nd2 (D2O)
λex
= 340 nm λem
= 1064 nm
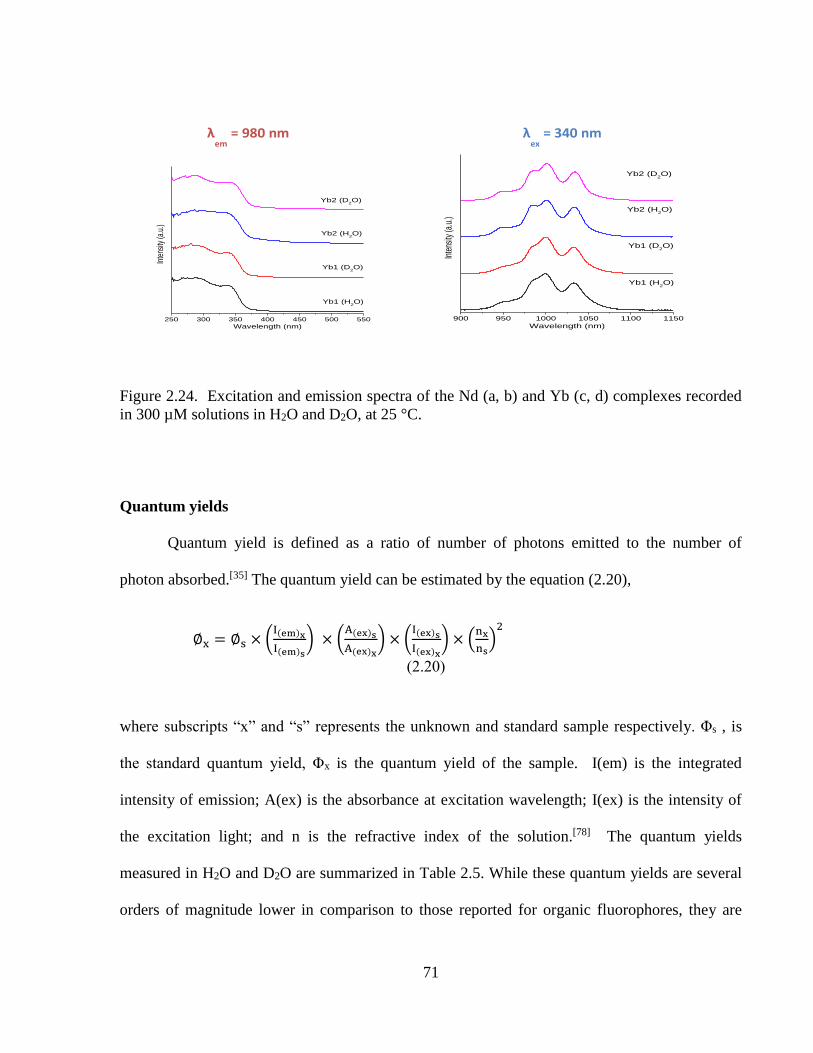
71
Figure 2.24. Excitation and emission spectra of the Nd (a, b) and Yb (c, d) complexes recorded
in 300 µM solutions in H2O and D2O, at 25 °C.
Quantum yields
Quantum yield is defined as a ratio of number of photons emitted to the number of
photon absorbed.[35] The quantum yield can be estimated by the equation (2.20),
where subscripts “x” and “s” represents the unknown and standard sample respectively. Φs , is
the standard quantum yield, Φx is the quantum yield of the sample. I(em) is the integrated
intensity of emission; A(ex) is the absorbance at excitation wavelength; I(ex) is the intensity of
the excitation light; and n is the refractive index of the solution.[78] The quantum yields
measured in H2O and D2O are summarized in Table 2.5. While these quantum yields are several
orders of magnitude lower in comparison to those reported for organic fluorophores, they are
λex
= 340 nm λem
= 980 nm
900 950 1000 1050 1100 1150
Wavelength (nm)
Inte
nsity
(a.u
.)
Yb2 (D2O)
Yb2 (H2O)
Yb1 (D2O)
Yb1 (H2O)
250 300 350 400 450 500 550
Yb2 (D2O)
Yb2 (H2O)
Yb1 (D2O)
Yb1 (H2O)
Wavelength (nm)
Inte
nsity
(a.u
.)
∅x = ∅s × (I(em)x
I(em)s
) × (A(ex)s
A(ex)x
) × (I(ex)s
I(ex)x
) × (nx
ns)
2
(2.20)

72
fairly high for hydrated lanthanide chelates. The higher quantum yield values and longer
luminescence lifetimes in D2O indicate the higher probability of non-radiative deactivation of
Ln3+ ions through overtones of O-H (3,600 cm-1) rather than O-D (2,200 cm-1) vibrations.[6]
Table 2.5. Summarized quantum yields in H2O and D2O.
Compound Solvent
Quantum yield
(%)
Lifetime q
Yb1 H2O 6.7(2)·10-3 0.864(2) µs 0.8
D2O 8.29(2)·10-2 7.75 µs
Yb2 H2O 5.9(1)·10-3 0.863(9) µs 0.8
D2O 7.6(2)·10-2 8.33(3) µs
Nd1 H2O 5.5(2)·10-3 84(2) ns 0.8
D2O 2.68(1)·10-2 342(2) ns
Nd2 H2O 6.77(2)·10-3 88(1) ns 0.8
D2O 3.16(3)·10-2 372(4) ns
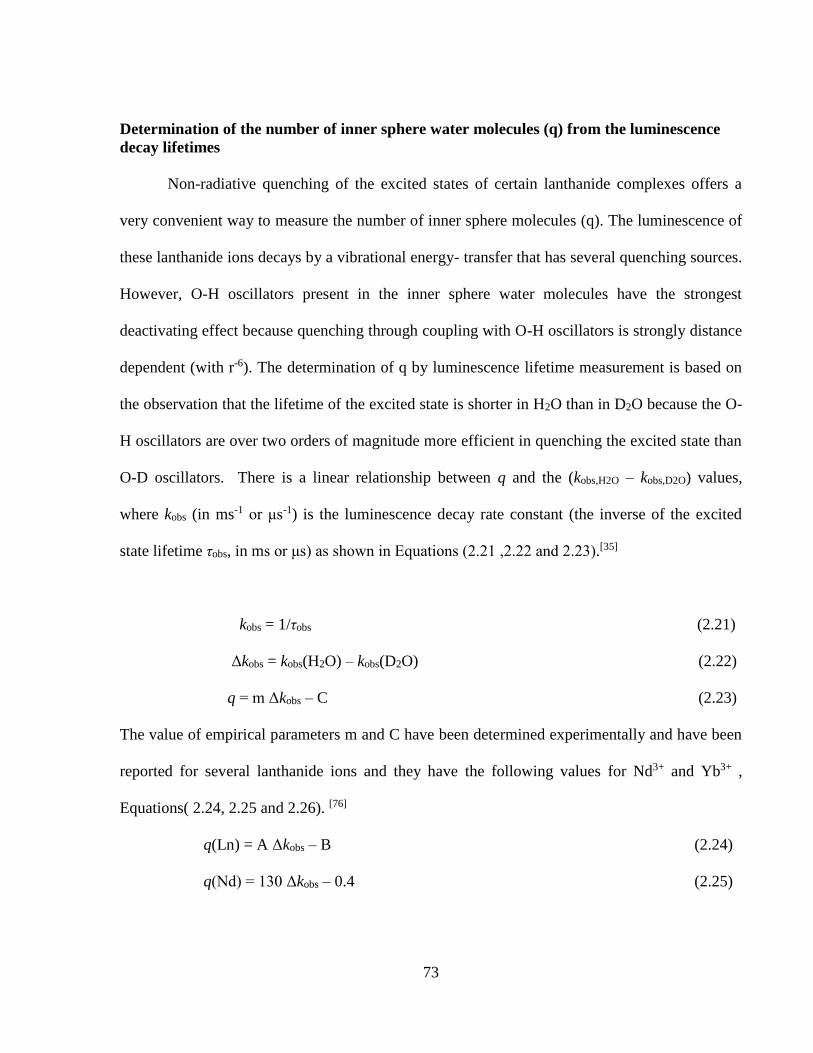
73
Determination of the number of inner sphere water molecules (q) from the luminescence
decay lifetimes
Non-radiative quenching of the excited states of certain lanthanide complexes offers a
very convenient way to measure the number of inner sphere molecules (q). The luminescence of
these lanthanide ions decays by a vibrational energy- transfer that has several quenching sources.
However, O-H oscillators present in the inner sphere water molecules have the strongest
deactivating effect because quenching through coupling with O-H oscillators is strongly distance
dependent (with r-6). The determination of q by luminescence lifetime measurement is based on
the observation that the lifetime of the excited state is shorter in H2O than in D2O because the O-
H oscillators are over two orders of magnitude more efficient in quenching the excited state than
O-D oscillators. There is a linear relationship between q and the (kobs,H2O – kobs,D2O) values,
where kobs (in ms-1 or μs-1) is the luminescence decay rate constant (the inverse of the excited
state lifetime τobs, in ms or μs) as shown in Equations (2.21 ,2.22 and 2.23).[35]
kobs = 1/τobs (2.21)
Δkobs = kobs(H2O) – kobs(D2O) (2.22)
q = m Δkobs – C (2.23)
The value of empirical parameters m and C have been determined experimentally and have been
reported for several lanthanide ions and they have the following values for Nd3+ and Yb3+ ,
Equations( 2.24, 2.25 and 2.26). [76]
q(Ln) = A Δkobs – B (2.24)
q(Nd) = 130 Δkobs – 0.4 (2.25)

74
q(Yb) = 1.0 Δkobs – 0.20 (2.26)
Where A = 130 ns for Nd3+ and 1.0 μs for Yb3+, B = 0.2 μs−1, 0.4 for Yb3+ and Nd3+ respectively;
Δkobs is given in ns−1 and μs−1. The luminescence decay over time for all studied complexes
(Nd1, Yb1, Nd2 and Yb2) (Figure 2.25) could be best fitted by monoexponential functions
reflecting the presence of only one Ln3+-containing emitting species in solutions.
Figure 2.25. Luminescence decay curves for Nd1 and Yb1 (top) and Nd2 and Yb2 (bottom) in
H2O (black) and D2O (red).
The fitting of the decay curves afforded the exponential time decay constant τobs excited state
lifetime, Equation (2.27).
𝐼𝑡 = 𝐼0exp (−𝑡/𝜏) (2.27)
log(
I)
t(µs)
t(µs)t(µs)
t(µs)
log(
I)
log(
I)lo
g(I)
0 20 40 601E-4
1E-3
0.01
0.1
1 Yb1 in H2O
Yb1 in D2O
/ µs
log (
I)
0 20 40 601E-4
1E-3
0.01
0.1
1
/ µs
log (
I)
Yb2 in H2O
Yb2 in D2O
0 1 2 3 41E-4
1E-3
0.01
0.1
1
log (
I)
/ µs
log (
I)
Nd1 in H2O
Nd1 in D2O
0 1 2 3 4
1E-4
1E-3
0.01
0.1
1 Nd2 in H
2O
Nd2 in D2O
/ µs
log (
I)
0 20 40 601E-4
1E-3
0.01
0.1
1 Yb1 in H2O
Yb1 in D2O
/ µs
log (
I)
0 20 40 601E-4
1E-3
0.01
0.1
1
/ µs
log (
I)
Yb2 in H2O
Yb2 in D2O
0 1 2 3 41E-4
1E-3
0.01
0.1
1
log (
I)
/ µs
log (
I)
Nd1 in H2O
Nd1 in D2O
0 1 2 3 4
1E-4
1E-3
0.01
0.1
1 Nd2 in H
2O
Nd2 in D2O
/ µs
log (
I)
0 20 40 601E-4
1E-3
0.01
0.1
1 Yb1 in H2O
Yb1 in D2O
/ µs
log (
I)
0 20 40 601E-4
1E-3
0.01
0.1
1
/ µs
log (
I)
Yb2 in H2O
Yb2 in D2O
0 1 2 3 41E-4
1E-3
0.01
0.1
1
log (
I)
/ µs
log (
I)
Nd1 in H2O
Nd1 in D2O
0 1 2 3 4
1E-4
1E-3
0.01
0.1
1 Nd2 in H
2O
Nd2 in D2O
/ µs
log (
I)
0 20 40 601E-4
1E-3
0.01
0.1
1 Yb1 in H2O
Yb1 in D2O
/ µs
log
(I)
0 20 40 601E-4
1E-3
0.01
0.1
1
/ µs
log
(I)
Yb2 in H2O
Yb2 in D2O
0 1 2 3 41E-4
1E-3
0.01
0.1
1
log
(I)
/ µs
log
(I)
Nd1 in H2O
Nd1 in D2O
0 1 2 3 4
1E-4
1E-3
0.01
0.1
1 Nd2 in H
2O
Nd2 in D2O
/ µs
log
(I)

75
Where 𝐼𝑡 and 𝐼0 are the emission intensity of the lanthanide at time t and zero respectively, and 𝜏
is a decay constant.
Comparison of τobs values obtained in H2O and D2O solutions and the use of the above
mentioned phenomenological equations allowed the estimation of the number of inner sphere
water molecules for all complexes. The value of q=0.8±0.2 was found for all these chelates,
which is in good agreement with the value obtained for Gd1 and Gd2 by susceptibility
measurements.
2.5 CONCLUSION
In conclusion, I have synthesized a novel DOTA based ligand with a tropone sidearm/s.
The Ln3+ complexes have one inner sphere water molecule and the Gd-complexes have nearly
the same r1 value as GdDOTA. The neutral O-donor atom of the tropone moiety slows down the
water exchange rate by a factor of 3 relative to GdDOTA. It is worth noting that the tropone
coordinating group could therefore be used to fine tune the water exchange rate of a lanthanide
complex for applications where slow water exchange is preferred (e. g. paraCEST).
Photophysical measurements revealed that the tropone unit is an efficient sensitizer for the NIR
emitting Nd3+ and Yb3+ allowing the detection of bright NIR emission in aqueous solutions. The
excitation wavelength (340 nm) is relatively long, and more suitable for in vivo applications than
most previously reported examples.[55] The favorable photophysical properties of the tropone
chromophore combined with the DOTA framework offers a suitable platform for the design of
lanthanide based bimodal MR/optical imaging agents for in vivo applications.

76
CHAPTER 3
HYPERPOLARIZED 13C-LABELED OXALOACETATE DERIVATIVES AS
POTENTIAL MR PROBE FOR METABOLISM
3.1 INTRODUCTION
As discussed in Chapter 1, dramatic increases in nuclear magnetic resonance (NMR)
sensitivity can be achieved by increasing the nuclear spin polarization. Hyperpolarization
generally refers to methods that aim at enhancing nuclear polarization. Several experimental
techniques have been proposed to increase the nuclear spin polarization and enhance NMR
signal. [79] These include the brute force method, optical pumping, parahydrogen induced
polarization and dynamic nuclear polarization. The brute force method is a direct approach and
is based on the fact that the thermal equilibrium polarization increases with decreasing
temperature and increasing external magnetic field (Equation 1.6). This is, however, impractical
as the sample has to be kept at temperatures below 4K in very strong magnetic fields for an
extended period of time. Optical pumping is limited to the hyperpolarization of some inert gas
nuclei such as 3He and 129Xe, which are then used for lung imaging. Parahydrogen induced
polarization (PHIP) involves the addition of para-H2 to an unsaturated organic molecule using a
catalyst and converting the spin order of the parahydrogen molecule into 1H nuclear polarization
followed by the transfer of polarization from 1H to 13C nuclei present in the substrate. The
applicability of PHIP is limited by the specific chemistry involving the addition of H2 to
unsaturated compounds. On the other hand, dynamic nuclear polarization (DNP) is quite general
and can be applied for any magnetically active nuclei provided that they have sufficiently long
longitudinal (spin lattice) relaxation time. DNP is a phenomenon based on transferring electron

77
polarization to nuclei via microwave irradiation of the electron spins, which results in
dramatically enhanced NMR signal. In 1953, Albert Overhauser was the first one who predicted
the effect in metals by the saturation of electron spin resonance (ESR) line of conducting
electrons .[80] The Overhauser effect was experimentally verified by Carver and Slichter in 1956.
[81] Soon after that, DNP effect in non-conducting materials at low temperature was proposed by
Jeffries and Abragam, Proctor and Goldman in the 1960s and 1970s described DNP via thermal
mixing.[82,83] In 2003, Goldman and Ardenkjaer–Larsen demonstrated that compounds
hyperpolarized in the solid state could be dissolved and transferred into an NMR magnet for
spectrum acquisition with negligible loss of polarization. This new technique, known as liquid
state DNP NMR, offers dramatically enhanced signal gains for 13C and 15N nuclei and over
10,000-fold increases in signal to noise ratio have been reported for certain compounds. This
novel technique, known as dissolution DNP-NMR, enabled the application of hyperpolarized
compounds in biomedical MRI. In dissolution DNP, the transfer of high electron polarization of
nuclear spins occur at low temperature, around 1 K in a relatively strong magnetic field (3.4 T or
higher). The DNP sample must be in amorphous, isotropic glass, because anisotropy destroys
the electron–nuclear spin coupling in the sample that is required for DNP. Experimentally, DNP
is performed by microwave irradiation of a sample doped with a small amount of paramagnetic
species such as stable organic free radicals or transition metal ions as free electron source. The
optimal microwave frequency is near the electron paramagnetic resonance (EPR) of the
paramagnetic species and depends on the mechanism involved in the polarization transfer. The
glassing matrix is usually a mixture of glycerol or dimethyl sulfoxide (DMSO) with water.[84]

78
Figure 3.1. Paramagnetic species used as DNP polarizing agents. Ref. 84, 85.
3.1.1 The mechanism of dynamic nuclear polarization (DNP)
Dynamic nuclear polarization (DNP) refers to the transfer of electron spin polarization to
nuclear spins. At low temperatures (around 1K) in moderately strong magnetic fields (3T),
nuclear spin polarization is still negligible while the electron spins are highly polarized due to the
higher gyromagnetic ratio of the electron. Microwave irradiation of samples containing trace
amounts of paramagnetic species (organic free radicals or paramagnetic metal complexes) near
the electron resonance frequency transfers the polarization from the electrons to coupled nuclear
spins in the solid state. Since the spin lattice relaxation of the electron is much faster than that of
the nuclei, under DNP conditions a single electron can polarize several nuclei. The transfer of
polarization can occur by different mechanisms depending on the temperature and ESR
properties of the free radical. Very briefly, the solid effect involves one electron and one nuclear
spin and arises from the microwave excitation of the forbidden transitions involving both spins
S
SS
S
COOH
R
RR
R
SS
S
S
HOOC
RR
RR
SS
S
S
COOH
RR
RR
R = CH3 Finland, R = CH2CH2OH, OX063
1,3-bisdiphenylene-2-phenylallyl (BDPA)

79
simultaneously.[86] Since the transitions are forbidden, the solid effect has a strong dependence
upon the incident power of the microwave source.
Thermal mixing [87] is an energy exchange process between the electron Zeeman, the electron
dipole-dipole and the nuclear Zeeman reservoirs.[88,89] At thermal equilibrium, the spin
temperature of the electron dipole-dipole (TSS), the electron (TEZ) and the nuclear Zeeman (TNZ)
reservoirs is equal to the lattice temperature. [90] Off center irradiation on the side of the ESR line
drives the electron dipole-dipole transitions and cools the electron dipole-dipole reservoir
relative to the lattice, resulting in a highly polarized electron reservoir. When the ESR linewidth
is comparable to the nuclear Larmor frequency, the electron dipole-dipole reservoir is thermally
coupled to the nuclear Zeeman reservoir, and energy transfer occurs between them. As a result,
the spin temperature of the nuclear Zeeman reservoir (TNZ) will be equal with TSS, leading to
enhanced nuclear spin polarization. This process depends upon the allowed electron-electron
dipolar flip-flops, and can therefore be of very high efficiency at higher magnetic fields where
the solid effect begins to fail. Maximum positive and negative enhancements are achieved at ωe ±
ω1/2 where ω1/2 is the ESR linewidth.
The cross effect involves two coupled unpaired electrons with different EPR frequency (ωe1 and
ωe2, respectively) for which ωe2-ωe1 = ωn holds.[22,91] When the microwave radiation flips the
electron spin at ωe1 that is coupled to the other electron at ωe2 a nuclear spin flip takes place
simultaneously with the spin flip of the second electron. The matching frequency difference can
be achieved through random orientation of spin packets of the same free radical with
inhomogenously broadened EPR line or with two different radicals that satisfy the matching
frequency difference requirement.
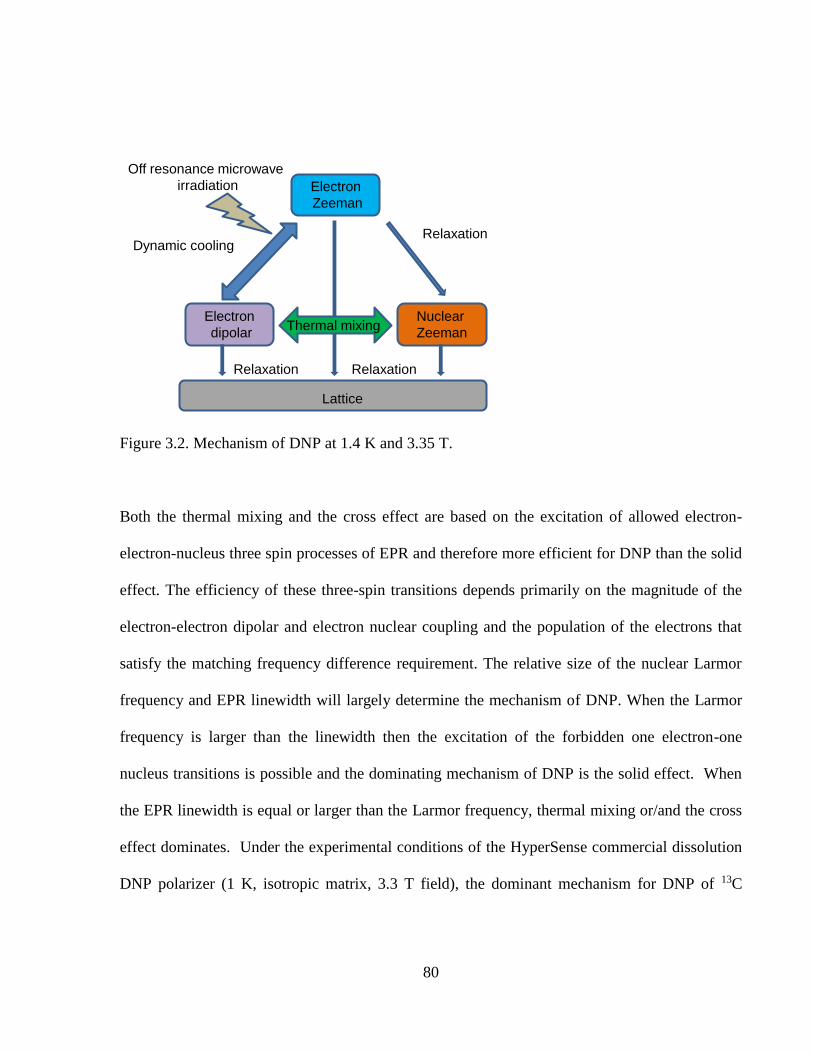
80
Figure 3.2. Mechanism of DNP at 1.4 K and 3.35 T.
Both the thermal mixing and the cross effect are based on the excitation of allowed electron-
electron-nucleus three spin processes of EPR and therefore more efficient for DNP than the solid
effect. The efficiency of these three-spin transitions depends primarily on the magnitude of the
electron-electron dipolar and electron nuclear coupling and the population of the electrons that
satisfy the matching frequency difference requirement. The relative size of the nuclear Larmor
frequency and EPR linewidth will largely determine the mechanism of DNP. When the Larmor
frequency is larger than the linewidth then the excitation of the forbidden one electron-one
nucleus transitions is possible and the dominating mechanism of DNP is the solid effect. When
the EPR linewidth is equal or larger than the Larmor frequency, thermal mixing or/and the cross
effect dominates. Under the experimental conditions of the HyperSense commercial dissolution
DNP polarizer (1 K, isotropic matrix, 3.3 T field), the dominant mechanism for DNP of 13C
Electron
Zeeman
Electron
dipolar
Nuclear
Zeeman
Lattice
Thermal mixing
Off resonance microwave
irradiation
Relaxation Relaxation
RelaxationDynamic cooling

81
nuclei is hermal mixing when carbon centered organic free radicals are used as polarizing
agents.[22]
Figure 3.3. Commercially available HyperSense DNP polarizer at UTSW.
3.1.2 The effect of nuclear spin-lattice (T1) relaxation on polarization
The built up polarization of 13C nuclei will decay according to the T1 value of the
nucleus. Under DNP conditions (at temperatures less than 4K) the T1 relaxation times of 13C
nuclei are extremely long, on the order of 10,000 s or more. The free radical concentration has a
significant effect on the T1, as it has been shown that the T1 value of 13C labeled urea is 28,200 s
and 15,800 s the presence of 15mmol/l and 20 mmol/l of trityl radical, respectively. [85] In
solution at ambient temperature, the 13C T1 values in small organic compounds range from a few
seconds to ~1 minute and one can anticipate having a detectable 13C signal for ~5T1 or a
maximum of 5 minutes. The structural position of the 13C label and the molecular weight will

82
largely determine the relaxation rate of the 13C nucleus. Dipolar relaxation through attached
protons provides a very efficient pathway for relaxation. [85]
3.1.3 The dependence of polarization build-up on microwave frequency, power,
temperature and free radical concentration
As already discussed, the optimal microwave irradiation frequency depends on the
mechanism of DNP process. Generally, for 13C enriched compounds, the enhancement curves
and optimal frequencies for the maximum positive and negative enhancement indicate that the
dominating mechanism for 13C DNP is thermal mixing when trityl radicals are used. It has been
shown that the 13C saturation polarization increases with increasing microwave power until
60mW and then reaches a plateau and higher power has no effect on the final polarization
enhancement. As expected, temperature has a very profound effect on both the saturation
polarization and rate of polarization build-up. A decrease from 4K to 1.4K results in an almost
fourfold increase in polarization. At a given temperature, higher radical concentration results in
a faster buildup rate but a lower final polarization enhancement probably due to the relaxation
effect of the paramagnetic radical.
3.1.4 The HyperSense DNP polarizer
The DNP polarizer is a modified high resolution, narrow bore 7T magnet charged to
3.35T and integrated with a variable temperature insert (VTI) and a microwave source (200mW
maximum power at 94GHz with a tuning range of 500MHz and a frequency modulation
bandwidth of 10kHz). The sample is cooled to 1.2K in a pumped helium bath and the
microwave irradiation is turned on. When the desired polarization is reached, the irradiation is

83
turned off and hot water or methanol is injected into the sample holder and the solution is
transferred into the bore of a 51 mm vertical bore 400 MHz NMR spectrometer for spectrum
acquisition with negligible loss of polarization. Detailed descriptions of the HyperSense DNP
polarizer and similar instruments have been published.[102]
Figure 3.4. The structure of dissolution DNP polarizers.
The sample preparation requires special attention. Both the substrate molecule and the free
radical must be soluble in the glassing agent. The sample is dissolved in a solvent that acts as a
glassing agent, doped with the free radical to a final concentration between 10 and 40 mM
depending on the radical. About 50 to 150 μL aliqot of the sample is then placed into the
hyperpolarizer at temperature about 1.4 K and irradiated with microwaves (100 mV) at a
frequency near the ESR frequency (94.17 GHz at 3.35 T) of the radical.[85] After 2 hours of
superheatededsolvent
microwave sourceand waveguide
cryostat
sample cup
to NMR/MRI
NMR coil
to vacuum pump
wide bore superconducting magnet
dissolution/transfer line
insert
liquid He

84
polarizing time, 4 mL of superheated water is injected into the sample holder and 4 mL of
solution is transferred into a 10 mm NMR tube in a high resolution magnet via a Teflon tube
with a transfer time ttr of 8 s for 1 H and NMR spectra acquisition. The most commonly used
glassing matrix is glycerol/water mixture, although other glassing agents such as DMSO/water
can also be used. The glassing matrix has a strong influence on the DNP because efficient
polarization transfer requires isotropic glass matrix, in which both the substrate and the free
radical polarizing agent should be completely soluble. [85]
Figure 3.5. DNP spectra of different radicals recorded in the HyperSense polarizer (40mL
aliquots of 1:1 [1-13C] pyruvic acid: sulfolane glass doped with different radicals. DNP
conditions: 3.35 T, 1.4 K, 100 mW microwave source. Note that for TEMPO, only the positive
enhancement peak could be observed due to its wide ESR line. Reprinted with permission from
Ref.85.
The optimal microwave frequency is determined for each radical by using the built in solid state
NMR spectrometer of the HyperSense hyperpolarizer. This measures the solid state 13C
polarization of a 13C enriched sample in the frequency range of 93.90-94.10 GHz in steps of 5
MHz (“microwave sweep). The nuclear polarization after sample dissolution and transfer is
estimated from the integral of the obtained liquid state NMR signal by comparing it to the
1.0
0.5
0.0
-0.5
-1.0
13C
NM
R I
nte
nsity (
a.u
.)
94.2594.2094.1594.1094.0594.0093.95
Microwave Frequency (GHz)
40 mM BDPA 15 mM trityl OX063 40 mM TEMPO
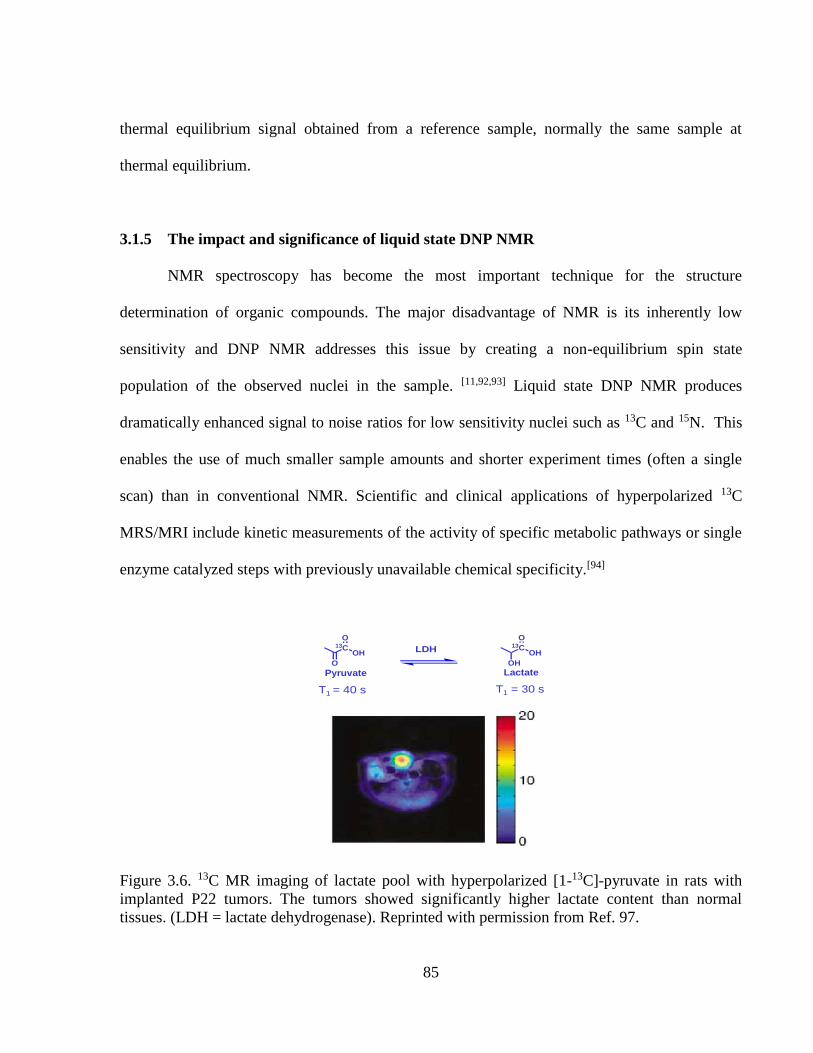
85
thermal equilibrium signal obtained from a reference sample, normally the same sample at
thermal equilibrium.
3.1.5 The impact and significance of liquid state DNP NMR
NMR spectroscopy has become the most important technique for the structure
determination of organic compounds. The major disadvantage of NMR is its inherently low
sensitivity and DNP NMR addresses this issue by creating a non-equilibrium spin state
population of the observed nuclei in the sample. [11,92,93] Liquid state DNP NMR produces
dramatically enhanced signal to noise ratios for low sensitivity nuclei such as 13C and 15N. This
enables the use of much smaller sample amounts and shorter experiment times (often a single
scan) than in conventional NMR. Scientific and clinical applications of hyperpolarized 13C
MRS/MRI include kinetic measurements of the activity of specific metabolic pathways or single
enzyme catalyzed steps with previously unavailable chemical specificity.[94]
Figure 3.6. 13C MR imaging of lactate pool with hyperpolarized [1-13C]-pyruvate in rats with
implanted P22 tumors. The tumors showed significantly higher lactate content than normal
tissues. (LDH = lactate dehydrogenase). Reprinted with permission from Ref. 97.
LDH
T1 = 40 s T1 = 30 s
13COH
O
O
Pyruvate
13COH
O
OH
Lactate
86
Metabolic imaging with hyperpolarized nuclei has been applied to the detection of the
distribution of a labeled substrate and all metabolites derived from this substrate. [10,95] A number
of hyperpolarized 13C labeled compounds have been tested in animals. Among these, [1-13C]
pyruvate is by far the most important, largely due to its central metabolic role and sufficiently
long T1 relaxation time of both the C1 and C2 carbons. [96] Hyperpolarized [1-13C]-pyruvate has
been used to highlight elevated lactate production in tumors because pyruvate rapidly exchanges
into the lactate pool.[98] Hyperpolarized [1-13C]-pyruvate is currently being tested in human
patients for the detection of prostate cancer.[99]
Figure 3.7. Measuring mitochondrial pyruvate dehydrogenase (PDH) activity in heart muscle
using hyperpolarized (HP) [1-13C]-pyruvate. Flux though the PDH catalyzed step was calculated
from the magnetization decay curves at 14.1 T. The production HP-[13C] bicarbonate from HP
pyruvate is visualized by the 13C MR images recorded in vivo. The imaging experiments were
performed at 1.5 T using a 13C chemical shift imaging sequence. Reprinted with permission from
Ref. 100.
time (s)
Decay of hyperpolarized 13C magnetization
13C chemical shift imaging of HP-[13C]bicarbonate
production in porcine heart muscle
13C NMR spectrum of an isolated rat heart
perfused with 2 mM HP [1-13C]-pyruvate
pyruvate
bicarbonate
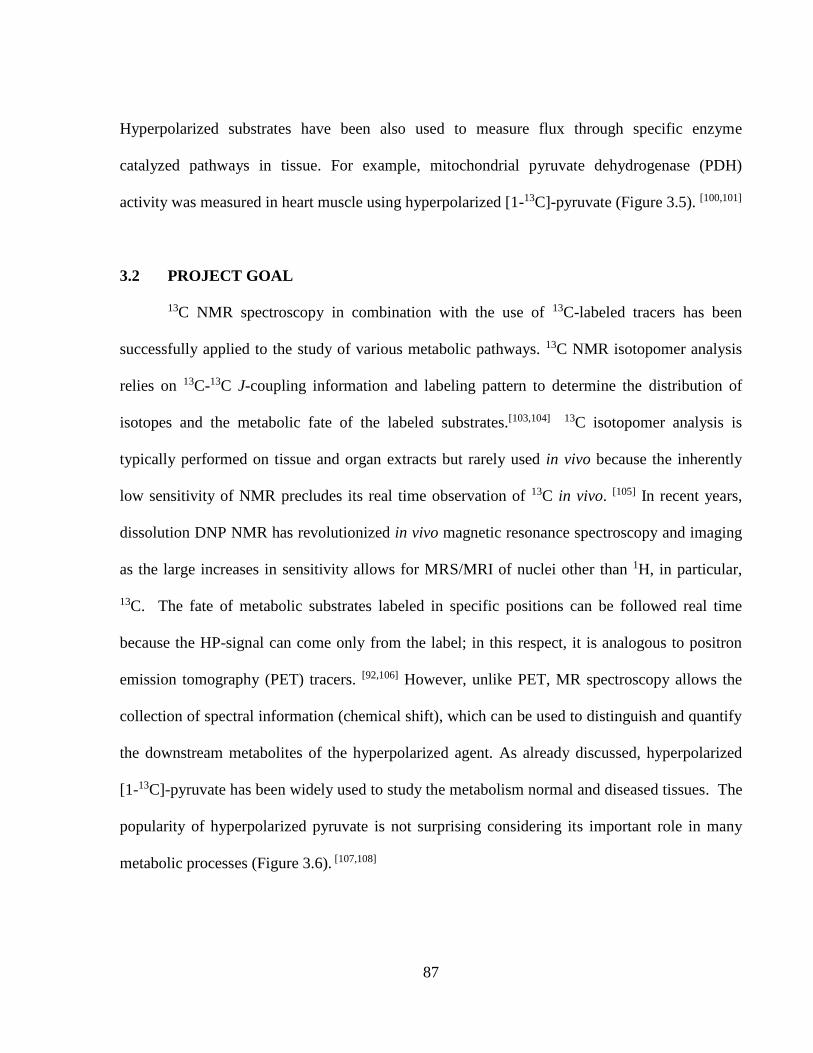
87
Hyperpolarized substrates have been also used to measure flux through specific enzyme
catalyzed pathways in tissue. For example, mitochondrial pyruvate dehydrogenase (PDH)
activity was measured in heart muscle using hyperpolarized [1-13C]-pyruvate (Figure 3.5). [100,101]
3.2 PROJECT GOAL
13C NMR spectroscopy in combination with the use of 13C-labeled tracers has been
successfully applied to the study of various metabolic pathways. 13C NMR isotopomer analysis
relies on 13C-13C J-coupling information and labeling pattern to determine the distribution of
isotopes and the metabolic fate of the labeled substrates.[103,104] 13C isotopomer analysis is
typically performed on tissue and organ extracts but rarely used in vivo because the inherently
low sensitivity of NMR precludes its real time observation of 13C in vivo. [105] In recent years,
dissolution DNP NMR has revolutionized in vivo magnetic resonance spectroscopy and imaging
as the large increases in sensitivity allows for MRS/MRI of nuclei other than 1H, in particular,
13C. The fate of metabolic substrates labeled in specific positions can be followed real time
because the HP-signal can come only from the label; in this respect, it is analogous to positron
emission tomography (PET) tracers. [92,106] However, unlike PET, MR spectroscopy allows the
collection of spectral information (chemical shift), which can be used to distinguish and quantify
the downstream metabolites of the hyperpolarized agent. As already discussed, hyperpolarized
[1-13C]-pyruvate has been widely used to study the metabolism normal and diseased tissues. The
popularity of hyperpolarized pyruvate is not surprising considering its important role in many
metabolic processes (Figure 3.6). [107,108]

88
Figure 3.8. Pyruvate is involved in several important metabolic processes.
However, pyruvate is not the only metabolic intermediate that could provide useful information
about important biochemical processes. These include other tricarboxylic acid (TCA) cycle
intermediates such as citrate, succinate, malate and oxaloacetate. This last compound is
particularly interesting because it is involved in not only the TCA cycle but also
gluconeogenesis, lipogenesis and amino acid synthesis. [109]
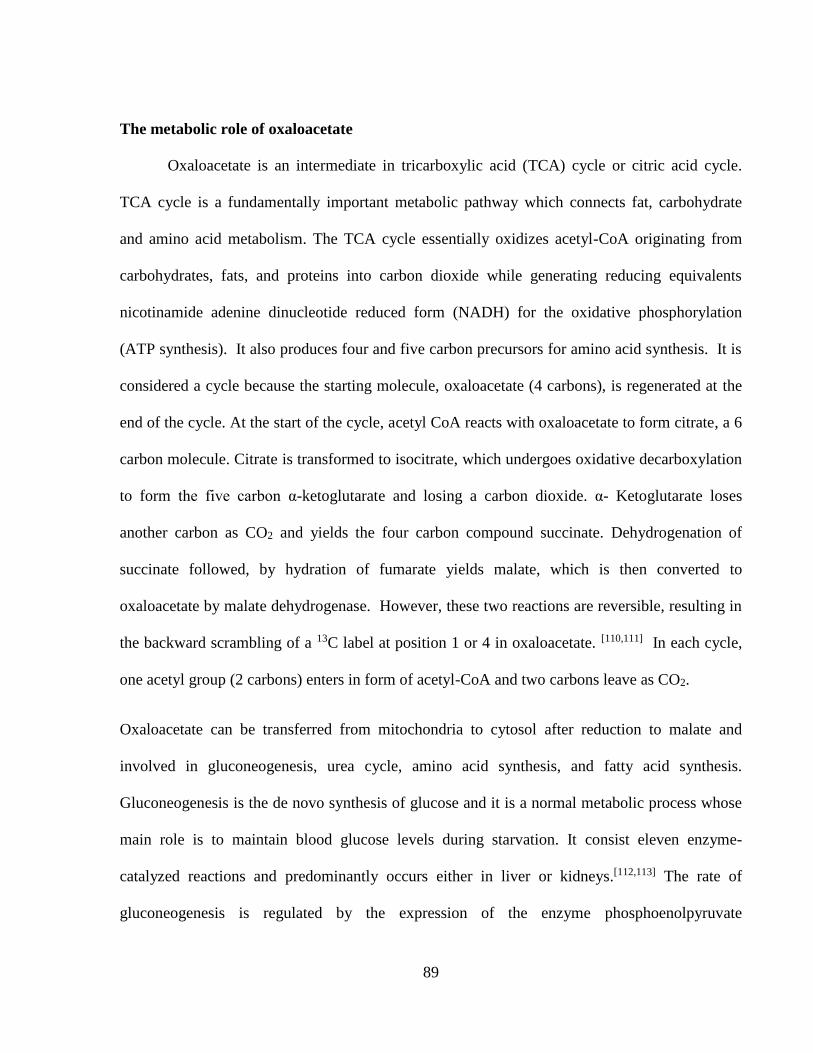
89
The metabolic role of oxaloacetate
Oxaloacetate is an intermediate in tricarboxylic acid (TCA) cycle or citric acid cycle.
TCA cycle is a fundamentally important metabolic pathway which connects fat, carbohydrate
and amino acid metabolism. The TCA cycle essentially oxidizes acetyl-CoA originating from
carbohydrates, fats, and proteins into carbon dioxide while generating reducing equivalents
nicotinamide adenine dinucleotide reduced form (NADH) for the oxidative phosphorylation
(ATP synthesis). It also produces four and five carbon precursors for amino acid synthesis. It is
considered a cycle because the starting molecule, oxaloacetate (4 carbons), is regenerated at the
end of the cycle. At the start of the cycle, acetyl CoA reacts with oxaloacetate to form citrate, a 6
carbon molecule. Citrate is transformed to isocitrate, which undergoes oxidative decarboxylation
to form the five carbon α-ketoglutarate and losing a carbon dioxide. α- Ketoglutarate loses
another carbon as CO2 and yields the four carbon compound succinate. Dehydrogenation of
succinate followed, by hydration of fumarate yields malate, which is then converted to
oxaloacetate by malate dehydrogenase. However, these two reactions are reversible, resulting in
the backward scrambling of a 13C label at position 1 or 4 in oxaloacetate. [110,111] In each cycle,
one acetyl group (2 carbons) enters in form of acetyl-CoA and two carbons leave as CO2.
Oxaloacetate can be transferred from mitochondria to cytosol after reduction to malate and
involved in gluconeogenesis, urea cycle, amino acid synthesis, and fatty acid synthesis.
Gluconeogenesis is the de novo synthesis of glucose and it is a normal metabolic process whose
main role is to maintain blood glucose levels during starvation. It consist eleven enzyme-
catalyzed reactions and predominantly occurs either in liver or kidneys.[112,113] The rate of
gluconeogenesis is regulated by the expression of the enzyme phosphoenolpyruvate

90
carboxykinase (PEPCK), which is in turn influenced by insulin levels. However, compromised
regulatory mechanisms of gluconeogenesis in type 2 diabetes results in the production of excess
glucose and elevated blood sugar levels.[114] Phosphoenolpyruvate kinase (PEPCK) catalyzes the
rate determining step of gluconeogenesis, namely, the decarboxylation and phosphorylation of
oxaloacetate to form phosphoenolpyruvate (PEP).[108,115] Therefore, 13C labeled oxaloacetate
could potentially be used for measuring PEPCK activity. For example, the action of PEPCK on
hyperpolarized oxaloacetate labeled with 13C in position C4 would produce hyperpolarized
CO2/bicarbonate and therefore, would reflect metabolic flux through this enzyme.
Hyperpolarized CO2/bicarbonate easily detected at 125 and 160 ppm, respectively.
Oxaloacetate is di-anion and generally, cannot cross the cell membrane although mammalian
Na+/dicarboxylate co-transporters have been identified in the kidney.[116] Monocarboxylic acids
on the other hand, are rapidly transported by plasma membrane monocarboxylate transporters
(MCTs). MCTs can transport a wide variety of monocarboxylates including derivatives with oxo
and hydroxyl substituents on the C2 and C3 carbon. [117,118] We therefore, assumed that the
monoester of oxaloacetate, specifically, the oxaloacetic acid-1-monoethyl ester, will be
transported by MCTs. [119,120] We also assumed that the hydrolysis of the ester group will occur
rapidly because it has already been demonstrated that carboxylesterases present in liver cells can
hydrolyse ethyl esters of small carboxylic acids such as diethyl succinate and ethyl acetoacetate
without significant loss of 13C spin polarization. [121,122] Thus, the goal of this study was to
determine whether it is feasible to use hyperpolarized 13C labeled oxaloacetic acid derivatives as
metabolic probes.
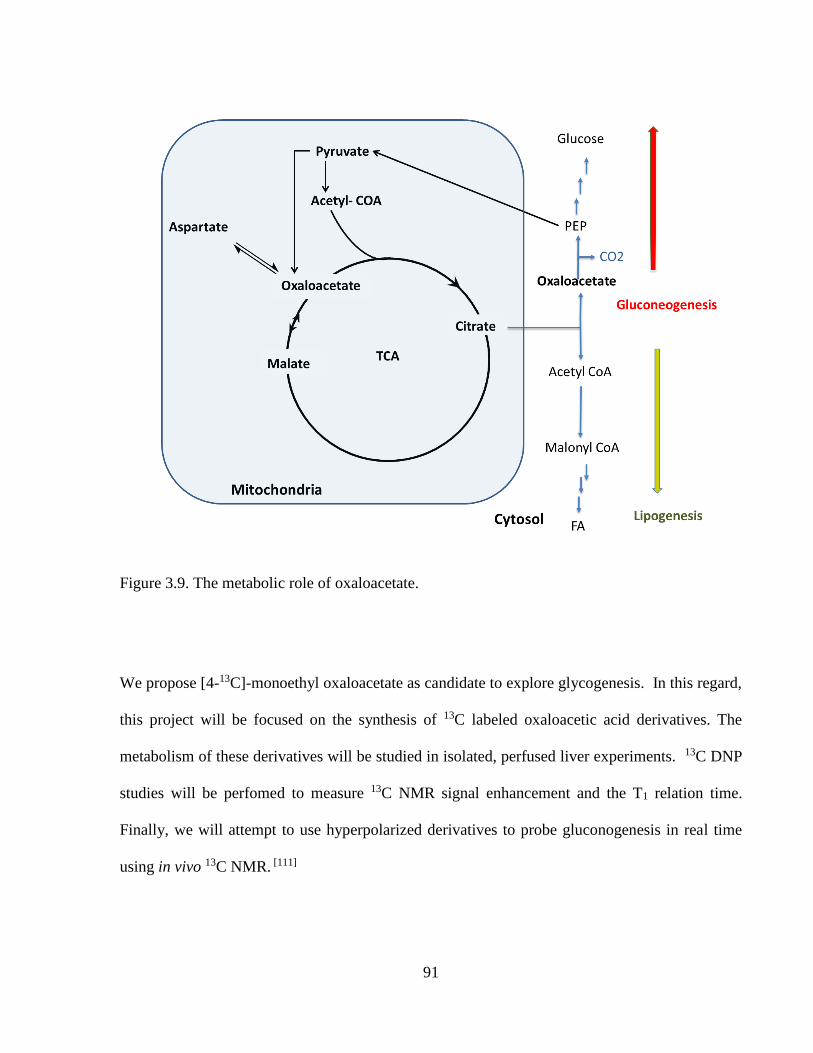
91
Figure 3.9. The metabolic role of oxaloacetate.
We propose [4-13C]-monoethyl oxaloacetate as candidate to explore glycogenesis. In this regard,
this project will be focused on the synthesis of 13C labeled oxaloacetic acid derivatives. The
metabolism of these derivatives will be studied in isolated, perfused liver experiments. 13C DNP
studies will be perfomed to measure 13C NMR signal enhancement and the T1 relation time.
Finally, we will attempt to use hyperpolarized derivatives to probe gluconogenesis in real time
using in vivo 13C NMR. [111]

92
3.3 EXPERIMETAL
3.3.1 Synthesis
General Remarks. All solvents were obtained from commercial sources and were used without
further purification. The free radical, (trityl OX063) was obtained from Oxford Instruments
Molecular Biotools. The DNP was performed using an Oxford HyperSense commercial
polarizer. 1H NMR spectra were recorded using a Varian 9.4T NMR system.
[4-13C]-diethyl oxaloacetate sodium salt (1a). This compound was prepared following a
literature procedure. [128] To 21% solution of sodium ethoxide in ethanol (3.2 mL), a mixture of
of diethyl oxalate (3.2 g) and ethyl [1-13C]-acetate (1.8 g) was added dropwise over a period of
25 minutes in an ice bath. The mixture was stirred for 2 h. The mixture was allowed to warm up
to room temperature while stirred for another hour. Then the mixture was heated to 85 ºC for 3
hours. The reaction mixture was allowed to cool to room temperature and stirred for an
additional 14 h. The product separated as a yellowish precipitate. It was taken up with ethanol,
filtered, washed with ethanol and ether several times and dried to a constant mass in vacuum to
give the product as a white solid (2.3 g, 53%).
[4-13C]-monoethyl oxaloacetate disodium salt (1). This compound was prepared following a
literature procedure. [124] To the solution of 200 mg sodium hydroxide in absolute ethanol (20
mL) and water (4 mL), 1.0 g of 1a was added to form a clear solution. The mixture was stirred
overnight, over which period the product precipitated as a white solid. The product was filtered
and washed with ethanol and ether several times. The solvents were removed in vacuum to give
the product as a white solid (550 mg, 64%)

93
Hyperpolarization of [4-13C]-monoethyl oxaloacetate disodium salt
[4-13C]-Monoethyl oxaloacetate disodium salt was dissolved in a solvent mixture that acts as a
glassing matrix (approximately 1M concentration in 1:1 glycerol-water) and doped with the trityl
radical OX063 (15 mM). The sample (150 μL) was placed into the HyperSense polarizer
operating at 1.4 K then irradiated with microwaves (100 mV) at a frequency near the ESR
frequency (94.17 GHz at 3.35 T) of the radical. After 2 hours of polarizing time, 4 mL of
superheated water was injected into the sample holder and the solution was transferred into a 10
mm NMR tube in a 9.4 T high resolution magnet via a Teflon tube. The concentration after
dissolution was approximately 2mM. 13C NMR spectra were recorded at 9.4 T.
3.3.2 Data analyses
The NMR data were acquired using a Varian VNMR spectrometer, and the spectra were
processed using ACDLABS version 12 software (Advanced Chemistry Development, Inc.,
Toronto, Canada). 13C spectra were collected using a non-selective 5 degree excitation with a
repetition time of 5 s and a total of 21 spectra were collected (n = 1). In liver perfusion
experiments the C3 lactate peak was used as reference. The graphs, fits, and data analyses were
done using Graph pad prism 7.01. T1 values were calculated by fitting NMR signal intensity as a
function of time in Equation (3.1). [127]
𝑀𝑧 (𝑡) = 𝑀0 sin 𝜃 (𝑐𝑜𝑠 𝜃)𝑡
𝑇𝑅⁄ 𝑒
−𝑡𝑇1
⁄ (3.1)
Where Mz is the magnetization of the hyperpolarized species along z axis as function of time ,
M0 initial magnetization, T1 relaxation time, θ is the flip angle and TR the repetition time.

94
3.3.3 Liver perfusion
This protocol for liver perfusion is used at the Advanced Imaging Research Center of UT
Southwestern. The animal protocol was approved by the Institutional Animal Care and Use
Committee of UT Southwestern Medical Center. Female C57Bl/6 mice obtained from Charles
River Laboratories were housed in the university vivarium on a 12 h light–dark cycle and had
free access to standard lab chow and water. Mice (35-36g) were fasted overnight with free access
to drinking water before the experiments. Following general anesthesia using isoflurane, the
livers of adult mice were rapidly cannulated then excised. The liver was perfused through the
portal vein with a modified Krebs-Henseleit (KH) buffered medium while suspended in the
effluent at 37 °C and the perfusion was carried out at a constant flow rate of 5 mL/min. The
perfusion medium was temperature regulated with a water jacket. Efferent and afferent pO2 were
measured with a blood gas analyzer (Instrumentation Laboratory, Lexington, MA, U.S.A.).
Livers were rejected if they did not maintain a pO2 gradient of at least 100 mmHg or if the tissue
color changed during the study. The perfusion medium consisted of 118 mM NaCl, 5 mM KCl,
1.2 mM MgSO4, 1.25 mM CaCl2, 25 mM NaHCO3, 1.2 mM KH2PO4 and 0.2 mM octanoate.
Isolated liver perfusion
Livers were supplied with a mixture of 2 mM [4-13C]-monoethyl oxaloacetate and
perfusion medium. Livers were perfused for ~30 min in a perfusion column height of 15 cm H2O
at constant flow rate of 5 mL/min. Under these conditions, livers reach steady-state 13C
enrichment after ~ 30 min (Hausler et al. 2006). Effluent medium was collected every 15 min to

95
measure O2 consumption. Livers were freeze-clamped and stored at −80 °C immediately after
the NMR is done for extraction.
Liver perfusion with hyperpolarized agent
[4-13C]-monoethyl oxaloacetate was polarized as described. The sample was dissolved
with a superheated of KH buffer solution. After dissolution, 3 mL of the resulting solution was
mixed into 20 mL of the perfusate containing the same perfusion medium (118 mM NaCl, 5 mM
KCl, 1.2 mM MgSO4, and 1.25 mM CaCl2, 25 mM NaHCO3, 1.2 mM KH2PO4 and 0.2 mM
octanoate) and pH was adjusted to 7.4. The liver was placed in a 25 mm NMR tube and
positioned in an 89 mm bore 9.4 T magnet (Agilent) equipped with a Doty 1H/13 C probe.
Shimming was performed on the 23Na signal. Broadband 1H decoupling using WALTZ-16 was
gated on during acquisition only. To facilitate shimming, a sodium-free perfusion medium was
pumped through a separate line to the bottom of the NMR tube at a rate of ~5 mL/min. This flush
served two purposes: (1) to remove extracellular sodium from the active volume of the probe to
facilitate shimming and (2) to remove any metabolites excreted by the perfused liver. The HP 13C
NMR signal was collected using a series of 5° 13C pulses with an acquisition time of 1s and 1s
interpulse delay. The ~ 23 mL of HP material, as described, was injected by catheter into the
medium directly above the cannulated liver at a rate of ~ 5 mL/min. After the injection the liver
was perfuse additionally for 15min to reach to steady state. The medium was not recirculated.
Livers were freeze-clamped and stored at −80 °C immediately after the NMR is done for further
processing.[107,123]

96
3.3.4 Perchloric acid (PCA) extraction
Mortar and pestle was placed in a PVC bucket and cooled by liquid nitrogen (LN2), and
then frozen tissue was weighed and placed into LN2. Pulverize tissue into a fine powder in the
presence of LN2. A Bunsen burner was used to heat a 10 ml glass beaker to remove all moisture.
The hot beaker was weighed and cooled down to the room temperature and placed in LN2 along
with the scoop end of a steel spatula. The LN2-cooled 10-mL beaker was placed on the balance
and the balance was covered to keep the balance cool. The LN2-cooled spatula was used to
transfer ~ 100 mg of pulverized tissue into the cold beaker. Transferred tissue should not have
LN2 present. The 10-mL beaker was removed from the balance and placed in a 70 °C oven for 24
hrs. After 24 hrs, the warm 10-mL beaker was weighed by the same balance at room
temperature. Difference in pre-dried vs dried tissue weight is the amount of moisture lost from
tissue. Perchloric acid (PCA) solution (6%) was transferred into a 15 ml centrifuge tube and kept
in ice to cool down. Volume transferred should be equal to 4 × the frozen weight of the tissue. A
mortar was removed from bucket and after checking that all LN2 has evaporated, tissue was
transferred into 15-mL centrifuge tube. A steel spatula was used to remove all tissue from
mortar. The tube was capped and the tissue was mixed into the acid solution, uncapping
periodically to allow any residual N2 (g) to escape. Once mixed thoroughly, the centrifuge tube
was placed in an ultra-centrifuge cooled to 2 °C for 15 min @ 13500 rpm. The supernatant was
transferred to an ice-cold 10-mL beaker. The ice-cold solution was neutralized with KOH (aq)
solution. After pH correction, the mixture was transferred to another 15-mL centrifuge tube and
kept in ice for 10-15 min. The tube was centrifuged for 10 min @ 13500 rpm @ 2 °C. Once

97
complete, the supernatant was transferred to a pre-weighed scintillation vial and placed in a
freeze-dryer system overnight. An NMR spectrum was obtained.
3.4 RESULT AND DISSCUSSION
3.4.1 Synthesis
The synthesis of [4-13C] monoethyl oxaloacetate disodium salt is outlined in Scheme 3.1.
We have chosen the commercially available ethyl [1-13C]-acetate for the synthesis of [4-13C]-
diethyl oxaloacetate sodium salt (1a). This reagent reacted cleanly with diethyloxalate in
presence of sodium ethoxide and ethanol to give the expected sodium salt of the enolate of
diethyl oxaloacetate (Scheme 3.1). The sodium ethoxide used for the condensation was freshly
prepared by dissolving sodium in anhydrous ethyl alcohol. The C4 monoester was prepared by
selective hydrolysis of the diester with NaOH in ethanol. The regioselectivity in this reaction
likely arises from the larger separation of the negative charges in the C4 monoester enolate ion as
compared to the other isomer. [124]
Scheme 3.1.Synthesis of [4-13C] monoethyl oxaloacetate disodium salt (1).

98
3.4.2 Isolated, perfused liver experiments
After synthesis of the [4-13C]-monoethyl oxaloacetate disodium salt, we decided to
investigate the metabolic fate of this compound to establish whether the compound is taken up
and metabolized by the liver. Therefore, we performed isolated, perfused mouse liver
experiments. The isolated mouse livers were perfused with a perfusate containing 2mM [4-13C]-
monoethyl oxaloacetate, 0.2 mM octanoate and KH buffer for 30 min. The liver then was freeze-
clamped and extracted with PCA to remove all enzymes and protenis for methabolic extraction.
High resolution 13C NMR spectroscopy at 600MHz equipped with 10mm cold probe of the PCA
extracts revealed the presence of [1-13C]-citrate (179.7 ppm), [4-13C]-aspartate (178.5ppm) and
[4-13C]-malate (180.9ppm), indicating that [4-13C]-monoethyl oxaloacetate can enter the cells,
the ethyl ester undergoes hydrolysis and the resulting [4-13C]-oxaloacetate enters the TCA cycle.
Figure 3.10. The conversion of [4-13C]-monoethyl oxaloacetate to [1-13C]-citrate, [4-13C]-malate
and [4-13C]-aspartate in the TCA cycle.

99
13C.esp
200 180 160 140 120 100 80 60 40 20 0
Chemical Shift (ppm)
0.005
0.010
0.015
0.020
0.025
0.030
0.035
Norm
alized Inte
nsity
Figure 3.11. Full 13C NMR spectrum at 600 MHz of a mouse liver extract after perfusion with
that [4-13C]-monoethyl oxaloacetate.
Figure 3.12. The 174 - 186 ppm region of the above 13C NMR spectrum showing the metabolites
of [4-13C]-monoethyl oxaloacetate.

100
[C4-13C]-Oxaloacetate was not observed, but this is not surprising because the in vivo pool size
of oxaloacetate is very small The NMR spectrum is shown in Figure 3.9 and 3.10. The
resonances were assigned by comparison of the experimental chemical shifts with a chemical
shift reference database of metabolites compiled at the advanced imaging research center
(AIRC). Figure 3.8 shows the metabolic fate of [4-13C]-oxaloacetate in the TCA cycle.
3.4.3 In vitro DNP-NMR studies
The liver extract results have demonstrated that [4-13C]-monoethyl oxaloacetate is taken
up and metabolized in the liver. However, as discussed, the sensitivity of a conventional 13C
NMR experiment is not high enough to be able to detect TCA cycle metabolites in vivo within a
reasonable time frame. Therefore, we have decided to study the real time metabolism of [4-13C]-
monoethyl oxaloacetate using hyperpolarized [4-13C]-monoethyl oxaloacetate in perfused mouse
livers. As discussed, the hyperpolarized 13C magnetization decays by spin-lattice (longitudinal)
relaxation and enhanced 13C signal can be observed for about 3 to 5 T1 periods. Thus,
considering the time required for dissolution, transfer (around 10 s) and injection, successful in
vivo detection of metabolites generally requires T1 relaxation times longer than 15s. Before the in
vivo studies we have performed in vitro dynamic nuclear polarization (DNP-NMR) experiments
to measure the 13C NMR signal enhancement and the T1 relaxation time of the 13C label in [4-
13C]-monoethyl oxaloacetate. The compound was polarized under standard DNP conditions in
glycerol-water matrix with trityl OX063 in the HyperSense polarizer.

101
HP_13C_monoOxaloacetate_liverhomogenate_04182017_sum30scans
185 180 175 170 165 160 155 150
Chemical Shift (ppm)
0
0.1
0.2
0.3
0.4
0.5
0.6
0.7
0.8
0.9
1.0
Norm
alized Inte
nsity
Figure 3.13. T1 decay of hyperpolarized magnetization [4-13C] monoethyl oxaloacetate disodium
salt after dissolution in KH buffer. Approximately 5000-fold 13C NMR signal enhancement was
observed at room temperature and 9.4 T. Fitting of the decay curves gave approximately the
same T1 value, 14 s for all three peaks at 9.4 T.
13C NMR spectra were recorded at 9.4 T after dissolution in water or aqueous KH buffer
solution. Approximately 5000-fold 13C signal enhancements at room temperature were achieved

102
at 9.4 T. The carbonyl region in the 13C NMR indicated the presence of 3 major isomers (Figure
3.11).[125] The T1 was determined from the decay of the hyperpolarized magnetization (Figure
3.11). Unfortunately, the T1 value was found to be only around 14s.
3.4.4 Liver perfusion experiments with hyperpolarized [4-13C] monoethyl oxaloacetate
disodium salt
Although the T1 value of the C1 carboxylate was found to be short (14 s) we decided to
perform hyperpolarized 13C NMR spectroscopy studies with perfused livers. Isolated livers were
perfused with hyperpolarized [4-13C] monoethyl oxaloacetate disodium salt in the bore of a 9.4 T
magnet and the metabolism of this substrate was followed real time by 13C NMR spectroscopy.
A sum spectrum of the carboxylate region is shown in Figure 3.12. Although the signal to noise
ratio is very poor, the spectrum clearly indicates that hyperpolarized [4-13C] monoethyl
oxaloacetate disodium salt undergoes some transformation. Unfortunately, we were unable to
unequivocally identify any metabolites from these spectra.
Figure 3.14. 13C NMR spectrum (sum of 20 FIDs) of isolated mouse liver perfused with perfused
with 0.2 mM hyperpolarized [4-13C] monoethyl oxaloacetate disodium salt and 0.2 mM
octanoate.
15015215415615816016216416616817017217417617818013C Chemical shift (ppm)

103
3.5 CONCLUSION
In summary, I have synthesized a 13C- labeled oxaloacetate derivative, [4-13C]-monoethyl
oxaloacetate. I have shown in isolated, perfused liver experiments using the non-hyperpolarized
[4-13C]-monoethyl oxaloacetate that the compound is taken up by the liver, the ethyl ester group
is cleaved, the C4 labeled oxaloacetate enters the TCA cycle, and is metabolized to produce
maleate, citrate and aspartate, as expected. Dynamic nuclear polarization of [4-13C]-monoethyl
oxaloacetate sodium salt was successfully performed, however, the T1 relaxation time of the 13C
label at the C4 position was only about 14s, not long enough to observe significant downstream
real time metabolism in perfused liver with the hyperpolarized compound.

104
REFERENCES
1. Dale, B.M., M.A. Brown, and R.C. Semelka, Magnetic resonace imaging: Basic
principles and applications. Wiley,2015.
2. Bloch, F., Nuclear induction. Physical Review, 1946. 70(7-8): p. 460.
3. Purcell, E.M., H.C. Torrey, and R.V. Pound, Resonance absorption by nuclear magnetic
moments in a solid. Physical Review, 1946. 69(1-2): p. 37.
4. Aime, S., et al., High relaxivity contrast agents for MRI and molecular imaging, in
molecular imaging. Springer,2005.p. 99-121.
5. Berger, A., Magnetic resonance imaging. BMJ: British Medical Journal, 2002.
324(7328): p. 35-35.
6. Caravan, P., et al., Gadolinium(III) chelates as MRI contrast agents: structure, dynamics,
and applications. Chemical Reviews, 1999. 99(9): p. 2293-2352.
7. Abragam, A. and M. Goldman, Principles of dynamic nuclear polarisation. Reports on
Progress in Physics, 1978. 41(3): p. 395.
8. Griffin, R.G., Dynamic nuclear polarization at 9 T applied to solid state nuclear magnetic
resonance. Ecole Normale Supérieur de Lyon, 2000.
9. Ardenkjær-Larsen, J.H., et al., Increase in signal-to-noise ratio of> 10,000 times in
liquid-state NMR. Proceedings of the National Academy of Sciences, 2003. 100(18): p.
10158-10163.
10. Hurd, R.E., et al., Hyperpolarized 13C metabolic imaging using dissolution dynamic
nuclear polarization. Journal of Magnetic Resonance Imaging, 2012. 36(6): p. 1314-
1328.
11. Månsson, S., et al., 13C imaging—a new diagnostic platform. European Radiology,
2006. 16(1): p. 57-67.
12. Golman, K., et al., Molecular imaging using hyperpolarized 13C. The British journal of
radiology, 2003. 76(suppl_2): p. S118-S127.
13. Caravan, P., et al., Gadolinium (III) chelates as MRI contrast agents: structure, dynamics,
and applications. Chemical Reviews, 1999. 99(9): p. 2293-2352.
14. Laurent, S., L. Vander Elst, and R. Muller, Lanthanide complexes for magnetic resonance
and optical molecular imaging. The Quarterly Journal of Nuclear Medicine and
Molecular Imaging, 2009. 53(6): p. 586.
105
15. Toth, E., L. Helm, and A.E. Merbach, Relaxivity of gadolinium (III) complexes: theory
and mechanism. Wiley, 2001.
16. Debroye, E. and T.N. Parac-Vogt, Towards polymetallic lanthanide complexes as dual
contrast agents for magnetic resonance and optical imaging. Chemical Society Reviews,
2014. 43(23): p. 8178-8192.
17. Sherry, A.D. and Y. Wu, The importance of water exchange rates in the design of
responsive agents for MRI. Current Opinion in Chemical Biology, 2013. 17(2): p. 167-
174.
18. Westlund, P.-O., A generalized Solomon-Bloembergen-Morgan theory for arbitrary
electron spin quantum number S: The dipole-dipole coupling between a nuclear spin I=
1/2 and an electron spin system S= 5/2. Molecular Physics, 1995. 85(6): p. 1165-1178.
19. Aime, S., et al., Prototropic and water-exchange processes in aqueous solutions of Gd
(III) chelates. Accounts of Chemical Research, 1999. 32(11): p. 941-949.
20. Zhang, S., et al., 1H and 17O NMR detection of a lanthanide-bound water molecule at
ambient temperatures in pure water as solvent. Inorganic Chemistry, 2001. 40(17): p.
4284-4290.
21. Lauffer, R.B., Paramagnetic metal complexes as water proton relaxation agents for NMR
imaging: theory and design. Chemical Reviews, 1987. 87(5): p. 901-927.
22. Farrar, C.T., et al., Mechanism of dynamic nuclear polarization in high magnetic fields.
The Journal of Chemical Physics, 2001. 114(11): p. 4922-4933.
23. Viswanathan, S., et al., Alternatives to gadolinium-based metal chelates for magnetic
resonance imaging .Chemical Reviews, 2010. 110(5): p. 2960-3018.
24. Ren, J., et al., Analysis of lanthanide induced NMR shifts using a crystal field
independent method: application to complexes of tetraazamacrocyclic ligands.
Inorganica Chimica Acta, 2002. 339: p. 273-282.
25. Webber, B.C. and M. Woods, Structural analysis of isomeric europium (III) chelates of
NB-DOTMA. Inorganic Chemistry, 2012. 51(15): p. 8576-8582.
26. Ratnakar, S.J., et al., Modulation of water exchange in europium (III) DOTA− tetraamide
complexes via electronic substituent effects. Journal of the American Chemical Society,
2008. 130(1): p. 6-7.
27. van Zijl, P. and N.N. Yadav, Chemical exchange saturation transfer (CEST): what is in a
name and what isn't? Magnetic Resonance in Medicine, 2011. 65(4): p. 927-948.

106
28. Vinogradov, E., A.D. Sherry, and R.E. Lenkinski, CEST: from basic principles to
applications, challenges and opportunities. Journal of Magnetic Resonance, 2013. 229: p.
155-172.
29. Zhang, S., et al., PARACEST agents: modulating MRI contrast via water proton
exchange. Accounts of Chemical Research, 2003. 36(10): p. 783-790.
30. Pedersen, M., Safety update on the possible causal relationship between gadolinium‐containing MRI agents and nephrogenic systemic fibrosis. Journal of Magnetic
Resonance Imaging, 2007. 25(5): p. 881-883.
31. Brücher, E., et al., Stability and toxicity of contrast agents. The Chemistry of Contrast
Agents in Medical Magnetic Resonance Imaging, Second Edition, 2013: p. 157-208.
32. Bunzli, J.-C.G. and C. Piguet, Taking advantage of luminescent lanthanide ions.
Chemical Society Reviews, 2005. 34(12): p. 1048-1077.
33. Bünzli, J.-C.G. and S.V. Eliseeva, Lanthanide NIR luminescence for
telecommunications, bioanalyses and solar energy conversion. Journal of Rare Earths,
2010. 28(6): p. 824-842.
34. Alpha, B., et al., Antenna effect in luminescent lanthanide cryptates: a photophysical
study. Photochemistry and Photobiology, 1990. 52(2): p. 299-306.
35. Bunzli, J.-C.G., Lanthanide luminescence for biomedical analyses and imaging.
Chemical Reviews, 2010. 110(5): p. 2729-2755.
36. Doffek, C., et al., Understanding the quenching effects of aromatic C–H- and C–D-
oscillators in near-IR lanthanoid luminescence. Journal of the American Chemical
Society, 2012. 134(39): p. 16413-16423.
37. Zhang, J., et al., Sensitization of near‐infrared‐emitting lanthanide cations in solution by
tropolonate ligands. Angewandte Chemie International Edition, 2005. 44(17): p. 2508-
2512.
38. Buenzli, J.-C.G., On the design of highly luminescent lanthanide complexes.
Coordination Chemistry Reviews, 2015. 293: p. 19-47.
39. Kobayashi, H., et al., Rational chemical design of the next generation of molecular
imaging probes based on physics and biology: mixing modalities, colors and signals.
Chemical Society Reviews, 2011. 40(9): p. 4626-4648.
40. Ma, Y. and Y. Wang, Recent advances in the sensitized luminescence of organic
europium complexes. Coordination Chemistry Reviews, 2010. 254(9): p. 972-990.

107
41. Moeller, T., Coordination chemistry of the lanthanide elements—one hundred years of
development and understanding. American Chemical Socitey Publication, 1967.
42. Rojas‐Quijano, F.A., et al., Lanthanide (III) complexes of tris (amide) PCTA derivatives
as potential bimodal magnetic resonance and optical imaging agents. Chemistry-A
European Journal, 2009. 15(47): p. 13188-13200.
43. Bonnet, C.S., et al., Pyridine‐based lanthanide complexes combining MRI and NIR
luminescence activities. Chemistry-A European Journal, 2012. 18(5): p. 1419-1431.
44. Verwilst, P., et al., Recent advances in Gd-chelate based bimodal optical/MRI contrast
agents. Chemical Society Reviews, 2015. 44(7): p. 1791-1806.
45. Pauson, P.L., Tropones and tropolones. Chemical Reviews, 1955. 55(1): p. 9-136.
46. Dutt, Y., R. Singh, and M. Katyal, Metal complexes with tropolones. Talanta, 1969.
16(10): p. 1369-1382.
47. Zhang, J., et al., Synthesis and structural properties of lanthanide complexes formed with
tropolonate ligands. Inorganic Chemistry, 2007. 46(16): p. 6473-6482.
48. Beeby, A., et al., Non-radiative deactivation of the excited states of europium, terbium
and ytterbium complexes by proximate energy-matched OH, NH and CH oscillators: an
improved luminescence method for establishing solution hydration states. Journal of the
Chemical Society, Perkin Transactions 2, 1999(3): p. 493-504.
49. Caille, F., et al., Isoquinoline-based lanthanide complexes: bright NIR optical probes and
efficient MRI agents. Inorganic Chemistry, 2012. 51(4): p. 2522-2532.
50. Jagadish, B., et al., On the Synthesis of 1, 4, 7-Tris (tert-butoxycarbonylmethyl)-1, 4, 7,
10-tetraazacyclododecane. Tetrahedron Letters, 2011. 52(17): p. 2058-2061.
51. Kovacs, Z. and A.D. Sherry, pH-controlled selective protection of polyaza macrocycles.
Synthesis, 1997. 1997(07): p. 759-763.
52. Martins, A.F., et al., Gd3+ complexes conjugated to Pittsburgh compound B: potential
MRI markers of β-amyloid plaques. Journal of Biological Inorganic Chemistry, 2014.
19(2): p. 281-295.
53. Micskei, K., et al., Oxygen-17 NMR study of water exchange on gadolinium
polyaminopolyacetates [Gd(DTPA)(H2O)]2- and [Gd(DOTA)(H2O)]- related to NMR
imaging. Inorganic Chemistry, 1993. 32(18): p. 3844-3850.
54. CarmenáAlpoim, M. and F. Carlos, Determination of the number of inner-sphere water
molecules in lanthanide (III) polyaminocarboxylate complexes. Journal of the Chemical
Society, Dalton Transactions, 1992(3): p. 463-467.

108
55. Martins, A.F., et al., A bis (pyridine N‐oxide) analogue of DOTA: relaxometric
properties of the GdIII complex and efficient sensitization of visible and NIR‐emitting
lanthanide (III) cations including PrIII and HoIII. Chemistry-A European Journal, 2014.
20(45): p. 14834-14845.
56. Aime, S., et al., Conformational and coordination equilibria on DOTA complexes of
lanthanide metal ions in aqueous solution studied by 1H-NMR spectroscopy. Inorganic.
Chemistry, 1997. 36(10): p. 2059-2068.
57. Carnall, W., P. Fields, and K. Rajnak, Electronic energy levels in the trivalent lanthanide
aquo ions. I. Pr3+, Nd3+, Pm3+, Sm3+, Dy3+, Ho3+, Er3+, and Tm3+. The Journal of
Chemical Physics, 1968. 49(10): p. 4424-4442.
58. Bünzli, J.-C.G. and S.V. Eliseeva, Intriguing aspects of lanthanide luminescence.
Chemical Science, 2013. 4(5): p. 1939-1949.
59. Peters, J., J. Huskens, and D. Raber, Lanthanide induced shifts and relaxation rate
enhancements. Progress in Nuclear Magnetic Resonance Spectroscopy, 1996. 28(3-4): p.
283-350.
60. Rohrer, M., et al., Comparison of magnetic properties of MRI contrast media solutions at
different magnetic field strengths. Investigative Radiology, 2005. 40(11): p. 715-724.
61. Ruloff, R., et al., Accelerating water exchange for Gd III chelates by steric compression
around the water binding site. Chemical Communications, 2002(22): p. 2630-2631.
62. Rudovský, J., et al., Synthesis of a bifunctional monophosphinic acid DOTA analogue
ligand and its lanthanide (III) complexes. A gadolinium (III) complex endowed with an
optimal water exchange rate for MRI applications. Organic & Biomolecular Chemistry,
2005. 3(1): p. 112-117.
63. Kálmán, F.K., et al., Synthesis, potentiometric, kinetic, and NMR Studies of 1, 4, 7, 10-
tetraazacyclododecane-1, 7-bis (acetic acid)-4, 10-bis (methylenephosphonic
acid)(DO2A2P) and its complexes with Ca (II), Cu (II), Zn (II) and lanthanide (III) ions.
Inorganic Chemistry, 2008. 47(9): p. 3851-3862.
64. Rojas‐Quijano, F.A., et al., Synthesis and characterization of a hypoxia‐sensitive MRI
probe. Chemistry-A European Journal, 2012. 18(31): p. 9669-9676.
65. Bleuzen, A., et al., Water exchange on in aqueous magnesium (II) solution: a variable
temperature and pressure 17O NMR study. Magnetic Resonance in Chemistry, 1997. 35:
p. 765È773.

109
66. Djanashvili, K. and J. Peters, How to determine the number of inner‐sphere water
molecules in Lanthanide (III) complexes by 17O NMR spectroscopy. A technical note.
Contrast Media & Molecular Imaging, 2007. 2(2): p. 67-71.
67. Rudovský, J., et al., Lanthanide (III) complexes of a mono (methylphosphonate) analogue
of H4dota: The influence of protonation of the phosphonate moiety on the TSAP/SAP
isomer ratio and the water exchange rate. Chemistry-A European Journal, 2005. 11(8): p.
2373-2384.
68. Fasano, M., et al., The extraordinary ligand binding properties of human serum albumin.
International Union of Biochemistry and Molecular Biology life, 2005. 57(12): p. 787-
796.
69. Caravan, P., et al., Albumin binding, relaxivity, and water exchange kinetics of the
diastereoisomers of MS-325, a gadolinium (III)-based magnetic resonance angiography
contrast agent. Inorganic Chemistry, 2007. 46(16): p. 6632-6639.
70. Grist, T.M., et al., Steady-state and dynamic MR angiography with MS-325: initial
experience in humans. Radiology, 1998. 207(2): p. 539-544.
71. Caravan, P., et al., The interaction of MS-325 with human serum albumin and its effect
on proton relaxation rates. Journal of the American Chemical Society, 2002. 124(12): p.
3152-3162.
72. Lauffer, R.B., et al., MS-325: albumin-targeted contrast agent for MR angiography.
Radiology, 1998. 207(2): p. 529-538.
73. Beeby, A., et al., AS d. Sousa, JAG Williams and M. Woods. Intramolecular sensitisation
of lanthanide(III) luminescence by acetophenone-containing ligands: the critical effect of
para-substituents and solvent. Journal of the Chemical Society, Perkin Transactions,
1999. 2(2): p. 493.
74. Hurd, R.E., et al., Metabolic imaging in the anesthetized rat brain using hyperpolarized
[1-13C] pyruvate and [1-13C] ethyl pyruvate. Magnetic Resonance in Medicine, 2010.
63(5): p. 1137-43.
75. Aime, S. and P. Caravan, Biodistribution of gadolinium‐based contrast agents, including
gadolinium deposition. Journal of Magnetic Resonance Imaging, 2009. 30(6): p. 1259-
1267.
76. Caillé, F., et al., Isoquinoline-based lanthanide complexes: bright NIR optical probes and
efficient MRI agents. Inorganic Chemistry, 2012. 51(4): p. 2522-2532.
77. Krumpel, A.H., Locating energy levels of lanthanide ions in inorganic ionic compounds.
PhD Thesis, Technical University Delft, Netherlands, 2009.
110
78. Ishida, H., J.-C. Bünzli, and A. Beeby, Guidelines for measurement of luminescence
spectra and quantum yields of inorganic and organometallic compounds in solution and
solid state (IUPAC Technical Report). Pure and Applied Chemistry., 2016. 88(7): p. 701-
711.
79. Kuhn, L.T., Hyperpolarization methods in NMR spectroscopy. Springer. 2013.
80. Overhauser, A.W., Polarization of nuclei in metals. Physical Review, 1953. 92(2): p. 411.
81. Carver, T.R. and C.P. Slichter, Experimental Verification of the Overhauser Nuclear
Polarization Effect. Physical Review, 1956. 102(4): p. 975-980.
82. Abragam, A., Overhauser effect in nonmetals. Physical Review, 1955. 98(6): p. 1729-
1735.
83. Ramanathan, C., Dynamic nuclear polarization and spin diffusion in nonconducting
solids. Applied Magnetic Resonance, 2008. 34(3): p. 409.
84. Ardenkjær-Larsen, J.H., et al., Increase in signal-to-noise ratio of > 10,000 times in
liquid-state NMR. Proceedings of the National Academy of Sciences, 2003. 100(18): p.
10158-10163.
85. Lumata, L., et al., BDPA: An efficient polarizing agent for fast dissolution dynamic
nuclear polarization NMR spectroscopy. Chemistry – A European Journal, 2011. 17(39):
p. 10825-10827.
86. Gerfen, G.J., et al., High frequency (140 GHz) dynamic nuclear polarization: polarization
transfer to a solute in frozen aqueous solution. The Journal of Chemical Physics, 1995.
102(24): p. 9494-9497.
87. Goldman, M., Thermal mixing between spin systems in solids. Physical Review, 1965.
138(6A): p. A1668-A1674.
88. Goertz, S.T., The dynamic nuclear polarization process. Nuclear Instruments and
Methods in Physics Research Section A: Accelerators, Spectrometers, Detectors and
Associated Equipment, 2004. 526(1): p. 28-42.
89. Lumata, L., et al., DNP by thermal mixing under optimized conditions yields >60 000-
fold enhancement of 89Y NMR signal. Journal of the American Chemical Society, 2011.
133(22): p. 8673-8680.
90. Wenckebach, W.T., Dynamic nuclear polarization via thermal mixing: beyond the high
temperature approximation. Journal of Magnetic Resonance, 2017. 277(supplement C):
p. 68-78.

111
91. Thurber, K.R. and R. Tycko, Theory for cross effect dynamic nuclear polarization under
magic-angle spinning in solid state nuclear magnetic resonance: The importance of level
crossings. The Journal of Chemical Physics, 2012. 137(8): p. 084508.
92. Golman, K., et al., Molecular imaging with endogenous substances. Proceedings of the
National Academy of Sciences, 2003. 100(18): p. 10435-10439.
93. Golman, K. and J.S. Petersson, metabolic imaging and other applications of
hyperpolarized 13C1. Academic Radiology, 2006. 13(8): p. 932-942.
94. Merritt, M.E., et al., Hyperpolarized 13C allows a direct measure of flux through a single
enzyme-catalyzed step by NMR. Proceedings of the National Academy of Sciences, 2007.
104(50): p. 19773-19777.
95. Gallagher, F.A., M.I. Kettunen, and K.M. Brindle, Biomedical applications of
hyperpolarized 13C magnetic resonance imaging. Progress in Nuclear Magnetic
Resonance Spectroscopy, 2009. 55(4): p. 285-295.
96. Serrao, E.M. and K.M. Brindle, Potential clinical roles for metabolic imaging with
hyperpolarized [1-(13)C]pyruvate. Frontiers in Oncology, 2016. 6: p. 59.
97. Golman, K., et al., Metabolic imaging by hyperpolarized 13C magnetic resonance
imaging for in vivo tumor diagnosis. Cancer Research, 2006. 66(22): p. 10855-10860.
98. Golman, K., et al., Metabolic imaging by hyperpolarized magnetic resonance imaging for
tumor diagnosis. Cancer Research, 2006. 66(22): p. 10855.
99. Nelson, S.J., et al., Metabolic imaging of patients with prostate cancer using
hyperpolarized [13C]Pyruvate. Science Translational Medicine, 2013. 5(198): p. 198.
100. Bhattacharya, P., B.D. Ross, and R. Bünger, Cardiovascular applications of
hyperpolarized contrast media and metabolic tracers. Experimental Biology and
Medicine, 2009. 234(12): p. 1395-1416.
101. Harrison, C., et al., Comparison of kinetic models for analysis of pyruvate-to-lactate
exchange by hyperpolarized (13)C NMR. NMR in Biomedicine, 2012. 25(11): p. 1286-
1294.
102. Lumata, L.L., et al., Development and performance of a 129-GHz dynamic nuclear
polarizer in an ultra-wide bore superconducting magnet. Magnetic Resonance Materials
in Physics, Biology and Medicine, 2015. 28(2): p. 195-205.
103. Sherry, A.D. and C.R. Malloy, 13C Isotopomer analysis of glutamate a NMR method to
probe metabolic pathways intersecting in the citric acid cycle, in vivo carbon-13 NMR
2002, Springer US: Boston, MA. p. 59-97.

112
104. Lu, D., et al., 13C NMR isotopomer analysis reveals a connection between pyruvate
cycling and glucose-stimulated insulin secretion (GSIS). Proceedings of the National
Academy of Sciences, 2002. 99(5): p. 2708-2713.
105. Puccetti, C., et al., 13C-NMR isotopomer distribution analysis: a method for measuring
metabolic fluxes in condensation biosynthesis. NMR in Biomedicine, 2002. 15(6): p. 404-
415.
106. Golman, K., et al., 13C-angiography .Academic Radiology. 2002. 9 Suppl 2: p. S507-10.
107. Moreno, K.X., et al., Competition of pyruvate with physiological substrates for oxidation
by the heart: implications for studies with hyperpolarized [1-(13)C]pyruvate. American
Journal of Physiology - Heart and Circulatory Physiology, 2010. 298(5): p. H1556-
H1564.
108. Merritt, M.E., et al., Flux through hepatic pyruvate carboxylase and phosphoenolpyruvate
carboxykinase detected by hyperpolarized 13C magnetic resonance. Proceedings of the
National Academy of Sciences, 2011. 108(47): p. 19084-19089.
109. Golman, K. and M. Thaning, Real-time metabolic imaging. Proceedings of the National
Academy of Sciences, 2006. 103(30): p. 11270-11275.
110. Jin, E.S., A.D. Sherry, and C.R. Malloy, Metabolism of glycerol, glucose, and lactate in
the citric acid cycle prior to incorporation into hepatic acylglycerols. Journal of
Biological Chemistry, 2013. 288(20): p. 14488-14496.
111. Jones, J.G., et al., Measurement of gluconeogenesis and pyruvate recycling in the rat
liver: a simple analysis of glucose and glutamate isotopomers during metabolism of
[1,2,3-13C3]propionate. Federation of European Biochemical Societies Letters., 1997.
412(1): p. 131-137.
112. Rines, A.K., et al., Targeting hepatic glucose metabolism in the treatment of type 2
diabetes. Nature Reviews Drug Discovery ,2016. 15(11): p. 786-804.
113. Nuttall, F.Q., A. Ngo, and M.C. Gannon, Regulation of hepatic glucose production and
the role of gluconeogenesis in humans: is the rate of gluconeogenesis constant?
Diabetes/Metabolism Research and Reviews, 2008. 24(6): p. 438-458.
114. Hanson, R.W. and L. Reshef, Regulation of phosphoenolpyruvate carboxykinase (GTP)
gene expression. Annual Review of Biochemistry, 1997. 66(1): p. 581-611.
115. Hanson, R.W. and A.J. Garber, Phosphoenolpyruvate carboxykinase. I. Its role in
gluconeogenesis. The American Journal of Clinical Nutrition, 1972. 25(10): p. 1010-21.

113
116. Pajor, A.M., Sodium-coupled transporters for Krebs cycle intermediates. Annual Review
of Physiology, 1999. 61: p. 663-82.
117. Halestrap, A.P., The monocarboxylate transporter family--Structure and functional
characterization. International Union of Biochemistry and Molecular Biology life, 2012.
64(1): p. 1-9.
118. Halestrap, A.P. and N.T. Price, The proton-linked monocarboxylate transporter (MCT)
family: structure, function and regulation. Biochemical Journal, 1999. 343(Pt 2): p. 281-
299.
119. Jackson, V.N. and A.P. Halestrap, The kinetics, substrate, and inhibitor specificity of the
monocarboxylate (lactate) transporter of rat liver cells determined using the fluorescent
intracellular pH indicator, 2′, 7′-bis (carboxyethyl)-5 (6)-carboxyfluorescein. Journal of
Biological Chemistry, 1996. 271(2): p. 861-868.
120. Jensen, P.R., et al., Hyperpolarized [1,3-13C2 ]ethyl acetoacetate is a novel diagnostic
metabolic marker of liver cancer. International Journal of Cancer, 2015. 136(4): p.
E117-26.
121. Zacharias, N.M., et al., Real-time molecular imaging of tricarboxylic acid cycle
metabolism in vivo by hyperpolarized 1-13C diethyl succinate. Journal of the American
Chemical Society, 2012. 134(2): p. 934-943.
122. Laizure, S.C., et al., The role of human carboxylesterases in drug metabolism: have we
overlooked their importance? Pharmacotherapy, 2013. 33(2): p. 210-22.
123. Moreno, K.X., et al., Production of hyperpolarized (13)CO(2) from [1-(13)C]pyruvate in
perfused liver does reflect total anaplerosis but is not a reliable biomarker of glucose
production. Metabolomics : Official Journal of the Metabolomic Society, 2015. 11(5): p.
1144-1156.
124. Hellerman, L., et al., Studies on succinate dehydrogenase. effect of monoethyl
oxaloacetate, acetylene dicarboxylate, and thyroxine. Journal of Biological Chemistry,
1960. 235(8): p. 2468-2474.
125. Cocivera, M., et al., Catalysis of keto-enol tautomerism of oxaloacetic acid and its ions
studied by proton nuclear magnetic resonance. The Journal of Organic Chemistry, 1977.
42(25): p. 4076-4080.
126. Hashami, Z., et al., Lanthanide DO3A-tropone complexes: efficient dual MR/NIR
imaging probes in aqueous medium. European Journal of Inorganic Chemistry, 2017.
2017(43): p. 4965-4968.

114
127. Jiang, W., et al., Hyperpolarized 15N-pyridine derivatives as pH-sensitive MRI agents.
Scientific Reports, 2015. 5.
128. Gupton, B., F., et al., Preparation of sodium diethyl oxalacetate. US 4,902,819, 1990.
115
BIOGRAPHICAL SKETCH
Zohreh Hashami was born in Iran. She obtained her bachelor’s degree in Physics from Azad
University of Mashhad, Iran. She was accepted into the Physics graduate program at The
University of Texas at Dallas in Fall 2009 and earned her master degree in Physics 2011. In 2013
she entered the Chemistry department to pursue a PhD in Chemistry. In 2013 she started working
under the supervision of Dr. Zoltan Kovacs at UT Southwestern Medical Research center. Her
research focused on development of novel magnetic resonance probes.

CURRICULUM VITAE
Zohreh Hashami
EDUCATION
PhD. in Chemistry/ Biochemistry
University of Texas at Dallas /UT Southwestern Medical Research Center, USA
M.S. in Physics
University of Texas at Dallas, USA
B.S. in Physics
Azad University of Mashhad, Iran
M.S. LAB EXPERINCE
Advance Imaging Research Center (AIRC), UT Southwestern Medical Research Center &
Chemistry Department, University of Texas at Dallas
Design and develop bimodal, MR/optical imaging agents, dynamic nuclear polarization
(DNP), data analysis: ACD (Advanced Chemistry Development) and Igor. (Image
processing).
Physics Department, University of Texas at Dallas:
Synthesized, analyzed and characterized carbon nanotubes
TEACHING EXPERIENCE
Adjunct faculty Brookhaven Community College, Farmers Branch, TX 2012 – Present
University physics I& II, physical chemistry, College physics I&II and astronomy

Adjunct faculty Present
Collin County Community College University physics II, College physics II
Adjunct faculty Richland Community College, Dallas, TX 2014-2015
College physics I&II
Teaching Assistant
University of Texas at Dallas 2010-2011&2013-Present
University physics I&II, statistical physics and General chemistry I&II
AWARDS
Recognition of Service from University of Texas at Dallas 2016
Honor Society, Strength and Honor member 2013- Present
PUBLICATIONS
1) Zohreh Hashami, Andre F. Martins, Alexander M. Funk, Veronica Clavijo Jordan,Svetlana
V. Eliseeva, and Zoltan Kovacs, Lanthanide DO3A-tropolone complexes: efficient bimodal
MR/NIR imaging probes in water, Eur. J. Inorg. Chem. 2017, 4963.
2) Lloyd Lumata, Matthew Merritt, Zohreh Hashami, S. James Ratnakar, and Zoltan Kovacs,
Production and NMR Characterization of Hyperpolarized 107,109Ag Complexes, Angew. Chem.
Int. Ed. 2011, 525–527