novel method
TRANSCRIPT

Novel Method for Rapid Determination of Thermoformability
Dr. Amit DhariaTransmit Technology Group, LLC, TXDr. Don HyltonMcConnell Co. Inc., GA
Outline®Properties –Thermoforming Process
relationship ®Current test methods ®Description of new test apparatus
/operation/ data acquisition ®Application and data interpretation®Future plans®Conclusion
Thermoforming Process®Extruding sheet stock ®Heating sheet above Tg®Stretching heated sheet in rubbery state®Forming stretched sheet®Cooling®Trimming ®Finishing –painting, printing

Structure - Properties -Thermoformability® Rate of change of strength with the
change in strain rate at forming temperature
®% Crystallinity – Breadth of rubbery Plateau
® Molecular weight, Molecular weight distribution, molecular architecture (branching, crosslinking) – MFR, Melt Elasticity

Other parameters® Density - % filler, type of fillers, degassing® Geometry – Thickness, area, multi-layered
structures, adhesion between layers® Residual stresses between and within in
extruded layer sheet stock® Thermal diffusivity (Cp, K. Rho)® Extrusion quality ( gels, unmelts,
thickness variation, grain patterns)® Color (IR absorption)

Current tests® Low shear melt viscosity (MFR, RMS)® Hot tensile test (2 in gauge length, 0.2 to 20
ipm, or 0.002 to 0.33 1/s vs. 10/1s for TF process)
® Melt Tension (Draw Force –Melt strength, Break Velocity –Draw down)
® Sag Test (sag distance, sag time)® Hot Creep Test® DMA (Relaxation time)
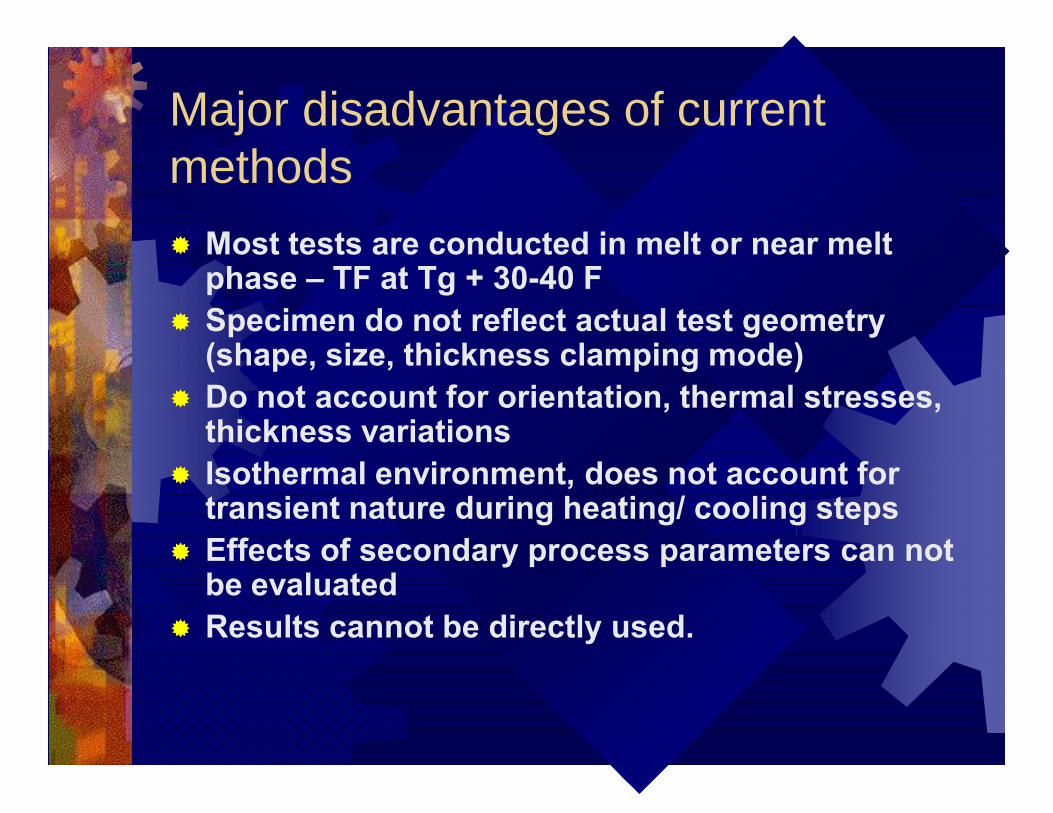
Major disadvantages of current methods® Most tests are conducted in melt or near melt
phase – TF at Tg + 30-40 F® Specimen do not reflect actual test geometry
(shape, size, thickness clamping mode)® Do not account for orientation, thermal stresses,
thickness variations® Isothermal environment, does not account for
transient nature during heating/ cooling steps® Effects of secondary process parameters can not
be evaluated® Results cannot be directly used.

What we want to know?® Will this material thermoform? ® Will this new material process the same? ® Will this lot process the same as the last one?® Why this lot does not process the same?® How much time is needed to heat the sheet?® How fast material will heat?® What is the right forming temperature range?® Will melt adhesion between layers survive
heating and stretching step?® Will material discolor, fed or degrade during
heating?

What processors want to know?®What is the maximum draw down ratio?® How fast part can be made? ®What is the MD and TD shrinkage?®Will material tear?® How much regrind can I use?®Will grains retain shape and depth?® Does extruded sheet have gels or
unmelts?

What Industry Needs?® A standard test method which reflects all unit
steps – heating, 3D stretching, forming, and cooling
® A test equipment which can be precisely controlled, is rapid, easy to use, provides repeatable and quantitative information, using the lease amount of material.
® Easy to use “Thermoformability Index” standard for comparing, contrasting effects of selected process/ material variables

TECHNOFORM TM
Patent PendingTTG
TECHNOFORM
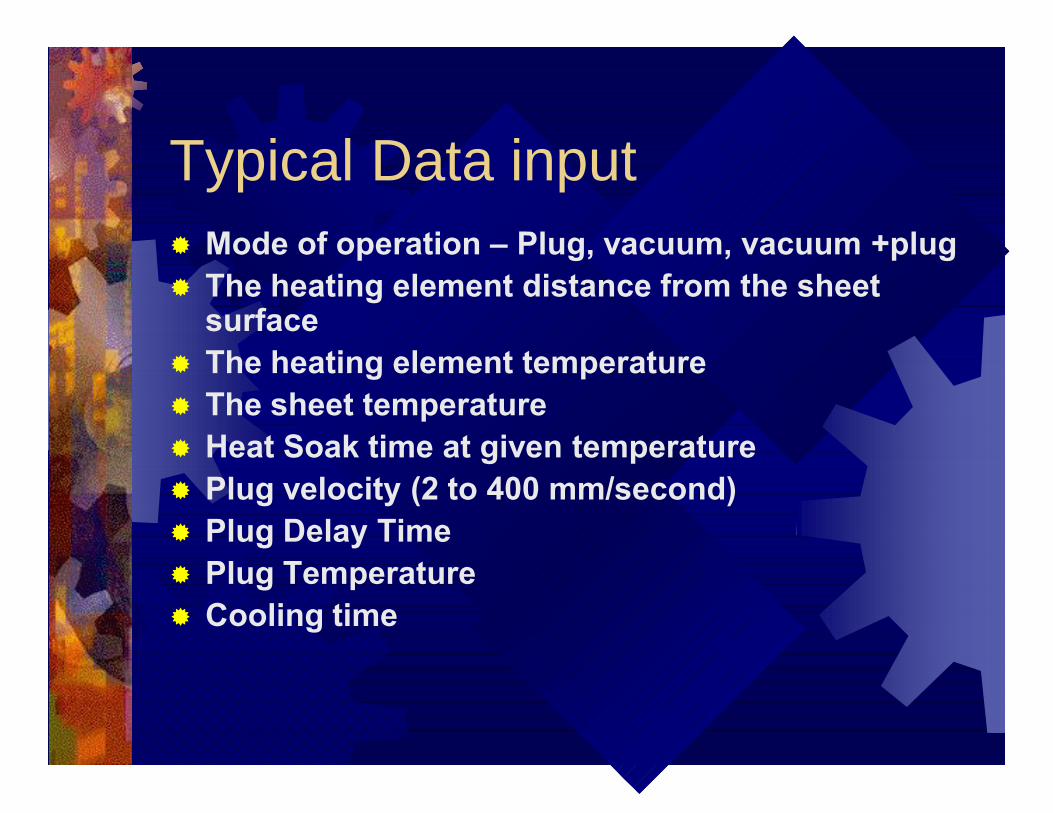
Typical Data input® Mode of operation – Plug, vacuum, vacuum +plug® The heating element distance from the sheet
surface® The heating element temperature® The sheet temperature® Heat Soak time at given temperature® Plug velocity (2 to 400 mm/second)® Plug Delay Time ® Plug Temperature® Cooling time
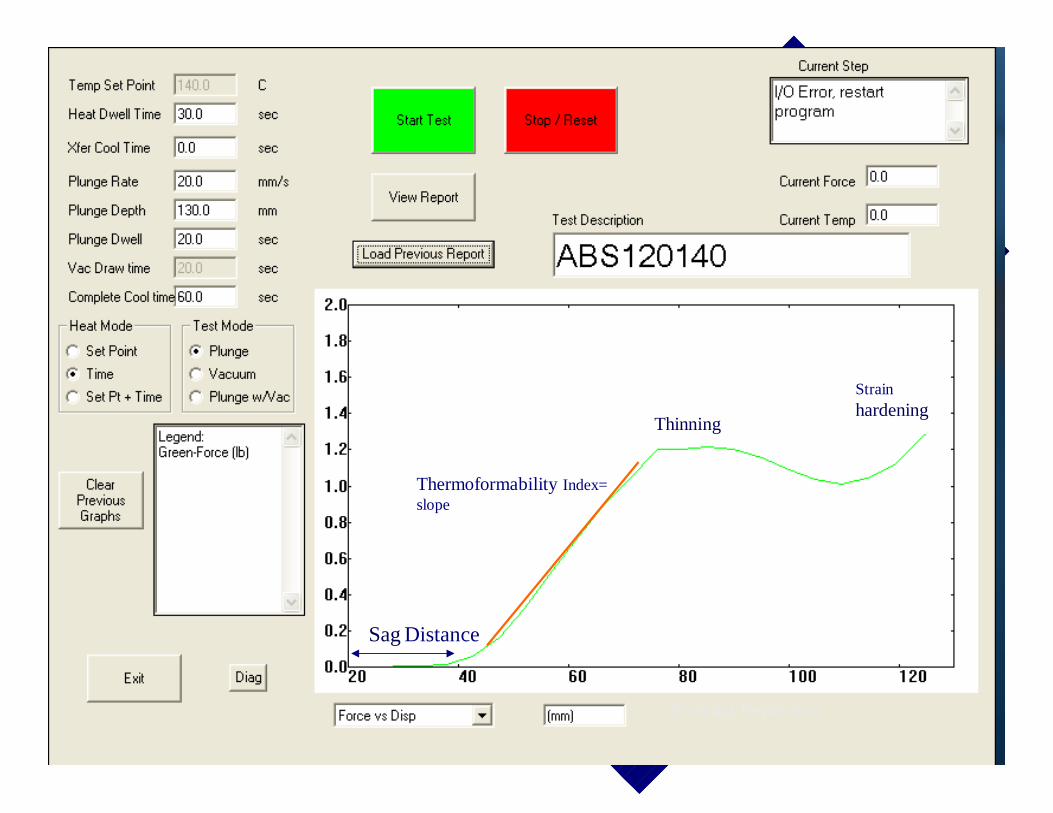
Typical user Input Screen
Sag Distance
Thinning
Strainhardening
Forming Depth mm
Thermoformability Index=slope
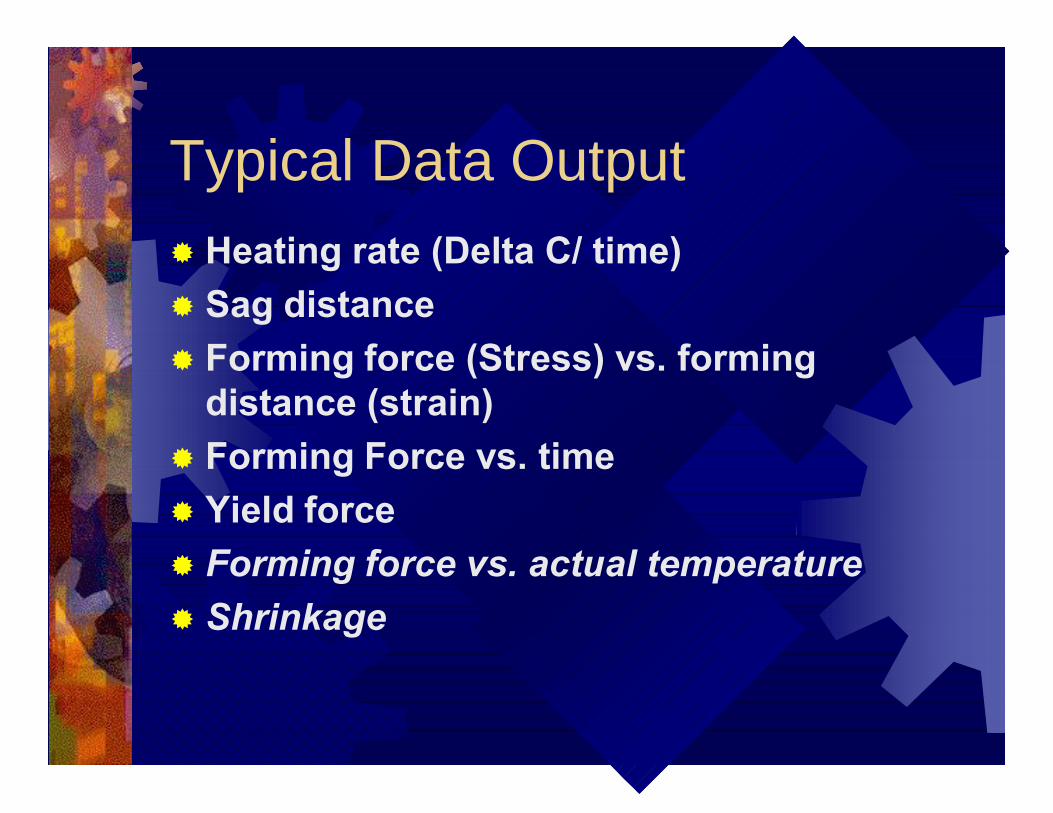
Typical Data Output® Heating rate (Delta C/ time)® Sag distance ® Forming force (Stress) vs. forming
distance (strain)® Forming Force vs. time® Yield force® Forming force vs. actual temperature® Shrinkage

Heating rates for various plastic materials(Heater at 600 C, 3” from upper, 2” from lower)
30
80
130
180
230
0 20 40 60 80
t (seconds)
T (c
)
PPHDPEHIPSPVCABSAcetalPMMANylon
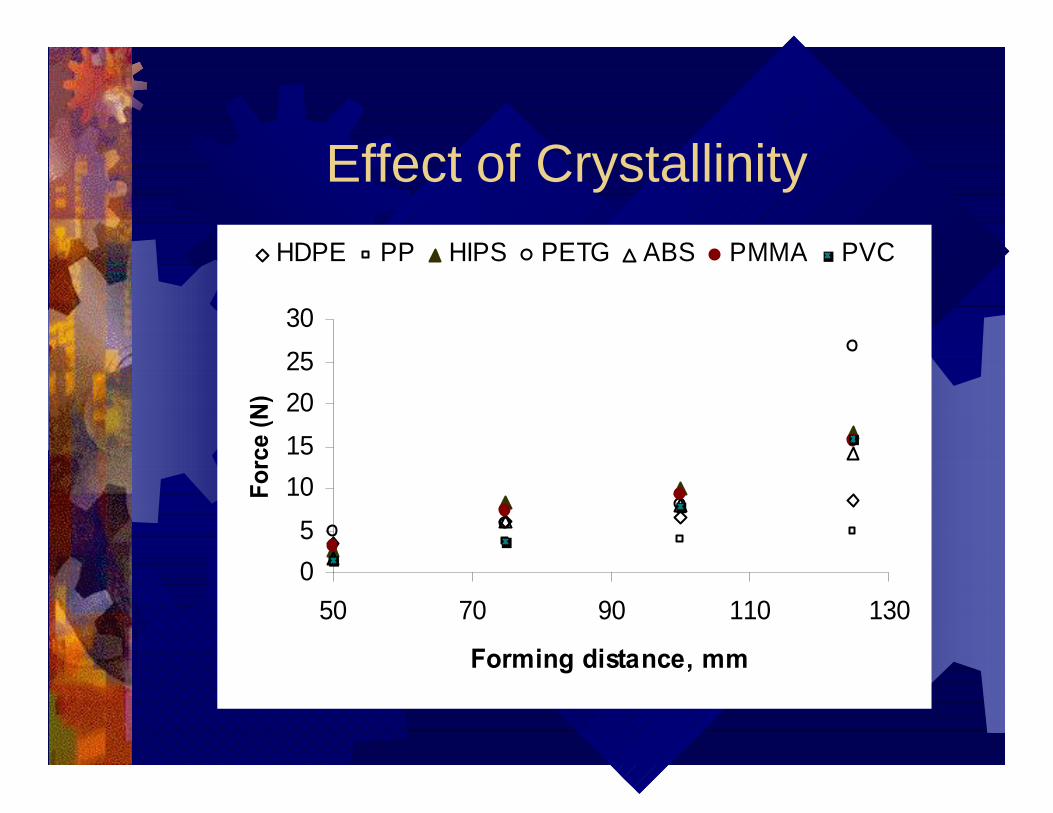
Effect of Crystallinity
05
1015202530
50 70 90 110 130
Forming distance, mm
Forc
e (N
)HDPE PP HIPS PETG ABS PMMA PVC

Effect of Forming Temperature
0
2
4
6
8
10
12
14
125 145 165 185
Temperature (C)
Fo
rce
(N)
ABS
PP
HDPE
HIPS
PETG
PMMA
ACETAL
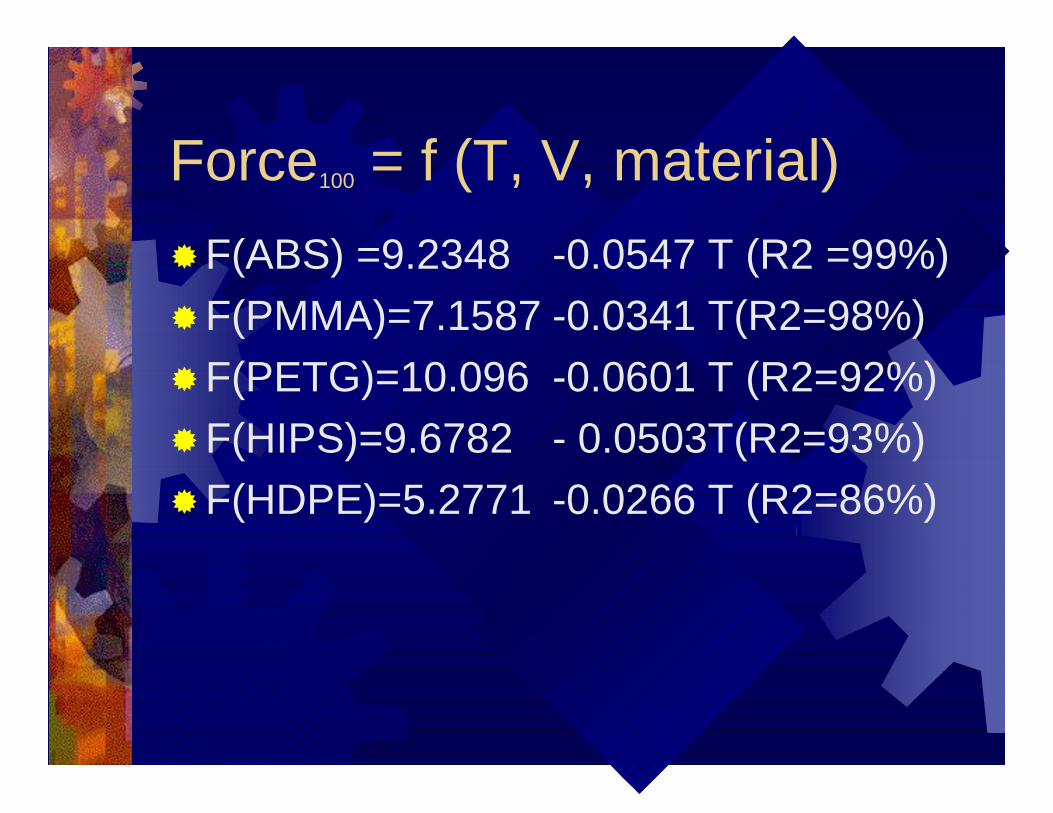
Force100 = f (T, V, material)®F(ABS) =9.2348 -0.0547 T (R2 =99%)®F(PMMA)=7.1587 -0.0341 T(R2=98%)®F(PETG)=10.096 -0.0601 T (R2=92%)®F(HIPS)=9.6782 - 0.0503T(R2=93%)®F(HDPE)=5.2771 -0.0266 T (R2=86%)

Comparison of Acetal, Nylon, TPO
0123456
0 50 100 150Time (seconds)
Form
ing
dist
ance
(mm
)
Delrin (206)
PA (241 C)
TPO (161 C)

Effect of forming Speed on HDPE @ 150 C
Effect of Forming Speed on HDPE
0
2
4
6
8
10
0 50 100 150Distance (mm)
From
ing
forc
e (N
)
20 mm/sec30 mm.sec50 mm/sec
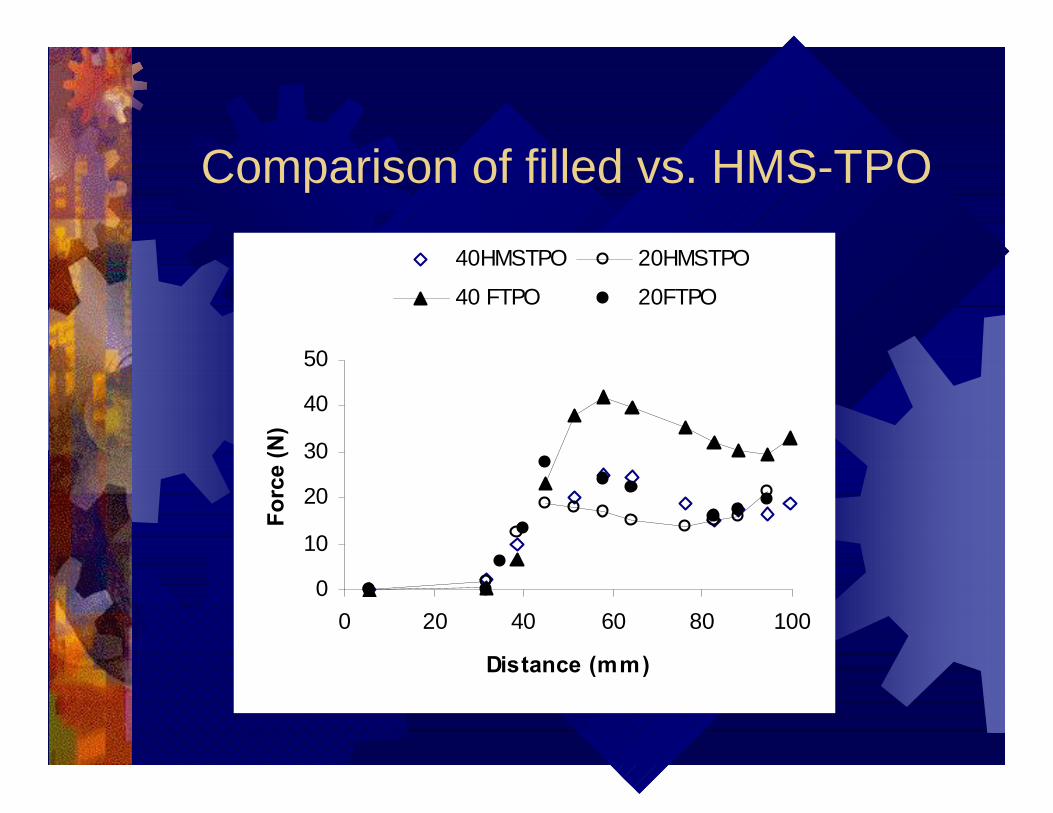
Comparison of filled vs. HMS-TPO
0
10
20
30
40
50
0 20 40 60 80 100
Distance (mm)
Forc
e (N
)40HMSTPO 20HMSTPO
40 FTPO 20FTPO

Effect of adding HMSPP in PP
01234567
40 60 80 100 120 140Form ing Dist ance, mm
Form
ing
Forc
e, L
bf
10%H MSPP 20%HMS PP 30% HMSPP
01234567
40 60 80 100 120 140Form ing Dist ance, mm
Form
ing
Forc
e, L
bf
10%H MSPP 20%HMS PP 30% HMSPP
01234567
40 60 80 100 120 140
Forming Distance, mm
Form
ing
Forc
e, L
bf10%HMSPP 20%HMSPP 30%HMSPP

Formability of HMSPP/PP Blends
02468
1012
10 20 30
% HMSPP
thic
knes
s (H
igh/
Low)

Effect of % Regrind on formability TPO20% regrind / Five Successive Extrusions
0123456
40 60 80 100 120
Forming Distance, mm
Form
ing Fo
rce,
Lbf
1st2nd3rd4th5th
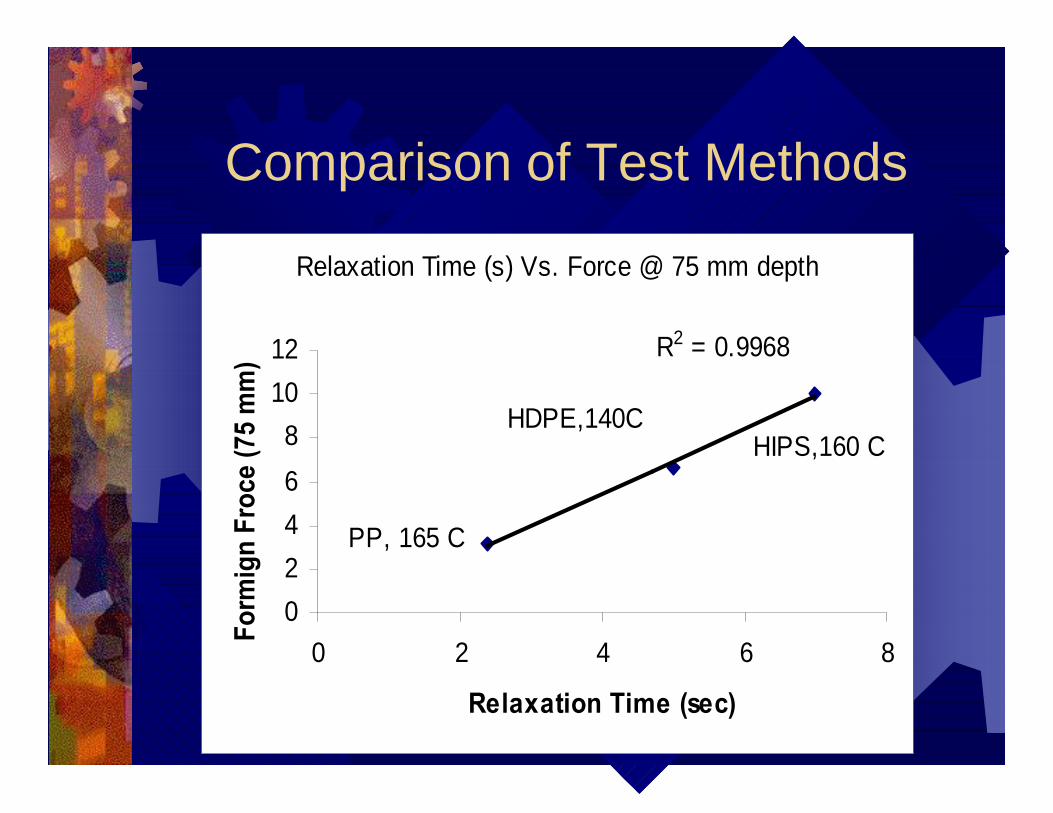
Comparison of Test Methods
Relaxation Time (s) Vs. Force @ 75 mm depth
R2 = 0.9968
02468
1012
0 2 4 6 8
Relaxation Time (sec)
Form
ign
Froc
e (7
5 m
m)
PP, 165 C
HDPE,140CHIPS,160 C

Future Plans® Develop a standard “Thermoformability
Index” similar to Melt Flow Index; which can be used by industry as specification to describe thermoformability of material.
® Refine force-vs. displacement data into stress vs. strain data for each plug geometry
® Develop an integrated predictive modeling system like “Moldflow”.

Conclusions® A novel and simple test equipment is
developed which closely reflects all four unit steps of the typical thermoforming process and generates quantitative and repeatable information.
® The test data can be used in raw form to compare or contrast various materials and process parameters input or can be further modeled as a design or predictive tool.