novel multiphase chemical reaction systems enabled by
TRANSCRIPT

Novel Multiphase Chemical Reaction Systems Enabled by Microfabrication Technology
By
Matthew W. Losey
Submitted to the Department of Chemical Engineering in partial fulfillment of the requirements for the degree of
Doctor of Philosophy
at the
MASSACHUSETTS INSTITUTE OF TECHNOLOGY
May 2001
© Massachusetts Institute of Technology 2001. All rights reserved.
Author......................................................................................................................... Matthew W. Losey
Department of Chemical Engineering May 4, 2001
Certified by.................................................................................................................
Klavs F. Jensen Lammot duPont Professor of Chemical Engineering
Professor of Materials Science and Engineering Thesis Supervisor
Certified by.................................................................................................................
Martin A. Schmidt Professor of Electrical Engineering and Computer Science
Thesis Supervisor Accepted by................................................................................................................
Robert E. Cohen St. Laurent Professor of Chemical Engineering
Chairman, Departmental Committee on Graduate Students

2
Abstract
Novel Multiphase Chemical Reaction Systems Enabled by Microfabrication Technology
By
Matthew W. Losey
Advances in MEMS (micro-electromechanical systems) have enabled some of the
"Lab-on-a-Chip" technologies and microfluidics that are pervasive in many of the current developments in analytical chemistry and molecular biology. Coinciding with this effort in micro-analytics has been research in chemical process miniaturization -- reducing the characteristic length scale of the unit operation to improve heat and mass transfer, and ultimately process performance. My research has involved the design and fabrication of novel chemical reaction systems using MEMS and microfabrication methods (photolithography, deep-reactive-ion etching, thin-film growth and deposition, and multiple wafer bonding). Miniature chemical systems provide the opportunity for distributed, on-demand manufacturing, which would eliminate the hazards of transportation and storage of toxic or hazardous chemical intermediates. Reactions that are particularly suitable for miniaturized chemical systems are those that are fast and involve toxic intermediates: the controlled synthesis of phosgene is such a reaction and has been demonstrated in a microfabricated packed bed reactor. Owing to the high surface-to-volume ratios, micro chemical systems also have the potential to make improvements in process performance through enhanced heat and mass transfer. Heterogeneously catalyzed gas-liquid reactions have been performed in the microfabricated reactors and have been shown to have mass transfer coefficients several orders of magnitude larger than their industrial-scale counterparts. Multiphase reactions are often hindered by mass-transfer limitations owing to the difficulty in transporting the gaseous reactant through the liquid to the catalytic surface. The microchemical device has been designed to increase the interfacial gas-liquid contacting area by promoting dispersion and preventing coalescence. Microfabrication allows the design of reactors with complicated fluidic distribution networks, staggered arrays of microstructural features to promote mixing, and the integration of sensing and temperature control. Other uses of microfabrication include the incorporation of porous silicon as a high surface area catalyst support. In all, performing multiphase chemistry on a chip has been demonstrated to have inherent advantages, particularly for those fast reactions that can benefit from improved mixing and mass transfer.

3
Acknowledgements
Before I acknowledge all of the people at MIT, I must begin by acknowledging the support of my parents, Bob and Diane Losey. This thesis is the result of their continued encouragement and support. Their lifelong commitment to the values of education, honesty, and hard work, has been the cornerstone upon which this thesis was built. This thesis is dedicated to both of them. Every good thesis starts with a good advisor. I could not have asked for a better advisor than Klavs Jensen. We have enjoyed a remarkable working relationship and I have thoroughly enjoyed the research that we have crafted together. It's a shame that there isn't enough time in a day to try out all of the ideas that we came up with throughout this thesis. Fortunately, at least one of the ideas (this thesis) turned out to be a legitimate one. I am grateful for the confidence that he has repeatedly placed in me and I am deeply indebted for his advisement and mentorship. Also, I am also extremely fortunate to have had Marty Schmidt as an advisor for this thesis. The collaboration between Marty and Klavs is truly a unique opportunity, blending the best of MEMS design and chemical engineering. If it were not for Marty's grounding in practicality and sensible design, many of us would still be in the clean room. It was truly valuable and immensely enjoyable to have Marty's involvement. The efforts of the other members of my thesis committee, Professors Daniel Blankschtein and Paul Laibinis are gratefully acknowledged. Their involvement, flexibility, and time committed were greatly appreciated. Collaboration with industrial partners provided a valuable resource for technical guidance and understanding of traditional multiphase reactor design. This research was funded in part by an industrial sponsor. That company, through the efforts of Denise Anderson, deserves credit for their foresight and commitment to academic research. Their sustained interest in the results of this work, while limiting direct involvement, was a source of continued inspiration. The value of having Denise Anderson as a source of feedback and technical guidance can not be over-stated. And I would like to offer my sincere thanks to the personnel of the Microsystems Technology Lab (MTL). Their expertise, patience, and commitment to the education of the students has made our research possible. I would like to thank MIT's Felice Frankel for numerous photographs which have appeared in many of our publications and in this thesis. There are a number of other resources throughout MIT that I relied upon throughout my research. The people whose help has been instrumental include Fred Cote of the Edgerton Center student machine shop, Andrew Gallant of the MIT Central machine, and Tony Garrett-Reed of the Materials Science Microscopy Lab. Lastly, I want to thank all of my friends and fellow students at MIT who have been incredible role-models and sources of support. One in particular, Dr. Laura Pruette, to whom I am forever indebted for her love and support.

4
The following acknowledgements are related directly to the work involved with this thesis. The initial single-channel reactor design was motivated by the liquid mixer design of Tamara Floyd. Tamara graciously allowed me to test some of her devices well before I had an appreciation for how much work went into making them. The result is that I broke almost all of them. In the end, I had a packaging scheme that worked and saved me from breaking all of my own reactors down the road. The collaboration with her, as seen in the first chapter, resulted in an understanding of mixing and reaction at the micro scale which had a direct impact on the design for the gas-liquid contacting scheme. The work with the phosgene chemistry in chapter 4 is a result of a collaboration with Sameer Ajmera. The details of the analysis are left to him, but I think the work provides a reference point for what really is a 'fast reaction.' It provides a contrast for the multiphase hydrogenation reaction, and as a result, provides further insight into microreactor design. Perhaps the greatest accomplishment is that we lived to see the data. But I do appreciate his patience and it was overall an enjoyable experience. It was a real pleasure to be able to work with Shinji Isogai of Mitsubishi Chemicals. His work with multiphase oxidation reactions with these microreactors was a particularly good example of the benefits of process intensification. Shinji's work ethic would put any graduate student's to shame (particularly this one's) and his polite and accommodating personality were appreciated by everyone in the lab. A good portion of the gas-liquid contacting study in the microstructured reactor was performed by Sonia Tulyani, an undergraduate who stuck with the project for the course of her undergraduate research. She is not only a student of incredible patience and skill, but she also was wonderful to work with. MIT needs more undergraduates like her. Chapter 6 describes the incorporation of porous silicon into the microreactors. Porous silicon studies were initiated by David Quiram and continued by Rebecca Jackman. Rebecca and I collaborated for the porous silicon integration in this thesis. If there was ever a process that was truly 'black magic,' this was it. Other people in the group have contributed throughout with both major and minor details. Aleks Franz and Samara Firebaugh both provided insight and guidance throughout the device and fabrication designs.

5
TABLE OF CONTENTS
ABSTRACT ....................................................................................................................... 2
ACKNOWLEDGEMENTS.............................................................................................. 3
1. INTRODUCTION................................................................................................... 18
1.1. MOTIVATION AND THESIS OVERVIEW.................................................................... 18
1.2. BACKGROUND ON MICROREACTION TECHNOLOGY................................................ 23
1.3 BACKGROUND ON MULTIPHASE CHEMICAL PROCESSES ........................................ 25
1.3.1 Trickle-Bed Reactors..................................................................................... 29
1.3.2 Hydrogenation Reactions.............................................................................. 31
1.3.3 Previous Micro Trickle-Beds ........................................................................ 33
1.4 MOTIVATION FOR MICROSCALE MULTIPHASE CHEMICAL PROCESSES................... 34
1.5 THESIS OBJECTIVES................................................................................................ 35
1.6 THESIS OUTLINE .................................................................................................... 35
2. “SINGLE-CHANNEL" REACTOR DESIGN AND APPLICATIONS............ 37
2.1. FROM GAS-PHASE TO LIQUID PHASE: BACKGROUND FOR THE FIRST DESIGN......... 37
2.2. SINGLE CHANNEL REACTOR DESIGN ....................................................................... 46
2.3. SINGLE CHANNEL REACTOR FABRICATION ............................................................ 55
2.4. PACKAGING AND EXPERIMENTAL SET-UP .............................................................. 56
2.5. PRESSURE DROP RESULTS...................................................................................... 61
2.6. APPLICATION OF THE SINGLE CHANNEL REACTOR TO THE SYNTHESIS OF PHOSGENE
63
6
2.6.1. Introduction................................................................................................... 63
2.6.2. Chemical Compatibility of Silicon/Glass ...................................................... 65
2.6.3. Phosgene Reaction Results............................................................................ 66
2.7. SINGLE CHANNEL REACTOR SUMMARY................................................................. 69
3. "MULTI-CHANNEL" REACTOR DESIGN ...................................................... 70
3.1. MICROFLUIDIC DESIGN .......................................................................................... 71
3.1.1. Overcoming Surface Tension in Microchannels ........................................... 72
3.1.2. Device Layout................................................................................................ 74
3.2. HEATER DESIGN..................................................................................................... 77
3.2.1. Thermal Performance Characterization ....................................................... 82
3.2.2. Heat Transfer for a Free Standing Microchip Reactor................................ 83
3.2.3. Discussion: Heat Exchange in Microchemical Devices ............................... 87
3.2.4. Thermal Uniformity Calculation................................................................... 89
3.3. FABRICATION PROCESS .......................................................................................... 94
3.4. ORIENTATION AND GRAVITATIONAL EFFECTS FOR MICRO MULTIPHASE SYSTEMS97
3.5. SUMMARY OF THE MULTICHANNEL REACTOR DESIGN .......................................... 99
4. RESULTS: THE CATALYTIC HYDROGENATION OF CYCLOHEXENE
101
4.1. CYCLOHEXENE HYDROGENATION........................................................................ 101
4.2. INTRINSIC RATE DETERMINATION........................................................................ 102
4.3. CATALYST POISONING AND DEACTIVATION......................................................... 106
4.4. AMS HYDROGENATION EXPERIMENTS ................................................................ 107
4.5. CYCLOHEXENE DEACTIVATION AND PURIFICATION PROCEDURES ....................... 113
7
4.5.1. Cyclohexene Purification ............................................................................ 114
4.6. REACTION RESULTS ............................................................................................. 117
4.6.1. Activation Energy for the Cyclohexene Hydrogenation.............................. 117
4.6.2. Reaction Results: Single Channel Reactor Hydrogenation ........................ 120
4.6.3. Reaction Results: Hydrogenation in a Multichannel Reactor .................... 122
4.6.4. 1% Pt/Al2O3 Reaction Results.................................................................... 125
4.7. BATCH EXPERIMENTS .......................................................................................... 126
4.8. REACTION RESULTS SUMMARY............................................................................ 129
4.9. MICROFLUIDICS RESULTS .................................................................................... 130
4.9.1. Fluid Flow Characterization....................................................................... 130
4.9.2. Flow Distribution ........................................................................................ 134
4.9.3. Two-Phase Flow Pressure Drop................................................................. 139
4.10. SUMMARY ........................................................................................................ 140
5. MASS TRANSFER AND REACTOR ANALYSIS ........................................... 141
5.1. IS THE STEADY-STATE ASSUMPTION FOR GAS ABSORPTION VALID? ...................... 142
5.2. WHY USE A HETEROGENEOUSLY CATALYZED REACTION TO ASSESS MASS
TRANSFER?................................................................................................................... 143
5.3. WHY IS CO-CURRENT FLOW NECESSARY?........................................................... 144
5.4. MASS TRANSFER ANALYSIS: MODEL DERIVATION............................................. 145
5.4.1. Mass Transfer Analysis: Gas-Liquid Absorption........................................ 147
5.4.2. Mass Transfer analysis: Liquid Film resistance......................................... 150
Lower Bound Analysis for Liquid Diffusion............................................................ 153
5.4.3. Mass Transfer: Internal Pore Diffusion and Effectiveness Factor ............. 154

8
5.4.4. Mass Transfer Analysis: Steady State Rate Expression.............................. 155
5.5. MASS TRANSFER COEFFICIENTS IN THE MICROREACTOR..................................... 158
5.6. RATE OF GAS ABSORPTION VERSUS MASS TRANSFER COEFFICIENTS .................. 159
5.7. SUMMARY ............................................................................................................ 163
6. MICROSTRUCTURED CATALYTIC REACTORS....................................... 164
6.1. INTRODUCTION..................................................................................................... 164
6.2. MICROSTRUCTURED REACTOR DEVICE DESIGN................................................... 168
6.2.1. Multiphase Microfluidics Design ................................................................ 169
6.2.2. Microstructured Catalyst Design ................................................................ 171
6.3. FABRICATION ....................................................................................................... 173
6.4. POROUS SILICON AS A CATALYST SUPPORT ......................................................... 175
6.4.1. Introduction................................................................................................. 175
6.4.2. Experimental Procedure for Porous Silicon Formation............................. 178
6.5. DEVICE CHARACTERIZATION AND RESULTS......................................................... 181
6.6. CATALYST CHARACTERIZATION AND CHEMISORPTION........................................ 181
6.6.1. Surface Area Characterization ................................................................... 184
6.6.2. Pulsed Chemisorption Methods .................................................................. 185
6.7. GAS-LIQUID REACTION RESULTS IN THE MICROSTRUCTURED REACTOR............. 190
6.8. SUMMARY ............................................................................................................ 195
7. GAS-LIQUID CONTACTING IN MICROFABRICATED SYSTEMS ......... 196
7.1. INTRODUCTION..................................................................................................... 196
7.2. GAS LIQUID FLOW BEHAVIOR IN CONVENTIONAL SYSTEMS................................ 196
7.3. HYDRODYNAMICS AND FLOW REGIMES OF TWO-PHASE MICROCHANNEL FLOW 200

9
7.3.1. Microstructured Reactor Flow Regimes ..................................................... 200
7.3.2. Influence of wetability of the surfaces on flow regimes .............................. 205
7.3.3. Open Channel Gas-Liquid Flow ................................................................. 208
7.3.4. Pressure Drop Measurements..................................................................... 210
7.3.5. Interfacial Area Determination................................................................... 213
7.3.6. Discussion: Geometry influence.................................................................. 214
7.4. SUMMARY ............................................................................................................ 215
8. MULTIPHASE MICROREACTOR COMPARISON AND DISCUSSION... 216
8.1. MASS TRANSFER COEFFICIENT COMPARISON ...................................................... 216
8.1.1. Why is the mass transfer coefficient, KLa, 100 times larger? ..................... 217
8.2. INTERFACIAL GAS-LIQUID CONTACTING AREA ................................................... 218
8.3. POWER DISSIPATION ............................................................................................ 219
8.4. DISCUSSION.......................................................................................................... 221
8.4.1. Packed-bed or Integrated Catalyst? ........................................................... 221
8.4.2. What is an appropriate reaction for a microchemical system? ................. 222
8.4.3. Is Small Really Better? The question of process intensification ................. 224
8.5. SUMMARY ............................................................................................................ 227
9. CONCLUSIONS AND RECOMMENDATIONS FOR FURTHER STUDY . 228
9.1. THESIS SUMMARY ................................................................................................ 228
9.2. PRINCIPAL ACCOMPLISHMENTS OF THE THESIS.................................................... 230
9.2.1. Measurement of KLa in a microreactor system........................................... 230
9.2.2. First micromachined packed-bed and novel gas-liquid contacting ............ 230
9.2.3. Comparison of integrated catalysts with conventional catalysts ................ 231

10
9.3. RECOMMENDATIONS FOR FURTHER STUDY.......................................................... 232
9.3.1. Novel Materials by Microfluidic Synthesis ................................................. 232
9.4. COMMENTS ON THE FUTURE. ................................................................................ 235
10. REFERENCES...................................................................................................... 237

11
LIST OF FIGURES
FIGURE 1-1. MICROSTRUCTURED MICROREACTOR CHIP. . ................................................. 22
FIGURE 1-2. COMMON GAS-LIQUID REACTOR DESIGNS...................................................... 26
FIGURE 1-3. COMMON MULTIPHASE PACKED-BED REACTOR DESIGNS.. ............................. 27
FIGURE 1-4. IDEALIZED WETTING OF THE CATALYST PELLETS IN A TRICKLE-BED REACTOR.
................................................................................................................................... 30
FIGURE 2-1. MEMBRANE MICROREACTOR . ....................................................................... 37
FIGURE 2-2. LIQUID MICROMIXER DESIGN. ...................................................................... 40
FIGURE 2-3. EXPERIMENTAL VISUALIZATION OF AN ACID-BASE REACTION IN THE LIQUID-
PHASE MICROMIXER. . ............................................................................................... 41
FIGURE 2-4. EXPERIMENTAL VISUALIZATION OF LAMINAR FLOW ..................................... 43
FIGURE 2-5. UV-VIS SPECTRA COLLECTED IN THE MICROREACTOR. .............................. 43
FIGURE 2-6. ABSORBANCE DECAY AS A RESULT OF MIXING. ............................................ 45
FIGURE 2-7. DESIGN OPTIONS FOR MICROFABRICATED FILTER STRUCTURE....................... 47
FIGURE 2-8. REACTION CHANNEL OUTLET DESIGN. ......................................................... 52
FIGURE 2-9. SINGLE-CHANNEL MULTIPHASE MICROREACTOR INLET DESIGN .................... 53
FIGURE 2-10. PHOTOMICROGRAPH OF SINGLE CHANNEL MICRO REACTOR ........................ 54
FIGURE 2-11. FIXTURE FOR INTERFACING THE CHIP WITH EXTERNAL FLUIDICS. ............. 56
FIGURE 2-12. PHOTOGRAPH OF STEEL INTERFACE FIXTURE. ............................................ 57
FIGURE 2-13. ASSEMBLED REACTOR PACKAGE. . ............................................................. 58
FIGURE 2-14. EXPERIMENTAL SET UP. ............................................................................. 59
FIGURE 2-15. MEASURED PRESSURE DROP FOR ETHANOL IN A PACKED SINGLE-CHANNEL
MICROREACTOR. ....................................................................................................... 62

12
FIGURE 2-16. A) SILICON REACTOR AFTER EXPOSURE TO CHLORINE AT 250 °C. B)
SILICON REACTOR WITH 5000Å OXIDE LAYER AFTER EXPOSURE TO CHLORINE AT 250
°C FOR 6 HOURS. ...................................................................................................... 65
FIGURE 2-17. EXPERIMENTAL RESULTS FOR PHOSGENE SYNTHESIS IN A SINGLE CHANNEL
MICROREACTOR. ........................................................................................................ 68
FIGURE 3-1. TOP, PLANE VIEW OF MULTICHANNEL REACTOR AND POINT OF CROSS-
SECTIONS.................................................................................................................... 76
FIGURE 3-2. CROSS-SECTION OF LIQUID MANIFOLD CORRESPONDING TO B) OF 3-1. ......... 77
FIGURE 3-3. SINGLE CHANNEL REACTOR WITH INTEGRATED HEATER ............................... 79
FIGURE 3-4. RESISTIVE TEMPERATURE SENSOR AT THE EXIT OF THE REACTOR. ................ 79
FIGURE 3-5. TEMPERATURE DEPENDENCE OF THE RESISTANCE FOR THE HEATER............... 80
FIGURE 3-6. LAYOUT FOR HEATER LINES AND TEMPERATURE SENSOR. . ........................... 81
FIGURE 3-7. RESULTING TEMPERATURE FOR A GIVEN POWER INPUT USING AN INTEGRATED
THIN-FILM HEATER IN A SINGLE-CHANNEL REACTOR.................................................. 83
FIGURE 3-8. TEMPERATURE DECAY WITH NON-INSULATED CHIP....................................... 85
FIGURE 3-9. LINEARIZED TEMPERATURE VERSUS TIME PROFILE (DATA FROM FIGURE 3-8).
THE MEASURED SLOPE PROVIDES THE HEAT TRANSFER COEFFICIENT. ........................ 87
FIGURE 3-10. MODEL FOR DETERMINING TEMPERATURE UNIFORMITY.............................. 90
FIGURE 3-11. 2-D MODEL FOR TEMPERATURE UNIFORMITY PROFILE ................................ 91
FIGURE 3-12. CALCULATED TEMPERATURE PROFILE FOR A POWER OF 1 WATT. ................ 93
FIGURE 3-13. PHOTOMICROGRAPH OF INLET MANIFOLD FOR THE TEN-CHANNEL REACTOR. .
................................................................................................................................... 96

13
FIGURE 4-1. HYDROGENATION OF AMS IN A SINGLE CHANNEL MICROREACTOR LOADED
WITH 50 µM CATALYST PARTICLES. ......................................................................... 109
FIGURE 4-2. AMS HYDROGENATION IN A SINGLE CHANNEL MICROREACTOR. ............... 110
FIGURE 4-3. AMS HYDROGENATION IN A SINGLE CHANNEL MICROREACTOR. ............... 111
FIGURE 4-4. DEACTIVATION OF THE RATE OF HYDROGENATION NORMALIZED FOR THE
AMOUNT OF AMS FED TO THE REACTOR. ................................................................. 116
FIGURE 4-5. CYCLOHEXENE HYDROGENATION IN A SINGLE CHANNEL REACTOR. NO
PURIFICATION LEADS TO A LOSS OF ACTIVITY SIMILAR TO THE AMS EXPERIMENTS. 113
FIGURE 4-6. CYCLOHEXENE HYDROGENATION IN A SINGLE CHANNEL MICROREACTOR.
WITH PROPER PURIFICATION, THE RATE REMAINS STEADY AFTER AN INITIAL LOSS OF
ACTIVITY. ................................................................................................................. 115
FIGURE 4-7. CYLOHEXENE HYDROGENATION. REACTION RATE REMAINS STEADY FOR THE
SECOND DAY OF USING THE SAME CATALYST AND USING A NEW SUBSTRATE. .......... 116
FIGURE 4-8. CYCLOHEXENE HYDROGENATION RATE VERSUS TEMPERATURE.................. 119
FIGURE 4-9. ARRHENIUS PLOT FOR THE CYCLOHEXENE HYDROGENATION. ..................... 119
FIGURE 4-10. REACTION RATE DEPENDENCE ON LIQUID VELOCITY FOR THE CYCLOHEXENE
HYDROGENATION IN A MULTICHANNEL REACTOR. . ................................................ 123
FIGURE 4-11. REACTION RATE DEPENDENCE ON GAS VELOCITY FOR THE CYCLOHEXENE
HYDROGENATION IN A MULTICHANNEL REACTOR. ................................................... 123
FIGURE 4-12. COMPARISON OF REACTION RATES FOR THE CYCLOHEXENE HYDROGENATION
IN THE SINGLE CHANNEL REACTOR AND THE MULTICHANNEL REACTOR. .................. 124
FIGURE 4-13. BATCH/SLURRY REACTOR RESULTS FOR CYCLOHEXENE HYDROGENATION. .
................................................................................................................................. 127
14
FIGURE 4-14. REACTION RATE RESULTS FOR CYCLOHEXENE HYDROGENATION IN A BATCH /
SLURRY REACTOR USING THE DATA FROM FIGURE 4-13. .......................................... 128
FIGURE 4-15. EXPECTED REACTION RATES FOR A RANGE OF MASS TRANSFER RATES USING
THE INTRINSIC REACTION RATE FOR THE CYCLOHEXENE HYDROGENATION. ........... 129
FIGURE 4-16. FLUID FLOW REGIME CHARACTERIZATION IN SINGLE CHANNEL REACTOR. 131
FIGURE 4-17. PHOTOMICROGRAPH OF PULSING FLOW..................................................... 132
FIGURE 4-18. FLOW TRANSITION POINT VERSUS SUPERFICIAL MASS VELOCITIES:
MICROREACTOR COMPARED WITH PUBLISHED LABORATORY REACTOR. ................... 133
FIGURE 4-19. DRYING OUT OF THE CATALYST BED DUE TO A GAS PULSE. ....................... 133
FIGURE 4-20. FLOW MALDISTRIBUTION IN THE PACKED BEDS. ........................................ 136
FIGURE 4-21. EVEN DISTRIBUTION OF MULTIPHASE FLOW IN A PACKED-BED. ................ 138
FIGURE 4-22. TWO-PHASE PRESSURE DROP IN A SINGLE CHANNEL REACTOR. THE
ADDITION OF GAS FLOW AT 4SCCM INCREASES THE PRESSURE DROP. ....................... 139
FIGURE 5-1. MASS TRANSFER RESISTANCES FOR GAS-LIQUID-SOLID REACTION. ........... 145
FIGURE 6-1. CAD ILLUSTRATION OF THE TWO REACTOR DESIGN OPTIONS...................... 168
FIGURE 6-2. SEM OF DRIE ETCHED MICROSTRUCTURED REACTION CHANNELS............. 172
FIGURE 6-3. PROCESS FLOW FOR THE FABRICATION OF MICROSTRUCTURED CHANNELS
INCORPORATING POROUS SILICON. ........................................................................... 174
FIGURE 6-4. RESULTING PORE SIZE IN POROUS SILICON FOR DIFFERENT DOPANT TYPES AND
WAFER RESISTIVITIES, TAKEN FROM [111]. .............................................................. 177
FIGURE 6-5. EXPERIMENTAL SET-UP FOR CREATING POROUS SILICON............................. 179
FIGURE 6-6. TEFLON REACTOR FOR CREATING POROUS SILICON ON 4" WAFERS.............. 180

15
FIGURE 6-7. PHOTOMICROGRAPH OF THE CROSS-SECTION OF THE REACTION CHANNELS
INDICATING THE DEPTH OF THE POROUS SILICON LAYER INTO THE BULK SILICON
SUBSTRATE............................................................................................................... 182
FIGURE 6-8. SEMS OF POROUS SILICON. . ...................................................................... 183
FIGURE 6-9. CO CHEMISORPTION PULSE CHROMATOGRAM ............................................ 186
FIGURE 6-10. EXPERIMENTAL SET-UP FOR CO CHEMISORPTION ANALYSIS. . ................. 187
FIGURE 6-11. RESULTS FOR CO CHEMISORPTION EXPERIMENTS. . ................................. 189
FIGURE 6-12. CYCLOHEXENE HYDROGENATION IN THE POROUS SILICON REACTORS. ..... 192
FIGURE 6-13. LIFETIME STUDIES FOR POROUS SILICON WITH PLATINUM CATALYSTS. . .. 193
FIGURE 6-14. COMPARISON OF REACTION RATES AND NORMALIZED ACTIVITIES BETWEEN
THE PACKED BED REACTORS AND THE POROUS SILICON REACTORS .......................... 194
FIGURE 7-1. TWO-PHASE FLOW REGIMES IN TUBES AND CAPILLARIES, TAKEN FROM [25,
121]. ....................................................................................................................... 198
FIGURE 7-2. SLUG-FLOW REGIME IN A MICROSTRUCTURED REACTOR USING CO-CUURENT
FLOW OF ETHANOL / AIR. . ....................................................................................... 201
FIGURE 7-3. ANNULAR FLOW IN A MICROSTRUCTURED REACTOR USING ETHANOL AND AIR.
. ................................................................................................................................ 202
FIGURE 7-4. DISPERSED FLOW REGIME. ......................................................................... 203
FIGURE 7-5. FLOW REGIME MAP FOR WATER-NITROGEN MIXING IN A SILICON
MICROSTRUCTURED REACTOR. . ............................................................................. 204
FIGURE 7-6. SLUG-DISPERSED FLOW REGIME IN A SILICON MICROSTRUCTURED REACTOR
................................................................................................................................. 205
FIGURE 7-7. FLOW REGIME MAP IN AN OXIDIZED MICROSTRUCTURED REACTOR. ............ 207

16
FIGURE 7-8. FLOW REGIME MAP IN AN OPEN-CHANNEL MICROREACTOR USING WATER/AIR
CO-CURRENT FLOW. ................................................................................................ 208
FIGURE 7-9. PHOTOMICROGRAPH OF ‘ANNULAR’ FLOW IN AN OPEN-CHANNEL
MICROREACTOR........................................................................................................ 209
FIGURE 7-10. TWO-PHASE PRESSURE DROP IN THE MICROSTRUCTURED REACTOR (GAS
FLOW RATE = 100 SCCM). ........................................................................................ 211
FIGURE 7-11. TWO-PHASE PRESSURE DROP IN THE MICROSTRUCTURED REACTORS USING
WATER/AIR COCURRENT FLOW. . ............................................................................. 212
FIGURE 8-1. PREDICTED KLA ON THE BASIS OF POWER DISSIPATION. ............................. 221
FIGURE 8-2. PROCESS INTENSIFICATION EXAMPLE. ........................................................ 225
FIGURE 9-1. OIL DROPLET FORMATION IN WATER USING THE MULTICHANNEL
MICROREACTOR........................................................................................................ 233
FIGURE 9-2. OIL DROPLET FORMATION IN WATER WITHOUT SURFACTANT. ..................... 234

17
LIST OF TABLES
TABLE 1-1. COMPARISON OF REACTION SPEEDS AT AMBIENT CONDITIONS ..................... 32
TABLE 2-1. CALCULATED PRESSURE DROPS FOR BASED ON ERGUNS EQUATION............... 50
TABLE 3-1. CALCULATED DIMENSIONLESS BOND NUMBERS (GRAVITY VS. SURFACE
TENSION) ................................................................................................................... 98
TABLE 4-1. CYCLOHEXENE REACTION RATE VERSUS TEMPERATURE. ............................. 118
TABLE 4-2. VARIOUS REACTION RESULTS FOR HYDROGENATION IN A SINGLE CHANNEL
REACTOR.................................................................................................................. 120
TABLE 4-3. VARIOUS REACTION RESULTS FOR HYDROGENATION IN A MULTI CHANNEL
REACTOR.................................................................................................................. 122
TABLE 4-4. VARIOUS REACTION RESULTS FOR HYDROGENATION IN A MULTI CHANNEL
REACTOR.................................................................................................................. 125
TABLE 5-1. VALUES OF THE SHERWOOD NUMBER FOR VARIOUS REYNOLDS NUMBERS .. 152
TABLE 5-2. MASS TRANSFER COEFFICIENTS CALCULATED IN THE MICROREACTOR ........ 159
TABLE 5-3. COMPARISON OF MASS TRANSFER COEFFICIENTS FOR VARIOUS REACTORS. . 162
TABLE 8-1. COMPARISON OF MULTIPHASE REACTORS..................................................... 216
TABLE 8-2. INTERFACIAL GAS-LIQUID CONTACT AREAS IN THE MICROSTRUCTURED
REACTOR. ................................................................................................................. 219

18
1. Introduction
1.1. Motivation and Thesis Overview
The ability to carry out chemical reactions at a large scale with high yield,
absolute process control, and with economic efficiency is at the core of chemical
engineering. The modern chemical plant contains a whole host of operations which serve
to transform materials, in a controlled and efficient fashion, from one form to another.
Understanding chemical processes requires tools that can probe reaction kinetics
efficiently and accurately, and this too, is a critical component of chemical engineering.
In the evolution of technology, more advanced methods for reactor construction and
chemical analysis are increasingly becoming available. New technologies are developed
in seemingly unrelated fields and eventually these technologies diffuse out and find
diverse and varied applications. This thesis is about such technology application in the
area of reactor design and reaction engineering.
The technology in question is microfabrication. The development of modern
integrated circuits has produced manufacturing processes that deposit thin layers of
materials ranging from glasses to metals, carve out features in these materials smaller
than a micron, and all of it is done in replicate across large areas. The modern Pentium
processor has nearly 10 million individual transistors in an area of 4 cm2: each transistor
is a fraction of a micron in size (for reference the human hair has an average diameter of
about 50 microns). Multiple layers of metals and glasses cover and connect to the
transistors to create the microelectronic circuit.
Coinciding with this microelectronics revolution has been the development of
mechanical instruments at this microscopic scale using much of the same technology.

19
When coupled with electrostatic forces for manipulating and sensing the mechanical
instruments, the collective term to describe the technology is micro-electro-mechanical
systems (MEMS). Today’s research in MEMS covers a broad array of future
applications. Ranging from the fanciful micromachines that could one day travel
throughout the body to report or repair on damaged tissues to miniature aerial vehicles,
MEMS is a field of great imagination and prospect. The reality for MEMS today is no
less impressive. The most widespread application is the miniature pressure sensor which
is used in a number of systems in the modern automobile. These MEMS devices measure
the deformation of a thin membrane and transduce the mechanical pressure to an
electrical signal. The miniature accelerometer for air-bag deployment in an automobile is
another example. The digital mirror display (DMD) made by Texas Instruments is a
MEMS device consisting of arrays of microscopic mirrors. Electrostatic forces cause
each individual mirror to deflect hundreds of times per second, to reflect an incident light
beam upon or away from a target. In this way, a continuous moving image is projected
with super digital clarity and fidelity. The inkjet printer is another widespread MEMS
application: a miniature nozzle, coupled with the microelectric generation of bubbles,
forces ink as a steady stream of droplets on to the paper.
The technology that unites these varied MEMS applications is silicon
microfabrication. Starting with substrates of pure single crystalline silicon, thin films are
deposited, photolithography is used to pattern arrays of small features, plasmas or acids
are used to selectively etch the films or silicon, and multiple substrates are bonded
together to produce the mechanical and electrical elements of a single chip. The chip is

20
packaged within a larger system of components to create a functional sensor, instrument
or device.
The motivation for applying this technology to chemical processing is a result of a
number of enabling features of the microfabrication process. First of which, the ability to
create small features with large aspect ratios is an ability unique to microfabrication.
Conventional machining is limited to features 100 µm in size and the depth is limited to
the same. Furthermore, conventional machining is serial in nature, requiring lots of time
for complex geometries. Silicon micromachining, particularly deep reactive ion etching,
allows features much smaller to be created simultaneously. For example, the inlet
channels of the single channel reactor of chapter 2 are only 25 µm wide and nearly 300
µm deep. What advantage do small channels have for chemical processing? As the size
of the channel decreases, the relative ratio of channel surface area to channel volume
increases. This increased surface area has a direct impact on thermal and mass transport.
The ability to keep a reactor at a constant temperature, even in the presence of a highly
exothermic reaction, is improved as the surface area for heat conduction increases.
Similarly for mass transport, as the length scale for diffusion is reduced, the time to reach
homogeneous fluid mixtures is reduced. This advantage is discussed in more detail
throughout this thesis with the primary objective to demonstrate quantitatively the
improvements in heat and mass transfer for chemical reactions in microsystems. In
addition to constructing small features in replicate, silicon microfabrication has a host of
additional features, including the ability to construct thin film sensors and electronics.
This allows for the direct integration of functionality with the reactor, such as
temperature measurement, heating, pressure measurement, and specific chemical

21
identification and detection. Figure 1-1 is a photograph of the microreactor device that is
the culmination of this thesis. It is a chip (1.5cm X 4cm) consisting of 2 layers of silicon,
2 layers of glass, 10 parallel reaction channels filled with 20,000, 50 µm diameter catalyst
supports, a platinum thin film element for heating and platinum thin film resistor for
temperature measurement. The rest of this thesis will describe the design, fabrication and
characterization of this device as well as the devices which led up to its design.
The next section of this chapter provides some of the background work in the area
of microreaction systems prior to and during this thesis. It covers a range of applications
proposed and demonstrated for microchemical systems and lends further motivation to
this area of research. In addition, providing a short survey of other efforts in
microreaction research goes toward showing the novelty of the present work. Following
this background is a section describing multiphase reactions and the most common
reactor designs found in industrial applications. The limitations of these industrial
reactors lends motivation towards the research of this thesis which focuses upon novel
reactor designs for multiphase processes. This chapter finishes with an outline for the
rest of the thesis.

22
Figure 1-1. Microstructured microreactor chip. Ten channels (625µm X 300µm X 20mm) are connected in parallel. Four segments of a thin-film platinum heater overlap the channels. Photograph courtesy of Felice Frankel.
1 cm
23
1.2. Background on Microreaction Technology
The last decade has seen an explosive growth in research and development in the
miniaturization of chemical processes.[1] [2] Benson was one of the first to propose that
miniaturized chemical systems could provide modular, distributed production units
thereby allowing a manufacturing process which was more flexible to market forces,
portable, safer for the generation of hazardous chemicals, and more efficient by virtue of
improved heat and mass transfer.[3] Since then, a multitude of technologies have been
developed and applied for the purposes of creating miniaturized chemical unit operations,
including both silicon microfabrication[4] and conventional machining of metals[5]. An
international conference on microreaction technology, started in 1996 and continuing
today, illustrates the wide-spread interest that has been generated.[6, 7] The potential for
chemical synthesis in a microsystem has been addressed by several authors.[8-14] This
interest in micro chemical synthesis is in addition to a larger body of work devoted to the
miniaturization of analytical chemistries, Micro Total Analysis Systems (µTAS).[15-18]
The premise for using a miniaturized device for chemical synthesis is that
production scale quantities are achieved as a result of numbering up, or operating a
number of devices in parallel, rather than redefining the scale of the device itself.[19]
This is a radical departure from traditional modes of chemical processing which involve a
few, very large chemical plants. The motivation for operating a multitude of reactors can
stem from several factors including an enhanced unit productivity (owing to higher heat
and mass transfer), better control, and safer operation. Part of the reason why this mode
of operation has yet to be explored is that the control systems required to manage such a
complex network of operations has only recently become available with the advent of

24
modern computing. The overriding assumption in this thesis, when analyzing the
microreaction devices in the context of chemical synthesis, is that numbering-up or
parallel synthesis is a viable route to scaling up a process. The motivation for this study
is to elucidate those chemical processes which could be suitable for parallel synthesis and
to demonstrate a microreaction unit with sufficiently superior performance that process
intensification is justified.
In addition to chemical synthesis, microreaction systems have the potential to
improve the investigation of chemical processes. One way is to improve the efficiency of
experimentation by increasing the through-put of data collection and analysis. The high-
throughput screening of catalysts is such an example and has received considerable
attention recently.[20-23] Another way is to eliminate the effects of heat and mass
transfer in disguising the true kinetics of a fast exothermic chemical reaction. Yet a third
benefit is the ability to work with small volumes of reagents. For a pharmaceutical
intermediate, the reagent can be in short-supply, or for a toxic chemistry the small
volumes can make the investigation safer.
It is the ability to define microscopic geometries with high surface area to volume
ratios which makes microreactors attractive to a host of chemical processes. Multiphase
processes specifically, could benefit because mass transport across phase boundaries is
often the limiting step in a reactive process. On an industrial scale, multi-phase reactors
have a wide variety of designs. The choice of design depends on several variables,
including the scale of the operation, the nature of the catalysts involved, and the severity
of mass transfer limitations.

25
1.3 Background on Multiphase Chemical Processes
Many of today’s chemical reaction processes involve multiple phases, and the
value of chemical products generated by multiphase reactor technology has been
estimated at over $600 billion annually.[24] Most multiphase processes are those
involving the reaction between a gas phase and a liquid phase. The reaction between two
immiscible liquids, or a solid reacting with a gas or liquid could also be considered
multiphase, but occur less frequently. The reasons for having to react a gas and liquid
phase vary. In the case of petro-chemicals or specialty chemicals, the costs associated
with heating the liquid to the gas phase may be too high, especially if the reaction is
carried out at elevated pressures or the hydrocarbon has limited volatility. For
pharmaceuticals, the liquid reactant of interest may decompose before it volatilizes.
Reactions between gases and liquids are ubiquitous throughout chemical processes
ranging from absorption processes (scrubbing CO2 into amine solutions) to reactive
(chlorination of aromatics). The reactions can either be homogeneously catalyzed, as in
the case of chlorinations where the catalyst is a Lewis acid such as FeCl3 dissolved in the
substrate, or heterogeneously catalyzed, such as catalytic hydrogenations using noble
metals dispersed on inert porous materials.
The reactors available for carrying out these gas-liquid reactions vary from co-current
and countercurrent bubble column reactors to highly agitated slurry batch reactors.[25]
The principle consideration in all cases though, is the rate of transport of the gaseous
reactant into the liquid. It is this transport process which may ultimately limit the rate of
conversion as opposed to the intrinsic kinetics of the chemical reaction itself. Affecting
this rate of transport has been the subject of immense study.
26
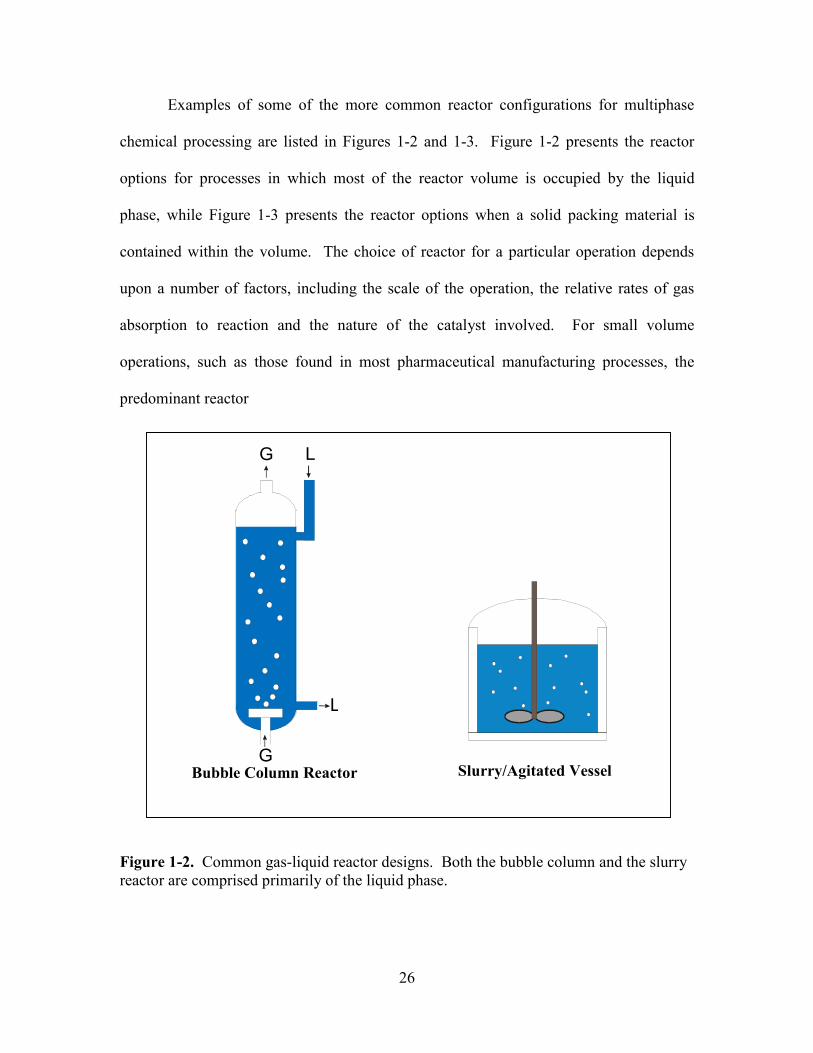
Examples of some of the more common reactor configurations for multiphase
chemical processing are listed in Figures 1-2 and 1-3. Figure 1-2 presents the reactor
options for processes in which most of the reactor volume is occupied by the liquid
phase, while Figure 1-3 presents the reactor options when a solid packing material is
contained within the volume. The choice of reactor for a particular operation depends
upon a number of factors, including the scale of the operation, the relative rates of gas
absorption to reaction and the nature of the catalyst involved. For small volume
operations, such as those found in most pharmaceutical manufacturing processes, the
predominant reactor
Figure 1-2. Common gas-liquid reactor designs. Both the bubble column and the slurry reactor are comprised primarily of the liquid phase.
G L
G
L
Bubble Column Reactor Slurry/Agitated Vessel

27
choice is the agitated vessel or slurry reactor. However, continuous reactors have several
advantages for miniaturization, as will be discussed in the next chapter.
Continuous industrial multiphase reactors are usually classified according to their
flow dynamics.[26] In trickle bed reactors, for example, the volume of the reactor is
predominantly the gas phase and the liquid forms a thin film around the catalyst pellet.
This contrasts with the bubble column reactor, where the predominant phase is liquid and
the gas is dispersed as bubbles throughout the volume, or the packed bubble column
Figure 1-3. Common multiphase packed-bed reactor designs. The trickle-bed reactor is primarily filled with the gas phase, but flow can either be co current or countercurrent with gas flow either upward or downward.
reactor where the predominant phase within the reactor is the liquid phase. A wide range
of variations on these designs exist, all intended to better promote the mixing between the
G
L
L
G
G
L
L
GTrickle-bed reactor, co-current or counter-current flow
Packed Bubble Column Reactor

28
gas and liquid phases. The designs for the bubble column reactors aim to produce large
packets or trains of small diameter bubbles; preventing the coalescence of the gas is
tantamount to maintaining a high interfacial area between the two phases. It is this
interfacial area which determines the rate of transport into the liquid phase for a given
flux. For this reason, the reactor is designed to maximize the interfacial area. The jet-
loop reactor, for instance, is an extreme example of achieving high-levels of gas-liquid
dispersion and mass transfer. The high velocities produced come at the expense of high
power consumption, but the mass transfer is the highest of the various reactor types.
The packed column reactors are either filled with an inert material or filled with a
catalyst which plays an active role in the reaction process. The heterogeneous reaction
requires that both the liquid phase and the gas phase reactant adsorb onto the surface of
the active catalyst. The active catalyst is usually contained within the pores of an inert,
high surface area material and so there is an additional opportunity for transport
limitations within the pores of the catalytic material. Mass transfer limitations become
compounded as transport of the gaseous reactant is hindered by its adsorption into the
liquid, its diffusion and transport with the liquid to the catalyst, and then finally within
the pores of the catalyst itself. Because of the multitude of mass transfer resistances,
these three-phase, gas-liquid-solid reactions present the greatest opportunity for making
improvements in mass transfer through engineering at the micro-scale. The
microreactors presented in this thesis involve heterogeneously catalyzed gas-liquid
reactions and their behavior more closely resembles that of the three-phase packed-
column, or trickle-bed reactors.

29
1.3.1 Trickle-Bed Reactors
Trickle-bed reactors have generally found application in large scale petro-
chemical processing and there has been a large body of knowledge collected over the last
several decades. [27-31] The reactor consists of a column ranging in diameter from 5 cm
(laboratory scale) to several meters (industrial scale) filled with catalyst pellets or
cylinders ranging in size from 4-10 mm in diameter. The gas and liquid phases can flow
either co-currently or counter-currently, but the liquid flow is down through the packing.
The flow relies upon gravity to pull the liquid downward and relies upon capillary action
to distribute the liquid through the porous solids pellets. Because of the relative volume
fractions of the phases, the liquid ‘trickles’ through the packed-bed.
Challenges in designing trickle bed reactors include reducing pressure drop,
achieving a uniform distribution of the fluids within the reactor, and reducing internal and
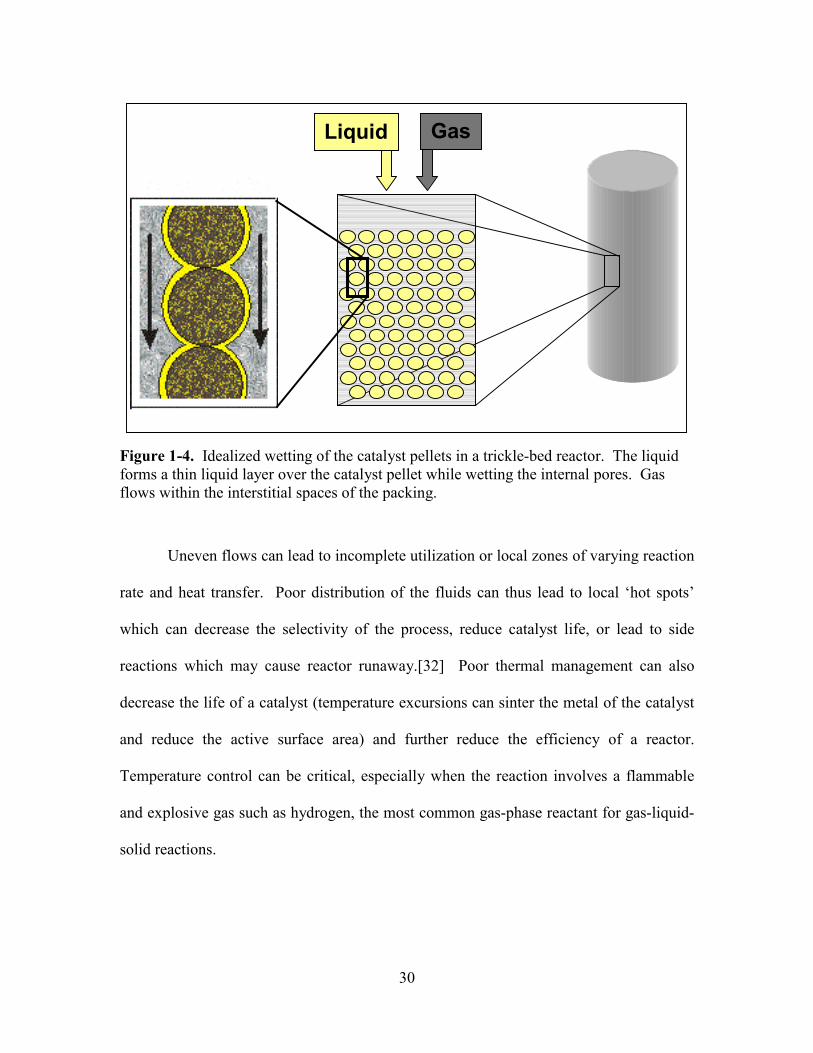
external hindrances to mass transport. Figure 1-4 depicts the ideal configuration of the
phases for a catalyst particle in a trickle-bed reactor. The liquid forms a thin film over
the catalyst through which the gas must diffuse in order to react at the solid surface.
Deviations from this ideal configuration include partial wetting of the catalyst particle,
partial drying of the catalyst particle (where some volume of the catalyst contains only
the gas phase) or increases in the thickness of the liquid layer due to macro scale flow
distribution. This variation from ideal conditions is characterized as the ‘wetting
efficiency’ of the trickle bed and can impede performance in addition to all the other
mass transfer resistances.
30
Figure 1-4. Idealized wetting of the catalyst pellets in a trickle-bed reactor. The liquid forms a thin liquid layer over the catalyst pellet while wetting the internal pores. Gas flows within the interstitial spaces of the packing.
Uneven flows can lead to incomplete utilization or local zones of varying reaction
rate and heat transfer. Poor distribution of the fluids can thus lead to local ‘hot spots’
which can decrease the selectivity of the process, reduce catalyst life, or lead to side
reactions which may cause reactor runaway.[32] Poor thermal management can also
decrease the life of a catalyst (temperature excursions can sinter the metal of the catalyst
and reduce the active surface area) and further reduce the efficiency of a reactor.
Temperature control can be critical, especially when the reaction involves a flammable
and explosive gas such as hydrogen, the most common gas-phase reactant for gas-liquid-
solid reactions.
Liquid Gas

31
1.3.2 Hydrogenation Reactions
The most common chemistry for gas-liquid-solid reactors is the heterogeneously
catalyzed hydrogenation reaction. Hydrogenation reactions span all scales of chemical
production, from pharmaceuticals to commodity chemicals. Numerous examples abound.
Within petrochemicals at the large scale, hydrogenation is used to convert malaeic
anhydride to 1,4-butanediol. In 1994, 300,000 metric tons of 1,4-butanediol was
produced, primarily as the feedstock for making tetrahydrofuran (THF), a common
industrial solvent. [33] Within pharmaceutical and fine chemicals, nearly 20% of all
synthetic steps are catalytic hydrogenation.[34] For example, the hydrogenation of
glucose to sorbitol is used in the synthesis of vitamin C; 30% of the steps in the
manufacture of Vitamin E are catalytic hydrogenations. Another example is the catalytic
hydrogenation of p-isobutylacetophenone, an intermediate in the process for ibuprofen.
The hydrogenation of nitro compounds finds use in the hydrogenation of 2,4-
dinitrotoluene to toluenediamine. Toluenediamine is reacted with phosgene (chapter 2)
to produce toluenediisocyanate(TDI), another important industrial solvent.
As a class of reactions, hydrogenations pose several challenges. Hydrogenations
are relatively exothermic (100-400 kJ/mol), so temperature control and thermal
uniformity can be important issues. Hydrogen has a low solubility in most liquids
causing the reactions to be limited by the concentration of hydrogen even for low
concentrations of the liquid reactant (the solubility of hydrogen in an organic solvent is
near 4×10⁻⁶ mol/cm3, while the liquid concentration is ~ 1×10⁻³ mol/cm3). As a result of
this low solubility, many hydrogenation reactions are operated at elevated pressures to
32
increase the solubility (often as high as 100 atm). The elevated pressures exacerbates the
explosion hazard of the hydrogen gas and complicates the equipment design for the
reactor.
Range of Reaction Rates
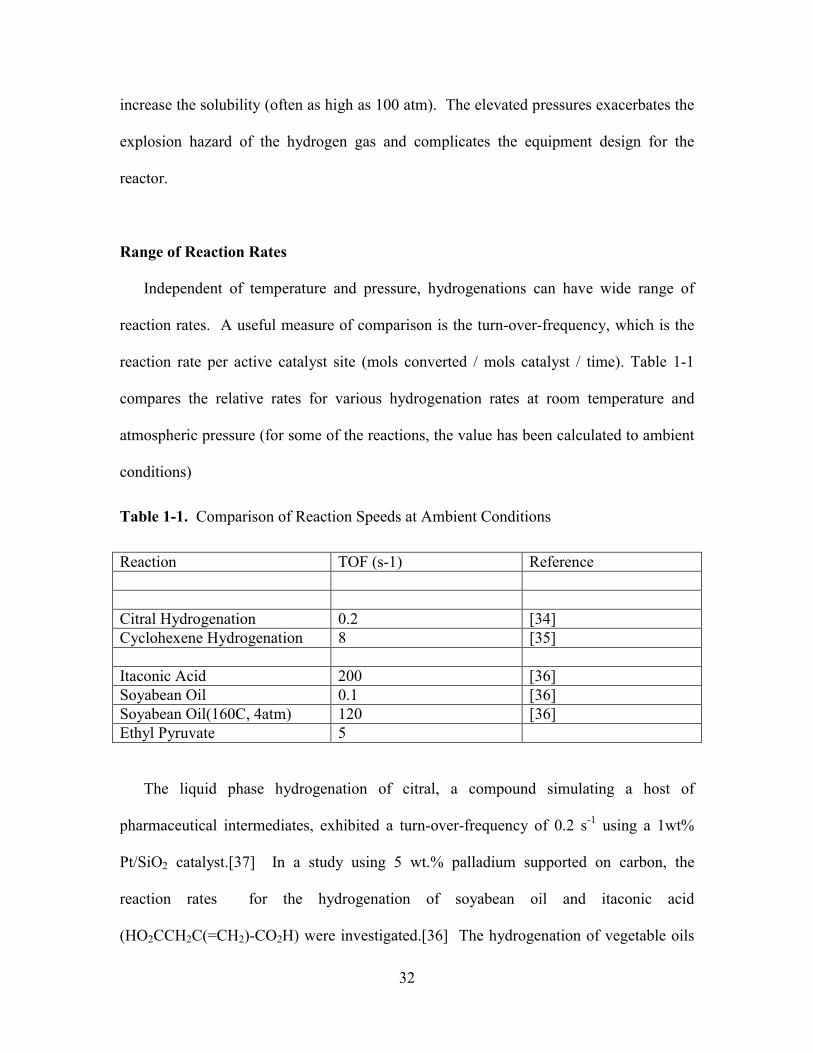
Independent of temperature and pressure, hydrogenations can have wide range of
reaction rates. A useful measure of comparison is the turn-over-frequency, which is the
reaction rate per active catalyst site (mols converted / mols catalyst / time). Table 1-1
compares the relative rates for various hydrogenation rates at room temperature and
atmospheric pressure (for some of the reactions, the value has been calculated to ambient
conditions)
Table 1-1. Comparison of Reaction Speeds at Ambient Conditions
Reaction TOF (s-1) Reference Citral Hydrogenation 0.2 [34] Cyclohexene Hydrogenation 8 [35] Itaconic Acid 200 [36] Soyabean Oil 0.1 [36] Soyabean Oil(160C, 4atm) 120 [36] Ethyl Pyruvate 5
The liquid phase hydrogenation of citral, a compound simulating a host of
pharmaceutical intermediates, exhibited a turn-over-frequency of 0.2 s-1 using a 1wt%
Pt/SiO2 catalyst.[37] In a study using 5 wt.% palladium supported on carbon, the
reaction rates for the hydrogenation of soyabean oil and itaconic acid
(HO2CCH2C(=CH2)-CO2H) were investigated.[36] The hydrogenation of vegetable oils

33
is a prevalent example of large-scale hydrogenation reactions and soyabean oil is a
representative triglyceride. Triglycerides require partial hydrogenation for the
manufacture of edible oils because the unsaturated oils (containing carbon-carbon double
bonds) are subject to oxidation resulting in short shelf-lives. At room temperature the
rate of reaction for the triglyceride hydrogenation is relatively slow (TOF calculated to be
0.1 s-1). For this reason, the reactions are run at elevated temperatures and pressures
where the reaction rates are considerably faster. At these elevated conditions, the
reactions are reported to be limited entirely by the diffusion, or mass transfer, of
hydrogen.[36] The hydrogenation of cyclohexene, the model reaction performed in this
study, is moderately fast with a TOF = 8 s-1.
1.3.3 Previous Micro Trickle-Beds
The construction of a ‘micro’ trickle bed reactor has been illustrated by Germain et al.
for precisely the reason of eliminating mass transfer limitations.[38] The particle size of
the catalyst was in the range of 100-200 µm and the reaction investigated was the
catalytic hydrogenation of glucose to sorbitol. Although few details have been published,
this is the only example of a reactor employing catalyst particle sizes smaller than a
millimeter.
A cross-flow sandwich structure has been investigated for improving gas-liquid mass
transfer. The reactor design was found to have better mass transfer performance relative
to a conventional packed bed, although specific mass transfer coefficients were not
provided.[39] This provides another example of the extremes to which reactors will be
designed in order to alleviate mass transfer limitations.

34
1.4 Motivation for Microscale Multiphase Chemical Processes
Multiphase reactions present a unique opportunity for microfabricated reactors.[14]
In addition to efficient thermal control, these systems have the added complexity of
forcing a reactant of one phase to mix, diffuse, and react with that of another. For fast
gas-liquid-solid reactions, the chemical kinetics are often limited by the mass transfer rate
of the gaseous species through the liquid to the surface of the catalyst. As a class of
reactions, hydrogenations represent a typical and ubiquitous gas-liquid-solid reaction.
Hydrogen is reacted with an organic substrate over a supported noble metal catalyst in
either a slurry reactor or in a packed bed arrangement. The limited solubility of hydrogen
in organic substrates and solvents makes mass transfer a primary concern.[26]
Consequently reactions are often operated at high pressures, sometimes as high as 100
atmospheres[30]to increase the reaction rate and offset the low hydrogen solubility.
However, in that case the explosion potential requires extreme safety measures.
The opportunity for microreaction systems to impact multiphase reactions has been
recognized by other investigators.[40-45] The novelty of the present work is 1) the
presence of the heterogeneous catalyst (which provides another opportunity for
improving mass transfer), 2) the use of silicon micromachining and the integration of
sensor functionality, and 3) the engineering of microstructural features within the reaction
channels to manipulate gas-liquid flow and increase the interfacial gas-liquid contact
area.

35
1.5 Thesis Objectives
The objectives of this thesis are to investigate novel chemical reactor designs for
multiphase reactions which are enabled by microfabrication methods. Multiphase
reactions which specifically focus on reactions between gas and liquid phases are
emphasized because the gas-liquid interface presents a resistance to mass transfer. This
resistance can be mitigated by engineering at the micro scale by reducing the length of
diffusion and increasing the total contact area of the interface. One goal is to demonstrate
improved mass transfer such that improved overall reaction rates can motivate the use of
microreactor systems for chemical synthesis. Another goal is to study the behavior of
two-phase flows in microfluidic devices to provide a greater understanding of the
engineering of microdevices for multiphase applications. Yet a third goal is to create
entirely novel reactor designs which have not previously been considered in the chemical
engineering literature because the fabrication technology (silicon microfabrication) has
not been available.
1.6 Thesis Outline
Having outlined the relevant previous work on microfabricated chemical reactors,
particularly those for multiphase gas-liquid reactions, the rest of this work will focus on a
number of devices for multiphase systems, their design, fabrication, and characterization.
Chapter 2 begins with a study of mixing liquids in a microchannel device. The results of
that study provide the backdrop and motivation for the design of the first single channel
multiphase reactor. As a demonstration of the ability to incorporate catalysts and carry
out hazardous reactions in a controlled fashion, the gas-phase synthesis of phosgene is

36
conducted in this single channel reactor. Within chapter 2, the experimental methods for
most of the thesis are described, including the packaging of the reactor chip and the
physical set up for the experiments. Chapter 3 presents the design and fabrication of the
10 parallel channel, or multi-channel reactor, which is a logical extension of the results
from chapter 2. In addition, several features are added, including thin film resistors for
heating and temperature control. Chapter 3 contains much of the thermal characterization
for the devices. After describing the design of the two principal devices, chapter 4 details
the experimental results for the catalytic gas-liquid hydrogenation of cyclohexene.
Pressure drop, multiphase fluid dynamics, and reaction rate results are described. Using
this model reaction, the mass transfer for gas-liquid absorption is characterized in chapter
5. The final reactor design presented in chapter 6 is that of the microstructured or
integrated catalyst reactor. This device, more so than the previous two, is an original
design enabled by microfabrication. Chapter 7 provides the results for gas-liquid two-
phase flow phenomena in these microstructured reactors. Chapter 8 summarizes the
results for the reactors of this thesis and provides a comparison with industrial reactors.
Chapter 9 finishes the thesis with conclusions and opportunities for further study.

37
2. “Single-channel" Reactor Design and Applications
2.1. From Gas-Phase to Liquid Phase: Background for the first design
The gas phase membrane microreactor depicted in Figure 2-1, designed and tested
by Ravi Srinivisan throughout 1995-1997, is one of the first MEMS microreaction
devices ever constructed. [46] Designed to carry out high temperature gas-phase
reactions, it consists of a membrane heated with thin-film platinum resistors, a thin
platinum film as
Figure 2-1. Membrane microreactor illustrating the integration of multiple thin film heaters and resistive temperature sensors onto a chip for the gas-phase partial oxidation of ammonia. Courtesy R. Srinivasan.
20 mm

38
catalyst, and a ‘T’ geometry for mixing two reagents on chip. Two issues are of
paramount importance for its influence on the design of subsequent microreactors: the
nature of the catalyst and the nature of the on-chip mixing. The issue of the catalyst
design will be revisited later in section 2-3. The issue of mixing is treated here briefly,
because it is represents the principal design feature required for reactors involving
condensed phases.
In order for any chemical reaction to occur between two different reagents, they
first have to mix, and if needed, be transported to a catalytic surface. For gases, the
process of mixing is fast, owing to their large binary diffusivities (D = 1-10×10-5 m2/s).
For the channel dimensions in the gas-phase microreactor (500 µm), the characteristic
time for diffusion (τD=L2/D) is 25 milliseconds. Furthermore, Reynolds numbers are
low so that the flow is laminar and mixing occurs without the aid of turbulent convection.
According to Srinivisan,[47] the rate of the reaction and the required residence time is
such that the gas phase is a homogeneous mixture once the flow reaches the catalytic
portion of the reactor. Hence a simple geometry such as a mixing ‘T’ is sufficient to
react two gas-phase reagents.
The case for liquids is more complex. Binary diffusivities are much lower (D = 1-
10×10-9 m2/s). As a result, if two liquid reagents were to be mixed in the above reactor
geometry, several minutes would be required before the two liquids could be considered a
homogeneous mixture. The reaction would be hindered by the inability for the two
reagents to successfully transport in equal concentrations to the catalytic surface. Usually
one can depend upon turbulence to achieve rapid mixing in a continuous flow reactor.
However, at these small channel dimensions, turbulence is difficult to achieve. To

39
address this micromixing problem, several strategies have emerged based on short
diffusion lengths and numerous studies have been performed on mixing liquid reagents in
microfabricated devices.[48-52] The goal is to reduce diffusional lengths and generally
this is done by splitting up and interleaving the inlet streams. Another strategy, with an
added level of fabrication complexity, makes use of chaotic advection.[53, 54] The
utility of this latter approach is unclear, as the devices are complicated in construction.
Most of the micro-mixer designs, in one form or another, take advantage of the
dependence of the diffusional mixing time upon the square of the characteristic length.
The streams to be mixed are contacted in such a way that the contact area between the
streams is large and the width of the streams is small. Since the diffusion time scales
with the square of the length, mixing times can be quite rapid when the length for the
diffusion is on the order of microns.
Using the liquid phase microreactor designed and fabricated by T. Floyd[48],
mixing characterization was performed and the principle of multilaminar mixing was
studied. Liquid-phase mixing studies were performed as part of this thesis in order to
understand mixing strategies before designing devices for more complicated multi-phase
flows. Figure 2-2 is a top-view of the microreactor, showing how the fluids enter radially
aligned inlet ports and flow through the device. The liquid-phase microreactor achieves
rapid mixing of the reagents by dividing the reagents into multiple laminar streams and
then contacting the streams such that the contacting area is maximized. The two
reagents to be reacted are first split into five laminar streams each. These streams are
contacted and then focused into a narrow (50 µm) channel. By focusing these laminar

40
streams into a narrower channel, the length scale for diffusion is shortened even more.
The channels are etched into a silicon layer and a glass layer caps the channels from the
top. Fluids enter the device from ports underneath the device located at the ends of each
of the streams.
Figure 2-2. Liquid micromixer design. Two sets of radially aligned inlets split and interleave two mixing liquid reagents. The streams are then focused to a narrow 50 µm wide channel for reaction and analysis.
30 m
m
Inlet Ports for
Inlet Ports for
Focussing Region
Outlet Port
50µµµµm

41
Figure 2-3. Experimental visualization of an acid-base reaction in the liquid-phase micromixer. Red streams contain phenol red pH indicator at pH 8(red), yellow streams contain 0.1M HCl. The diffusion of the acid into adjacent streams is dictated by the flow rates.
A) Liquid flow rate = 0.05mL/min. B) Liquid flow rate = 0.2 mL/min.
This method extends the concept of mixing by lamination by contacting 10
laminar streams in a single pass.[55] Moreover, the high aspect ratio of the channels
allows for higher throughput of reactants, which is desirable for chemical synthesis. As a
A
B

42
qualitative assessment of mixing versus flow in the device consider figures 2-3A and 2-
3B. A pH indicator, phenol red, is mixed with an acid at a low flow rate (0.05mL/min).
As the acid diffuses into the adjacent stream, the pH drops below the color transition
point of the indicator and the color changes from red to yellow. By increasing the flow
rate, and hence reducing the time that acid has to diffuse into the adjacent streams at a
given point, the extension of the red (unmixed portion) streams is increased.
As a more quantitative assessment, acid-base reactions, coupled with fiber optics and
UV-visible spectroscopy were used. Monitoring the absorbance of a pH indicator with an
acid base reaction is a commonly used method for assessing the mixing behavior. Since
the acid-base reaction is fast, the kinetics, as measured through the absorbance of the pH
indicator, is controlled by the mixing of the reagents. Figure 2-4 is an experimental
visualization of laminated mixing streams. Phenol red indicator in phosphate buffer
solutions at pH = 6.8 and pH = 8.0 produce the yellow and red streams respectively. At a
discrete point down the length of the reactor, the absorbance is measured as a function of
flow rate. Figure 2-5 is a UV-VIS spectra of the two buffer solutions fed independently
to the reactor, as well as the spectra for the mixing of the two reagents at equal flow rates.
Because the signal collected is averaged over the entire width of the channel, a reaction is
necessary to assess mixing. Simply using a dye in one of the streams would be
insufficient because the average concentration would be the same before and after
mixing. For these experiments, both streams contain the same concentration of the
phenol red indicator; it is the diffusion of the acid which causes the color change. Figure
2-6 shows the decay of the absorbance for the red indicator as a function of the contact
time.

43
Figure 2-4. Experimental visualization of laminar flow with two reagents for UV-Vis mixing characterization (buffered phenol red pH 8.0 and 6.8).
Figure 2-5. UV-VIS spectra collected in the microreactor. The pH 8.0 reagent has an absorbance maximum at 560 nm. When mixed with the pH 6.4 reagent, the absorbance at 560 nm decays due to the acid base reaction and the transition of the color pH indicator. In this way, the mixing is quantitatively assessed.
50µµµµm
0
0.5
1
1.5
2
2.5
360 410 460 510 560 610 660Wavelength (nm)
Abs
orba
nce
Uni
ts (A
U)
Reagent #1
Reagent #2
Mixed Reagents via Micromixer

44
The contact time here is defined as
where Q is the volumetric flow rate, As is the cross-sectional area of the channel and L is
the length down the channel at which the absorbance is collected. As the flow rate is
decreased, the time at which two adjacent streams have been allowed to contact and mix
is increased. The absorbance decays as a result of the acid-base reaction, which is a
result of the mixing. The extent of mixing is a parameter than can be defined to assess
the relative degree of mixing, since complete mixing, in the mathematical sense, would
only occur for a flow rate of zero. The absorbance of a solution premixed with both
reagents in equal amounts is defined as 100% mixed. The absorbance of the red reagent
flowing through the reactor in the absence of reaction is defined as 0% mixed. The
measured absorbance is used to calculate the extent of mixing based on this linear scale.
Using the data cited above, the acid-base reagents are 90% mixed for a contact time of 10
milliseconds in the microreactor. This compares favorably to the characteristic diffusion
time of 6 milliseconds (assuming L = 2.5 µm, 1×10⁻⁹ m2/s).
The conclusions resulting from this study of diffusion and reaction in continuous
flow microreactors influenced the choice of design for the multiphase reactors in a
number of ways. First, since flow is entirely laminar, the method of splitting reagents
into multiple laminar streams and interleaving them to reduce diffusional lengths is a
successful strategy at the micro scale. Second, from a fabrication standpoint, deep
reactive ion etching allows high aspect ratio channels which can produce deep, narrow
streams for optimal contacting. The fabrication layout for the multiphase reactors is an
QAL s
contact⋅=τ

45
extension of the liquid microreactor fabrication: deep etching channels in silicon and
capping them with a layer of glass.
Figure 2-6. Absorbance decay as a result of mixing. The absorbance peak at 563nm is tracked versus flow rate and position along the microreactor. As the extent of mixing increases with increased contact time, the absorbance decreases to a steady mixed value (see Figure 2-5). Error bars represent one standard deviation with 3 samples per data point.
0.690.710.730.750.770.790.810.830.850.870.89
0.00 0.10 0.20 0.30 0.40 0.50
Contact Time (seconds)
Abs
orba
nce
at 5
63nm

46
2.2. Single channel reactor design
The design of the single channel reactor was influenced by two principal
considerations: the capabilities of existing fabrication processes and the nature of the
chemistry. For heterogeneously catalyzed reactions, the high surface areas of traditional
porous supports allow for a greater dispersion of the active surface sites and
consequently, a higher reaction rate per volume of support. For reactions of moderate
rate, such as some hydrogenations, processing in small volumes demands the highest
attainable active surface area in order to have a practical reactor throughput. Planar metal
films, while easy to integrate using thin film methods, can not attain the same active area
through geometry alone. So while thin film catalysts are sufficient for fast gas-phase
reactions such as ammonia oxidation, higher surface area catalysts can extend the range
of applicable reactions in the microenvironment. For the planar platinum film of the gas-
phase reactor with dimensions of 500 µm X 1 cm, the active surface area is on the order
of 0.5 cm2, not accounting for surface roughness which would increase this value slightly.
In a 3-D configuration of porous catalyst particles (1wt% platinum supported on a porous
alumina) with active surface area of 0.6 m2/g, the metal surface area is 30X larger at 15
cm2 (assuming the same geometry with a height of 500 µm and a packing density of 1
g/cm3). The surface area of metal available for reaction is higher with the porous particles
even though there is more metal by weight with the thin film deposition.
The advantage of using standard catalysts, such as noble metals supported on inert
porous materials is the readily available information on chemical kinetics. Catalyst
preparation becomes a matter of separating discrete particle size ranges and loading the
reaction channels. Common methods for fractioning powders into particle size ranges

47
using sieves exist and can separate particles as small as 30 µm. Uniformly sized
polystyrene particles sized 1-5 µm are routinely used in column packings for
chromatography applications.
Available photolithography methods enable features as small as 1 micron, so in
theory, a filter structure could be built to allow the packing of particles this small. The
first design feature in order to accommodate micron size particles is to create such a filter
structure for capturing particles and retaining them within the device while allowing
reactants to flow continuously through the packed bed. Several designs are available for
microfabricated filters. [56-58] The method employed hear was to create an array of
columns fabricated simultaneously with the main reaction channels. Figure 2-7 illustrates
the design choices for a microfabricated filter, accounting for the etch variation
associated with different sized features. Depending upon the specific etch process,
features with a smaller critical dimension etch slower than larger features due to
diffusional limitations of the gas-phase products. The greater the disparity in feature
sizes (such as that between the 625-µm-wide reaction channel and the 25-µm-wide filter)
the greater the difference in etch depths. The critical issue in choosing the appropriate
size for the packing material is the pressure drop.

48
Figure 2-7. Design options for microfabricated filter structure. Smaller gaps (bottom) necessitate shorter etch depths and a greater disparity in depth between the filter unit and the reaction channel.
For microreaction systems in general, the engineering design challenge is to balance
the gains made in heat and mass transfer against the losses in pressure drop. The pressure
drop for a packed bed of spherical particles can be estimated from the Ergun equation,
]G75.1D
)1(150[)1(DG
LP
p3
p
+−−=∆ µεεε
ρ
(2-1)
500 µm Pyrex
300 µm deep channel
25 µm gaps
1-5 µm

49
or
3p
2
32p
2 )1(D
G75.1D
)1(G150LP
εε
ρρεεµ −+−⋅=∆
(2-2)
where G is the superficial mass velocity, ε is the void fraction, Dp is the particle diameter,
µ is the viscosity and L is the length of the packed bed.[59] For the relatively small
velocities in this work, the second term is negligible. Substituting G with the volumetric
flow rate Q, the cross-sectional area of the reactor, As, and the density, gives the
following functional dependence:
3
2
s2
p εε)(1
AdQµ
L∆P −⋅
⋅⋅∝
(2-3)
As an example, for a flow rate of 0.5 mL/min, and the cross-sectional area of the
reactor(width=625µm, depth =300µm), the superficial velocity is ,U = 4.44 cm/s.
Using the following values in the Ergun equation (2-1), ε = 0.4, µ = 0.012 g/(cm s), Dp =
64 µm, and ρ = 0.8 g/cm3, gives ∆∆∆∆P/L = 0.11 MPa / cm
Table 2-1 contains the calculated pressure drops for various sized particles. The channel
geometries are the same as above with a bed length of 2 cm and a flow rate of 0.1
mL/min.

50
Table 2-1. Calculated Pressure drops for based on Erguns equation.
Particle Diameter Pressure Drop
64 µm 0.044 MPa
5 µm 7.2 MPa
1 µm 180 MPa
What becomes apparent is that for particles smaller than 10 µm, the calculated pressure
drops are beyond practical feasibility. Particles, 5 µm in diameter, in this geometrical
arrangement would have a pressure drop of 7.2 MPa or nearly 1000 PSI! As will be
shown later, the actual flow rates required for an appreciable rate of conversion is slightly
reduced at 0.01 mL/min. This would reduce the pressured drop by a factor of 10, but
even so, the pressure drop would become unmanageable. Later in this chapter,
experimental values for the pressure drop are measured in a microchannel and the Ergun
equation is shown to apply, even at this reduced scale.
Consequently, the pressure drop sets the lower limit of particle sizes for a given
geometrical configuration and flow conditions. The upper limit for particle sizes is set by
the need to eliminate channeling and flow maldistributions at the walls of the packed bed.
As the particle size approaches some fraction of the channel diameter, void spaces
become uneven at the walls causing flow to channel near the walls rather than through
the packed-bed. Although, there is no universal rule for defining the ratio of channel
diameter to particle size, a value of at least 6-10 is often used. [60] Therefore, for a
channel height of 300 µm, a particle size of 50 µm would be at the upper limit for a ratio
of 6.

51
Having determined that the optimal particle diameters for pressure drop would be
in the range of 50 microns, the filter structure designed included columns 40 µm wide
with a spacing of 25 µm. Figure 2-8 depicts the exit portion of the channel along with a
scanning electron micrograph of a cross-section of the reaction channel with the filter
unit. The etch non uniformity of the process can be seen as the depth in the 25 µm gaps
is not the same as the main reaction channel (625 µm).
Figure 2-9A illustrates the inlet portion of the reactor. Gas and liquid inlet flows
are split among several 25-µm-wide channels which meet at the main reaction chamber
which is 625 µm wide. Perpendicular to these inlet channels are two 400µm wide
channels used for delivering the catalyst slurry. Figure 2-9B is a scanning electron
micrograph of a cross-section of the inlet channels where they meet at the main reaction
chamber. At the outlet of the 2-cm-long reaction chamber is a series of posts etched in
the silicon which are used to retain the packing material. Figure 2-10 is a photo
micrograph of the single channel reactor filled with activated carbon catalyst.

52
Figure 2-8. Reaction channel outlet design. A) Schematic indicating the position of the filter unit immediately upstream of the exit port. B) SEM of a cross-section of the filter stucture.
Catalyst Filter Exit Port
Reaction Chamber
A
50 µµµµm
B

53
Figure 2-9. Single-channel multiphase microreactor inlet design. A) Schematic indicating the design for splitting a single gas inlet into 4 streams, a liquid inlet into 5 streams, and interleaving the inlet streams until they meet at the reaction channel. B) SEM cross-section of 9 inlet channels.
LiquidInletsGas Inlets
Catalyst Inlets
625µ
m
A
B
50 µµµµm
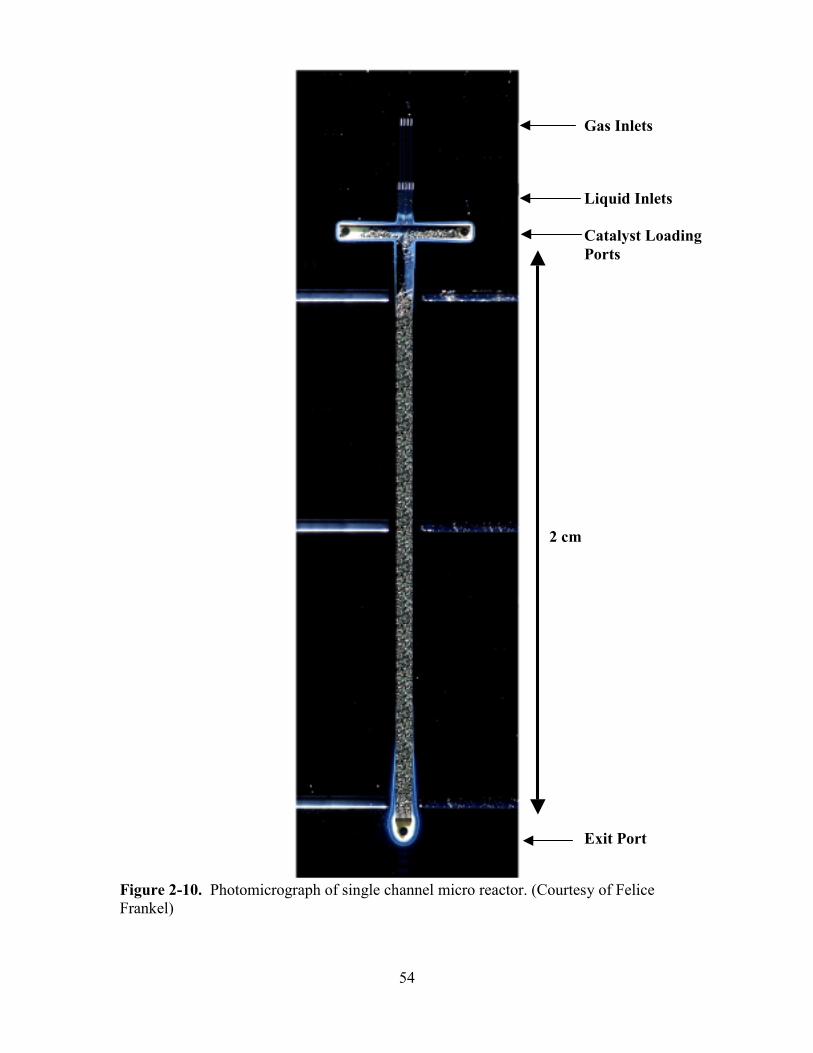
54
Figure 2-10. Photomicrograph of single channel micro reactor. (Courtesy of Felice Frankel)
2 cm
Gas Inlets
Liquid Inlets
Catalyst Loading Ports
Exit Port

55
2.3. Single Channel Reactor Fabrication
Details for the fabrication process can found in chapter 3, but are described here
briefly. The fabrication process for the single channel reactor involves two etch steps and
an anodic bond. The topside channels are first formed in the silicon substrate by using a
time-multiplexed inductively coupled plasma etch process. [61] This etch process is the
key technology which allows the definition of small high-aspect ration features for all of
the devices of this thesis. The depth of the channels is controlled by timing the etch to
approximately 300 µm. As seen Figure 2-8, a loading effect in the etch process causes
the 25 µm wide channels to be approximately 20% more shallow than the main reaction
channel. The wafer is then patterned from the bottom side to allow ports to access the
various channels. The final step in the process is to cap the channels with Pyrex glass
using an anodic bond.[62] The wafer is then diced into twelve reactors 1.5 cm X 3.5 cm.
Prior to the anodic bond, the silicon wafer can be treated to a thermal oxidation in order
to coat the reaction channels with a protective silicon dioxide layer. The oxidation
improves the anodic bond process as measured by the reduced size of defects (non-
bonded areas).
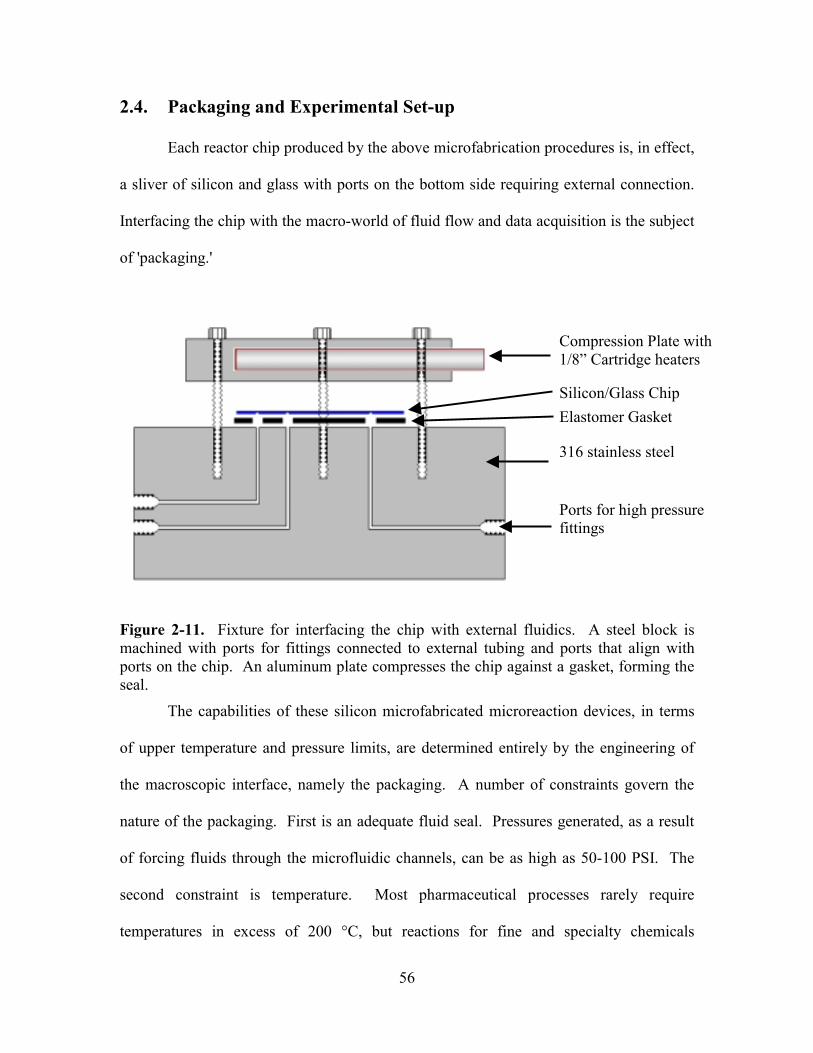
56
2.4. Packaging and Experimental Set-up
Each reactor chip produced by the above microfabrication procedures is, in effect,
a sliver of silicon and glass with ports on the bottom side requiring external connection.
Interfacing the chip with the macro-world of fluid flow and data acquisition is the subject
of 'packaging.'
Figure 2-11. Fixture for interfacing the chip with external fluidics. A steel block is machined with ports for fittings connected to external tubing and ports that align with ports on the chip. An aluminum plate compresses the chip against a gasket, forming the seal.
The capabilities of these silicon microfabricated microreaction devices, in terms
of upper temperature and pressure limits, are determined entirely by the engineering of
the macroscopic interface, namely the packaging. A number of constraints govern the
nature of the packaging. First is an adequate fluid seal. Pressures generated, as a result
of forcing fluids through the microfluidic channels, can be as high as 50-100 PSI. The
second constraint is temperature. Most pharmaceutical processes rarely require
temperatures in excess of 200 °C, but reactions for fine and specialty chemicals
Elastomer GasketSilicon/Glass Chip
Compression Plate with 1/8” Cartridge heaters
316 stainless steel
Ports for high pressure fittings

57
manufacture can require much higher temperatures. Another constraint is materials
compatibility. An all-glass interconnection method would be ideal for most cases, but
there is no convenient way to break and rejoin glass connections as there is with metals.
As such, the materials need to be compatible with a range of solvents and gases at
elevated temperatures.
Figure 2-12. Photograph of steel interface fixture. Left) arrangement of ports. Right) Assembled with microreactor and aluminum compression plate (with cartridge heaters).
The approach employed in this study was to use a compressed elastomeric gasket
to form the seal between the chip and a metal fixture with channels (1/32” diameter)
connecting to ports for standard high pressure metal fittings (Figure 2-11). O-rings were
attempted, but two shortcomings were apparent. One was that the force of compression
was unevenly distributed throughout the brittle silicon-glass chip, causing the chip to
break. The other shortcoming was the size of the o-ring itself. A design employing o-
rings would require ports with a spacing of at least 3-5 mm. When the size of the chip is
10 mm × 40 mm, this separation can be problematic when several connections need to be

58
made. On the other hand, a gasket that contains 1/16” diameter holes requires less
spacing between ports and provides a more even counter-force during compression. The
result of this approach for packaging is that the properties of the gasket material
ultimately determine the limitations of the reactor.
Figure 2-13. Assembled reactor package. Multichannel reactor is visible through plexiglass cover-plate allowing visualization of microchannel flow.
Figures 2-12, 2-13, and 2-14 show the experimental setup and packaging for the
micro packed-bed reactor. The silicon-glass reactor is compressed against a thin
elastomeric sheet (0.8mm thick Viton™) to form a fluidic connection to the stainless
steel base that was machined for standard high-pressure fittings. The cover plate, which
compresses the chip, can either be aluminum with cartridge heaters (3.2mm, 25watts,

59
Omega, Stamford, CT) for temperature control, or plexiglass for visualization.
Thermocouples (0.25mm, type K, Omega) are inserted into 400µm channels of the
microreactor. In-line pressure transducers (Omegadyne, Stamford, CT) connected with a
low-volume stainless steel 'T' type connector (Upchurch Scientific) measure the pressure.
A mass flow controller (Unit Systems) delivers the hydrogen while a syringe pump
(Harvard Apparatus PHD2000) delivers the liquid reactant. Fractions of the effluent are
collected and analyzed off-line using a Hewlett-Packard 6890 GC with a mass selective
detector. Flow visualization is obtained with the use of a Leica MZ12 stereomicroscope
connected to a Cohu CCD camera positioned directly above the plexiglass compression
plate.
Figure 2-14. Experimental set up. All fittings and tubing are 1/16" stainless steel.
Mass Flow Controller
H2 Sample
Syringe Pump
Pressure Sensors
Collection / Separation
Packaged Reactor
Thermocouple/ RTD Pressure

60
Although this approach for interfacing the chips is convenient in terms of testing
multiple devices, it nevertheless places severe limitations on the testing of the devices.
The gasket material determines the upper temperature limit (Tmax= 200 ºC for Viton,
Tmax= 300 ºC for Kalrez). The compression seal, as well as the fluids employed,
determine the upper pressure limit. The packaged reactor has been tested to 150 psi (10
atm) before a sudden leakage of hydrogen became significant. (Pmax = 10 atm)
We have loaded different materials into the microreactor including glass
microspheres (MO-Science Inc., MN), polystyrene beads, and catalyst powders. All
chemicals and catalysts, unless otherwise noted, were used as obtained from Sigma-
Aldrich (Milwaukee, WI). Using standard sieving equipment, a 50-75µm fraction was
filtered from the catalyst powder and a slurry formed using ethanol. The slurry was
delivered to the microreactor using the 400-µm-wide side channels (Figure 2-10). Once
the reactor was loaded with material, the catalyst inlets were closed by either substituting
a different gasket or capping the external fittings.
61
2.5. Pressure Drop Results
The pressure drop in the microreactors was first characterized for single phase
flow. For multiphase flows, predicting the two-phase pressure drop is considerably more
complicated, requiring a knowledge of the relative gas and liquid volumes in the reactor.
[31] The relative volumes of the two phases in the reactor volume are determined by the
fluid properties as well as the relative flow rates. Measuring the gas and liquid hold-ups
(the relative volumes occupied in the reactor) in the packed-bed microreactor is
problematic using conventional gravimetric methods. Optical microscopy is difficult for
the packed-beds owing to the 3-dimensional nature of the flow. In the microstructured
reactors of chapter 6, two-phase flow is more easily observed.
The single channel reactor was filled with 50-71 µm particles of glass and
activated carbon. For various flow rates of ethanol, the pressure was recorded and is
plotted in Figure 2-15. Figure 2-15 also compares the results for the single channel
reactor pressure drop with the Ergun equation. Differences between the experimental
values and the predictions are reasonable given the uncertainty in the void fractions for
the micro packed-beds. Thus, it appears that the use of the Ergun correlation can be
extended to microreactors.

62
Figure 2-15. Measured pressure drop for ethanol in a packed single-channel microreactor. The results compare favorably to the pressure predicted by the Ergun equation for a void fraction of 0.4. The error bars represent one standard deviation with 3 samples for each data point.
0
10
20
30
40
50
60
70
80
90
100
0 0.2 0.4 0.6 0.8 1 1.2
Flow Rate (mL/min.)
∆P (P
SIG
)
53-71µm Carbon53-71µm Glass SpheresErgun Equation, ε=0.4

63
2.6. Application of the Single Channel Reactor to the Synthesis of
Phosgene
2.6.1. Introduction
Candidate chemical systems for microreaction technology are those involving fast
and exothermic reactions. In addition, reactions that involve the production of toxic and
hazardous chemicals would benefit from distributed, on-demand synthesis. A portable,
miniaturized platform for generated these dangerous compounds would alleviate the risks
associated with storage and transportation. Furthermore, testing chemistries with these
compounds would be inherently safer if the amounts required for the experiment were
greatly reduced. The possibility of miniaturized plants for safer operations has recently
been reviewed.[63] Phosgene (COCl2, carbonyl dichloride), is such a toxic intermediate
used commercially in fine chemicals and pharmaceutical synthesis. Phosgene is
manufactured in the gas phase from chlorine and carbon monoxide using an activated
carbon catalyst:
Cl2 + CO COCl2 -∆H = 26 kcal/mol (1)
The reaction is fast and exothermic.[64, 65] The toxicity of phosgene is such that it was
used as a chemical warfare agent in World War I and has a lethal exposure limit to
humans of 400-500 ppm-minutes. Phosgene is produced commercially on a large scale
(3 billion pounds per year) for use in manufacturing isocyanates, polycarbonates,
polyurethane foams, pharmaceuticals and herbicides. Processes using phosgene require
specialized cylinder storage, environmental enclosures, pipelines, fixtures under negative
pressure, and significant preventative maintenance. These difficulties also apply to any

64
research involving phosgene. Moreover, phosgene is under a variety of transportation
restrictions. As a consequence, most phosgene is consumed at the point of
production.[66] Off-site production often necessitates out-sourcing not only the phosgene
synthesis, but also a set of sequential processing steps in order to get to a safe,
transportable compound. Microchemical systems stand to provide an opportunity for
flexible point-of-use manufacture of chemicals such as phosgene. Reactors operating in
parallel can be turned on or off as needed to maintain as close to zero storage as possible.
Single reactor failures would lead to extremely small chemical releases.
In this work, I present phosgene synthesis in a silicon based micropacked-bed
reactor as an example of the potential for safe on-site/on-demand production of a
hazardous compound. Preliminary productivity values are presented. The versatility of
microfabricated reactors is demonstrated for hazardous and corrosive gases such as
chlorine through the use of a glass-like protective coating that is formed during the
reactor fabrication process. The increased heat and mass transfer characteristics, which
provide inherent safety and increased productivity in chemical synthesis, are also
explored as advantages in the extraction of chemical kinetics. The pre-exponential factor
and apparent activation energy for phosgene formation are determined to demonstrate the
utility of micropacked-bed reactors as laboratory research tools.

65
2.6.2. Chemical Compatibility of Silicon/Glass
Chlorine reacts with silicon, particularly at elevated temperatures. Consequently,
microreactors made from silicon would be chemically attacked, eventually dissolving to
such an extent that reactor failure would occur. Figure 2-16A shows the deleterious
effects of reacting chlorine in a silicon device at 250 oC. The reactor inlets and channels
are severely etched. Note that the etching occurs in the vicinity of where the packed bed
of catalyst begins. This position is where the pressure, the concentration of chorine,
Figure 2-16. A) Silicon reactor after exposure to chlorine at 250 °C. B) Silicon reactor with 5000Å oxide layer after exposure to chlorine at 250 °C for 6 hours. The oxide layer prevents the etching of the silicon by the chlorine.
and the temperature are likely to be the highest with the fastest release of heat occurring
at the start of the reaction. Etching does not initiate directly at the inlets upstream,
suggesting that there is a temperature increase near the start of the packed-bed. In
contrast, the reactor with a thermally grown silicon oxide layer (Figure 2-16B) shows no
BA

66
visible change after 6 hours of continuous experiments. The advantages of silicon/glass
as a reactor material are evidenced through this high temperature reaction. Not only is
the silicon thermally conductive and capable of withstanding high temperature operation,
but the ability to deposit thin films of alternate materials extends the range of materials
compatibility.
2.6.3. Phosgene Reaction Results
No temperature increase could be measured upon switching flow from the bypass
line to the reactor. This thermal uniformity is expected because single crystal silicon has
a large thermal conductivity (150 W/m K) and readily dissipates heat from the packed-
bed. The thermal mass of the stainless-steel packaging is many orders of magnitude
larger than the reactor and provides a significant heat-sink. Likewise, the energy
provided by the cartridge heaters to maintain the temperature of the reactor/packaging is
orders of magnitude larger than the energy generated from the reaction. No deactivation
as reported by Shapatina et al.[67] was observed during the experimental time-scales (6-
10 hours) possibly due to the high level of purity in the gas feeds.[67] No side-products
were observed in a full mass spectrum scan, presumably as a result of suppressing hot-
spots common in larger reactors and using high purity feeds. Products such as silicon
tetrachloride, which would form if chlorine reacted with silicon, were also not detected.
The experimental results are summarized in Figure 2-17.
Isocyanates are derived from reactions of phosgene with amine precursors. The
reactions are highly exothermic, and selectivity towards the desired products is strongly
governed by reaction conditions, in particular, temperature.[65] Following a procedure

67
for the synthesis of cyclohexylisocyanate [68], phosgene generated by the microreactor at
complete conversion was used to drive a small bench scale experiment. Phosgene was
continuously bubbled through a solution of cyclohexylamine and toluene in a 50mL
reaction flask. Generation of cyclohexylisocyanate was demonstrated, with complete
conversion of the amine reactant. Even with volumes as small as 50 mL, the flask
temperature rose 50 oC without external cooling, severely impacting selectivity.
Integrating a microfabricated gas-liquid reactor performing the amine phosgenation with
the microreactor producing phosgene into a single microchemical system would give
better control over selectivity. Moreover, the phosgene would be consumed in the same
device as it is produced further reducing the hazards of working with the toxic
compound.
The apparent activation energy from the experiments of 7.6 kcal/mol compares
with the 8.6 kcal/mol reported by Shapatina et al.[69] The rate constants extrapolated
from the microreactor also favorably compare to the previously published values. The
data falls on a straight line, even at the higher temperatures, giving further evidence for
the lack of mass transfer limitations.
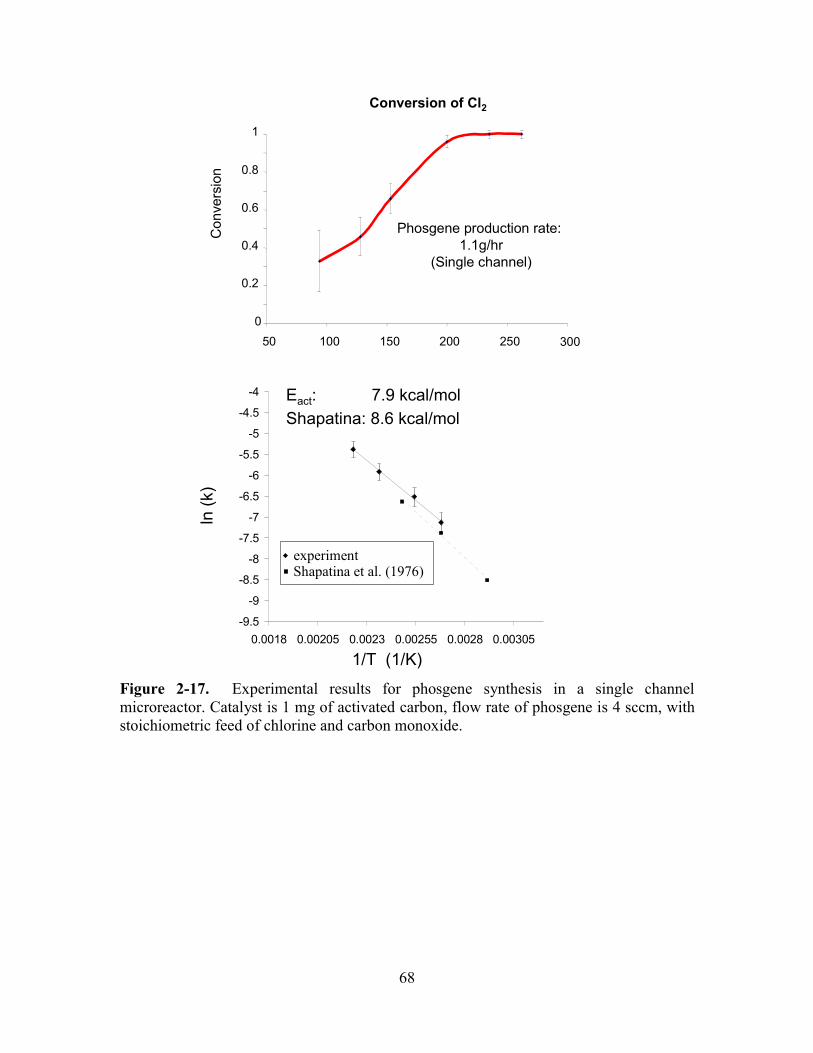
68
Figure 2-17. Experimental results for phosgene synthesis in a single channel microreactor. Catalyst is 1 mg of activated carbon, flow rate of phosgene is 4 sccm, with stoichiometric feed of chlorine and carbon monoxide.
0
0.2
0.4
0.6
0.8
1
50 100 150 200 250 300
Con
vers
ion
Phosgene production rate: 1.1g/hr
(Single channel)
Conversion of Cl2
experimentShapatina et al. (1976)
1/T (1/K)
ln (k
)
-9.5
-9
-8.5
-8
-7.5
-7
-6.5
-6
-5.5
-5
-4.5
-4
0.0018 0.00205 0.0023 0.00255 0.0028 0.00305
Eact: 7.9 kcal/molShapatina: 8.6 kcal/mol

69
2.7. Single Channel Reactor Summary
The first step in the design of the microreaction devices for heterogeneous
chemistries was the incorporation of the catalyst. It was determined that thin films of
catalytic materials, while active for some fast gas-phase reactions, would be insufficient
for some of the slower gas-liquid catalytic reactions. The simple approach to catalyst
integration was to incorporate conventional catalyst powders by using discrete particle
size fractions and loading into a device with a suitable filter. The dimensions for the
catalyst particles, as well as the dimensions for the reaction channel, were determined in
part by estimating the pressure drop using the Ergun equation. The measured pressure
drops matched very well with predictions.
The method of mixing the two reagent streams on chip was motivated by results
from a liquid-liquid mixing device. Interleaving laminated streams served to reduce the
diffusional length scale as well as provide an even distribution of the reactants at the start
of the reaction channel. Separate inlet channels were provided in order to load the
particles into the reaction channel. The entire device was packaged using the
compression of an elastomeric gasket to form the fluidic seal.
The gas-phase synthesis of phosgene was performed in the single channel reactor
with complete conversions achieved at 200 °C. The phosgene reaction is fast and very
exothermic, yet precise temperature control was achieved for the range of temperatures
investigated. The determined activation energy agreed with literature values, indicating
the absence of mass transfer effects. A thermal oxide layer on the silicon was sufficient to
prevent corrosion of the silicon by the chlorine gas.
70
3. "Multi-channel" Reactor Design
Two important conclusions regarding microreactor design come out of the single
channel reactor study. First, is the geometrical influence on pressure drop, the second is
the necessity for adequate reactor volume for practical throughputs. This chapter and the
design presented, is an extension of the last: multiple reaction channels are configured to
operate in parallel. The reasons for doing so are discussed as well as the modifications to
the fabrication process. The multiphase reaction involving catalytic hydrogenation is
introduced to analyze quantitatively the mass transfer characteristics of the microreaction
device. Gas-liquid flow behavior is characterized and compared with flow phenomena at
the macro scale.
Based on equation (2-3), for a given volume of packing with constant residence time,
a short, large diameter reaction channel would minimize the pressure drop. If reactions
are operated such that there are no mass transfer limitations, then the capacity for
conversion depends on the amount of catalyst and not on the specific geometry. The
problems with operating such a design are obtaining an even distribution of reactants
over the inlet diameter and controlling the temperature profile. Since the temperature of
most tubular reactors is controlled through the exterior radial walls, a large diameter
reactor will become increasingly hindered by radial gradients in temperature. Therefore,
splitting the flow into multiple channels so that the effective cross-sectional area is large
will ultimately reduce the pressure drop while maintaining the same reactor throughput
and high surface-to-volume ratio. Microfabrication methods have the potential for
efficiently realizing such a reactor design; one that reduces mass transfer limitations,
71
ensures thermal uniformity and employs a reactor geometry which reduces the pressure
drop.
3.1. Microfluidic Design
In order to construct a chemical system on a chip, the following features were desired:
a) the ability to mix multiple reagents, whether of the same phase or different phases b)
the ability to heat the reaction zone and measure the temperature and c) the ability to
incorporate catalytic activity whether by standard catalytic particles or integrated
catalytic layers. Two similar devices were designed toward this end. Both consist of
multiple reaction channels connected in parallel. In the first design, the channels (300
µm deep, 625 µm wide, 20 mm long) are empty and contain a filter structure near the exit
to retain a packed-bed of catalytic particles. The second device contains staggered arrays
of 50 µm columns within the channels to provide both catalyst support and static mixing.
This second device is presented in the next chapter. The results with the multichannel
packed bed reactors lends motivation for the microstructured reactor.
The first function for any of the reaction devices described in the present work is to
mix two reagents on-chip. The approach taken here uses the continuous flow split and
mix strategy. Mixing multiple phases, such as a gas and liquid, at the micro scale is more
problematic: interfacial forces cause the phases to rapidly coalesce. Keeping the fluids
dispersed in order to reduce diffusional length scales is considerably more difficult as
compared to mixing two liquids of similar physical properties. Nevertheless, improved
gas-liquid contacting has been demonstrated in this and other microchannel
applications.[41, 70]

72
3.1.1. Overcoming Surface Tension in Microchannels
As the dimensions of the device shrink, capillary forces have more of an impact
on fluid flow. The Young-Laplace equation, ∆P = 2γ/r, can be used to estimate the
minimum pressure needed to overcome surface tension (γ) effects for a gas-liquid
interface in a small channel. [71] For a 10 µm channel radius and water (γ = 72 dyn/cm),
∆P=0.14 atm. Therefore, the dimension for the inlet mixing channels (25 µm wide) is not
so small that surface tensions effects would become prohibitive. This consideration does
not include the forces required to overcome frictional resistances of two-phase flow in
capillaries. In that case, the pressure drop depends on the velocity, relative volumes of
the two phases, and the length of the channel in addition to channel radius. Theoretically,
microfabrication methods could allow the construction of channels smaller than a micron.
For a channel diameter of 0.2 µm, the pressure required to overcome surface tension is
severe: 14 atm. Therefore, the scaling of the inlet channels for multiphase mixing is
dictated by these surface tension effects: a 10 µm characteristic radius is sufficiently large
that surface tension is not severe, and yet small enough to take advantage of diffusional
processes.
Even though surface tension is not restricting the flow in the microchannel
contactor, it nevertheless dictates the nature of two-phase flow. The fluid dynamics of the
two-phase flow depend on the relative effects of surface tension and inertial forces. Two
dimensionless numbers have been used to establish this relationship and appear in a
number of correlations of multiphase fluid dynamics and mass transfer. The Capillary
number, Ca = µLVL/σ, provides a ratio of the inertial forces to the capillary forces for
two-phase flow, where µL is the viscosity of the liquid, VL is the velocity and σ the

73
surface tension. For the range of flow rates and materials used in this study, 1×10⁻⁵ < Ca
< 1×10⁻³. In the context of packed beds, the Webber number, We = (VL2 Dp ρ)/σ also
provides a ratio of inertial forces to interfacial forces, where Dp is the diameter of the
particles and ρ is the density of the liquid. For the small 50 µm diameter particles in the
reactors here, 1×10⁻⁷ < We < 1×10⁻³. Both of these dimensionless numbers indicate that
surface tension is the driving force governing the nature of the two-phase flow.

74
3.1.2. Device Layout
The overall device consists of two bonded silicon layers and a glass layer to cap
the top most channels. As seen in figure 3-1, an array of 10 reaction channels are
fabricated in silicon and connected through an on-chip microfluidic manifold. Reagents
enter and exit the chip from the ports on the bottom-side, underneath the chip. The gas
inlet (figure 3-1, cross-section A) is divided into 10 channels whose widths vary,
depending on the length, to ensure an even distribution of flow. These ten streams are
further divided into 4 streams (25 µm wide) before entering the ‘mixing zone.’ The
second inlet for the liquid is split into multiple inlet channels (25 µm wide) in the bottom
silicon layer (figure 3-1, cross-section B). In this way, the 90 gas and liquid inlet streams
are interleaved in an alternating fashion. The second layer of silicon is required to
manifold the second inlet without overlapping the different sets of streams. Figure 3-2 is
an enlarged view indicating the alignment of adjacent channels such that the two reagents
will not mix until they have reached the reaction channels. These inlet streams proceed
until they meet at the ‘mixing zone’, just prior to the reaction channels.
The 10 reaction channels are 2 cm long, 600 µm wide, and 300 µm deep. Each of
the ten channels is connected by a 500 µm wide channel running perpendicular near the
inlets (figure 3-1, at cross-section C). This intersection is where the multitude of inlet
streams first meet and is considered the ‘mixing zone.’ This channel also allows the
catalytic particles to be loaded into all ten channels simultaneously.
Separate ports and inlet channels for the catalyst are required because the inlet streams
(25 µm wide) are meant to prevent a back-flow of catalyst during operation. The
catalyst is loaded as a slurry, and as such requires a certain velocity to keep the particles

75
suspended. Two different ports for the catalyst slurry are necessary: as the device is
filled with particles, the pressure drop increases and it becomes increasingly difficult to
generate the velocities needed to drive the particles. With two catalyst inlet ports
however, a cross flow of catalyst slurry can be easily attained and the particles steadily
loaded into the channels. This ability for cross flow also helps to ensure an even loading
of particles among the ten channels.
At the end of the 2-cm-long channels are filter structures consisting of 40 µm
wide columns with a separation gap of 25 µm. After the filter, the fluids exit via a 400
µm diameter port to the bottom silicon layer, where all ten exit streams are collected to a
single port (figure 3-1, cross-section D). The difference between the packed-bed device
and the microstructure one is simply the arrays of columns patterned into the channels; all
the other fluidics are the same.

76
Figure 3-1. Top, plane view of multichannel reactor and point of cross-sections. A) Gas inlet. B)Liquid Distributor. C) Catalyst inlets. D) Exit port manifold.
A B C D
1 mm
A
B
C
D
External port for thermocouple or metal

77
Figure 3-2. Cross-section of liquid manifold corresponding to B) of 3-1.
3.2. Heater Design
To test the potential for integrated temperature control in an individual reaction
device, thin film resistors were designed and tested. Thin film resistive elements have
been used in conjunction with membrane reactors, where the thermal isolation of the
membrane allows high temperatures(>700 °C) to be reached. [47] In this application, the
ultimate temperature requirement is much lower (<300 °C) but heating of the entire chip
and fluid is necessary and heat loss to the environment is substantial. Incorporating
heating elements also allows for experimental characterization of the thermal properties
of microchemical devices before testing highly exothermic chemical reactions.
B
100 µm

78
The amount of energy required to raise the temperature of the fluids for a given
flow rate can be used as a first order approximation for the size of the heaters. The
energy required to raise the temperature from 25 °C to 90 °C of water flowing at 0.1
mL/min. is 0.5 Watts,
TCmq p∆⋅= C
where .min/g1.0Qm =⋅= ρC and Cp = 4.2 J/(g K). For hydrogen flowing at 100 sccm,
assuming a density of 9x10⁻⁵ g/cc (30°C), and ∆T = 300°C, q = 0.6 Watts.
For hydrogen, Cp=14.3 J/(g K) which is substantially larger than Nitrogen (Cp =1 J/(g
K).
As will be shown later, convective heat losses from the external surface of the
chip is somewhat larger (1.3 W at 80 °C). While trying to maximize the power delivery
to the chip, the constraints on the design were the thickness of the metal film and the
maximum current density. Thicker films are desired to allow higher current flow, but the
metal layer must be thin enough to allow a fluidic seal between the glass and silicon
layers using the anodic bond. Here, films 1000 Å in thickness did not prevent the glass
wafer from bonding and sealing to the silicon. The maximum current density before
electromigration serves to degrade the film can be taken as approximately 1x10⁻⁶ A/cm2 s
[47].
Test Device
The resistance characteristics of titanium/platinum films were tested using a test
pattern on a single channel reactor design. Figure 3-3 shows the layout of the heater. A
film, 600 µm wide, 6 cm long, 1000 Å thick, was deposited. A smaller test pattern to

79
simulate a temperature sensing film was also used. Figure 3-4 shows a meandering
pattern with a line 25 µm wide.
Figure 3-3. Single channel reactor with integrated heater. A single line (500 µm wide) with 4 segments meanders along the length of the reaction channel.
Figure 3-4. Resistive temperature sensor at the exit of the reactor.
Platinum heater connections
Platinum RTD connections
1 cm
Outlet
Inlets

80
The resistance of the heater at 25 °C was 262 Ohm, giving a resistivity of 0.26
Ohm µm. This was slightly higher than the known resistivity of platinum (0.11 Ohm
µm). This could be due to insufficient annealing of the platinum after e-beam deposition
as well as resistance at the contacts. Figure 3-5 is a resistance vs. temperature plot
showing linear behavior to at least 125°C. One of the advantages of platinum as a
temperature resistive element is the large range of linearity between resistance and
temperature.
The temperature resistivity coefficient, αT was calculated to be 0.0021 °C-1, defined as:
]T1[)C25T(cetansisRe)T(cetansisRe T ⋅+⋅== α
This compares with values of 0.0029°C-1 reported for platinum films on silicon nitride
membranes.[47]
Figure 3-5. Temperature dependence of the resistance for the heater. Error bars represent approximately 5% error in the resistance measurement.
y = 0.5408x + 247.9R2 = 0.9899
250
260
270
280
290
300
310
320
0 20 40 60 80 100 120 140Temperature (C)
Res
ista
nce
(Ohm
)

81
Heater design for the multiple channel reactor
Based on the measured resistivity characteristics of titanium/platinum films on the
test structures above (0.26 Ohm µm), the meandering pattern of Figure 3-6 was chosen so
that the total resistance would be near 100 Ohm. This would allow the heaters to operate
near 10 watts with a reasonable potential (30 V) and still be within the current density
limits. The lines (600 µm wide) form two parallel resistance paths 5.4 cm length each.
For the dimensions of the heater (600 µm X 0.1 µm) and the assumed maximum current
density, the maximum current allowed is 0.9 A, or 30 W. The heater lines were
positioned in such way to ensure an even distribution of heat among the ten channels.
Each of the ten channels is separated by an island of silicon 625 µm wide. These islands
serve to provide mechanical stability for the entire chip, provide more surface area for the
anodic bond, and provide a conduit for heat from the thin film heaters to the rest of the
silicon.
Figure 3-6. Layout for heater lines and temperature sensor. The heater line (500 µm wide, 1500 Å thick) has two parallel segments running along the length of the channels.
82
3.2.1. Thermal Performance Characterization
Resistivity of the titanium/platinum films depended upon the conditions of the
post deposition anneal. Annealing for 3 hours at 500 ºC yielded a resistance of 125 +/- 4
Ohm or a resistivity of 0.26 Ohm µm. If this was followed by an anneal at 650 ºC for 2
hours, the resistance dropped to 91 +/- 3 Ohm or a resistivity of 0.18 Ohm µm. This
compares to the resistivity of pure platinum, 0.11 Ohm µm.
Power-temperature characteristics were evaluated to determine the feasibility of
using thin film heaters as a temperature source in a microchemical system. The heaters
were tested and their performance in controlling the temperature of the chip was entirely
dependant upon the packaging scheme. Using the packaging scheme depicted in figure
2-13, the thin film heaters were unsuccessful in rapidly bringing the reactor to a desired
set-point. Since the reactor is tightly sandwiched between two metal fixtures, the area for
external convection is enhanced and the total thermal mass is large. Several hours were
required to bring the packaged system to a set-point of 70 °C with a power input of 15
watts.
Alternative packaging schemes, such as tubing attached directly to the chip, could
improve the situation.[72] This was tested by suspending the chip both in air and
wrapped in a fiberglass insulation material. For a chip suspended in air, a power input of
2.2 watts produced a steady temperature of 125 ºC, while a chip with insulation and a
power input of 4 watts produced a temperature of 300 ºC. Figure 3-7 shows the
temperature versus power behavior for the single channel reactor.
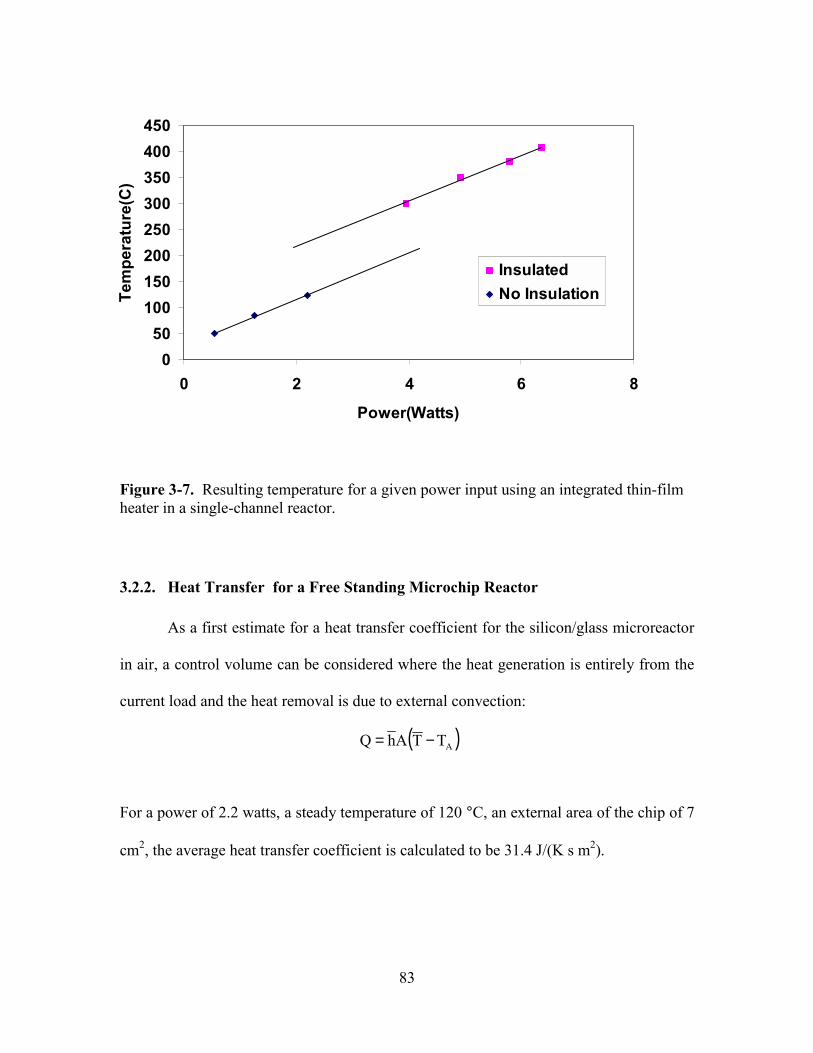
83
Figure 3-7. Resulting temperature for a given power input using an integrated thin-film heater in a single-channel reactor.
3.2.2. Heat Transfer for a Free Standing Microchip Reactor
As a first estimate for a heat transfer coefficient for the silicon/glass microreactor
in air, a control volume can be considered where the heat generation is entirely from the
current load and the heat removal is due to external convection:
( )ATTAhQ −=
For a power of 2.2 watts, a steady temperature of 120 °C, an external area of the chip of 7
cm2, the average heat transfer coefficient is calculated to be 31.4 J/(K s m2).
050
100150200250300350400450
0 2 4 6 8
Power(Watts)
Tem
pera
ture
(C)
InsulatedNo Insulation
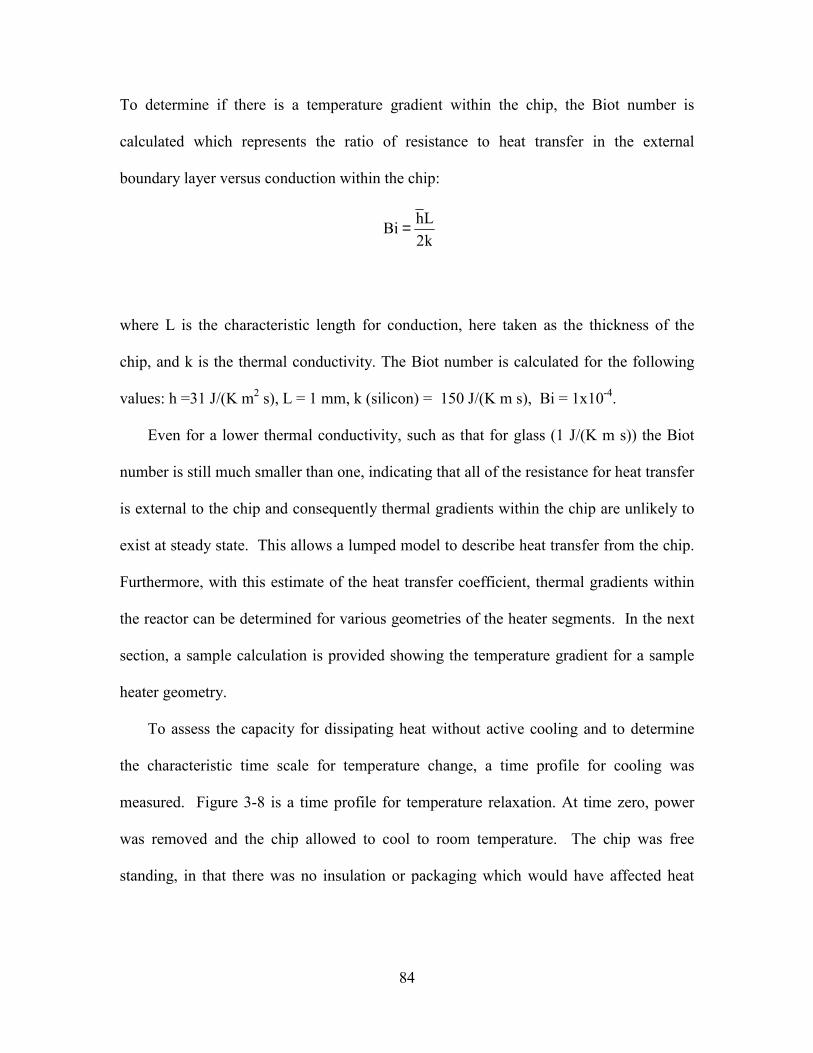
84
To determine if there is a temperature gradient within the chip, the Biot number is
calculated which represents the ratio of resistance to heat transfer in the external
boundary layer versus conduction within the chip:
k2LhBi =
where L is the characteristic length for conduction, here taken as the thickness of the
chip, and k is the thermal conductivity. The Biot number is calculated for the following
values: h =31 J/(K m2 s), L = 1 mm, k (silicon) = 150 J/(K m s), Bi = 1x10⁻⁴.
Even for a lower thermal conductivity, such as that for glass (1 J/(K m s)) the Biot
number is still much smaller than one, indicating that all of the resistance for heat transfer
is external to the chip and consequently thermal gradients within the chip are unlikely to
exist at steady state. This allows a lumped model to describe heat transfer from the chip.
Furthermore, with this estimate of the heat transfer coefficient, thermal gradients within
the reactor can be determined for various geometries of the heater segments. In the next
section, a sample calculation is provided showing the temperature gradient for a sample
heater geometry.
To assess the capacity for dissipating heat without active cooling and to determine
the characteristic time scale for temperature change, a time profile for cooling was
measured. Figure 3-8 is a time profile for temperature relaxation. At time zero, power
was removed and the chip allowed to cool to room temperature. The chip was free
standing, in that there was no insulation or packaging which would have affected heat

85
transfer. It is assumed that heat transfer through the thermocouple and wire leads was
negligible relative to heat loss through the surface of the chip.
Figure 3-8. Temperature decay with non-insulated chip. The reactor was heated to the initial temperature with the integrated heaters and then allowed to cool to room temperature. The thermal response time is measured to be 1.6 minutes.
Temperature was recorded continuously using LabView. Initially, the power supplied to
the reactor was 2.2 W, producing a temperature of 120 °C. For the unsteady temperature
decline with removal of the current, conservation of energy requires:
qtTCp ⋅−∇=∂∂ρ
(3-1)
Averaging and integrating over the entire volume of the reactor gives,
∫=V
TdVV1T
(3-2)
0
20
40
60
80
100
120
140
0.00 0.50 1.00 1.50 2.00 2.50 3.00 3.50 4.00
Time(Minutes)
Tem
pera
ture
(C)

86
∫∫ ⋅∇−=∂∂ρ
VV
dV)q(dVtTCp
(3-3)
( )ATTAhtTCpV −−=∂∂ρ
(3-4)
∫∫ ⋅−=∂∂ρ
AV
dA)qn(dVtTCp
(3-5)
Solving for the temperature as a function of time provides the time scale for the
temperature decay:
τ−
=−− t
Ao
A eTTTT
(3-6)
AhCpVρ=τ
(3-7)
A plot of the natural logarithm of the temperature versus time will give a straight line, the
slope of which is the time scale and can be used to determine the heat transfer coefficient.
Figure 3-9 shows the linearized data where Θ, the dimensionless temperature variable, is
defined as in equation 3-6. The slope gives the time constant, τ = 1.6 minutes and hA
=0.014 J/K/s. For a surface area of 7cm2, h=20 J/K/s/m2.

87
Figure 3-9. Linearized temperature versus time profile (data from Figure 3-8). The measured slope provides the heat transfer coefficient.
3.2.3. Discussion: Heat Exchange in Microchemical Devices
The results of the various packaging schemes on the thermal performance of the
microreactor serves to illustrate the trade-off between control and efficiency. The heat
losses to the environment as a result of the large surface areas can be significant. This
attribute can be used as a means for dissipating the heat of a reaction without active
cooling. If heat transfer is between the chip and air, then the steady state temperature for
a power input of 1.3 watts was 80 ºC. Considering the phosgene reaction, one that was
both fast and exothermic, the heat generation for a single channel reactor at 100%
conversion is 0.4 Watts (rate = 1.1 g/hr, ∆H=110 kJ/mol). This amount of heat is easily
dissipated without active cooling given that the reaction requires a temperature of 250 ºC.
As a result of this imbalance between the power required to heat the chip (or conversely
y = -1.6151x - 0.1092R2 = 0.9953
-5
-4
-3
-2
-1
0
0.00 0.50 1.00 1.50 2.00Time (M inute s
Ln
( ΘΘ ΘΘ)

88
the large amount of heat dissipation) and the heat potentially generated by the reaction, a
large amount of control is afforded over the process. Temperature is determined entirely
by the power input by the heaters, not by the heat generated by the reaction. The trade-
off is that the reactor is operating inefficiently due to the large amounts of energy lost to
the environment.
If instead the chip is thermally isolated, then less power is required for a given
temperature. A power input of 3 watts now generates a temperature in the reactor of 250
ºC instead of 150 ºC, see Figure 3-7. The reactor operates more efficiently, but at the
expense of control since the reaction now generates heat at rates which are comparable to
losses due to external convection. Depending upon the application, either one of the
these modes of operation may be desirable.
Citing the phosgene example above, if the reaction was now performed in a 10
channel device, the rate of heat generation would now be at 4 watts. For a non-insulated
chip, this would produce a temperature close to 250 ºC, the required temperature of
operation to achieve the cited rates of reaction. According to this calculation, a
multichannel reactor could perform the phosgene reaction without the need of either on-
chip cooling or heating. This suggests that individual microreactors could be tailored to
the chemical reaction at hand. The reaction volume in a chip could be adjusted such that
the heat generated by the reaction is exactly that required for the intended temperature of
operation. Not counting the energy produced by the reaction, this would be the most
efficient way to operate a reactor. For the phosgene reaction, this would be impossible at
any other scale. At a larger scale, the external heat transfer coefficient may be the same,
89
but the surface area per volume ratio would be much smaller and as a result, the total
amount of heat transfer would be reduced relative to the heat generation of the reaction.
3.2.4. Thermal Uniformity Calculation
In the design of the heater for the multichannel reactor, several design options
were available, and so a calculation was performed to arrive at an optimum heater
geometry. The calculation involved determining the temperature gradient between two
parallel heater elements on a silicon chip. For a given temperature drop, the maximum
spacing between the elements can be estimated.
The heat transfer coefficient from the chip surface was estimated from experiments.
The value used here (30 J/K m2 s) is for a non-insulated chip, where the heat transfer will
be most severe and the temperature gradients the largest.
The system to be modeled can be seen in Figure 3-11. Thin platinum films
meander along the silicon glass interface. Applying a current through the films allows
the chip to be resistively heated. The calculation will show that for a heater spacing of no
more than 1 cm, the temperature difference from the portion of the silicon directly next to
the heater to the portion of the silicon in the center will be smaller than 10K.

90
Figure 3-10. Model for determining temperature uniformity.
The Biot number based on a chip depth, W, of 1mm and the thermal conductivity
of silicon is:
4103.1k
hWBi −⋅==
(3-8)
Consequently, most of the heat transfer resistance is external to the chip. This allows for
the fin approximation, where the temperature is uniform in the z direction and varies
along x. (Deen, 3.3-19)
Assume that the heat source can be treated as a uniform flux in the x direction, and
thereby reduce the problem to one dimension as in Figure 3-12. Also assume that edge
effects can be neglected, as the predominant surface area is the top and bottom planes of
the chip.
Platinum
h t
Heater Spacing, L
Silicon Base
Glass Cap
z
x

91
Figure 3-11. 2-D model for temperature uniformity profile
From the energy conservation equation,
0)TT(Wk
h2dx
Tdam2
2
=−⋅−
(3-9)
(the factor of 2 comes from a heat flux at two surfaces(top and bottom))
substituting
amTTT −=
(3-10)
and
WxX =
(3-11)
gives:
0TBidX
Td2
2
=⋅−
(3-12)
subject to the boundary conditions:
h(T-Tam)
L / 2

92
(B.C. 1)
qdXdTk
0X
−==
(3-13)
(B.C. 2) (symmetry condition)
0dXdT
W2/LX
==
(3-14)
The solution to (3-12) has the form:
XBi2
XBi1 eCeCT ⋅−⋅ ⋅+⋅=
(3-15)
Solving for the constants gives,
)1e11(
kBiqC
Bi21 −−
⋅⋅
=γ−
(3-16)
)e1(kBiqC
Bi22 γ−−⋅⋅=
(3-17)
W2L=γ
(3-18)
For the conditions under which h was determined experimentally, the power through the
heaters varied from 1-3 watts for a heater containing 4 segments 1.5 cm long.
To use the most extreme conditions for thermal non-uniformity, the calculation
involves distributing the power into two heating segments, 2 cm long which are at
opposite ends of the 1.5-cm-wide chip. (Figure 3-11). This would produce the most
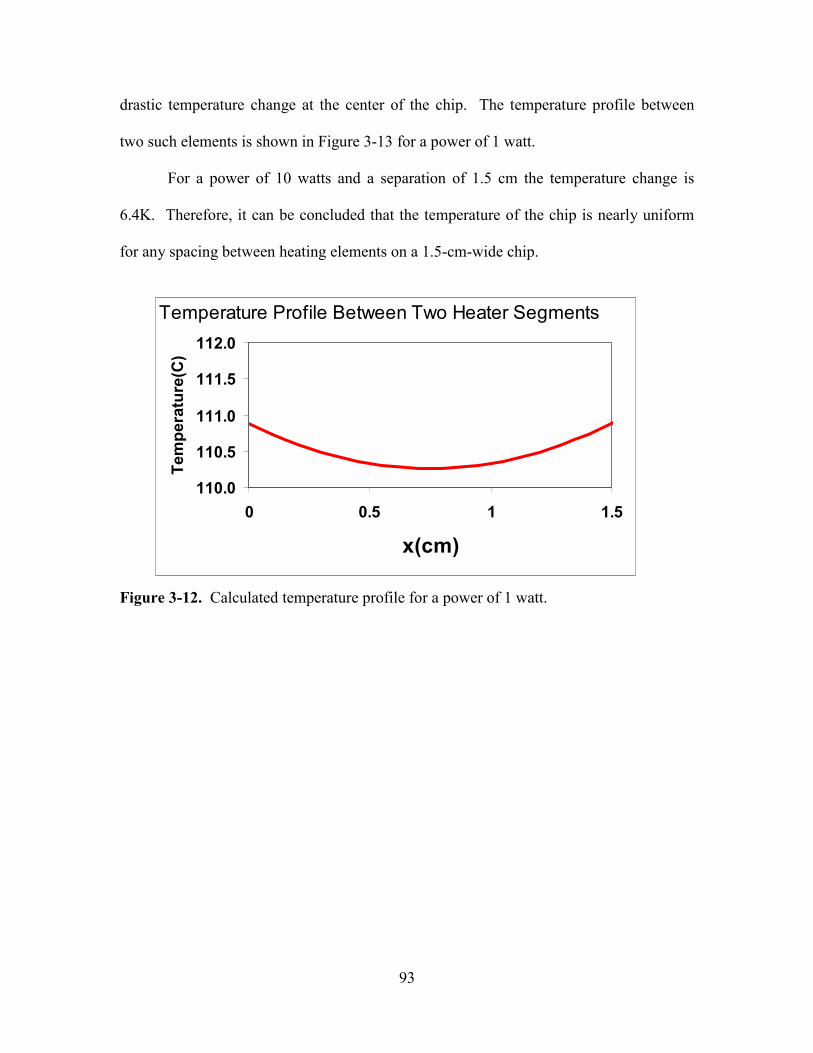
93
drastic temperature change at the center of the chip. The temperature profile between
two such elements is shown in Figure 3-13 for a power of 1 watt.
For a power of 10 watts and a separation of 1.5 cm the temperature change is
6.4K. Therefore, it can be concluded that the temperature of the chip is nearly uniform
for any spacing between heating elements on a 1.5-cm-wide chip.
Figure 3-12. Calculated temperature profile for a power of 1 watt.
110.0
110.5
111.0
111.5
112.0
0 0.5 1 1.5
x(cm)
Tem
pera
ture
(C)
Temperature Profile Between Two Heater Segments

94
3.3. Fabrication Process
The fabrication process is presented first for the open channel design. The
fabrication for the reactor with microstructured packing is similar with the exception of a
few steps required for integrating porous silicon. This involves the use of a silicon nitride
layer as mask for the electrochemical etching process which forms the porous silicon.
Thick resist (AZ4620, Hoechst AG) was spin coated to 10 µm thickness in order
to pattern the two double-side polished silicon substrates. A contact mask alignment
procedure was used (Electronic Visions EV 450 Aligner). The fluid channels were then
formed in the silicon substrate by using a time-multiplexed inductively coupled plasma
etch process using a Surface Technology Systems deep reactive ion etcher.[73] The
depth was controlled by timing the etch to approximately 300 µm. For the conditions
used, this required between 1 and 1.5 hours. Each wafer was then patterned from the
back-side using infrared alignment and etched in a similar fashion. Due to slight
variations in the etch rate, the etch from the backside was extended until all features
‘broke-through’ to meet the topside channels. This resulted in an over-etch of no more
than 10 minutes, or 30 microns. These two silicon wafers were then cleaned (4:1
H2SO4:H2O2 90 °C, followed by an RCA clean) and fusion bonded. The wafers were
first contacted without vacuum (Electronic Visions AB1-PV Bonder) and then annealed
at 1100 °C in nitrogen for 1 hour. After the bonding, an oxide coating (5000 Å thick)was
grown on the wafer stack using a wet thermal process at 1100 °C.
Separately, a Pyrex 7740 glass wafer (Bullen Ultrasonics) was patterned with a
titanium/platinum film to create resistive heaters and temperature sensors. A thin

95
titanium layer served to promote adhesion between the glass and the platinum.[74] A
simplified “lift-off’ process was used where 1 µm of thin resist (OCG 825-20cs, ) defined
the metal lines in negative. After development, the Pyrex was subjected to an oxygen
plasma for 1 minute to clear any residue prior to metal deposition. An e-beam evaporator
was used to deposit first 50 Å of titanium followed by 1000 Å of platinum. Immediately
following the deposition, the photoresist was removed by sonication in acetone for 10
minutes. Any metal/resist remnants were removed by a treatment with a resist strip
(Nanostrip) for 10 minutes. The patterned glass/metal wafer was then annealed at 500C
for 3 hours. The resistive elements thus fashioned were used as is. Ultimately, it would
be desirable to insulate these metal features from exposure to the reaction channels for
applications involving corrosive reagents. The insulation of electrodes has been
demonstrated elsewhere using thin films of polymers [18] or CVD oxides.[75] The glass
wafer and the silicon wafer stack were next anodically bonded with the metal films
toward the silicon. [62] An Electronic Visions AB1-PV bonder was used at the following
conditions: 500°C, 800 Volts for 5 minutes. After this last bonding step, the wafer stack
was diced to produce eight reactors (15 mm × 40 mm × 1.5 mm). Figure 3-14 is a
photomicrograph of the inlet manifolds feeding into the ten microstructured channels.

96
Figure 3-13. Photomicrograph of inlet manifold for the ten-channel reactor. A) The inlet channel widths vary according to the length from the inlet port to the reaction channel in order to ensure a constant pressure drop and even distribution of fluid flow. B) Each of the ten reaction channels has an inlet manifold consisting of 9 channels distributing the gas and liquid phases.
100 µm
500 µm
A
B

97
3.4. Orientation and Gravitational Effects for Micro Multiphase
Systems
To determine if the orientation of operation (horizontal or vertical) of the
microreactor would have an influence on flow behavior, several criteria from the
literature were consulted. Numerous studies have investigated the influence of gravity on
two-phase flow in small channels or capillaries.[76] These microchannel studies involve
both circular and rectangular cross sections, generally with a hydraulic diameter near 1
millimeter. Fukano and co-workers investigated flow regimes and flow regime
transitions for two-phase flow in capillaries ranging in diameter from 1 mm to 26 mm.
[76] Operating under identical conditions with exception to orientation, the authors
concluded that two-phase flow is unaffected by gravitational effects for capillary
diameters less than 5 mm.
The first criteria for the relative influence of gravity on flow is the Bond number,
which represents the ratio of gravitational forces to capillary forces:
[ ]σρ−ρ= gDBo GL
2
(1)
where D is the diameter of the channel, ρL and ρG are the densities of the liquid and gas
respectively, g is the gravitational constant, and σ is the surface tension. For small Bond
numbers, interfacial forces dominate and orientation or gravity has no influence. Bruaner
and co-workers provided a criterion for the dominance of surface tension based on the
Eotvös number, Eö:[77]

98
( )[ ] 1
gD2öE
GL2
2
>ρ−ρσπ=
(1)
For air and water, the surface tension is 72 mN/m, while for air and most organic solvents
the surface tension is between 20 and 30 mN/m. Table 3-1 shows the calculated values
for Bo and Eö for a range of channel diameters.
Table 3-1. Calculated dimensionless Bond numbers (Gravity vs. Surface Tension)
D (mm) σ (mN/m) Bo Eö
10 72 14 1.5
1 72 0.14 150
0.1 72 0.001 15,000
10 20 50 0.4
1 20 0.5 40
0.1 20 0.005 4,000
The conclusion is that even for a range in solvent properties, for a channel diameter of 1
mm or smaller, the Bond number is smaller than 1 and the criteria proposed by Bruaner is
met. Orientation, therefore, does not influence the two-phase flow behavior for the
devices of this thesis.

99
Furthermore, the influence of buoyancy effects can be considered. The
dimensionless parameters that determine the relative influence of thermally induced
density gradients to viscous forces are the Rayleigh number, Ra, and the Grashof number,
Gr:
2
33 TgLGrTgLRaυ∆β=
αυ∆β=
For water at room temperature, β = 2.066 x 10⁻⁴ K-1, thermal diffusivity α =0.0015 cm2/s,
and the kinematic viscosity ν =0.01cm2/s. For L = 1 mm and ∆T = 1 K, Gr = 2 and Ra =
14. Critical values for the Rayleigh number, where instabilities begin to occur, are near 1
x 103. [78] Given the small length scales involved, it is increasingly difficult to maintain
even minor temperature gradients, so that free convection is unlikely to play a significant
role in flow behavior.
3.5. Summary of the Multichannel Reactor Design
Photolithography allows the design of complicated fluidic networks at no
additional cost in terms of fabrication time or equipment. The multichannel reactor of
this chapter is an example of a microfluidic design which makes full use of the ability to
construct complex fluidic manifolds and features. Ten identical reaction channels are
connected in parallel and a fluidic distribution system has been designed to allow the
simultaneous loading of catalyst particles and the even distribution of reactants among
the ten channels. The inlet manifold for the reactants consists of 90 individual channels

100
(25 mm wide, 300 mm deep) feeding into the reaction channels. Such a fluidic design
would be difficult at best, to fabricate using conventional means.
The microfabrication of the devices is described in detail in section 3.4. The
enabling technology for the construction of these devices is the deep-reactive-ion etching
(DRIE). Photolithography, metal deposition and multiple wafer bonding are the other
critical fabrication steps. Eight identical reactor chips are produced from a single 100mm
silicon wafer. Microfabrication enables the manufacture of these devices with small
features and integrated electronics, batch-wise with a high degree of tolerance.
In addition to geometry, the devices described in this chapter have integrated
functionality in the form of heaters and temperature sensors. Thin-film platinum heaters
have been incorporated which have demonstrated heating loads up to 10 watts and chip
temperatures to 400 ºC. The Biot number for heat transfer was found to be much less
than one (Bi<<1) indicating that the chip is nearly isothermal and temperature gradients
within the reactor unlikely. The primary factor determining the thermal properties of the
reactors is the packaging, not the properties of the thin-film heaters. With further
advances in chip-packaging, thin-film heaters would be a viable approach to temperature
control in this microreaction devices.
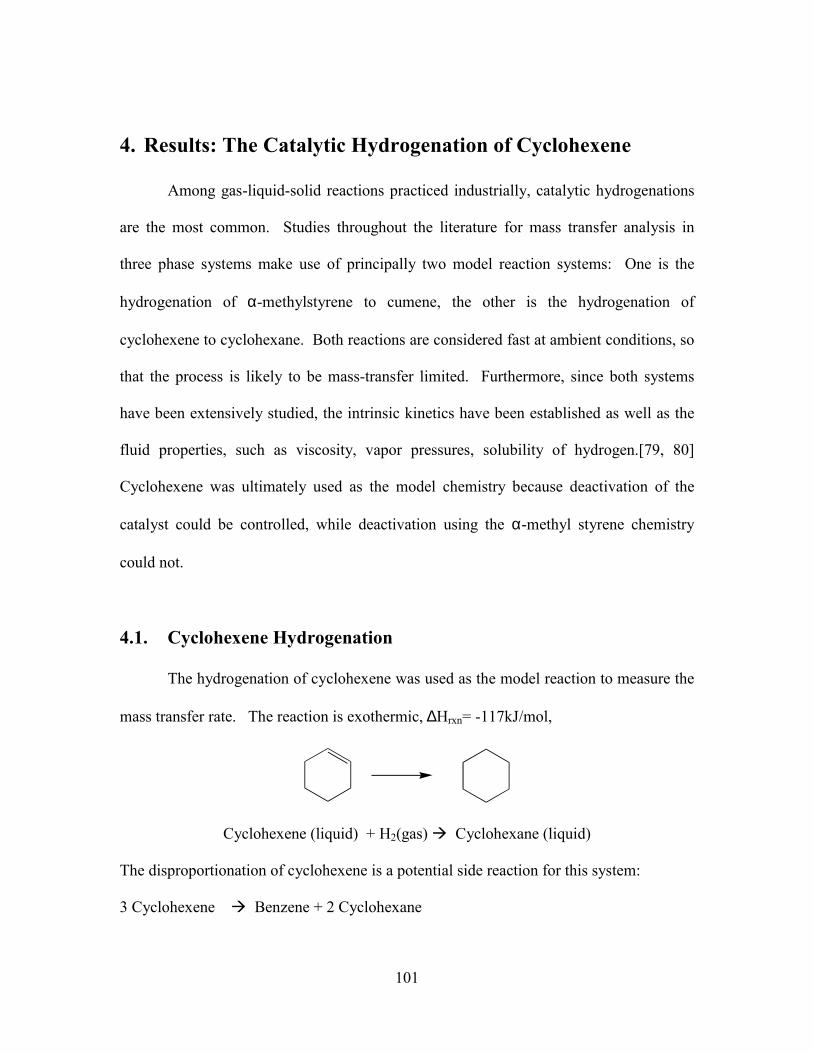
101
4. Results: The Catalytic Hydrogenation of Cyclohexene
Among gas-liquid-solid reactions practiced industrially, catalytic hydrogenations
are the most common. Studies throughout the literature for mass transfer analysis in
three phase systems make use of principally two model reaction systems: One is the
hydrogenation of α-methylstyrene to cumene, the other is the hydrogenation of
cyclohexene to cyclohexane. Both reactions are considered fast at ambient conditions, so
that the process is likely to be mass-transfer limited. Furthermore, since both systems
have been extensively studied, the intrinsic kinetics have been established as well as the
fluid properties, such as viscosity, vapor pressures, solubility of hydrogen.[79, 80]
Cyclohexene was ultimately used as the model chemistry because deactivation of the
catalyst could be controlled, while deactivation using the α-methyl styrene chemistry
could not.
4.1. Cyclohexene Hydrogenation
The hydrogenation of cyclohexene was used as the model reaction to measure the
mass transfer rate. The reaction is exothermic, ∆Hrxn= -117kJ/mol,
Cyclohexene (liquid) + H2(gas) Cyclohexane (liquid)
The disproportionation of cyclohexene is a potential side reaction for this system:
3 Cyclohexene Benzene + 2 Cyclohexane

102
The catalyst employed was a standard platinum supported on alumina powder, where the
platinum content was either 1% or 5% by weight. The metal surface area for the 1wt%
Pt/Al2O3 catalyst was measured as 0.57 m2/g using CO chemisorption in a Micromeritics
ASAP 2010 instrument. The catalyst powder was sieved and fractions of 53-75 µm, 36-
38 µm, or <36 µm were used. The amount of catalyst in the reactor was determined by
the weight of the reactor before and after loading. Flow visualization was used to ensure
that steady co-current flow was achieved and that the distribution of the fluid to the
catalyst particles was even. This condition was especially important for the cyclohexene
hydrogenation, as its high volatility could influence the reaction kinetics if the bed of
catalyst particles was allowed to dry out, as in the case of the pulsing flow regime.
4.2. Intrinsic Rate Determination
To get an accurate assessment of mass transfer, the intrinsic rate for the
hydrogenation of cyclohexene must be known. This intrinsic rate is the rate of reaction in
the absence of all diffusional effects and mass transfer limitations and represents the
highest attainable rate for a catalyst at a given set of conditions. The analysis presented
here employs two approaches. The first is to take a representative value from the
literature for a catalyst of similar support type and metal content. Owing to variations in
catalysts, such as the method of manufacture or the nature of the porosity of the support,
the variation of reaction rates from the reported values to the present analysis could be
significant. Expressing the intrinsic rate as a function of the available metal surface area,
rather than just the mass of the catalyst, makes the comparison less problematic. The
reaction is ‘structure in-sensitive,’ so that the nature of the platinum metal surface is
103
insignificant. Furthermore, since the support interaction in the catalytic process is
minimal for this particular reaction, reaction rates on the basis of metal surface area can
be considered reliable. The second approach is to measure the intrinsic rate
experimentally using a batch/slurry reactor with good mass-transfer properties. If the
catalyst concentration in the slurry reactor is low enough, then the demand for hydrogen
by the reaction can be tailored such that mass transfer effects are minimized. The
advantage of this approach is that the exact same catalyst used in the slurry/reactor
experiments, including composition as well as particle size, can be used in the
microreactor studies. This eliminates any variations due to differences in the catalyst, but
the drawback is that extensive studies have to be performed on the slurry-reactor to
determine its own mass-transfer characteristics.
Several reaction mechanisms for cyclohexene hydrogenation have been proposed.
The two presented here both reduce to a reaction that is first order in hydrogen and zero
order in cyclohexene. Michel Boudart published a comprehensive investigation of
intrinsic reaction kinetics of cyclohexene hydrogenation in 1978[35] and proposed that
the rate for dissociative chemisorption of hydrogen on the catalyst surface was the
controlling rate for the reaction:
Rate = k·CH2 (4-1)
Their observations, as well as the observations of others, was that the concentration of the
product did not affect the reaction rate, and that for reasonable concentrations of
cyclohexene, the reaction was first order in hydrogen and zero order in cyclohexene.
Kawakami and co-workers measured the effects on reaction rates for lower

104
concentrations of cyclohexene and found that the following Langmuir-Hinshelwood rate
expression fit the data:
)CK1()CK1(CCKKk
RateCC
22HH
C2HCHv
++=
(4-2)
where KH (438 L/mol) and KC (47.3 L/mol) are the equilibrium adsorption coefficients
for hydrogen and cyclohexene respectively. This expression would suggest a mechanism
of the form where the surface reaction between the dissociatively adsorbed hydrogen and
the adsorbed cyclohexene is rate limiting and the adsorption of the species are considered
in pseudo steady-state. For conversions of cyclohexene up to 80%, the concentration of
cyclohexene, CC, (2 mol/L) is still much higher than that for the solubility of hydrogen,
CH2, (4×10⁻³ mol/L). Consequently, the rate expression in equation 4-2 reduces to the one
in equation 4-1, where the reaction is first order in hydrogen.
The intrinsic rates for the hydrogenation of cyclohexene using a variety of
platinum catalysts in various solvents are available in the study by Madon et al.[35] Two
rate constants are defined here using standard convention: one is the surface reaction rate
constant, ksur (cm/s), the other is the volumetric rate constant, k (1/s).
2HCk3cms
molR ⋅=
⋅
2Hcatsur CAmk3cms
molR ⋅⋅⋅=
⋅

105
Where m is the catalyst loading (g/cm3) and Acat is the active surface area per mass of
catalyst (cm2/g). A representative value for the metal surface area is that measured for
the 1wt% Pt/Al2O3 as 5700 cm2/g using CO chemisorption in a Micromeritics ASAP
2010 instrument. The catalyst loading is typically in the range of 0.8-1.0 g/cm3 (for
example, the total weight could be 40 mg in a multichannel device with 40 µL volume).
The rate constants provided by Madon et al. are for a 2.3%Pt/SiO2 catalyst in
various solvents. The reaction rates varied by as much as 20% among the different
solvents. For cyclohexene as the solvent, the activation energy, Ea, is 26.03 kJ/mol and
the pre-exponential factor is 112 cm/s. The calculated surface reaction rate constant is,
ksur = 2.8×10⁻³ cm/s (T=22 ºC)
Given a 1-2 ºC variation in temperature between experiments, this value for the rate
constant has a likely error of 5-10%, not including effects for the solvent or catalyst
composition. For a catalyst loading of 1 g/cm3 and the surface area reported above, the
intrinsic volumetric rate constant is,
k = 16 s-1
In addition to providing rates specific to the 2.3% Pt/SiO2, Madon et al. provide a
comparison of turn over frequencies (rate of conversion per surface site) for other
supports with varying levels of dispersion for the catalyst. (Dispersion defined as the
fraction of metal atoms exposed at the surface to the total number of atoms). The
variation in turn over frequency among the various catalysts was very small (5%)
indicating that the support type and dispersion is not important to the activity of the
catalyst. For example, the reported turn-over-frequency for a 0.6% Pt/γ-Al2O3
(dispersion=0.7) is 8.61 while that for a 2% Pt/ηAl2O3 (dispersion=0.23) catalyst is 8.21.

106
Consequently, a fairly good estimate of the intrinsic rate can be made on the basis of
metal surface area. So while data is not available on the intrinsic reaction rate for the
exact same catalyst used in this study (5% Pt/Al2O3 or 1% Pt/Al2O3), the similarity in
reaction rates on the basis of surface area supports the use of the literature value as an
estimate for the intrinsic rate.
4.3. Catalyst Poisoning and Deactivation
One of the critical parameters for a heterogeneously catalyzed process is the
lifetime of the catalyst. The loss of catalytic activity can be attributed to a number of
factors, such as poisoning due to irreversible adsorption of impurities in the feed stock,
alterations in the catalyst such as a reduction of dispersion as metal particles agglomerate
at high temperatures or loss of catalyst from poor adhesion of a metal to the support. One
benefit of using standard catalyst powders in a microreactor is that the chemistry and
lifetime characteristics of the catalyst have already been optimized. One disadvantage of
the microreactor, and of process intensification in general, is that the lifetime of the
reactor becomes more sensitive to these catalyst deactivation effects. In a traditional
reactor, reactor size is not at a premium, so more catalyst can be loaded than is needed for
a given process. This ‘extra’ catalyst serves to buffer the losses in activity due to aging
of the catalyst. In a microreactor, on the other hand, the amount of catalyst and hence the
size of the reactor, must exactly match the requirements of the process since the size is
engineered to operate with optimal efficiency.
For the purposes of evaluating the performance of the microreactor, it is important
to have kinetics which are stable over the time of the experiment. This makes evaluating

107
the dependence of the reaction rate on such variables as flow rate and temperature
reliable and simple to analyze. The evaluation of mass transfer rates, since they depend
on the intrinsic rate, could be ascertained from initial reaction rates before deactivation
occurs. When the catalysts are characterized, such as the active surface area, the
calculated intrinsic rates are for initial conditions.
4.4. AMS Hydrogenation experiments
The first hydrogenation experiments were performed using α-methylstyrene as
the model chemistry. The course of the experiments which attempted to elucidate the
deactivation mechanism are detailed. Several potential causes for the deactivation were
investigated and eliminated through various experiments.
AMS + H2 Cumene
This reaction, like the cyclohexene hydrogenation, has been used extensively to
characterize trickle-bed reactors and is a fast reaction at moderate conditions. AMS is an
aggressive solvent, dissolving a wide-array of polymers and is corrosive to a number of
metals. AMS is usually shipped with a polymerization inhibitor owing to its poor stability
over long periods of time. Several attempts to use the AMS were made. One failure
involved the corrosion of a brass component of a pressure gauge which likely deposited
copper and other metals on the catalyst. The gasket material was also a concern and
+ H2

108
several materials were used. PDMS (polydimethylsiloxane) gaskets were incompatible
with the hydrophobic solvents, as the gasket swelled and failed completely. A teflon
gasket(Gore Inc., Goretex gasket tape) was also used, but failed to confine the
hydrophobic solvents. Viton was finally used successfully as a gasket material. Another
failure involved the corrosion of the 5-port steel chuck. Prior to the current version,
where the chuck is machined to accommodate the ferrules of miniature fittings, a silver-
solder was used to attach tubing to the steel base plate. The AMS corroded this silver-
solder causing a leak at the joint and likely metallic contamination of the catalyst. Even
with a microreactor systems made entirely of compatible materials (all 316-stainless
steel) and the AMS purified by removing the polymerization inhibitor, deactivation of the
catalyst occurred rapidly.
The experiments shown in figures 4-1 through 4-4 use a single channel packed-
bed reactor with a 5wt% palladium supported on carbon catalyst. The single channel
reactor typically held 1-2 mg of catalyst. The carbon particles were rod-shaped and even
though they were filtered to 50 µm, smaller particles on the order of 5-10 µm could be
observed filling the channel. The conclusion is that this particular catalyst does not have
the mechanical stability to retain its size integrity. In some cases, these smaller particles
agglomerated in portions of the packed-bed causing the pressure drop to increase
dramatically.
Figure 4-1 shows the reaction rate and conversion versus time for the
hydrogenation of AMS. The catalyst was loaded into the microreactor using an ethanol
slurry and 10 mL of ethanol was passed through the reactor in order to remove the water
content of the catalyst. The catalyst was then ‘activated’ by passing hydrogen through

109
the reactor at 200 °C. Reaction was initiated by starting the liquid flow rate at 0.01
mL/min of pure AMS (still retaining the polymerization inhibitor). The reaction rate then
continued to decrease over the course of several hours until no activity was observed. At
this point, the activation procedure was repeated, but no gains in activity were made.
Figure 4-2 shows the reaction rate profile for substrate that has been purified (inhibitor
removed), but no activation procedure. The reaction rate increases initially (presumable
from the lack of activation) and then decays rapidly. This eliminates the inhibitor as the
cause of the deactivation. The temperature was gradually increased in increments to
recover the activity. At 110 °C, and after most of the activity had been lost, pure AMS
only was passed through the reactor for 5 hours in an attempt to dissolve any oligimers or
polymerized species that may be blocking the pores of the catalyst. This also failed to
recover the activity.
Figure 4-1. Hydrogenation of AMS in a single channel microreactor loaded with 50 µm catalyst particles. A severe loss in reaction rate is observed over the course of the experiment.
0.0E+00
1.0E-06
2.0E-06
3.0E-06
4.0E-06
5.0E-06
6.0E-06
7.0E-06
8.0E-06
9.0E-06
1.0E-05
0 100 200 300 400 500 600Time(minutes)
Rea
ctio
n R
ate
(mol
/min
.)
0.00%
2.00%
4.00%
6.00%
8.00%
10.00%
12.00%
14.00%
16.00%1st Activation200C, 2hrs, 5sccm H2
2nd Activation200C, 2hrs, 5sccm H2
Catalyst: 5wt% Pd/CT = 50CP = 40PSILiquid Flow = 0.01 mL/minH2 Flow = 5sccm C
onve
rsio
n

110
In the last experiment, purified AMS was diluted in heptane to 10 wt% and used as a
substrate. Figure 4-3 compares the rate of deactivation with the concentration of AMS in
the substrate. As a result of diluting the AMS, the deactivation rate was decreased. As
seen in Figure 4-4, when the reaction rate is compared to the amount of AMS fed to the
reactor (which is independent of concentration), rather than time the rate of deactivation
is similar. The conclusion drawn is that the deactivation of the catalyst is due to some
component in the AMS or the AMS itself poisoning the catalyst.
Figure 4-2. AMS hydrogenation in a single channel microreactor. Deactivation continues with an increase in temperature. Flowing AMS only does not recover the activity.
0.00E+00
5.00E-06
1.00E-05
1.50E-05
2.00E-05
2.50E-05
3.00E-05
0 200 400 600 800 1000 1200 1400Time(minutes)
Rea
ctio
n R
ate
(mol
/min
)
0.00%
2.00%
4.00%
6.00%
8.00%
10.00%
12.00%
14.00%
16.00%
18.00%
Con
vers
ion
3/20/99, 50C3/20/99, 90C3/21/99, 100C3/22/99, 110C
AMS flow only for 300min.

111
Deactivation during AMS hydrogenation is mentioned only briefly in the
literature[32]. Watson and co-workers discuss and provide evidence for, the formation of
oligomeric species from the AMS. Self-polymerization is known for AMS, hence the
polymerization inhibitor. The oligomeric species have a low volatility, as well as a low
solubility, so that diffusion within the pores of the catalyst becomes hindered.
Figure 4-3. AMS Hydrogenation in a single channel microreactor. When AMS is diluted to 10% by weight in ethanol, the rate of deactivation is decreased indicating that the source for deactivation is some component of the AMS.
0.00E+00
2.00E-06
4.00E-06
6.00E-06
8.00E-06
1.00E-05
1.20E-05
0 100 200 300 400 500 600 700 800
Time (Minutes)
Rea
ctio
n R
ate
(mol
/min
)
100% AMS10% Feed

112
Figure 4-4. Deactivation of the rate of hydrogenation normalized for the amount of AMS fed to the reactor.
0.00E+00
2.00E-06
4.00E-06
6.00E-06
8.00E-06
1.00E-05
1.20E-05
0 0.005 0.01 0.015 0.02 0.025 0.03 0.035
Mols of Substrate Fed
Rea
ctio
n R
ate
100% AMS Feed10% AMS Feed
113
4.5. Cyclohexene Deactivation and Purification Procedures
Mechanisms for the deactivation of catalysts used for cyclohexene hydrogenation
are also reported.[81, 82] Procedures for purifying cyclohexene and preventing
deactivation are more readily available in the literature than for the AMS hydrogenation.
Two mechanisms predominate: one is the build up of carbonaceous residues on the
catalyst, the other is the formation of a hydroperoxide from the cyclohexene which
poisons the noble-metal catalyst. A stable cyclohexene epoxide is reported to form when
cyclohexene come in contact with air.[80]The hydroperoxide irreversibly adsorbs to the
catalyst and reduces the surface sites available for reaction. Madon et al. report a
procedure for purifying the cyclohexene to remove these and other contaminating
species.[35] Their method calls for passing the cyclohexene through alumina powder and
storing under helium. Watson et al report a similar procedure. Somorjai report a
procedure whereby the cyclohexene is refluxed in the presence of CaH2 and stored under
argon. [80]
To compare the effects of a given purification procedure, cyclohexene was first
used as received from Aldritch (with 0.01% BHT stabilizer). Figure 4-5 shows the
reaction rate for the hydrogenation performed in a single-channel reactor using a 5wt%
Pt/Al2O3 catalyst. This alumina catalyst was found to have superior mechanical
properties relative to the carbon catalysts. For this first experiment, without any
treatment of the substrate, the activity decreased as before.

114
Figure 4-5. Cyclohexene hydrogenation in a single channel reactor. No purification leads to a loss of activity similar to the AMS experiments.
4.5.1. Cyclohexene Purification
In a nitrogen glove box, cyclohexene was mixed with alumina powder overnight.
The cyclohexene:alumina weight ratio was 10:1. The alumina powder is the same
activated γ-alumina powder sold by Aldritch as a polymerization inhibitor remover. The
advantage of using this alumina powder is that it has a high surface area, it is in the form
of a finely divided powder, and is shipped and stored under nitrogen without contact to
air. After mixing overnight, the cyclohexene was dissolved in ethanol (also stored in the
nitrogen glove box) and transferred using a gas-tight glass syringe with a teflon plunger
and valve. The catalyst was purged with hydrogen for 1 hour at room temperature,
ensuring that most of the air in the system was removed.
0.00E+00
1.00E-06
2.00E-06
3.00E-06
4.00E-06
5.00E-06
6.00E-06
0 50 100 150 200 250 300
Time(minutes)
Rea
ctio
n R
ate(
mol
/min
.) 10% Cyclohexene in ethanol5wt% Pt/Al2O3(3mg)Liquid Flow Rate =0.01mL/min.H2 Flow Rate= 7sccmT=22C

115
Using these procedures, stable reaction kinetics were obtained. Figure 4-6 shows
the time profile for the reaction rate using procedures outlined above. The reaction rate
initially declines 28% from 4.6×10⁻⁶ mol/min to 3.3 mol/min, but remains steady over the
course of two hours, deviating by less than 1%. This initial decay in the reaction rate is
consistent with cycloalkene hydrogenations.[81]
Figure 4-6. Cyclohexene hydrogenation in a single channel microreactor. With proper purification, the rate remains steady after an initial loss of activity.
Others report similar initial decay followed by steady reaction rate, attributing the
decay to an initial deposit of carbonaceous material on the catalyst. To further verify
experimental procedures, Figure 4-7 shows the reaction rate on the second day of
experiments using the same catalyst. After running the reaction for 10 hours at varying
conditions, the reactor and catalyst was left overnight sealed from exposure to air. Fresh
0.00E+00
1.00E-06
2.00E-06
3.00E-06
4.00E-06
5.00E-06
6.00E-06
0 50 100 150 200
Time (Minutes)
Rea
ctio
n R
ate
(mol
/min
.)
Single Channel Reactor10%Cyclohexene in Ethanol5wt% Pt/Al2O3T=30C∆P=6.5PSIG
Qliq=0.01 mL/min.QH2=10sccm

116
substrate was used and the reaction rate remained constant(deviating by only 2%) for
almost two hours. The reaction rate declined slightly from the end of the previous day by
approximately 10%. The gradual decline in reaction rate, as observed by the difference
in reaction rate from Figure 4-6 to Figure 4-7 prevents the extensive re-use of the catalyst
for the purposes of kinetics investigations. For all of the studies in this thesis, fresh
catalyst and substrate was used each day.
Figure 4-7. Cylohexene hydrogenation. Reaction rate remains steady for the second day of using the same catalyst and using a new substrate.
0.00E+00
1.00E-06
2.00E-06
3.00E-06
4.00E-06
5.00E-06
6.00E-06
0 50 100 150 200
Time (Minutes)
Rea
ctio
n R
ate
(mol
/min
.) Single Channel Reactor10%Cyclohexene in Ethanol5wt% Pt/Al2O3T=30C∆P=8PSIG
Qliq=0.01 mL/min.QH2=10sccm

117
4.6. Reaction Results
Conversions near 10% at liquid flow rates near 0.1 mL/min yielded observed
reaction rates ranging from 0.9×10⁻³ to 1.4×10⁻³ mol/(min. g cat.), depending on the flow
rates of the gas and liquid streams. For comparison, the intrinsic reaction rate was
estimated as 3.4×10⁻³ mol/(min. g cat.) from reported literature values and the measured
metal surface area. In general, the reaction rate (corrected for differences in pressure)
was observed to increase as the flow rate of either the gas or liquid was increased. This
suggests that mass transfer limitations play a role in the observed kinetics. In traditional
laboratory reactors, mass transfer coefficients vary with the liquid Reynolds number even
when the Reynolds number is small (typical Reynolds number for these experiments is
Re = 0.05).[83] The purity of the cyclohexene also affected the catalyst activity.
Without proper purification, the activity was observed to decrease significantly over the
course of several hours. Purification procedures were similar to those reported
elsewhere.[32] For all of the data reported, the kinetics were averaged over a time period
where the activity of the catalyst deviated by no more than 5% from the initial steady
reaction rate.
4.6.1. Activation Energy for the Cyclohexene Hydrogenation
With stable reaction kinetics, the influence of various parameters upon reaction
rate could be investigated without having to load a new catalyst for every experiment.
This also helped to eliminate any variations in reaction rate due to the amount of catalyst
loaded or the pre-treatment of the catalyst for each experiment. Figure 4-8 shows the
results for a single channel reactor loaded and the increase in reaction rate with increases

118
in temperature. Initially, the reaction rate showed steady behavior at T = 30 °C, and then
once the temperature was stabilized at the various set-points, three data points were
collected for each temperature. The conditions were identical for each temperature
(Liquid Flow Rate = 10 mg/min., Gas Flow Rate = 10 sccm). Table 4-1 lists the average
reaction rate along with the standard deviation and the reactor conditions. An
experimental activation energy was obtained from this data as seen in the Arrhenius plot
in Figure 4-9. Although the linear regression was excellent (r2=0.999), a slight standard
deviation in the temperature (~5%) causes for large errors in determining the activation
energy. From the data in Table 4-1, the activation energy, EA is calculated to be 18.5 +/-
5 kJ/mol. This value can be compared with the activation energy reported by Madon et
al, EA=25 +/- 2 kJ/mol. Even considering the error, the activation energy observed here
is lower and is likely due to a mass transfer influence. [60]
Table 4-1. Cyclohexene reaction rate versus temperature.
Temperature (°C)
Average Reaction Rate (mol/minute)
Standard Deviation
30.1 +/- 0.9 2.13×10⁻⁶ 2.7% 40.6 +/- 0.6 2.75×10⁻⁶ 2.0% 50.3 +/- 3.1 3.36×10⁻⁶ 2.0%
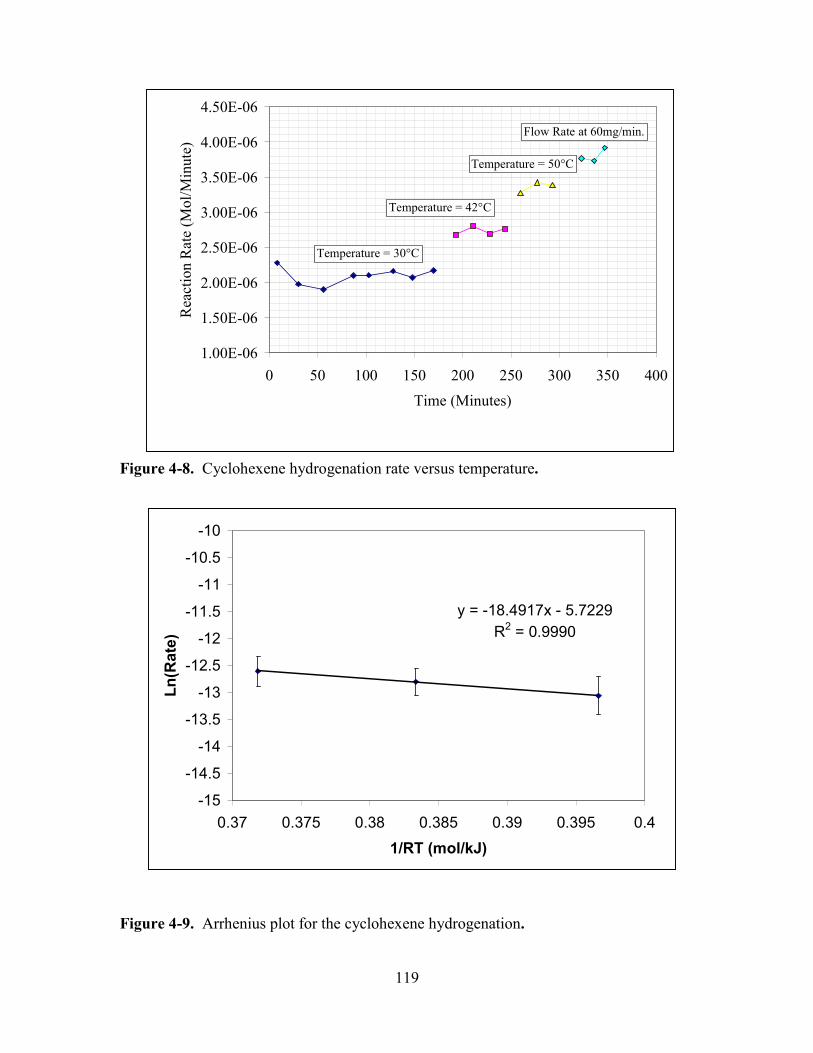
119
Figure 4-8. Cyclohexene hydrogenation rate versus temperature.
Figure 4-9. Arrhenius plot for the cyclohexene hydrogenation.
1.00E-06
1.50E-06
2.00E-06
2.50E-06
3.00E-06
3.50E-06
4.00E-06
4.50E-06
0 50 100 150 200 250 300 350 400Time (Minutes)
Rea
ctio
n R
ate
(Mol
/Min
ute)
Temperature = 30°C
Temperature = 42°C
Temperature = 50°C
Flow Rate at 60mg/min.
y = -18.4917x - 5.7229R2 = 0.9990
-15
-14.5
-14
-13.5
-13
-12.5
-12
-11.5
-11
-10.5
-10
0.37 0.375 0.38 0.385 0.39 0.395 0.41/RT (mol/kJ)
Ln(R
ate)
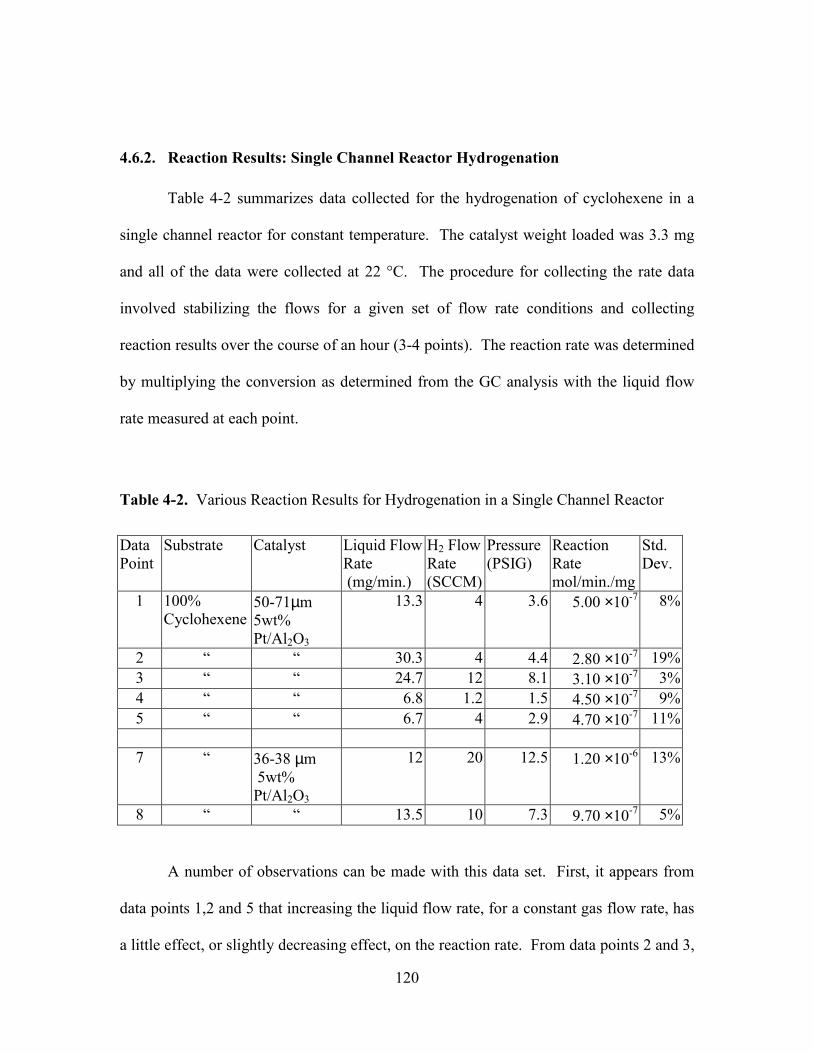
120
4.6.2. Reaction Results: Single Channel Reactor Hydrogenation
Table 4-2 summarizes data collected for the hydrogenation of cyclohexene in a
single channel reactor for constant temperature. The catalyst weight loaded was 3.3 mg
and all of the data were collected at 22 °C. The procedure for collecting the rate data
involved stabilizing the flows for a given set of flow rate conditions and collecting
reaction results over the course of an hour (3-4 points). The reaction rate was determined
by multiplying the conversion as determined from the GC analysis with the liquid flow
rate measured at each point.
Table 4-2. Various Reaction Results for Hydrogenation in a Single Channel Reactor
Data Point
Substrate Catalyst Liquid FlowRate (mg/min.)
H2 FlowRate (SCCM)
Pressure (PSIG)
Reaction Rate mol/min./mg
Std. Dev.
1 100% Cyclohexene
50-71µm 5wt% Pt/Al2O3
13.3 4 3.6 5.00 ×10⁻⁷ 8%
2 “ “ 30.3 4 4.4 2.80 ×10⁻⁷ 19%3 “ “ 24.7 12 8.1 3.10 ×10⁻⁷ 3%4 “ “ 6.8 1.2 1.5 4.50 ×10⁻⁷ 9%5 “ “ 6.7 4 2.9 4.70 ×10⁻⁷ 11% 7 “ 36-38 µm
5wt% Pt/Al2O3
12 20 12.5 1.20 ×10⁻⁶ 13%
8 “ “ 13.5 10 7.3 9.70 ×10⁻⁷ 5%
A number of observations can be made with this data set. First, it appears from
data points 1,2 and 5 that increasing the liquid flow rate, for a constant gas flow rate, has
a little effect, or slightly decreasing effect, on the reaction rate. From data points 2 and 3,

121
it can be observed that increasing the gas flow rate, for a given liquid flow rate, has little
effect on the reaction rate.
The effect of particle size can be more clearly observed in data points 7-8. The
reaction rate is higher for the smaller, more discrete particle size. Comparing data points
8 and 3, the reaction rate is 3X higher, even though the pressure is nearly the same. (The
pressure will determine the saturated solubility of hydrogen, and hence the reaction rate)
The effect on the pressure drop by the particle size is also observed for these points given
that the liquid flow rate is higher for the larger particle size.
Two conclusions can be drawn from this data set. First, the flow conditions have
less of an influence on the observed reaction rate as compared to the influence of the
particle size of the catalyst. The particle size effect could be caused by two mechanisms.
One mechanism is a diffusional limitation in the pores of the catalyst which would be
reduced for smaller particle sizes. This is unlikely to cause the reaction rate to increase
by a factor of three. In the section on mass transfer analysis, internal diffusion is
estimated to limit the reaction by only 20%. The most likely mechanism is the
distribution of the two phases throughout the packed bed. With the smaller particle sizes,
the bed is more likely to be uniform, and the pressure drop slightly higher such that the
phases get distributed throughout the bed of particles. In essence, for the smaller
particles, the bed is packed more uniformly and the utilization of the catalyst is greater.
The second conclusion is that pressure drop for the two-phase flow follows an
expected linear trend for increasing flow rates of the gas and liquid phases. The pressure
drop is more strongly dependant on the flow rate of the gas than that of the liquid,
according to data points 1-6.
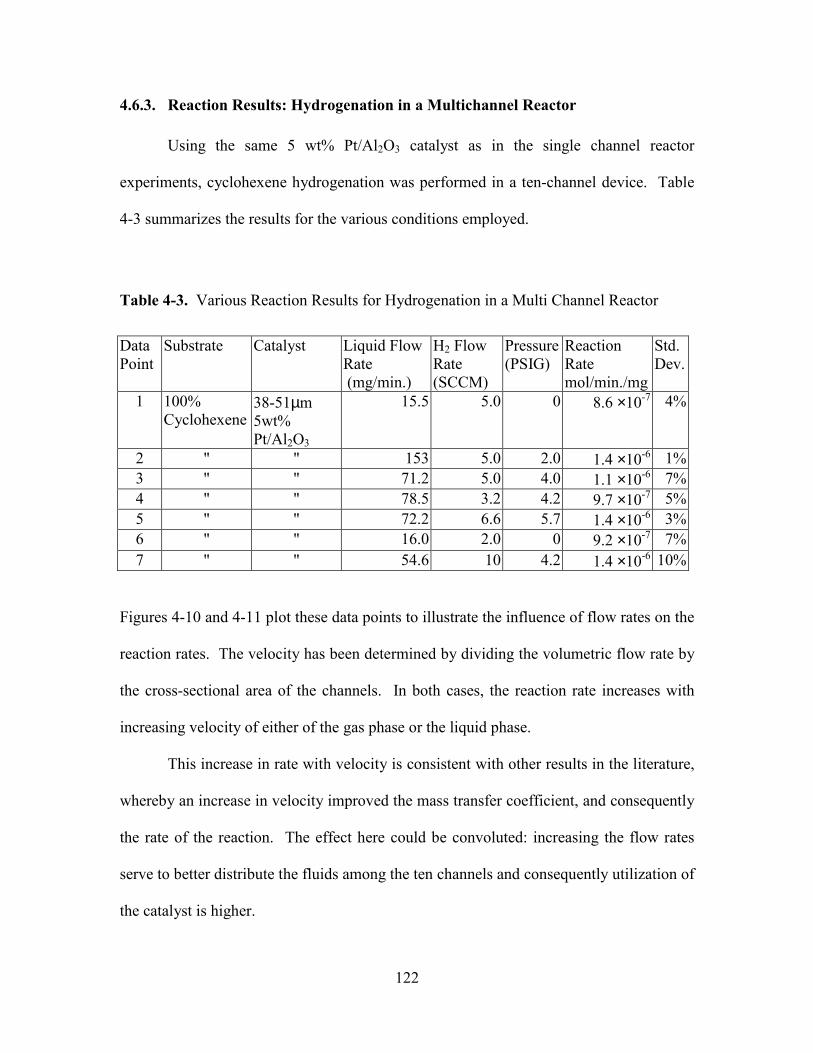
122
4.6.3. Reaction Results: Hydrogenation in a Multichannel Reactor
Using the same 5 wt% Pt/Al2O3 catalyst as in the single channel reactor
experiments, cyclohexene hydrogenation was performed in a ten-channel device. Table
4-3 summarizes the results for the various conditions employed.
Table 4-3. Various Reaction Results for Hydrogenation in a Multi Channel Reactor
Data Point
Substrate Catalyst Liquid Flow Rate (mg/min.)
H2 Flow Rate (SCCM)
Pressure(PSIG)
Reaction Rate mol/min./mg
Std. Dev.
1 100% Cyclohexene
38-51µm 5wt% Pt/Al2O3
15.5 5.0 0 8.6 ×10⁻⁷ 4%
2 " " 153 5.0 2.0 1.4 ×10⁻⁶ 1%3 " " 71.2 5.0 4.0 1.1 ×10⁻⁶ 7%4 " " 78.5 3.2 4.2 9.7 ×10⁻⁷ 5%5 " " 72.2 6.6 5.7 1.4 ×10⁻⁶ 3%6 " " 16.0 2.0 0 9.2 ×10⁻⁷ 7%7 " " 54.6 10 4.2 1.4 ×10⁻⁶ 10%
Figures 4-10 and 4-11 plot these data points to illustrate the influence of flow rates on the
reaction rates. The velocity has been determined by dividing the volumetric flow rate by
the cross-sectional area of the channels. In both cases, the reaction rate increases with
increasing velocity of either of the gas phase or the liquid phase.
This increase in rate with velocity is consistent with other results in the literature,
whereby an increase in velocity improved the mass transfer coefficient, and consequently
the rate of the reaction. The effect here could be convoluted: increasing the flow rates
serve to better distribute the fluids among the ten channels and consequently utilization of
the catalyst is higher.

123
Figure 4-10. Reaction rate dependence on liquid velocity for the cyclohexene hydrogenation in a multichannel reactor. The increase in activity is due to a combination of improved mass transfer and better distribution of the reagents to the catalysts.
Figure 4-11. Reaction Rate dependence on gas velocity for the cyclohexene hydrogenation in a multichannel reactor.
Figure 4-12 compares the rate data in the multi-channel reactor with the data in
the single channel reactor. Two observations can be made. First, is that the reaction rate
is consistently higher in the multichannel reactor compared with a single channel reactor.
Second, that increasing the liquid velocity increases the rate in the multichannel reactor,
0.00E+00
2.00E-07
4.00E-07
6.00E-07
8.00E-07
1.00E-06
1.20E-06
1.40E-06
1.60E-06
0.000 0.050 0.100 0.150 0.200Liquid Velocity(cm/s)
Rat
e(m
ol/m
in/m
g)
0.00E+00
2.00E-07
4.00E-07
6.00E-07
8.00E-07
1.00E-06
1.20E-06
1.40E-06
1.60E-06
20 30 40 50 60 70 80 90Gas Velocity(cm/s)
Rat
e(m
ol/m
in/m
g ca
t)

124
where liquid velocity has little to no influence on the reaction rate in the single channel
reactor. This second point would indicate that the distribution of the fluids in the
multichannel reactor is the predominate mechanism whereby the reaction rate is
improved. The fact that the rate per mass of catalyst is higher in the multichannel reactor
indicates that the fluids are distributed evenly to some degree, i.e. there is no gross flow
maldistribution where 20-30% of the catalyst is unused. The productivity of the
multichannel reactor is consistent with the fact there is nearly 10X the amount of catalyst.
For data point 7 of table 4-3 (multichannel), the conversion is 9% at 55mg/min, or 5
mg/min of product, while for data point 7 of table 4-2 (single channel), the conversion is
at 2.3% at 12 mg/min, or a production rate of 0.3 mg/min.
Figure 4-12. Comparison of reaction rates for the cyclohexene hydrogenation in the single channel reactor and the multichannel reactor.
0.00E+00
2.50E-07
5.00E-07
7.50E-07
1.00E-06
1.25E-06
1.50E-06
1.75E-06
2.00E-06
2.25E-06
2.50E-06
0 0.1 0.2 0.3 0.4 0.5Liquid Velocity(cm/s)
Multichannel ReactorFH2=5 SCCMDp=38-50µm
Single-channel ReactorFH2=4 SCCMDp=53-71µm
Single-channel ReactorFH2=10 SCCMDp=38-50 µm
Rea
ctio
n R
ate(
mol
/min
/mg)

125
4.6.4. 1 Wt% Pt/Al2O3 Reaction Results
The results of Figure 4-12 indicate that reaction rates improved with smaller
particle size. The effect could be the result of a number of factors. One is the liquid
diffusion mass transfer, one is the gas-liquid mass transfer, the other is the catalyst
utilization, or distribution efficiency to the catalyst. To see if reaction rates could be
improved further, size fractions for the alumina catalyst were used that consisted of
particles smaller than 36 µm. The capabilities of traditional sieve equipment limit the
size of filtration to 36 µm. The result is that the size distribution could in effect, be very
large. The pressure drop was expected to increase as a result of the smaller particles, but
the expected tradeoff would be in terms of better distribution of the fluids and higher
reaction rate. In Section 4-3, the results of the improved flow distribution are
demonstrated. Table 4-4 summarizes the results for the 1% Pt / Al2O3 catalyst in the
microreactor.
Table 4-4. Various Reaction Results for Hydrogenation in a Multi Channel Reactor
Data Point
Substrate Catalyst Liquid FlowRate (mg/min.)
H2 Flow Rate (SCCM)
Pressure(PSIG)
Reaction Rate mol/min./mg
Std. Dev.
1 100% Cyclohexene
<36µm 1wt% Pt/Al2O3
75 10 10.1 2.0 ×10⁻⁶ 6%
2 " " 15 3.2 4.2 9.0 ×10⁻⁷ 7%

126
4.7. Batch Experiments
Batch experiments were performed as an alternative means to arrive at an intrinsic
rate constant and to check the applicability of the rate data provided in the literature. The
experimental set up and procedure are briefly described. A 250 mL, three neck flask was
fitted with a thermometer, a gas inlet line, and a magnetic stirrer. The ports on the flask
were sealed with a neoprene rubber septum. In a nitrogen glove box, the flask was
charged with a certain amount of cyclohexene and catalyst, such that the catalyst to
substrate ratio was low (~1:100). Once the flask was sealed, it was transferred from the
glove box to a fume hood and connected to the hydrogen gas inlet line. Prior to the
commencement of stirring, the gas volume above the substrate in flask was purged three
times with hydrogen. Once the flask was charged with hydrogen, stirring was initiated
and this was taken as time zero for the reaction. After certain intervals of time, samples
(~200 µL) were withdrawn from the flask and analyzed using GC-MS.
Figure 4-13 plots the reaction results in the form of conversion versus time.
Conversion was determined on the basis of the relative peak areas for the total ion
chromatograms. If A1 and A2 are the integrated peak areas for cyclohexene and
cyclohexane respectively, then the conversion, X is
This assumes that the substrate is only converted to a single product and that the peak
area is linearly proportional to the concentration of the species. Both assumptions were
verified. No other products for the reaction were detected and the peak response was
calibrated with concentration and found to have a linear dependence.
21
2
AAAX+
=

127
0.0%1.0%2.0%3.0%4.0%5.0%6.0%7.0%8.0%9.0%
0 20 40 60 80 100 120Time(minutes)
Con
vers
ion
Figure 4-13. Batch/Slurry reactor results for cyclohexene hydrogenation. 10 mL of pure cyclohexene, 54 mg of 1wt%Pt/Al2O3 sieved to <36 µm, T=22 °C.
The conditions of the reaction were the following: 10 mL of pure cyclohexene, 54 mg of
1wt%Pt/Al2O3 sieved to <36 µm, T=22 °C. Figure 4-14 plots the data as a reaction rate
versus time. The reaction rate at each data point was calculated using the total
conversion to that point and dividing by the total time elapsed. The reaction rate
increased over time, approaching a steady value for the last three points of 1.25×10⁻⁷
mol/s/cm3 +/- 3%, or 1.4 mol/(min mg cat). The initial increase in reaction rate is
presumably due to some initial activation of the catalyst. Using a solubility of hydrogen,
Csat(H2) = 3.6×10⁻⁶ mol/cm3, a surface area of the catalyst (5700 cm2/g), and a catalyst
loading of 5.4×10⁻³ g/mL, the intrinsic rate constant would be,
ksur = 1.13×10⁻³ cm/s

128
This value is only 40% of the rate constant predicted by the literature values above. This
would suggest that even the batch reaction has a certain mass-transfer limitation
associated with it.
0.00E+002.00E-084.00E-086.00E-088.00E-081.00E-071.20E-071.40E-07
0 20 40 60 80 100 120Time(minutes)
Rea
ctio
n R
ate(
mol
/s/c
m3 )
Figure 4-14. Reaction rate results for cyclohexene hydrogenation in a batch / slurry reactor using the data from Figure 4-13.
The gradual increase in reaction rate to the steady value of 1.25×10⁻⁷ is not due to
absorption of the hydrogen into the liquid. There is indeed an induction period during
which the hydrogen absorbs into the liquid. But if that time were on the same scale as the
induction for the reaction rate (~10 minutes), then the Kla, or the characteristic time scale
would have to be on the order 0.001 s-1 (1/10minutes). If the Kla were this low, then the
maximum steady state reaction rate (Rmax = Kla*CsatH2) would have to be 3.6×10⁻⁹
mol/s/cm3. The steady state reaction rate is in fact much higher than this. A possible
explanation for the induction period is the gradual activation of the catalyst due to

129
reduction of metal sites. The catalyst may not be fully reduced at the start of the reaction
and during the course of the experiment more surface sites may become available for
reaction.
The same procedures were used to determine the reaction rate for the 5wt% Pt/Al2O3
catalyst. For a catalyst size of 53-71 µm, the reaction rate, using the batch reactor, was
measured as 2.6×10⁻⁶ mol/(min mg cat).
4.8. Reaction Results Summary
Figure 4-15. Expected reaction rates for a range of mass transfer rates using the intrinsic reaction rate for the cyclohexene hydrogenation. Reported values of Kla would produce reaction rates several orders of magnitude lower than the rates observed in the microreactor.
Calculated Overall Reaction Rates versus Mass Transfer Coefficients
1.00E-10
1.00E-09
1.00E-08
1.00E-07
1.00E-06
1.00E-05
0.001 0.01 0.1 1 10 100
kLa(s-1)
Expe
cted
Rea
ctio
n R
ate
(mol
s/s)
Lowest Observed Reaction Rate
Highest Observed Reaction Rate
Typical Values for kLa (s-1)
aKk
CRate
L
*H
112
+=
η

130
4.9. Microfluidics Results
4.9.1. Fluid Flow Characterization.
In traditional laboratory reactors involving multiple phases, the behavior of the
multiphase fluid flow can have a substantial effect on the performance of the reactor.
Various flow regimes can exist ranging from bubbling flow to pulsing flow and are
traditionally characterized by a flow regime map.[84] Flow regimes in the
microfabricated reactor have been characterized visually using optical microscopy.
Figures 4-16 and 4-17 illustrate the nature of the gas-liquid flow for various flow rates of
the hydrogen/organic liquid system. For low liquid and gas velocities, bubbles form at
the distributor and are carried by the liquid to the packed-bed. When the flow rates
become sufficiently high, the liquid wets the walls of the channel prior to the packed bed
and a stable gas-liquid interface develops. For a given liquid flow rate, as the gas flow
rate increases, the gas-liquid interface near the distributor (see Figure 4-17) begins to
oscillate in a pulsing fashion. With a continued increase in the gas flow rate, the relative
phases become more segregated, resulting in a periodic "drying-out" of the packed bed.
Figure 4-19 is a photomicrograph comparing the bed packing between a liquid pulse and
a gas pulse. Figure 4-18 compares the transition point from steady flow to pulsing flow
with a regime map originally proposed by Charpentier in 1975. [84]
Though it has been shown that operating in a pulsing flow regime can improve
performance, it complicates the interpretation of mass transfer and kinetic data.[85]
Therefore, for all of the experimental kinetic data reported here, the reactor was operated

131
in the steady co-current flow regime. In traditional packed-bed reactors, pulsing flow can
cause major pressure fluctations that can cause mechanical damage to the packing.
Figure 4-16. Fluid flow regime characterization in single channel reactor.
(A) "Bubble flow", Liquid flow rate =10 µL/min, gas flow rate = 1 sccm. (B) "Steady" Co-current Flow, liquid flow rate =10 µL/min, gas flow rate = 5 sccm.
A
Gas-Liquid Interface
B

132
Figure 4-17. Photomicrograph of pulsing flow.
Single channel reactor, liquid flow rate = 10 µL/min, gas flow rate = 10sccm. Time sequence illustrates the oscillatory behavior of the gas-liquid interface near the inlets.
t = 0 s
t = 2.5 s
t = 1 s

133
Figure 4-18. Flow transition point versus superficial mass velocities: microreactor compared with published laboratory reactor. Microreactor Cyclohexene/H2 Charpentier Flow Map
Figure 4-19. Drying out of the catalyst bed due to a gas pulse. A) Packed-bed with both gas and liquid flow. B) Drying out of the porous catalyst in the packed bed. As the pulse of gas travels
through the bed, the liquid evaporates.
0.1
1
10
100
1000
0.0 0.0 0.1 1.0 10.0G(kg/(m2 s))
L/G
'Trickling Flow'
'Pulsing Flow'
500 µm
A B

134
4.9.2. Flow Distribution
One of the traditional problems in reactor design, particularly for multiphase
reactions, is one of uniform distribution of reagents throughout the reactor volume. Since
each of the two reactants are present as different phases, both phases must access the
catalytic sites within the porous particles. Capillary forces tend to cause the liquid to wet
the porous catalyst. As a result, the gas phase reagent must diffuse through the liquid
film surrounding the particle. In a traditional trickle-bed reactor, the catalysts are in the
form of cylindrical pellets 4-10 mm in diameter. The pellets fill the tubular reactor in a
random arrangement. So in addition to the microscale issue of gas and liquid reagents
diffusing to the catalytic sites, there is an issue of macro scale distribution. Gas and
liquid phases must be uniformly distributed at the reactor inlet, and the packed-bed itself
must promote a uniform co-current flow through the reactor volume. Traditional
equipment for trickle-bed reactors employ a liquid spray at the top of the reactor to
distribute the liquid reactant within the gas phase. But as the diameter of the overall
reactor increases, either as a result of scale-up or in the reactor geometry proposed in
chapter 2, it becomes much more difficult to manifold the distribution of the two reagents
across the large inlet area.
Ideally, each pellet would be wetted with the liquid reagent and surrounded by the
gas phase. In reality, flow patterns develop in which the liquid wets clusters or bundles
of pellets and the gas phase has a much longer path of diffusion to the pellets in the center
of the cluster. In the reverse case, gas-phase flow may predominate along certain
channels throughout the packed-bed resulting in collections of catalytic pellets which are
completely dry and absent of any liquid phase. In these dry zones, the only reaction is

135
that in the vapor phase which is likely to be much slower owing to the limited volatility
of reagents used in three-phase processes. These macroscale flow maldistributions
results from variations in the packing density. Other effects for industrial reactors
include the physical attrition of catalyst pellets to form particle ‘fines’ which block the
flow and increase the pressure drop.
Poor flow distribution is a traditional engineering challenge for packed-bed
reactors. In the packed-bed microreactors of this thesis, similar issues associated with
flow distribution were observed. The effect was more pronounced in the multichannel
design. The ten parallel channels operate independently: there is no transfer of flow
between adjacent channels. The consequence of this is that if there is an irregularity in
the packing at any point along the length, then flow gets diverted at the start of the
reaction channel, rather than at the start of the irregularity. The packing irregularity
could be a higher frequency in voids between adjacent particles, in which case the
pressure drop would be reduced and attract flow. The opposite effect could be one where
a cluster of smaller particles pack tightly, thus repelling flow to the other channels. The
flow distribution in this microreactor depends upon the arrangement of the packing
because the packing is the most significant pressure drop in the system. Figure 4-20
illustrates some of these effects for liquid flow rates near 0.1 ml/min. and gas flow rates
near 20 sccm.

136
Figure 4-20. Flow maldistribution in the packed beds.
A) Gas channeling in beds with 50-70 µm particles. B) Channels now filled with 36-38 µm particles. Because of uneven loading or packing density, the liquid completely bypasses several of the channels..
In figure 4-20A, gas and liquid phases are distributed among the inlet manifold,
but are diverted once reaching the start of the reaction channels. As can be seen in the
figure, a reaction channel has formed a rivulet of gas, effectively causing the gas to
bypass most of the catalytic particles. In the channel immediately below, flow is entirely
liquid. No gas flow penetrates into the packing, and the result is that the reaction is
limited by the absence of the gas reactant. The packing in figure 4-20A is of the particle
A
B
Gas phase channeling
Liquid flow only
Liquid flow only
Gas flow only

137
size 51-73 µm. Assuming that the average particle size is 60 µm, then the ratio of
channel diameter to particle size is 10:1 across the width and 5:1 across the depth. The
general consensus in the reaction engineering literature is that this ratio should be at least
10:1 in order for a uniform arrangement of the particles to develop. To accomplish this,
smaller particles with a tighter size distribution (36-38 µm) were loaded into the reactor
and the flow behavior analyzed. The result was that the mode of catalyst loading had a
more severe impact on the flow distribution. Figure 4-20B shows the two-phase flow in a
multichannel reactor loaded with 36-38 µm alumina particles. The flow in the top two
channels is entirely liquid, while that in the bottom channels of the picture are filled
entirely with gas. The intermediate channel demonstrates some flow of both phases,
suggesting that the packing density, or pressure drop steadily varies across the channels.
The pressure drop is the least near the top, since the higher viscosity liquid will have a
greater resistance to flow and divert to the channels with the lowest resistance. The
variation in packing density across the channels is due to loading of the catalyst into the
channels sequentially, rather than simultaneously. The lower channels finished loading
first, and gradually the channels were filled from bottom to top. The reasons the channels
loaded in this fashion is that the bottom-most catalyst inlet port was used to deliver the
particle slurry, while the top catalyst inlet port was used only to receive excess particle
flow.
When both catalyst inlet ports were used to deliver the particle slurry, in addition
to a cross flow provided by the gas and liquid inlets, the particles filled the channels
simultaneously, thus allowing for a more even packing distribution among the ten
channels. The effects can be observed in Figure 4-21. In Figure 4-21A, the two phases

138
are evenly distributed. The channel at the bottom still contains liquid stagnation regions,
but for most of the device the flow is much more uniform. Figure 4-21B, indicates the
flow at the exit. The ports immediately after the particle filter were used to confirm two-
phase flow in each channel, as the gas-liquid interface could be easily observed.
Figure 4-21. Even distribution of multiphase flow in a packed-bed.
36-38µm catalyst particles. A) Entrance. B) Exit streams illustrating co-current flow at the outlets.
Gas-Liquid interface
Even distribution
Liquid ‘Pockets’
A B

139
4.9.3. Two-Phase Flow Pressure Drop
The pressure drop in the ten parallel channel reactor followed the expected trend
based on equation (1): for similar flow rates, the pressure was reduced by a factor of ten.
The experimental two-phase pressure drop is plotted in Figure 4-22 for the single-channel
reactor. The gas flow rate is constant at 4 sccm and the liquid flow rate varies. The
expected pressure drop on the basis of the liquid flow alone and using the Ergun equation
is plotted with the experimental data. The two-phase pressure drop is a factor of 2-3
times higher than that predicted for single phase flow alone. As expected, the gas flow is
occupying a portion of the void volume and the effective volume available for the liquid
is reduced.
Figure 4-22. Two-phase pressure drop in a single channel reactor. The addition of gas flow at 4sccm increases the pressure drop.
0
0.5
1
1.5
2
2.5
3
3.5
4
4.5
5
0 5 10 15 20 25 30 35
Liquid Flow Rate (mg/min.)
DP(
PSIG
)
Ergun Equation for Liquid Flow Only

140
4.10. Summary
In this chapter, the catalytic hydrogenation of cyclohexene to cyclohexane was
used as a model multiphase chemical reaction to characterize the performance of the
microreactors. The first step was to determine the intrinsic kinetics, that is the reaction
rate in the absence of any mass transfer or diffusional limitations. This was
accomplished by extrapolating rate data from the literature as well as performing batch,
slurry reactor experiments. The second step was to achieve stable reaction kinetics so as
to determine the influence of various parameters, such as flow rates and temperature, on
the reaction rate. Poisoning and deactivation of the catalyst was prevented by employing
careful preparation procedures for the catalyst and substrate. Having determined the
intrinsic rate and maintaining stable reaction kinetics, reaction rate data was collected in
the single channel reactor and in the multichannel reactor for various flow rates,
temperatures, and catalysts.
Performing the multiphase reaction also allowed the characterization of the fluid
flow in the microreactors. The two-phase flow in the micro packed-beds varied
depending upon the relative rates of the gas and liquid streams. Various flow regimes
were observed, such as bubbling flow, steady flow, and pulsing flow, and were found to
be consistent with flow regimes observed in conventional reactors. The flow distribution
presented a challenge in the multichannel reactor because the fluid flow was found to be
highly sensitive to the loading density of the catalyst for each of the ten channels.
Nevertheless, flow conditions were achieved such that the reaction performance in the
microreactor could be quantitatively assesed and compared with conventional reactor
design.

141
5. Mass Transfer and Reactor Analysis
The reaction results from chapter 4 indicate that the reaction rates in the
microreactors are dependant upon the flow rates of the gas and liquid phases and the
particle size of the catalyst, even when the same reaction conditions are employed
(temperature, pressure, catalyst). This is consistent with a wide range of multiphase
reaction processes where the reaction rate is inhibited by mass transport effects. When
the observed reaction rate for a given reactor is less than expected based on the intrinsic
kinetics of the chemical reaction, a physical transport process is often the culprit. Any
number of approaches could be used to describe the influence of the transport upon the
reaction process, but the model used here is a thin-film approach consistent with
traditional chemical reaction engineering analysis. This allows a meaningful comparison
with reactor analyses in the literature, even if the physical description is not always exact.
A number of factors can have a deleterious effect upon the reaction rate, including
flow distribution (catalyst wetting efficiency), and mass transport of a reactant species to
the catalytic site. For fast reactions, the gas-phase reactant can become depleted in the
liquid-phase and the rate of gas absorption into the liquid or diffusion within the liquid to
the catalyst can become rate limiting. In the thin-film approach to mass transport, the
rate of material transport is linearly related to a concentration gradient by a mass transfer
coefficient, kL. The higher the mass transfer coefficient, the higher the rate of mass
transfer for a given reactor configuration.
A number of assumptions are required in order to apply this thin-film approach.
First, is that the mass transfer coefficient is the same everywhere in the reactor. Provided
that the catalyst loading density is the same, the catalyst particle size is the same, and that

142
the reactor is isothermal, this is not a difficult assumption to make. The more difficult
assumption is that the reaction conditions are at steady state. This assumes that the rate
of gas absorption into the liquid is balanced by the rate at which it is consumed by the
reaction. This assumption is addressed in the next section.
After addressing these assumptions, this chapter provides a justification for the
use of a heterogeneous reaction to assess mass transfer and then a justification for using
co-current gas-liquid flow for the reactors. After which, the model for the mass transfer
of the gas-liquid-solid reaction is derived. Using this model, the mass transfer
coefficient, KLa is calculated based on the reaction results of the previous chapter. In this
way, a quantitative assessment of the microreactor’s performance is provided on the basis
of experimental evidence.
5.1. Is the steady-state assumption for gas absorption valid?
For most of the mass transfer analysis, steady state operation is assumed. Given
that the design of the reactor calls for a short, wide reactor geometry, entrance effects
could become significant. To determine if this is the case for absorption of hydrogen into
the liquid, the time required to saturate the liquid for a given mass transfer is calculated.
The time to reach saturation is the inverse of the KLa. If KLa is 1 s-1 (lower bound for
values observed in the microreactor) and the solubility, Csat, is 3.6×10⁻⁶ mol/cm3, then the
rate of absorption is 3.6×10⁻⁶ mol/cm3/s and the time to reach Csat is 1 second. For a
liquid flow rate of 0.1 mL/min, a reactor volume of 0.04 mL, the residence time, τ, is 24
seconds. Hence, the time the reactants spend in the reactor is much longer than the time
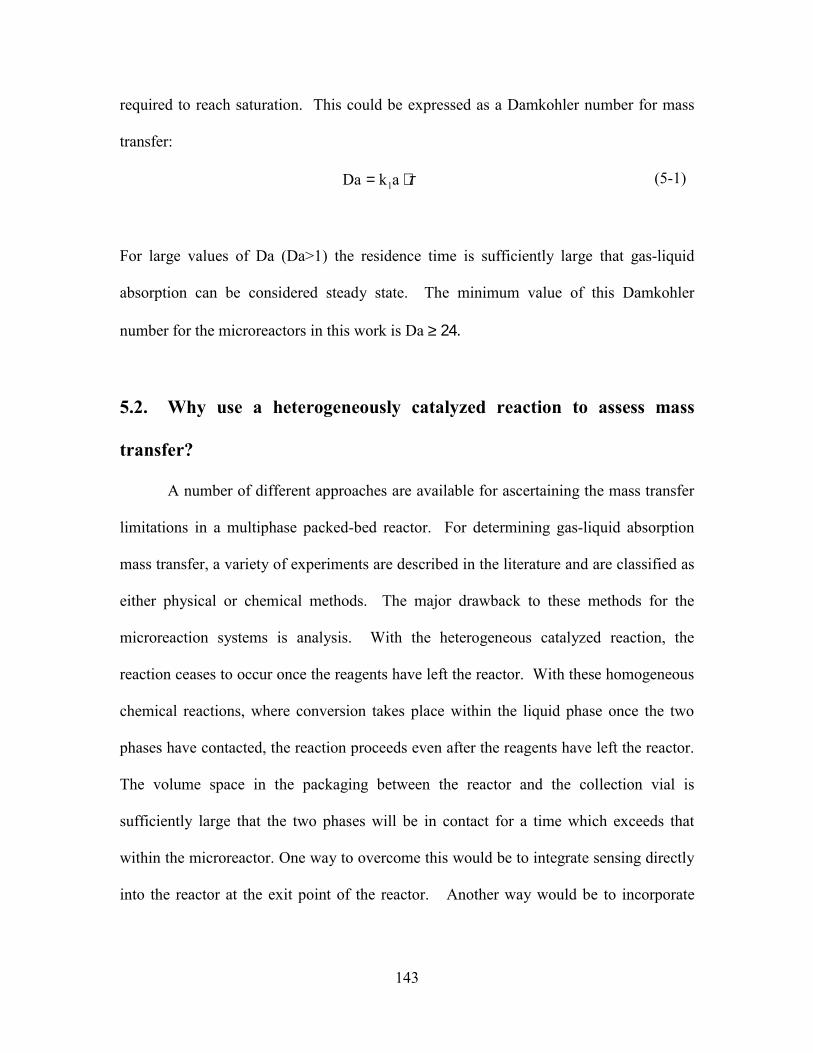
143
required to reach saturation. This could be expressed as a Damkohler number for mass
transfer:
τ⋅= akDa l (5-1)
For large values of Da (Da>1) the residence time is sufficiently large that gas-liquid
absorption can be considered steady state. The minimum value of this Damkohler
number for the microreactors in this work is Da ≥ 24.
5.2. Why use a heterogeneously catalyzed reaction to assess mass
transfer?
A number of different approaches are available for ascertaining the mass transfer
limitations in a multiphase packed-bed reactor. For determining gas-liquid absorption
mass transfer, a variety of experiments are described in the literature and are classified as
either physical or chemical methods. The major drawback to these methods for the
microreaction systems is analysis. With the heterogeneous catalyzed reaction, the
reaction ceases to occur once the reagents have left the reactor. With these homogeneous
chemical reactions, where conversion takes place within the liquid phase once the two
phases have contacted, the reaction proceeds even after the reagents have left the reactor.
The volume space in the packaging between the reactor and the collection vial is
sufficiently large that the two phases will be in contact for a time which exceeds that
within the microreactor. One way to overcome this would be to integrate sensing directly
into the reactor at the exit point of the reactor. Another way would be to incorporate
144
some means for quenching the reaction, either by temperature or some other chemical
reaction.
5.3. Why is Co-Current Flow Necessary?
Different modes of operation could be envisioned for reacting the liquid substrate
with the hydrogen gas. One mode would be to pre-mix the liquid and gas until the liquid
was saturated with the gas and then react the mixture over the catalyst. To understand
why this is not possible and why co-current flow of the hydrogen is necessary, consider
the following argument. The saturated solubility of hydrogen in cyclohexene, for
example, is 3.6×10⁻⁶ mol/cm3. Given the molecular weight (82 g/mol) and density (0.8
g/cm3) the concentration of pure cyclohexene (1×10⁻² mol/cm3) is 10,000 times larger
than the concentration of hydrogen. Even at elevated pressures, the concentration of
hydrogen dissolved and available for reaction is extremely low. At even the slightest
amount of conversion, all of the hydrogen will be consumed. As the hydrogen is
consumed from the liquid media, it must be continually replenished.

145
5.4. Mass Transfer Analysis: Model Derivation
To arrive at a quantitative assessment of mixing between the gas and liquid
phases in the microreactor, mass transfer coefficients can be calculated and compared
with values reported in the literature. In order to have an accurate comparison of
performance, the same methodology used in the literature for determining the mass
transfer coefficient was employed. The accuracy of a particular model in describing the
mass transfer is not as important as consistency between the study here and the results
available in the literature. Provided the method of analysis is the same, mass transfer
coefficients measured in the microreactor can be used to make a direct comparison of
performance with conventional reactors.
The result of using a heterogeneously catalyzed multiphase reaction is that several
mass transfer resistances are possible. Figure 5-1 depicts schematically the different mass
transfer steps for a gas-liquid-solid reaction.
Figure 5-1. Mass transfer resistances for gas-liquid-solid reaction. The hydrogen must transport to the gas-liquid interface, dissolve within the liquid, transport to the bulk liquid(gas-liquid mass transfer), transfer from the bulk liquid to the surface of the catalyst particle (liquid-solid mass transfer), and diffuse within the pores of the catalyst to the active metal sites (represented by the effectiveness factor η).
PH2(gas)
r = ηηηηk[H2](s)
[H2] (interface)
[H2] (Bulk)
LiquidGas
Gas-Liquid Interface
Porous Catalyst Particle

146
For multiphase reactions, the overall reaction rate can be expressed in terms of a
sum of these resistances in series. The mass transfer resistances for gas-transport consist
of diffusion within the gas-phase to the gas-liquid interface, gas absorption into the
liquid, diffusion of the dissolved gas from the bulk liquid to the catalyst surface, and
diffusion of the species inside the porous catalyst. Each of these will be treated
individually, although gas-liquid absorption is consistently treated as the most significant
resistance. The treatment follows that of Fogler.[59] Diffusion of the liquid reactant can
also present a resistance if its concentration is low (such as at high conversions or
dissolved substantially within a solvent). For the treatment here, the concentration is
high enough that diffusion of the liquid will not be significant. This also allows the
analysis to concentrate on transport of the gas reactant, where most of the resistance will
occur during absorption into the liquid phase.
In general, a mass transfer coefficient relates the molal mass flux to a
concentration gradient,
)CC(kN bil −⋅= (5-2)
Where N (mols m-2 s-1)is the mass flux, Ci (mols m-3)is the concentration of a particular
species at the interface, Cb is the concentration in the bulk and kl (m s-1)is the mass
transfer coefficient.[86] This form can be use to represent mass transport across an
interface as well as within a phase, such as from the bulk to the surface of the catalyst.

147
5.4.1. Mass Transfer Analysis: Gas-Liquid Absorption
For the case of gas-liquid absorption, (hydrogen absorbing into a liquid stream)
and using equation 5-2, Ci would be the concentration at the gas-liquid interface and Cb
would be the concentration of hydrogen dissolved in the bulk of the liquid.
The total rate of gas absorption in the microreactor, Rateab, depends on the total
interfacial area between the gas and liquid in the reactor, Ai (m2). The rate of absorption
is the product of the flux and the area,
)CC(AkANRate biiliAbsorption −⋅⋅=⋅= (5-3)
where Rateab(mols s-1), is the rate of gas absorption.
Since the exact interfacial area is difficult to measure, many of the reported correlations
lump kL and a together, where a is the specific area. To get the above rate of absorption
in terms of a specific area, a (m-1), we would need to divide by the microreactor
volume(m3).
orMicroreact
i
VAa =
(5-4)
Substituting 5-4 into 5-3 gives:
)CC(akV
Ratebil
orMicroreact
Absorption −⋅⋅= (5-5)
At steady state, the rate of gas absorption is equal to the rate of reaction.
actionReAbsorption RateRate = (5-6)
For the case of cyclohexene hydrogenation, the reaction is zero order in cyclohexene and
1st order in hydrogen. Because of the assumption of steady state, and the molal flow rate

148
of hydrogen greatly exceeds that required for complete conversion, the concentration of
hydrogen is constant. Therefore, the rate is constant throughout the reactor and the global
rate of conversion for the microreactor, from a kinetics standpoint, depends only on the
amount of catalyst in the reactor. The rate of reaction can be directly measured by
analyzing the rate at which the product leaves the reactor,
XFFRate outactionRe ⋅== (5-7)
where F (mol s-1) is the molar flow rate of substrate into the reactor, and X is the
conversion, 0-100%.
Substituting (5-4) and (5-5) allows one to go from the experimentally determined value
for Ratereaction to the rate of absorption for the gas (assuming there are no other
diffusional resistances).
)CC(akVRate
bilorMicroreact
actionRe −⋅⋅= (5-8)
What remains is the unknown value for the bulk concentration in the liquid, Cb.
Ultimately, it can be related to the concentration on the surface of the catalyst, and hence
the intrinsic reaction rate, through the liquid-phase mass transfer.
The entire volume of the microreactor is used in this analysis to arrive at a 'volumetric'
reaction rate. In most cases, the volume of the liquid phase in the reactor is used. If the
concentration of the substrate before and after reaction is used to arrive at a reaction rate,
then the residence time within the reactor is required. For a given flow rate, the entire

149
empty volume of reactor provides a conservative estimate. In actuality, portions of the
volume are filled with catalyst (porous) as well as gas.
Alternatively, we could divide the above expression by the density of catalyst in
the volume of the reactor, ρV, to get the rate of reaction per mass of catalyst. This reactor
mass density is equal to the product of the density of the catalyst, ρc, and the fraction of
the reactor volume that is solids.
L4mg3
VMass
orMicroreact
CatalystV µ
ρ ≈= (5-9)
CVV )1( ρερ ⋅−= (5-10)
where εV is the void fraction and ρc is the density of the catalyst particles.
The result is,
)CC(ak)1(
1MassV
VRate
bilVCCatalyst
orMicroreact
orMicroreact
actionRe −⋅⋅⋅−⋅
=⋅ερ
(5-11)
)CC(ak)1(
1'r bilVC
A −⋅⋅⋅−⋅
=−ερ
(5-12)
where -rA’is the reaction rate per mass of catalyst, mol s-1 g cat-1
Equation 11 is the form that can be found in Fogler’s analysis for trickle-bed reactors.
(equation CD12-2). This form is not required for the analysis since the mass of catalyst
would cancel out, leaving only the volume of the bed, as in equation 7.
In all treatments of multiphase mass transfer, the gas and liquid phases are
assumed to be in equilibrium directly at the interface. Consequently, Ci can be
represented by the saturated solubility of the gas in the liquid phase, a property easily

150
measured. This saturated solubility of the gas is related to the pressure in the gas phase at
the interface by Henry’s law:
2g CHHP ⋅= (5-13)
In some cases, the concentration of the gas-phase reactant at the gas-side of the interface
is itself limited by transport within the gas-phase. The rate of gas-side mass transfer can
be represented by,
)PP(AkRate ibig −= (5-14)
For the sake of completeness, the gas-side mass transfer is included, but is negligible for
this analysis. The gas-phase is pure hydrogen and the flow of hydrogen is in considerable
excess relative to the stoichiometric amounts required by the reaction..
5.4.2. Mass Transfer analysis: Liquid Film resistance
Lumping the liquid film resistance into the overall mass transfer coefficient
provides a conservative estimate for the gas-liquid absorption mass transfer. To see what
contribution, if any, the liquid diffusion might have, several calculations were performed.
The first, is to use the classical Frossling correlation, which relates the Sherwood number

151
to the Reynolds number for flow past a sphere. This correlation is typically used in the
context of a slurry reactor, where the catalyst particles can be treated as independant
spheres within the fluid media. The applicability to packed-beds of the Frossling
correlation is debatable, but is presented here for reference. Other, more complicated
correlations exist in the literature, but determining the applicability of those correlations
is beyond the scope of this thesis. The second approach, which represents the absolute
minimum, is to assume a solid surface area equivalent to that of the microstructured
reactor, and then to estimate the mass transfer coefficient on the basis of stagnant
diffusion.
The Frossling correlation provides one estimate for kc:
3/12/1pc Sc*Re*6.02Ddk
Sh +== (5-15)
For a liquid flow velocity of 0.1 cm/s (corresponding to a flow rate of 0.1 mL/min the
10 channel device) the Reynolds number is 0.05. (based on a characteristic length of
50µm)
The Schmidt number for hydrogen in organics is approximately 50.

152
Table 5-1. Values of the Sherwood number for various Reynolds numbers
Re Sc Sh kc(cm/s)
0.05 50 2.5 0.08
1 50 4.2 0.14
10 50 9.0 0.28
(D = 50 µm, D = 1.6 x 10⁻⁴ cm2/s)
Calculation of ap
The surface area per volume reactor of the catalyst particles can be estimated by
assuming a spherical shape for the particles and assuming a void fraction in the reaction
channel, ε of 0.4. In this case,
)1(R3)1(
R34
R4a3
2
p ε−=ε−×π
π=
R εεεε ap
25 µm 0.4 720 cm2/cm3
For Re = 0.05, kcap = 58 s-1
The packed bed is in fact a loosely ordered arrangement of near-spherical
particles with a distribution of particle sizes. Mass transfer to a submerged sphere may
give an approximate measure, but can not take into account the flow effects of adjacent
particles and voids. The finite volume of gas within the voids also makes an accurate
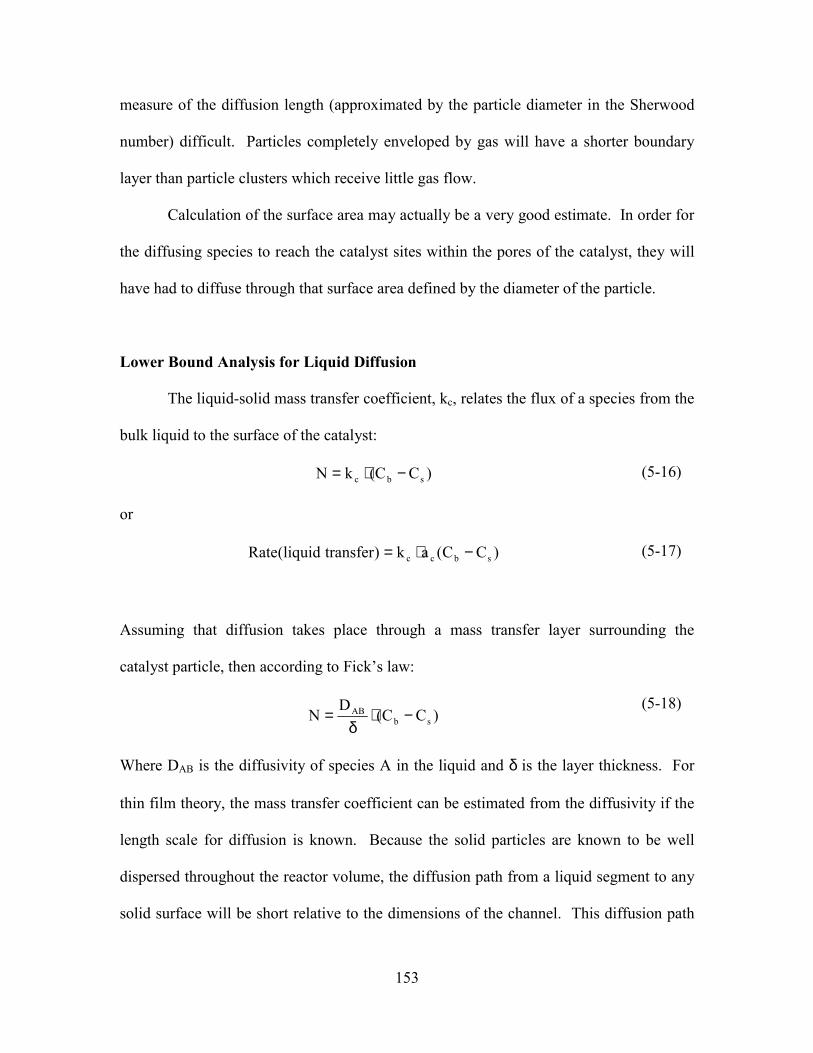
153
measure of the diffusion length (approximated by the particle diameter in the Sherwood
number) difficult. Particles completely enveloped by gas will have a shorter boundary
layer than particle clusters which receive little gas flow.
Calculation of the surface area may actually be a very good estimate. In order for
the diffusing species to reach the catalyst sites within the pores of the catalyst, they will
have had to diffuse through that surface area defined by the diameter of the particle.
Lower Bound Analysis for Liquid Diffusion
The liquid-solid mass transfer coefficient, kc, relates the flux of a species from the
bulk liquid to the surface of the catalyst:
)CC(kN sbc −⋅= (5-16)
or
)CC(ak)transferliquid(Rate sbcc −⋅= (5-17)
Assuming that diffusion takes place through a mass transfer layer surrounding the
catalyst particle, then according to Fick’s law:
)CC(DN sbAB −⋅δ
= (5-18)
Where DAB is the diffusivity of species A in the liquid and δ is the layer thickness. For
thin film theory, the mass transfer coefficient can be estimated from the diffusivity if the
length scale for diffusion is known. Because the solid particles are known to be well
dispersed throughout the reactor volume, the diffusion path from a liquid segment to any
solid surface will be short relative to the dimensions of the channel. This diffusion path
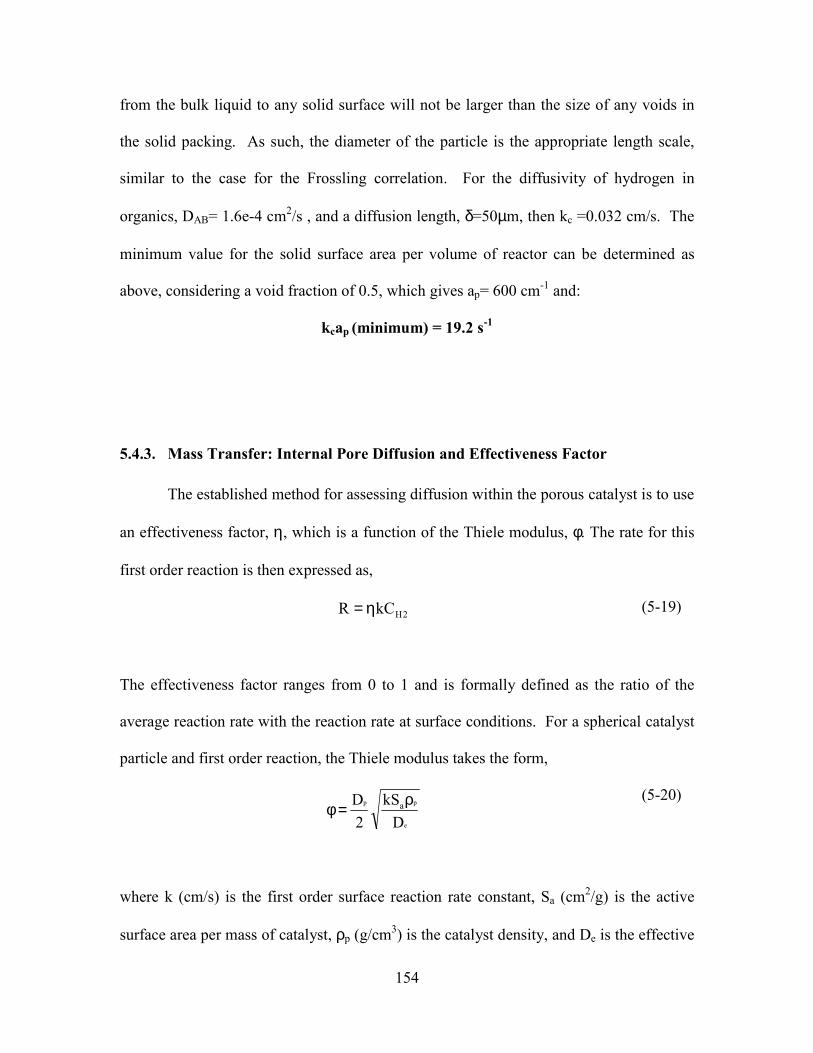
154
from the bulk liquid to any solid surface will not be larger than the size of any voids in
the solid packing. As such, the diameter of the particle is the appropriate length scale,
similar to the case for the Frossling correlation. For the diffusivity of hydrogen in
organics, DAB= 1.6e-4 cm2/s , and a diffusion length, δ=50µm, then kc =0.032 cm/s. The
minimum value for the solid surface area per volume of reactor can be determined as
above, considering a void fraction of 0.5, which gives ap= 600 cm-1 and:
kcap (minimum) = 19.2 s-1
5.4.3. Mass Transfer: Internal Pore Diffusion and Effectiveness Factor
The established method for assessing diffusion within the porous catalyst is to use
an effectiveness factor, η, which is a function of the Thiele modulus, φ. The rate for this
first order reaction is then expressed as,
2HkCR η= (5-19)
The effectiveness factor ranges from 0 to 1 and is formally defined as the ratio of the
average reaction rate with the reaction rate at surface conditions. For a spherical catalyst
particle and first order reaction, the Thiele modulus takes the form,
e
pp
DkS
2D aρ=φ
(5-20)
where k (cm/s) is the first order surface reaction rate constant, Sa (cm2/g) is the active
surface area per mass of catalyst, ρp (g/cm3) is the catalyst density, and De is the effective

155
diffusivity in the porous catalyst. The square of the Thiele modulus represents the ratio
of the characteristic time for diffusion to the characteristic time for the reaction.
Kawakami and co-workers determined the effective diffusivity of hydrogen and
cyclohexene in porous alumina catalysts, De = 2.7×10⁻⁵ cm2/s. [79]Using this diffusivity
and the reaction rate constant determined by Madon, ksur = 2.8×10⁻³ cm/s, the Thiele
modulus was calculated. For a 50 µm diameter spherical catalyst particle, φ = 1.9. The
relationship between the Thiele modulus and the effectiveness factor for a spherical
catalyst and a first order reaction is,
)1coth(32 −φφ
φ=η
(5-21)
Using equation 5-21, the effectiveness factor is 82%. The effectiveness factor for a
typical catalyst pellet with a diameter of 1 mm is 8%. Consequently, for this fast
reaction, internal diffusion is likely to be rate limiting using standard catalyst pellets. An
additional benefit to using the microreactor, in addition to improved gas-liquid
absorption, is the reduced diffusional limitations within the pores of the catalyst as a
result of using small 50 µm diameter particles.
5.4.4. Mass Transfer Analysis: Steady State Rate Expression
At steady state, the concentration of hydrogen in the liquid phase, as well as
hydrogen adsorbed to the catalyst is assumed to be constant. The rate of gas absorption
into the liquid as well as the rate of diffusion balances the rate of reaction at the surface
of the catalyst. Equating equations 5-3, 5-14, 5-17, and 5-19 and eliminating the bulk

156
liquid concentration provides a rate expression in terms of the mass transfer coefficients,
the intrinsic rate constant and the saturated solubility of hydrogen.
SATA
PClg
A C)
k1
ak1
ak1
akH1(
1'r ⋅
η++
⋅+
⋅⋅
=− (5-22)
CASAT , the equilibrium solubility of hydrogen, related to the pressure by Henry’s constant
H, Henry’s constant
kg, gas-side gas-liquid mass transfer coefficient
kl, liquid-side gas-liquid mass transfer coefficient
kc, liquid-solid mass transfer coefficient
For all of the analysis here, the gas phase consists of pure hydrogen. Consequently, gas-
side mass transfer can be considered negligible and can be eliminated from the rate
expression.
For simplicity of analysis, we could also lump the mass transfer resistances into a single
diffusional resistance which is limiting the reaction rate,
PClL ak1
ak1
aK1 +
⋅=
(5-23)
Therefore, the rate expression reduces to :
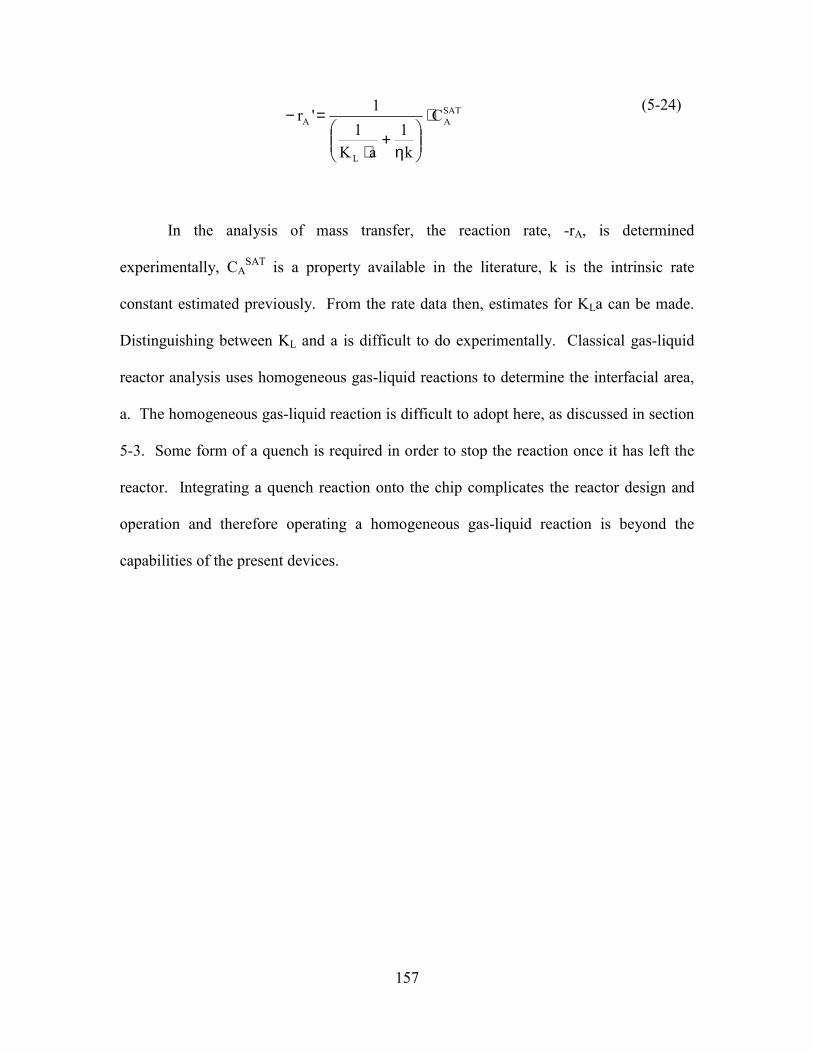
157
SATA
L
A C
k1
aK1
1'r ⋅
η+
⋅
=− (5-24)
In the analysis of mass transfer, the reaction rate, -rA, is determined
experimentally, CASAT is a property available in the literature, k is the intrinsic rate
constant estimated previously. From the rate data then, estimates for KLa can be made.
Distinguishing between KL and a is difficult to do experimentally. Classical gas-liquid
reactor analysis uses homogeneous gas-liquid reactions to determine the interfacial area,
a. The homogeneous gas-liquid reaction is difficult to adopt here, as discussed in section
5-3. Some form of a quench is required in order to stop the reaction once it has left the
reactor. Integrating a quench reaction onto the chip complicates the reactor design and
operation and therefore operating a homogeneous gas-liquid reaction is beyond the
capabilities of the present devices.

158
5.5. Mass Transfer Coefficients in the Microreactor
Using equation 5-24, the rate data from tables 4-2 and 4-3, and accounting for
solubility changes with the pressure, the following mass transfer coefficients can be
determined. If the rate taken from the work of Madon et al. can be considered the
intrinsic rate, then the mass transfer coefficients can also be calculated for the batch
reactions. The intrinsic rate for the 5% Pt/Al2O3 catalyst was determined in this manner.
The intrinsic rate for the 1% Pt catalyst, as determined from the literature value in Madon
et al., was used to determine the Kla of the batch experiments. Assuming that the KLa is
the same for all batch experiments (the vessel, stirring speed, catalyst concentration and
particle size were all the same) then the intrinsic rate for the 5% catalyst can be
determined as in Table 5-2. The overall mass transfer coefficient was found to be in the
range of 3-15 s-1 for the 1% Pt/Al2O3 catalyst. In determining the specific contribution to
mass transfer by gas-liquid absorption, the gas-liquid absorption mass transfer
coefficient, kla, could be as high as 33 s-1 if the minimum rate for liquid-solid mass
transfer is assumed. Overall these values for the mass transfer coefficients compare very
favorably to values reported in the literature for other laboratory scale reactors.

159
Table 5-2. Mass Transfer coefficients calculated in the microreactor
Reaction Rate at 1 atm M
Intrinsic Rate Constant η
ksap KLa kLa mol/(min mg) g/cm3 s-1 1% wt Pt/ Al2O3, Multichannel Reactor, Maximum Observed Rate 2.00×10⁻⁶ 0.83 13.28† 1 ∞
10.3 10.3 2.00×10⁻⁶ 0.83 13.280.82 ∞ 12.4 12.4 2.00×10⁻⁶ 0.83 13.280.82 2012.4 32.7 1% wt Pt/ Al2O3, Multichannel Reactor, Minimum Observed Rate 9.10×10⁻⁷ 0.83 13.280.82 ∞ 3.5 3.5 Batch Reaction w/ 1% Pt/ Al2O3 1.43×10⁻⁶ 0.0054 0.08640.82 ∞ 0.04 0.04 Batch Reaction w/ 5% Pt/ Al2O3 2.60×10⁻⁶ 0.0036 0.11* 0.82 ∞ 0.04 0.04 Maximum Observed Rate 5% wt Pt/Al2O3 1.4×10⁻⁶ 1.075 32.900.82 ∞ 8.1 8.1Minimum Observed Rate 5% wt Pt/ Al2O3 2.80×10⁻⁷ 0.825 25.250.82 ∞ 1.0 1.0† Intrinsic Rate = ksurAcm
* Calculated on the basis of kLa
5.6. Rate of Gas Absorption versus Mass Transfer Coefficients
Mass transfer coefficients have been used throughout reactor design as a means
for accurately scaling up processes and predicting reaction performance for a given
process configuration. In comparing two reactors, however, mass transfer coefficients
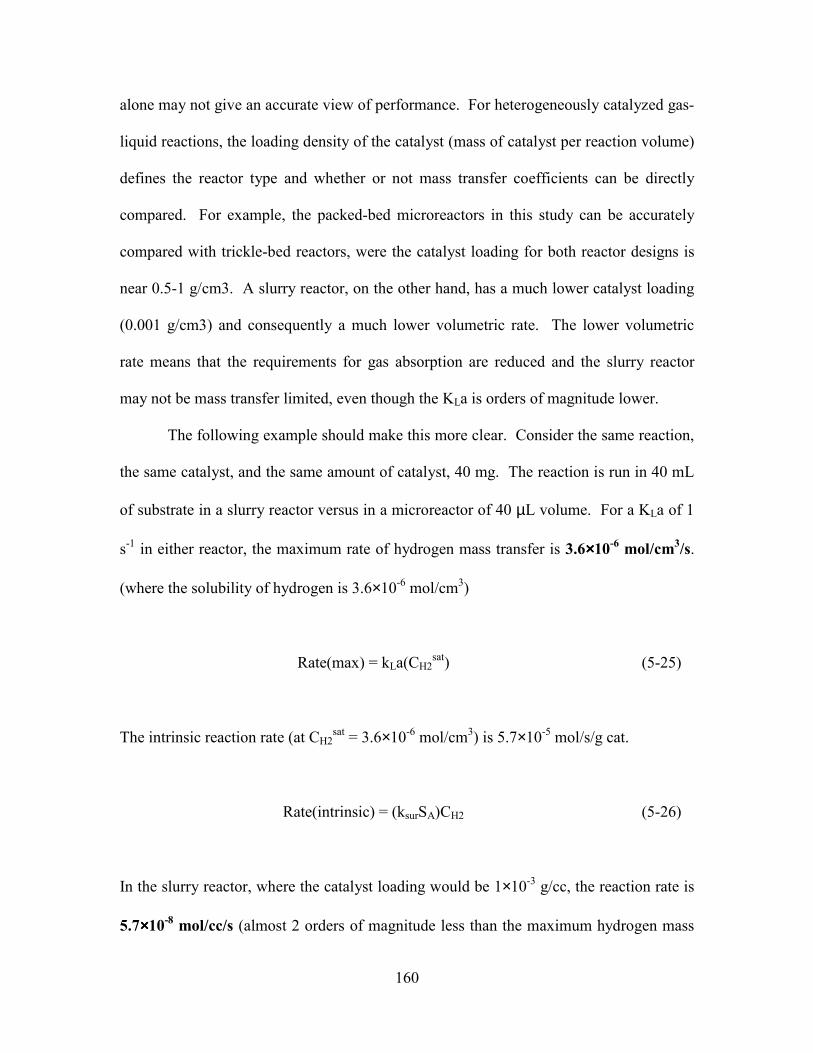
160
alone may not give an accurate view of performance. For heterogeneously catalyzed gas-
liquid reactions, the loading density of the catalyst (mass of catalyst per reaction volume)
defines the reactor type and whether or not mass transfer coefficients can be directly
compared. For example, the packed-bed microreactors in this study can be accurately
compared with trickle-bed reactors, were the catalyst loading for both reactor designs is
near 0.5-1 g/cm3. A slurry reactor, on the other hand, has a much lower catalyst loading
(0.001 g/cm3) and consequently a much lower volumetric rate. The lower volumetric
rate means that the requirements for gas absorption are reduced and the slurry reactor
may not be mass transfer limited, even though the KLa is orders of magnitude lower.
The following example should make this more clear. Consider the same reaction,
the same catalyst, and the same amount of catalyst, 40 mg. The reaction is run in 40 mL
of substrate in a slurry reactor versus in a microreactor of 40 µL volume. For a KLa of 1
s-1 in either reactor, the maximum rate of hydrogen mass transfer is 3.6××××10-6 mol/cm3/s.
(where the solubility of hydrogen is 3.6×10⁻⁶ mol/cm3)
Rate(max) = kLa(CH2sat) (5-25)
The intrinsic reaction rate (at CH2sat = 3.6×10⁻⁶ mol/cm3) is 5.7×10⁻⁵ mol/s/g cat.
Rate(intrinsic) = (ksurSA)CH2 (5-26)
In the slurry reactor, where the catalyst loading would be 1×10⁻³ g/cc, the reaction rate is
5.7××××10-8 mol/cc/s (almost 2 orders of magnitude less than the maximum hydrogen mass

161
transfer rate). In the microreactor, where the catalyst loading is 1g/cc, the reaction rate is
5.7××××10-5 mol/cc/s which is now higher that the maximum rate of hydrogen mass transfer.
In order for the reaction to proceed at the rates observed in this study (1.4×10⁻⁵ - 2.3×10⁻⁵
mol/cc/s), the KLa value must be larger than 1 s-1 in the microreactor.
The important criteria in determining the mass transfer limitations is the rate of
gas absorption in the reaction volume relative to the rate of reaction per volume. At first
glance, it may seem appropriate to simply compare the rate constants (in this case Kla(s-
1) and ηk (~16s-1)). For the case of the slurry reactor where kLa =0.001 s-1, it would
appear that mass transfer limitations predominate even though its actually not the case.
The volumetric rate constant k, is defined in terms of the catalyst loading density which
varies between the reactors. To assess this relative influence, we define a parameter Ψ,
which is a ratio of the maximum rate of gas absorption in the reaction volume to the
maximum intrinsic volumetric reaction rate:
mA)C()C(kCaK
catySat
2Hx
liqsur
Sat2HL
η⋅=ψ
(5-21)
Where m is the catalyst loading density, x is the order of the reaction for the liquid
reagent and y is the order of the reaction for the gaseous reactant. Table 5-3 compares Ψ
for various reactor configurations and mass transfer coefficients.

162
Table 5-3. Comparison of mass transfer coefficients for various reactors.
Reactor Kla m ksur (x=0, y=1) Acat CH2sat Ψ
s-1 g/cm3 cm/s cm2/g mol/cm3 Packed-bed Microreactor 15 0.9 2.80×10⁻³ 5700 3.60×10⁻⁶ 1.0Trickle-Bed Reactor 0.1 0.9 2.80×10⁻³ 5700 3.60×10⁻⁶ 0.01Slurry Reactor 0.01 0.001 2.80×10⁻³ 5700 3.60×10⁻⁶ 0.63
For the microreactors, the rate of gas absorption is on the same scale as the rate of
reaction, which is appropriate for conducting a mass transfer analysis. If intrinsic
kinetics analysis were desired, then Ψ should be much larger than 1 so that gas
absorption is not limiting. In making a comparison between reactors or in determining
the extent of mass transfer limitation, this ratio provides a more accurate assessment
relative to just comparing the mass transfer coefficients by themselves.
An important observation is that as the activity of the catalyst is reduced (the
metal surface area or Acat) Ψ increases, and the importance of gas-liquid mass transfer
diminishes. This suggests that to operate a reactor efficiently, the volumetric reaction
rate should be reduced so as to not be limited by the gas absorption rate. To achieve
overall productivity from the reactor, the total reactor volume can be made sufficiently
large that the total amount of catalytic surface area meets the demands of the process.
This explains the need to construct increasingly larger reactors. If space is not a
premium, then the most efficient method of reactor operation is to have small specific
catalyst activities and large reactor volumes.

163
5.7. Summary
Using traditional thin film theory to describe the mass transfer resistances in a
gas-liquid-solid reaction, the mass transfer coefficients were determined experimentally
for several microfabricated devices. The hydrogenation of cyclohexene to cyclohexane
using a platinum supported on alumna catalyst was used as a model reaction. Using the
rate data from chapter 4, the volumetric mass transfer coefficient, KLa, was determined to
fall in the range:
KLa = 3-10 s-1
Accounting for diffusion within the pores of the catalyst and assuming that mass transfer
within the liquid film could be a contributing factor, the mass transfer coefficient for gas-
liquid absorption was found to be as high as:
kLa (maximum observed value) = 33 s-1
These values for the mass transfer coefficient are at least 100 times larger than values
reported in the literature. But as discussed in section 5-6, mass transfer coefficients are
useful only when comparing reactors with comparable catalyst loading densities, such as
among packed-bed reactors. But even comparing the packed-bed microreactors of this
study with conventional multiphase packed bed reactors, the mass transfer capabilities are
greatly improved.
164
6. Microstructured Catalytic Reactors
6.1. Introduction
Micromachining technology promises the ability to create novel fluidic structures
unattainable using conventional fabrication methods. The ability to create arrays of
interconnected features scaling down as small as microns is the hallmark of silicon and
semiconductor manufacturing methods. Although the principle use of silicon has been
for electronics, silicon has been considered as a structural material for the creation of
miniature mechanical devices for some time. The excellent thermal and mechanical
properties of silicon, coupled with the fabrication infrastructure for integrated circuit
manufacturing, makes silicon micromachining one of the leading candidates for creating
the world in miniature. It provides the machinist access to a range of microscopic sizes
and dimensions and can create arrays spanning orders of magnitude in size relative to the
small features. So while conventional milling or laser drilling may be able to construct a
single feature 0.05 mm in size, silicon micromachining can make thousands of 0.05 mm
features in the space of a square centimeter—all at one time.
The packed-bed multichannel reactors in this thesis provide a good example of
some of the capabilities of micromachining technology, such as the small filter unit, the
parallel array of channels, the integrated thin film heaters and temperature sensors, and
the fluidic manifold. But the functional unit of the reactor is still the catalyst particle
which has been filtered from standard catalyst powders. The reactors are in essence,
scaled-down versions of their macro-scale counterparts. The issues associated with
packing and loading of the catalytic powders are the same as those faced with
165
conventional packed-bed reactors. The difference with the microfluidic packed-beds is
that the reactor geometry can be tailored in such a way that the pressure drop for using
extremely small particles is manageable. But despite the control over pressure drop,
providing an even loading density among all ten channels is problematic. Slight
variations lead to uneven distributions in flow and poor reactor efficiency. A reactor
could be designed such that the pressure drop is determined from the microfluidic
channels, rather than the packed bed of particles. Since the microfluidics are precisely
defined, the flow distribution is guaranteed to be evenly distributed provided the pressure
drop of the packing is much smaller than the pressure drop of the microfluidics. This
approach, however, limits the overall size of the reactor and compromises reactor
productivity. As seen in chapter 4, even for reaction channels 2 cm in length, the
pressure drop can be near 10 psi. In order to provide distributed flow, the channels either
have to be made much shorter, or the pressure drop required would exceed the
capabilities of the experimental setup (section 2.5). Another approach to achieving
evenly distributed flow is to integrate the catalytic support structures directly into the
walls of the reaction channel. The reactor design presented in this chapter is an
illustration of a chemical reactor which would not have been possible without
micromachining methods.
For fast multiphase reactions, the rate and selectivity of the chemical process can
be greatly influenced by the mass transfer limitations of one reagent's transport within
and across phases. Using silicon micromachining technology, reactor devices have been
constructed that demonstrate improved mass-transfer for gas-liquid heterogeneously

166
catalyzed processes.[87] In these devices, standard catalyst particles 50-75 µm diameter
were loaded into silicon channels with an integrated filter unit. While the small particles
provide the high surface areas for improved gas-liquid mixing, they also represent a
challenge in terms of pressure drop and fluid distribution among the ten parallel channels.
Expanding upon that work, the next generation of reactors presented here, consist of
integrated catalyst supports, as opposed to packed-beds. The channels are patterned with
arrays of columns, 50 µm in diameter, 300 µm tall, with nearly 20,000 columns per
device. Figure 1-1 shows one of these parallel channel devices and figure 6-1 shows the
microstructural features within the channels. By constructing these microstructured
channels, a packed bed is simulated where the geometric properties (support size, shape
and distribution) are controlled. As a result of the extreme uniformity of the packing
arrangement, control over fluid flow is greatly enhanced. Since fabrication of the
columns is straightforward using deep reactive ion etch technology, the challenge then
becomes incorporating the catalyst into these structures such that the activity is
comparable to that of the standard catalysts. The microstructured channels also provide
for enhanced visual characterization of two-phase flow in microchannels.
The ability to construct arrays of microstructural features using silicon
microfabrication has been investigated for other applications. It has been found that
surfaces composed of arrays of micro columns exhibit dramatic differences in wetting
characteristics.[88] In that study, only columns with diameters smaller than 32 µm
exhibited ‘ultra hydrophobicity,’ that is a contact angle considerably higher than smooth
silicon, relative to smooth surfaces or even arrays of larger columns. The primary
difference with that study and the work here is that the water-air flow is on top of the

167
surface, as opposed to through the columns of the microreactors here. But it is important
to point out that as a result of engineering the microtextures of the surfaces that dramatic
differences in gas-liquid behavior can be achieved.
Both packed-beds and microstructured channels have appeared before in the
context of microfluidic systems and will likely continue to find application in
microfluidic analysis and reaction.[89, 90] In one case, the surface of the columns was
used to abstract and collect DNA from flowing solutions.[91] In another case, the surface
of the microfabricated channels was functionalized to perform the chromatographic
separation.[92] For heterogeneous catalytic applications, the activity is greatly enhanced
if the catalytic component is supported upon a porous layer. Creating this highly active
layer within microreaction devices has received attention from several groups.[93-95]
Janicke and co-workers[94] used a CVD method to obtain porous alumina layers in their
microreactors Laurell and co-workers[95] have demonstrated porous silicon as a support
structure for their immobilized enzyme reactors. The activity of the enzyme reaction is
greatly enhanced over the non-porous channels as a result of the increase in surface area.
In a device presented here, the microstructured silicon channels have been made porous
in a similar fashion and impregnated with a platinum catalyst for the multiphase
hydrogenation reactions. Whereas features of the present work have appeared in other
contexts, the fabrication and application are unique, particularly in the case of the
multiphase mass transfer analysis.

168
6.2. Microstructured Reactor Device Design
In order to construct a chemical system on a chip, the following features were desired:
a) the ability to mix multiple reagents, whether of the same phase or different phases b)
the ability to heat the reaction zone and measure the temperature and c) the ability to
incorporate catalytic activity whether by standard catalytic particles or integrated
catalytic layers. Two similar devices have been designed toward this end. Both consist
of multiple reaction channels connected in parallel. In the first design, the channels (300
µm deep, 625 µm wide, 20 mm long) are empty and contain a filter structure near the exit
to retain a packed-bed of catalytic particles (Figure 6-1A). The second device contains
staggered arrays of 50 µm columns within the channels to provide both catalyst support
and static mixing (Figure 6-1B).
Figure 6-1. CAD illustration of the two reactor design options. A) Open channel with filter for filling with catalytic particles. B) Microstructured channel with staggered arrays of columns
A B

169
6.2.1. Multiphase Microfluidics Design
The first function for the reaction devices described in the present work is to mix
two reagents on-chip. As discussed in chapter 2, a number of strategies have emerged for
passively mixing fluids at these scales owing to the laminar nature of the fluid flow.[48-
52] The goal is to reduce diffusional lengths and generally this is done by splitting up
and interleaving the inlet streams. Another strategy, with an added level of fabrication
complexity, makes use of chaotic advection[53, 54] The approach taken here uses the
continuos flow split and mix strategy.
Mixing multiple phases, such as a gas and liquid, at the micro scale is more
problematic: interfacial forces cause the phases to rapidly coalescence. Keeping the
fluids dispersed in order to reduce diffusional length scales is considerably more difficult
as compared to mixing two liquids of similar physical properties. Nevertheless, improved
gas-liquid contacting has been demonstrated in this and other microchannel applications.
[41, 70] As the dimensions of the device shrink, capillary forces have more of an impact
on fluid flow. The Young-Laplace equation, ∆P = 2γ/r, can be used to estimate the
minimum pressure needed to overcome surface tension(γ) effects for a gas-liquid
interface in a small channel.[71] For a 10 µm channel radius and water (γ = 72 dyn/cm),
∆P = 0.14 atm. Therefore, the dimension for the inlet mixing channels (25 µm wide) is
not so small that surface tensions effects would become prohibitive.
The 10 reaction channels are 2 cm long, 600 µm wide, and 300 µm deep. Each of
the ten channels is connected by a 500 µm wide channel running perpendicular near the
inlet. The multitude of inlet streams first meet here and this region is considered the
‘mixing zone.’ The channel has been retained for the microstructured reactor, although

170
its function for delivering the catalyst slurry is no longer required. In fact, the presence of
this open channel prior to the reaction channels may be deleterious. After separating the
two phases into 90 separate, interleaved inlet streams, the gas and liquid flows rapidly
coalesce before meeting at the reaction channel.
At the end of the 2 cm long channels are filter structures consisting of 40 µm wide
columns with a separation gap of 25 µm. After the filter, the fluids exit via a 400 µm
diameter port to the bottom silicon layer, where all ten exit streams are collected to a
single port. The difference between the packed-bed device and the microstructure one is
simply the arrays of columns patterned into the channels; all the other fluidics are the
same.

171
6.2.2. Microstructured Catalyst Design
For the microstructured device, the ten reaction channels contain the integrated
catalyst support structures as seen in Figure 6-1. Figure 6-2 is a scanning electron
micrograph of the actual reaction channels containing these columns. The posts, 50 µm
in diameter and 300 µm tall, are arranged in staggered arrays and provide for a void
fraction of 60%. Compared with packed-beds, which for spherical packing have a void
fraction of 40%, the microstructured channels will have a reduction in pressure drop with
only a small reduction in catalyst volume. The geometry of the posts (cross-section and
spacing) was chosen for simplicity and ease of fabrication. A denser arrangement of
posts could be possible, depending on the limits of the DRIE process. These
micromachined features, in conjunction with the gas-liquid inlet distributors, serve to
provide a high surface area for improved gas-liquid contacting.
In order to attain comparable catalytic activity with the standard catalytic
particles, it is necessary to increase the surface area even further. This could be
accomplished by coating with a porous layer, or, as in the devices here, create a porous
layer within the substrate itself. Methods for making silicon porous are readily integrated
into a fabrication process.
The microstructured design is unique to microfabrication; such a design with
small, high aspect ratio features, would be impractical, even for a prototype, to
manufacture using conventional machining methods.

172
Figure 6-2. SEM of DRIE etched microstructured reaction channels. The scalloped surface of the post is due to etch process which consists of alternating chemistries.
50 µµµµm
25µm
A
B

173
6.3. Fabrication
The fabrication for the microstructured reactor is similar to the multichannel
device with the exception of a few steps required for integrating porous silicon. All the
masks are the same except for the one which defines the microstructured reaction
channels. As a result, some of the design features have been inherited from the
multichannel reactor, such as the catalyst inlet ports, the catalyst loading channels, and
the filter structure at the end of the channels. Although the filter structure no longer
serves any functional role, the geometries between the multichannel and the
microstructured reactors are identical in order to make a direct comparison in reaction
performance. The microstructured reactor involves the use of a silicon nitride layer as
mask for the electrochemical etching process which forms the porous silicon.[96] Figure
6-3 depicts the process flow outlining the six major fabrication steps. Silicon nitride,
5000 Å thick, was deposited onto the silicon wafers using a vertical tube furnace (VTR).
Onto the silicon nitride was spin coated the thick resist to 10 µm (Figure 6-3, step 1). An
SF6 plasma process (Applied Materials Precision 5000) was used to etch the silicon
nitride (Figure 6-3, step #2). The deep channels were then formed in the silicon on both
sides using the same STS etch process as before (Figure 6-3, step #3). A thin layer of
aluminum (2000 Å) was added to the back of the wafer to provide uniform electrical
contact during the porous silicon formation process (Figure 6-3, step#4). After creating
the porous silicon (step#5), the aluminum was removed from the backside using a PAN
etch (10:3:1 phosphoric acid, acetic acid, nitric acid) for about 1 hour. The wafer was
rinsed with methanol and deionized water before returning to the clean room where it was
cleaned using 3:1 H2SO4:H2O2 at 90ºC. Oxidation of the porous silicon was performed at

174
two different conditions following procedures reported elsewhere. [97, 98] Using a
furnace tube, the wafer was subjected to an oxygen atmosphere at 300 ºC for 3 hours.
The second oxidation condition involved the 300 ºC, 3 hour oxidation followed by 1 hour
in oxygen at 850 ºC.
Figure 6-3. Process flow for the fabrication of microstructured channels incorporating porous silicon. SiN Photoresist Porous Si Al Glass
1.
2.
3.
4.
5.
6.
Pattern 10um thick resist on 5000Å SiN
Pattern SiN
Pattern silicon (both sides)
Deposit aluminum to backside
Create porous silicon
Remove aluminum and anodic bond glass to topside

175
A glass wafer was then anodically bonded to the silicon wafer at the same
conditions as before without removing the silicon nitride layer (step#6). Although
performance of the bond to silicon nitride relative to bare silicon was not characterized,
bond success and uniformity was unaltered. Others report on the versatility of the anodic
bond in relation to oxide or nitride layers on the silicon.[99]
6.4. Porous Silicon as a Catalyst Support
6.4.1. Introduction
The goal of the microstructured reactors was to simulate the packing of a fixed-
bed reactor while precisely defining the packing geometry so as to improve fluid
distribution, heat and mass transfer. To incorporate the heterogeneous catalyst, either the
columns have to be coated with an active material, or consist of active material within
their volume. The approach take here was to make the columns porous and impregnate
them with the catalyst. Alternatively, a process could be envisioned where the columns
are directly fabricated out of a porous material. Arrays of features made of thin-film
porous silica have been demonstrated, but the height was only 0.2 µm.[100] The columns
here are 300 µm tall, and currently there are no methods available for fabricating them in
a porous material. Another alternative would be to coat the columns with a porous
material such as a sol-gel alumina coating common with wash-coats of monolithic
reactors.
Numerous studies on porous silicon and its formation mechanisms have been
performed, with primary interest focused on its photoluminescent properties. Recent
work has also focused on sensing applications: the ability to integrate silicon

176
microelectronics with a high surface area sensor makes porous silicon an attractive
material. [101, 102] Surface areas have been reported as high as 800 m2/g, which is
comparable to standard catalyst supports.[103] Almost all of the applications in
microdevices for porous silicon has been for sensing applications. The enzyme
microreactors of Drott et al. are the first example of using porous silicon as a catalyst
support.[95, 104-107] To date, porous silicon has not been investigated as a catalyst
support for noble metal catalysts. Only one study has modified porous silicon with
palladium, but the application was for hydrogen detection.[108]
Porous silicon is formed through an electrochemical etching process. The rate of
formation, the pore size and morphology, and porosity of the layer depend upon a number
of parameters, including the etch solution, the dopant type and density of the substrate,
the current density, and the presence of illumination. A number of reviews describe in
detail the chemistry and influence of these parameters on the porous silicon formation
process.[109, 110] Figure 6-4, taken from a paper by V. Lehman, illustrates the
dependence of the average pore size on both dopant type and density.[111] N-type
wafers were chosen for the devices here in order to achieve 'meso-porous' material where
internal diffusion would not be limiting. The evolution of hydrogen gas is characteristic
of pore formation, while the absence of gas evolution is characteristic of
electropolishing.[109] For all of the devices etched here, significant gas evolution was
noted.

177
Figure 6-4. Resulting pore size in porous silicon for different dopant types and wafer resistivities, taken from [111].
To create the porous silicon in the channels only, silicon nitride was used as a
mask to protect the surface of the wafer. This ensured a smooth surface for the
subsequent anodic bond. The silicon nitride was kept on the surface after the etch because
it was feared that the long phosphoric acid etch, commonly used to strip silicon nitride,
would damage the porous silicon. The procedures used for making the porous silicon are
similar to those reported elsewhere.[103] The patterned silicon wafers, n-type, with
varying resistivity of 10-20 Ω-cm or 1-5 Ω-cm, received an aluminum coating on the
backside for contact, which was removed after the porous silicon was formed.
Illumination was used and a current density of roughly 15 mA/cm2, based on the open
1
10
100
1000
10000
0.001 0.01 0.1 1 10 100Resistivity (Ω cm)
Pore
Dia
met
er (n
m)
n-type p-type and n-type
Micro
Meso
Macro

178
area of silicon, was applied for 10-30 minutes. Scanning electron micrographs were used
to characterize the depth of the etch into the substrate.
Oxidation of the porous silicon was also accomplished by means of a tube furnace
prior to anodic bonding. Others report that a treatment at 300 ºC in oxygen stabilizes the
porous silicon.[98] [112] Subsequent higher temperature oxidations convert more of the
porous layer to oxide while sacrificing some of the porosity of the layer. Without this
oxidation step, a native oxide layer (1.5 nm - 4 nm thick) will spontaneously grow upon
the freshly etched porous silicon with exposure to air.[113] Yet another approach to
oxidizing the porous silicon is an anodization process.[114] In addition to its stabilizing
effect upon the porous layer, converting more of the silicon to silicon oxide makes the
catalytic support better resemble traditional high-surface area silica supports.
6.4.2. Experimental Procedure for Porous Silicon Formation
The essential requirements for forming the porous silicon are making an electrical
contact to the backside of the wafer and keeping the acid solution with electrode on the
front-side. Figure 6-5 depicts the arrangement of the fixture for holding the wafer and the
experimental set-up. The fixture was specially designed for this application and was
based off a similar design for performing KOH etching of silicon wafers. Figure 6-6
shows the teflon fixture and the arrangement of a HypalonTM o-ring for making the seal
to the silicon wafer. The wafer is compressed against this teflon fixture by another teflon
piece and o-ring with the aid of several Kel-F hex screws. Once sealed, the acid solution
(100 mL consisting of 50:50 by volume, ethanol and hydrofluoric acid) is poured into the
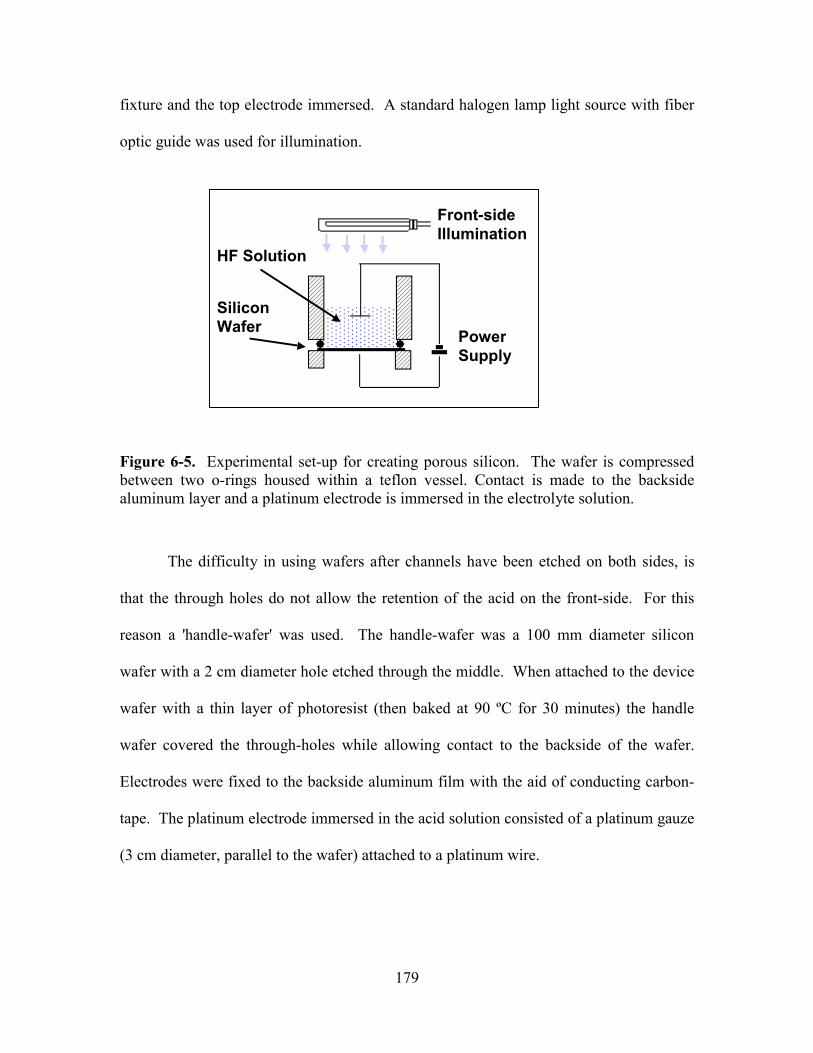
179
fixture and the top electrode immersed. A standard halogen lamp light source with fiber
optic guide was used for illumination.
Figure 6-5. Experimental set-up for creating porous silicon. The wafer is compressed between two o-rings housed within a teflon vessel. Contact is made to the backside aluminum layer and a platinum electrode is immersed in the electrolyte solution.
The difficulty in using wafers after channels have been etched on both sides, is
that the through holes do not allow the retention of the acid on the front-side. For this
reason a 'handle-wafer' was used. The handle-wafer was a 100 mm diameter silicon
wafer with a 2 cm diameter hole etched through the middle. When attached to the device
wafer with a thin layer of photoresist (then baked at 90 ºC for 30 minutes) the handle
wafer covered the through-holes while allowing contact to the backside of the wafer.
Electrodes were fixed to the backside aluminum film with the aid of conducting carbon-
tape. The platinum electrode immersed in the acid solution consisted of a platinum gauze
(3 cm diameter, parallel to the wafer) attached to a platinum wire.
PowerSupply
Front-side Illumination
HF Solution
SiliconWafer

180
The procedures for incorporating the platinum catalyst within the porous silicon
follow standard methods of catalyst preparation.[115, 116] Impregnation of the platinum
catalyst was performed on an individual die by flowing the precursor solution (1-10wt%
H2PtCl6 in DI water) through the reactor. The devices were allowed to dry for several
hours at 70 ºC before calcination. After the water had been removed, the reactors were
heated in air at 550 ºC for 3 hours, and then the catalyst was reduced by flowing pure
hydrogen at 300 ºC for another 3 hours.
Figure 6-6. Teflon reactor for creating porous silicon on 4" wafers. 16 hex-nut screws compress the oring against the silicon wafer.

181
6.5. Device Characterization and Results
6.6. Catalyst Characterization and Chemisorption
Figure 6-7 shows an optical micrograph of a cross section of a reactor after creating the
porous silicon. The same cross section is shown using a scanning electron micrograph in
Figure 6-8. The pore structure penetrates approximately 50 µm into the silicon substrate.
Although the surface of the columns appeared to be roughened, it was difficult to
determine their porosity, if any. There is slight undercutting of the silicon nitride mask,
evidenced by the taper near the interface. To evaluate various catalyst preparation
conditions, in addition to the reaction rate, the surface area of the platinum metal in the
device was determined using a pulsed carbon monoxide chemisorption method.[117, 118]
Carbon monoxide selectively chemisorbs onto the platinum only, and based on the
volume of CO adsorbed, the surface area can be determined. Using this technique,
standard 1% Pt/Al2O3 catalyst particles loaded into the open channel device produced a
measured surface area of 300 cm2. Under the same conditions, surface area for the
platinum on porous silicon was measured as 100 cm2, while no detectable adsorption was
observed for empty reactors or porous silicon reactors without the platinum.

182
Figure 6-7. Photomicrograph of the cross-section of the reaction channels indicating the depth of the porous silicon layer into the bulk silicon substrate.
50 µµµµm
100 µµµµm

183
Figure 6-8. SEMs of porous silicon. A) Shows inset for enlarged view in B) Macropores are visible in the walls of the channel. C) Magnified view of the macropores indicating a size approaching 0.5mm. D) Shows inset for magnified view in E) Micropore formation at the base of the channel.
Macropore Formation
Cross section of mesopore formation
A B
C
D
E

184
6.6.1. Surface Area Characterization
Commercial supported metal catalysts are characterized by a number of
parameters including pore size distribution of the support, total surface area of the
support, metal particle size and dispersion and surface area of the active metal.[117]
Measurements are made using standardized equipment. Metal surface area is important
in predicting the activity of a catalyst since it provides the total number of surface sites
available for reaction. It is useful in making comparisons of catalysts, since it can
provide an estimate of the activity in the absence of mass transfer limitations.
Chemisorption methods are routine since gases like CO and hydrogen bond specifically
to certain metals and not to the porous support.
Static volumetric methods are the most common and are explained here briefly.
A known weight of catalyst is introduced to a glass sample tube of known volume. After
the sample is evacuated, a certain volume of the adsorbate gas is introduced. When
adsorption equilibrium is attained, the amount of gas remaining in the system can be
determined from the pressure measurement. Keeping the temperature constant, the
volume of adsorbed gas is measured for increasing pressures.
The principal limitation for this approach is the amount of catalyst required to
make an accurate measurement. Depending on the volume of the glass sample tube,
increasingly accurate pressure measurements are required for small sample weights, or
low surface areas. This limitation becomes prohibitive for the microreactors of this
study, because a single microreactor has a relatively small amount of total surface area.
For example, a ten-channel reactor can hold approximately 40 mg of catalyst, while
typical measurements using the volumetric approach call for catalyst weights of 1000 mg.

185
6.6.2. Pulsed Chemisorption Methods
Another established method for determining surface areas is a pulsed
chromatographic chemisorption approach[119, 120] A continuos flow of inert gas passes
through the catalyst in a packed bed arrangement. Pulses of CO are continuously injected
into the flow stream. In the absence of any adsorbing metals, the pulses eluted will
contain the same volume of adsorbing gas, as all of the adsorbing gas flows to the
detector. In the presence of an adsorbing metal such as platinum or palladium, a fraction
of the volume of the initial pulses will be irreversibly adsorbed to the catalyst and the
volume of the pulses eluted will be reduced. As the pulses are continuously injected, the
catalyst becomes saturated with the adsorbing gas and the volume of the adsorbing gas
gradually returns to its injected value. Figure 6-9 is an example of a chromatogram
illustrating the pulsed chemisorption approach. The difference in volume from an eluted
pulse and the volume of a pulse at saturation is the amount of CO adsorbed. By summing
up over all the pulses, the total amount of CO adsorbed, and hence the surface area of the
catalytic metal can be determined. What makes this approach particularly suitable for the
microreactors is that the volume and content of the injected pulses can be tailored
according to the amount of metal area exposed. In this case, the amount of CO per pulse
was set to be approximately equal to the amount that would be required to completely
cover the surface of the catalyst. The other advantage is that the sensitivity of the
detector, in this case a mass spectrometer, allows for a relatively small amount of CO per
pulse.

186
Figure 6-9. CO Chemisorption pulse chromatogram. Each pulse of CO is injected into the flow through the reactor, eluted, and measured on the mass spectrometer. The initially clean platinum surface irreversibly adsorbs CO from the first several pulses. Eventually the surface is saturated and the pulses approach a steady volume eluted.
Figure 6-10 illustrates the experimental setup for the pulsed chemisorption
analyses. A Hewlett Packard gas chromatograph (HP GC6980) with mass selective
detector and gas sampling valve was adapted for this application. A gas sampling valve
with an injection volume of 1mL was used to inject 5000 ppm carbon monoxide in
helium into a carrier gas of helium. A control valve was used to maintain a steady
pressure of 1 or 5 psig of CO in the sample of loop of the injection valve. A manifold
containing the packaged microreactor and a bypass line was inserted into the oven of the

187
GC and connected to the inlet port upstream and a 30 meter capillary column downstream
The column was used to create a pressure drop between the turbo pump of the mass spec
(1.4×10⁻⁵ torr) and the microreactor. As a result, the pressure in the microreactor was
constant at 11.2 psig for a flow of 1.5 sccm. The pressure drop across the microreactor
was negligible for this flow rate of gas. Pulses were injected every 2.5 minutes and the
average retention time was 1.4 minutes.
Figure 6-10. Experimental set-up for CO chemisorption analysis. A 1 mL sampling valve injects the CO pulses into the flow stream where the flow can either bypass the reactor or travel through the reactor and adsorb to the catalyst. The capillary column is used to create a pressure drop from the exit of the reactor to the vacuum conditions within the mass spectrometer.
Bypass Line
Microreactor
GC ColumnMass Specand Turbo Pump
Gas Sampling ValveSample Loop = 1 mL
HeliumCarrier Gas
COInjection Gas
To Exhaust

188
Figure 6-11 contains the results for several samples, including an empty
microreactor, a porous silicon microreactor with no catalyst, a porous silicon reactor with
platinum catalyst, and a multichannel reactor loaded with 1% Pt/Al2O3 catalyst. The
results are tabulated for each pulse as a fraction of the steady state volume. The volume
adsorbed for each pulse is equal to the difference between the pulse volume and the
volume of the pulses at saturated, steady-state conditions. Given a pressure in the sample
loop of 5 psig, a sample volume of 1 mL, and a temperature of 30 C, the ideal gas law
provides for 2.2×10⁻⁷ mols of CO per pulse of 5000 ppm CO in helium. The surface area
can then be determined, assuming that each CO molecule is chemisorbed to one platinum
atom and each platinum atom provides approximately 1.2×10⁻¹⁵ cm2 of surface
area.[117].
The measured surface areas (relative error of approximately 20%) for the various
devices were 240+/- 48 m2 for the 1wt% Pt/Al2O3 powder, 103 +/- 20 m2 for the porous
silicon impregnated with platinum, and 0m2 for the empty porous silicon reactors. On a
per mass basis, the surface area for the powdered catalyst was 1.1 m2/g which is
considerably lower than the value measured using a conventional static volumetric
approach of 5.7m2/g. The important consideration though, is that the pulsed CO
chemisorption provides an accurate comparison between the number of available
catalytic sites between the two different types of reactors.

189
Figure 6-11. Results for CO chemisorption experiments. The commercial porous catalyst adsorbs the most CO followed by the porous silicon reactor. The control experiments consisting of an empty reactor and a porous silicon reactor with no platinum adsorb almost no CO.
0
20
40
60
80
100
120
1 2 3 4 5 6 7 8 9 10 11 12 13 14 15 16 17 18 19
Pulse #
Perc
ent o
f Equ
alib
rium
Pea
k A
rea
Porous Si / No PlatinumEmpty MicroreactorPorous Si w/ PlatinumPacked 1% Pt/Al2O3
1 cm3 Injection Volume5000ppm CO in He1.5 cm3/min He flow

190
6.7. Gas-Liquid Reaction Results in the Microstructured Reactor
The catalytic hydrogenation of cyclohexene to cyclohexane was chosen as a
model reaction for a number of reasons. The reaction is fast at room temperature and
atmospheric pressure, so it is likely to have some degree of mass transfer limitation. The
reaction has been used extensively for characterizing industrial multiphase reactors, and
many of the fluid properties are known. Hydrogenations are ubiquitous throughout fine
chemicals and pharmaceutical processing, and because hydrogen is only slightly soluble
in most organic solvents, mass transfer of the hydrogen to the liquid phase can often be
the rate-limiting step. Hydrogenations are exothermic and the explosive potential of
pressurized hydrogen makes the safety aspects of a miniaturized reaction unit attractive.
Results for the reaction rate and mass transfer coefficient in the microstructured reactor
are compared here with the packed-bed device. In chapters 4 and 5, it was shown that
mass transfer could be greatly improved in packed-bed microreactors where catalyst
particles were 50 µm in diameter. In typical laboratory reactors, such three-phase
reactions can be limited by the rate of gas absorption into the liquid, the distribution of
reagents throughout the packed-bed, or by diffusion within the porous catalyst itself. An
overall mass transfer coefficient, KLa, was measured in the microfabricated packed-bed
to be near 10 s-1, more than 100 times larger than values reported for laboratory scale
reactors. For these packed-bed devices, achieving an even distribution and packing
density among the parallel channels was critical in order to get an even flow of reagents.
Otherwise, the flow may bypass one or several channels, decreasing the utilization of the
reactor. Furthermore, the packing density is affected by the particular mode of catalyst

191
loading. Obtaining a repeatable packing density among several devices operated in
parallel could become problematic. In order to alleviate some of these challenges
typically associated with packed-beds, the microstructured reactors of this chapter mimic
the packed-bed while providing exact control over the bed properties. The high degree of
tolerance offered by microfabrication methods ensures that each reactor has the same
flow behavior.
The reaction rate results for several devices are presented in Figure 6-12. All of
the microstructured devices exhibit significant decay of catalytic activity over the initial
start-up of the reaction process. For comparison , the results using a conventional 5 wt%
Pt catalyst are shown to be significantly better than the porous silicon catalysts. After an
initial decay, the reaction rate decreased slightly for the case of the reactor 2C in Figure
6-12. After subjecting the device to air at 300 °C for 1 hour followed by another
reduction, the activity remained slightly lower than the previous level of activity,
indicating that the oxidation did not 'reactivate' the catalyst.

192
Figure 6-12. Cyclohexene hydrogenation in the porous silicon reactors.
This non-oxidized porous silicon reactor was then used at a temperature of 50 °C.
Once the reaction rate decayed significantly, the device was purged with hydrogen for
two hours at 50 °C and a portion of the activity was regained. This behavior was
repeated three times, as seen in Figure 6-13 which plots the time course for the catalyst
activity. The result is that purging the reactor with hydrogen eventually regained some of
the lost catalytic activity. In addition, a porous silicon reactor was tested which was
subjected to an oxidation treatment at 800 °C for 1hour. The reaction results indicate that
the activity is more stable, but the reaction rate is reduced. This is most likely due to a
reduction in catalytic surface area when the small pores of the porous silicon are closed
due to oxide growth.
Initial reaction rates for the hydrogenation of cyclohexene in an integrated
catalytic microreactor (non-oxidized porous silicon) were observed to be 2.0×10⁻⁵
Porous Silicon Reactors
0
0.000005
0.00001
0.000015
0.00002
0.000025
0.00003
0.000035
0 50 100 150 200Time(min)
Rea
ctio
n R
ate(
mol
/min
.)
Packed-bed microreactor, 5wt%PtReactor 2AReactor 2CReactor 2C, after oxidationReactor 2D
Reactor 2AReduced on-chuck 300CNeat Cyclohexene feed
Reactor 2CReduced in tube furnace 400C, 3hrs11%Cyclohexene in Heptane feed
Reactor 2D3X Catalyst DepositedReduced in tube furnace 400C, 3hrs11%Cyclohexene in Heptane feed

193
mol/min., nearly a third that of the 10 channel packed-bed reactor. When normalized for
the metal content of the device, the reaction rate compares favorably: 6.5×10⁻⁴
mol/min/m2 with the porous silicon support versus 4.5×10⁻⁴ mol/min/m2 with the
powdered catalyst. Figure 6-14 compares the catalytic activity for the various devices.
The conclusion is that mass transfer in the microstructured reactor is equivalent to that of
the packed-bed, even though the pressure drop is less. Furthermore, the overall activity
of the microstructured reactor is much lower than the conventional catalysts because of
the amount of active metal impregnated into the porous silicon. The calculated mass
transfer coefficients, KLa, in the integrated microstructured reactor fall within the range
of 3-7 s-1.
Figure 6-13. Lifetime studies for porous silicon with platinum catalysts. Oxidized porous silicon is more stable, but has a lower activity than the non-oxidized porous silicon.
1.00E-07
1.00E-06
1.00E-05
1.00E-04
1.00E-03
0 200 400 600 800 1000Time (Minutes)
Rea
ctio
n R
ate
(mol
/min
.)
Porous silicon, non-oxidized,T= 298KPorous silicon, non-oxidized,T = 323KPacked-bed, single channel,5wt% Pt/AluminaPorous silicon, oxidized at1073K
Reaction rate in porous silicon
Reaction Rate Platinum Black
Reaction Rate multi-channel 5 wt% Pt / Alumina
10% Cyclohexene in heptane at 100 mg/min.Hydrogen flow rate = 50 sccm

194
Figure 6-14. Comparison of reaction rates and normalized activities between the packed bed reactors and the porous silicon reactors. Top) Global reaction rates. Bottom) Reaction rates normalized for catalytic surface area.
0.00E+00
1.00E-05
2.00E-05
3.00E-05
4.00E-05
5.00E-05
6.00E-05
Multi-Channel:Packed Bed
Multi-Channel:IntegratedCatalyst
Packed-bedSingle-Channel
Rea
ctio
n R
ate
(mol
/min
)
0.00E+00
2.00E-04
4.00E-04
6.00E-04
8.00E-04
1.00E-03
Multi-channel:Packed-bed
Multi-channel:IntegratedCatalyst
Packed-bedSingle-
Channel
Rea
ctio
n R
ate
(mol
/min
/m2 )

195
6.8. Summary
The design, fabrication, and characterization of multiphase microfluidic devices
has been presented. Using silicon microfabrication methods, a "fully micromachined"
packed-bed reactor has been constructed. Columns, 50 µm in diameter, have been etched
into the channels of the microreactor, mimicking the arrangement of a packed bed.
Procedures for creating porous silicon have been used to provide a high surface area
support for the metal catalyst. Such microfabrication methods allow the integration of
catalyst supports or gas-liquid contacting structures directly into the reactor. This
provides an added level of control on such factors as support size and distribution and
void fraction, as compared to a typical packed-bed reactor. The microfluidic construction
of the reactor allows for the controlled distribution of gas and liquid reagents to either the
small catalyst particles or the microstructured posts. In addition, silicon microfabrication
has allowed the local integration of temperature sensing and heat generation in the reactor
device. And while the packaging has a critical impact on the performance of the heaters,
it has been demonstrated that on-chip temperature control is feasible with improved
packaging methods.

196
7. Gas-Liquid Contacting in Microfabricated Systems
7.1. Introduction
Microfabrication methods provide a means for constructing novel channel
geometries for the purposes of influencing gas-liquid flow. The nature of the flow, in
terms of the various flow regimes, relative hold-up of the two phases, and pressure drop
have been extensively studied at the macroscale (tubes, packed tubes) as well as at the
meso scale (glass capillaries). As the size of the channel decreases, the effects of gravity
diminish and the role of surface tension takes over. The ability to construct channels with
microstructural elements, such as the microstructured reactor of this thesis, provides for
the first time, the ability to influence and control two-phase flow in microchannels for the
purposes of increasing interfacial areas and reducing pressure drop.
The issue of flow regimes in packed-bed multiphase reactors was addressed
briefly in Chapter 2. The design of the microstructured reactor, with a void fraction
significantly larger than that of a packed bed, puts the reactor somewhere in between an
open channel and a densely packed-bed in terms of characterization. Before the specific
flow behavior is addressed, gas-liquid flow in macro-scale systems is presented to
provide a background for the results that follow.
7.2. Gas Liquid Flow Behavior in Conventional Systems
The phenomenon of gas-liquid two-phase flow occurs in a variety of situations,
including absorption for the purification of a gas stream, reaction for the conversion of a
liquid reactant, and heat exchange with phase change, such as in the rod bundle of a
nuclear reactor. The parameters that are critical for the process are the two-phase

197
pressure drop and the rate of mass or heat transfer. Both of these parameters are
dependant upon the physical nature of the flow. The nature of the fluid flow, as
determined by the physical form that the fluids conform to, the relative volume of the two
phases and the interfacial contact area, ultimately affects the efficiency of thermal and
mass transport between the phases. Before any attempt at predicting pressure drop or
transport efficiency can be made, the specific flow regime must be known. Some
examples of flow behavior in channels with gas and liquid flowing co-currently are
illustrated in Figure 7-1.
Flow regimes are characterized by mapping the physical form of the flow onto a
domain containing the superficial velocity of the gas versus that of the liquid. The types
of flow regimes as well as the transitions between them depend upon the physical
properties of the fluids involved as well as the size and shape of the channel. For two-
phase flow in tubes the flow behavior can range from ‘Bubble’ flow, where the gas is
dispersed as discrete bubbles within the liquid to ‘Annular flow,’ where the liquid flows
along the channel walls and the gas flows in the center. Intermediate to these two, is a
‘slug-flow’ or ‘Taylor-flow’ regime where the phases form discrete slugs separated by
regions of the alternate phase. If the channel is large enough, then gravitational forces
influence the flow and the fluids will form ‘Stratified’ layers based on their relative
densities. For high gas and liquid flow rates, Xu et al. report a “churning / turbulent”
flow in which the gas is chaotically dispersed and the flow trajectories vary in time.[121]

198
Figure 7-1. Two-phase flow regimes in tubes and capillaries, taken from [25, 121]. At small relative gas velocites, bubbles exist within a continuos liquid phase. Increasing the gas flow rate leads to slug or Taylor flow then to annular flow. At sufficiently high velocities, 'churn' flow or dispersed flow exists. For large tube diameters, gravity serves to 'stratify' the two phases.
One of the earliest works on two-phase flow in capillary tubes was performed at
MIT by Mikio Suo and Peter Griffith. [122] In that work, the flow transition between
slug flow and annular flow were described and a theoretical model for predicting the
transition provided. Since then, much work has been performed and the complex nature
Bubble Flow Slug Flow Annular Flow Churn Flow
Stratified Flow

199
of the flow is still the subject of investigation. [121, 123, 124] The work by G.I. Taylor
has made ‘Taylor’ flow synonymous with the slug-flow fluid regime.[125]

200
7.3. Hydrodynamics and Flow Regimes of Two-Phase Microchannel
Flow
The nature of the two-phase gas-liquid flow was investigated for a range of flow
rates and materials. Understanding the flow behavior is critical in determining the extent
of mass transport and characterizing the microstructured microreactor relative to its
macroscale counterparts. The nature of the flow, as well as the transition from various
flow regimes, depends not only on the relative velocities of the two phases, but also on
the various physical properties of the solvent (viscosity, surface tension). The behavior
of the gas-liquid interface, as determined by hydrodynamics of the two-phase flow, will
affect the interfacial area for gas-liquid contacting and consequently the rate of mass
transport between the two phases. Water-air mixtures were investigated in order to
compare results with those studies found in the literature. A variety of organic solvents
and air were also used since they more closely represent the hydrogenation reactions
intended for the microstructured device. Gas-liquid flow behavior was also investigated
for the open-channel device, since the results were more likely to parallel the results of
the prior work in two-phase microchannel flow.
7.3.1. Microstructured Reactor Flow Regimes
Figures 7-2 through 7-4 contain a series of photomicrographs that illustrate the
various flow regimes that have been observed in silicon (un-oxidized) microstructured
channel reactors. Although some of the terminology to describe these flow regimes has
been adopted from other studies of gas-liquid flow, the exact nature of the flow may not
be entirely identical. The presence of the columns within the channels forces the flow to
behave with sight differences in some cases, as will be noted in the following discussion.

201
The flow regime which predominates at relatively small gas and liquid flow rates is the
slug-flow regime. At relatively low gas flow rates, the predominate phase is liquid and
the gas travels as slugs, or bubbles, of various sizes among the ten channels (Figure 7-2).
Figure 7-2. Slug-flow regime in a microstructured reactor using co-cuurent flow of ethanol / air. Flow distribution is even to all ten channels. Inset shows a single slug of gas with a flat frontal profile.
As the gas flow rate is increased relative to the liquid flow, streams of gas form in
the center of the channels, as the liquid prefers to wet the walls of the channels, termed
here as the annular-flow regime. In cylindrical capillaries, annular flow describes the
concentric arrangement of the two phases, with the liquid phase wetting the walls of the
capillary. As seen in Figure 7-3, the rectangular geometry of the channels forces the
liquid to the either end of the 600-µm-wide channel. It has been observed that the middle

202
portions of the channel contain the gas-phase only, so the wetting of the channel walls is
uneven and skewed toward the corners of the channels.
Figure 7-3. Annular flow in a microstructured reactor using ethanol and air. The liquid phase is confined to the walls of the reactor and the gas follows a path (sometimes tortuous) through the center of the channels. All ten inlets are distributing gas and liquid phases.
Increasing both flow rates produces a flow regime that is characterized by a rapid
dispersion of both phases (Figure 7-4). It is in this flow regime that mixing of the gas
and liquid phases is the greatest and the interfacial area is expected to be substantially
larger than in an open channel arrangement.
Figure 7-5 plots a flow regime map for water-nitrogen contacting in an un-
oxidized silicon microstructured reactor. The flow regime and pressure drop were
recorded at various combinations of the flow rates for the gas and liquid streams. From
this collection of data points, the map was constructed illustrating the transition between

203
the various flow regimes. A number of observations can be made. First, the dispersed
flow regime, which occurs at both high gas and liquid flow rates, borders both the slug
flow and the annular flow regimes. The transition from slug flow to dispersed flow is not
as distinct as with the ethanol mixtures: channels contain both flow types as the flow
transitions to complete dispersion in all ten channels. Figure 7-6 illustrates the slug-
dispersed flow regime. Unlike with the ethanol-air mixtures, at both low liquid and gas
flow rates the water-air flow is a mixture of annular and slug flow. The flow gradually
transitions to the annular flow as the gas flow rate is increased for a given liquid flow
rate.
Figure 7-4. Dispersed flow regime. The defined gas-liquid interface of the annular flow regime is broken with a high degree of dispersion of the gas and liquid phases. Whereas the gas-liquid interface was fixed with the annular flow, here it randomly fluctuates throughout the volume.

204
Later in this chapter the interfacial contact areas are analyzed and the dispersed
flow regime is found to have almost an order of magnitude increase in the interfacial
area. The flow rates required to generate this dispersion, however, are quite high. A
water flow rate of 2-3 mL/min. is required, corresponding to a very small residence time
in the reactor ( ~1 second).
Figure 7-5. Flow regime map for water-nitrogen mixing in a silicon microstructured reactor. Data points represent observed flow regimes. Transition lines are estimated based upon the closest data points.
Dispersed Flow , Annular Flow , Slug-dispersed , Slug-Annular
0.1
1.0
10.0
1 10 100 1000Gas Flow Rate (SCCM)
Liqu
id F
low
Rat
e (m
L/m
in.)
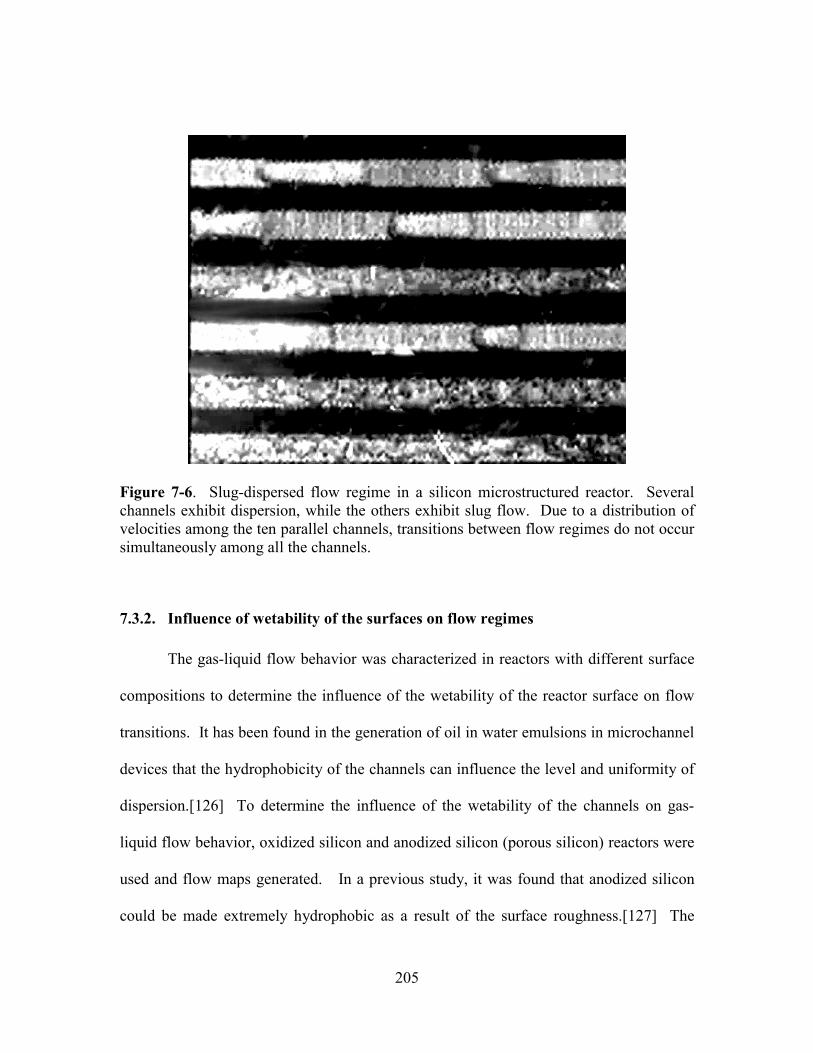
205
Figure 7-6. Slug-dispersed flow regime in a silicon microstructured reactor. Several channels exhibit dispersion, while the others exhibit slug flow. Due to a distribution of velocities among the ten parallel channels, transitions between flow regimes do not occur simultaneously among all the channels.
7.3.2. Influence of wetability of the surfaces on flow regimes
The gas-liquid flow behavior was characterized in reactors with different surface
compositions to determine the influence of the wetability of the reactor surface on flow
transitions. It has been found in the generation of oil in water emulsions in microchannel
devices that the hydrophobicity of the channels can influence the level and uniformity of
dispersion.[126] To determine the influence of the wetability of the channels on gas-
liquid flow behavior, oxidized silicon and anodized silicon (porous silicon) reactors were
used and flow maps generated. In a previous study, it was found that anodized silicon
could be made extremely hydrophobic as a result of the surface roughness.[127] The

206
water-air-surface contact angle was measured as high as 100 degrees for anodized silicon,
60 degrees for silicon, and near zero for oxidized silicon. A completely hydrogen
terminated silicon surface is hydrophobic (θ = 90) but after exposure to air and growth of
a native oxide, it becomes slightly hydrophilic (θ = 60)[127]. As a result, the oxidized
microreactors are likely to be more hydrophilic than normal silicon, while the porous
silicon reactors are likely to be more hydrophobic.
Figure 7-7 is a flow map for an oxidized (5000 Å thermal oxide) silicon reactor.
Slight variations from the un-oxidized silicon reactor was observed in terms of the nature
of the flow regimes as well as the transitions. The most notable effect was the reduction
in the liquid flow rate for the transition point to dispersed flow. The estimated transition
point is 0.5mL/min in the oxidized (more hydrophilic) versus 2.5 mL/min in the un-
oxidized channels. This can be rationalized by the energy required to disperse or break
the gas-liquid interface. For a hydrophilic surface, a lower energy (lower velocity) is
required to force the water to wet more of the surface. The other notable effect was in the
size and shape of the slugs. For the hydrophilic surface, the slugs tended to be larger and
more elongated as opposed to the more hydrophobic silicon surface for which the gas
phase formed smaller, more frequent slugs. The results for the porous silicon channels
did not have a notable difference on the flow behavior or transition points. The flow
closely resembled that of the bare silicon surface.
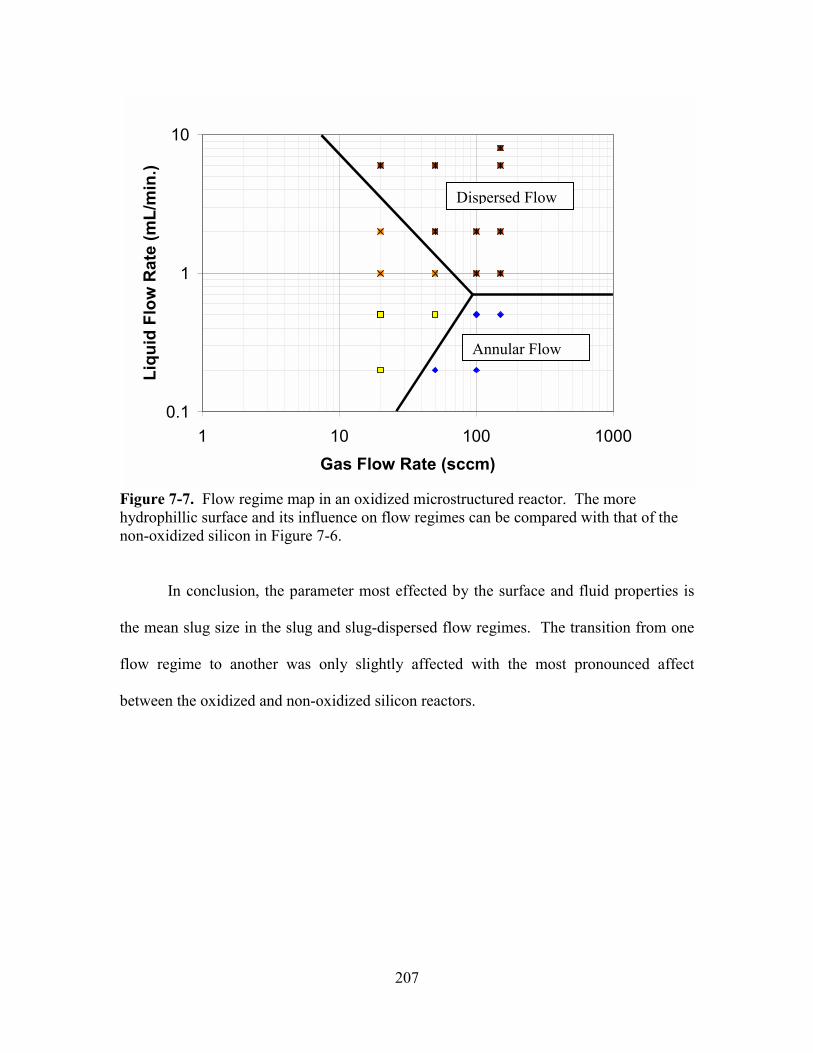
207
Figure 7-7. Flow regime map in an oxidized microstructured reactor. The more hydrophillic surface and its influence on flow regimes can be compared with that of the non-oxidized silicon in Figure 7-6.
In conclusion, the parameter most effected by the surface and fluid properties is
the mean slug size in the slug and slug-dispersed flow regimes. The transition from one
flow regime to another was only slightly affected with the most pronounced affect
between the oxidized and non-oxidized silicon reactors.
0.1
1
10
1 10 100 1000Gas Flow Rate (sccm)
Liqu
id F
low
Rat
e (m
L/m
in.)
Dispersed Flow
Annular Flow

208
7.3.3. Open Channel Gas-Liquid Flow
The two-phase flow behavior in the open, ten-channel device described in chapter
3 contrasts with that of the microstructured devices of this chapter. The relative flow
rates or the ratio of gas to liquid flow was critical in determining an even distribution of
flow among the ten parallel channels. Channeling, or poor flow distribution, was
prevalent whenever one of the flow rates was greatly in excess relative to the other.
Figure 7-8 maps out the regimes where evenly distributed flow occurred.
Figure 7-8. Flow regime map in an open-channel microreactor using water/air co-current flow. For relatively low flow rates of either phase, channeling and poor distribution occurs.
Two-Phase Flow Patterns, Open Channel (Water/Air)
0.1
1
10
1 10 100 1000Gas Flow Rate (SCCM)
Liqu
id F
low
Rat
e(m
L/m
in.)
ChannelingEven Distribution
Even DistributionAnnular Flow
Poor DistributionLiquid Deficient
ChannelingGas Deficient

209
For gas flow rates of 20 sccm (v = 1 cm/s) and lower, several channels were deficient in
the gas phase. Gas would distribute in the forms of slugs to some, but not all of the
channels. Only as the flow rate is increased above a certain threshold (independent of
liquid flow rate) would the two phases equally distribute among the ten channels. At
sufficiently high liquid and gas flow rates, two-phase flow would be evenly distributed.
The flow in that case would resemble the ‘annular flow regime’ with liquid flowing
predominately at the sides of the channels. Figure 7-9 is a photomicrograph of the
annular flow in the open-channel reactor. The liquid deficient flow regime was
characterized by an excess of gas flow such that the liquid would trickle or form rivulets
of flow around the channel walls. The liquid flow was pulsitile in nature and did not
distribute evenly among the ten channels.
Figure 7-9. Photomicrograph of ‘Annular’ flow in an open-channel microreactor.

210
The implications for this flow behavior for gas-liquid reactions is that the
presence of the columns facilitates the even distribution of the two phases. In addition,
an entirely new flow regime, that of the dispersed flow in Figure 7-4, is created as a result
of the posts. This dispersed flow regime was not observed in the open-channel reactors
for the range of flow rates studied.
7.3.4. Pressure Drop Measurements
In addition to observing the specific flow regime, the pressure drop was measured
for a range of gas and liquid flow rates. The two-phase pressure drop for various solvents
with air is plotted in Figure 7-10 as a function of liquid flow rate. For a constant gas flow
rate of 100 sccm, the flow transitions to the dispersed flow regime near 2mL/min. As the
flow makes the transition, the pressure drop takes a sudden shift upwards. Upon
decreasing the flow rate, the pressure drop continues along this upper curve until the flow
transitions back to the annular flow. The hysterisis effect in the pressure drop profiles is
a result of the unstable nature of the transition between various flow regimes. The
pressure drop for a range of flow gas and liquid flow rates is plotted in Figure 7-11 for
water-air mixtures in an un-oxidized silicon reactor. This can be compared with the
various flow regimes of Figure 7-5. For changes in the volumetric flow rate, the liquid
has more of an influence on the pressure drop. The effect becomes more severe as the
gas flow rate is increased.

211
Figure 7-10. Two-phase pressure drop in the microstructured reactor (gas flow rate = 100 sccm). The pressure drop is linear with liquid flow rate, but shifts when the flow transitions to the dispersed flow regime.
0.110
0.120
0.130
0.140
0.150
0.160
0.170
0.180
0 2 4 6Liquid Flow Rate(mL/min.)
Two-
phas
e Pr
essu
re (M
PA)
Ethanol/AirToluene/Air
DispersedFlow
Stable Interface
∆∆∆∆P

212
Figure 7-11. Two-phase pressure drop in the microstructured reactors using water/air cocurrent flow. On a volume basis, increasing the gas flow rate has a more severe impact on the pressure drop.
1 2 3 4 5 6 7 8 9 100
100
200
275
048
1216202428323640
Pres
sure
(PSI
G)
Liquid Flow Rate(mL/min.)
Gas Flow Rate (SCCM)
36-40
32-36
28-32
24-28
20-24
16-20
12-16
8-12
4-8
0-4
Data points collected
Silicon (un-oxidized) microstructured reactor

213
7.3.5. Interfacial Area Determination
Using the optical images shown in Figures 7-2, 7-3, and 7-4, the interfacial
contact areas were estimated. Both the size of the bubbles as well their number density
were used to estimate a contact area per volume of device. The contact area for the flow
regime in Figure 7-2 is estimated at 1500 m2/m3 while the area for Figure 7-4 is estimated
at 16,000 m2/m3. These numbers are considerably larger than reported values of 200
m2/m3 for bubble columns in chemical processing. [25]
Two-phase flow in capillaries has been shown to produce a similar range of flow
regimes, from ‘slug flow,’ where the gas is in the form of discreet bodies encompassing
the channel, to ‘annular flow,’ where the gas is steady stream through the center of the
channel.[128] The microstructured reactor, by introducing surface forces in the center of
the channel, provides an added measure of control over the two-phase flow and flow
transitions. MEMS fabrication methods allow this engineering of internal capillary
surfaces for the purposes of increasing heat transfer to the substrate and influencing two-
phase flow to increase mass transfer across phases.
The pressure drop for the microstructured channels were measured for co-current
flow of gas and liquid phases. The dispersed flow regime in Figure 7-4 occurred for a
flow rate of ethanol of 2 mL/minute and a nitrogen flow rate of 100 standard cm3/minute.
At these conditions, the pressure drop was measured as 0.54 atm. Reaction conditions,
however, dictated much smaller flow rates (0.2 mL/min of cyclohexene, 20 sccm of H2)
and consequently the pressure drop was almost negligible for the microstructured
channels.

214
7.3.6. Discussion: Geometry influence
As a result of using photolithographic methods to define the channel and feature
geometries, a number of variables in the geometry could be altered to affect the nature of
the two-phase flow. For instance, the presence of the ‘mixing zone’ or open channel
running perpendicular to the reaction channels where the 90 inlet channels first meet
could influence the flow. The consequence of this open channel is that the two phases
have the opportunity to coalesce before being constrained again within the confines of the
column arrays. If the reaction channels were to begin directly at the point where the inlet
channels meet, the two phases could be induced to remain segregated because the wetting
of the columns would counteract the forces causing the phases to separate. Another
variable is the size and spacing of the posts. As both the size and spacing is reduced, the
surface area is increased and the void fraction is reduced. A higher pressure drop will be
required for a given velocity and the result could be that the onset of dispersed flow
occurs at a much lower velocity. This is critical for reactions, such as the cyclohexene
hydrogenation, which require longer residence times for appreciable conversion. For the
cyclohexene hydrogenation, the residence time required is large enough that the
velocities of the phases results in flow within the non-dispersed flow regimes.

215
7.4. Summary
Gas-liquid two-phase flow was investigated in the microstructured reactors for a
variety of flow rates, materials, and surface compositions. Flow regime maps were
generated for both the open channel reactor design and the microstructured channel
reactor design, and notable differences in flow behavior occurred. Even flow distribution
was more difficult to achieve in the open channel design. With the microstructural
elements, even flow distribution was achieved and a dispersion of the two phases was
generated at flow rates above 2 mL/min. The two-phase pressure drop was determined
for a range of gas and liquid flow rates and was always within a managable value
(<50psig) for liquid flow rates up to 10 mL/min. It was demonstrated that the interfacial
contact area between the gas and liquid phases was substantial: as high as 16,000 m-1.
This, like the mass transfer coefficient product KLa, was more than 100 times larger than
those achieved in typical industrial gas-liquid contactors. By increasing the surface area
over which the gas and liquid streams must contact, mass transfer limited reaction rates
can be improved. For reactions that are limited by the mass transfer effects, as is the case
with many multiphase reactions, the improvement in mass transfer offered by the
microreactor translates into improved overall reaction rates, reactor performance and
control.

216
8. Multiphase Microreactor Comparison and Discussion
8.1. Mass Transfer Coefficient Comparison
The observed reaction rates for the cyclohexene hydrogenations in this
microreactor study all exceed expected rates on the basis of conventional mass transfer
capabilities. Even if the reactions were completely controlled by mass transfer, such as
the rate of absorption of hydrogen into the liquid, the mass transfer coefficients are still
orders of magnitude larger than conventional laboratory and industrial multiphase
reactors. The analyses of chapter 5 and 6 provide explicit values for the volumetric mass
transfer coefficient, KLa, using a thin-film model approach. Table 8.1 summarizes these
mass transfer values in the microreactors and compares them with conventional
multiphase reactors and some of the other micro device studies. Compared with these
conventional multiphase reactors, the microfabricated reactors of this study have mass
transfer coefficients that are at least 100 times larger.
Table 8-1. Comparison of multiphase reactors.
Reactor KLa (s-1) Reference Microreactor: Packed-bed 3-30 Microreactor: Integrated Catalyst
3-10
Trickle bed reactor 0.005-0.01 [25] Trickle bed (high pressure) 0.01-0.8 [30] Bubble column reactor 0.005 - 0.01 [25] Slurry reactor 0.02 - 0.2 [25] Jet-loop reactor 0.01 - 2.2 [25] Tube (4mm I.D.) 0.1-8 [124]

217
8.1.1. Why is the mass transfer coefficient, KLa, 100 times larger?
One of the principle motivations for microreaction technology is that shorter
diffusional lengths and higher surface to volume ratios translate into improved mass
transfer rates. The interfacial area, a, is itself a surface to volume ratio. It is the surface
area of contact between the gas and liquid phases per volume of reactor. If the liquid
wets all of the solid surface in a reactor and the gas flows through all of the interstitial
space, then the interfacial contact area will scale with the surface area of the reactor. For
packed-bed contacting devices, the surface area scales with that of the spherical packing,
where the surface to volume ratio of a sphere is 1/6R . In the laboratory scale reactors for
which the mass transfer coefficients were reported, the particle size was near 5mm. For
the particle sizes of the microreactor, 0.05 (100 X smaller) the surface to volume ratio is
100 X larger. Thus if the interfacial contact area, a, scales with the surface area of the
packing, then the increase in Kla could be accounted for in terms of the surface area
alone.
In addition to the surface area, the mass transfer coefficient itself, kL, may also
contribute. If the mass transfer coefficient is approximated assuming a stagnant layer for
diffusion, then kL ~ D/δ, where d is the length scale for diffusion. If this length scale for
diffusion again scales with the characteristic length of the packing, then the expected
increase would be on the order of 100 for the 50 um and smaller particles used in this
work.
To summarize, both kL and a scale inversely with a characteristic length.
Assuming that the same characteristic length (diameter of the packing) determines the
surface area for gas-liquid contacting as well as the length scale for diffusion then,

218
2L L1aK ∝
(8-1)
For the reduction in particle size from 5mm to 50um, it is conceivable that the mass
transfer coefficient could increase as much as a factor of 10,000.
8.2. Interfacial Gas-Liquid Contacting Area
Determining the interfacial area, a, using conventional chemical methods is
difficult to adapt to the microreactor owing to the fast reactions required and the necessity
for integrating the detection method on-chip. However, owing to the 2-D geometry of the
microstructured reactors, an estimate of the interfacial area can be made on the basis of
optical micrographs taken for the various flow regimes. This does not account for the
time variation of the interface nor the relative volumes of the two phases. But for
purposes of order of magnitude comparison with industrial reactors, the values are
instructive. Table 8-2 lists the interfacial areas observed from chapter 6 along with
representative values for various reactors available in the literature.[25] The volume-
specific interfacial areas generated in the microreactors are 10-100 times larger than the
conventional gas-liquid contacting devices.

219
Table 8-2. Interfacial gas-liquid contact areas in the microstructured reactor.
Reactor / Flow Regime Interfacial Area, a, m-1 Microstructured Microreactor / Slug flow
1,600
Microstructured Microreactor / Annular flow
5,000
Microstructured Microreactor / Dispersed flow
16,000
Bubble Column 20 Packed Bubble Column 200 Jet-Loop 2,000
8.3. Power Dissipation
The increase in interfacial areas comes at the expense of increased resistance to fluid
flow. For assessing the efficiency of mixing operations, the energy dissipation factor can
be used.[129, 130] This factor accounts for the level of power input per volume of reactor
for a given process. For continuous multiphase flow, the energy dissipation factor, εV is
LuL∆P
ε glV ⋅=
(8-2)
where the two-phase pressure drop is used, as well as the velocity of the liquid phase.
For the cyclohexene hydrogenations in the range of mass transfer coefficients recorded,
the energy dissipation falls in the range:
( ) 3microV mkW52~ −⋅−ε
This can be compared with values for trickle bed reactors whose values range:
( ) 3standardV mkW2.001.0~ −⋅−ε
220
When these two sets of energy dissipation factors are compared in light of the level of
mass transfer provided, the conclusion is that the microreactor is operating as efficient, if
not slightly more efficient. In fact, some of the original analyses of trickle-bed reactors
attempted to correlate the mass transfer with this energy dissipation factor.[28]
Satterfield proposed the following the following relation between the mass transfer
coefficient and the power dissipation:
21
Vl 017.0ak ε= (8-3)
Figure 8-1 plots this correlation along with the range of data collected in the
microreactors of this thesis. As can be seen, the mass transfer coefficients are greater
than or equal to that expected on the basis of this empirical correlation. The enhanced
mass transfer available in the microreaction devices comes at the expense of increased
power dissipation per unit volume. But the mass transfer capabilities in the microreactors
are unattainable using conventional reactor designs. As a result, the microreaction
devices with enhanced mass transfer provide the opportunity for engineering more
productive processes for fast reactions.

221
Figure 8-1. Predicted Kla on the basis of power dissipation. The solid line represents data in the literature for traditional packed-bed reactor designs. The packed-bed microreactors are slightly more efficient than what is expected on the basis of Satterfield's correlation.
8.4. Discussion
8.4.1. Packed-bed or Integrated Catalyst?
The reactor design of chapter 6 presents a unique alternative for carrying out
heterogeneous reactions compared with traditional packed-bed approaches. The
integrated catalytic reactor allows, for the first time, a reactor which is precisely defined
in terms of its packing geometry and configuration. Integrating the porous catalyst
support within the walls of the reactor is a common configuration of monolithic catalytic
reactors, although seldom used for the purposes of chemical synthesis. Monolithic
reactors contain bundles of open channels with diameters as small as a millimeter.
0.01
0.1
1
10
100
1 10 100 1000 10000εεεεV
((((W////m3333))))
KLa
(s-1
)
Correlation proposed by SatterfieldKLa ∝ εV
1/2
Results from Packed-Bed Microreactor

222
Because they are manufactured using an extrusion process, the channel walls are smooth.
The principal difference in the integrated catalytic reactors here, is that, in addition to
have multiple channels or bundles of channels, the channels are filled with
microstructural features to increase the catalytic area and improve mass transfer. Both
reactor designs, the packed-bed reactor and the integrated catalytic reactor, have their
relative merits and flaws.
8.4.2. What is an appropriate reaction for a microchemical system?
There can be a number of reasons motivating the use a microreactor system,
including safety, improved thermal control, improved mass transfer and ultimately higher
productivity, improved control and sensitivity for kinetics investigations. For the chip-
based, continuous flow designs presented in this thesis, there is a minimum reaction rate
that will be feasible to perform. For process intensification and microreactors in general,
the faster the reaction the better. If the reaction is too slow, then the residence time
required for adequate conversion will require a flow rate which is too low. Several
factors determine the minimum flow rate. The capabilities of modern syringe and HPLC
pumps determines the minimum liquid flow rates for stable, reproducible pressure-driven
flow. This value is in the range of 0.001-0.01 mL/min., although some highly
sophisticated pumps can achieve flow 1-2 orders of magnitude lower. Another practical
limitation is the amount of sample required for analysis. In addition, the volume of the
packaging and fluidic interconnections can be significantly larger than the reactor
requiring significant times for the low flow rates in order to purge out the volume. Based
on the experience of the reactors studied here, a flow rate of 0.01 mL/min is the minimum
flow rate which is practical for experimentation. For a reactor volume of 0.040ml (the

223
multichannel reactor) the maximum residence time allowed in order to achieve a desired
level of conversion is 4 minutes. For a first order reaction in a PFR with a substrate at
1M concentration, this implies a minimum rate constant (99% conversion), k > 0.02 s-1.
If the purpose of the study is to investigate kinetics where only 10% conversion is
acceptable, then the minimum rate constant is k > 0.0004 s-1. Fogler suggests a
Damkohler number (Da = τk) of 10 to achieve a conversion of approximately 90% in a
CSTR. This again would suggest a minimum first order rate constant, k > 0.04 s-1.
Using only rate constants, however, can be misleading. The gas-liquid
hydrogenation of cyclohexene has a rate constant of 16 s-1, but because the solubility, or
concentration, of hydrogen is so low (0.004 mol/L) the corresponding rate is not as high
as the rate constant would suggest. The rate is zero order in substrate until the conversion
gets above 90%, then the reaction order switches to first order. Assuming zero order
kinetics and a substrate of 1M, for complete conversion a residence time of only 15
seconds is required. Assuming that the hydrogen concentration does not vary
substantially between various reactions, a minimum zero order rate constant can be
established based on the maximum residence time of 4 minutes, k > 1.0 s-1.
With heterogeneously catalyzed reactions, such as the cyclohexene
hydrogenation, the reaction rate can be improved by increasing the number of catalyst
sites. In typical reactors, this catalyst site density is kept low or just at the point where
mass transfer would limit the reaction. For the microreactor systems, the a higher
catalyst activity is tolerable because the mass transfer is improved. For other reactions,

224
more aggressive conditions can be performed in a microreactor system, so comparing rate
constants alone is not entirely accurate.
To summarize, for the reactors of this study, the follow rate constants are
recommended as a guide for reactions with sufficient rate
k(min) > 0.02 s-1 (First order rate constant, liquid reaction)
k(min) > 1.0 s-1 (Zero order hydrogenation)
These minimum rate constants can be extended if the volume of the reactor were
increased so as to increase the residence time. The volumetric limits for building
microreactors using silicon micromachining technology is the size of the silicon substrate
(100 mm). Assuming that a single reactor were to occupy an entire wafer, then the
residence time could be improved (increased) by a factor of 10-20.
8.4.3. Is Small Really Better? The question of process intensification
Is process intensification or a reduction in reactor size beneficial? Consider the
two reactors of figure 8-2. Reactor 1 has a more active catalyst at 6000 cm2/g of active
surface area, while reactor 2 has a less active catalyst but is 1000 times larger. In the
absence of mass transfer limitations, both will have the same reactor throughput at
6.05×10⁻⁴ mol/s for the cyclohexene hydrogenation. Because reactor 1 has the more
active catalyst, it has a higher volumetric reaction rate, 6.05×10⁻⁵ versus 6.05×10⁻⁸
mol/s/cm3. If we now consider mass transfer effects, both will have the same mass
transfer coefficient, KLa = 0.01 s-1, because both are loaded with the same size catalyst
pellets (5 mm). The reaction throughput for reactor 1 is now greatly diminished because
the volumetric rate of gas absorption can not support the rate of reaction. This would
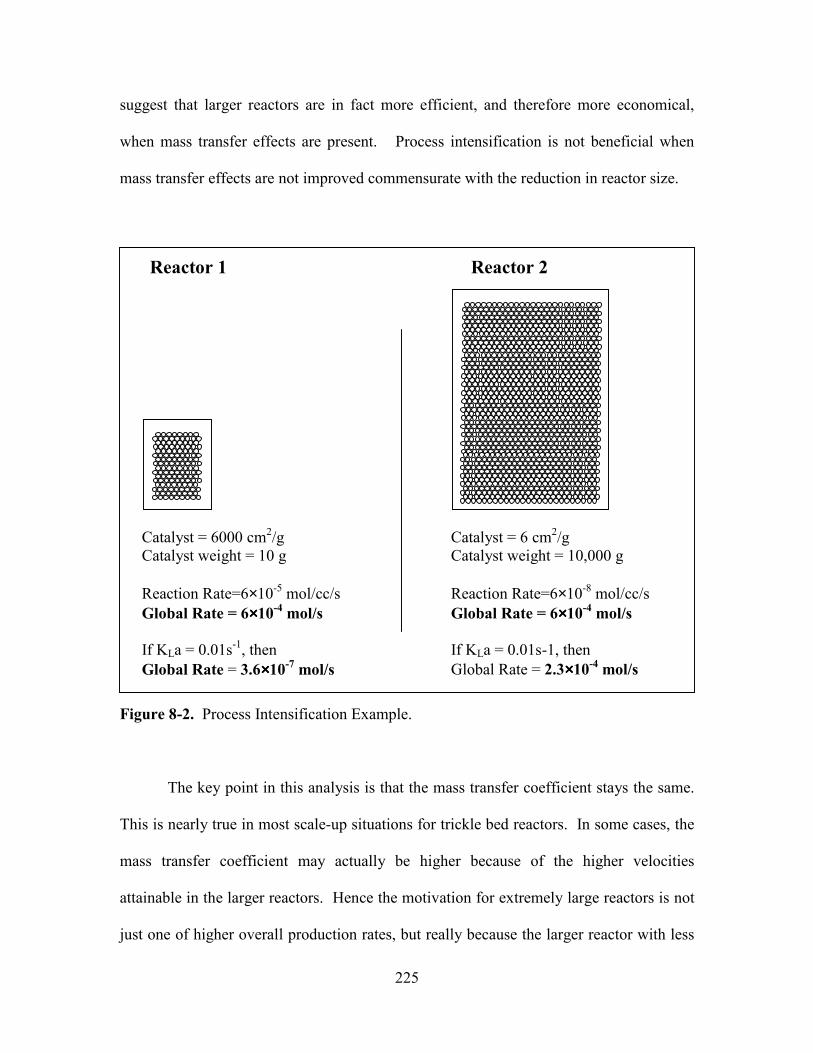
225
suggest that larger reactors are in fact more efficient, and therefore more economical,
when mass transfer effects are present. Process intensification is not beneficial when
mass transfer effects are not improved commensurate with the reduction in reactor size.
Figure 8-2. Process Intensification Example.
The key point in this analysis is that the mass transfer coefficient stays the same.
This is nearly true in most scale-up situations for trickle bed reactors. In some cases, the
mass transfer coefficient may actually be higher because of the higher velocities
attainable in the larger reactors. Hence the motivation for extremely large reactors is not
just one of higher overall production rates, but really because the larger reactor with less
Catalyst = 6000 cm2/g Catalyst weight = 10 g Reaction Rate=6×10⁻⁵ mol/cc/s Global Rate = 6××××10-4 mol/s If KLa = 0.01s-1, then Global Rate = 3.6××××10-7 mol/s
Catalyst = 6 cm2/g Catalyst weight = 10,000 g Reaction Rate=6×10⁻⁸ mol/cc/s Global Rate = 6××××10-4 mol/s If KLa = 0.01s-1, then Global Rate = 2.3××××10-4 mol/s
Reactor 1 Reactor 2

226
active catalyst operates more efficiently. If the smaller reactor were to have a higher
mass transfer coefficient, then the volumetric gas absorption rate could support the more
active catalyst, and an overall smaller reactor volume would be sufficient. The results
presented in this thesis indicate that the smaller particle or catalyst dimensions translate
into higher mass transfer coefficients, thereby allowing more active catalysts and
consequently reduced reactor volumes. Reactor size can either refer to catalyst
dimensions or reactor volume. For traditional trickle-bed reactors, reducing the reactor
volume by increasing the activity of the catalyst results in poorer productivity. For
reactors with small characteristic lengths such as the microreactors of this study, mass
transfer is improved, and the catalyst activity can be increased resulting in a smaller
reactor volume. Smaller is better—only when the features determining mass transfer are
also reduced in size.
The other issue is one of deactivation of the catalyst. As seen in chapter 4, when
the intrinsic kinetics of the chemistry dominate the reaction rates, as opposed to mass
transfer, the global rate is more sensitive to deactivation or poisoning of the catalytic
sites. In the example above, if the number of active sites in reactor 1 (mass transfer
limited) is reduced by one-half, the global rate is reduced by only 0.1%. If the number of
active sites in reactor 2 is reduced by one-half, the global rate is reduced by nearly 40%.
By having a large catalytic activity in excess of the mass transfer capabilities of the
reactor (reactor #1), the effects of deactivation can be masked and the global rate will
appear to remain more constant. This comes at the expense of lower volumetric reaction
rates. The net result of process intensification is that the rate per volume of reactor can
be expanded greatly through improving catalyst activity and mass transfer, but
227
deactivation of the catalyst plays a larger role throughout the lifetime of the catalyst. As
seen in chapter 4, if the proper purification and activation procedures are utilized, then
the activity can remain high over time. Without deactivation, the volume of the catalyst
can be tailored more efficiently to the demands of the process.
8.5. Summary
The mass transfer in the microreactor is greatly improved over its macroscale
counterpart, due in part to the high gas-liquid interfacial area generated by the
microreactor. The two phases are forced to mix over the catalyst in a constrained volume
relative to the standard pellet-size length scale in trickle-bed reactors. Compared with the
dimensions of laboratory trickle bed reactor catalyst pellets (4-8 mm), the 50 µm catalyst
particles used in the microreactor represent a 100-fold increase in the surface-to-volume
ratio. A similar improvement in performance would be expected if small particles could
be used in a standard laboratory reactor. However, the use of such small particles would
lead to nonuniform flow distribution and very large pressure drops for typical laboratory
reactor geometries. The microfabrication approach allows the control (and visualization
cf. Figure 7-4) of multiphase flows in multiple channels and geometries (higher reactor
diameter to length ratios) that provide for reasonable pressure drops (0.17 MPa)

228
9. Conclusions and Recommendations for Further Study
Conducting chemistry at microscopic dimensions has allowed the study of novel
fluidic phenomena and the demonstration of unprecedented levels of mass transfer in
multiphase systems. Microfabrication technology permitted the construction of the
chemical reaction devices in this thesis; devices with arrays of microscopic channels and
features unattainable using other, more conventional, fabrication approaches. As a result
of their microscopic engineering, some of the devices allowed the study of entirely novel
multiphase flow behavior: the flow regime characteristics of the microstructured reactors
in chapter 7 illustrate this point. In addition, the reduced length scales allowed for rapid
diffusion and higher interfacial areas producing mass transfer coefficients at least 100
times larger than in conventional reactors: the hydrogenation of cyclohexene in chapter 4
provided the quantitative verification of this effect. Yet a third demonstration in this
thesis was the integration of standard catalytic materials onto a chip format as well as the
integration of the catalytic materials into the reactor: this could one day allow for the
rapid and automated testing of catalytic materials by integrating sensing (which is
commonly a semiconductor thin-film device) and reaction into one package.
9.1. Thesis Summary
In the last 5-7 years, microreaction engineering has emerged as a new discipline
as a subset of 'lab-on-a-chip' or 'micro total analysis systems.' A broad array of research
activities in the area of chemical process miniaturization and intensification has taken
place. As a contribution to this field of microchemical systems, this thesis has
demonstrated, quantitatively, the benefits in terms of mass transfer as a result of

229
miniaturization. It has also been demonstrated that silicon microfabrication is a useful
and enabling technology for constructing such microchemical reactors. The
microstructured reactor of Chapter 6 is the culmination of a series of designs, starting
with the single channel packed bed reactor of Chapter 2.
Multiphase reactions are particularly suitable for microreaction technology,
whether they are gas-liquid, immiscible liquids, homogeneous or heterogeneously
catalyzed. As a result of having to mix distinct phases of different fluid properties, the
rates of chemical processes can often be limited or hindered as a result of the phase
interface. Increasing the interfacial area between the two phases increases the rate of
transport for a species and reducing the length scale by which this transport takes place
also improves the rate of mass transfer. This effect is particularly evident for gas-liquid
reactions which are prevalent throughout petrochemical, fine and specialty chemical and
pharmaceutical processing.
Trickle-bed reactors are an example of a continuous, heterogeneously catalyzed,
gas-liquid process. In addition to transport at the gas-liquid interface, mass transport
effects are complicated by the fact that both reacting species must get to a catalyst site
before reaction can occur. Of all the chemical reactor types, trickle-bed reactors are the
most likely to suffer from mass transfer limitations. For this reason, the trickle-bed
reactor was chosen as an illustrative guide and point of comparison for designing chip-
based multiphase reactors. The critical issues in the design of the microreactor were the
nature of the catalyst, the speed and exothermicity of the model reaction, the distribution
and mixing of gas-liquid streams in confined spaces, the pressure losses, and the required
residence times.

230
9.2. Principal Accomplishments of the Thesis
9.2.1. Measurement of KLa in a microreactor system
The performance of a microreactor system was quantitatively characterized and
compared with conventional reactors using multiphase chemical reactions. The mass
transfer coeffficent KLa, which determines the rate for gas-liquid absorption, was found
to be in the range of 3-30 s-1, which is at least 100 times better than in conventional
reactors. The interfacial contact area, which is another measure of gas-liquid absorption
capacity, was also experimentally determined to be as much as 100 times larger (as high
as 16,000 m-1) than in traditional gas-liquid contacting equipment. The cost for achieving
such high levels of mass transfer comes in the form of the energy consumption or power
dissipation (as reflected by the pressure drop). As was shown in section 8-3, the level of
mass transfer is commensurate with the level of power dissipation. The microreactor is
no less efficient than conventional reactors. The difference is that the microreactor
allows one to achieve the higher levels of mass transfer which are unattainable any other
way.
9.2.2. First micromachined packed-bed and novel gas-liquid contacting
Micromachining methods enable the efficient construction of complicated 2-
dimensional extruded geometries. The microstructured reactor of chapters 6 and 7 is the
first example of a completely micromachined packed bed reactor. The geometry,
arrangement, and void fraction of the packing is determined precisely by the design of the
reactor. This is in sharp contrast to the traditional approach of relying upon the random
231
arrangement of particles in a packed-bed format. As a result of defining the bed
geometry, pressure drop and fluid distribution was controlled. As compared to gas-liquid
contacting in open-channel capillaries, the microstructured channel promoted the mixing
and dispersion of the two phases. The dispersed flow regime induced by the column
arrays is unique to this system having never been observed in past gas-liquid flow
studies. The increased level of interfacial contact area in this dispersed flow regime can
have significant implications for improved heat and mass transfer for multiphase systems.
9.2.3. Comparison of integrated catalysts with conventional catalysts
The ability to precisely define the arrangement of the packed-bed is a positive
feature of the microstructured reactors, but it requires the integration of the catalyst into
the reactor. The reactor device is specific to a particular chemistry and modes of
fabricating a particular catalyst may be proprietary or difficult to reproduce in a porous
silicon substrate. The filter design of chapter 2 allows the integration of conventional
catalytic materials (powders of high surface area catalysts) onto a chip-based format. The
added advantage is that the catalyst can easily be removed and replaced with a different
material for a different reaction or operation. In addition, the art of catalyst manufacture
is left to those specialists who have a collective expertise spanning the last century of
chemical production. By integrating the powdered catalysts onto the chip, formats for
rapidly testing standard catalysts could become available. Novel semiconductor or
MEMS-based chemical sensors could be coupled with the reactor in one package for
higher sensitivity and faster operation.

232
9.3. Recommendations for Further Study
The multiphase systems investigated in this thesis were heterogeneously catalyzed
gas-liquid reactions. There are abundant examples of other multiphase systems which
would be equally suitable for microreaction technology, such as homogeneously
catalyzed gas-liquid reactions or reactions between components in immiscible liquids,
such as in phase-transfer catalysis. Other multiphase processes could benefit from novel
devices available from the microfabrication methods presented here, such as extractions
or emulsion formation. Examples of forming oil in water dispersions are presented in
the next section.
For heterogeneously catalyzed gas-liquid reactions, the cyclohexene
hydrogenation used as the model reaction in this thesis is a fairly simple chemistry. The
lack of selectivity issues makes the analysis straightforward, but there is an opportunity
for demonstrated an added feature to improved mass transfer: improving yield by
controlling selectivity. Furthermore, the increased mass transfer could allow the
successful investigation of intrinsic kinetics for a range of multiphase reactions.
9.3.1. Novel Materials by Microfluidic Synthesis
Whereas research in microchemical reactors to-date has focused on the synthesis
of established commodity or specialty compounds, the area of novel material synthesis
has yet to be explored. Microfluidic technology provides a number of unique advantages
related to materials processing. With the improvements in heat and mass transfer
resulting from higher surface-to-volume ratios, more control over the material forming
process could lead to higher quality materials or materials with unique properties. An

233
example is in solids-forming processes where the particle size and the particle size
distribution influence the properties of the material. Materials which have a strong
relationship between particle morphology and function include drugs, pigments, and
some semiconductors. Controlling the crystallization mechanisms of a pharmaceutical
compound is recognized to have an important influence on therapeutic function. By
directly controlling the interface, diffusion and contact time between two mixing streams,
the microfluidic reactor may better direct the particulate forming process.
Figure 9-1. Oil droplet formation in water using the multichannel microreactor. (1wt% surfactant) A) Initial generation of oil droplets at the inlet channels. B) Continued growth of the oil droplets. C) Middle droplet breaks away and proceeds to flow down the channel. D) Droplets from adjacent channels cluster together.
An emerging area within microfluidics is the potential for control the processing
of colloids and emulsions.[126] Modern semiconductor fabrication methods deal with
features 0.1 µm in size; more practical MEMS devices will probably deal with features
A B
C D

234
closer to 1 µm. Nevertheless, reactors can be designed with characteristic length scales
closer to those of the emulsions than in conventional reactors. Whereas in conventional
processing the duration and speed of agitation may effect the emulsion's performance,
micromixing devices could potentially gain wider control through manipulation of the
dispersion process at the micro-level. Figure 9-1 contains a sequence of images showing
the dispersion of an oil phase into water which contains 1 wt% surfactant (Triton-X).
Without surfactant, the behavior is very different. Figure 9-2 illustrates the dispersion of
oil in water showing the uniform distribution of droplet size within the channels of the
microreactor.
Figure 9-2. Oil droplet formation in water without surfactant.
One such area of application for microfluidic emulsifiers could be in the
microencapsulation of pharmaceutical agents for controlled delivery. Microfluidic
reactors for creating emulsions could provide more control over the various parameters,
such as size, morphology and size distribution of the polymer capsules. A microfluidic
100 µµµµm

235
platform could also more efficiently screen the various parameters (concentration of the
polymer and protein solutions, organic/aqueous phases ratio). The other advantage to
moving the encapsulation process to a chip is in the conservation of valuable therapeutic
agents. The protein or compound involved may be in short supply: improving
encapsulation efficiency and minimizing waste could be important benefits.
9.4. Comments on the future.
As ‘chip’ technology takes hold within analytical chemistry and modern
computing becomes more sophisticated, chemical synthesis could one day become
completely automated. Chip-based pumps, valves, and fluidic manifolds, currently under
development in several labs, will one day automate all of the fluid manipulations carried
out by hand today. Integrating these fluidic control elements with mixing units, reaction
units, separation devices, and analytical devices will create multi functional and rapidly
configurable chemistry lab sets. All of the menial tasks now performed by chemists in
the lab, such as the configuration of glassware, the transferal and mixing of reagents, the
separation, purification, and analysis of products will one day be done at the computer
terminal rather than the lab bench. The first applications have been for portable analytical
equipment, but gradually the platforms are penetrating into traditional organic synthesis.
Today, automated peptide synthesizers utilize sequences of automated chemical reactions
that combine amino acids to create custom biomolecules. The future could hold a similar
product for a much more diverse world of organic molecule synthesis.
The drive to such an automated, configurable microfluidics platform is the result
of the inherent advantages of microfabrication and the benefits of engineering at the
236
microscale. Microfabrication holds the potential to mass fabricate identical chemistry lab
components cheaply with a wide range of integrated functionality. Performing chemistry
in the microscopic domain has the advantage of low reagent consumption, safety in terms
of control and exposure, and improved process control due to superior heat and mass
transfer.
The vision of integrating an entire chemical plant on a chip may be some time in
coming, but the tools necessary to create an integrated, miniaturized chemical system are
becoming more common-place. As the benefits of micro-scaled reaction devices become
known, the drive to miniaturize will increase. This thesis has demonstrated, for a
particular class of chemical reaction, that engineering features in the sub-millimeter
regime can have a positive influence on the performance of the process. Microfabrication
has also allowed us to re-think the way chemical reactors have traditionally been
designed and has enabled the creation of entirely novel chemical reactors for multiphase
chemical processes.

237
10. References
[1] M. Freemantle, "Downsizing chemistry," in Chemical & Engineering News. 1999. p.
27-36.
[2] G. Ondrey, "Microreactor Engineering: Birth of a New Discipline?," Chemical
Engineering, vol. 102, no. (3), pp. 52, 1995.
[3] R.S. Benson and J.W. Ponton, "Process Miniaturization--A Route to Total
Environmental Acceptability," Transactions of the Institution of Chemical
Engineers, vol. 71 A, no. , pp. 160-168, 1993.
[4] J.J. Lerou, et al., Microfabricated minichemical systems: Technical feasibility, in
Microsystem Technology for Chemical and Biological Microreactors: Papers of
the Workshop on Microsystem Technology, Mainz, 20-21 February, 1995. 1996,
DECHEMA: Frankfurt. p. 51-69.
[5] R.S. Wegeng, C.J. Call, and M.K. Drost. Chemical System Miniaturization. in AIChE
1996 Spring National Meeting. 1996. New Orleans, LA.
[6] W. Ehrfeld, I.H. Rinard, and R.S. Wegeng, eds. Process Miniaturization: 2nd
International Conference on Microreaction Technology. . 1998, AIChE: New
York.
[7] W. Ehrfeld, ed. Microreaction Technology. 3rd International Conference on
Microreaction Technology. . 1999, Springer: Berlin.
[8] S.J. Haswell, et al., "The application of micro reactors to synthetic chemistry,"
Chemical Communications, vol. , no. (5), pp. 391-398, 2001.

238
[9] P. Fletcher and S. Haswell, "Downsizing synthesis," Chemistry in Britain, vol. 35,
no. (11), pp. 38-41, 1999.
[10] H. Okamoto, "Are microreactors useful for organic synthesis?," Journal of Synthetic
Organic Chemistry Japan, vol. 57, no. (9), pp. 805-812, 1999.
[11] S.H. DeWitt, "Microreactors for chemical synthesis," Current Opinion in Chemical
Biology, vol. 3, no. (3), pp. 350-356, 1999.
[12] W. Ehrfeld, V. Hessel, and H. Lehr, Microreactors for chemical synthesis and
biotechnology - Current developments and future applications, in Microsystem
Technology in Chemistry and Life Science. 1998. p. 233-252.
[13] K.P. Jäckel, Microtechnology: Application opportunities in the chemical industry,
in Microsystem Technology for Chemical and Biological Microreactors: Papers
of the Workshop on Microsystem Technology, 20-21 February, 1995. 1996,
DECHEMA: Frankfurt. p. 29-50.
[14] K.F. Jensen, "Microchemical systems: Status, challenges, and opportunities,"
AIChE Journal, vol. 45, no. (10), pp. 2051-2054, 1999.
[15] D.J. Harrison, P.G. Glavina, and A. Manz, "Towards Miniaturized Electrophoresis
and Chemical-Analysis Systems On Silicon - an Alternative to Chemical
Sensors," Sensors and Actuators B-Chemical, vol. 10, no. (2), pp. 107-116, 1993.
[16] A. Manz and H. Becker, Microsystem Technology in Chemistry and Life Sciences.
Topics in Current Chemistry. Vol. 194. 1998, Berlin: Springer.
[17] A.v.d. Berg, W. Olthuis, and P. Bergveld, Micro Total Analysis Systems 2000. 2000,
Dordrecht: Kluwer Academic.
239
[18] M.A. Burns, et al., "An integrated nanoliter DNA analysis device," Science, vol.
282, no. (5388), pp. 484-487, 1998.
[19] D.J. Quiram, et al., "Design issues for membrane-based, gas phase microchemical
systems," Chemical Engineering Science, vol. 55, no. (16), pp. 3065-3075, 2000.
[20] B. Jandeleit, et al., "Combinatorial materials science and catalysis," Angewandte
Chemie-International Edition, vol. 38, no. (17), pp. 2495-2532, 1999.
[21] S. Senkan, et al., "High-throughput testing of heterogeneous catalyst libraries using
array microreactors and mass spectrometry," Angewandte Chemie-International
Edition, vol. 38, no. (18), pp. 2794-2799, 1999.
[22] S. Senkan, "Combinatorial heterogeneous catalysis - A new path in an old field,"
Angewandte Chemie-International Edition, vol. 40, no. (2), pp. 312-329, 2001.
[23] W.H. Weinberg, et al., "Combinatorial methods in homogeneous and heterogeneous
catalysis," Current Opinion in Solid State & Materials Science, vol. 3, no. (1), pp.
104-110, 1998.
[24] M.P. Dudukovic, "Multiphase reactors-revisited," Chemical Engineering Science,
vol. 54, no. , pp. 1975-1995, 1999.
[25] S.Y. Lee and Y.P. Tsui, "Succeed at gas/liquid contacting," Chemical Engineering
Progress, vol. 95, no. (7), pp. 23-49, 1999.
[26] P.L. Mills and R.V. Chaudhari, "Multiphase catalytic reactor engineering and
design for pharmaceuticals and fine chemicals," Catalysis Today, vol. 37, no. (4),
pp. 367-404, 1997.
[27] A.A. Pelossof, "Mass transfer limitations in a trickle-bed reactor.," in Chemical
Engineering. 1967, MIT: Cambridge.

240
[28] C.N. Satterfield, "Trickle-Bed Reactors," AIChE Journal, vol. 21, no. (2), pp. 209,
1975.
[29] M. Herskowitz and J.M. Smith, "Trickle-Bed Reactors: A Review," AIChE Journal,
vol. 29, no. (1), pp. 1-17, 1983.
[30] M.H. AlDahhan, et al., "High-Pressure Trickle-Bed Reactors: A Review,"
Industrial & Engineering Chemistry Research, vol. 36, no. (8), pp. 3292-3314,
1997.
[31] F. Larachi, et al., "Hydrodynamics and mass transfer in high-pressure trickle-bed
reactors," Theoretical Foundations of Chemical Engineering, vol. 32, no. (6), pp.
564-569, 1998.
[32] P.C. Watson and M.P. Harold, "Dynamic Effects of Vaporization With Exothermic
Reaction in a Porous Catalytic Pellet," Aiche Journal, vol. 39, no. (6), pp. 989-
1006, 1993.
[33] A.M. Brownstein, "1,4-Butanediol and tetrahydrofuran: Exemplary small-volume
commodities," CHEMTECH, vol. , no. (August), pp. 506-510, 1991.
[34] F. Roessler, "Catalysis in the Industrial Production of Pharmaceuticals and Fine
Chemicals," Chimia, vol. 50, no. , pp. 106-109, 1996.
[35] M. Boudart, R.J. Madon, and J.P. O'Connell, "Catalytic Hydrogenation of
Cyclohexene," AIChE Journal, vol. 24, no. (5), pp. 904, 1978.
[36] J.M. Winterbottom, et al., "Catalytic Hydrogenation in a Packed Bed Bubble
Column Reactor," Catalysis Today, vol. 48, no. , pp. 221-228, 1999.
[37] U.K. Singh and M.A. Vannice, "Liquid-Phase Hydrogenation of Citral over Pt/SiO2
Catalysts," Journal of Catalysis, vol. 191, no. , pp. 165-180, 2000.

241
[38] A.H. Germain, et al., Obtaining Intrinsic Kinetic Data Using a Micro Trickle Bed
Reactor: The Hydrogenation of Glucose on Supported Ruthenium, in New
Horizons in Catalysis, T. Seiyama and K. Tanabe, Editors. 1980, Elsevier: New
York. p. 1492-1493.
[39] I. Mazzarino, "A comparative study of sandwich cross-flow and random catalytic
packings for multiphase chemical reactors," Chemical engineering Science, vol.
54, no. , pp. 3677-3682, 1999.
[40] R.D. Chambers and R.C.H. Spink, "Microreactors for elemental fluorine," Chemical
Communications, vol. , no. (10), pp. 883-884, 1999.
[41] K. Jahnisch, et al., "Direct fluorination of toluene using elemental fluorine in
gas/liquid microreactors," Journal of Fluorine Chemistry, vol. 105, no. (1), pp.
117-128, 2000.
[42] G. Wiebmeier and D. Honicke. Microreaction Technology: Development of a Micro
Channel Reactor and its Application in Heterogeneously Catalyzed
Hydrogenations. in Process Miniaturization: 2nd International Conference on
Microreaction Technology. 1998. New Orleans, LA: AICHE.
[43] J. Shaw, et al. Reaction and Transport Coupling for Liquid and Liquid/Gas Micro-
Reactor Systems. in Process Miniaturization: 2nd International Conference on
Microreaction Technology. 1998. New Orleans, LA: AICHE.
[44] V. Hessel, et al. Gas/Liquid Dispersion Processes in Micromixers: The Hexagon
Flow. in Process Miniaturization: 2nd International Conference on
Microreaction Technology. 1998. New Orleans, LA: AICHE.

242
[45] P. Angeli, D. Gobby, and A. Gavriilidis, Modelling of Gas-Liquid Catalytic
Reactions in Microchannels, in Microreacttion Technology: Industrial Prospects,
W. Ehrfeld, Editor. 2000, Springer: Berlin. p. 253-259.
[46] R. Srinivasan, et al., "Micromachined reactors for catalytic partial oxidation
reactions," Aiche Journal, vol. 43, no. (11), pp. 3059-3069, 1997.
[47] R. Srinivasan, "Microfabricated Reactors for Partial Oxidation Reactions," in
Department of Chemical Engineering. 1998, Massachusetts Institute of
Technology: Cambridge.
[48] T.M. Floyd, et al., Novel Liquid Phase Microreactors for Safe Production of
Hazardous Specialty Chemicals, in Microreacttion Technology: Industrial
Prospects, W. Ehrfeld, Editor. 2000, Springer: Berlin. p. 171-180.
[49] J.B. Knight, et al., "Hydrodynamic focusing on a silicon chip: Mixing nanoliters in
microseconds," Physical Review Letters, vol. 80, no. (17), pp. 3863-3866, 1998.
[50] J. Voldman, M.L. Gray, and M.A. Schmidt, "An integrated liquid mixer/valve,"
Journal of Microelectromechanical Systems, vol. 9, no. (3), pp. 295-302, 2000.
[51] W. Ehrfeld, et al., "Characterization of mixing in micromixers by a test reaction:
Single mixing units and mixer arrays," Industrial & Engineering Chemistry
Research, vol. 38, no. (3), pp. 1075-1082, 1999.
[52] D. Bokenkamp, et al., "Microfabricated silicon mixers for submillisecond quench-
flow analysis," Analytical Chemistry, vol. 70, no. (2), pp. 232-236, 1998.
[53] J. Evans, D. Liepmann, and A.P. Pisano. Planar Laminar Mixer. in IEEE 10th
International Workshop on Micro Electro Mechanical Systems. 1997. Nagoya,
Japan.

243
[54] R.H. Liu, et al., "Passive mixing in a three-dimensional serpentine microchannel,"
Journal of Microelectromechanical Systems, vol. 9, no. (2), pp. 190-197, 2000.
[55] H. Möbius, et al. Sensor Controlled Processes in Chemical Microreactors. in The
8th International Conference on Solid-State Sensors and Actuators, 1995 and
Eurosensors IX. Transducers '95. 1995: IEEE.
[56] B. He, L. Tan, and F. Regnier, "Microfabricated filters for microfluidic analytical
systems," Anal. Chem., vol. 71, no. , pp. 1464-1468, 1999.
[57] W. Ehrfeld, et al., "Microfabrication of Membranes With Extreme Porosity and
Uniform Pore-Size," Journal of Membrane Science, vol. 36, no. , pp. 67-77, 1988.
[58] Y. Wang and M. Ferrari, "Surface modification of micromachined silicon filters,"
Journal of Materials Science, vol. 35, no. , pp. 4923-4930, 2000.
[59] H.S. Fogler, Elements of Chemical Reaction Engineering. 2nd ed. 1992: Prentice
Hall.
[60] C.N. Satterfield, Mass Transfer in Heterogeneous Catalysis. 1981: Krieger
Publishing.
[61] A.A. Ayon, et al., "Characterization of a time multiplexed inductively coupled
plasma etcher," Journal of the Electrochemical Society, vol. 146, no. (1), pp. 339-
349, 1999.
[62] M.A. Schmidt, "Wafer-to-wafer bonding for microstructure formation,"
Proceedings of the IEEE, vol. 86, no. (8), pp. 1575-1585, 1998.
[63] Behr A., Ebbers W., and W. N., "Miniplants - A contribution to inherent safety?,"
Chemie Ingenieur Technik, vol. 72, no. (10), pp. 1157-1166, 2000.
244
[64] A. Lord and H.O. Pritchard, "Thermodynamics of Phosgene Formation from
Carbon Monoxide and Chlorine," J. Chem. Thermodynamics, vol. 2, no. , pp. 187,
1970.
[65] J.H. Saunders, E.E. Hardy, and R.J. Slocombe, Phosgene, in Encyclopedia of
Chemical Technology, R.E. Kirk and D.F. Othmer, Editors. 1953, Interscience
Encyclopedia, Inc.: New York. p. 391.
[66] EPA, "Locating and Estimating Air Emissions From Sources of Phosgene," . 1985,
Environmental Protection Agency.
[67] E.N. Shapatina, et al., "The Kinetics of Catalytic Synthesis of Phosgene," Kinetics
and Catalysis, vol. 17, no. , pp. 559, 1976.
[68] J.C. Sheehan, P.A. Cruickshanks, and G.L. Boshart, "A Convenient Synthesis of
Water-Soluble Carbodiimides," J. Organic Chem, vol. 26, no. , pp. 2525, 1961.
[69] E.N. Shapatina and V.L. Kuchaev, "Kinetics of the Synthesis of Phosgene Using
Low Chlorine Concentrations," Kinetics and Catalysis, vol. 20, no. , pp. 972,
1980.
[70] B. Zhao, J.S. Moore, and D.J. Beebe, "Surface-directed liquid flow inside
microchannels," Science, vol. 291, no. (5506), pp. 1023-1026, 2001.
[71] A. Adamson and A. Gast, Physical Chemistry of Surfaces. 6th ed. 1997, New York:
Wiley.
[72] B.L. Gray, et al., "Novel interconnection technologies for integrated microfluidic
systems," Sensors and Actuators a-Physical, vol. 77, no. (1), pp. 57-65, 1999.

245
[73] A. Mehra, et al., "Microfabrication of high-temperature silicon devices using wafer
bonding and deep reactive ion etching," Journal of Microelectromechanical
Systems, vol. 8, no. (2), pp. 152-160, 1999.
[74] S.L. Firebaugh, K.F. Jensen, and M.A. Schmidt, "Investigation of High-
Temperature Degradation of Platinum Thin Films with an In Situ Resistance
Measurement Apparatus," Journal of Microelectromechanical Systems, vol. 7, no.
(1), pp. 129-135, 1998.
[75] J.T. Santini, M.J. Cima, and R. Langer, "A controlled-release microchip," Nature,
vol. 397, no. , pp. 335-338, 1999.
[76] T. Fukano and Kariyasaki, "Characteristics of gas-liquid two-phase flow in a
capillary tube," Nuclear Engineering and Design, vol. 141, no. , pp. 59-63, 1993.
[77] N. Brauner and D.M. Maron, "Identification of the range of 'small diameters'
conduits, regarding two-phase flow pattern transisiton," International
Communications in Heat and Mass Transfer, vol. 19, no. , pp. 29-39, 1992.
[78] W. Deen, Analysis of Transport Phenomena. 1998, New York: Oxford University
Press.
[79] K. Kawakami, M. Yamamoto, and K. Kusunoki, "Intraparticle Diffusion Effects for
Liquid-Phase Hydrogenation of Cyclohexene on a Pt-Al2O3 Catalyst," The
Canadian Journal of Chemical Engineering, vol. 59, no. (June), pp. 407-409,
1981.
[80] D.E. Gardin, et al., "Liquid-Phase Hydrogenation of Cyclohexene over Pt Foil
Catalysts," Journal of Catalysis, vol. 158, no. , pp. 193-198, 1996.

246
[81] S.D. Jackson, et al., "Cycloalkene Hydrogenation over Palladium Catalysts,"
Applied Catalysis A: General, vol. 187, no. , pp. 161-168, 1999.
[82] M.A. Aramendia, et al., "Transformation of cyclohexene on palladium catalysts:
activity and deactivation," Journal of Molecular Catalysis A: Chemical, vol. 151,
no. , pp. 261-269, 2000.
[83] F. Turek and R. Lange, "Mass Transfer in Trickle-Bed Reactors at Low Reynolds
Number," Chemical Engineering Science, vol. 36, no. , pp. 569-579, 1981.
[84] J.C. Charpentier and M. Favier, "Some Liquid Holdup Experimental Data in
Trickle-Bed Reactors for Foaming and Nonfoaming Hydrocarbons," AIChE
Journal, vol. 21, no. (6), pp. 1213-1218, 1975.
[85] R.Y. Wu, M.J. McCready, and A. Varma, "Effect of pulsing on reaction outcome in
a gas-liquid catalytic packed-bed reactor," Catalysis Today, vol. 48, no. (1-4), pp.
195-198, 1999.
[86] E.L. Cussler, Diffusion, mass transfer in fluid systems. 2nd ed. 1997, New York:
Cambridge University Press.
[87] M.W. Losey, M.A. Schmidt, and K.F. Jensen, A micro packed-bed reactor for
chemical synthesis, in Microreacttion Technology: Industrial Prospects, W.
Ehrfeld, Editor. 2000, Springer: Berlin. p. 277-286.
[88] D. Oner and T. McCarthy, "Ultrahydrophobic Surfaces. Effects of Topography
Length Scales on Wettability," Langmuir, vol. 16, no. , pp. 7777-7782, 2000.
[89] R.D. Oleschuk, et al., "Trapping of bead-based reagents within microfluidic
systems: On-chip solid-phase extraction and electrochromatography," Analytical
Chemistry, vol. 72, no. (3), pp. 585-590, 2000.

247
[90] J.P. Kutter, S.C. Jacobson, and J.M. Ramsey, "Solid phase extraction on
microfluidic devices," Journal of Microcolumn Separations, vol. 12, no. (2), pp.
93-97, 2000.
[91] L.A. Christel, et al., "Rapid, automated nucleic acid probe assays using silicon
microstructures for nucleic acid concentration," Journal of Biomechanical
Engineering-Transactions of the Asme, vol. 121, no. (1), pp. 22-27, 1999.
[92] B. He and F. Regnier. Microfabricated liquid chromatography columns based on
collocated monolith support structures. in Micro Total Analysis Systems'98
Workshop. 1998. Banff, Canada: Kluwer Academic Publishers.
[93] D. Honicke, Microchemical reactors for heterogeneously catalyzed reactions, in
Reaction Kinetics and the Development of Catalytic Processes. 1999. p. 47-62.
[94] M.T. Janicke, et al., "The controlled oxidation of hydrogen from an explosive
mixture of gases using a microstructured reactor/heat exchanger and Pt/Al2O3
catalyst," Journal of Catalysis, vol. 191, no. (2), pp. 282-293, 2000.
[95] T. Laurell, et al., "Enhanced enzyme activity in silicon integrated enzyme reactors
utilizing porous silicon as the coupling matrix," Sensors and Actuators B-
Chemical, vol. 31, no. (3), pp. 161-166, 1996.
[96] H. Wang, et al., "Photolithographic Patterning of Porous Silicon Using Silicon-
Nitride and Silicon-Carbide Masks," Materials Letters, vol. 23, no. (4-6), pp. 209-
214, 1995.
[97] T. Lohner, et al., "Ellipsometric characterization of oxidized porous silicon layer
structures," Materials Science and Engineering B-Solid State Materials For
Advanced Technology, vol. 69, no. , pp. 182-187, 2000.

248
[98] J.J. Yon, et al., "The Kinetics and Mechanism of Oxide Layer Formation From
Porous Silicon Formed On P-Si Substrates," Journal of Applied Physics, vol. 62,
no. (3), pp. 1042-1048, 1987.
[99] T.M.H. Lee, et al., "Detailed characterization of anodic bonding process between
glass and thin-film coated silicon substrates," Sensors and Actuators a-Physical,
vol. 86, no. (1-2), pp. 103-107, 2000.
[100] D.A. Doshi, et al., "Optically Defined Multifunctional Patterning of Photosensitive
Thin-Film Silica Mesophases," Science, vol. 290, no. (6), pp. 107-111, 2000.
[101] I. Schechter, M. Ben-Chorin, and A. Kux, "Gas Sensing Properties of Porous
Silicon," Analytical Chemistry, vol. 67, no. , pp. 3727-3732, 1995.
[102] S.E. Letant, et al., "Integration of porous silicon chips in an electronic artificial
nose," Sensors and Actuators B, vol. 69, no. , pp. 183-198, 2000.
[103] L. Canham, ed. Properties of Porous Silicon. EMIS Datareviews. Vol. 18. 1997,
Inspec: London.
[104] J. Drott, et al., "Porous silicon as the carrier matrix in microstructured enzyme
reactors yielding high enzyme activities," Journal of Micromechanics and
Microengineering, vol. 7, no. (1), pp. 14-23, 1997.
[105] J. Drott, et al., "Pore morphology influence on catalytic turn-over for enzyme
activated porous silicon matrices," Thin Solid Films, vol. 330, no. (2), pp. 161-
166, 1998.
[106] J. Drott, et al., "Porous silicon carrier matrices in micro enzyme reactors- influence
of matrix depth," Mikrochimica Acta, vol. 131, no. (1-2), pp. 115-120, 1999.

249
[107] B. Lendl, et al., "Fourier transform infrared detection in miniaturized total analysis
systems for sucrose analysis," Analytical Chemistry, vol. 69, no. (15), pp. 2877-
2881, 1997.
[108] V. Polishchuk, et al., "A study of hydrogen detection with palladium modified
porous silicon," Analytica Chimica Acta, vol. 375, no. , pp. 205-210, 1998.
[109] R.L. Smith, "Porous silicon formation mechanisms," Journal of Applied Physics,
vol. 71, no. (8), pp. R1-R22, 1992.
[110] P.C. Searson, J.M. Macaulay, and S.M. Prokes, "The formation, morphology, and
optical properties of porous silicon structures.," Journal of the Electrochemical
Society, vol. 139, no. (11), pp. 3373-3377, 1992.
[111] V. Lehmann. Porous Silicon - A New Material for MEMS. in Micro Electro
Mechanical Systems, 1996, MEMS '96. 1996: IEEE.
[112] D. van Noort, et al., "Monitoring specific interaction of low molecular weight
biomolecules on oxidized porous silicon using ellipsometry," Biosensors and
Bioelectronics, vol. 13, no. (3-4), pp. 439-449, 1998.
[113] R.C. Anderson, R.S. Muller, and C.W. Tobias, "Chemical Surface Modification of
Porous Silicon," Journal of the Electrochemical Society, vol. 140, no. (5), pp.
1393-1396, 1993.
[114] A. Bsiesy, et al., "Anodic Oxidation of Porous Silicon Layers Formed on Lightly
p-Doped Substrates," Journal of the Electrochemical Society, vol. 138, no. (11),
pp. 3449-3456, 1991.
[115] C.N. Satterfield, Heterogeneous Catalysis in Industrial Practice. 1996, Malabar,
Fl: Krieger Publishing.

250
[116] S.D. Jackson, et al., "Supported Metal Catalysts: Preparation, Characterization,
and Function," Journal of Catalysis, vol. 139, no. , pp. 191-206, 1993.
[117] J.R. Anderson and K.C. Pratt, Introduction to Characterization and Testing of
Catalysts. 1985, Orlando: Academic Press Inc.
[118] C.S. Brooks and V.J. Kehrer, "Chemisorption of Carbon Monoxide on Metal
Surfaces by Pulse Chromatography," Analytical Chemistry, vol. 41, no. (1), pp.
103-106, 1969.
[119] G. Berger and P. Gallezot, Particle Size and Dispersion Measurements, in
Handbook of Heterogeneous Catalsysis Volume 2, G. Ertl, H. Knozinger, and J.
Weitkamp, Editors. 1997, Wiley-VCH: Weinheim. p. 444.
[120] F. Delannay, ed. Characterization of Heterogeneous Catalysts. . 1984, Marcel
Dekker, Inc.: New York.
[121] J.L. Xu, P. Cheng, and T.S. Zhao, "Gas-liquid two-phase flow regimes in
rectangular channels with mini/micro gaps," International Journal of Multiphase
Flow, vol. 25, no. (3), pp. 411-432, 1999.
[122] M. Suo and P. Griffith, "Two-Phase Flow in Capillary Tubes," Transactions of the
ASME: Journal of Basic Engineering, vol. September, no. , pp. 576-581, 1964.
[123] Q.C. Bi, "Taylor Bubbles in miniaturized circular and noncircular channels,"
Internation Journal of Mulitphase Flow, vol. 27, no. , pp. 561-570, 2001.
[124] P. Tortopidis and V. Bontozoglou, "Mass Transfer in Gas-Liquid Flow in Small
Diameter Tubes," Chemical Engineering Science, vol. 52, no. (14), pp. 2231-
2237, 1997.

251
[125] G.I. Taylor, "Deposition of a viscous fluid on the wall of a tube," Journal of Fluid
Mechanics, vol. 10, no. (1), pp. 161-165, 1961.
[126] T. Kawakatsu, et al., "The effect of the hydrophobicity of microchannels and
components in water and oil phases on droplet formation in microchannel water-
in-oil emulsification," Colloids and Surfaces A, vol. 179, no. , pp. 29-37, 2001.
[127] Y. Matsumoto, T. Shimada, and M. Ishida, "Novel prevention method of stiction
using silicon anodization for SOI structure," Sensors and Actuators A, vol. A72,
no. , pp. 153-159, 1999.
[128] K.A. Triplett, et al., "Gas-liquid two-phase flow in microchannels Part I: two-
phase flow patterns," International Journal of Multiphase Flow, vol. 25, no. (3),
pp. 377-394, 1999.
[129] J.C. Middleton, Gas-Liquid Dispersion and Mixing, in Mixing in the Process
Industries, N. Harnby, M.F. Edwards, and A.W. Nienow, Editors. 1992,
Butterworth-Heinemann: Oxfford.
[130] Y.T. Shah, Gas-Liquid-Solid Reactor Design. 1979, Pittsburgh: McGraw-Hill.