november 11, 2008 -...
TRANSCRIPT

Welcome to Investor DayNovember 11, 2008
Copyright 2008, SPSS Inc.Copyright 2008, SPSS Inc. 2
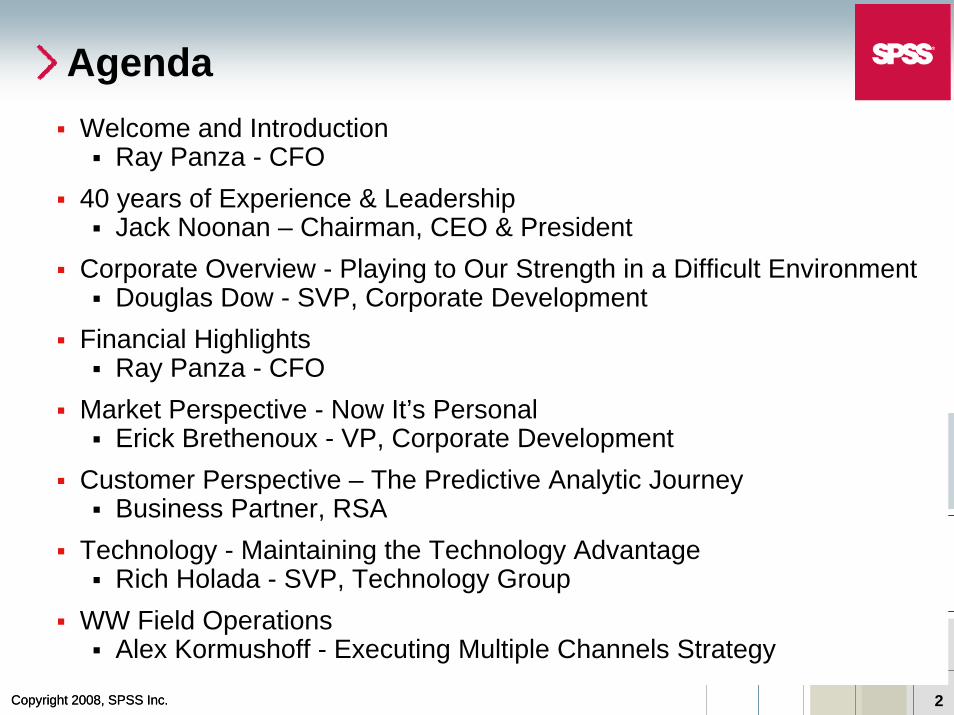
Welcome and IntroductionRay Panza - CFO
40 years of Experience & LeadershipJack Noonan – Chairman, CEO & President
Corporate Overview - Playing to Our Strength in a Difficult EnvironmentDouglas Dow - SVP, Corporate Development
Financial HighlightsRay Panza - CFO
Market Perspective - Now It’s PersonalErick Brethenoux - VP, Corporate Development
Customer Perspective – The Predictive Analytic JourneyBusiness Partner, RSA
Technology - Maintaining the Technology AdvantageRich Holada - SVP, Technology Group
WW Field OperationsAlex Kormushoff - Executing Multiple Channels Strategy
Agenda
Copyright 2008, SPSS Inc.Copyright 2008, SPSS Inc. 3
Investment Proposition
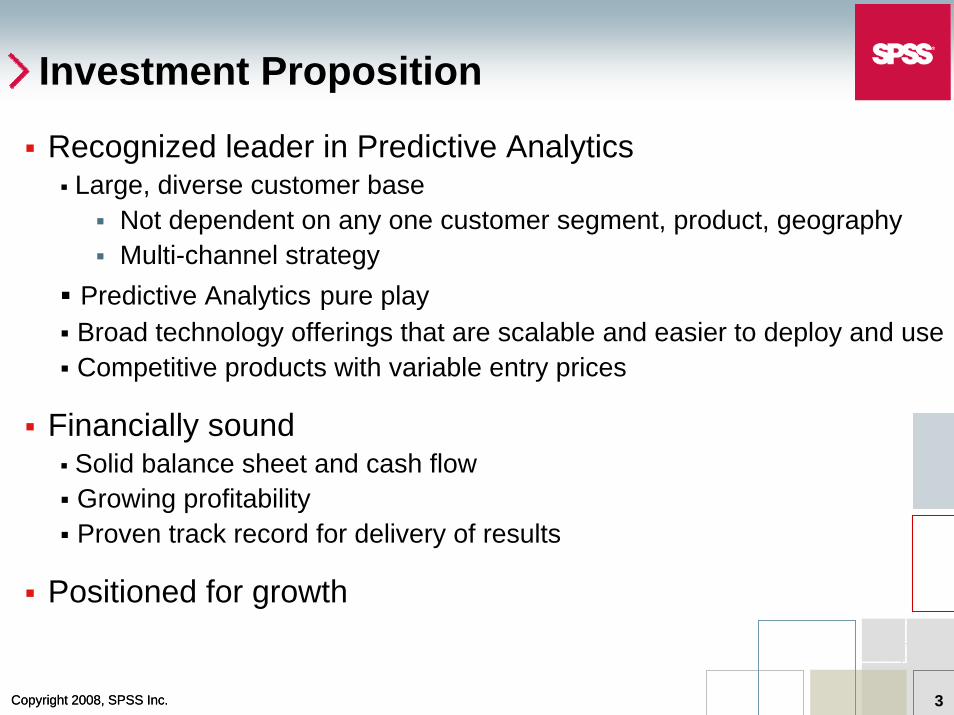
Recognized leader in Predictive AnalyticsLarge, diverse customer base
Not dependent on any one customer segment, product, geographyMulti-channel strategy
Predictive Analytics pure play Broad technology offerings that are scalable and easier to deploy and useCompetitive products with variable entry prices
Financially soundSolid balance sheet and cash flowGrowing profitabilityProven track record for delivery of results
Positioned for growth

40-Years of Experience
Jack Noonan, Chairman, CEO & President

Copyright 2008, SPSS Inc.Copyright 2008, SPSS Inc. 5
SPSS is a Technology Company(Technology is specialized expertise)
SPSS has deep expertise applying Predictive Analytics Specialized expertise in data about people
SPSS has manifested this expertise in software products
SPSS is finding the paths to market for its technology From statistics and data miningTo data collection and deploymentMajority of our technology hasn’t crossed the chasm

Copyright 2008, SPSS Inc.Copyright 2008, SPSS Inc. 6
Evolution of SPSS
1968 1984
Stats for You & Me
1997
Desktop Stats Enterprise Strategy
2003
Process Improvement
Constants: Expertise in the Practice of Quantitative Analysis; “Follow the User”
Drivers
Survey AnalysisThe rise of the PC
Stats NOT on every desktopEnterprise Computing – IT the enabler for business
(Bigger problems / More people / Larger business impact)
Enablers
Platform agnosticism
Technology is the scaling enablerStretch & grow – acquisitions
Expertise in data about people & deployment
Customer Intimacy
Product LeadershipOperational Excellence
Customer retention process
Product placement processFraud detection processPredictive Platform
Copyright 2008, SPSS Inc.Copyright 2008, SPSS Inc. 7
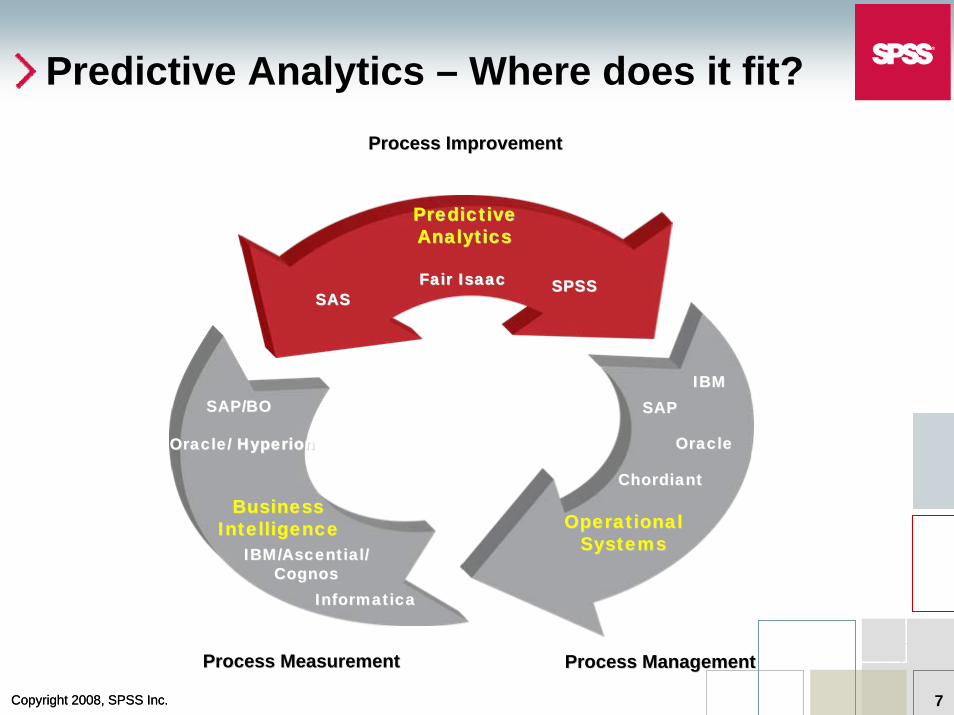
Predictive Analytics – Where does it fit?Process ImprovementProcess Improvement
Process ManagementProcess ManagementProcess MeasurementProcess Measurement
PredictivePredictiveAnalyticsAnalytics
SPSSSPSSSASSAS
Fair IsaacFair Isaac
OperationalOperationalSystemsSystems
IBMIBM
OracleOracle
ChordiantChordiant
SAPSAP
BusinessBusinessIntelligenceIntelligence
Oracle/ Oracle/ HyperionHyperion
SAP/BOSAP/BO
InformaticaInformatica
IBM/Ascential/IBM/Ascential/CognosCognos
Copyright 2008, SPSS Inc.Copyright 2008, SPSS Inc. 8
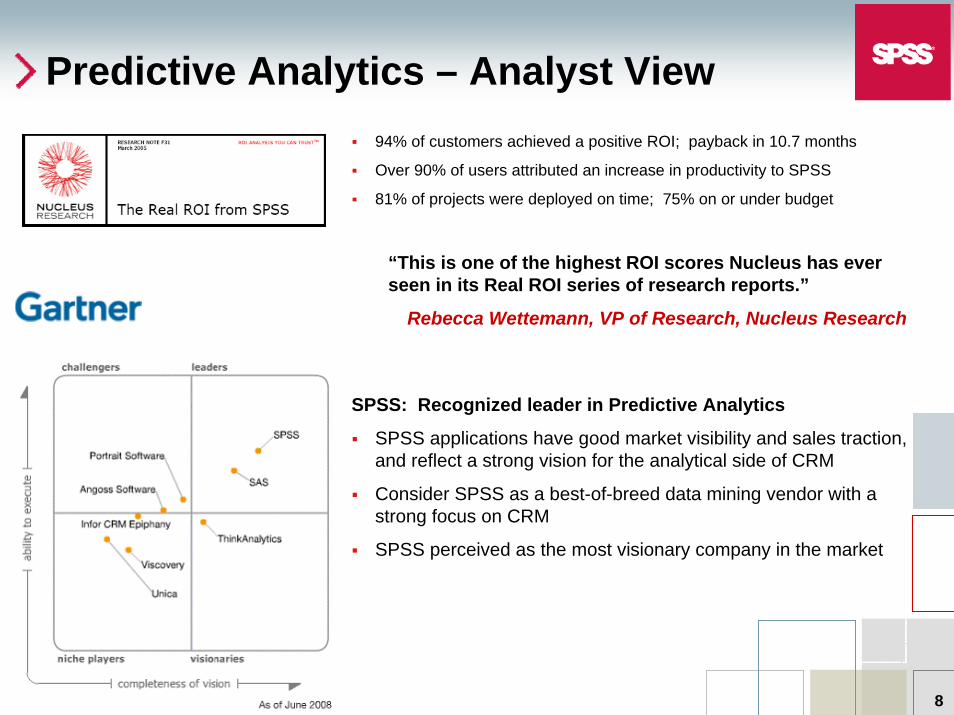
Predictive Analytics – Analyst View94% of customers achieved a positive ROI; payback in 10.7 months
Over 90% of users attributed an increase in productivity to SPSS
81% of projects were deployed on time; 75% on or under budget
“This is one of the highest ROI scores Nucleus has ever seen in its Real ROI series of research reports.”
Rebecca Wettemann, VP of Research, Nucleus Research
SPSS: Recognized leader in Predictive Analytics
SPSS applications have good market visibility and sales traction, and reflect a strong vision for the analytical side of CRM
Consider SPSS as a best-of-breed data mining vendor with a strong focus on CRM
SPSS perceived as the most visionary company in the market
Copyright 2008, SPSS Inc.Copyright 2008, SPSS Inc. 9
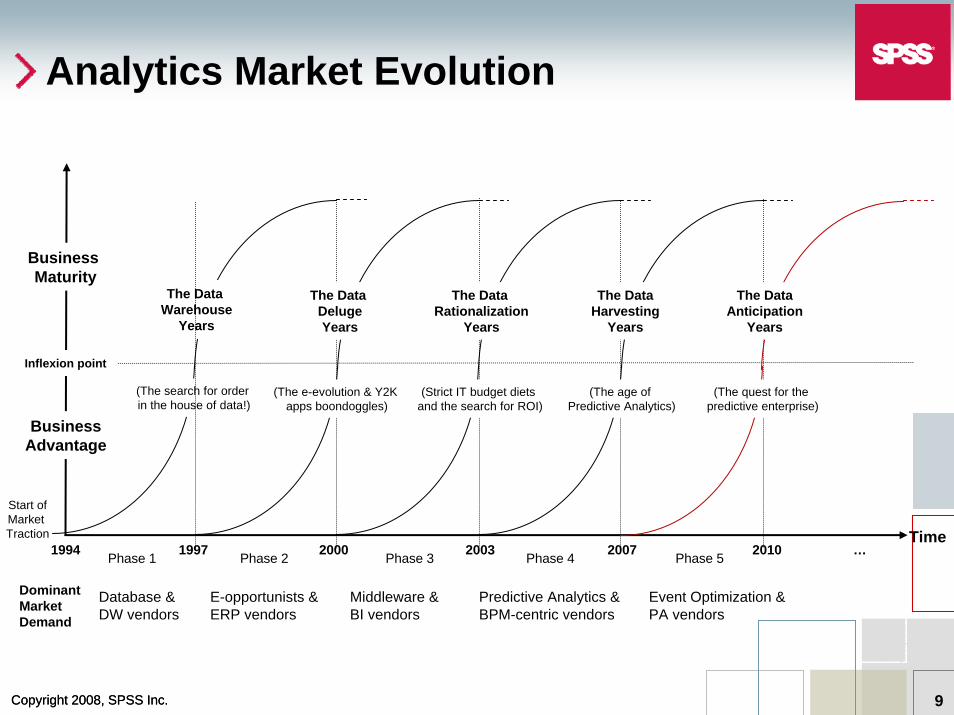
Analytics Market Evolution
BusinessAdvantage
Business Maturity
Inflexion point
Time1994
DominantMarketDemand
2000Phase 2
The Data DelugeYears
(The e-evolution & Y2K apps boondoggles)
E-opportunists &ERP vendors
2003Phase 3
The Data Rationalization
Years
(Strict IT budget diets and the search for ROI)
Middleware &BI vendors
2007Phase 4
The Data Harvesting
Years
(The age of Predictive Analytics)
Predictive Analytics & BPM-centric vendors
2010Phase 5
The Data Anticipation
Years
(The quest for the predictive enterprise)
Event Optimization &PA vendors
…1997Phase 1
Database & DW vendors
The Data Warehouse
Years
(The search for order in the house of data!)
Start ofMarket Traction
Playing to Our Strengths in a Difficult Environment
Douglas Dow, SVP Corporate Development
Copyright 2008, SPSS Inc.Copyright 2008, SPSS Inc. 11
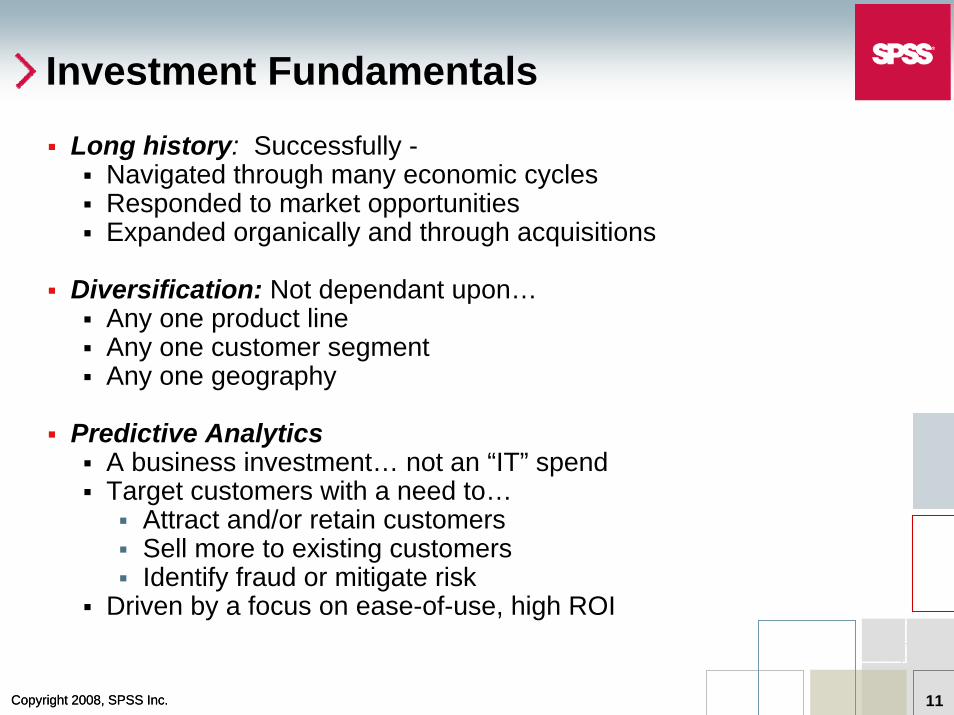
Investment Fundamentals
Long history: Successfully -Navigated through many economic cyclesResponded to market opportunitiesExpanded organically and through acquisitions
Diversification: Not dependant upon…Any one product line Any one customer segment Any one geography
Predictive Analytics A business investment… not an “IT” spend Target customers with a need to…
Attract and/or retain customersSell more to existing customers Identify fraud or mitigate risk
Driven by a focus on ease-of-use, high ROI

Copyright 2008, SPSS Inc.Copyright 2008, SPSS Inc. 12
Who is SPSS?
Producer of Predictive Analytic software Tools for analystsSolutions for businesses
Expertise in data about people ActionsAttributesAttitudes
40 years of experience in delivering value
Broad customer base
1,310 F/T employees (9/30/08) ~ 223 quota sales reps
Experienced inside and field sales teams
Copyright 2008, SPSS Inc.Copyright 2008, SPSS Inc. 13
Diverse Customer Base
Academic21%
Government &Non-Profit
15%
Commercial64%
Commercial enterprisesCommercial enterprises95% of the FORTUNE 1000 companies
80% of the top global banks
80% of the top global life insurance companies
All of the market research firms on the Honomichl Global 25
Government & nonGovernment & non--profit profit organizationsorganizationsU.S. and all major foreign governments
Law enforcement authorities around the world
Every branch of the U.S. Military
All 50 U.S. State governments
AcademicAcademic#1 statistical software in U.S. campuses
All of the top U.S. colleges and universities
75% of the top universities in Europe
More than 100 text books
SPSS analytical tools - standard at U.K. universities
2008 YTD

Copyright 2008, SPSS Inc.Copyright 2008, SPSS Inc. 14
The Predictive Analytics Market
Predictive Analytics technology improves business processes:Provides visibility for key decision makersAutomates decisions to meet business goalsAchieves a measurable competitive advantage
Predictive Analytics is fundamentally different than Business Intelligence:PA is data/text mining + statistic + survey + deployment technologiesSPSS PA has people-data orientationPA creates new value-added data-scoresGo-to-market methods are different

Copyright 2008, SPSS Inc.Copyright 2008, SPSS Inc. 15
Growing Market Opportunity
SPSS Products:Predictive ToolsPredictive Solutions
Advanced analytics growing at 10% (1)
CRM analytic applications growing at 13% (1)
SPSS Market Opportunity:
(1) Compound Annual Growth Rate for 2007-2011; source 2007 IDC reports
(2) 2007 full year revenue $291M less $29M of Services revenue
SPSS Predictive Analytics$262M (2)
Advanced Analytics
$1.3B
CRM Analytic Applications
$1.3B

Copyright 2008, SPSS Inc.Copyright 2008, SPSS Inc. 16
Competitive Advantages
Data about PeopleDeep domain expertise grounded in 40 years analyzing data about peopleAbility to dynamically capture attitudes, attributes and behaviorsAbility to dynamically improve people interactions
Right action for the right person at the right timeContinuously enriched knowledge about people
A “first-to-market” deployment methodologyA methodology for deploying Predictive Analytics across the enterpriseProvides an incremental, phased approach to the enterprise solutionBased on the convergence of analytics, architecture and business processes
“Play well with others”Non-intrusive integration (Service Oriented Architecture (SOA))Database-agnostic Leverages existing operational software & IT investments
Copyright 2008, SPSS Inc.Copyright 2008, SPSS Inc. 17
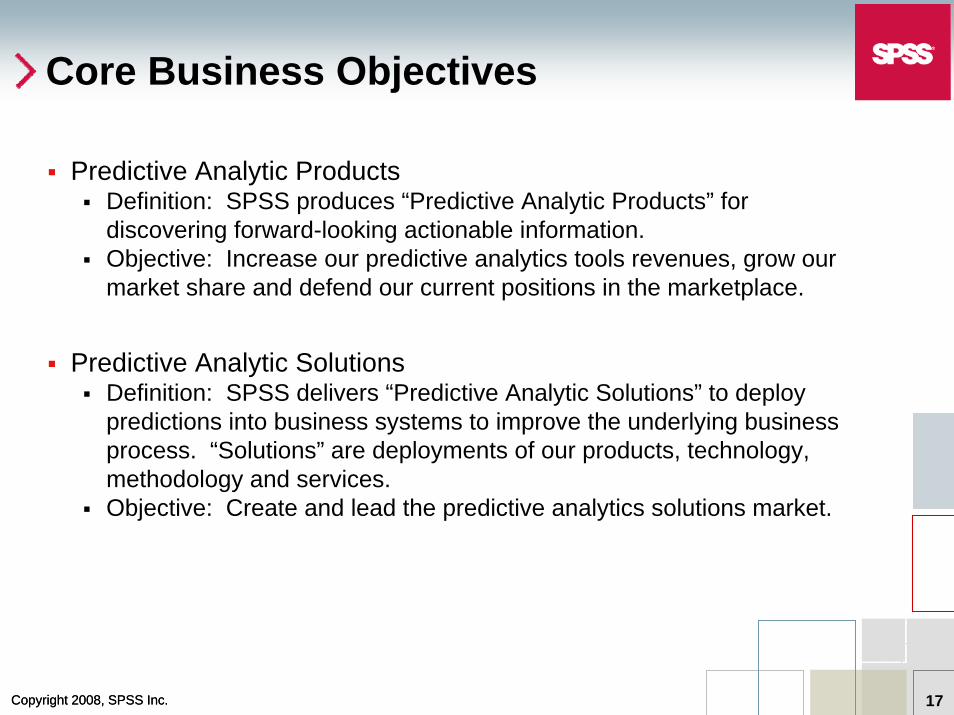
Core Business Objectives
Predictive Analytic Products Definition: SPSS produces “Predictive Analytic Products” for discovering forward-looking actionable information.Objective: Increase our predictive analytics tools revenues, grow our market share and defend our current positions in the marketplace.
Predictive Analytic SolutionsDefinition: SPSS delivers “Predictive Analytic Solutions” to deploy predictions into business systems to improve the underlying business process. “Solutions” are deployments of our products, technology, methodology and services.Objective: Create and lead the predictive analytics solutions market.
Copyright 2008, SPSS Inc.Copyright 2008, SPSS Inc. 18
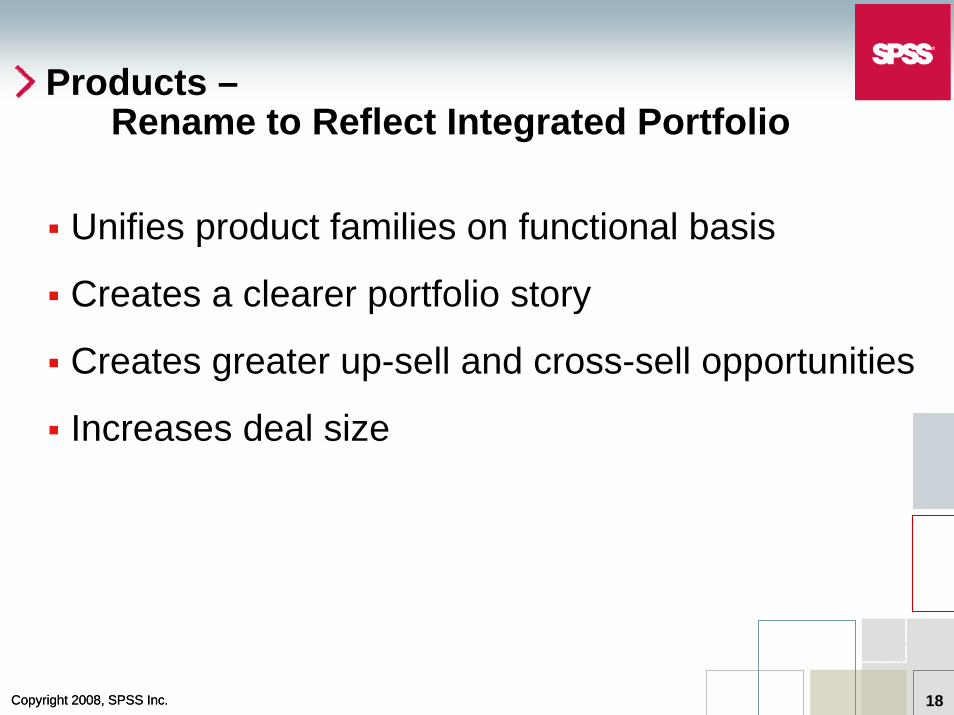
Products –Rename to Reflect Integrated Portfolio
Unifies product families on functional basis
Creates a clearer portfolio story
Creates greater up-sell and cross-sell opportunities
Increases deal size

Copyright 2008, SPSS Inc.Copyright 2008, SPSS Inc. 19
We accomplish this by:
Creating a unifying portfolio naming standard around Predictive Analytics Software (PASW)
Creating consistent naming rules for all productsOrganizing product families around Capture, Predict and Act
Naming products with meaningful terms describing what the products do
Integrating key “bundles” (core product + modules / options) into new premium offering
Rolling out over Q1 and Q2 2009

Copyright 2008, SPSS Inc.Copyright 2008, SPSS Inc. 20
Solutions – Seeking Sustainable Innovation

Copyright 2008, SPSS Inc.Copyright 2008, SPSS Inc. 21
Predictive Analytic Solutions: Moving Forward
Predictive Analytics connect data to effect action by drawing reliable conclusions about current conditions and future events.
SPSS has been doing this for 40 years.
Traditional Systems
Ensure that customer interactions happen, and are consistent, efficient and recorded.
Provide historical view
Manually Measure Report Study
Largely manual or drive static rules
Predictive Analytic Solutions
Ensure that the interactions are the right ones at the right times for the right customers.
Predict future outcomes
Algorithms that automatically “learn”significant patterns
Deployed into business process for dynamic decision making
Copyright 2008, SPSS Inc.Copyright 2008, SPSS Inc. 22
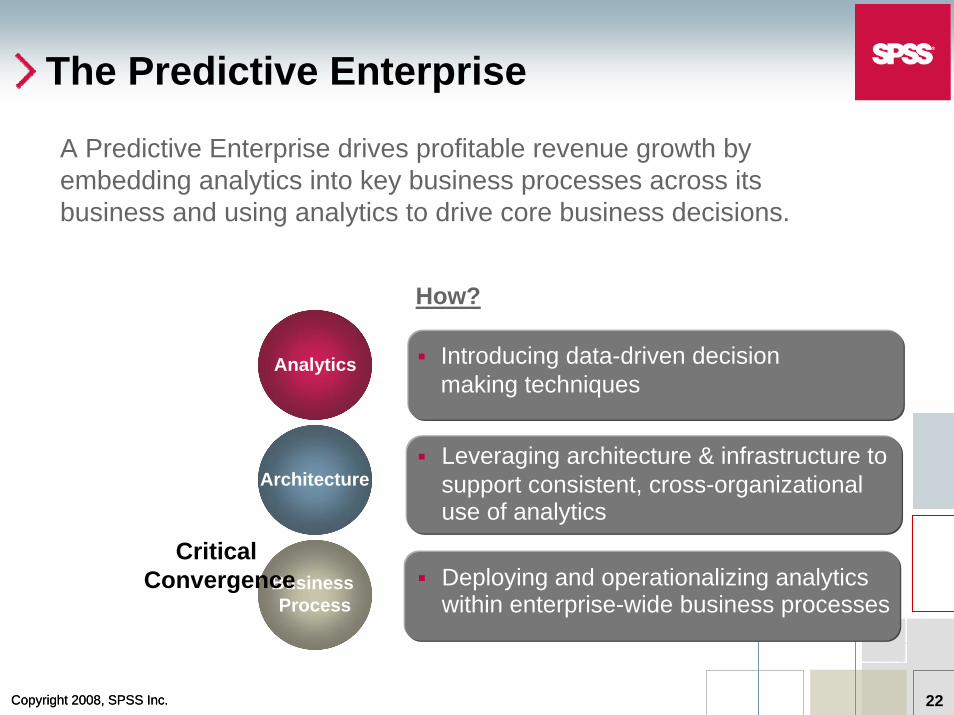
Leveraging architecture & infrastructure to support consistent, cross-organizational use of analytics
The Predictive Enterprise
A Predictive Enterprise drives profitable revenue growth by embedding analytics into key business processes across its business and using analytics to drive core business decisions.
How?
Business Process
Architecture
Analytics
Deploying and operationalizing analytics within enterprise-wide business processes
Critical Convergence
Introducing data-driven decision making techniques
Copyright 2008, SPSS Inc.Copyright 2008, SPSS Inc. 23
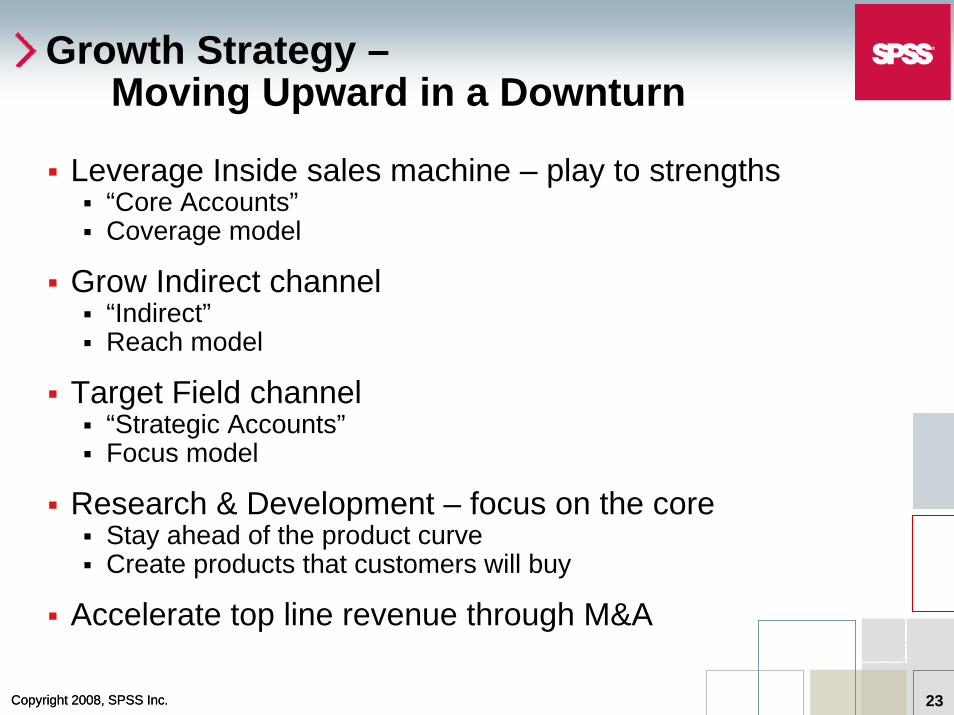
Growth Strategy –Moving Upward in a Downturn
Leverage Inside sales machine – play to strengths“Core Accounts”Coverage model
Grow Indirect channel“Indirect”Reach model
Target Field channel“Strategic Accounts”Focus model
Research & Development – focus on the coreStay ahead of the product curveCreate products that customers will buy
Accelerate top line revenue through M&A
Playing to Our Strengths in a Difficult Environment
Financial Performance
Ray Panza, EVP & CFO
Copyright 2008, SPSS Inc.Copyright 2008, SPSS Inc. 25
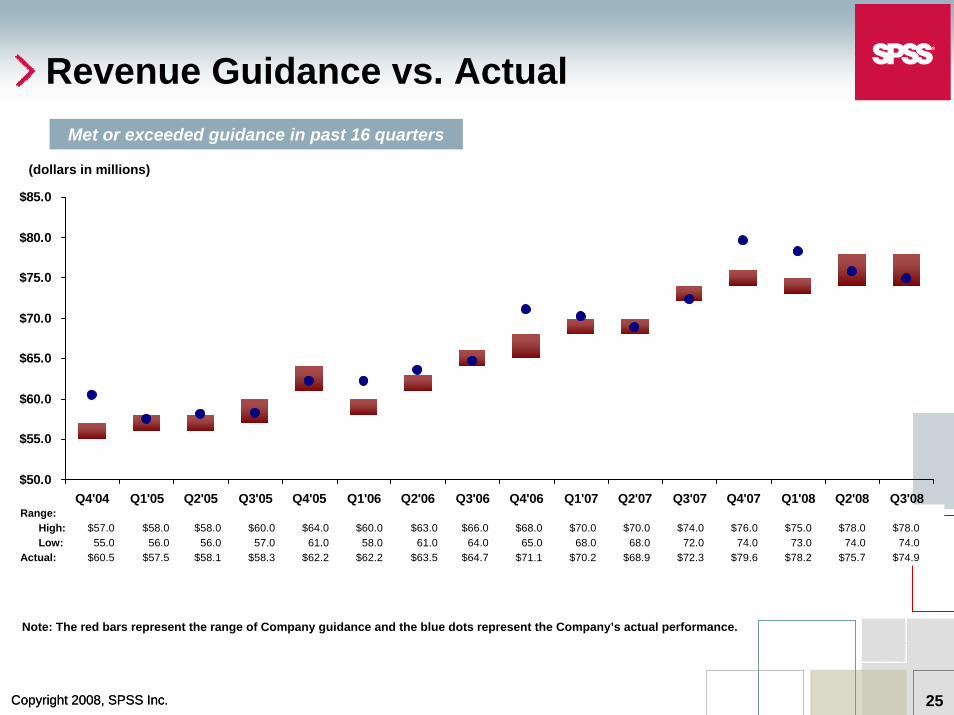
Revenue Guidance vs. Actual
Note: The red bars represent the range of Company guidance and the blue dots represent the Company’s actual performance.
Range:High: $57.0 $58.0 $58.0 $60.0 $64.0 $60.0 $63.0 $66.0 $68.0 $70.0 $70.0 $74.0 $76.0 $75.0 $78.0 $78.0Low: $55.0 $56.0 $56.0 $57.0 $61.0 $58.0 $61.0 $64.0 $65.0 $68.0 $68.0 $72.0 $74.0 $73.0 $74.0 74.0
Actual: $60.5 $57.5 $58.1 $58.3 $62.2 $62.2 $63.5 $64.7 $71.1 $70.2 $68.9 $72.3 $79.6 $78.2 $75.7 $74.9
$50.0
$55.0
$60.0
$65.0
$70.0
$75.0
$80.0
$85.0
Q4'04 Q1'05 Q2'05 Q3'05 Q4'05 Q1'06 Q2'06 Q3'06 Q4'06 Q1'07 Q2'07 Q3'07 Q4'07 Q1'08 Q2'08 Q3'08
Met or exceeded guidance in past 16 quarters
(dollars in millions)

Copyright 2008, SPSS Inc.Copyright 2008, SPSS Inc. 26
$0.00
$0.10
$0.20
$0.30
$0.40
$0.50
$0.60
Q4'04 Q1'05 Q2'05 Q3'05 Q4'05 Q1'06 Q2'06 Q3'06 Q4'06 Q1'07 Q2'07 Q3'07 Q4'07 Q1'08 Q2'08 Q3'08
GAAP EPS Guidance vs. Actual
Note: The red bars represent the range of Company guidance and the blue dots represent the Company’s actual performance.
(1) Q2’06 EPS includes non-recurring incremental R&D and marketing expenses and $0.8mm in non-operating non-cash currency exchange translation charges.
(2) Q4’06 EPS adjusted for a non-cash income tax expense charge of $6.9mm. The effect of this charge on EPS was $0.33.
(dollars per share)
Range:High: $0.20 $0.10 $0.14 $0.22 $0.28 $0.20 $0.26 $0.30 $0.38 $0.27 $0.35 $0.42 $0.40 $0.45 $0.48 $0.48 Low: $0.14 $0.05 $0.08 $0.15 $0.22 $0.14 $0.20 (1) $0.24 $0.31 (2) $0.23 $0.30 $0.38 $0.34 $0.40 $0.40 $0.42
Actual: $0.20 $0.13 $0.21 $0.22 $0.30 $0.24 $0.12 $0.28 $0.43 $0.39 $0.36 $0.41 $0.50 $0.51 $0.41 $0.55
Met or exceeded guidance in past 15 of past 16 quarters
Copyright 2008, SPSS Inc.Copyright 2008, SPSS Inc. 27
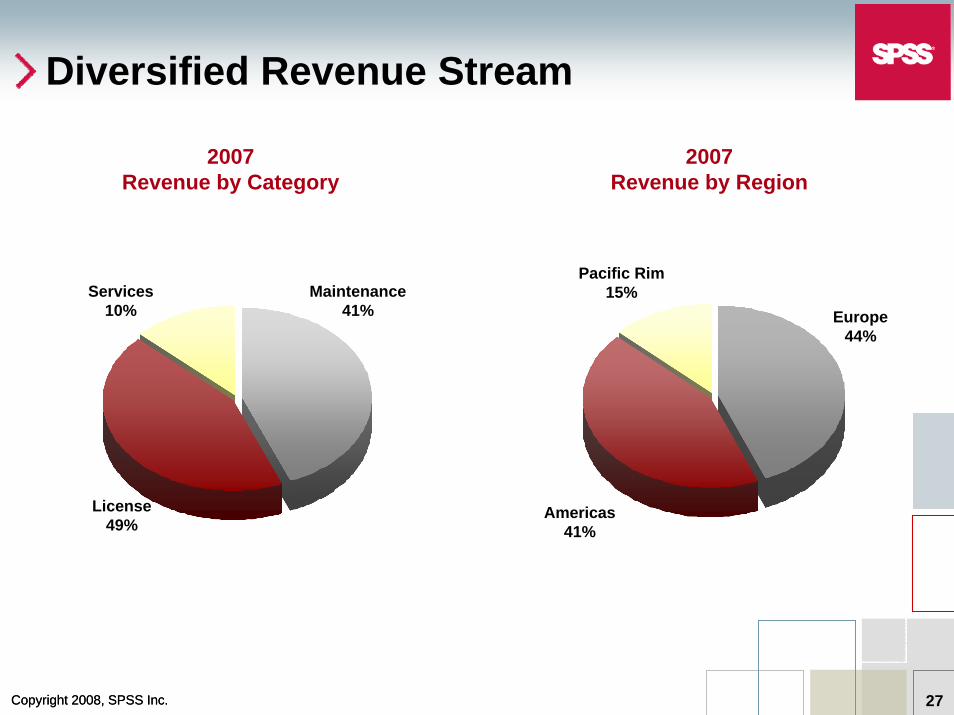
Diversified Revenue Stream
2007Revenue by Category
License49%
Maintenance41%
Services10%
2007Revenue by Region
Americas41%
Europe44%
Pacific Rim15%
Copyright 2008, SPSS Inc.Copyright 2008, SPSS Inc. 28
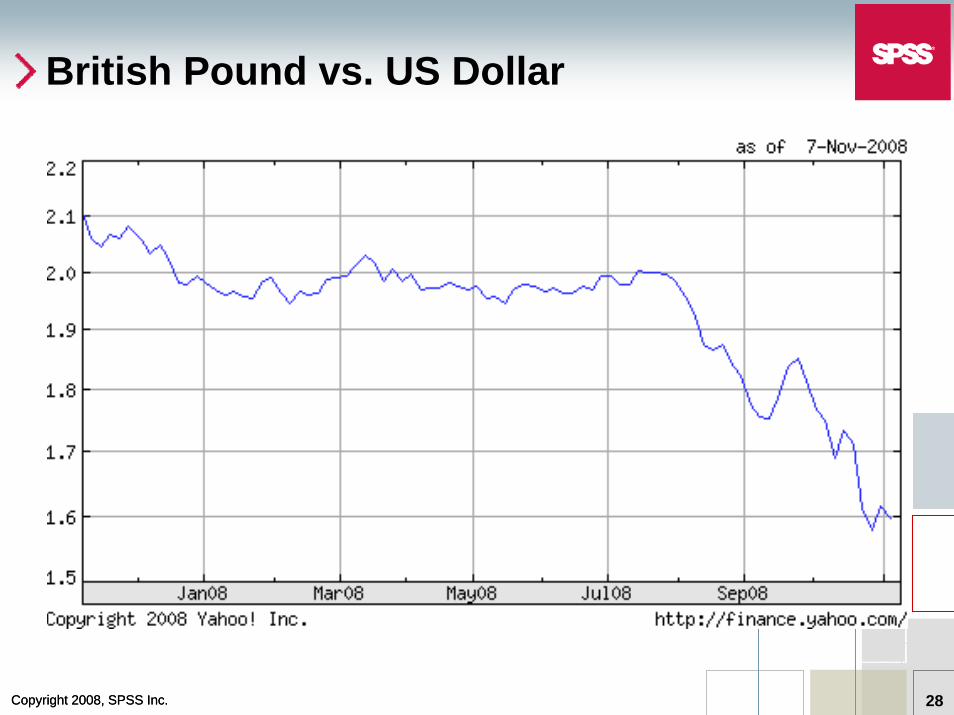
British Pound vs. US Dollar

Copyright 2008, SPSS Inc.Copyright 2008, SPSS Inc. 29
Euro vs. US Dollar

Copyright 2008, SPSS Inc.Copyright 2008, SPSS Inc. 30
Financial Summary
$Millions 2004 2005 2006 2007 TTM 3Q08
Revenue $224.1 $236.1 $261.5 $291.0 $308.5
License Revenue $95.8 $107.6 $125.0 $144.0 $149.1
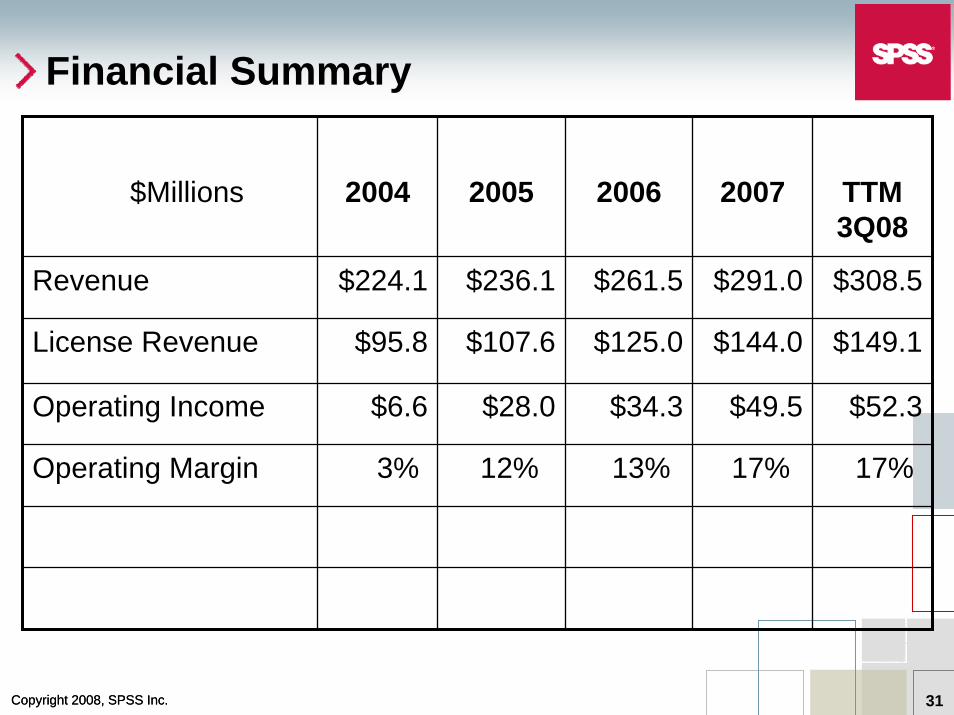
Copyright 2008, SPSS Inc.Copyright 2008, SPSS Inc. 31
Financial Summary
$Millions 2004 2005 2006 2007 TTM 3Q08
Operating Income $6.6 $28.0 $34.3 $49.5 $52.3
Revenue $224.1 $236.1 $261.5 $291.0 $308.5
License Revenue $95.8 $107.6 $125.0 $144.0 $149.1
Operating Margin 3% 12% 13% 17% 17%

Copyright 2008, SPSS Inc.Copyright 2008, SPSS Inc. 32
Financial Summary
$Millions 2004 2005 2006 2007 TTM 3Q08
Operating Income $6.6 $28.0 $34.3 $49.5 $52.3
Revenue $224.1 $236.1 $261.5 $291.0 $308.5
License Revenue $95.8 $107.6 $125.0 $144.0 $149.1
Operating Margin 3% 12% 13% 17% 17%
Operating Cash Flow $12.3 $51.5 $48.2 $84.9 $78.9*
Cash (end of period) $37.1 $84.4 $140.2 $306.9 $307.0
* Includes $7.4M cash outflow related to 4Q’07 stock repurchase – current payable accrued at year-end 2007 and paid in early January 2008

Copyright 2008, SPSS Inc.Copyright 2008, SPSS Inc. 33
Recent Financial Results
($millions - except EPS) Y-T-D Y-T-D %09/08 09/07 Change
License $107.0 $101.8 5%Maintenance 98.9 87.9 13%Service 22.9 21.7 6%Total Revenues 228.8 211.4 8%
Operating Expenses 191.2 176.6 8%
Operating Income $37.6 $34.8 8%
Operating Margins 16% 16%
Net Income $28.2 $23.7 19%Fully Diluted EPS $1.47 $1.16 27%

Copyright 2008, SPSS Inc.Copyright 2008, SPSS Inc. 34
Operating Expense Detail (w/wo Share-based Compensation)
Detail Expenses Including Share-Based Compensation(In thousands, except per share) Y-T-D Y-T-D % Change
09/08 09/07 '08 vs. '07Cost of Revenues $16,236 $13,070 24%Sales, Marketing, Services 115,036 101,839 13%Research & Development 33,550 36,444 (8%)General & Administrative 26,421 25,245 5% Total Operating Expenses $191,243 $176,598 8%
Detail Expenses Excluding Share-Based Compensation (In thousands, except per share) Y-T-D Y-T-D % Change
09/08 09/07 '08 vs. '07Cost of Revenues $16,236 $13,070 24%Sales, Marketing, Services 113,777 100,880 13%Research & Development 32,728 35,477 (8%)General & Administrative 22,163 21,628 2%Share-based Compensation 6,339 5,543 14% Total Operating Expenses $191,243 $176,598 8%
Copyright 2008, SPSS Inc.Copyright 2008, SPSS Inc. 35
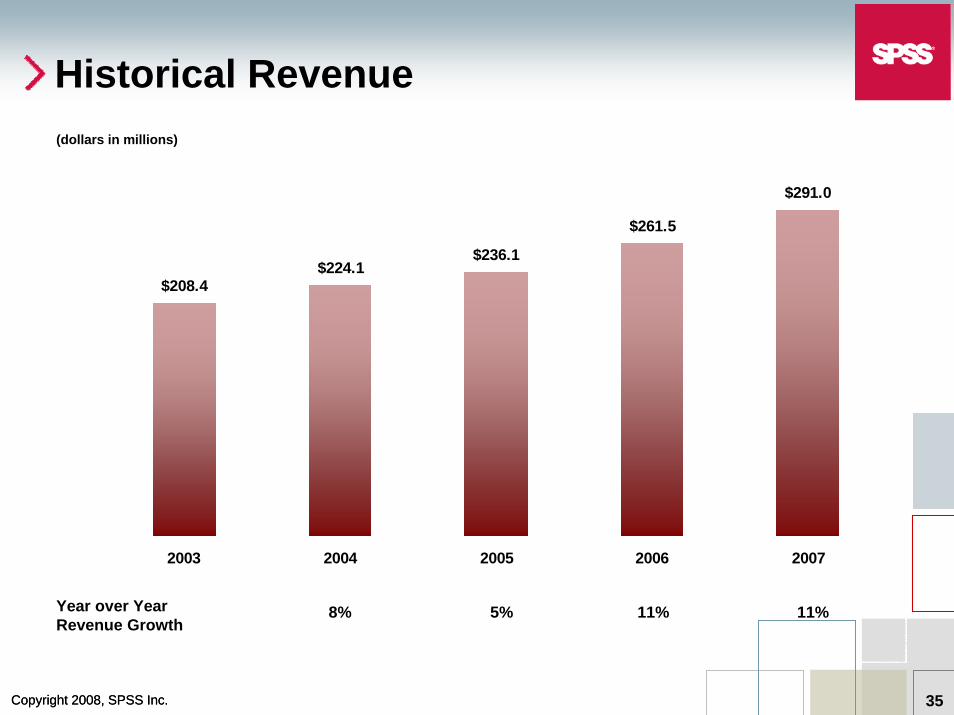
$208.4$224.1
$236.1
$261.5
$291.0
2003 2004 2005 2006 2007
Historical Revenue
Year over YearRevenue Growth
8% 5% 11%
(dollars in millions)
11%
Copyright 2008, SPSS Inc.Copyright 2008, SPSS Inc. 36
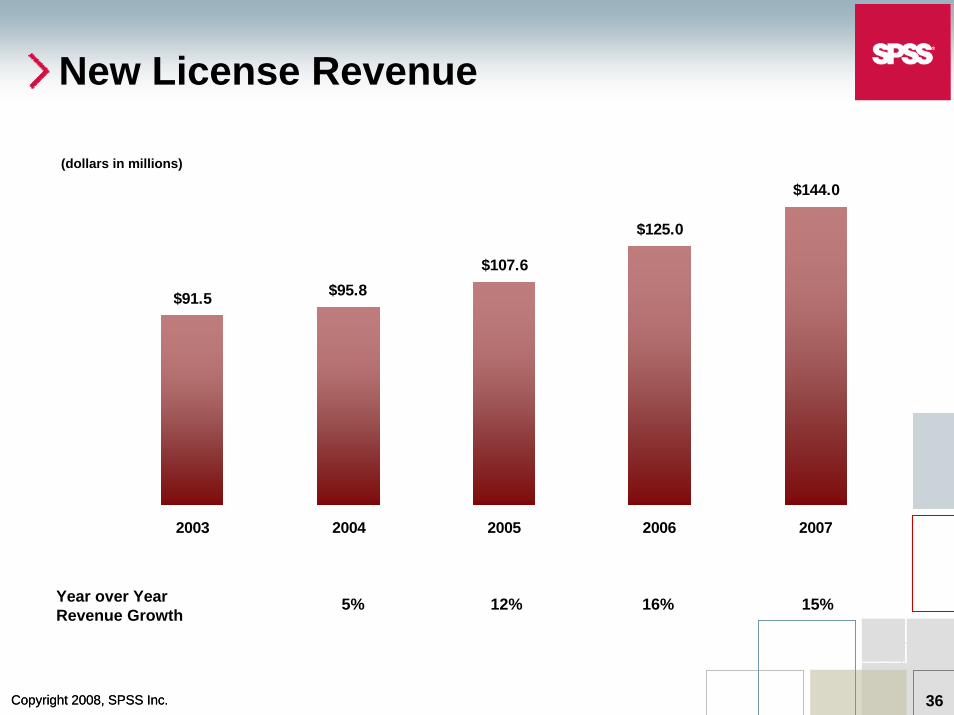
New License Revenue
(dollars in millions)
Year over YearRevenue Growth
5% 12% 16%
$91.5 $95.8$107.6
$144.0
$125.0
2003 2004 2005 2006 2007
15%
Copyright 2008, SPSS Inc.Copyright 2008, SPSS Inc. 37
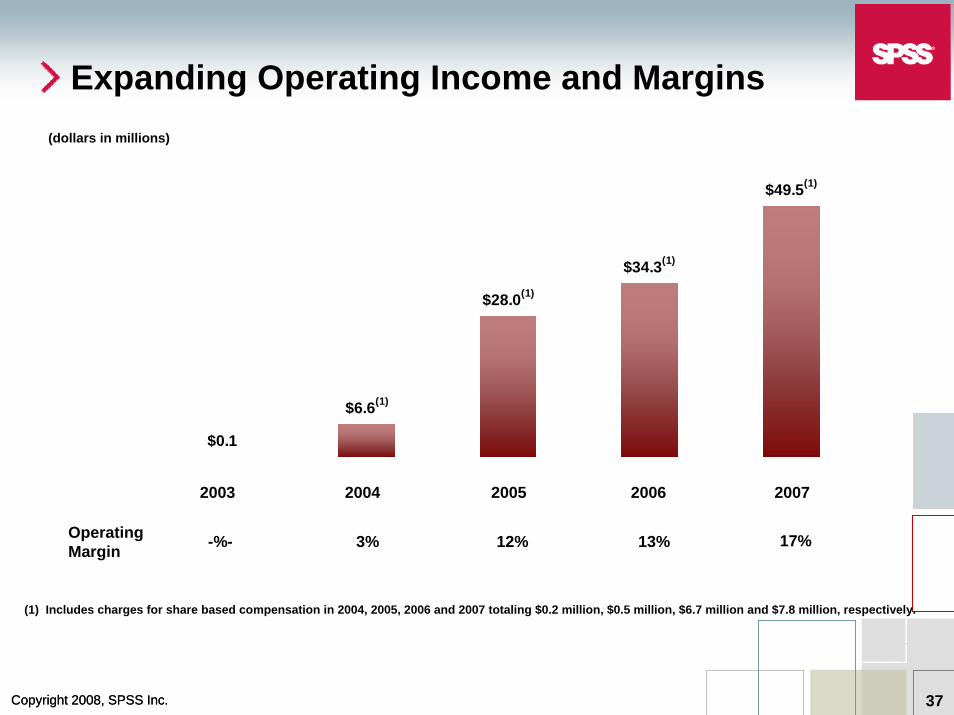
$0.1
$6.6(1)
$28.0(1)
$34.3(1)
$49.5(1)
2003 2004 2005 2006 2007
Expanding Operating Income and Margins
Operating Margin -%- 3% 12% 13%
(1) Includes charges for share based compensation in 2004, 2005, 2006 and 2007 totaling $0.2 million, $0.5 million, $6.7 million and $7.8 million, respectively.
(dollars in millions)
2004 2005 2006 20072003
17%
Copyright 2008, SPSS Inc.Copyright 2008, SPSS Inc. 38
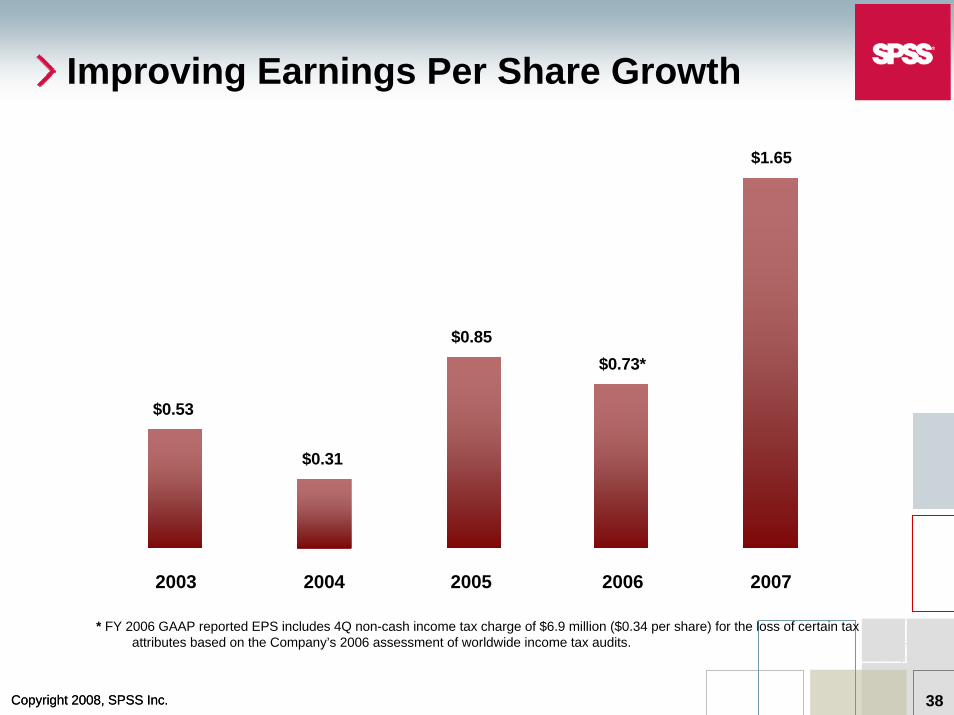
$0.53
$0.31
$0.85$0.73*
$1.65
2003 2004 2005 2006 2007
Improving Earnings Per Share Growth
* FY 2006 GAAP reported EPS includes 4Q non-cash income tax charge of $6.9 million ($0.34 per share) for the loss of certain tax attributes based on the Company’s 2006 assessment of worldwide income tax audits.
2004 2005 2006 20072003
Copyright 2008, SPSS Inc.Copyright 2008, SPSS Inc. 39
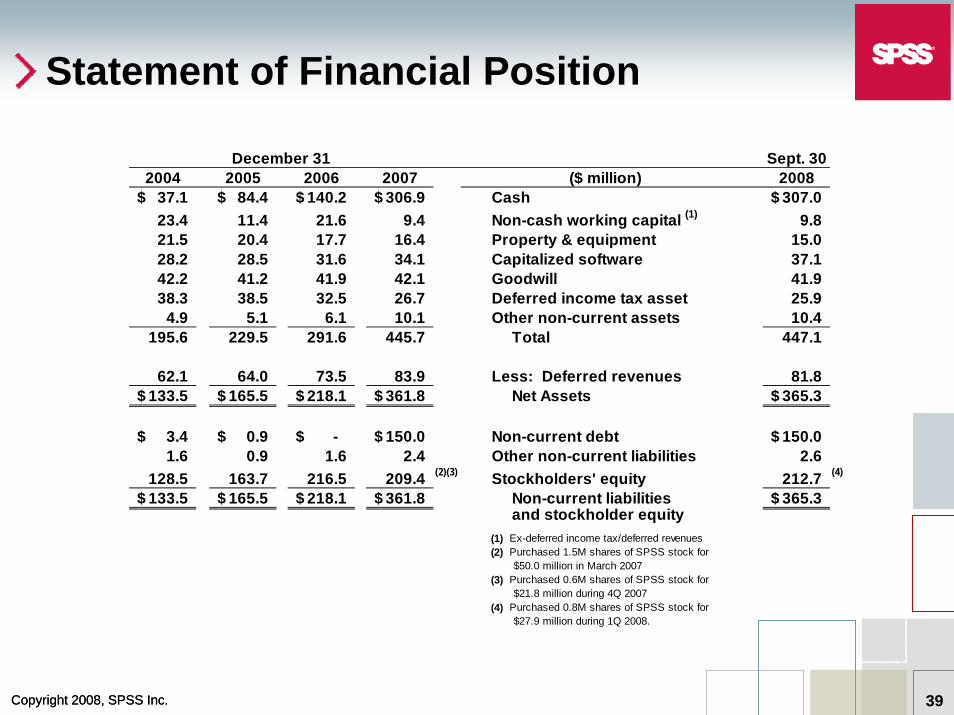
Statement of Financial Position
Sept. 302004 2005 2006 2007 ($ million) 2008
37.1$ 84.4$ 140.2$ 306.9$ Cash 307.0$ 23.4 11.4 21.6 9.4 Non-cash working capital (1) 9.8 21.5 20.4 17.7 16.4 Property & equipment 15.0 28.2 28.5 31.6 34.1 Capitalized software 37.1 42.2 41.2 41.9 42.1 Goodwill 41.9 38.3 38.5 32.5 26.7 Deferred income tax asset 25.9
4.9 5.1 6.1 10.1 Other non-current assets 10.4 195.6 229.5 291.6 445.7 Total 447.1
62.1 64.0 73.5 83.9 Less: Deferred revenues 81.8 133.5$ 165.5$ 218.1$ 361.8$ Net Assets 365.3$
3.4$ 0.9$ -$ 150.0$ Non-current debt 150.0$ 1.6 0.9 1.6 2.4 Other non-current liabilities 2.6
128.5 163.7 216.5 209.4 (2)(3) Stockholders' equity 212.7 (4)
133.5$ 165.5$ 218.1$ 361.8$ Non-current liabilities 365.3$ and stockholder equity
(1) Ex-deferred income tax/deferred revenues(2) Purchased 1.5M shares of SPSS stock for $50.0 million in March 2007(3) Purchased 0.6M shares of SPSS stock for $21.8 million during 4Q 2007(4) Purchased 0.8M shares of SPSS stock for $27.9 million during 1Q 2008.
December 31
Copyright 2008, SPSS Inc.Copyright 2008, SPSS Inc. 40
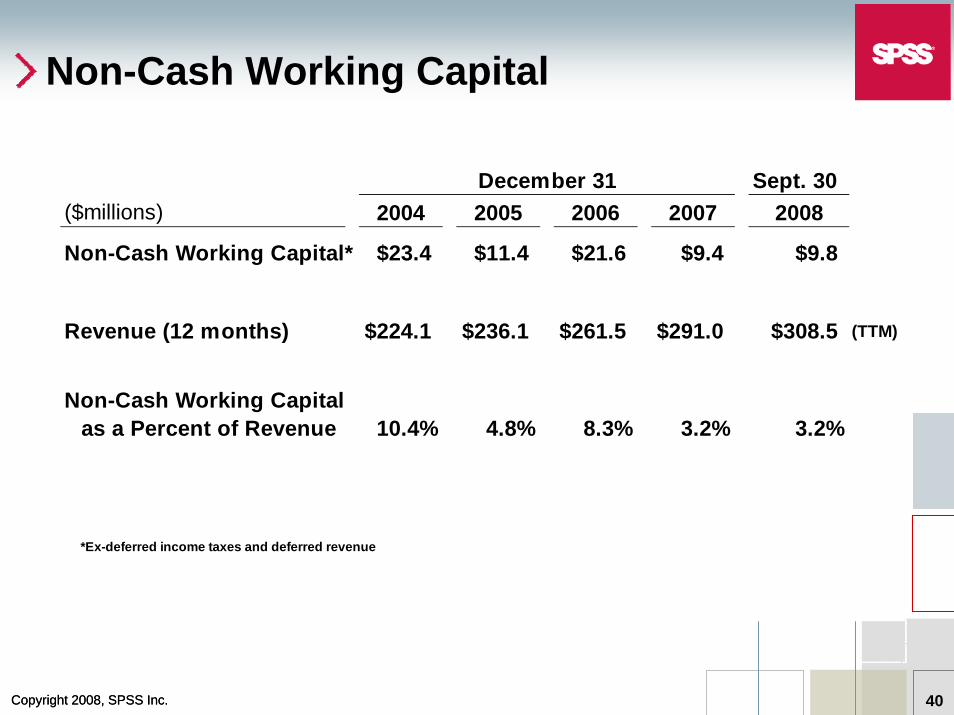
Sept. 30($millions) 2004 2005 2006 2007 2008
Non-Cash Working Capital* $23.4 $11.4 $21.6 $9.4 $9.8
Revenue (12 months) $224.1 $236.1 $261.5 $291.0 $308.5 (TTM)
Non-Cash Working Capital as a Percent of Revenue 10.4% 4.8% 8.3% 3.2% 3.2%
*Ex-deferred income taxes and deferred revenue
December 31
Non-Cash Working Capital

Copyright 2008, SPSS Inc.Copyright 2008, SPSS Inc. 41
$12.3
$51.5 $48.2
$84.9
2003 2004 2005 2006 2007
Strong Cash Flows from Operations(dollars in millions)
* Beginning in 2006, tax benefit from share-based compensation is included in “Cash from Financing Activities” rather than “Cash Flows from Operations.”
*
$22.2

Copyright 2008, SPSS Inc.Copyright 2008, SPSS Inc. 42
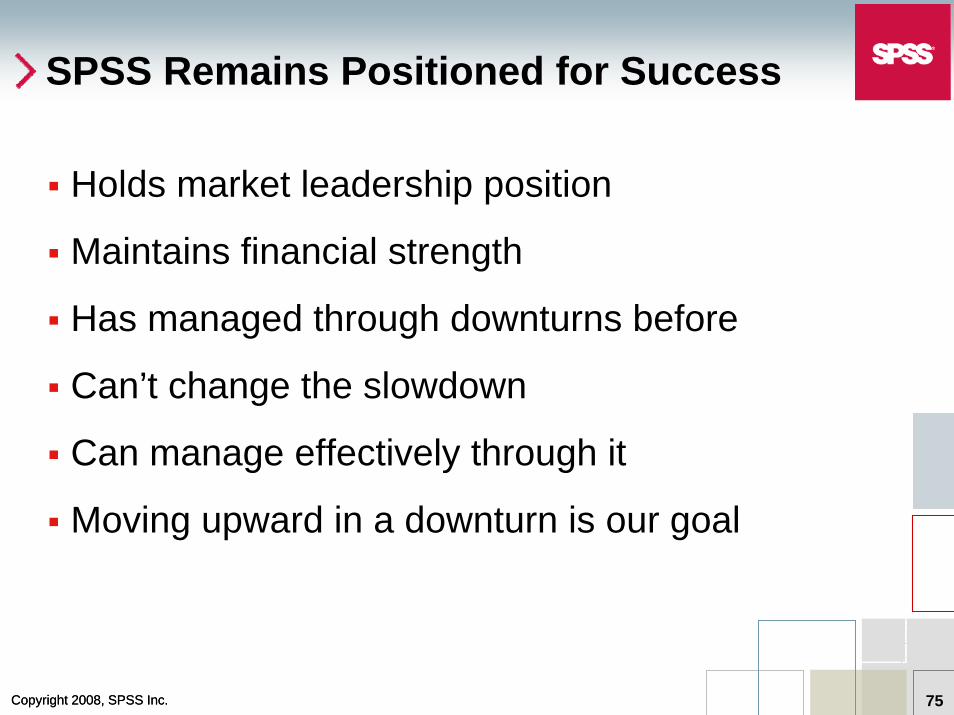
SPSS Remains Positioned for Success
Holds market leadership position
Maintains financial strength
Has managed through downturns before
Can’t change the slowdown
Can manage effectively through it
Moving upward in a downturn is our goal
People Data: Now It’s Personal!
Erick Brethenoux, VP Corporate Development
Copyright 2008, SPSS Inc.Copyright 2008, SPSS Inc. 44
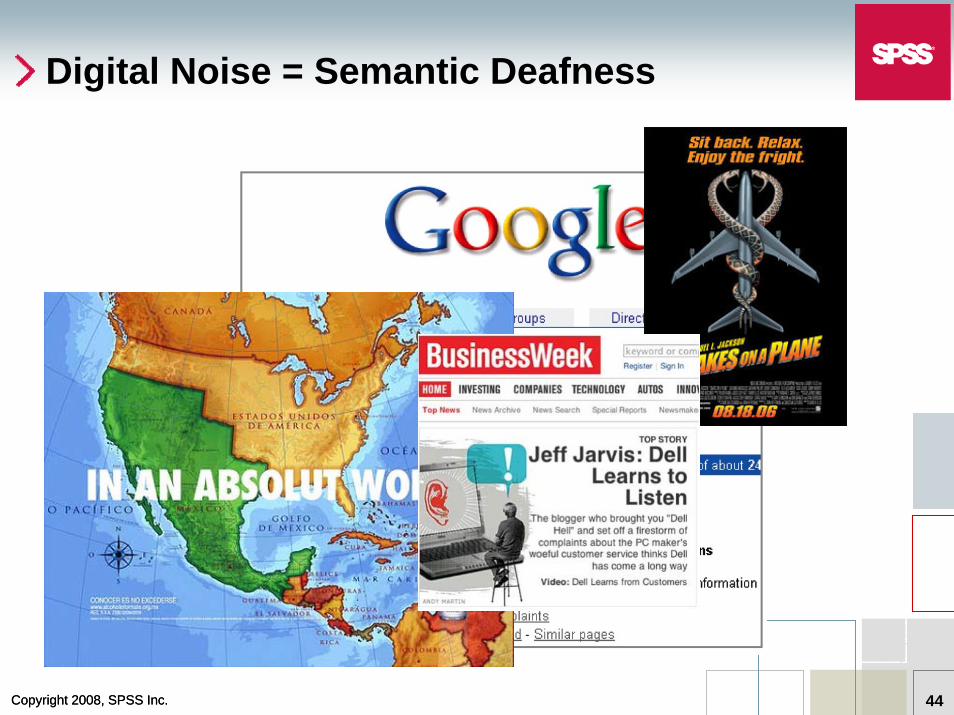
Digital Noise = Semantic Deafness
Copyright 2008, SPSS Inc.Copyright 2008, SPSS Inc. 45
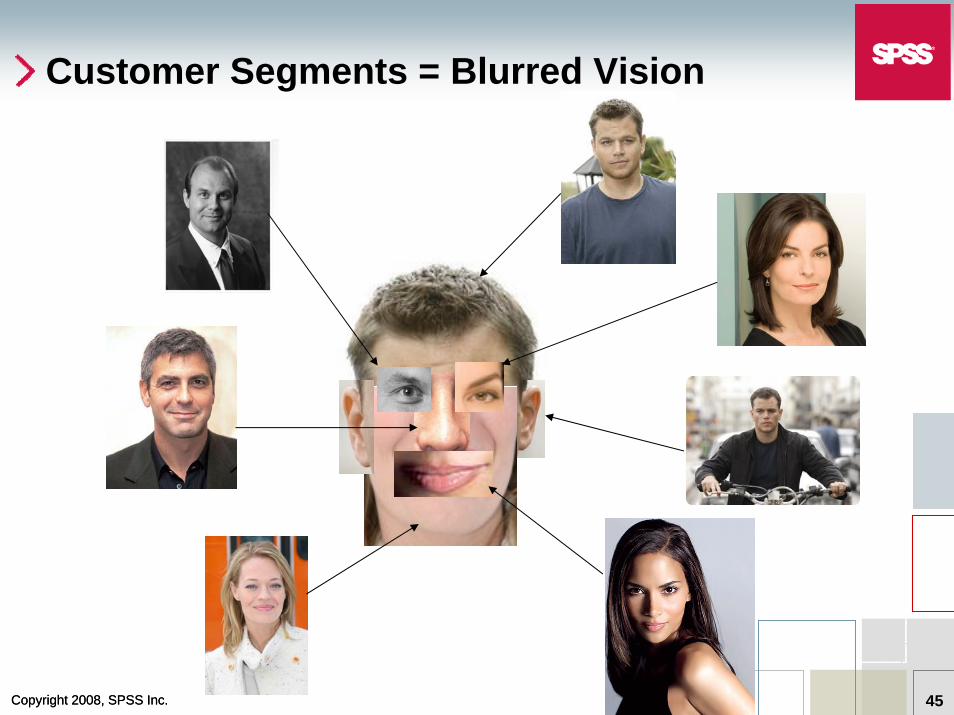
Customer Segments = Blurred Vision
Copyright 2008, SPSS Inc.Copyright 2008, SPSS Inc. 46
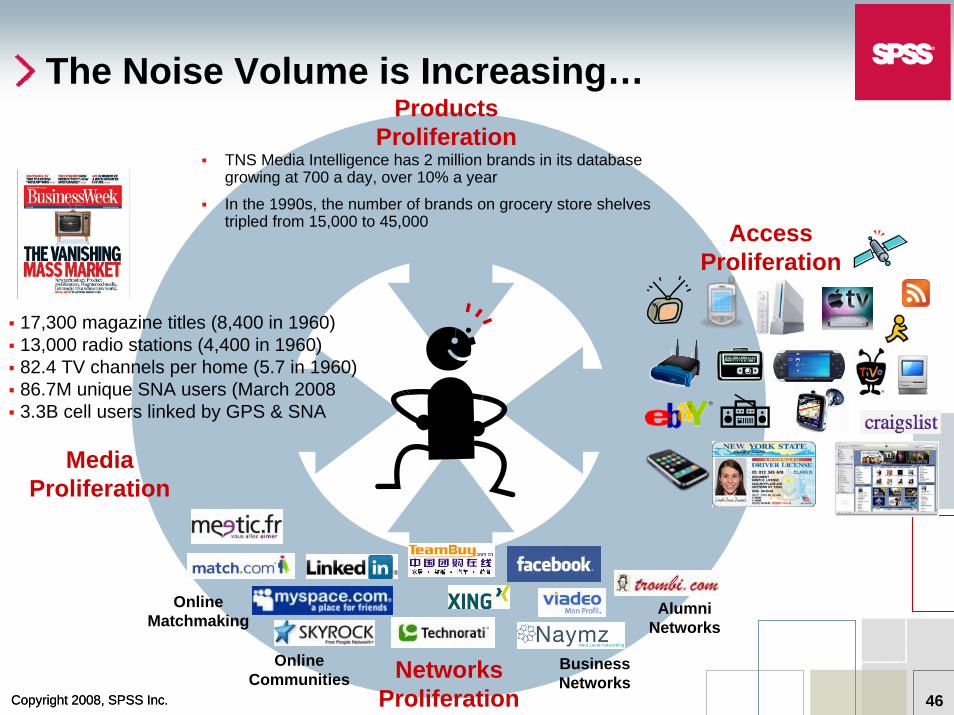
The Noise Volume is Increasing…Products
Proliferation
NetworksProliferation
AccessProliferation
MediaProliferation
TNS Media Intelligence has 2 million brands in its database growing at 700 a day, over 10% a year
In the 1990s, the number of brands on grocery store shelves tripled from 15,000 to 45,000
17,300 magazine titles (8,400 in 1960)13,000 radio stations (4,400 in 1960)82.4 TV channels per home (5.7 in 1960)86.7M unique SNA users (March 20083.3B cell users linked by GPS & SNA
OnlineCommunities
BusinessNetworks
OnlineMatchmaking
AlumniNetworks

Copyright 2008, SPSS Inc.Copyright 2008, SPSS Inc. 47
… Through a Multitude of Personalities
Chef (Amazon)
Comedian (MySpace)
VP (Siebel)
Apocalypto (WoW)
Netizen (Second Life)
Which OneIs it?
Friends & Family
User
Consumer
Customer
Participant
Influencer

Copyright 2008, SPSS Inc.Copyright 2008, SPSS Inc. 48
Trusting the Voice of Their Peers
Source: Global Nielsen consumer report - Trust in Advertising - October 2007 (Base: 26,486 internet users in 47 markets from Europe, Asia Pacific, the Americas and the Middle East
Copyright 2008, SPSS Inc.Copyright 2008, SPSS Inc. 49
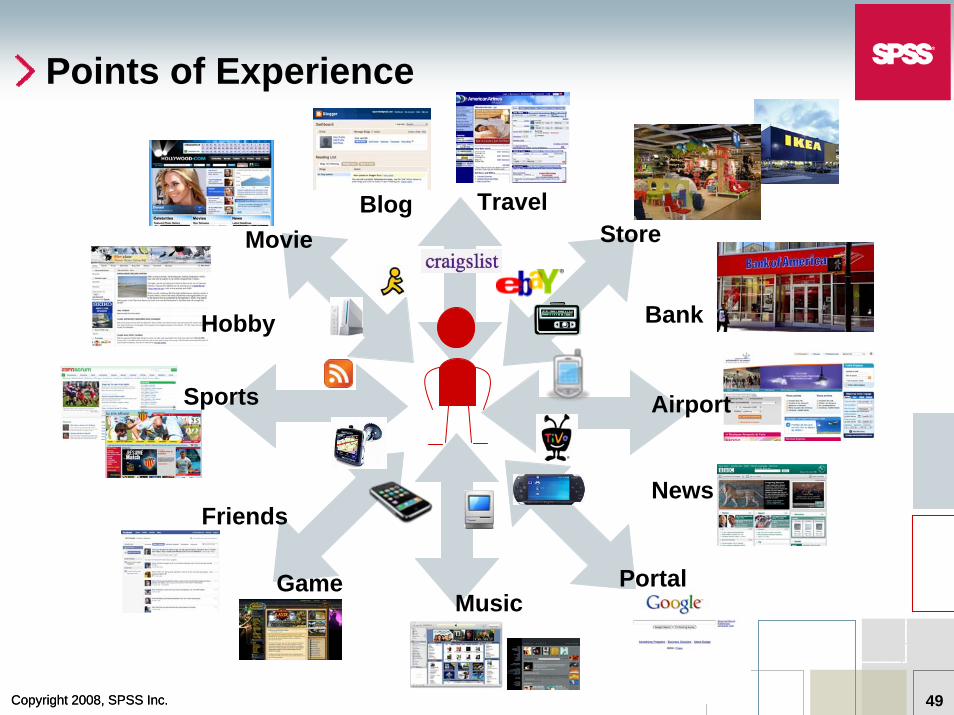
Points of Experience
BlogMovie
Game Portal
Sports
Music
Store
Bank
News
Hobby
Friends
Airport
Travel
Copyright 2008, SPSS Inc.Copyright 2008, SPSS Inc. 50
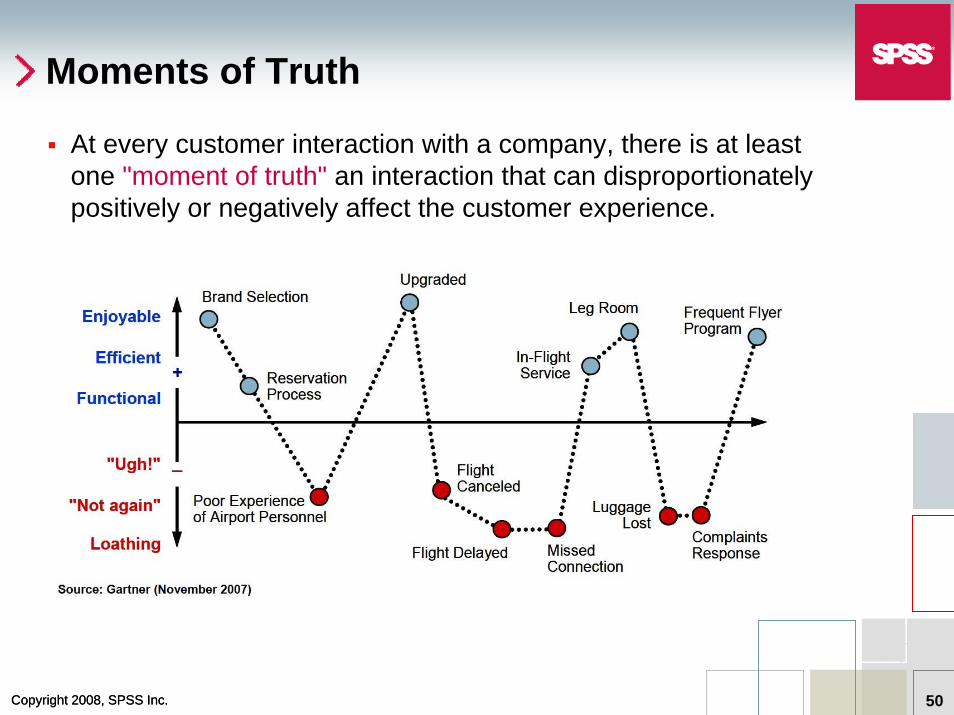
Moments of Truth
At every customer interaction with a company, there is at least one "moment of truth" an interaction that can disproportionately positively or negatively affect the customer experience.
Copyright 2008, SPSS Inc.Copyright 2008, SPSS Inc. 51
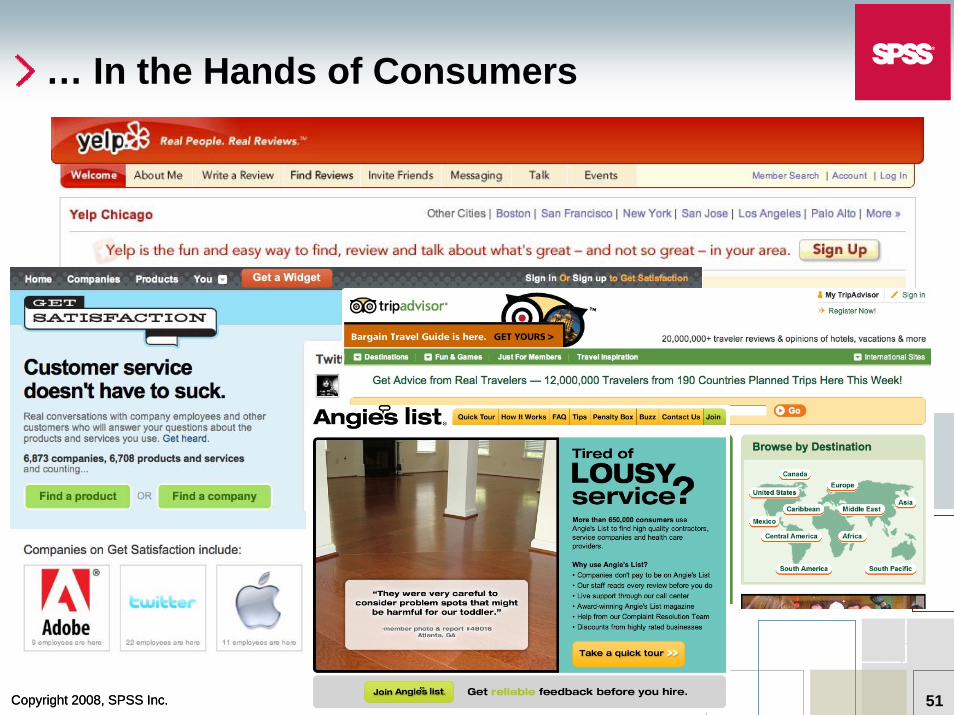
… In the Hands of Consumers
Copyright 2008, SPSS Inc.Copyright 2008, SPSS Inc. 52
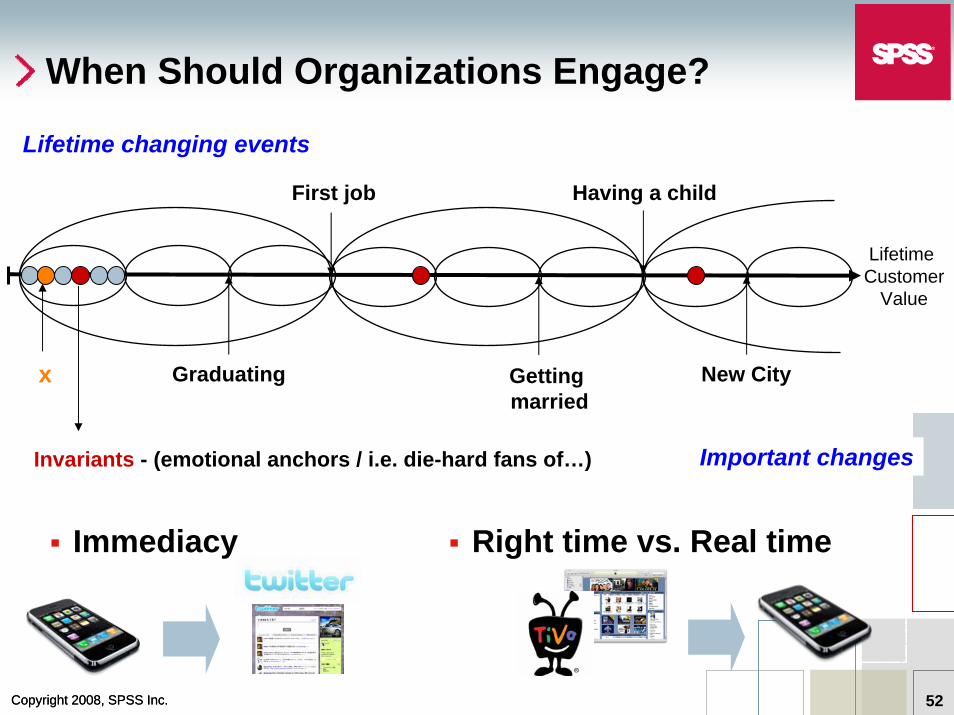
When Should Organizations Engage?
Lifetime changing events
First job Having a child
LifetimeCustomer
Value
Important changes
Graduating Getting married
New City
Immediacy Right time vs. Real time
x
Invariants - (emotional anchors / i.e. die-hard fans of…)
Copyright 2008, SPSS Inc.Copyright 2008, SPSS Inc. 53
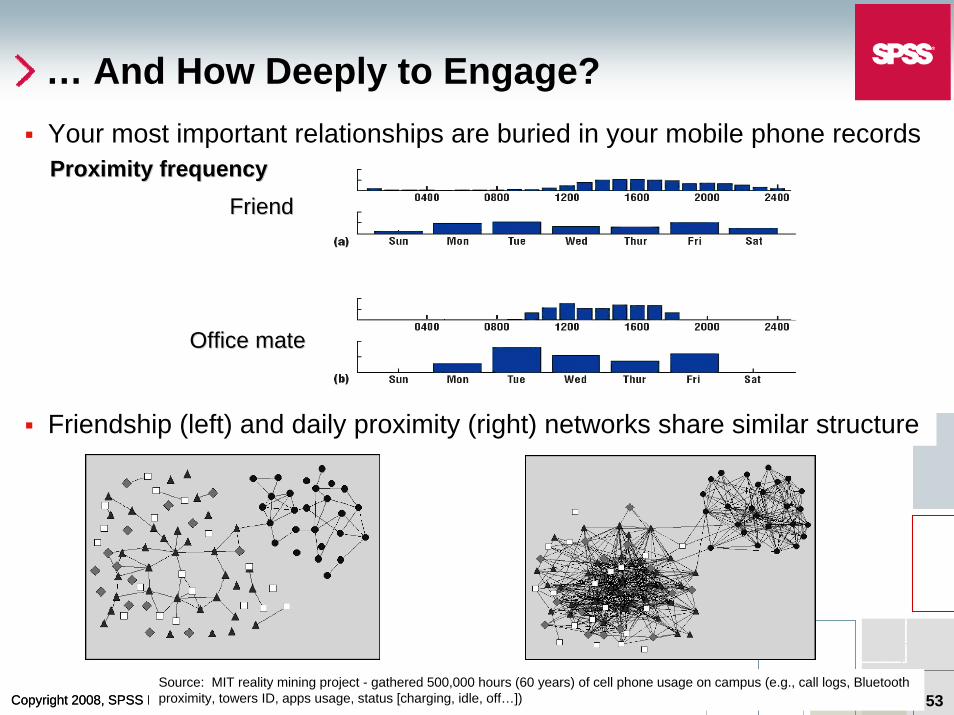
… And How Deeply to Engage?Your most important relationships are buried in your mobile phone records
Source: MIT reality mining project - gathered 500,000 hours (60 years) of cell phone usage on campus (e.g., call logs, Bluetooth proximity, towers ID, apps usage, status [charging, idle, off…])
Proximity frequencyProximity frequencyFriendFriend
Office mateOffice mate
Friendship (left) and daily proximity (right) networks share similar structure

Copyright 2008, SPSS Inc.Copyright 2008, SPSS Inc. 54
No Decisions Without EmotionsAt banks, emotionally charged interactions (e.g., receiving financial advice and negotiating mortgages as opposed to buying travelers’ checks) can have dramatic impacts on the organization’s bottom line
(1) Source: Survey of 2,229 large banks customers - The McKinsey Quarterly - “The moment of Truth in Customer Service”)
87% 72%

Copyright 2008, SPSS Inc.Copyright 2008, SPSS Inc. 55
CEOs are Investing in Active Listening
Source: PWC Management Barometer 1Q08 (Base: based on interviews with 118 senior executives of large, US-based multinationals - Avg Revenues $7.1B)
Copyright 2008, SPSS Inc.Copyright 2008, SPSS Inc. 56
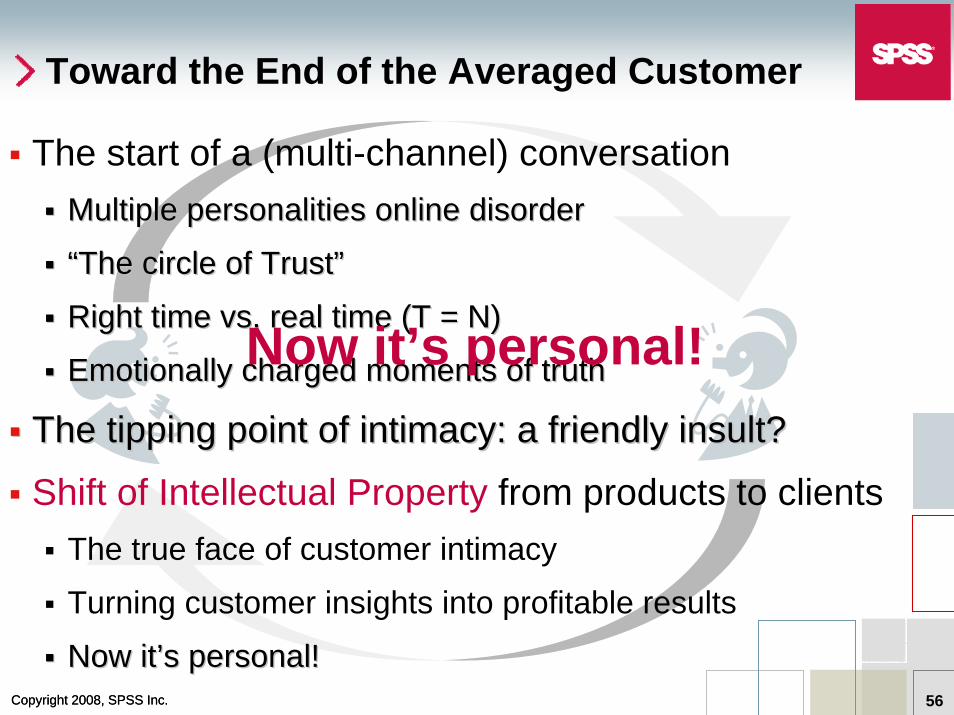
Toward the End of the Averaged Customer
The start of a (multi-channel) conversationMultiple personalities online disorderMultiple personalities online disorder
““The circle of TrustThe circle of Trust””
Right time vs. real time (T = N)Right time vs. real time (T = N)
Emotionally charged moments of truthEmotionally charged moments of truth
The tipping point of intimacy: a friendly insult?The tipping point of intimacy: a friendly insult?
Shift of Intellectual Property from products to clientsThe true face of customer intimacy
Turning customer insights into profitable results
Now itNow it’’s personal!s personal!
Now it’s personal!
Maintaining the Technological Advantage Taking Risks without Taking Chances
Rich Holada, SVP Technology

Copyright 2008, SPSS Inc.Copyright 2008, SPSS Inc. 58
Foundation in Science & Data – 40 Years
ScienceStill alive & being invested in by academic communityAcknowledged more & more by business
Data Growing exponentially in volumeIncreased value to business
Copyright 2008, SPSS Inc.Copyright 2008, SPSS Inc. 59
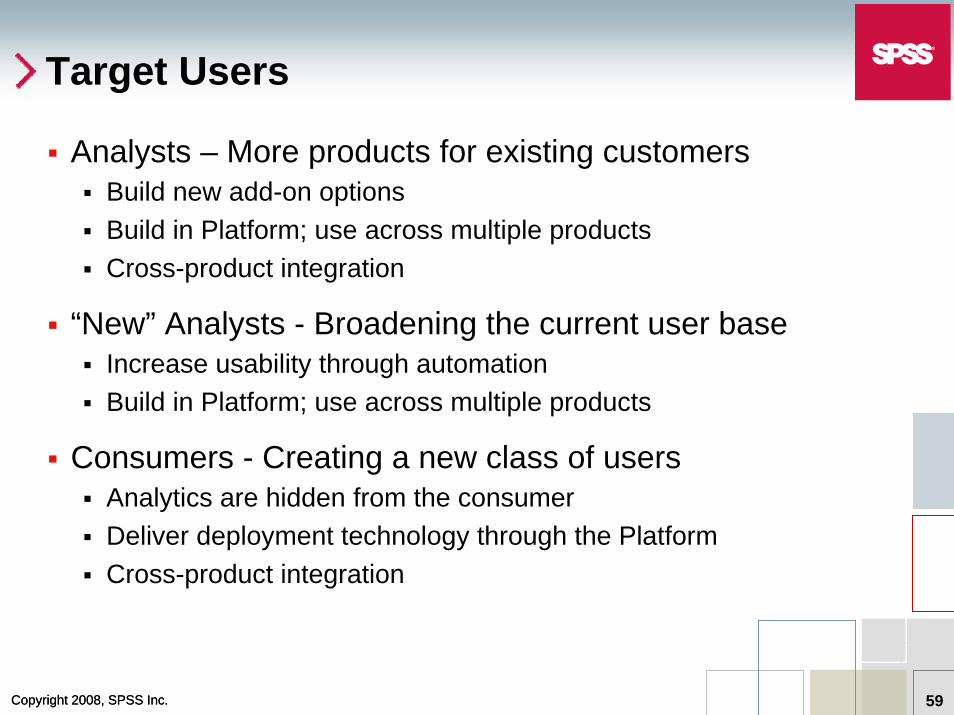
Target Users
Analysts – More products for existing customersBuild new add-on optionsBuild in Platform; use across multiple productsCross-product integration
“New” Analysts - Broadening the current user baseIncrease usability through automationBuild in Platform; use across multiple products
Consumers - Creating a new class of usersAnalytics are hidden from the consumerDeliver deployment technology through the PlatformCross-product integration

Copyright 2008, SPSS Inc.Copyright 2008, SPSS Inc. 60
R&D Investment Focus
Science & DataMaintain dominant position with Analysts
UsabilityEnabling the less sophisticated “New” Analysts
Deployment CapabilityEnabling the “consumer,” an entirely new class of user
Copyright 2008, SPSS Inc.Copyright 2008, SPSS Inc. 61
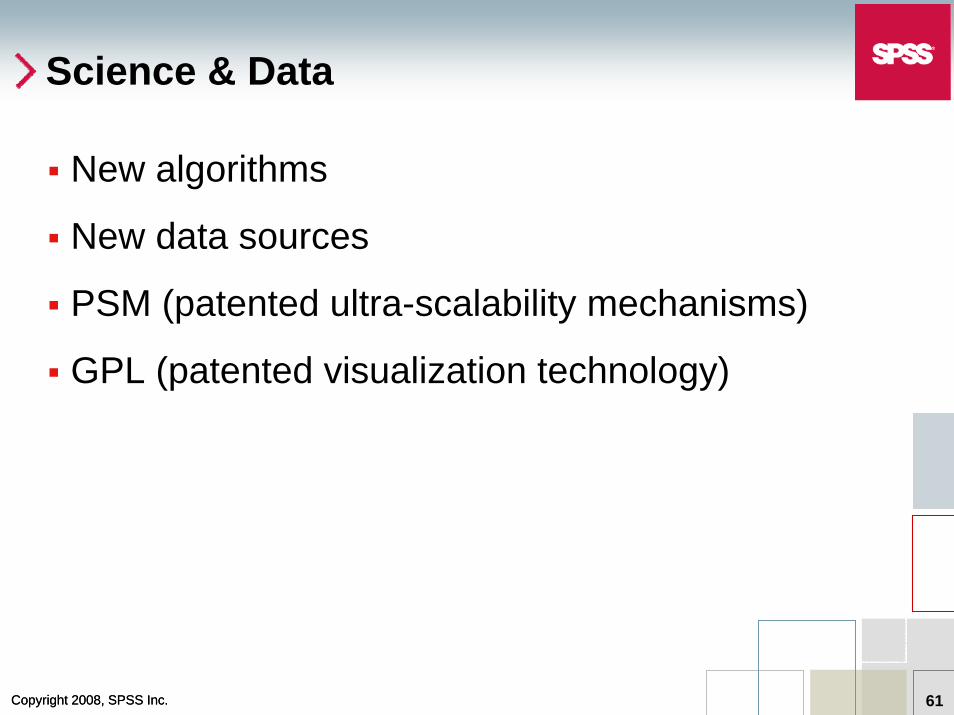
Science & Data
New algorithms
New data sources
PSM (patented ultra-scalability mechanisms)
GPL (patented visualization technology)

Copyright 2008, SPSS Inc.Copyright 2008, SPSS Inc. 62
Science & Data – GPL

Copyright 2008, SPSS Inc.Copyright 2008, SPSS Inc. 63
Usability
Algorithm AutomationAutomated data preparation (ADP)Automated model selection
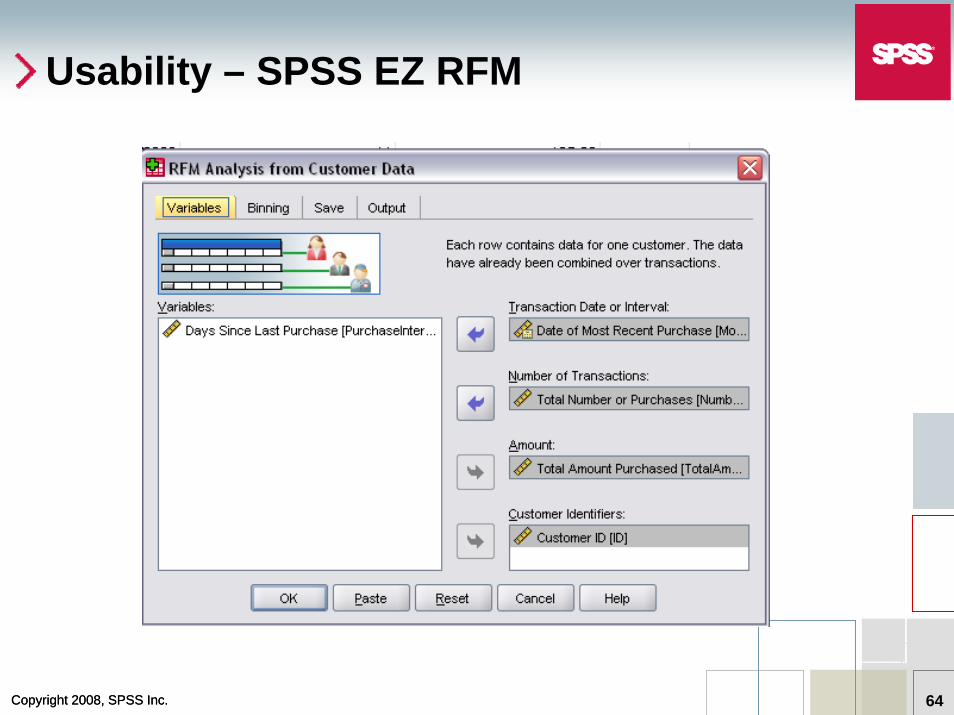
Targeted application interfaces and processesModeler AdvantageCustom DialogsSPSS EZ RFM
Copyright 2008, SPSS Inc.Copyright 2008, SPSS Inc. 64
Usability – SPSS EZ RFM
Copyright 2008, SPSS Inc.Copyright 2008, SPSS Inc. 65
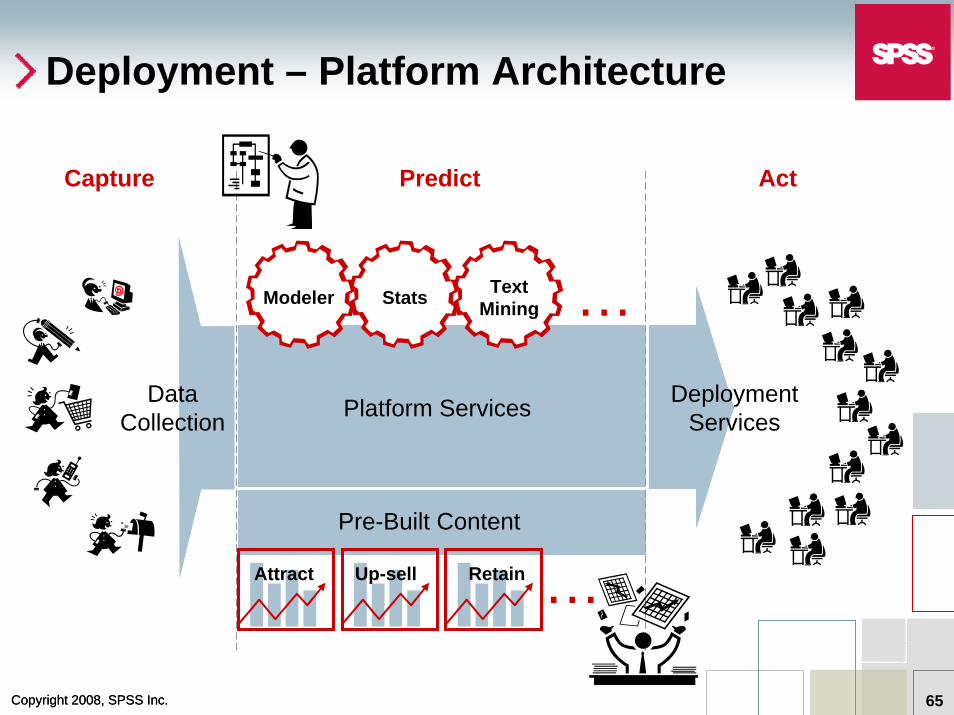
Deployment – Platform Architecture
Capture Predict Act
…
…
DataCollection
DeploymentServicesPlatform Services
Pre-Built Content
Modeler Stats
Attract Up-sell Retain
TextMining

Copyright 2008, SPSS Inc.Copyright 2008, SPSS Inc. 66
R&D Summary
User Focus ProductsAnalyst Science & Data New Algorithms
New Data SourcesPSMGPL
New Analyst Usability Algorithm AutomationTargeted Applications
Consumer Deployment Platform Architecture
Executing Through Multiple Channels “Covering the Table”
Alex Kormushoff, SVP WW Field Operations
Copyright 2008, SPSS Inc.Copyright 2008, SPSS Inc. 68
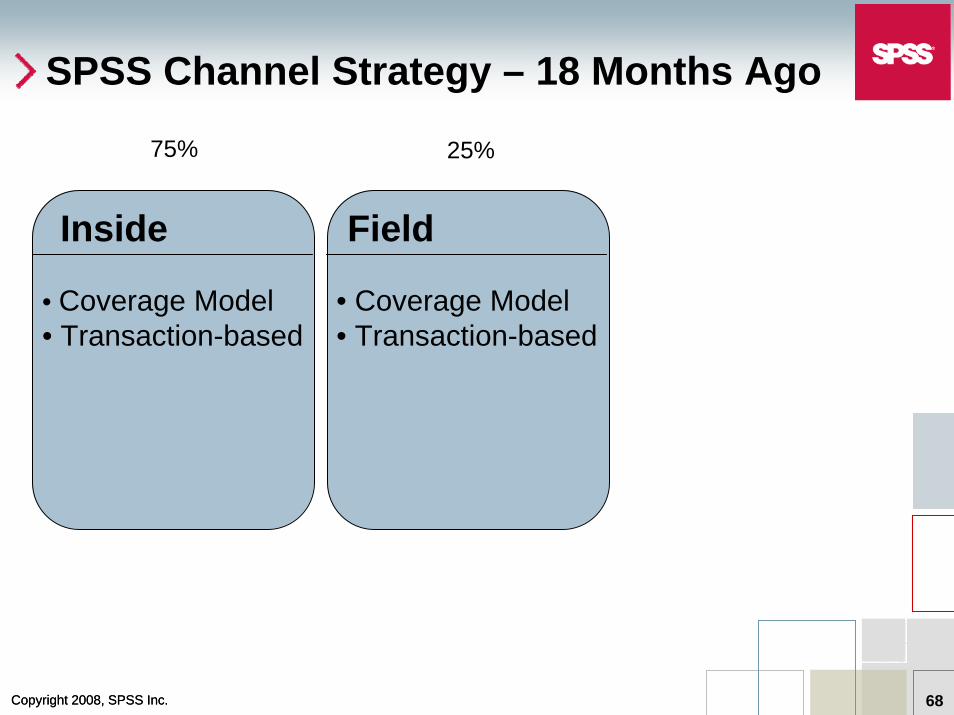
SPSS Channel Strategy – 18 Months Ago
Inside Field
• Coverage Model• Transaction-based
• Coverage Model• Transaction-based
75% 25%
Copyright 2008, SPSS Inc.Copyright 2008, SPSS Inc. 69
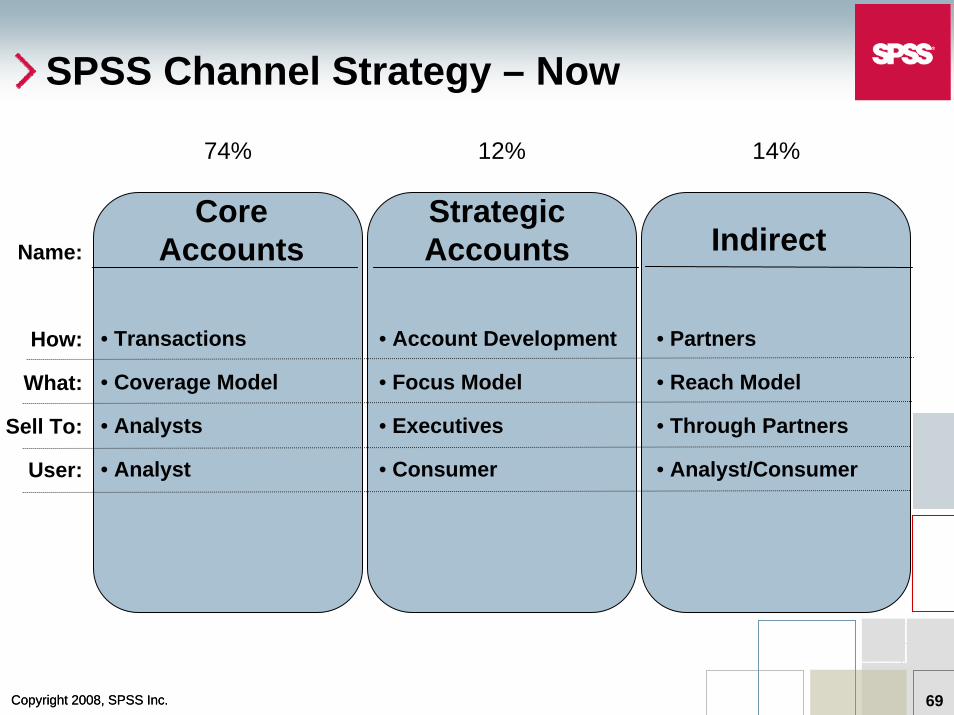
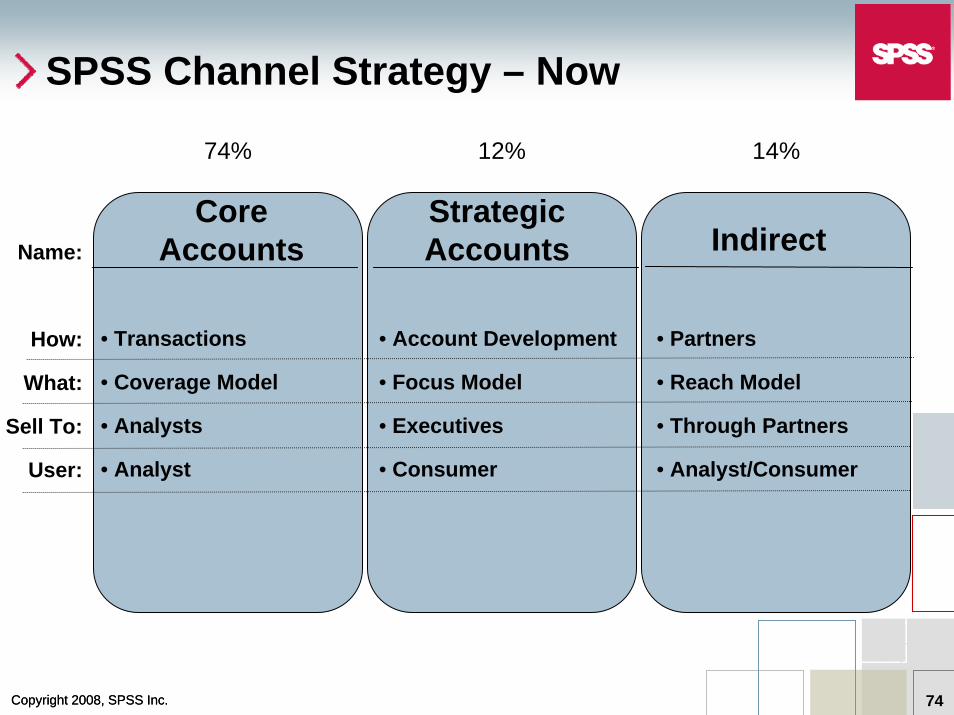
SPSS Channel Strategy – Now
Core Accounts Indirect
• Transactions
• Coverage Model
• Analysts
• Analyst
• Account Development
• Focus Model
• Executives
• Consumer
• Partners
• Reach Model
• Through Partners
• Analyst/Consumer
Strategic AccountsName:
How:
What:
Sell To:
User:
74% 12% 14%
Copyright 2008, SPSS Inc.Copyright 2008, SPSS Inc. 70
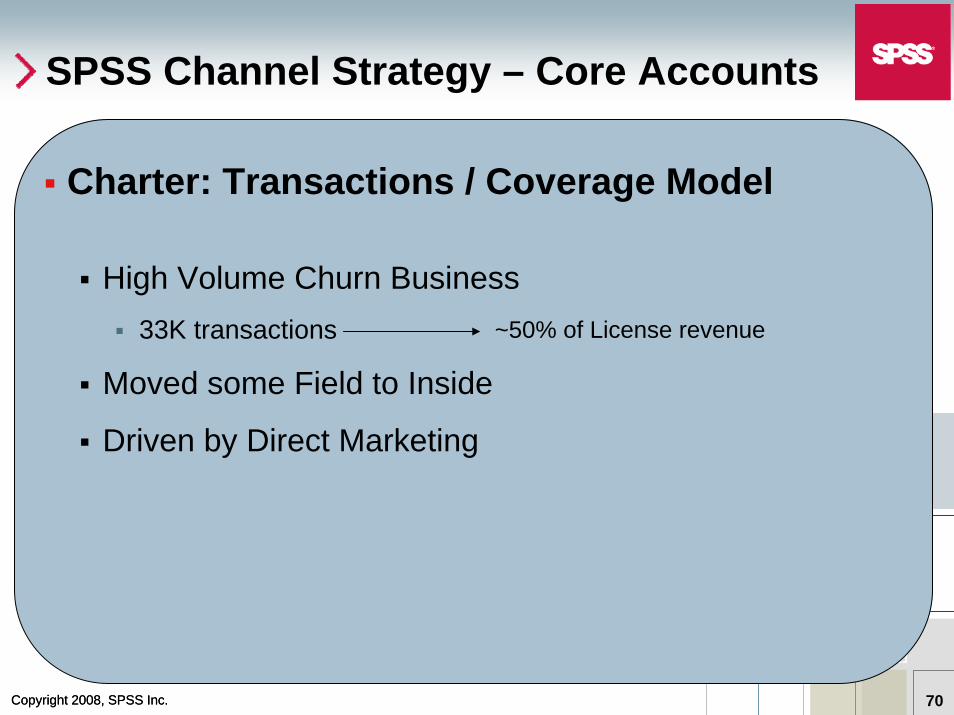
SPSS Channel Strategy – Core Accounts
Charter: Transactions / Coverage Model
High Volume Churn Business33K transactions
Moved some Field to Inside
Driven by Direct Marketing
~50% of License revenue
Copyright 2008, SPSS Inc.Copyright 2008, SPSS Inc. 71
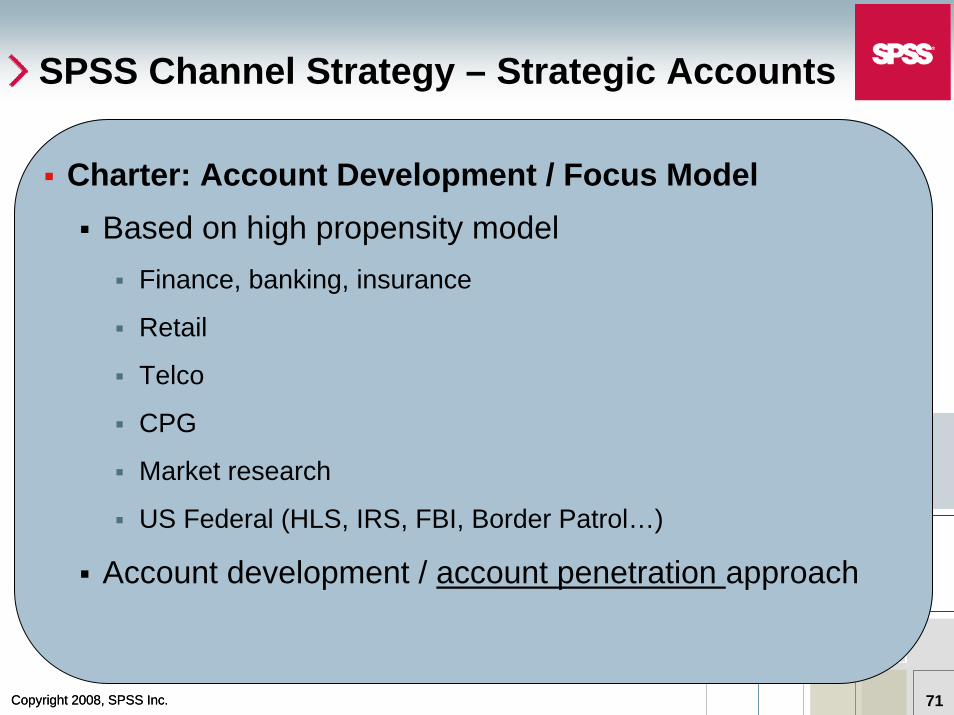
SPSS Channel Strategy – Strategic Accounts
Charter: Account Development / Focus ModelBased on high propensity model
Finance, banking, insurance
Retail
Telco
CPG
Market research
US Federal (HLS, IRS, FBI, Border Patrol…)
Account development / account penetration approach

Copyright 2008, SPSS Inc.Copyright 2008, SPSS Inc. 72
SPSS Channel Strategy – Indirect
Charter: Partners / Reach Model
Franchises
Distributors
OEMs
Alliances
Copyright 2008, SPSS Inc.Copyright 2008, SPSS Inc. 73
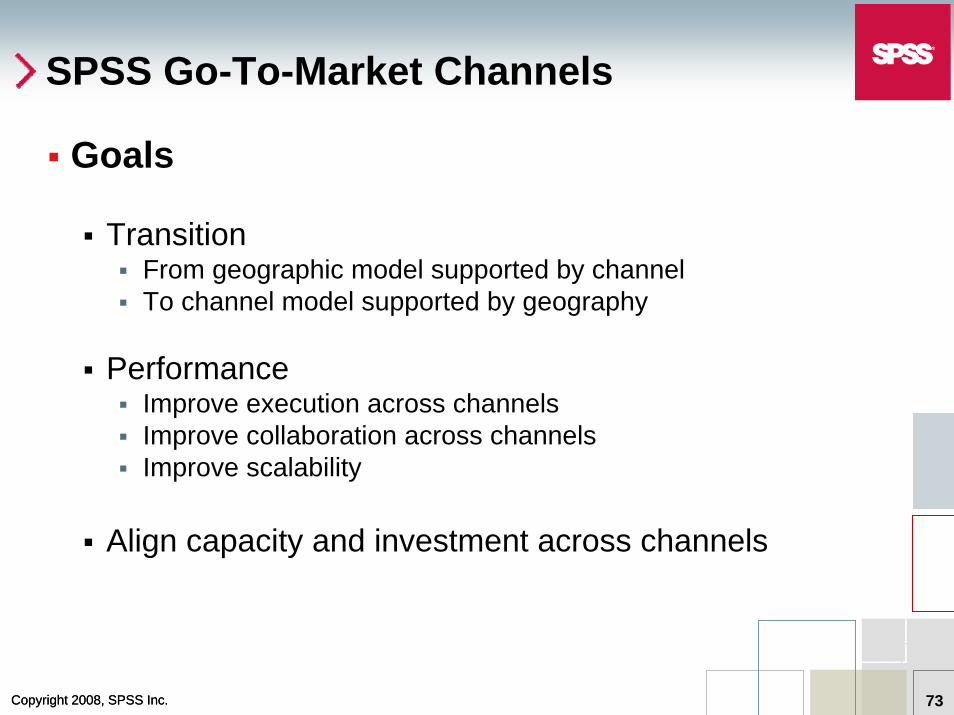
SPSS Go-To-Market Channels
Goals
TransitionFrom geographic model supported by channelTo channel model supported by geography
PerformanceImprove execution across channelsImprove collaboration across channelsImprove scalability
Align capacity and investment across channels
Copyright 2008, SPSS Inc.Copyright 2008, SPSS Inc. 74
SPSS Channel Strategy – Now
Core Accounts Indirect
• Transactions
• Coverage Model
• Analysts
• Analyst
• Account Development
• Focus Model
• Executives
• Consumer
• Partners
• Reach Model
• Through Partners
• Analyst/Consumer
Strategic AccountsName:
How:
What:
Sell To:
User:
74% 12% 14%
Copyright 2008, SPSS Inc.Copyright 2008, SPSS Inc. 75
SPSS Remains Positioned for Success
Holds market leadership position
Maintains financial strength
Has managed through downturns before
Can’t change the slowdown
Can manage effectively through it
Moving upward in a downturn is our goal