november 16, 2005altagas income fund ccs income trust foremost industries noranda income fund...
TRANSCRIPT

THE WORST IS YET TO COME
THE $20 BILLION DECEPTION THAT DWARFS THE TAX DEBATE
NOVEMBER 16, 2005
Examination of the 50 Largest Business Income Trusts
Aeroplan Income Fund Cathedral Energy Services Fording Canadian Coal Newalta Income Fund Spinrite Income Fund
Altagas Income Fund CCS Income Trust Foremost Industries Noranda Income Fund Superior Plus
Arctic Glacier Chemtrade Logistics Gateway Casinos North West Company TimberWest Forest Group
Atlas Cold Storage Cineplex Galaxy Great Lakes Carbon Osprey Media TransForce Income Fund
Avenir Diversified CML Healthcare KCP Income Fund Parkland Income Fund Tree Island Wire
Bell Nordiq Connors Bros. Keyera Facilities Peak Energy Services Trinidad Energy Services
BFI Canada Consumers' Waterheater Labrador Iron Ore Rogers Sugar UE Waterheater
Brick Group Contrans Income Fund Livingston International Royster-Clark - IDS Wajax Income Fund
Canexus Income Fund Davis + Henderson Medical Facilities - IDS SFK Pulp Westshore Terminals
Canwest Media Works Energy Savings Mullen Group Sleep Country Yellow Pages
The Investorside Research Association certifies that AccountabilityResearch does not have any investment banking conflicts of interest
Analysts Certifying this Report:
Mark Rosen, MBA, CFA (416) 367-3352 x1000 [email protected]
L.S. (Al) Rosen, PhD, FCA, CFE, FCPA, CA-IFA (416) 367-3352 x1002 [email protected]
Consulting Analyst:
Diane Urquhart, MA (905) 822-7618 [email protected]

Business Income Trusts
TABLE OF CONTENTS
Executive Summary .................................................................................................................................... 1 The Need for Higher Cash Yielding Securities........................................................................................... 3
Cash Distribution Yields Are Misleading .......................................................................................... 3 What is the Fair Value of a Business Trust? ...................................................................................... 5
Taxation of Business Trusts ........................................................................................................................ 5 A Recommended Solution for Tax Parity .......................................................................................... 6 Fair Taxation amongst Business Structures and Canadians............................................................... 8
The Canadian Income Trust Market............................................................................................................ 9 Distributions Fundamentally Not Sustainable........................................................................................... 10 Distributable Cash Figures Easily Manipulated ........................................................................................ 12
What is Sustainable? ........................................................................................................................ 16 Assessing Reasonable Fair Value.............................................................................................................. 18
Selecting a Discount Rate for Valuation.......................................................................................... 18 Historical Investment Performance of Income Trusts...................................................................... 19 Poor Performance of Business Trust Offerings................................................................................ 23 Business Trust IPO Performances Worse Than Common Equity Offerings ................................... 24 First Business Trust Bankruptcy Filing............................................................................................ 26 Business Trust Takeovers Provide Limited Chance of Relief ......................................................... 27 Future Declines in Distributions and Prices of Business Trusts ...................................................... 27
Insiders and Underwriters Reaping The Benefits...................................................................................... 33 Investment Banking Fees Based on Inflated IPO Prices.................................................................. 33 Research Biased by Underwriting Fees ........................................................................................... 33
Regulators Condoning Current Market Abuse .......................................................................................... 35 Alternative To Current Market Abuse....................................................................................................... 36 Summary of Report Recommendations .................................................................................................... 37 Summary ................................................................................................................................................... 38
iACCOUNTABILITY RESEARCH

Business Income Trusts
TABLE OF FIGURES
Figure 1: Yields Not a Good Measure of Investment Return ................................................................ 4 Figure 2: Profits of Trusts versus Corporations after Corporate and Personal Taxes............................ 6 Figure 3: Recommended Taxation of Business Trusts .......................................................................... 7 Figure 4: Income Trusts by Type........................................................................................................... 9 Figure 5: Business Trusts by Market Capitalization............................................................................ 10 Figure 6: Comparison of May 2005 Report with Current Review ...................................................... 11 Figure 7: Business Trusts with Deteriorating TTM Distributions-to-Distributable Cash Ratios ........ 11Figure 8: Average Business Trust Calculation of Distributable Cash ................................................. 12 Figure 9: The Average Characteristics of the 50 Largest Business Trusts .......................................... 13 Figure 10: TTM Maintenance Capex as a Percentage of Depreciation Expense................................. 15 Figure 11: Breakdown of Cash Yield Highlighting Proportion Covered by TTM Net Income .......... 17Figure 12: U.S. Junk Bond Spread....................................................................................................... 19 Figure 13: Impact of Higher Interest Rates on the Valuation of the Average Business Trust............. 19Figure 14: Decline in Income Trust Market Caps since September 16, 2005 ..................................... 20 Figure 15: Income Trust Price Performance by Type.......................................................................... 21 Figure 16: All Income Trusts Price Performance ................................................................................ 21 Figure 17: Oil & Gas Resource Trusts Price Performance .................................................................. 22 Figure 18: Real Estate Income Trusts Price Performance ................................................................... 22 Figure 19: Business Trusts Offerings Down More Than 30% As of November 9, 2005 .................... 24Figure 20: IPO Market for Business Trusts versus Common Equities ................................................ 25 Figure 21: Performance of Income Trusts and Common Equity IPOs ................................................ 26 Figure 22: Impact of New Equity Offerings is Dilution ...................................................................... 28 Figure 23: Illustration of Dilutive Effect of New Equity Offerings..................................................... 29 Figure 24: Valuation of the Average Business Trust versus a Corporation......................................... 30 Figure 25: Illustration of the Valuation of the Average Business Trust versus a Corporation ............ 31Figure 26: Valuation of Mature Dividend Paying Public Corporations .............................................. 32 Figure 27: Summary of Scenarios........................................................................................................ 32 Figure 28: Importance of Business Trusts to the Investment Banks.................................................... 33 Figure 29: Recommendations for Investment Banking versus Non-Investment Banking Clients ...... 34Figure 30: Top 25 Underwriters of Business Trust Offerings ............................................................. 34 Figure 31: Auditors Remaining Silent on Distributable Cash Calculation Mayhem........................... 35
iiACCOUNTABILITY RESEARCH

Business Income Trusts
EXECUTIVE SUMMARY
Business income trusts could easily be overvalued by 28% on average, or by $20 billion across the entire business trust market. This assessment is based on our analysis of the net present value of future income and cash distributions for the 50 largest business trusts, in comparison to common equity values. The $20 billion potential loss is in addition to the $10 billion decline that has occurred since the Department of Finance initiated its tax review of the trusts in September. We believe that a new modest tax on business trusts would represent $5 billion of damage. Investors are simply not recognizing that cash distributions are well in excess of income, and therefore not sustainable over the longer-term. Seventy-five percent of the 50 largest business trusts have cash distributions exceeding their income. On average, they pay cash distributions that are 158% of their reported net income, which itself is open to manipulation. Much of the over-valuation stems from abuses in the financial reporting, valuation, and marketing of business trusts. We believe that the primary motivation for the conversion of many corporations into business trusts has not been related to income tax advantages. Rather, it has been the opportunity for selling owners to receive inflated prices well above what strategic industry buyers and professional investors alone would be willing to pay. Investment bankers have been motivated by the $1.4 billion of inflated underwriting fees that they have received since January 1, 2001. Many have taken advantage of ill-informed investors seeking higher cash yielding investments. These investors are not being adequately educated that a significant portion of their monthly distributions is actually a return of their own money. A cash distribution yield simply cannot be compared to a traditional income yield. On average, less than two-thirds of the cash distribution yield represents traditional income yield, with the balance being a return of investors’ capital. When investors misinterpret a cash distribution to be income when it is not, the income generating ability (and perceived value) of the investment becomes inflated in comparison to companies that are returning actual income to investors. Playing no small part in the over-valuation are the abuses related to distributable cash reporting. Much of the manipulation relates to the understatement of future capital spending required to maintain the capital assets of the business. The total maintenance capex of the business trusts estimated by management is only 32% of the total depreciation expenses reported under standardized accounting rules. This implies a severe mismatch between prior capital spending requirements and estimated future needs (the latter of which forms the basis of the current inflated business trust values).
1ACCOUNTABILITY RESEARCH

Business Income Trusts
Even more over-valuation results from the flawed methodologies being pushed by the investment banks, in which cash distributions are capitalized using current cash yield benchmarks. In contrast, we have calculated the net present value of future net income and cash distributions using three scenarios, which more reasonably reflect the impact of eroding the future cash-generating ability of the company through inflated cash distributions. In the first scenario, we value the average large business trust based on reducing its ratio of distributions to net income from 158% to 100% (a measure that would allow the trusts to maintain their capital base, and their income-producing ability). In this scenario, total business trust capitalization would drop 20% from its current level. Secondly, we considered a situation where the trusts would continue to prematurely return capital to investors, and then issue additional units to fund capital maintenance needs. This resulted in a decline very similar to that of our first scenario due to the dilution caused by the additional units issued. Our third scenario valued the trusts based on their current course of issuing distributions well in excess of income, and running the capital assets into the ground. This neglectful situation would cause a decline of 46% of total business trust market capitalization from today. The prospects for serious declines in business trusts are already evident. Twenty-two business trusts are down 30% or more from their IPO or latest offering prices. In brief, we recommend: (1) the introduction of a blended tax solution comprising a new 10% tax on business trusts and an increase in the dividend tax credit; (2) new government regulations and securities enforcement actions to deter the accounting, valuation, and marketing abuses surrounding business trusts; and (3) structural reform of Canada’s abysmally weak accounting and securities regulation authorities. A new tax on business trusts would stem the tide of business trust conversions and the litany of financial reporting, valuation, and marketing abuses occurring in this sector of the market. An increase in the dividend tax credit would encourage many corporations to raise their dividend payout ratios as a way of boosting shareholder value. This would also save current shareholders from needless restructuring fees, and still provide income-seeking investors with an effective alternative to business trusts. In the end, whether a new tax on business trusts is introduced or not, we believe that a substantial downward correction in the business trust market in the range of 20%, or $15 billion is warranted. This is in addition to the declines that have occurred since the Department of Finance initiated its tax review of the trusts in September.
2ACCOUNTABILITY RESEARCH

Business Income Trusts
T HE NEED FOR HIGHER CASH YIELDING SECURITIES
Individuals, especially retirees and other income-seeking investors, have experienced an increasing need for investments that pay out significant cash distributions. Five-year GICs have a current interest rate of 2.8%. Canadian government bonds have yields of 4.20% and 4.35% for 10-year and 30-year terms, respectively. Investment grade corporate bonds produce modestly higher average yields of around 4.5%. The highest dividend-paying common equities, such as banks, insurers, and pipelines, have average yields of roughly 3%, or 3.85% on a pre-tax interest income equivalent basis. Such yields, from a traditional standpoint, are not sufficient to meet the cash flow needs of many investors. As such, these investors have bought income trusts in the belief that these securities offer higher cash yields. The investment bank Green Sheets used by financial advisors to market new equity offerings provide a calculation of the cash distribution as a percentage of the offering price and compare this measure against benchmarks of other income trusts in similar businesses. The cash yield methodology is also prevalent in equity research reports and most data services. However, cash distribution yields are misleading because they include a substantial portion of capital that is prematurely being returned to investors and eroding the principal value of the company. Quoted cash distribution yields represent a significant overstatement of the likely future return on investment in the majority of business trusts. In fact, the return on investment in the end could well be less than that provided by risk-free government bonds. Return on investment is a calculation of the internal rate of return based on the initial investment, expected future cash distributions over the investment holding period, and the fair value of the business at the end of the holding period. Investors are not being adequately informed about how much of their own money they are getting back. As well, risks are being ignored with respect to the volatility of business trust unit prices due to changes in interest rates, commodity prices, and other economic conditions. In sum, average current cash yields are being overstated and many principal risks are being understated, leading to inflated business trust values in general. Cash Distribution Yields Are Misleading
Figure 1 provides an illustration of why cash distribution yields are a very poor measure of investment return. In short, business trust prices are inflated because they capitalize the portion of current cash yield that is a return of investors’ own money. Figure 1 shows the return for an investor who pays $10 for a business trust unit with a current annual cash distribution of $0.80 per unit. The current cash distribution yield is 8.0%. However, the fundamentally-based investment return is not 8%, but might actually be negative 1.6%. The poor performance comes from the fact that the initial investment might be too high relative to the net
3ACCOUNTABILITY RESEARCH

Business Income Trusts
worth of the business based on its net income. Capital that should be re-invested in the business to maintain and replace capital assets is being prematurely returned to investors. The capital asset base of the trust is being eroded over time, causing its income-generating ability to decline. In examining the 50 largest business trusts, we found that cash distributions exceeded reported net income by 58%. Thus, when investors receive their distributions, on average, over one-third represents a return of capital that is being erroneously re-capitalized into the unit price. A more reasonable and sustainable valuation would capitalize only the portion of distributions that is backed by reported income.
Figure 1: Yields Not a Good Measure of Investment Return
Year 0 1 2 3 4 5 6 7 8 9 10
Cash Distributions = Net Income 100%
Net Income Growth Rate 0% Capital Assets $5.33 $5.33 $5.33 $5.33 $5.33 $5.33 $5.33 $5.33 $5.33 $5.33 $5.33 Return on Capital Assets 10% 10% 10% 10% 10% 10% 10% 10% 10% 10% 10% Net Income $0.53 $0.53 $0.53 $0.53 $0.53 $0.53 $0.53 $0.53 $0.53 $0.53 $0.53 Cash Distribution $0.53 $0.53 $0.53 $0.53 $0.53 $0.53 $0.53 $0.53 $0.53 $0.53 Initial Investment -$6.06 IRR Cash Flows -$6.06 $0.53 $0.53 $0.53 $0.53 $0.53 $0.53 $0.53 $0.53 $0.53 $5.87 Desired Investment Return 8% Cash Distributions > Than Net Income 150% Net Income Growth Rate -14.7% Capital Assets $5.33 $5.07 $4.77 $4.45 $4.10 $3.71 $3.28 $2.80 $2.28 $1.71 $1.08 Return on Capital Assets 10% 11% 11% 11% 11% 11% 11% 12% 12% 13% 16% Net Income $0.53 $0.53 $0.51 $0.48 $0.45 $0.41 $0.37 $0.33 $0.28 $0.23 $0.17 Return of Capital $0.27 $0.29 $0.32 $0.35 $0.39 $0.43 $0.47 $0.52 $0.57 $0.63 Cash Distribution $0.80 $0.80 $0.80 $0.80 $0.80 $0.80 $0.80 $0.80 $0.80 $0.80 Initial Investment -5.88 IRR Cash Flows -5.88 $0.80 $0.80 $0.80 $0.80 $0.80 $0.80 $0.80 $0.80 $0.80 $1.88 Desired Investment Return 8%
Initial Price Too High
Initial Investment -$10.00
IRR Cash Flows -$10.00 $0.80 $0.80 $0.80 $0.80 $0.80 $0.80 $0.80 $0.80 $0.80 $1.88
Cash Distribution Yield 8.00% Actual Investment Return -1.56%
When business trusts pay out cash distributions in excess of reported net income, unitholders are receiving a return of their own investment capital. Figure 1 shows the return of capital to be the difference between the cash distribution and the net income per unit. As explained later in this report, the return of capital is largely the result of management substantially underestimating the amount of capital that needs to be spent to maintain the capital assets and income-generating ability of the company. Prematurely returning cash to unitholders that should be spent on maintaining the capital base of the company means that the cash-generating ability of business is deteriorating. Our illustration in Figure 1 shows the value of
4ACCOUNTABILITY RESEARCH

Business Income Trusts
capital assets on the balance sheet being reduced from $5.33 at the time of initial investment to just $1.08 at the end of the 10-year period. The fundamental investment return is negative for one key reason: the price paid initially is too high relative to the fair value of the business based on its earnings power. The fair value of the business in this simple illustration is the value of the capital assets at the end of the investment holding period. What is the Fair Value of a Business Trust?
The general methodology to determine the fair value of a business trust unit is shown in Figure 1. In our illustration, the fair price is $5.88 and not the $10.00 that was paid based on the superficial 8.0% cash distribution yield. At the $5.88 fair price, the investment return is around 8.0%, based on expected future cash distributions over the investment holding period, and the fair value of the business at the end of the holding period. The fair price is roughly $6.00 whether the cash distribution is $0.80 per unit (equal to 1.5 times net income), or the cash distribution is equal to net income at $0.53. Investors should not be paying a multiple on the portion of cash distributions that is a return of their own money. Every business trust has its own dynamics with respect to cash distribution relative to net income, and the pattern of its future net income in terms of growth and sensitivity to economic factors. Unfortunately, our illustration in Figure 1 is not just hypothetical, but rather similar to evidence we collected from the 50 largest business trusts in Canada. Our research findings support the case for an additional 20% decline in the overall market cap for business trusts from today’s level. Total declines could well be 39% from the September 16, 2005 peak values, for which a modest new tax on business trusts would contribute only 7%. This is not to say that every trust should decline within this range. Rather, the business trust market as a whole is over-valued by as much as 20% from a fundamental long-term viewpoint. While delivering cash to investors is a premium that should be recognized, it is only valid to the extent that the distributions are sustainable. In short, given the current financial reporting bedlam in the market, we believe investors are valuing the cash, while ignoring the deterioration in the capital base and the net worth of the underlying businesses. TAXATION OF BUSINESS TRUSTS
Figure 2 shows that the profit left in a business trust after both personal and corporate taxes are paid is 14% higher than what is left in a large corporation that pays out 40% of its net income in dividends. Right off the bat, we know people will misinterpret this statement. We are not referring to the amount of tax revenue generated from a business trust versus a corporation. Instead, we are examining the value of a trust versus a corporation based on income after both corporate and personal taxes are paid. Because we are focusing on profit, we are ignoring the
5ACCOUNTABILITY RESEARCH

Business Income Trusts
fact that trust unitholders are paying tax on distributions that are, on average, 58% greater than reported profits. The 14% gap is based on a 40% dividend payout ratio in the corporation, and assumes top personal tax rates at both the federal and provincial (Ontario) levels. Thus, if taxes were equalized between trusts and large corporations with 40% dividend payouts, investors could suffer a 14% correction in the value of their trusts. Figure 2: Profits of Trusts versus Corporations after Corporate and Personal Taxes
Current Federal Current Ontario Current Total
Business Trust Tax Rate — — — Corporate Tax Rate 22.12% 14.00% 36.12% Personal Tax Rate 29.00% 17.41% 46.41% Gross-Up 125.00% 125.00% 125.00% Dividend Tax Credit 13.33% 8.00% 21.34% Capital Gains Exemption — — 50.00% Interest 29.00% 17.41% 46.41% Dividends 19.58% 11.76% 31.34% Capital Gains 14.50% 8.71% 23.21%
Current Large Business
Current Income Trust 100% Payout 40% Payout
Corporate Profit Before Tax $100.00 $100.00 $100.00 Business Trust/Corporate Taxes — $36.12 $36.12 Net Corporate Profit After Tax $100.00 $63.88 $63.88 Retained Profits — — $38.33 Cash to Unit/Share Owners $100.00 $63.88 $25.55 Personal Taxes: Income $46.41 — — Dividends — $20.02 $8.01 Capital Gains — — $8.89 Total Taxes $46.41 $56.14 $53.02 Corporate Profits After Total Taxes $53.59 $43.86 $46.98
14%
A Recommended Solution for Tax Parity
We believe that a downward correction in the business trust market will likely occur due to its over-pricing of cash distributions relative to the earnings power of the underlying businesses. However, the estimated 14% loss caused by full tax parity objectives could be mitigated by taking a blended approach of imposing a 10% federal and provincial combined tax on business trusts and improving the dividend tax credit for public corporations. In the blended approach, the impact of the new tax on a business trust is a loss of 10% of the business trust’s fundamental value. This 10% decline in fundamental value is more than the 7% decline contribution discussed above for our recommended tax solution, since the 7%
6ACCOUNTABILITY RESEARCH

Business Income Trusts
calculation is taken from the inflated current price of business trusts that is based on current cash yield valuation. The 7% decline of business trust prices caused by the new business trust tax, would be offset by a 3% gain on the value of current common equities (with an average dividend payout of 40%). The 10% loss in fundamental business trust values is the result of the business trust profit after tax declining 10% from $53.59 in Figure 2 to $48.23 in Figure 3. The 3% rise in the value of dividend paying common equities is due to the increase in corporation after-tax profit rising from $46.98 in Figure 2 to $48.29 in Figure 3 for the assumed dividend payout rate of 40%. We have assumed that a diversified investment portfolio would contain a lower proportion of business trusts compared to dividend-paying common stocks. The net loss of the blended tax solution on the total portfolio would be nominal, at about 1%, if the portfolio was 20% in business trusts and 30% in Canadian dividend paying equities. Figure 3: Recommended Taxation of Business Trusts
Recommended Federal
Recommended Ontario
Recommended Total
Business Trust Tax Rate 6.12% 3.88% 10.00% Corporate Tax Rate 22.12% 14.00% 36.12% Personal Tax Rate 29.00% 17.41% 46.41% Gross-Up 137.68% 137.68% 137.68% Dividend Tax Credit 16.76% 10.61% 27.37% Capital Gains Exemption — — 50.00% Interest 29.00% 17.41% 46.41% Dividends 16.85% 9.36% 26.22% Capital Gains 14.50% 8.71% 23.21%
Recommended Large Business
Recommended Income Trust 100% Payout 40% Payout
Corporate Profit Before Tax $100.00 $100.00 $100.00 Business Trust/Corporate Taxes $10.00 $36.12 $36.12 Net Corporate Profit After Tax $90.00 $63.88 $63.88 Retained Profits — — $38.33 Cash to Unit/Share Owners $90.00 $63.88 $25.55 Personal Taxes: Income $41.77 — — Dividends — $16.75 $6.70 Capital Gains — — $8.89 Total Taxes $51.77 $52.87 $51.71 Corporate Profits After Total Taxes $48.23 $47.13 $48.29
Parity
7ACCOUNTABILITY RESEARCH
Business Income Trusts
Fair Taxation amongst Business Structures and Canadians
We do not think it is necessary, nor politically pragmatic, for the federal government to achieve income tax parity between business trusts and corporations by eliminating the double taxation of Canada’s large corporations and by continuing to have no direct tax on business trusts. We suggest a blended approach of introducing a modest new income tax on business trusts and increasing the dividend tax credit. A new tax would curtail the creation of new business trusts, while an increase in the dividend tax credit would encourage many corporations with mature businesses and steady cash flows to substantially raise their dividend payouts. Consequently, a new segment of the common equities market would develop comprising “very high dividend” paying equities. These equities would evolve to meet the needs of investors who are seeking higher retirement income than they can achieve from present sources. Investors would get what they need, without the Canadian economy having to pay unnecessary investment banking, legal, and accounting fees for the conversion of corporations into business trusts. Business trusts should be taxed at parity with corporations so that Canadian governments: 1. Are not vulnerable to an erosion of a major portion of the corporate tax base,
which is $29 billion at the federal level. Achievement of tax parity between business trusts and corporations will likely stop the announcements by corporate CEOs that they have a fiduciary duty to shareholders to implement business trust conversions;
2. Are not placing an increasing proportion of the tax burden on non-investing taxpayers, because of an erosion of corporate taxes due to business trust conversions;
3. Are not biasing economic activity between business trusts and corporations, such that there are fewer corporations investing in research and development, productivity enhancing capital spending, and higher-risk capital projects that create future prosperity and jobs;
4. Are not creating gains and fees for selling corporate shareholders and the financial, legal, and accounting industries for conversions that are not necessary to meet investors’ income needs; and
5. Are not continuing to fuel the mania for issuing units of largely unregulated business trusts into the market. Investors will eventually recognize the accounting abuses and the weaknesses in investment bankers’ due diligence on quality and determination of fair valuation. Tax parity between business trusts and corporations will stem the tide of new equity offerings of poor quality business trusts and serve to focus investors’ attention on the real reasons why sellers have found conversion so attractive: insider selling of units at over-valued prices and the raising of cash on terms no other strategic corporate or professional investor could match.
8ACCOUNTABILITY RESEARCH

Business Income Trusts
THE CANADIAN INCOME TRUST MARKET
There are 237 income trusts in Canada, with a market capitalization of $152.1 billion as of November 8, 2005. Seventy percent of the income trusts and 45% of the total market capitalization are in the business trust category. The business trust category is defined in Figure 4 to include power & pipelines and various other businesses. The total business trust category has now grown larger than the oil and gas resource trust segment in terms of market capitalization. Figure 4: Income Trusts by Type
Number Market Cap (millions) Market Cap %
Various Businesses 146 $54,255 36%
Power & Pipelines 19 $13,784 9%
All Business Trusts 165 $68,038 45%
Oil & Gas Resource Trusts 39 $64,041 42%
Real Estate Investment Trusts 33 $19,982 13%
Total of All Trusts 237 $152,062 100%
Source: Bloomberg; Reuters; Accountability Research; As of November 8, 2005 The proliferation of business trusts in Canada is not found in other countries, due in large part to our unique tax policies. While the tax advantage of income trusts has also played a part in the creation of oil and gas resource and real estate income trusts in Canada, other countries also encourage these industries by taxing their real estate and oil and gas resource trusts similar to us. However, we believe that the primary motivation for the conversion of corporations into business trusts in Canada has not been the income tax advantage. Rather, it has been the opportunity for selling owners to receive inflated prices above what professional investors and strategic industry buyers would be willing to offer. The finance, legal, and accounting industries have been able to reap high fees for the unnecessary restructuring of corporations into business trusts. Many of these fees have been inflated by the initial over-valuation of the offering prices (as discussed earlier). The over-valuations are occurring due to accounting abuses associated with the reporting of distributable cash, and cash distributions not being defined as a combination of income and a return of investors’ own money. The misrepresentation of the current cash yield valuation methodology by the issuers and the investment bankers is only adding to the over-valuation and mispricing. Figure 5 shows the breakdown of the income trust market by size. Presently, 62% of business trusts are considered small-cap investments (under $250 million). Small-caps have greater risk because they are less diversified by products and services, number of customers, and geographic markets. The management teams of small businesses tend to be less experienced and there is usually less corporate governance on behalf of the public owners. Also, small cap business trusts are
9ACCOUNTABILITY RESEARCH

Business Income Trusts
more illiquid and a large number of investors would have difficulty selling their positions without causing a major decline in the price. Fewer institutional investors are allowed to buy small-cap business trusts because many investment mandates restrict taking on such risks. Similar to the bankruptcy protection filing of Heating Oil Partners Income Fund (discussed later), there will undoubtedly be more future insolvencies, and significant volatility in the future cash distributions and prices of small-cap business trusts. Figure 5: Business Trusts by Market Capitalization
Number Market Cap ($ millions) Market Cap %
Under $10 million 3 $3.8 0%
$10 - $50 million 14 $482.9 1%
$50 - $100 million 38 $2,755.7 4%
$100 - $250 million 48 $7,746.4 11%
$250 - $500 million 29 $10,058.1 15%
$500 million - $1 Billion 17 $12,056.8 18%
Over $1 Billion 16 $34,934.5 51%
Total 165 $68,038.2 100%
Source: Bloomberg; Reuters; Accountability Research; As of November 8, 2005 The investment banks are selling too many small-cap business trusts that are unsuitable investments for investors whose investment objectives are secure income and capital preservation. Many of these income-seeking investors are retirees who cannot afford to absorb significant investment losses after their working lives.
DISTRIBUTIONS FUNDAMENTALLY NOT SUSTAINABLE
We have updated and expanded our May 2005 review of the largest business trusts in the Canadian market. We remain focused on the business trusts, as opposed to oil and gas resource trusts and REITs, because we believe it is the area where the most market abuse is occurring, and where the most over-valuation exists. We also believe that the business trust segment will bear the brunt of any change in federal government tax policy towards the trusts, given the more global acceptance of REITs and oil and gas resource trusts. Figure 6 shows a summary comparison of the scope of our May 2005 review with our current report. While there are slight differences, the basic approach has remained the same. Although the median ratio of cash distributions to distributable cash for the 50 largest trusts has increased slightly, this is mostly irrelevant because the reported figures are incomparable across companies. Because the denominator in the ratio (distributable cash) is arbitrarily defined by each management team, the average
10ACCOUNTABILITY RESEARCH

Business Income Trusts
or median lacks any sense of absolute meaning. Perhaps nothing explains this better than the wide range of distributions-to-distributable cash ratios that exists (42% to 116%) amongst the largest business trusts. Figure 6: Comparison of May 2005 Report with Current Review
Current Report May 2005 Report
Universe The 50 largest business trusts Business trusts greater than $250 million market cap
Period Trailing twelve month data ending closest to June 30, 2005
Trailing twelve month data ending closest to Dec 31, 2004
# of trusts 50 42
Market cap of smallest trust About $207 million $250 million
Median cash ratio (cash distribution divided by distributable cash) 90% 87%
Median cash yield (cash distribution divided by price) 8.9% 7.4%
% of trusts reporting cash distributions greater than net income 74% 79%
% of trusts with cash ratio greater than 100% 22% 17%
Nevertheless, it is still useful to track the changes in distributions-to-distributable cash ratios over time for individual business trusts, as it can be a tip-off to unsustainable cash distributions in the short-term. While there is nothing to stop companies from changing their make-up of distributable cash on the fly, this would normally be done to improve appearances. However, Figure 7 highlights companies whose trailing twelve month (TTM) distributions-to-distributable cash ratios have significantly deteriorated during the first six months of 2005. Figure 7: Business Trusts with Deteriorating TTM Distributions-to-Distributable Cash Ratios
Distributions-to-Distributable Cash Ratio
June 30/05 Dec 31/04 Deterioration
SFK Pulp 105.6% 72.8% 32.8%
Parkland Income Fund 106.7% 82.5% 24.2%
Cineplex Galaxy 116.2% 93.6% 22.6%
Brick Group* 109.3% 87.7% 21.7%
Osprey Media* 98.8% 79.5% 19.4%
KCP Income Fund 108.9% 99.5% 9.3%
Chemtrade Logistics 102.6% 96.8% 5.8%
*Dec. 31/04 ratios for The Brick Group and Osprey Media are based on partial year results.
Note: Increases in TTM distributions-to-distributable cash ratios are an indicator of possible problems in sustaining future cash distributions. Distributions-to-distributable cash ratios over 100% not only indicate that distributions exceed what management says it has, but what management says it has is usually an exaggeration of what it actually has, based on net income.
Source: Accountability Research
11ACCOUNTABILITY RESEARCH

Business Income Trusts
While distributions-to-distributable cash ratios can sometimes reveal shorter-term instability, they cannot be relied upon to effectively screen for problem trusts. In order to unearth longer-term instability, we must address the lack of utility with respect to distributable cash figures. In our recent review, we again found wide discrepancies in distributable cash reporting. This is largely due to the fact that no accounting or securities regulatory body has taken steps to standardize the reporting of distributable cash. Figure 8 presents an illustration of the added garbage-in, garbage-out problem surrounding valuations that rely on unregulated and incomparable distributable cash figures. The lack of comparability and reliability that results from trust managers calculating their own distributable cash is on top of the lack of utility that already exists within the definitions of net income due to loose Canadian accounting rules for calculating net income.
Figure 8: Average Business Trust Calculation of Distributable Cash
Origin Reliability & Comparability Scale
Net Income GAAP accounting rules 50% + Depreciation and Amortization GAAP accounting rules 50% +/- Other Adjustments GAAP accounting rules 50% = CFO before changes in working capital GAAP accounting rules 50% +/- Changes in working capital GAAP accounting rules 50% = Cash flow from operations GAAP accounting rules 50% +/- Changes in working capital GAAP accounting rules 50% - Maintenance Capex Arbitrary management allocation 0% +/- Other Adjustments Arbitrary management allocation 0% = Distributable Cash Incomparable/Unregulated figure 0% Distributions Declared Set by the Board n/a / Distributable Cash Incomparable/Unregulated figure 0% = So-called “payout ratio” Incomparable/Unregulated figure 0%
Garbage In
Garbage Out
DISTRIBUTABLE CASH FIGURES EASILY MANIPULATED
Figure 9 provides the hard data for the 50 largest business trusts to back up the financial reporting credibility problem illustrated above. In sum, the 50 largest business trusts reported $2.2 billion in net income, but ignored enough expenses to claim that $3.6 billion of distributable cash existed. The action of eliminating expenses that would normally have to be recognized under accounting rules is very reminiscent of the financial reporting games that were played during the technology investing bubble a few years back. The bulk of the problem can be traced to the gap between depreciation expenses and maintenance capex. However, inadequate working capital allowances cannot be ignored. Distributable cash ignores standard depreciation expenses in favour of using short-term management estimates of capital spending needs. In total, the 50 largest business trusts ignored $1.52 billion in depreciation expenses, but added
12ACCOUNTABILITY RESEARCH

Business Income Trusts
back only $491 million in maintenance capex allocations. The roughly $1 billion shortfall obviously has worried the federal government because investments in new technology are needed to keep Canada competitive across the world. Figure 9: The Average Characteristics of the 50 Largest Business Trusts
Total in millions
Average in millions
As % of Distributable Cash
Net Income $2,165 $43.3 59.7% Depreciation and Amortization $1,520 $30.4 41.9% Other Adjustments $156 $3.1 4.3% Changes in working capital -$214 -$4.3 -5.9%
Cash flow from operations $3,626 $72.5 100.0% Changes in working capital $214 $4.3 5.9% Maintenance Capex -$491 -$9.8 -13.5% Other Adjustments $279 $5.6 7.7%
Distributable Cash $3,628 $72.6 100.0% Distributions Declared $3,418 $68.4 94.2% Increase in Cash Reserve $210 $4.2 5.8%
In essence, extra cash is being returned to unitholders through distributions that exceed net income funded by management skimping on the maintenance and replacement of worn out capital assets. This would be acceptable for some trusts over the short-term if capital spending needs are temporarily lower than they have been in previous years. However, many investors are assuming that capital spending requirements have been permanently lowered and are valuing many trusts on that basis. When capital spending eventually increases again, the cash excess that was used to pay distributions will no longer be available. If capital spending does not return to normal levels, the income-generating ability of the company starts to erode. (We discuss the consequences of this in more detail later in our report.) Accounting depreciation represents the smooth recognition of wearing down capital assets to an unusable condition, at which point more money is needed to replace those assets. In other words, capital assets should theoretically be replaced when they are fully depreciated. While this isn’t always the case (because some companies are known to carry very useful assets at no cost), this assumption is broadly valid when examining the 50 largest business trusts as a group. In other words, some companies at certain times in their investment life cycles will be able to invest less in capital assets. In such cases, it would be acceptable for these companies to report maintenance capital expenditure estimates that are less than the depreciation expenses that they ignore when calculating distributable cash. However, the total weight of evidence points to the fact that businesses cannot permanently report maintenance capex estimates that are well below their reported depreciation expenses. Therefore, the valuations attached to such business trusts should not capitalize understated maintenance capex estimates as permanent benefits.
13ACCOUNTABILITY RESEARCH

Business Income Trusts
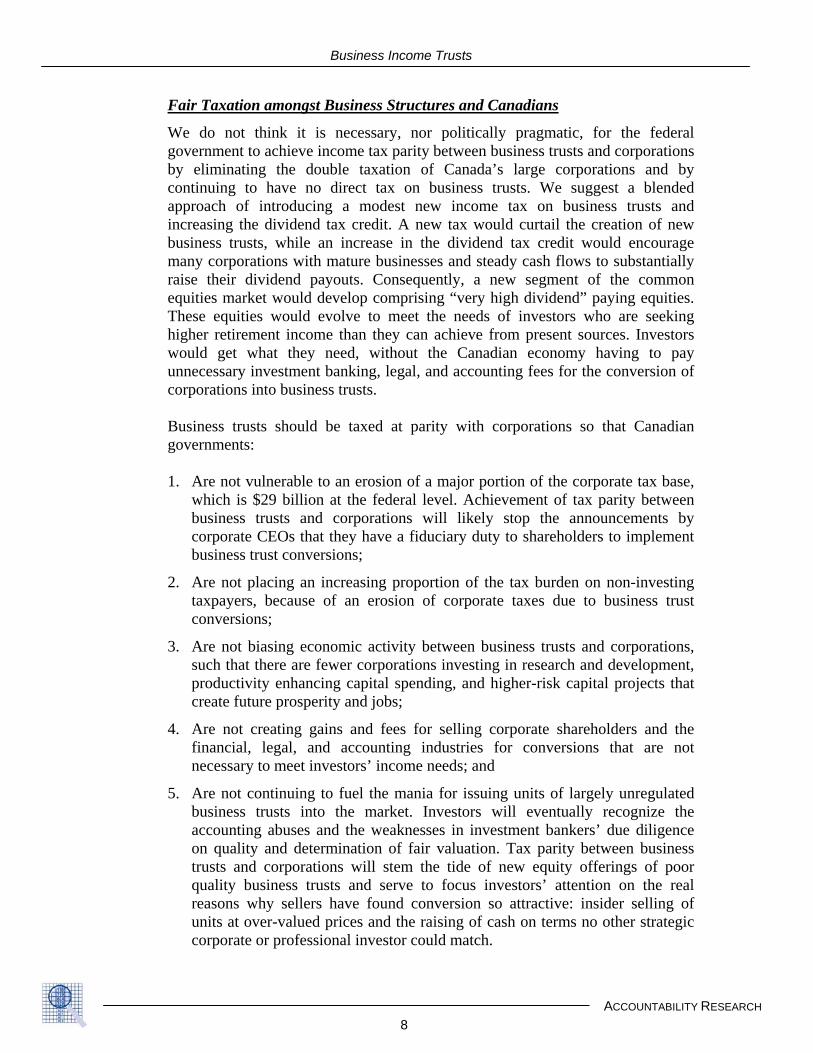
The total maintenance capex of the business trusts (as estimated by management) averages just 32% of the total depreciation and amortization expense they are required to report under standardized accounting rules. This has created a fundamental mismatch between income and distributable cash, because the “costs” incurred to earn the “revenue” under the distributable cash method are being systematically under-reported. Without recording the full costs used to earn revenue, the recognized basis for business valuation is destroyed. Figure 10 details how estimated future maintenance capex spending is pervasively undershooting the income statement recognition of previous capital spending for the individual business trusts. Given that 47 of the 50 largest business trusts estimated maintenance capex that was lower than their trailing twelve month depreciation expenses, we are seriously concerned about the longer-term stability and valuation of many trusts. This is not to say that the cash needed to meet current cash distributions cannot be secured in the future. It simply means that capital spending replacement programs might have to be financed with future debt, additional equity, or a cut to future distributions. As we explain later, an immediate distribution cut would actually make more fundamental sense than the dilution of continued equity offerings. However, such a recognition would be predicated on the market valuing the business trusts on a fundamental basis as opposed to the inflated valuations currently being placed on new offerings and in research governing the secondary market. In order for distributable cash to represent a basis for business valuation over the longer-term, maintenance capex must take into account the eventual replacement of much of the company’s capital assets. Essentially, we are willing to accept distributable cash as a short-term cash budgeting tool. However, we cannot accept it as the basis for a longer-term valuation of an entity (which normally would be some form of standardized income-generating ability). In essence, the validity of distributable cash comes down to the specific adjustments made by the management of each business trust. And, in our opinion, the average adjustments made amongst the 50 largest business trusts are clearly inappropriate, and leading to inflated trusts values. While some issuers and investment bankers might argue that depreciation expenses are overstated for various reasons, there are also grounds to consider that they might actually be understated. For instance, intangible assets are no longer regularly amortized, but must still be purchased. As well, depreciation expenses based on old historical costs could easily be understated in relation to replacement costs moving forward because of the impact of the time value of money and inflation. In short, there is nothing that we think reasonably explains the wide, pervasive gap between depreciation expenses and management capex estimates. And, quite to the contrary, there are several reasons to be seriously concerned.
14ACCOUNTABILITY RESEARCH
Business Income Trusts
Figure 10: TTM Maintenance Capex as a Percentage of Depreciation Expense
Maintenance Capex as % of Depreciation Expense
Avenir Diversified 0% Energy Savings 0% Labrador Iron Ore 0% North West Company 0% Peak Energy Services 0% TimberWest Forest Group 0% Trinidad Energy Services 0% Westshore Terminals 0% Cathedral Energy Services 3% Yellow Pages 7% Keyera Facilities 7% Chemtrade Logistics 10% Medical Facilities - IDS 11% Brick Group 11% Tree Island Wire 12% Gateway Casinos 14% Livingston International 14% Altagas Income Fund 17% Cineplex Galaxy 18% Osprey Media 19% Superior Plus 20% Arctic Glacier 21% Connors Bros. 22% Canexus Income Fund 28% Atlas Cold Storage 28% Great Lakes Carbon 30% BFI Canada 30% Royster-Clark - IDS 32% SFK Pulp 39% Noranda Income Fund 40% Newalta Income Fund 42% Parkland Income Fund 42% KCP Income Fund 43% Consumers' Waterheater 43% TransForce Income Fund 43% CCS Income Trust 44% Rogers Sugar 45% Spinrite Income Fund 46% Foremost Industries 53% Contrans Income Fund 63% Davis + Henderson 69% Fording Canadian Coal 69% Sleep Country 70% UE Waterheater 77% Canwest Media Works 82% Mullen Group 94% Bell Nordiq 96% Aeroplan Income Fund >100% CML Healthcare >100% Wajax Income Fund >100% Median 29% Average 32%
15ACCOUNTABILITY RESEARCH

Business Income Trusts
What is Sustainable?
At the very core of financial reporting is the need to ensure a fundamental distinction between earned income and the capital contributions of owners. Without a clear separation, financial statements lose much of their meaning and usefulness in terms of determining underlying business value. When investors misinterpret a cash distribution to be income when it is not, the income generating ability (and perceived value) of the investment becomes inflated in comparison to companies that are returning actual income to investors. A cash distribution yield simply cannot be compared to a traditional income yield. For common equities, investors routinely examine the ratio of dividends to net income, in order to establish the sustainability of current dividends and the current dividend yield. Income-seeking investors usually steer clear of equities with dividend payout ratios that persistently exceed 100%, since the dividends will likely soon be cut. Therefore, why should investors ignore that same concept with a business trust that is issuing distributions in excess of its sustainable income? In general, we believe that investors are being misinformed by investment bankers and issuers alike. Fee revenue and the ability to sell companies at inflated prices are clouding certain people’s statements concerning the sustainability of many business trusts’ distributions. Figure 11 lists the 50 largest business trusts, and shows for each what proportion of the current cash distribution yield is backed by income in the trailing twelve month period ending June 30, 2005. A wide discrepancy exists in terms of how much an individual business trust’s cash distribution yield is supported by reported net income. Because Figure 11 is based on the most recent 12-month results, some business trusts might be impacted by an unusually good or bad year from an income perspective. However, the pervasive manner in which distributions exceed net income cannot be explained simply by some trusts having bad years or one-time expenses. Once again, the weight of the evidence cannot be explained other than to conclude that many business trusts are issuing cash distributions at an unsustainable rate.
16ACCOUNTABILITY RESEARCH

Business Income Trusts
Figure 11: Breakdown of Cash Yield Highlighting Proportion Covered by TTM Net Income (Current cash yield as of November 8, 2005)
Income as % of Distributions
Current Cash Yield
Income Portion
Potential Return of Capital
Medical Facilities - IDS Net loss 10.90% 0.00% 10.90% Parkland Income Fund Net loss 10.63% 0.00% 10.63% Royster-Clark - IDS Net loss 11.54% 0.00% 11.54% BFI Canada 15.0% 6.55% 0.98% 5.57% Canwest Media Works 15.4% 10.21% 1.57% 8.64% TimberWest Forest Group 19.0% 7.77% 1.47% 6.29% Consumers' Waterheater 30.8% 7.98% 2.46% 5.53% Cineplex Galaxy 31.7% 8.71% 2.76% 5.95% Avenir Diversified 34.1% 12.54% 4.28% 8.26% Chemtrade Logistics 34.7% 11.57% 4.01% 7.56% SFK Pulp 40.8% 7.94% 3.24% 4.71% Energy Savings 43.6% 5.46% 2.38% 3.08% Brick Group 43.7% 13.36% 5.85% 7.52% Great Lakes Carbon 44.2% 14.17% 6.26% 7.91% Arctic Glacier 49.2% 10.48% 5.15% 5.33% Osprey Media 54.6% 13.04% 7.12% 5.92% Aeroplan Income Fund 55.7% 5.73% 3.19% 2.54% Wajax Income Fund 56.8% 9.18% 5.22% 3.97% KCP Income Fund 56.9% 10.71% 6.10% 4.61% Yellow Pages 59.2% 6.51% 3.85% 2.66% Noranda Income Fund 60.2% 9.56% 5.75% 3.81% Keyera Facilities 62.2% 7.94% 4.94% 3.01% Superior Plus 62.9% 11.57% 7.28% 4.29% Mullen Group 65.5% 6.92% 4.53% 2.39% Livingston International 70.6% 7.58% 5.35% 2.23% Connors Bros. 70.8% 12.67% 8.96% 3.70% Contrans Income Fund 75.2% 11.07% 8.32% 2.75% Peak Energy Services 75.8% 9.23% 7.00% 2.24% Canexus Income Fund 78.9% 10.06% 7.94% 2.12% Newalta Income Fund 83.5% 8.61% 7.19% 1.42% Gateway Casinos 88.6% 9.26% 8.21% 1.06% Westshore Terminals 88.6% 8.60% 7.62% 0.98% Trinidad Energy Services 88.8% 6.92% 6.15% 0.77% Spinrite Income Fund 92.9% 11.46% 10.64% 0.82% Altagas Income Fund 94.1% 7.30% 6.87% 0.43% Tree Island Wire 94.5% 14.66% 13.86% 0.80% Fording Canadian Coal 99.0% 5.16% 5.16% 0.00% Bell Nordiq >100% 6.87% 6.87% 0.00% Cathedral Energy Services >100% 4.55% 4.55% 0.00% CCS Income Trust >100% 4.03% 4.03% 0.00% CML Healthcare >100% 7.55% 7.55% 0.00% Davis + Henderson >100% 8.07% 8.07% 0.00% Foremost Industries >100% 4.53% 4.53% 0.00% Labrador Iron Ore >100% 5.81% 5.81% 0.00% North West Company >100% 6.62% 6.62% 0.00% Rogers Sugar >100% 10.98% 10.98% 0.00% Sleep Country >100% 7.28% 7.28% 0.00% TransForce Income Fund >100% 8.68% 8.68% 0.00% UE Waterheater >100% 7.03% 7.03% 0.00% Atlas Cold Storage No distributions 0.00% n/a n/a Average 63.3% 7.85% 4.97% 2.88%
17ACCOUNTABILITY RESEARCH

Business Income Trusts
ASSESSING REASONABLE FAIR VALUE
Having established why cash distribution yields represent a flawed investment approach that has created inflated prices in the business trust market, we now turn to determining the sustainable value of the business trusts. By calculating the present value of future net income, we can more reasonably assess the impact of issuing distributions in excess of net income, and the impact of eroding the capital base of the company. Selecting a Discount Rate for Valuation
In our analysis, we have used a discount rate of 8.35% on cash paid out by both business trusts and corporations, where the cash payout rates are 100% or more, and we have used a discount rate of 16.7% on retained earnings for the corporations. The discount rate for the cash paid out is the 30-year Canadian bond yield plus a 4% risk premium, which is the average risk premium on U.S. junk bonds relative to U.S. risk-free government bonds. Canada does not have a junk bond market and the high cash distributions of business trusts make these securities similar to junk bonds. Certainly the business trusts carry the risk of junk bonds, and thus deserve a risk premium that is at least as great as the U.S. junk bond market. In fact, business trusts probably possess greater risk than U.S. junk bonds, since their cash distributions and principal values are not guaranteed, nor do they have any creditor rights during bankruptcy proceedings. Our discount rate for retained earnings contains a 12% risk premium to reflect investors’ strong preference for cash distributions rather than for the retention of earnings. Retained earnings lead to future capital gains that are more uncertain than expected cash distributions receivable over the short term. The discount rates we have selected for the cash dividends and retained earnings of corporations with 40% dividend payout rates are consistent with the average discount rate and P/E implicit in Canada’s largest mature public corporations. Figure 12 shows the U.S. junk bond risk premium over time, which stands as a reminder that not only might interest rates rise, but that the risk premium can also move (as it has in a wide range from 2% to 7% during the past 10 years). When economic conditions deteriorate, we would expect substantial pressure on prices in the business trust market, due to expanding risk premiums in the U.S. corporate junk bond market.
18ACCOUNTABILITY RESEARCH

Business Income Trusts
Figure 12: U.S. Junk Bond Spread (Government over Single B Corporate Composite)
0.0%
1.0%
2.0%
3.0%
4.0%
5.0%
6.0%
7.0%
8.0%
Jan-
95
Jan-
96
Jan-
97
Jan-
98
Jan-
99
Jan-
00
Jan-
01
Jan-
02
Jan-
03
Jan-
04
Jan-
05
The interest rate sensitivity of business trusts is very high, with prices likely to fall 14% in response to a 1% increase in rates. Conversely, prices could rise 19% if rates were to decline 1%. The sensitivity of the average business trust’s valuation to changes in interest rates is shown in Figure 13. Such a variation in itself shows how immature business trust pricing has been, as long-term horizons are being attributed to short-term cash flow expectations. Figure 13: Impact of Higher Interest Rates on the Valuation of the Average Business Trust
-2.0% -1.0% Even +1.0% +2.0%
Junk bond rate 6.35% 7.35% 8.35% 9.35% 10.35%
Fair value avg. trust (millions) $1,015 $826 $696 $601 $529
Historical Investment Performance of Income Trusts
We have serious concerns about the valuation of the business trust market, as income-seeking investors pour in new money based on recent historical price performances. The oil and gas resource and real estate income trusts have had stellar returns for the sound reasons of dramatic energy price increases and interest rate decreases since 2001. Energy prices are at all-time highs and interest rates are at historical lows, thus the oil and gas resource trusts and real estate trusts could well be at their cyclical peaks. Business trusts, however, have serious questions surrounding their valuation that are not related to expected changes in economic conditions. Figure 16 shows that income trusts have had a long period of strong performance, with the S&P/TSX Income Trust Composite Index up 72% since January 1, 2001.
19ACCOUNTABILITY RESEARCH

Business Income Trusts
The oil and gas resource trust sub-index, which represents 45% of the market, has increased 80% since January 1, 2001, as shown in Figure 17. The oil and gas resource trusts have been fueled by crude oil prices skyrocketing by 161% over the period, to a peak of $70 per barrel on September 1, 2005. Figure 18 shows that the real estate trusts have also performed well, albeit not to the extent of the oil and gas sector. Real estate trusts have appreciated 49% since 2001, with the wind of declining interest rates enhancing performance. Investment bankers have been flooding the market with business trusts to meet the maniacal demand of retail investors attracted to the historical performance of the overall trust sector, and the inflated cash distribution yields contained in investment banker marketing materials and equity research reports. The Federal Department of Finance (DoF) and Federal Finance Minister Ralph Goodale are being inappropriately blamed for the recent declines in income trust prices. Figure 16 shows that the S&P/TSX Income Trust Composite Index peaked just prior to the DoF’s September 19, 2005 announcement that it would no longer issue advance tax rulings for the conversion of corporations into income trusts. Since September 16th, as shown in Figure 14, the market capitalization of all business trusts is down almost $10 billion, or 12.5%. By comparison, all income trusts are down over $15 billion as of November 8, 2005, which was an improvement in the $23 billion decline that existed on October 10, 2005. Since September 16th, crude oil has declined 6% and the Canadian long bond market has declined 5%. Figure 16 shows that oil and gas trusts and real estate trusts represented $5.5 billion of the decline. The oil and gas trusts and real estate trusts have each declined about 7% since September 16th, which is explained by the deterioration in crude oil and Canadian long-term interest rates. Figure 14: Decline in Income Trust Market Caps since September 16, 2005 (In millions)
Nov 8/05 Sept 16/05 Decline
50 Largest Business Trusts $43,522 $51,027 -$7,505 All Business Trusts $68,038 $77,784 -$9,746 Oil & Gas Resource Income Trusts $64,041 $68,256 -$4,215 Real Estate Income Trusts $19,982 $21,295 -$1,313 All Income Trusts $152,062 $167,335 -$15,273
Source: Bloomberg; Reuters; Accountability Research It appears that the market is not expecting any tax increase for oil and gas trusts or real estate trusts, which makes sense given that previous government policy intended these sectors to be tax-advantaged, and are supported in the same manner in many other countries.
20ACCOUNTABILITY RESEARCH

Business Income Trusts
Figure 15: Income Trust Price Performance by Type (Since September 16, 2005)
80.0
85.0
90.0
95.0
100.0
105.0
110.0
9/17
/200
5
9/20
/200
5
9/23
/200
5
9/26
/200
5
9/29
/200
5
10/2
/200
5
10/5
/200
5
10/8
/200
5
10/1
1/20
05
10/1
4/20
05
10/1
7/20
05
10/2
0/20
05
10/2
3/20
05
10/2
6/20
05
10/2
9/20
05
11/1
/200
5
11/4
/200
5
Inde
x B
ased
to 1
00Oil & Gas Resource Real Estate Business Canadian Long Term Bonds
Figure 16: All Income Trusts Price Performance (Since January 1, 2001)
80.0
100.0
120.0
140.0
160.0
180.0
200.0
12/3
0/20
00
3/30
/200
1
6/30
/200
1
9/30
/200
1
12/3
0/20
01
3/30
/200
2
6/30
/200
2
9/30
/200
2
12/3
0/20
02
3/30
/200
3
6/30
/200
3
9/30
/200
3
12/3
0/20
03
3/30
/200
4
6/30
/200
4
9/30
/200
4
12/3
0/20
04
3/30
/200
5
6/30
/200
5
9/30
/200
5
Inde
x R
ebas
ed to
100
All Income Trusts (RTCM) Canadian Long Term Bonds
21ACCOUNTABILITY RESEARCH

Business Income Trusts
Figure 17: Oil & Gas Resource Trusts Price Performance (Since January 1, 2001)
8/30
/200
5
10/3
0/20
05
70.0
120.0
170.0
220.0
270.0
320.0
12/3
0/20
00
2/28
/200
1
4/30
/200
1
6/30
/200
1
8/30
/200
1
10/3
0/20
01
12/3
0/20
01
2/28
/200
2
4/30
/200
2
6/30
/200
2
8/30
/200
2
10/3
0/20
02
12/3
0/20
02
2/28
/200
3
4/30
/200
3
6/30
/200
3
8/30
/200
3
10/3
0/20
03
12/3
0/20
03
2/29
/200
4
4/30
/200
4
6/30
/200
4
8/30
/200
4
10/3
0/20
04
12/3
0/20
04
2/28
/200
5
4/30
/200
5
6/30
/200
5
Inde
x R
ebas
ed to
100
Oil & Gas Resource Income Trusts Crude Oil
Figure 18: Real Estate Income Trusts Price Performance (Since January 1, 2001)
8/30
/200
5
10/3
0/20
05
80.0
90.0
100.0
110.0
120.0
130.0
140.0
150.0
160.0
170.0
12/3
0/20
00
2/28
/200
1
4/30
/200
1
6/30
/200
1
8/30
/200
1
10/3
0/20
01
12/3
0/20
01
2/28
/200
2
4/30
/200
2
6/30
/200
2
8/30
/200
2
10/3
0/20
02
12/3
0/20
02
2/28
/200
3
4/30
/200
3
6/30
/200
3
8/30
/200
3
10/3
0/20
03
12/3
0/20
03
2/29
/200
4
4/30
/200
4
6/30
/200
4
8/30
/200
4
10/3
0/20
04
12/3
0/20
04
2/28
/200
5
4/30
/200
5
6/30
/200
5
Inde
x B
ased
to 1
00
Real Estate Income Trusts Canadian Long Term Bonds
22ACCOUNTABILITY RESEARCH

Business Income Trusts
The $10 billion decline in business trust market capitalization since September 16th does appear to include some damage due to an expectation that the DoF will impose a new tax on business trusts. The business trusts are down 12.5%, aided by the 5% decline in Canadian long bond prices since September 16th. Our recommended blended solution of a tax on business trusts and a higher dividend tax credit would cause $5 billion of damage to the current business trust market capitalization (calculated on the basis of a 7% decline in the total business trust capitalization of $77.8 billion as of September 16th). Thus, if this blended solution were adopted there should be no further material decline in business trust prices due to the tax issue. This $5 billion decline due to the blended tax solution is about 17% of the total $30 billion decline that is possible in the business trust market relative to its September 16th market cap. The remaining $25 billion of decline would be attributable to the evaporation of the over-valuation caused by flawed current cash distribution yield methodologies. The timing of the remainder of the $25 billion correction is dependent upon investors recognizing that they paid too high a price for cash distributions, with a large component being a return of their own money. Without the introduction of a modest new tax on business trusts, the likely future decline in total business trust values is $15 billion. If the new modest tax on business trusts is adopted, then the further decline would be $20 billion from November 8th levels. Later in this report, Figure 27 shows a summary of our business trust market cap valuations, including three scenarios each for the possibility of no tax change, and also the adoption of our recommended solution. Poor Performance of Business Trust Offerings
The serious decline of several business trusts is already evident, with 22 having declined 30% or more since their IPO or latest subsequent offering. These declines are likely being masked in portfolios with successful oil and gas trusts and real estate trusts. Some of the decliners have had more than one offering of units that has dropped more than 30%, as shown in Figure 19. In total, these 22 trusts alone have lost about $2.1 billion from their total IPO and subsequent offering values, representing an average loss of 52%.
23ACCOUNTABILITY RESEARCH

Business Income Trusts
Figure 19: Business Trusts Offerings Down More Than 30% As of November 9, 2005 (In millions of dollars)
Date Offering Value Current Value Decline
Heating Oil Partners 5/9/2002 $135.0 $0.00 -100% Heating Oil Partners 7/22/2004 $30.2 $0.00 -100% Advanced Fiber 3/28/2002 $130.8 $10.5 -92% Specialty Foods 3/13/2003 $201.3 $56.4 -72% Art in Motion 8/3/2004 $80.3 $23.7 -71% SFK Pulp 8/1/2002 $444.4 $151.5 -66% Associated Brands 11/15/2002 $117.6 $42.6 -64% Clearwater Seafood 7/31/2002 $232.9 $85.0 -64% Arriscraft International 12/14/2004 $66.8 $24.7 -63% Boyd Group 2/28/2003 $9.0 $3.6 -60% General Donlee 5/3/2002 $89.5 $39.5 -56% Clean Power 11/14/2002 $75.5 $34.6 -54% Menu Foods 5/22/2002 $129.0 $60.0 -54% Clean Power 11/14/2001 $212.0 $99.2 -53% Clean Power 7/29/2003 $32.0 $15.0 -53% Atlas Cold Storage 10/23/2002 $101.2 $52.2 -48% Atlas Cold Storage 9/6/2002 $85.0 $44.5 -48% FMF Capital 3/24/2005 $197.5 $105.7 -47% Atlas Cold Storage 11/23/2001 $55.0 $31.4 -43% Canwel Building 5/18/2005 $125.0 $74.1 -41% Entertainment One 11/4/2003 $141.4 $85.7 -39% Entertainment One 6/1/2005 $70.0 $42.4 -39% Canwel Building 5/13/2004 $43.5 $26.4 -39% Atlas Cold Storage 7/27/2001 $35.0 $21.8 -38% Connors Bros. 1/13/2005 $115.6 $74.2 -36% Hot House Growers 12/23/2003 $66.0 $43.6 -34% Connors Bros. 3/22/2004 $262.5 $175.9 -33% Osprey Media 4/15/2004 $204.0 $137.1 -33% Sun Gro 2/27/2002 $220.2 $149.8 -32% Atlas Cold Storage 3/6/2001 $37.0 $25.3 -31% Connors Bros. 9/29/2004 $93.4 $64.9 -31% Tree Island 10/13/2004 $76.7 $53.6 -30% Total $3,990.4 $1,906.0 -52%
Business Trust IPO Performances Worse Than Common Equity Offerings
Figure 20 shows there have been 114 business trust IPOs since January 1, 2001, which raised $16.6 billion. However, choosing the best business trust IPOs has been more like playing darts. If you had invested $1,000 in every business trust IPO since January 1, 2001, your portfolio would be up about 4% in value (excluding cash distributions). This might be what one would expect from an asset class that is erroneously characterized as being comprised of mature businesses with high stable cash flows. However, the extreme range of business trust price performance amongst individual IPOs, and the near 50:50 odds of winning or losing, is a frightening observation of the facts. Figure 22 shows that 58 of the business trust IPOs are down in price, and 56 are up in price since their initial offerings.
24ACCOUNTABILITY RESEARCH

Business Income Trusts
Business trust IPOs have a performance record that is worse than the 78 common equity IPOs on the TSX during the last five years, which is alarming for an asset class that is supposed to be suitable for customers seeking preservation of capital. As one might expect, the equity IPO portfolio has provided a much greater increase in value of 196% (compared to just 4% for the business trusts). As well, 63% of the common equities increased in value since their IPO (versus 49% for the business trusts). Figure 20: IPO Market for Business Trusts versus Common Equities (Since January 1, 2001)
IPOs Total Offering Value
# Down from Offering
# Up from Offering
# Down More than 30%
Total Market Cap Increase*
Income Trusts 114 $16,558 M 58 56 18 4%
Corporations 78 $7,500 M 29 49 16 196%
* Total market cap increase calculated on equal weight for each offering
Source: Bloomberg; Reuters; Accountability Research; Current prices at November 9, 2005 As shown in Figure 21, there is a very wide dispersion of performance for business trust IPOs, and relatively poor odds of avoiding losers. These problems raise some serious questions: 1. Is there sufficient due diligence being performed by the investment bankers on
business trust IPOs, especially given that they are being targeted at retail clients whose objectives include secure retirement income and preservation of capital?
2. Why is there not more critique of the quality and pricing of these IPOs from
institutional investors? Are they avoiding the worst of them en mass, and leaving them to be taken up entirely by retail investors?
3. Are the equity research professionals at the investment banks independently
assessing the quality and fair pricing of the business trust IPOs at the time of their offerings, or in the aftermarket?
4. Who within the investment banks are responsible for overseeing the
determination of whether specific business trusts are suitable for investors with the objectives of secure retirement income and preservation of capital, and what percentage of portfolios can safely be committed to business trusts?
25ACCOUNTABILITY RESEARCH

Business Income Trusts
Figure 21: Performance of Income Trusts and Common Equity IPOs (IPOs Since January 1, 2001 & Current Prices as of November 9, 2005)
0.0%
5.0%
10.0%
15.0%
20.0%
25.0%
30.0%
35.0%
< -80%
-60% to
-80%
-40% to
-60%
-20% to
-40%
0% to
-20%
0% to
20%
20% to
40%
40% to
60%
60% to
80%
>80%
Percentage Price Change
Perc
enta
ge o
f IPO
s in
the
Cat
egor
yIncome Trusts Corporations
First Business Trust Bankruptcy Filing
Heating Oil Partners Income Fund was the first business trust to file for bankruptcy protection on September 26, 2005. Notwithstanding the claim that business trusts are mature and stable, the financial collapse occurred just three years after its $135.0 million IPO and just more than a year after a $30.2 million subsequent offering of units. Total investment banking fees from Heating Oil Partners were $9.3 million. Heating Oil Partners is one of the largest residential heating oil distributors in the United States. It was unable to recover from soaring energy prices that have squeezed margins at a time when its customer base had been eroding. Given the level of financing that was provided by secured creditors, it is unlikely that unitholders will receive anything. The units have been de-listed from the TSX. What is disturbing about the situation is that Heating Oil Partners reported net losses in its three years prior to becoming a trust, and also in the three years afterwards. Nevertheless, the investment bankers decided that it was a stable business worthy of being marketed to income-seeking investors.
26ACCOUNTABILITY RESEARCH

Business Income Trusts
Business Trust Takeovers Provide Limited Chance of Relief
Agrium Inc. announced on November 8, 2005 that it will make an offer for the outstanding units of Royster-Clark for $10 per unit. Royster-Clark just went public at that price on July 13, 2005. The units had performed very poorly since being converted to a trust-like structure, down as much as 27% at one point this summer. The move to repackage the company and sell it to income-seeking investors seemed highly questionable given a debt-to-equity ratio that was in the stratosphere, and the fact that the company had lost money in three straight years prior to its conversion to a trust. Investment banking fees on the offering were $17.9 million. Fortunately, in the Royster-Clark case, there was a strategic industry buyer to bail out the losing position of the recent IPO investors. Takeovers normally include a control premium of between 20% and 40%. Unfortunately, the owners of most current business trusts will not be able to rely on takeover offers to attain their goal of preservation of capital. The Royster-Clark offering failed because it was over-priced from the start, and supports our argument that trust IPO valuations have to be priced substantially lower, commensurate with the sustainable earnings power of the underlying businesses. Future Declines in Distributions and Prices of Business Trusts
Our analysis of the 50 largest business trusts leads us to conclude that they are fundamentally over-valued. The timing of the decline in value is dependent upon when investors realize that cash distribution yields are not what they have been marketed to be. Prior to the September 19th DoF announcement, the average cash distribution yield was 6.7%, with just 4.2% of that amount backed by reported net income. However, we believe that business trusts should be providing internal rates of investment return of at least 8.35% (the junk bond rate discussed earlier). A business trust that pays out all of its earnings, let alone 158% of its earnings, cannot be expected to grow significantly over the long-term (if at all). We have estimated the fair value of the average business trust by using a long-term growth rate of 2%. We believe that the over-pricing of the average business trust is occurring because the average 6.7% cash yield is being discounted at a rate of 6.35% (the 8.35% junk bond yield less the assumed 2% growth rate). Instead, we think that the average income portion of the yield of 4.2% should be discounted at 6.35%. The consequence of the inflated cash yield is that business trust prices are grossed up by 1.58 times. Put another way, when business trust investors realize that their average 6.7% cash distribution yield is more than one-third a return of their own money, unit prices could fall by roughly that same amount (i.e., 32%) from their September 16th levels.
27ACCOUNTABILITY RESEARCH

Business Income Trusts
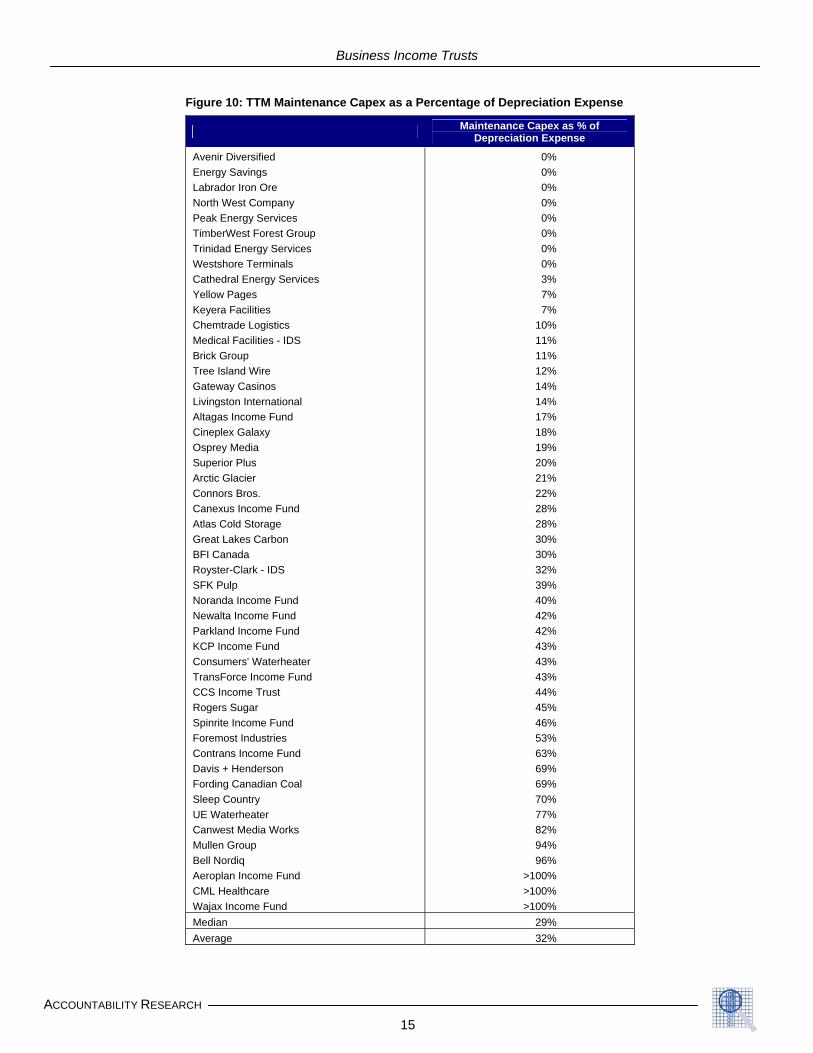
We have summarized the pre-September 19th announcement fair values for the average business trust in Figure 22. At the time, the market cap of the average business trust was $1,020 million, with an average cash distribution yield of 6.7% (4.2% of that backed by net income). However, we are very concerned that the cash distribution payout of 158% of net income means that there is a significant amount of capital being paid back to unitholders, and units are being over-priced to the same degree. Figure 22: Impact of New Equity Offerings is Dilution
Value of Average Trust
Total Per Unit
% Decline from Sept.
16th IRR
Capitalize Inflated Cash Flow Over Net Income $1,020 M $10.00
Capitalize Net Income As if Stable $696 M $6.82 -32%
Capitalize Net Income With Equity Offerings to Stabilize Capital Assets $696 M $6.82 -32% 2.6%
Capitalize Deteriorating Net Income and Capital Assets $474 M $4.65 -54% -9.9%
Indeed, if the average business trust had a cash distribution payout of 100% of net income, the trust would have a fair value of just $696 million with no change in business trust taxation, representing a drop of 32% from September 16th. This valuation scenario represents a sustainable situation where enough cash is being retained to maintain and replace capital assets. While reducing distributions to be in line with income would produce a 32% drop in average market capitalization since September 16, 2005, it is not nearly as bad as the situation of running down the assets of the company to an unusable condition. In that scenario, the failure to maintain and replace capital assets could impair the average business trust value to $474 million. This suggests a disastrous buy and hold strategy for the business trusts, with total declines of 54% since September 16, 2005. Trusts will suffer damage to their long-term values if management continues to pay out capital without adequately maintaining and replacing the capital assets necessary to remain productive and competitive. We can only presume that some business trusts are attempting to bridge the gap by prematurely paying out capital to secure a higher valuation in the market, and hoping to mask the shortfall by issuing more units at a later date. However, unitholders are not spared the damage from this remedial approach when viewed from a rational valuation perspective. Figure 22 shows that new equity offerings made at the current fair value per unit would cause substantial dilution, despite maintaining the capital base. Figure 23 illustrates that the dilution from the new equity offerings results in a reduction in unit values similar to the scenario in which we lowered the distribution payout ratio to 100% of net income.
28ACCOUNTABILITY RESEARCH
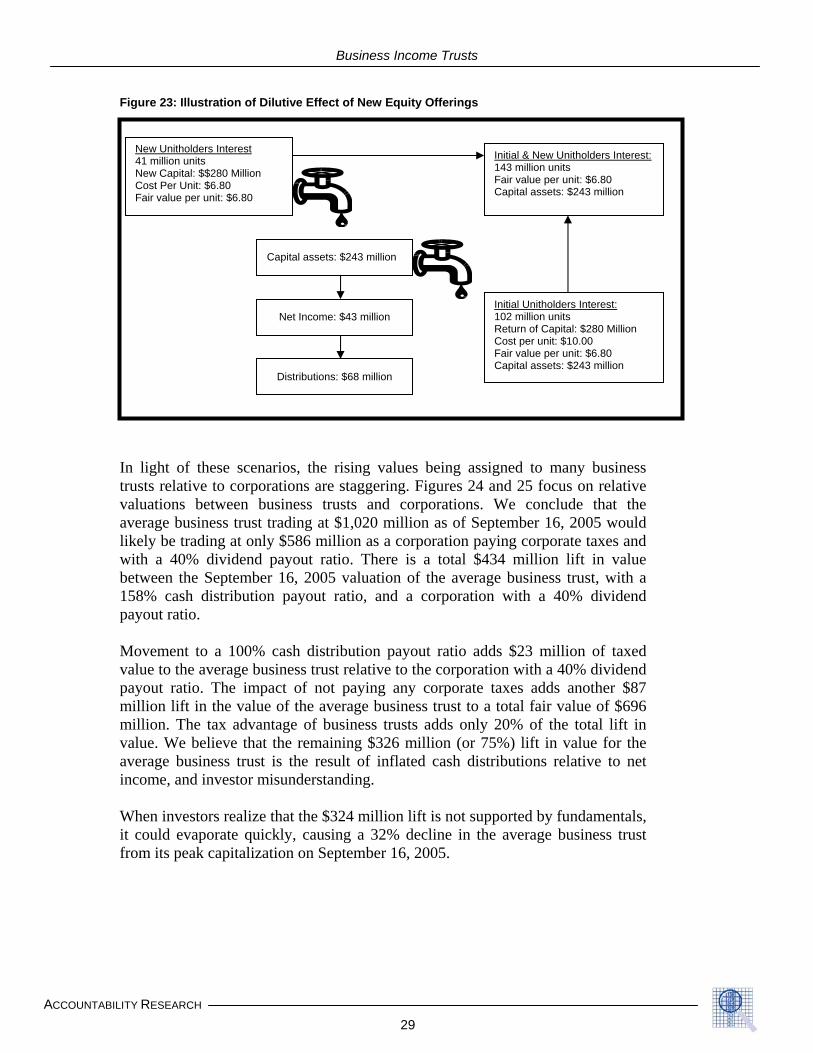
Business Income Trusts
Figure 23: Illustration of Dilutive Effect of New Equity Offerings
Initial & New Unitholders Interest: 143 million units Fair value per unit: $6.80 Capital assets: $243 million
Intrvaliwb1p Mvpmmvain Witfr
ACCOUNTABILIT
New Unitholders Interest 41 million units New Capital: $$280 Million Cost Per Unit: $6.80 Fair value per unit: $6.80
Capital assets: $243 million
Net Income: $43 million Initial Unitholders Interest: 102 million units Return of Capital: $280 Million Cost per unit: $10.00 Fair value per unit: $6.80 Capital assets: $243 million
Distributions: $68 million
light of these scenarios, the rising values being assigned to many business usts relative to corporations are staggering. Figures 24 and 25 focus on relative aluations between business trusts and corporations. We conclude that the verage business trust trading at $1,020 million as of September 16, 2005 would kely be trading at only $586 million as a corporation paying corporate taxes and ith a 40% dividend payout ratio. There is a total $434 million lift in value etween the September 16, 2005 valuation of the average business trust, with a 58% cash distribution payout ratio, and a corporation with a 40% dividend ayout ratio.
ovement to a 100% cash distribution payout ratio adds $23 million of taxed alue to the average business trust relative to the corporation with a 40% dividend ayout ratio. The impact of not paying any corporate taxes adds another $87 illion lift in the value of the average business trust to a total fair value of $696 illion. The tax advantage of business trusts adds only 20% of the total lift in
alue. We believe that the remaining $326 million (or 75%) lift in value for the verage business trust is the result of inflated cash distributions relative to net come, and investor misunderstanding.
hen investors realize that the $324 million lift is not supported by fundamentals, could evaporate quickly, causing a 32% decline in the average business trust om its peak capitalization on September 16, 2005.
29Y RESEARCH

Business Income Trusts
Figure 24: Valuation of the Average Business Trust versus a Corporation
Cash Payout Growth Rate Valuation
Status Quo
Business Trust & Cash Distribution Yield Calculation of Value 158% -8.5% $1,020
+74%
Business Trust 100% 2.0% $696 -32%
Business Trust 158% -8.5% $474 -54% Corporation 40% 9.0% $586 Corporation 100% 2.0% $569 Corporation 158% -4.7% $440
Recommended Tax Solution
Business Trust & Cash Distribution Yield Calculation of Value 158% -8.5% $918
+51%
Business Trust 100% 2.0% $626 -32%
Business Trust 157% -8.5% $450 -51% Corporation 40% 9.0% $608
Corporation 100% 2.0% $612
Corporation 158% -4.7% $460
We believe it is important to compare how the earnings of the business trusts are being valued compared to the earnings of major dividend-paying public corporations. Figure 26 shows that the average P/E on trailing net income for 18 large-cap, higher-yielding public corporations was 16.7 as of November 9th. The average business trust trading at $1,020 million as of September 16th had a trailing P/E of 23.6. The average business trust trading at $870 million on November 8, 2005, had a trailing P/E that had already declined to 20.1. It does not seem reasonable that the average business trust should have a higher P/E than common equities, which have higher-growth profiles and lower dividend payout ratios of roughly 45%. The average business trust with a cash distribution payout ratio of 158% cannot be growing at the rates of these mature high quality corporations. Almost by definition, business trusts with an average income payout of 158% should have lower growth. It is conventional theory that a corporation’s growth rate is its retention rate times its return on capital. The retention rate is 100% minus the dividend payout rate. For example, a business trust growing at 2% with a 100% cash distribution policy would have a 9% growth rate on a pre-tax basis if the same business were a corporation with a 40% dividend payout policy. In other words, the average business trust should, at most, trade at the same P/E as the 18 public corporations shown in Figure 26. Our fair valuation of $696 million for the average business trust has a slightly lower P/E of 16.1 than the P/E of 16.7 shown for the 18 public corporations. Consequently, our comparative analysis from a P/E valuation perspective supports our conclusion that business trusts are significantly over-priced and should decline on a fundamental basis by about 32% from their September 16, 2005 levels, and about 20% from their November 9, 2005 values.
30ACCOUNTABILITY RESEARCH

Business Income Trusts
Figure 25: Illustration of the Valuation of the Average Business Trust versus a Corporation
Company with 158% Income Payout
Company with 158% Income Payout
Move to 100% Income Payout
Corporation with 40% Income Payout
Tax Advantage
Corporation with 40% IncomePayout
Additional Move to 100%
Income Payout
Your Own Money Back
$0
$100
$200
$300
$400
$500
$600
$700
$800
$900
$1,000
$1,100
Business Trust Corporation
31ACCOUNTABILITY RESEARCH
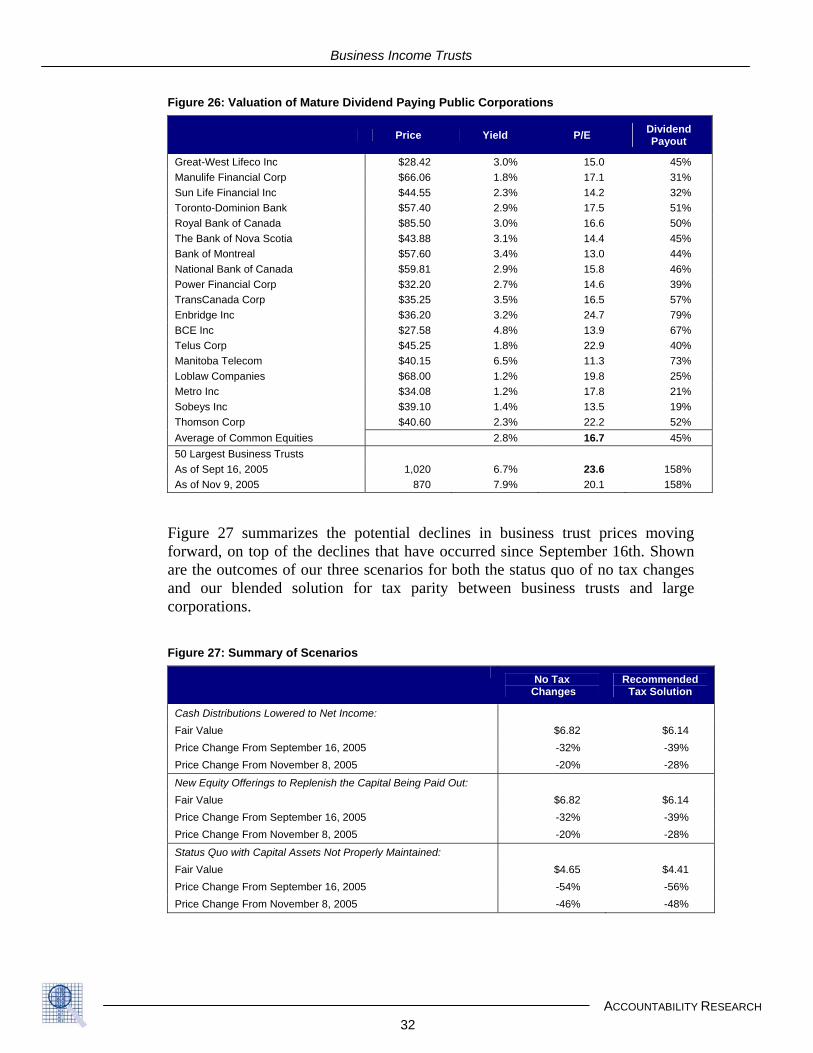
Business Income Trusts
Figure 26: Valuation of Mature Dividend Paying Public Corporations
Price Yield P/E Dividend Payout
Great-West Lifeco Inc $28.42 3.0% 15.0 45% Manulife Financial Corp $66.06 1.8% 17.1 31% Sun Life Financial Inc $44.55 2.3% 14.2 32% Toronto-Dominion Bank $57.40 2.9% 17.5 51% Royal Bank of Canada $85.50 3.0% 16.6 50% The Bank of Nova Scotia $43.88 3.1% 14.4 45% Bank of Montreal $57.60 3.4% 13.0 44% National Bank of Canada $59.81 2.9% 15.8 46% Power Financial Corp $32.20 2.7% 14.6 39% TransCanada Corp $35.25 3.5% 16.5 57% Enbridge Inc $36.20 3.2% 24.7 79% BCE Inc $27.58 4.8% 13.9 67% Telus Corp $45.25 1.8% 22.9 40% Manitoba Telecom $40.15 6.5% 11.3 73% Loblaw Companies $68.00 1.2% 19.8 25% Metro Inc $34.08 1.2% 17.8 21% Sobeys Inc $39.10 1.4% 13.5 19% Thomson Corp $40.60 2.3% 22.2 52% Average of Common Equities 2.8% 16.7 45% 50 Largest Business Trusts As of Sept 16, 2005 1,020 6.7% 23.6 158% As of Nov 9, 2005 870 7.9% 20.1 158%
Figure 27 summarizes the potential declines in business trust prices moving forward, on top of the declines that have occurred since September 16th. Shown are the outcomes of our three scenarios for both the status quo of no tax changes and our blended solution for tax parity between business trusts and large corporations. Figure 27: Summary of Scenarios
No Tax Changes
Recommended Tax Solution
Cash Distributions Lowered to Net Income: Fair Value $6.82 $6.14 Price Change From September 16, 2005 -32% -39% Price Change From November 8, 2005 -20% -28%
New Equity Offerings to Replenish the Capital Being Paid Out: Fair Value $6.82 $6.14 Price Change From September 16, 2005 -32% -39% Price Change From November 8, 2005 -20% -28%
Status Quo with Capital Assets Not Properly Maintained: Fair Value $4.65 $4.41 Price Change From September 16, 2005 -54% -56% Price Change From November 8, 2005 -46% -48%
32ACCOUNTABILITY RESEARCH

Business Income Trusts
I NSIDERS AND UNDERWRITERS REAPING THE BENEFITS
Stopping business trust financial reporting and valuation abuses is far more important than the impact of imposing income tax parity. Our analysis shows that the over-statement of distributable cash relative to net income and the use of cash yield valuations means that business trusts are trading at an average of 1.25 times to 1.40 times their fair value based on the fundamentals of the underlying businesses. Put another way, once investors come to understand that cash distributions misrepresent the sustainable earnings power of the underlying companies, total business trust market capitalization could drop 20% to 28% or more from current levels, depending upon whether the DoF introduces a new tax on business trusts. Investment Banking Fees Based on Inflated IPO Prices
It will be no surprise when the investment banking firms collectively argue against imposing any sort of measure that would cool down the business trust market. Figure 28 shows that investment bankers earn fixed fees of more than 5.4% on average, based on the equity offering prices of the business trusts. Therefore, it is in their best interests to argue that income trust prices should continued to be based on inflated values that include a capitalization of a return of investors’ own money. Since January 1, 2001, the investment banks have received inflated fee revenue in excess of $1.4 billion on business trust offerings. Figure 28: Importance of Business Trusts to the Investment Banks (From Jan 1, 2001 to Present; In Millions of Dollars)
Number New Offerings
Average Investment Banking Fees
IPOs 114 $16,558 $931 5.62% Subsequent Offerings 111 $10,180 $516 5.07% Total 225 $26,739 $1,446 5.41%
Source: Bloomberg; Reuters; Accountability Research; As of November 8, 2005 Research Biased by Underwriting Fees
We do not wish to tar all brokerage research analysts with the same brush, but the weight of the evidence points to the fact that underwriting revenues influence research analysts’ recommendations. Figure 29 shows the bias that still exists among the top five underwriters, with more investment banking clients receiving buy ratings than non-investment banking clients.
33ACCOUNTABILITY RESEARCH

Business Income Trusts
Figure 29: Recommendations for Investment Banking versus Non-Investment Banking Clients
Non-Investment Banking Clients Investment Banking Clients Buy Hold Sell Buy Hold Sell
CIBC World Markets 32% 51% 17% 36% 50% 13%
RBC Capital Markets 39% 50% 10% 47% 45% 8%
BMO Nesbitt Burns* 31% 54% 15% 48% 45% 7%
Scotia Capital 25% 52% 24% 33% 53% 14%
TD Newcrest 43% 50% 6% 49% 45% 5%
Average 34% 52% 14% 43% 48% 10%
*BMO non-investment banking client recommendations estimated using available company and industry data.
Note: Figures are rounded and may not sum to exactly 100%
Source: Accountability Research; Investment Dealers Figure 30: Top 25 Underwriters of Business Trust Offerings (From Jan 1, 2001 to Present)
Lead or Co-Lead in Syndicate
Participation in Syndicate
CIBC World Markets 36.9% 69.8% Scotia Capital 29.3% 64.9% TD Securities 13.8% 64.9% RBC Dominion 22.2% 63.6% BMO Nesbitt Burns 22.2% 61.8% National Bank 8.4% 61.8% Canaccord 3.1% 36.0% Raymond James 5.8% 21.3% HSBC Securities 0.0% 16.4% Blackmont 0.4% 12.9% Sprott 0.9% 12.0% Desjardins 0.0% 10.2% First Energy 0.0% 9.8% Dundee 0.0% 8.9% GMP Securities 2.2% 8.0% Westwind 1.3% 7.1% Merrill Lynch 2.2% 5.3% Orion Securities 1.3% 4.4% Haywood 0.0% 4.0% Peters & Co. 0.4% 4.0% Trilon Securities 0.0% 4.0% Wellington West 0.4% 4.0% Clarus Securities 0.4% 3.6% Genuity 0.4% 2.2% Acumen Capital 0.0% 1.8%
Source: Bloomberg; Accountability Research
34ACCOUNTABILITY RESEARCH

Business Income Trusts
REGULATORS CONDONING CURRENT MARKET ABUSE
We contend that the rush to convert corporations to income trusts has had more to do with the ability to obtain excessive valuations through permissive distributable cash reporting, and improper cash distribution valuation methodologies. Business trusts are even more poorly regulated than public corporations, where the record of the provincial securities commissions and accounting standards bodies has been very weak. The business trusts are not covered by the investor protections and civil liability provisions found in the Federal and Provincial Corporation Acts. The provincial securities commissions review and approve all business trust prospectuses, but they surprisingly appear to have found no problems with the financial reporting of distributable cash. As well, regulatory bodies appear to have found no problems in the Green Sheets prepared by investment bankers, and used by financial advisors, to market business trusts to their income-seeking retail clients. There has not been any announcement of mandatory requirements or enforcement actions to deal with misleading cash distribution yields in either the Green Sheets or equity research reports produced by the investment banks. Cash distribution yields are a combination of both earned income and a return of investors’ own money. Investors are not being adequately informed about the difference, or the fact that the return of their own money should not be capitalized into the unit values of the business trusts. The Canadian accounting standards bodies have chosen to deliberately remain silent concerning the abuses related to distributable cash, despite many such calculations being contained in the notes to audited financial statements. As we stated earlier, at the very core of financial reporting is the need to ensure a fundamental distinction between earned income and the capital contributions of owners. Without a clear separation, financial statements lose their meaning and usefulness in terms of determining underlying business value. Figure 31: Auditors Remaining Silent on Distributable Cash Calculation Mayhem (From Jan 1, 2001 to Present)
Involvement in Business Trust Offerings (%)
KPMG 27.3% PricewaterhouseCoopers 25.9% Ernst & Young 22.7% Deloitte 16.8% BDO Dunwoody 2.3%
35ACCOUNTABILITY RESEARCH

Business Income Trusts
We suspect that part of the silence of the auditors is related to the fact that virtually every business trust manager has thrown out the accountant’s view that depreciation expense represents the cost of maintaining the capital assets of a mature business. This essentially makes GAAP irrelevant in the view of many trust managers, despite the fact that they continue to compile their books using GAAP. While Federal and Provincial Corporations Acts prescribe the use of GAAP, we don’t believe that the Canadian Institute of Chartered Accountants’ monopoly on rule-setting has any legislated application to business trusts. This opens the door to alternative accounting bodies to step up and issue standards relating to distributable cash, given the CICA’s lack of action on the issue. The Investment Dealers Association is responsible for self-regulation of the employees and practices of the investment banks. The Mutual Fund Dealers Association is responsible for the self-regulation of the employees and practices of the mutual fund distributors. It is not surprising that these self-regulators have found no problems in: (1) the due diligence of the investment bankers; (2) the valuation methodologies in the Green Sheets used for marketing new offerings; (3) the equity research reports produced by the investment banks; or (4) the faulty compliance procedures for determining whether specific business trusts are suitable investments for income-seeking retail clients. The investment bank research departments are either not doing, or are not permitted to do, their jobs of advising investors on the quality and proper valuation of business trusts. To put it bluntly, the sellers of business trusts are taking advantage of an ill-informed retail market comprised largely of retirees seeking investment cash flows for their daily needs.
ALTERNATIVE TO CURRENT MARKET ABUSE
If the DoF were to introduce a new tax on business trusts, and there was proper regulation of the financial reporting, valuation, and marketing of business trusts to ensure investment suitability, substantially fewer business trusts would be created. However, corporations do not need to convert into income trusts in order to offer higher dividend yields in the market for income-seeking investors. Rest assured, if many high quality corporations with low future growth rates raised their dividend payout rates, they would still be attributed higher values in the market. Many investors have a significant need for income, and they are willing to pay a premium for corporations with higher dividend payout ratios. A new class of “very high dividend paying” corporations could evolve with the introduction of a blended tax solution, and accompanying improvements in the regulation of financial reporting, valuation, and marketing abuses. This new class of equities could eliminate the demand for many new business trust offerings, and still meet the needs of retirees seeking higher investment returns.
36ACCOUNTABILITY RESEARCH

Business Income Trusts
SUMMARY OF REPORT RECOMMENDATIONS
Following is a summary of recommendations that we believe will help to deflate some of the current over-valuation in the business trust market. There needs to be a serious curtailment in the financial reporting, valuation, and marketing abuses that are allowing owners and investment banks to reap undue rewards from selling business trust units at inflated prices to income seeking investors, including many retirees. 1. Implement a blended solution of a new business trust tax and an increase in
the dividend tax credit; 2. Require regulatory bodies, in collaboration, to:
a) disallow the use of the terms “Income Trust,” “Yield,” and “Payout Ratio” in situations where cash distributions exceed net income,
b) require a breakdown of how much of a distribution represents a return of
investors own money, whenever those distributions are quoted. Much of this effort has to be aimed at the business trust marketers, including the investment banks and income-oriented mutual fund distributors, many of whom abuse the lack of investor knowledge on the subject;
3. Require the provincial securities commissions (through changes in the law, if
necessary) to conduct a review and to take enforcement actions for distributable cash misrepresentations in business trust prospectuses and continuous disclosure documents;
4. Require the provincial securities commissions and all self-regulatory agencies
to issue special warnings to investment advisors to ensure that they are reviewing specific income trusts for what portion of the distributions represent a return of investors own money, and whether business trusts represent suitable investments for retirees seeking income and the preservation of capital;
5. To the extent possible, legislate a new Federal Investor Protection Act and
Agency to supersede the provincial securities commissions that have so far condoned the serious financial reporting, valuation, and marketing abuses in the business trust market;
6. Seriously improve the setting of Generally Accepted Accounting Principles
and Auditing Standards by instituting a thoroughly independent and independently-funded standards board (outside of the powers of the Canadian Institute of Chartered Accountants). This board should take responsibility for fixing the numerous accounting and auditing deficiencies that exist, starting with the current distributable cash reporting abuses.
37ACCOUNTABILITY RESEARCH

Business Income Trusts
7. Require the Provincial Auditors General to audit the provincial securities
commissions for conflicts of interest and enforcement practices, especially with respect to their handling of business trusts over the last several years.
SUMMARY
Business income trusts could easily be overvalued by 28% on average, or by $20 billion across the entire business trust market. The $20 billion potential loss is in addition to the $10 billion decline that has occurred since the Department of Finance initiated its tax review of the trusts in September. Much of the over-valuation stems from abuses in the financial reporting, valuation, and marketing of business trusts. We believe that the primary motivation for the conversion of many corporations into business trusts has not been related to income tax advantages at the corporate level. Rather, it has been the opportunity for selling owners (especially of private companies) to receive inflated prices well above what strategic industry buyers and professional investors alone would be willing to pay. Investment bankers have been motivated by the $1.4 billion of inflated underwriting fees that they have received since January 1, 2001. Many have taken advantage of ill-informed investors seeking higher cash yielding investments. These investors are not being adequately educated that a significant portion of their monthly distributions is actually a return of their own money. When investors misinterpret a cash distribution to be income when it is not, the income generating ability (and perceived value) of the investment becomes inflated in comparison to companies that are returning actual income to investors. Playing no small part in the over-valuation are the abuses related to distributable cash reporting. Much of the manipulation relates to the understatement of future capital spending required to maintain the capital assets of the business. This implies a severe mismatch between prior capital spending requirements and estimated future needs (the latter of which forms the basis of the current inflated business trust values). Even more over-valuation results from the flawed methodologies being pushed by the investment banks, in which cash distributions are capitalized using current cash yield benchmarks. In brief, we recommend: (1) the introduction of a blended tax solution comprising a new 10% tax on business trusts and an increase in the dividend tax credit; (2) new government regulations and securities enforcement actions to deter the accounting, valuation, and marketing abuses surrounding business trusts; and (3)
38ACCOUNTABILITY RESEARCH

Business Income Trusts
structural reform of Canada’s abysmally weak accounting and securities regulation authorities. A new tax on business trusts would stem the tide of business trust conversions and the litany of financial reporting, valuation, and marketing abuses occurring in this sector of the market. An increase in the dividend tax credit would encourage many corporations to raise their dividend payout ratios as a way of boosting shareholder value. This would also save current shareholders from needless restructuring fees, and still provide income-seeking investors with an effective alternative to business trusts. In the end, whether a new tax on business trusts is introduced or not, we believe that a substantial downward correction in the business trust market in the range of at least 20%, or $15 billion is warranted. This is in addition to the declines that have occurred since the Department of Finance initiated its tax review of the trusts in September.
39ACCOUNTABILITY RESEARCH

www.accountabilityresearch.com
This report has been prepared on an exclusive basis for Accountability Research Corporation (“ARC”) by Private Financial Research Corporation (“PFRC”), a registered securities adviser. ARC and PFRC, together with their respective directors, officers, and employees are prohibited from trading in the securities (including derivatives) of the companies profiled herein, or the securities (including derivatives) of the companies’ direct competitors during the 30 days before and after our initial report. We do not provide consulting, investment banking, underwriting, or asset management services to companies. We do not accept research fees from companies for writing reports about them. We have made every effort to ensure that the information contained in this report was compiled or derived from sources believed to be reliable, and that the statements made in this report are accurate and complete. We make no representation or warranty, expressed or implied, in respect of the information contained in this report and take no responsibility for any errors and omissions, and accept no liability whatsoever for any loss or damage arising from any publication, distribution, use or reliance on this report or its contents. All opinions expressed in this report are our own, and are subject to change without notification. Any inferences made by the reader of this report should not be construed as recommendations for actions to be taken by investors or potential investors of the securities mentioned. This report is intended to provide our institutional subscribers with a forthright discussion of business, accounting and financial reporting issues, including generally accepted accounting principles (GAAP) and the limits of their usefulness to investors. Do not assume that the accounting policies of any company mentioned herein are not within the broad range of GAAP, or that the policies employed by that company were not approved by its auditors. Do not assume that any company mentioned herein has reviewed our report prior to its publication. No part of this report may be reproduced without our express prior written consent.