november 2014 - cfs · stock indices: bombay stock exchange sensitive index (sensex), ftse bursa...
TRANSCRIPT
November 2014
Macroeconomic Surveillance Department
Monetary Authority of Singapore
ISSN 1793-3463 Published in November 2014 Macroeconomic Surveillance Department Monetary Authority of Singapore http://www.mas.gov.sg All rights reserved. No part of this publication may be reproduced, stored in a retrieval system or transmitted in any form or by any means, electronic, mechanised, photocopying, recording or otherwise, without the prior written permission of the copyright owner except in accordance with the provisions of the Copyright Act (Cap. 63). Applications for the copyright owner's written permission to reproduce any part of this publication should be addressed to: Macroeconomic Surveillance Department Monetary Authority of Singapore 10 Shenton Way MAS Building Singapore 079117 Printed by Oxford Graphic Printers Pte Ltd

Financial Stability Review, November 2014
Monetary Authority of Singapore Macroeconomic Surveillance Department
PREFACE i
OVERVIEW ii
1 GLOBAL ENVIRONMENT
1.1 G3 Macroeconomic Environment and Financial System 1
Box A: Corporate Bond Market Liquidity – Exiting a Crowded Theatre? 5
Box B: Total Loss-Absorbing Capacity: Macroeconomic and Financial Stability Implications
11
1.2 Asia Macroeconomic Environment and Financial System 14
Box C: Asset Quality Risks in Asia 25
Box D: Banking Reforms in China and India 29
2 SINGAPORE’S MACROECONOMIC ENVIRONMENT AND FINANCIAL SYSTEM
2.1 Macroeconomic Developments and Financial Markets 33
2.2 Corporate Sector 37
Box E: Assessing the Risks of Corporate Leverage in Singapore 42
Box F: SME Financing in Singapore 46
2.3 Household Sector 49
Box G: Update on the Singapore Private Residential Property Market 54
Box H: New Rules on Unsecured Credit Facilities and Credit Cards 59
2.4 Banking Sector 61
Box I: Funding Needs and Cross-Border Exposures of Singapore’s Banking System: Financing the Domestic Economy and Beyond
66
Box J: Funding Liquidity in Singapore’s Banking System: Making Sense from Different Perspectives
68
2.5 Non-Bank Financial Sector
2.5.1 Insurance Sector 71
2.5.2 Capital Markets Sector 74
Box K: Re-examining the Systemic Risks Posed by S-REITs 76
Box L: Innovative Financial Products: CoCos and Unconventional Lending 80
Box M: Virtual Currencies 84
STATISTICAL APPENDIX 86

Financial Stability Review, November 2014
Monetary Authority of Singapore Macroeconomic Surveillance Department
Definitions and Conventions
As used in this report, the term “country” does not in all cases refer to a territorial entity that is a state as
understood by international law and practice. As used here, the term also covers some territorial entities that
are not states but for which statistical data are maintained on a separate and independent basis.
In this report, the following country groupings are used:
Euro zone comprises Austria, Belgium, Cyprus, Estonia, Finland, France, Germany, Greece, Ireland, Italy,
Latvia, Luxembourg, Malta, Netherlands, Portugal, Slovakia, Slovenia and Spain
“G3” refers to the euro zone and United Kingdom, Japan, and the United States
“G20” refers to the Group of Twenty comprising Argentina, Australia, Brazil, Canada, China, France,
Germany, India, Indonesia, Italy, Japan, Mexico, Russia, Saudi Arabia, South Africa, South Korea,
Turkey, the United Kingdom, the United States and the European Union
“Asia-10” comprises China (CHN), Hong Kong (HK), India (IND), Indonesia (IDN), Korea (KOR), Malaysia
(MYS), the Philippines (PHL), Singapore (SGP), Taiwan (TWN) and Thailand (THA)
“Asia-7” comprises India, Indonesia, Korea, Malaysia, the Philippines, Taiwan and Thailand
“NEA-3” comprises Hong Kong, Korea and Taiwan
“SEA-5” comprises Indonesia, Malaysia, the Philippines, Singapore and Thailand
Abbreviations used for financial data are as follows:
Currencies: Chinese Renminbi (RMB), Euro (EUR), Hong Kong Dollar (HKD), Indian Rupee (INR),
Indonesian Rupiah (IDR), Japanese Yen (JPY), Korean Won (KRW), Malaysian Ringgit (MYR), Philippine
Peso (PHP), Singapore Dollar (SGD), Taiwan Dollar (TWD), Thai Baht (THB), Vietnamese Dong (VND), US
Dollar (USD)
Stock Indices: Bombay Stock Exchange Sensitive Index (SENSEX), FTSE Bursa Malaysia KLCI (FBMKLCI),
Hang Seng Index (HSI), Ho Chi Minh Stock Index (VNINDEX), Jakarta Composite Index (JCI), Korea
Composite Stock Price Index (KOSPI), Nikkei 225 (NKY), Philippine Stock Exchange Index (PSEI),
Shanghai Composite Index (SHCOMP), Stock Exchange of Thailand Index (SET), Straits Times Index (STI),
Taiwan TAIEX Index (TWSE)
Other Abbreviations
ABSD Additional Buyer Stamp Duty
ACU Asian Currency Unit
ADB Asian Development Bank
ADM Asian Dollar Market
AEs Advanced Economies
ASEAN Association of Southeast Asian Nations
AT1 Additional Tier 1
AUM Assets Under Management
BCBS Basel Committee on Banking Supervision
BIS Bank for International Settlements
BoE Bank of England
BoJ Bank of Japan
CAR Capital Adequacy Ratio

Financial Stability Review, November 2014
Monetary Authority of Singapore Macroeconomic Surveillance Department
CBRC Chinese Banking Regulatory Commission
CBS Credit Bureau Singapore
CCP Central Counterparty
CCR Core Central Region
CDP Central Depository (Pte) Limited
CET1 Common Equity Tier 1
CIS Collective Investment Scheme
CoCo Contingent Convertible Capital Instrument
COE Certificate of Entitlement
CPF Central Provident Fund
CPI Consumer Price Index
CPMI Committee on Payments and Market Infrastructures
CPSS Committee on Payment and Settlement Systems
CRAFT Comprehensive Risk Assessment Framework and Techniques
CRILC Central Repository of Information on Large Credits
CSRC Chinese Securities Regulatory Commission
DBU Domestic Banking Unit
DM Developed Markets
DOS Department of Statistics
EBIT Earnings Before Interest and Tax
EBITDA Earnings Before Interest and Tax, Depreciation and Amortisation
EC European Commission
ECB European Central Bank
ETF Exchange-Traded Fund
EU European Union FI Financial Institution
FSAP Financial Sector Assessment Program
FSB Financial Stability Board
FSR Financial Stability Review
GDP Gross Domestic Product
GFC Global Financial Crisis
G-SIB Global Systemically Important Bank
ICR Interest Coverage Ratio
IIF Institute of International Finance
IMF International Monetary Fund
IOSCO International Organisation of Securities Commissions
IPTO Insolvency and Public Trustee’s Office
ISDA International Swaps and Derivatives Association
IWST Industry-Wide Stress Test
LCR Liquidity Coverage Ratio
LEFS Loan Enterprise Finance Scheme
LIBOR London Interbank Offered Rate
LIS Loan Insurance Scheme
LSAP Large Scale Asset Purchase
LTD Loan-to-Deposit
LTRO Long-Term Refinancing Operations
LTV Loan-to-Value
MAS Monetary Authority of Singapore
MLP Micro Loan Programme
MSD Macroeconomic Surveillance Department
NEER Nominal Effective Exchange Rate
Financial Stability Review, November 2014
Monetary Authority of Singapore Macroeconomic Surveillance Department
NIM Net Interest Margin
NPL Non-Performing Loan
NSFR Net Stable Funding Ratio
OCR Outside Central Region
OIF Offshore Insurance Fund
OIS Overnight Indexed Swap
OMV Open Market Value
OTC Over-the-Counter
PBOC People’s Bank of China
PFMI Principles for Financial Market Infrastructures
PMET Professional, Manager, Executive and Technician
PONV Point of Non-Viability
RBI Reserve Bank of India
REIT Real Estate Investment Trust
ROA Return on Assets
RRR Reserve Ratio Requirement
RWA Risk-Weighted Assets
S&P Standard & Poor’s
SAAR Seasonally Adjusted Annualised Rate
SAFE SMEs’ Access to Finance Survey Analytical Report
SCAV Standing Committee on Assessment of Vulnerabilities
SGS Singapore Government Securities
SGX Singapore Exchange Ltd
SGX-DC Singapore Exchange Derivatives Clearing Limited
SIBOR Singapore Interbank Offered Rate SIF SIFMA
Singapore Insurance Fund Securities Industry and Financial Markets Association
SME Small and Medium-Sized Enterprise
SOR Swap Offer Rate
STI Straits Times Index
TDSR Total Debt Servicing Ratio
TED Treasury-Interbank Spread
TLAC Total Loss-Absorbing Capacity
TSC Transport, Storage and Communication
UMP Unconventional Monetary Policy/Policies
URA Urban Redevelopment Authority
WEO World Economic Outlook
WGRMS Working Group on Risk Mitigation Requirements

Financial Stability Review, November 2014
Monetary Authority of Singapore Macroeconomic Surveillance Department
i
PREFACE
The Monetary Authority of Singapore (MAS) conducts regular assessments of Singapore’s
financial system. Potential risks and vulnerabilities are identified, and the ability of the
financial system to withstand potential shocks is reviewed. The analyses and results are
published in the annual Financial Stability Review (FSR). The FSR aims to contribute to a
better understanding among market participants, analysts and the public of issues
affecting Singapore’s financial system.
Section 1 of the FSR provides a discussion of the macroeconomic environment and
financial markets both globally and in Asia. Section 2 starts by outlining key developments
in Singapore’s macroeconomic environment and financial system. This is followed by an
analysis of the corporate and household sectors, then the banking sector, which plays a
dominant role in Singapore’s financial landscape. Finally, a review of the non-bank
financial sector, which includes the insurance sector and capital market infrastructure and
intermediaries, is also provided.
The production of the FSR was coordinated by the Macroeconomic Surveillance
Department (MSD) team which comprises Chan Lily, Ng Heng Tiong, Choo Chian, Gay Bing
Yong Kenneth, Ho Ruixia Cheryl, Ho Xinyi, Lam Mingli Angeline, Lee Su Fen, Lim Ju Meng
Aloysius, Lim Weilun, Qiu Qiaoling Angeline, Soon Shu Ning Gael, Tan Chew Mui Eileen,
Teoh Shi-Ying, Wong Siang Leng, Wong Siew Yann Justin, Yap Su-E, Yeo Siok Lee Denise,
Yeoh Lye Choon Brian, Yip Ee Xiu and Yoe Xue Ting Selene under the general direction of
Dr Lam San Ling, Executive Director (MSD). Valuable statistical and charting support was
provided by members of the MSD Statistics Unit. The FSR also incorporates contributions
from the following departments: Banking Departments I, II & III, Capital Markets
Intermediaries Departments I, II & III, Economic Analysis Department, Economic
Surveillance and Forecasting Department, Insurance Department, Market Conduct
Department, Markets Policy and Infrastructure Department, Monetary and Domestic
Markets Management Department, Prudential Policy Department and Specialist Risk
Department. The FSR reflects the views of the staff of the Macroeconomic Surveillance
Department and the contributing departments.
The FSR may be accessed in PDF format on the MAS website:
http://www.mas.gov.sg/en/Regulations-and-Financial-Stability/Financial Stability.aspx
Financial Stability Review, November 2014
Monetary Authority of Singapore Macroeconomic Surveillance Department
ii
OVERVIEW
Global financial vulnerabilities remain amid
policy uncertainties
Financial vulnerabilities bear close monitoring in
the wake of accommodative monetary policies in
G3 economies. The prolonged low interest rate
environment and the search for yield have
contributed to instances of heightened financial
risk-taking and elevated asset valuations,
especially in less liquid assets and markets.
In this environment, divergent G3 monetary
policies could have financial stability spill-overs.
Uncertainties over the timing and trajectory of
interest rate normalisation in some G3 countries
as well as the strength of the growth stimulus in
other G3 countries could lead to disorderly
adjustments in global financial markets and
volatility in capital flows to Asia. These could in
turn adversely impact some financial institutions
and particularly highly leveraged corporates and
households.
If these global risks materialise, they could
lead to increased liquidity and default
stresses in some segments of Asian financial
systems
While strong global liquidity has underpinned
buoyant financial conditions in Asia, this can
quickly reverse amid normalising monetary
conditions in the US.
A turn in investor sentiment and a potential
disorderly exit from accommodative monetary
policies could fuel liquidity and funding risks.
Shocks from markets in the advanced economies
(AEs) could lead to capital outflows and greater
volatility in some Asian markets, particularly if
uncertainty over the timing and course of US
policy normalisation persists. Disorderly
corrections in some asset classes, including
property, could add to financial stability risks.
Highly leveraged corporates and households in
Asia would be vulnerable to interest rate shocks,
and potential foreign currency mismatch risks.
Bank asset quality could decline as borrowers’
debt servicing capacity weakens.
Nonetheless, Asian economies are expected to
remain resilient due to improved fundamentals
and active reforms. Efforts to strengthen public
finances and build up international reserves have
helped anchor investor confidence and should
provide some buffer against external risks.
In Singapore, growing leverage, still-
elevated property prices and rising cross-
border banking exposures warrant close
monitoring
In Singapore, the corporate debt-to-GDP ratio has
trended upwards since the Global Financial Crisis
(GFC), rising from 52% in Q2 2008 to 78% in Q2
2014. The household debt-to-income ratio has
also edged up from 1.9 times in 2008 to 2.3 times
in 2013. An interest rate hike combined with an
earnings shock could increase the number of
financially distressed corporates and households.
Private residential property market prices have
moderated following the series of property
measures introduced since 2009, but remain at
an elevated level. There has also been increased
interest in foreign property purchases, which
could expose investors to foreign exchange and
interest rate risks, as well as other risks arising
from unfamiliarity with overseas property
markets.
Foreign currency exposures in the banking
system have risen alongside the growth in cross-
border lending. A tightening of global liquidity
conditions could pose funding risks to the banks.
Financial Stability Review, November 2014
Monetary Authority of Singapore Macroeconomic Surveillance Department
iii
In an uncertain economic climate, volatile
external conditions could also lead to an
unexpected and sharp deterioration in asset
quality.
MAS is monitoring the above risks closely and
taking pre-emptive measures to address them.
Corporate balance sheets have remained firm, as
evidenced by sound profitability and liquidity
indicators. MAS’ stress test of corporate balance
sheets suggests that corporate debt servicing
ability remains strong, even when firms are
subject to interest rate and earnings shocks.
While highly leveraged firms may be vulnerable,
they do not pose systemic risk, especially if
accumulated cash reserves and hedging
strategies are considered.
Household balance sheets have also remained
healthy, with aggregate net wealth at about four
times GDP. Household asset holdings have
diversified away from property towards other
financial assets, mitigating risks from over-
concentration in any one asset class.
The pace of growth in household debt has slowed
markedly, as MAS’ policies to encourage financial
prudence take effect. The growth in outstanding
housing loans has moderated, alongside an
improvement in the risk profile of such loans with
new loans having lower loan-to-value (LTV) ratios
and shorter loan tenures.
Notwithstanding some moderation in household
leverage, the level of debt among highly
leveraged households bears close watching.
Households with high monthly debt service
commitments, including those who have over-
committed to property or have incurred high
Corporate and household balance sheets
are generally healthy, but the debt levels of
highly leveraged households bear watching
levels of credit card and unsecured debt, will be
vulnerable to interest rate or income shocks.
MAS will continue to monitor the level of
household leverage and take further measures,
where appropriate, to keep household debt at a
manageable level. Highly leveraged households
will need to work with banks and credit
counselling agencies to reduce their debts via
debt repayment plans.
MAS will also continue to monitor the property
market and take appropriate measures to
maintain a stable and sustainable market.
Households should be mindful of additional risks
associated with overseas property purchases.
Singapore’s banking system remains
resilient, but banks will have to be watchful
of liquidity and credit risks
Singapore’s banking system is sound and remains
resilient to external shocks. Asset quality is
healthy. The local banks’ capital adequacy
positions are well above regulatory requirements,
and their liquidity positions are sound.
The results of MAS’ industry-wide stress test
(IWST) also indicate that banks would be able to
meet regulatory capital requirements even under
severe stress conditions.
The banking system is self-sufficient in funding
domestic borrowing needs. Nonetheless, a
potential tightening in foreign currency funding
and liquidity could pose risks that bear close
monitoring.
Banks should continue to maintain good credit
underwriting practices and ensure that
provisioning is prudent and robust to potential
stress conditions. Banks should also continue to
monitor and address risks arising from stresses to
foreign currency funding and liquidity.

Financial Stability Review, November 2014
Monetary Authority of Singapore Macroeconomic Surveillance Department
iv
As global monetary conditions continue to
evolve, MAS will continue to assess risks to the
banking system from rising cross-border
exposures, refining both quantitative and
qualitative indicators and taking action where
necessary.
Macroeconomic Surveillance Department
Monetary Authority of Singapore
27 November 2014

Financial Stability Review, November 2014 1
Monetary Authority of Singapore Macroeconomic Surveillance Department
1.1 G3 Macroeconomic Environment and Financial System
Macroeconomic conditions in the G3 were mixed in 2014. While unconventional monetary policies (UMP)
continued to support near-term growth, the recovery in G3 economies has been lacklustre, pointing to the
need for policymakers to adopt structural reforms for longer-term sustainable growth.
Meanwhile, financial risks posed by UMP have become increasingly stark. While banking systems have
strengthened over the past year, risks have continued to build up in asset valuations and market liquidity.
Faster-than-expected rate rises, volatility spikes or geopolitical tensions could trigger market adjustments
in the G3 that may spill over to other regions. Alongside efforts to boost economic growth, policies that
address mounting financial vulnerabilities will be important.
Unconventional monetary policies continue to
shoulder the burden of supporting growth...
UMP has broadly continued to support economic
growth in 2014, although G3 monetary policy is set to
diverge going forward.
On the back of improving US growth prospects, the US
Federal Reserve completed the tapering of its large-
scale asset purchases (LSAP) and moved closer to
raising the federal funds rate. The Bank of England
(BoE) may also raise its benchmark interest rates in
2015. However, the European Central Bank (ECB)
expanded monetary accommodation by lowering its
benchmark rate and broadening its long-term
refinancing operations (LTRO) to address faltering euro
zone growth and deflationary pressures. The Bank of
Japan (BoJ) also sustained its quantitative easing
programme as the economy recently slipped into a
recession.
... but divergent and disappointing growth outcomes
highlight the need for structural reforms
G3 economic performance was mixed in 2014 (Chart
1.1.1). US economic growth rebounded following a
first quarter dip, as unemployment fell and business
spending strengthened. UK growth continued to gain
ground. However, growth remained weak in the euro
zone as deflation worries and structural vulnerabilities
came to the fore (Chart 1.1.2). Japan’s gross domestic
product (GDP) growth fell into negative territory
Chart 1.1.1 GDP Growth: G3 Economies
Source: CEIC
Chart 1.1.2 GDP Growth: Euro Zone Economies
Source: Eurostat
-20
-15
-10
-5
0
5
10
2007 2008 2009 2010 2011 2012 2013 2014
Qo
Q S
AA
R %
Gro
wth
US Japan Euro Zone UK
Q3
-10
-8
-6
-4
-2
0
2
4
6
8
10
2007 2008 2009 2010 2011 2012 2013 2014
YO
Y %
Gro
wth
France Germany Greece
Italy Portugal Spain
Q3

Financial Stability Review, November 2014 2
Monetary Authority of Singapore Macroeconomic Surveillance Department
1 The IMF cut projections for 2015 world GDP growth on 8 October 2014.
following a hike in consumption taxes in April.
Besides being uneven, G3 growth has also been sub-
par. GDP forecasts have been repeatedly revised
lower, and even US growth remains below potential
(Chart 1.1.3).1 This attests to the limits of monetary
policy in supporting growth and the urgent need for
other policy levers to pull their weight.
While banking systems continue to strengthen...
G3 banks have continued to strengthen over the year.
Asset quality risks are gradually dissipating, and
improving loan growth buoyed bank earnings.
Accordingly, bank creditworthiness has strengthened.
For example, the spreads of European bank credit
default swaps have narrowed further (Chart 1.1.4).
US banks eased credit standards in 2014 amid a broad
pickup in loan demand, while euro zone banks relaxed
lending standards for the first time since 2007 (Chart
1.1.5) as demand for consumer credit increased.
Japanese banks’ lending standards also continued to
ease (Chart 1.1.6).
Credit growth will continue only if asset quality risks
are mitigated. This includes addressing concerns raised
following the ECB’s asset quality review. Nevertheless,
regulatory reforms have generally bolstered banking
systems. Europe’s banking union, with the single
supervisory mechanism coming into effect in
November 2014, will help boost confidence in
European banks. Regulators are also addressing risks
posed by “too-big-to-fail” entities, including
introducing capital surcharges on global systemically
important banks (G-SIBs). Additionally, the US and UK
treasuries and central banks recently carried out
coordinated “war games” to test the resilience of their
financial system and to examine the cross-border
implications of bank failures.
Chart 1.1.3 Output Gap in Per Cent of Potential GDP
Source: International Monetary Fund (IMF) World Economic Outlook (WEO)
Chart 1.1.4 iTraxx Europe Senior Financial Index
Source: Bloomberg
Chart 1.1.5 Net Percentage of Banks Tightening Lending
Standards to Firms: Euro Zone and US
Source: ECB, US Federal Reserve *Commercial and Industrial
-10
-5
0
5
2005 2007 2009 2011 2013 2015 2017 2019
Pe
r C
ent
France GermanyJapan United KingdomUnited States
Estimates as at 2013
50
100
150
200
250
300
350
400
2008 2010 2012 2014
Bas
is P
oin
ts
Nov
-100
100
2008 2010 2012 2014
Net
Per
cent
age
Euro Zone Large Firms Euro Zone SMEsUS C&I* Loans to Large and Middle-Market FirmsUS C&I Loans to Small Firms
Q3
Easing
Tightening

Financial Stability Review, November 2014 3
Monetary Authority of Singapore Macroeconomic Surveillance Department
2 The troika consists of the IMF, the European Commission (EC) and the ECB.
… accommodative monetary policies are adding to
financial distortions...
Despite the improvement in banking systems, financial
vulnerabilities are building up in the wake of
accommodative monetary policies.
Continued financial risk-taking and search for yield
amid a low-rate environment have contributed to
pockets of elevated valuations in asset classes such as
property and bonds.
Against this accommodative monetary policy backdrop,
asset managers have pumped more money into less
liquid assets (Chart 1.1.7), which raises market liquidity
risks should such investors exit in a disorderly fashion.
Concerns about liquidity are further compounded by
declining dealer bond inventory (Chart 1.1.8). The
fragility of investor sentiment is illustrated by the spike
in volatility and dips in high-yield bond prices in
October 2014 (Chart 1.1.9). A disorderly exit could
affect markets in the US, Europe, and Asia to varying
degrees. Such liquidity risks warrant close attention
(See Box A: Corporate Bond Market Liquidity - Exiting a
Crowded Theatre?).
... and have dulled the impetus for appropriate fiscal
action in G3 economies
Sovereign borrowing costs remained at historical lows
(Chart 1.1.10). In the euro zone, sovereign prospects
improved as Portugal and Spain followed Ireland in
exiting the troika bailouts without a precautionary
credit line.2
A delicate balancing act must be maintained between
fiscal reform and pro-growth stimulus measures. On
one hand, fiscal discipline must continue to be
emphasised as debt-to-GDP ratios of G3 countries
remain high relative to historical trends (Chart 1.1.11).
On the other hand, where growth remains stubbornly
sub-par in economies that are already fiscally prudent,
fiscal flexibility to boost growth may be needed.
Chart 1.1.6 Diffusion Index of Credit Standards for Firms:
Japan
Source: BoJ
Chart 1.1.7 Increased Holdings of Corporate and Foreign
Bonds by Asset Managers
Source: US Federal Reserve
Chart 1.1.8
Primary Dealer Corporate Bond Inventory
Source: US Federal Reserve
-6
0
6
12
18
24
30
2008 2009 2010 2011 2012 2013 2014
Pe
rce
ntag
e P
oin
ts
Japan Large-Sized FirmsJapan Medium-Sized FirmsJapan Small-Sized Firms
Q3
Easing
0
5
10
15
20
10
15
20
25
30
2008 2010 2012 2014
Pe
r C
en
t
Pe
r C
en
t
Asset Managers Insurance
Banks (RHS) Households (RHS)
Q2
0
50
100
150
200
250
2005 2008 2011 2014
US$
Bil
lio
n
Nov

Financial Stability Review, November 2014 4
Monetary Authority of Singapore Macroeconomic Surveillance Department
Reforms must continue to stimulate growth and
build resilience
The present period of relative calm provides a good
opportunity to pursue needed reforms. Structural
reforms to boost the real economy need to be
prioritised, as growth remains below potential.
At the same time, building systemic resilience remains
a key priority. Geopolitical risks and health epidemics,
over and above economic uncertainties, could lead to
market volatility. Appropriate buffers would need to
be built up against such risks.
While macroprudential policies can help address some
financial stability risks arising from disorderly asset
price corrections, their effectiveness depends on
certain preconditions. These include having a clear
mandate, a broad toolkit, and perhaps most
importantly, political support.
Furthermore, macroprudential policies alone may not
be sufficient in constraining excessive financial risk-
taking. It is important to follow through on ongoing
regulatory reforms. At an appropriate time, monetary
accommodation should be withdrawn. In addition,
relevant steps need to be taken to mitigate liquidity
risks (See Box A).
The progress of these structural and market reforms
will have significant ramifications for economies
outside the G3, given increased economic and financial
interconnections between the G3 and the rest of the
world, especially Asia.
Chart 1.1.9 Market Indices:
High-Yield Bonds and Volatility
Source: Bloomberg
Chart 1.1.10 Ten-Year Sovereign Bond Yields:
Selected G3 Economies
Source: Bloomberg
Chart 1.1.11 Public Debt-to-GDP Ratio:
Selected G3 Economies
Source: IMF WEO
40
90
140
90
100
110
2012 2013 2014
Ind
ex
(Jan
20
10
= 1
00
)
Ind
ex
(Jan
20
10
= 1
00
)
iShares iBoxx $ High Yield Corporate BondETFSPDR Barclays High Yield Bond ETF
Chicago Board Options Exchange SPXVolatility Index (RHS)
Nov
0
1
2
3
4
5
6
2008 2010 2012 2014
Per C
ent
France Germany Japan UKUS
Nov
0
50
100
150
200
250
300
1990 1995 2000 2005 2010 2015
Pe
r C
en
t
France GermanyGreece IrelandItaly JapanPortugal SpainUnited Kingdom United States
Estimates as at 2013
2019

Financial Stability Review, November 2014 5
Monetary Authority of Singapore Macroeconomic Surveillance Department
Box A
Corporate Bond Market Liquidity: Exiting a Crowded Theatre?
Over the past few years, the search for yield amid a low interest rate environment has facilitated capital
flows into less liquid assets (Chart A1). These inflows raise market liquidity risks should investors exit en
masse. As lower market liquidity exacerbates market volatility, the risk of a disorderly exit is higher in
less liquid markets. In particular, the recent volatility spike in October 2014 saw bond market volatility
outpacing equity and foreign exchange market volatility (Chart A2), underscoring concerns that
adjustments in bond markets could be disorderly amid lower bond market liquidity.
Chart A1 Cumulative Fund Flows
Source: EPFR, MAS estimates Note: Fund flows into liquid assets are proxied by flows into money market funds, equity funds and government bond funds. Fund flows into illiquid assets are proxied by flows into bond funds (excluding government bond funds), and alternative funds.
Chart A2 Asset Market Volatility
Source: Bloomberg, MAS estimates Note: Z-score indicates the number of standard deviations an observation is from the mean. Bond volatility is based on the Merrill Option Volatility Estimate (MOVE) Index. Equity volatility is based on the average volatility of the S&P500, Nasdaq, Nikkei, Eurostoxx, DAX, CAC and FTSE. FX volatility is based on the average volatility of G10 currencies, i.e. USD, EUR, GBP, JPY, CHF, CAD, AUD, NZD, NOK and SEK.
Bond markets have grown to be an increasingly important source of financing for corporates, and
disruptions to the corporate bond markets would raise financing costs and adversely affect growth. As a
result, liquidity risks facing corporate bond markets have attracted attention from policymakers and
market participants, particularly in the US and Europe. In contrast, less attention has thus far been paid
to Asian corporate bond markets. In this box, we examine the factors contributing to liquidity risks in the
US, European and Asian corporate bond markets. We also suggest possible measures to address these
risks.
We find that reduced dealer capacity to make markets and increasingly crowded positions in corporate
bonds have altered the liquidity landscape of US and European corporate bond markets, making it more
difficult to transact in secondary markets. At the same time, the increased activity of investment funds
renders the markets more vulnerable to sudden pullbacks. In contrast, while Asian corporate bond
markets have remained relatively less liquid, they could be subject to fewer shocks due to the higher
participation of buy-and-hold investors. To address these liquidity risks, policymakers could look to boost
secondary liquidity by promoting standardisation of bond issuances and/or improving transparency in the
market, as well as improving risk disclosures.
-1,500
-1,000
-500
0
500
1,000
2009 2010 2011 2012 2013 2014
US$
Bill
ion
Illiquid assets Liquid assets
Nov-3
-2
-1
0
1
2
3
4
5
2009 2010 2011 2012 2013 2014
Z-s
core
Bond Vol Equity Vol FX Vol
Nov

Financial Stability Review, November 2014 6
Monetary Authority of Singapore Macroeconomic Surveillance Department
US and Europe Corporate Bond Markets
Banks retreating from market-making
Regulatory reforms intended to make banks safer are also constraining banks’ ability and willingness to
provide liquidity in bond markets.3 Trading assets of US and European banks have shrunk considerably
(Chart A3), as these banks have been shifting away from proprietary trading and market-making.
Chart A3
Banks’ Trading Assets
Source: SNL Financial, IMF
Investors thronging into illiquid high-yield bonds
Separately, the existence of a ‘central bank put’ has driven investors to riskier assets. Spurred by strong
investor demand for corporate bonds amid higher risk appetite, corporate bond markets in the US and
Europe saw record issuance in recent years. In particular, the growth in high-yield bond issuance has
outpaced that of total corporate bond issuance (Chart A4), as investors reach for yield in the riskier and
less liquid corners of the corporate bond market. With more investors trading in the same direction, exits
from corporate bond markets, in particular the high-yield segment, could easily become crowded quickly
when these positions unwind.
Chart A4
Growth in Corporate Bond Issuance
US
Source: Dealogic
Europe
Source: Dealogic
3 New Basel rules, such as the leverage ratio and higher capital charge for market risks, are making it more costly for banks to
warehouse bond inventory, and structural reforms in the US and EU restrict banks from conducting proprietary trading.
0
2
4
6
8
10
2010H1
2011H1
2012H1
2013H1
2014H1
US$
Tri
llio
nUS Europe
0
50
100
150
200
250
2007 2009 2011 2013
Ind
ex
(20
07
=10
0)
Investment-Grade High-Yield
2014
0
100
200
300
400
500
2007 2009 2011 2013
Ind
ex
(20
07
=10
0)
Investment-Grade High-Yield
2014

Financial Stability Review, November 2014 7
Monetary Authority of Singapore Macroeconomic Surveillance Department
Potential outflows from bond funds could further crowd the exits
Policymakers and market participants are growing concerned that sudden redemptions from high-yield
bond funds could trigger a larger sell-off in the illiquid and increasingly crowded high-yield bond market.
In addition, investments funds unable to liquidate their holdings in the illiquid high-yield bond market
may be forced to sell more liquid assets, such as government bonds, to meet redemptions. Corporate
bond investment funds could thus pose spill-over effects to other asset classes arising from liquidity risks.
Investors have started to scale back from high-yield bond funds (Chart A5) – such a gradual retreat could
help mitigate the risks of sudden large redemptions from high-yield bond funds down the road.
However, liquidity risks could be shifting to investment-grade corporate bonds. Outflows from US high-
yield bond funds have occurred alongside inflows into US investment-grade corporate bond funds, a sign
that investors could be switching into less risky, but still relatively illiquid investment-grade corporate
bonds. Should inflows into US investment-grade corporate bond funds accelerate, these funds and the
underlying market could become more vulnerable to shocks.
Chart A5
Cumulative Flows of US Bond Funds US
Source: EPFR, MAS estimates
Europe
Source: EPFR, MAS estimates
Asian Corporate Bond Markets
Asian corporate bond markets are less liquid compared to developed markets (DM)...
Asian corporate bond markets are less liquid compared to their DM counterparts. The corporate bond
turnover ratio (trading volume divided by market size) in Asia is substantially lower compared to that in
the US (Chart A6).
-50
150
350
550
750
2008 2010 2012 2014
US$
Bill
ion
Bond FundsCorporate Bond Funds- High-YieldCorporate Bond Funds- Investment-Grade
Nov
-80
-60
-40
-20
0
20
40
2008 2010 2012 2014
US$
Bill
ion
Bond FundsCorporate Bond Funds- High-YieldCorporate Bond Funds- Investment-Grade
Nov
Financial Stability Review, November 2014 8
Monetary Authority of Singapore Macroeconomic Surveillance Department
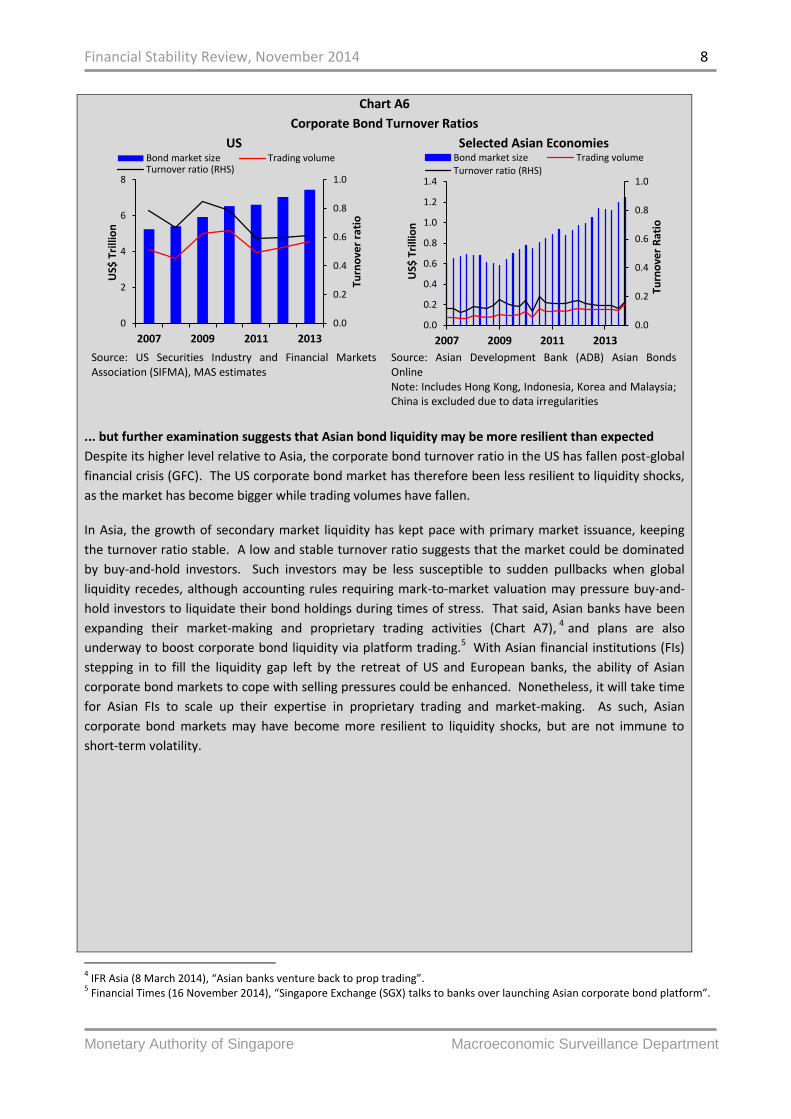
Chart A6
Corporate Bond Turnover Ratios
US
Source: US Securities Industry and Financial Markets Association (SIFMA), MAS estimates
Selected Asian Economies
Source: Asian Development Bank (ADB) Asian Bonds Online Note: Includes Hong Kong, Indonesia, Korea and Malaysia; China is excluded due to data irregularities
... but further examination suggests that Asian bond liquidity may be more resilient than expected
Despite its higher level relative to Asia, the corporate bond turnover ratio in the US has fallen post-global
financial crisis (GFC). The US corporate bond market has therefore been less resilient to liquidity shocks,
as the market has become bigger while trading volumes have fallen.
In Asia, the growth of secondary market liquidity has kept pace with primary market issuance, keeping
the turnover ratio stable. A low and stable turnover ratio suggests that the market could be dominated
by buy-and-hold investors. Such investors may be less susceptible to sudden pullbacks when global
liquidity recedes, although accounting rules requiring mark-to-market valuation may pressure buy-and-
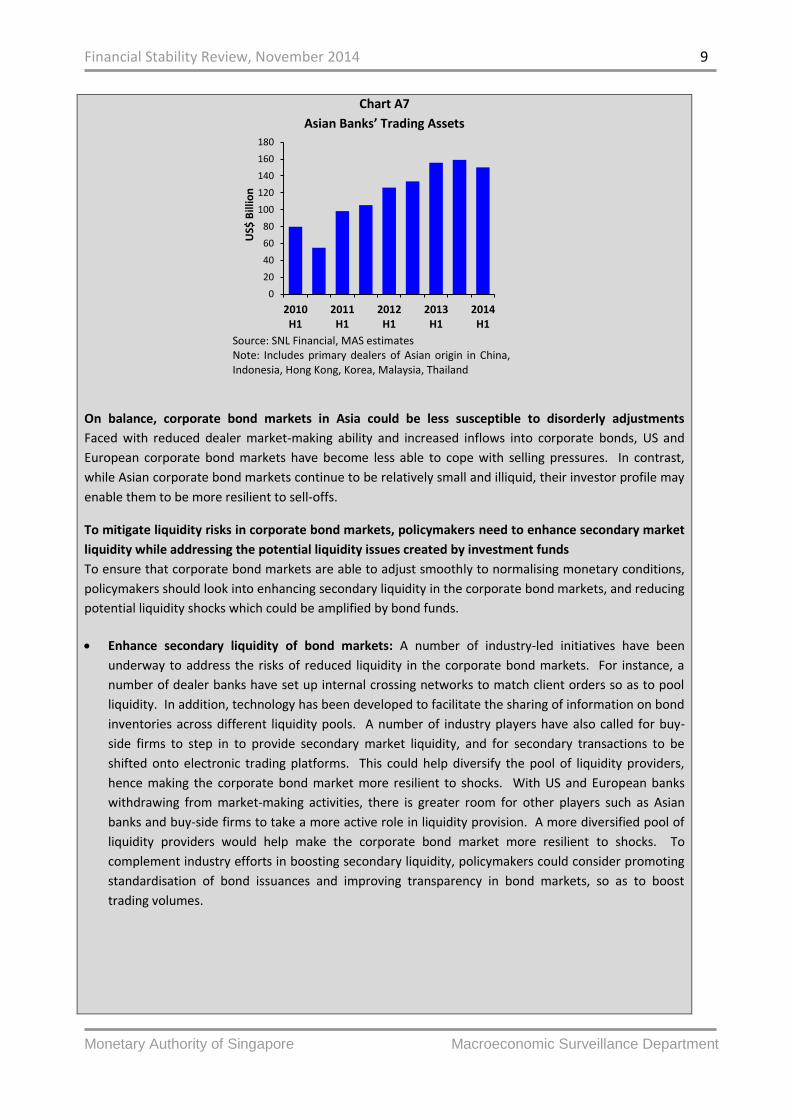
hold investors to liquidate their bond holdings during times of stress. That said, Asian banks have been
expanding their market-making and proprietary trading activities (Chart A7), 4 and plans are also
underway to boost corporate bond liquidity via platform trading.5 With Asian financial institutions (FIs)
stepping in to fill the liquidity gap left by the retreat of US and European banks, the ability of Asian
corporate bond markets to cope with selling pressures could be enhanced. Nonetheless, it will take time
for Asian FIs to scale up their expertise in proprietary trading and market-making. As such, Asian
corporate bond markets may have become more resilient to liquidity shocks, but are not immune to
short-term volatility.
4 IFR Asia (8 March 2014), “Asian banks venture back to prop trading”.
5 Financial Times (16 November 2014), “Singapore Exchange (SGX) talks to banks over launching Asian corporate bond platform”.
0.0
0.2
0.4
0.6
0.8
1.0
0
2
4
6
8
2007 2009 2011 2013
Turn
ove
r ra
tio
US$
Tri
llio
n
Bond market size Trading volumeTurnover ratio (RHS)
0.0
0.2
0.4
0.6
0.8
1.0
0.0
0.2
0.4
0.6
0.8
1.0
1.2
1.4
2007 2009 2011 2013
Turn
ove
r R
atio
US$
Tri
llio
n
Bond market size Trading volumeTurnover ratio (RHS)
Financial Stability Review, November 2014 9
Monetary Authority of Singapore Macroeconomic Surveillance Department
Chart A7
Asian Banks’ Trading Assets
Source: SNL Financial, MAS estimates Note: Includes primary dealers of Asian origin in China, Indonesia, Hong Kong, Korea, Malaysia, Thailand
On balance, corporate bond markets in Asia could be less susceptible to disorderly adjustments
Faced with reduced dealer market-making ability and increased inflows into corporate bonds, US and
European corporate bond markets have become less able to cope with selling pressures. In contrast,
while Asian corporate bond markets continue to be relatively small and illiquid, their investor profile may
enable them to be more resilient to sell-offs.
To mitigate liquidity risks in corporate bond markets, policymakers need to enhance secondary market
liquidity while addressing the potential liquidity issues created by investment funds
To ensure that corporate bond markets are able to adjust smoothly to normalising monetary conditions,
policymakers should look into enhancing secondary liquidity in the corporate bond markets, and reducing
potential liquidity shocks which could be amplified by bond funds.
Enhance secondary liquidity of bond markets: A number of industry-led initiatives have been
underway to address the risks of reduced liquidity in the corporate bond markets. For instance, a
number of dealer banks have set up internal crossing networks to match client orders so as to pool
liquidity. In addition, technology has been developed to facilitate the sharing of information on bond
inventories across different liquidity pools. A number of industry players have also called for buy-
side firms to step in to provide secondary market liquidity, and for secondary transactions to be
shifted onto electronic trading platforms. This could help diversify the pool of liquidity providers,
hence making the corporate bond market more resilient to shocks. With US and European banks
withdrawing from market-making activities, there is greater room for other players such as Asian
banks and buy-side firms to take a more active role in liquidity provision. A more diversified pool of
liquidity providers would help make the corporate bond market more resilient to shocks. To
complement industry efforts in boosting secondary liquidity, policymakers could consider promoting
standardisation of bond issuances and improving transparency in bond markets, so as to boost
trading volumes.
0
20
40
60
80
100
120
140
160
180
2010H1
2011H1
2012H1
2013H1
2014H1
US$
Bill
ion
Financial Stability Review, November 2014 10
Monetary Authority of Singapore Macroeconomic Surveillance Department
Address mismatch between liquidity promised by investment funds and the illiquidity of the
underlying asset: Another line of defence in addressing liquidity mismatches is to enhance investor
education and require better risk disclosure by bond funds. This empowers investors to make better
investment decisions. Beyond investor education, policymakers could intervene to ensure that
investors adequately factor in liquidity risks in their investment decisions. One possible option is to
set exit fees on bond funds. However, calibration of such exit fees has proven to be challenging as
liquidity risk premia are difficult to estimate, and the introduction of exit fees could accelerate
redemption, exacerbating sell-offs and liquidity risks. Another possible option could be to encourage
investment funds to offer redemption terms (e.g. minimum holding periods) that align with the
liquidity of the underlying assets.
Reduce liquidity mismatch by encouraging alignment of investment with appropriate risk appetite
and investment horizon: Institutional investors with long-dated liabilities, such as sovereign wealth
funds and pension funds, are better positioned to provide long-term financing for investments in
illiquid assets like infrastructure. This promotes better alignment of the liquidity risks of the
investment with the investor’s investment horizon, and also opens up a new source of long-term
financing for corporate borrowers. Ongoing efforts to develop robust infrastructure debt and equity
investment products (such as capital market instruments) could make it easier to assess the
associated risk-returns and make infrastructure an asset class which is more accessible to these
institutional investors. For investments which are more suited for shorter-term or more risk-averse
investors, policymakers could consider putting in place regulatory safeguards to enhance risk
disclosures and risk management practices.

Financial Stability Review, November 2014 11
Monetary Authority of Singapore Macroeconomic Surveillance Department
Box B Total Loss-Absorbing Capacity: Macroeconomic and Financial Stability Implications
This box examines the impact of implementing a total loss-absorbing capacity (TLAC) requirement on G-SIBs.
Overall, there could be a mild drag on global growth. However, there could be financial stability concerns
should non-bank FIs hold a substantial share of TLAC instruments.
TLAC allows for loss absorbency beyond the current minimum regulatory capital requirement
The objective of TLAC is to provide sufficient resources for a G-SIB to be resolved without needing taxpayer
capital support or causing severe systemic disruption. More specifically, TLAC allows a G-SIB to absorb losses
beyond the current minimum regulatory capital requirement under the present Basel III rules – 8% of risk-
weighted assets (RWA). This would provide more time and resources for authorities to resolve the G-SIB in an
orderly manner.
TLAC requirement could cause G-SIBs’ lending rates to rise by 33bps to 58bps, and global GDP growth to
decline by 0.09 to 0.15 percentage points per annum over the next five years
The proposed TLAC requirement would raise G-SIBs’ business costs, which if passed on to corporates and
households in the form of higher costs of credit or reduced credit supply, may lead to lower economic activity.
To assess the potential macroeconomic impact, we first estimate the additional capital needed to meet TLAC
purposes after taking stock of surplus capital that qualifies for TLAC. Surplus capital available, after taking into
account the Basel III minimum capital requirements and capital buffers (potentially totalling 13% of RWA6), are
more limited at UK and US G-SIBs, averaging 0.4% to 1.0% of RWA respectively, whereas surplus capital at
European (excluding UK) and Asian G-SIBs are higher, averaging 3.6% to 3.9% of RWA respectively (Chart B1). In
aggregate, the additional capital needed could range between US$787 billion to US$1,470 billion, assuming that
TLAC is calibrated at between 16% and 20% of RWA (Table B1).7
6 Comprising minimum capital requirement of 8%, capital conservation buffer of 2.5% and G-SIB surcharge of up to 2.5%.
Countercyclical capital buffer has been excluded as the buffer requirement kicks in only when it is assessed that there is excessive credit growth. 7 The Financial Stability Board (FSB) consultative document “Adequacy of loss-absorbing capacity of global systemically important
banks in resolution, November 2014” cites a possible TLAC range of 16% to 20% of RWA.

Financial Stability Review, November 2014 12
Monetary Authority of Singapore Macroeconomic Surveillance Department
Chart B1
Surplus Capital Available to Meet TLAC as % of
RWA
Source: Banks’ financial statements, MAS estimates
Table B1
Additional Capital Needed to Fulfil TLAC
Requirement Net of Surplus Capital
TLAC at 16% TLAC at 20%
UK G-SIBs US$ 103 bn US$ 192 bn
US G-SIBs US$ 481 bn US$ 761 bn
Europe (excl UK) G-SIBs
EUR 130 bn EUR 307 bn
Japan G-SIBs US$ 37 bn US$ 124 bn
Total US$ 787 bn US$ 1,470 bn
Source: Banks’ financial statements, MAS estimates
The additional capital needed for the TLAC requirement can be in the form of debt or equity.8 An extension of
the Modigiliani and Miller theorem suggests that a firm generally prefers debt capital which is cheaper than
equity capital due to the tax relief on interest payments but not on dividend payments. Empirically, a recent
OECD study estimates that the current cost of debt is around 4% to 6% (assuming investment-grade credit),
whereas the cost of equity is almost twice that of debt - around 10%.9
Assuming debt capital will be used to fulfil the additional capital needed for TLAC and extrapolating from
several past studies on Basel III capital requirements,10 implementing TLAC could increase G-SIBs’ lending rates
by 33bps to 58bps and reduce global GDP growth over the next five years by 0.09 to 0.15 percentage points per
annum.11
We also assess the ability of debt markets to absorb additional capital-raising to meet TLAC. Our estimates
suggest that debt raising would be manageable for most jurisdictions, ranging between 9% and 38% of annual
debt issuance for the European and Japanese debt markets (Table B2). However, it may be more difficult for
the US debt markets, with the additional capital ranging between 38% and 60% of annual debt issuance. This
may put further pressure on funding costs, which may in turn be passed on to borrowers in the form of higher
lending rates than the above estimates.
Table B2 Additional Capital Needed as % of Annual Debt Issuance (average over last five years)
TLAC at 16% TLAC at 20%
UK G-SIBs 20% 38%
US G-SIBs 38% 60%
Europe (excl UK) G-SIBs 10% 23%
Japan G-SIBs 9% 31% Source: Dealogic, MAS estimates
8 More specifically, there is an expectation that debt instruments will constitute an amount equal to or greater than 33% of the
TLAC requirement, so as to help ensure that there are sufficient resources available in resolution. 9 OECD (2013),“Long-term investment, the cost of capital and the dividend and buyback puzzle”.
10 Earlier studies by Bank for International Settlements (BIS), IIF, IMF and OECD suggest that implementing Basel III via raising
equity would result in increases in global lending rates ranging between 20bps to 360bps while annual GDP growth would be reduced by between 0.1 and 0.7 percentage points, over 2011 – 2015 than they would be in the absence of Basel III reforms. 11
Our estimates are based on a linear extrapolation of the global estimates from past studies on Basel III capital requirements, scaled for G-SIBs’ share of global banking assets.
0
2
4
6
8
10
12U
K G
-SIB
s
US
G-S
IBs
Euro
pe
(e
xcl U
K)
G-S
IBs
Jap
an G
-SIB
s
Pe
r C
en
t
Additional capital needed
Upper & Lower Bounds of Additional Capital Requirement
Financial Stability Review, November 2014 13
Monetary Authority of Singapore Macroeconomic Surveillance Department
There could be implications for G-SIBs’ balance sheets and systemic risk
The proposed TLAC requirement may incentivise G-SIBs to switch to debt funding from deposit funding.
However, the latter is typically a cheaper and more stable source of funding for banks, and would be useful for
meeting the liquidity coverage ratio (LCR) and net stable funding ratio (NSFR) requirements. The amount of
debt versus deposits that G-SIBs hold would depend to some extent on the trade-off between these
requirements.12
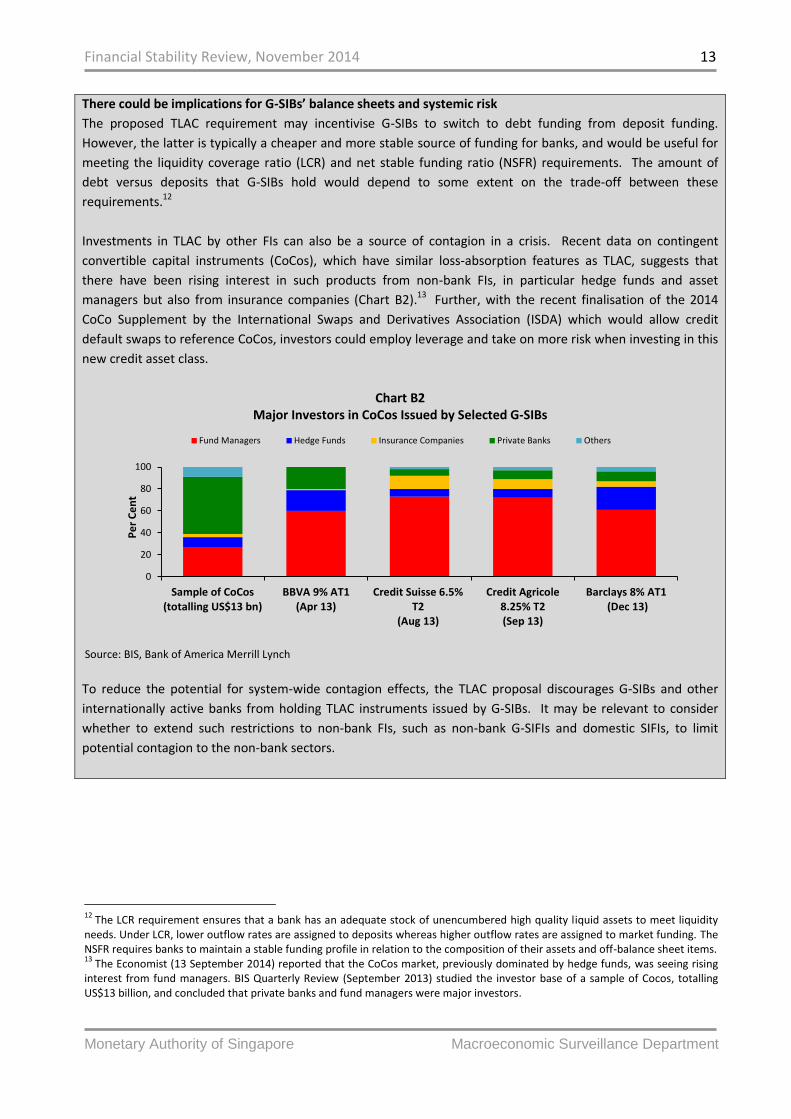
Investments in TLAC by other FIs can also be a source of contagion in a crisis. Recent data on contingent
convertible capital instruments (CoCos), which have similar loss-absorption features as TLAC, suggests that
there have been rising interest in such products from non-bank FIs, in particular hedge funds and asset
managers but also from insurance companies (Chart B2).13 Further, with the recent finalisation of the 2014
CoCo Supplement by the International Swaps and Derivatives Association (ISDA) which would allow credit
default swaps to reference CoCos, investors could employ leverage and take on more risk when investing in this
new credit asset class.
Chart B2 Major Investors in CoCos Issued by Selected G-SIBs
Source: BIS, Bank of America Merrill Lynch
To reduce the potential for system-wide contagion effects, the TLAC proposal discourages G-SIBs and other
internationally active banks from holding TLAC instruments issued by G-SIBs. It may be relevant to consider
whether to extend such restrictions to non-bank FIs, such as non-bank G-SIFIs and domestic SIFIs, to limit
potential contagion to the non-bank sectors.
12
The LCR requirement ensures that a bank has an adequate stock of unencumbered high quality liquid assets to meet liquidity needs. Under LCR, lower outflow rates are assigned to deposits whereas higher outflow rates are assigned to market funding. The NSFR requires banks to maintain a stable funding profile in relation to the composition of their assets and off-balance sheet items. 13
The Economist (13 September 2014) reported that the CoCos market, previously dominated by hedge funds, was seeing rising interest from fund managers. BIS Quarterly Review (September 2013) studied the investor base of a sample of Cocos, totalling US$13 billion, and concluded that private banks and fund managers were major investors.
0
20
40
60
80
100
Sample of CoCos(totalling US$13 bn)
BBVA 9% AT1(Apr 13)
Credit Suisse 6.5%T2
(Aug 13)
Credit Agricole8.25% T2(Sep 13)
Barclays 8% AT1 (Dec 13)
Pe
r C
en
t
Fund Managers Hedge Funds Insurance Companies Private Banks Others
Financial Stability Review, November 2014 14
Monetary Authority of Singapore Macroeconomic Surveillance Department
1.2 Asia Macroeconomic Environment and Financial System
Asian financial markets have largely stabilised following several episodes of LSAP tapering shocks in early
2014. Strong global liquidity and healthy risk appetites have continued to underpin buoyant financial
conditions in Asia.
Asian policymakers need to remain watchful amid economic uncertainties surrounding the G3 recovery
and the timing of rate hike by the US Federal Reserve. Asia’s strong debt build-up and high valuations in
some asset classes present financial stability risks. Global shocks could be amplified in Asia due to low
market liquidity in the region and stresses from capital outflows, with uneven impact on different parts of
Asia.
Looking ahead, Asian economies are expected to remain resilient amid active reforms by policymakers and
improved economic fundamentals. The present reprieve in financial markets provides an opportunity for
authorities to step up structural reforms and anchor investors’ confidence in the region, while balancing
their objective of near-term growth.
Asia’s economic outlook remains mixed due to
tentative recovery in external demand and varying
domestic headwinds
Asia has seen an uplift in external demand on the
back of G3 economic recovery, but downside risks
remain as growth momentum in the G3 falters in
late 2014. The outlook across Asia is mixed in the
presence of varying domestic headwinds.
Structural reforms and policy tightening in some
countries will further constrain domestic demand.
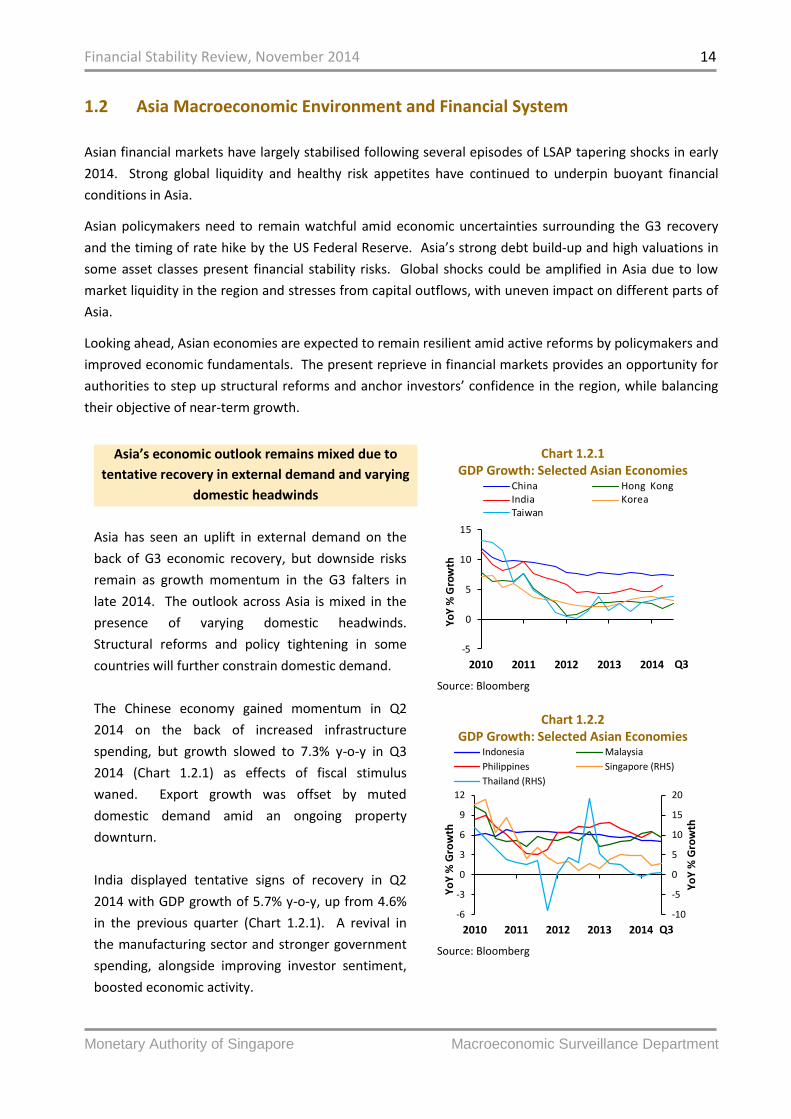
The Chinese economy gained momentum in Q2
2014 on the back of increased infrastructure
spending, but growth slowed to 7.3% y-o-y in Q3
2014 (Chart 1.2.1) as effects of fiscal stimulus
waned. Export growth was offset by muted
domestic demand amid an ongoing property
downturn.
India displayed tentative signs of recovery in Q2
2014 with GDP growth of 5.7% y-o-y, up from 4.6%
in the previous quarter (Chart 1.2.1). A revival in
the manufacturing sector and stronger government
spending, alongside improving investor sentiment,
boosted economic activity.
Chart 1.2.1 GDP Growth: Selected Asian Economies
Source: Bloomberg
Chart 1.2.2 GDP Growth: Selected Asian Economies
Source: Bloomberg
-5
0
5
10
15
2010 2011 2012 2013 2014
Yo
Y %
Gro
wth
China Hong KongIndia KoreaTaiwan
Q3
-10
-5
0
5
10
15
20
-6
-3
0
3
6
9
12
2010 2011 2012 2013 2014
Yo
Y %
Gro
wth
Yo
Y %
Gro
wth
Indonesia Malaysia
Philippines Singapore (RHS)
Thailand (RHS)
Q3
Financial Stability Review, November 2014 15
Monetary Authority of Singapore Macroeconomic Surveillance Department
South-east Asia remained generally resilient in Q2
2014 as a pickup in exports, led by stronger
shipments to the US and the euro zone, provided
some buffer against softening domestic demand.
Indonesia’s GDP growth eased further to 5.0% y-o-y
in Q3 (Chart 1.2.2) as past rounds of monetary
policy tightening dampened domestic demand.
Thailand’s economy sustained positive growth
momentum in Q3, expanding by 0.6% y-o-y,
following a contraction in Q1 2014 (Chart 1.2.2).
Other Asian economies have seen sluggish domestic
demand offsetting gains from external demand.
Korea’s GDP growth moderated with slowing private
consumption as consumer sentiment weakened. In
Hong Kong, retail sales were affected by political
uncertainty and lower spending by Chinese tourists
(Chart 1.2.1).
Looking ahead, Asia’s economic momentum hinges
on sustained recovery in the G3 and economic
stabilisation in China.
Chinese policymakers are likely to continue
supporting domestic demand through fiscal and
monetary easing. In the other Asian economies, a
slowdown in growth momentum in China and some
parts of G3 could continue to pose downside risks to
external demand and growth.
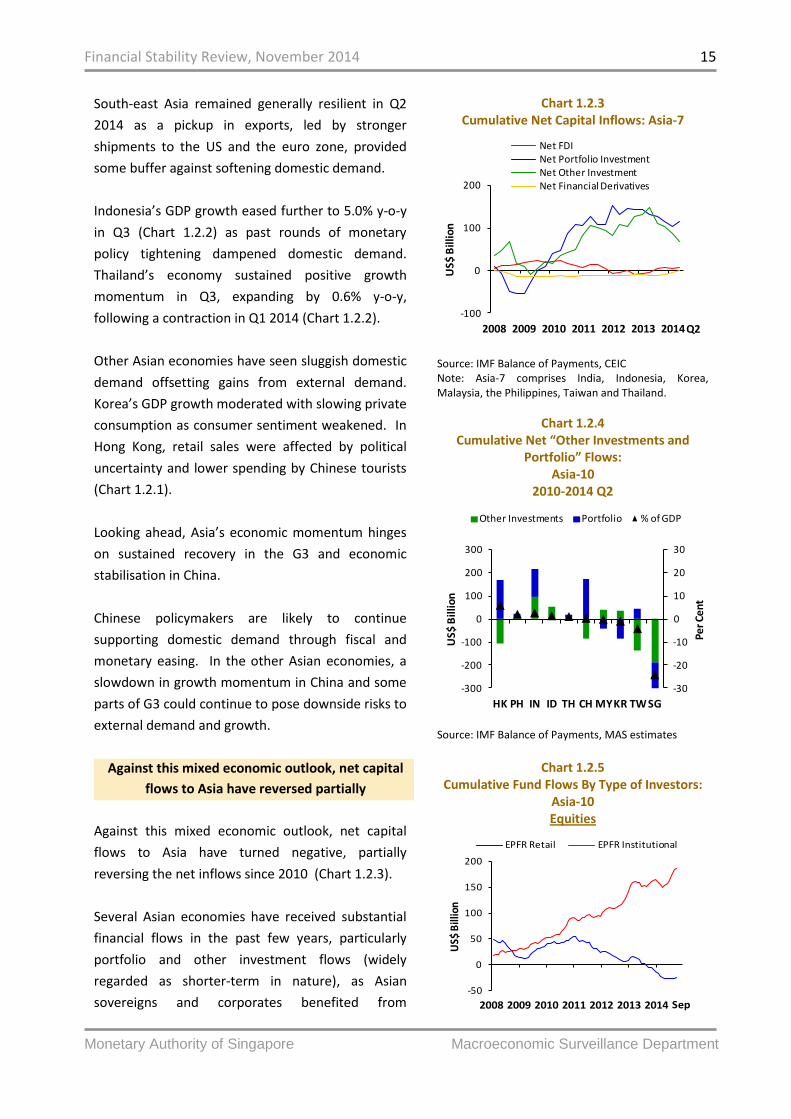
Against this mixed economic outlook, net capital
flows to Asia have reversed partially
Against this mixed economic outlook, net capital
flows to Asia have turned negative, partially
reversing the net inflows since 2010 (Chart 1.2.3).
Several Asian economies have received substantial
financial flows in the past few years, particularly
portfolio and other investment flows (widely
regarded as shorter-term in nature), as Asian
sovereigns and corporates benefited from
Chart 1.2.3 Cumulative Net Capital Inflows: Asia-7
Source: IMF Balance of Payments, CEIC Note: Asia-7 comprises India, Indonesia, Korea, Malaysia, the Philippines, Taiwan and Thailand.
Chart 1.2.4 Cumulative Net “Other Investments and
Portfolio” Flows: Asia-10
2010-2014 Q2
Source: IMF Balance of Payments, MAS estimates
Chart 1.2.5
Cumulative Fund Flows By Type of Investors: Asia-10 Equities
-100
0
100
200
2008 2009 2010 2011 2012 2013 2014
US$
Bill
ion
Net FDINet Portfolio InvestmentNet Other InvestmentNet Financial Derivatives
Q2
-30
-20
-10
0
10
20
30
-300
-200
-100
0
100
200
300
HK PH IN ID TH CH MYKR TW SGP
er C
ent
US$
Bil
lio
n
Other Investments Portfolio % of GDP
-50
0
50
100
150
200
2008 2009 2010 2011 2012 2013 2014
US$
Bill
ion
EPFR Retail EPFR Institutional
Sep

Financial Stability Review, November 2014 16
Monetary Authority of Singapore Macroeconomic Surveillance Department
historically low risk premia and global volatility
(Chart 1.2.4).
During the episodes of tapering shocks in late 2013
and early 2014, exits from Asia-10 equities and
bonds were driven mainly by retail funds, while
institutional funds maintained or even increased
holdings, reflecting longer-term optimism over
growth prospects in emerging Asia (Chart 1.2.5).
Looking ahead, uncertainty in the timing of an
interest rate rise in the US is likely to lead to greater
volatility in Asian capital flows. Asian policymakers
will need to step up structural reforms and anchor
investors’ confidence as a buffer against potential
shocks originating from markets in G3 economies.
This could involve deepening and broadening
domestic capital markets, and promoting a more
diversified investor base.
Global shocks may be amplified in Asian markets
through low market liquidity and herding
behaviour among asset managers
Shocks originating from markets in G3 economies
could lead to sudden capital withdrawals from
emerging Asia’s assets, with low market liquidity
and herding behaviour amplifying such shocks.
Liquidity risks could be propagated through
portfolio investment channels, alongside low
underlying market liquidity. The growth of liquidity
transforming products such as exchange-traded
funds (ETFs), which are frequently more liquid than
the assets they track, exacerbates this risk.
Investments by ETFs into Asia-10 has been on the
rise, accounting for over 18% of all equity
investments by funds in 2014 (Chart 1.2.6). While
ETFs occupy only a small proportion of overall
market capitalisation in Asia, the high frequency of
ETF trades, relative to overall trading activity on
Asian stock exchanges (Chart 1.2.7), calls for further
Bonds
Source: EPFR, MAS estimates
Chart 1.2.6
Net Assets of ETF funds in Asia-10 Equities
Source: EPFR, MAS estimates Note: The Vanguard MSCI Emerging Markets ETF has been excluded as it was added to EPFR data in 2012.
Chart 1.2.7 % Average Daily Turnover in 2013 of Stock
Exchange Attributed to ETFs: Asia-10
Source: Bloomberg, World Federation of Stock Exchanges, MAS estimates
-5
0
5
10
15
20
25
30
35
2008 2009 2010 2011 2012 2013 2014
US$
Bill
ion
EPFR Retail EPFR Institutional
Sep
0
5
10
15
20
25
30
35
0
50
100
150
200
250
300
350
2006 2008 2010 2012 2014
Pe
r Ce
nt
US$
Bill
ion
ETF
Non-ETF
ETF as % of Total (RHS)
Sep
0
4
8
12
16
Ch
ina
Ho
ng
Ko
ng
Ind
ia
Ind
on
esi
a
Mal
aysi
a
Ph
illip
pin
es
Sin
gap
ore
Sou
th K
ore
a
Taiw
an
Thai
lan
d
Pe
r C
en
t

Financial Stability Review, November 2014 17
Monetary Authority of Singapore Macroeconomic Surveillance Department
14
ETFs account for 0.48% of 2013 market capitalisation in Asia-10. 15
Ken Miyajima, Ilhyock Shim, BIS Quarterly Review (September 2014), “Asset Managers in Emerging Market Economies”.
monitoring of ETFs and their contribution to
liquidity risk.14
Further, the active referencing of benchmark indices
by asset managers could encourage herding
behaviour and increase correlation of investment
behaviour in Asian assets, potentially exacerbating
any decline in asset prices.15
Asian financial markets have rallied following
episodes of tapering shocks in early 2014
Asian financial markets have shrugged off episodes
of tapering shocks in early 2014 on the back of
resilient growth and intensifying reform efforts by
policymakers in Asia.
Economic fundamentals have improved since the
currency, bond and equity market sell-offs in early
2014. Import coverage has also been strengthened
through a strong build-up of international reserves
(Chart 1.2.8).
Equity markets in Asia have rallied (Chart 1.2.9) as
confidence in financial resilience bolstered investor
sentiment.
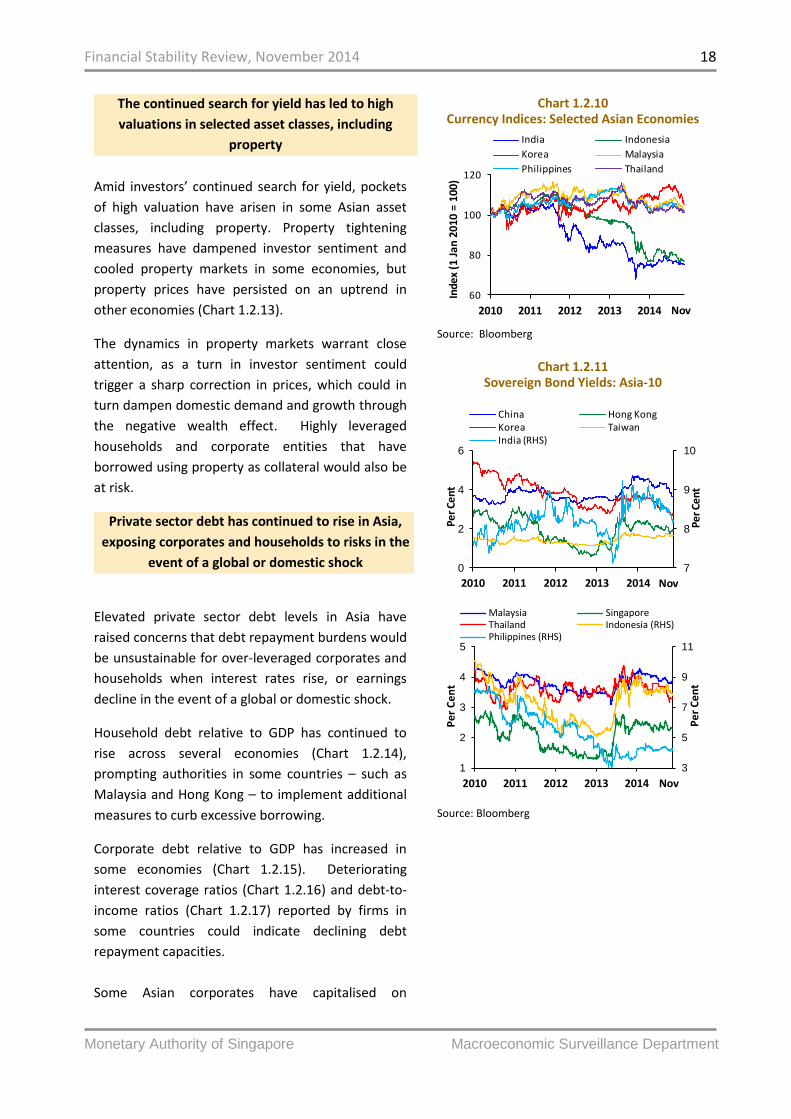
Asian currencies have strengthened following the
sell-off in early 2014. The Indian rupee and the
Indonesian rupiah, which saw the most significant
decline amongst Asian currencies during the
tapering episodes, have stabilised (Chart 1.2.10).
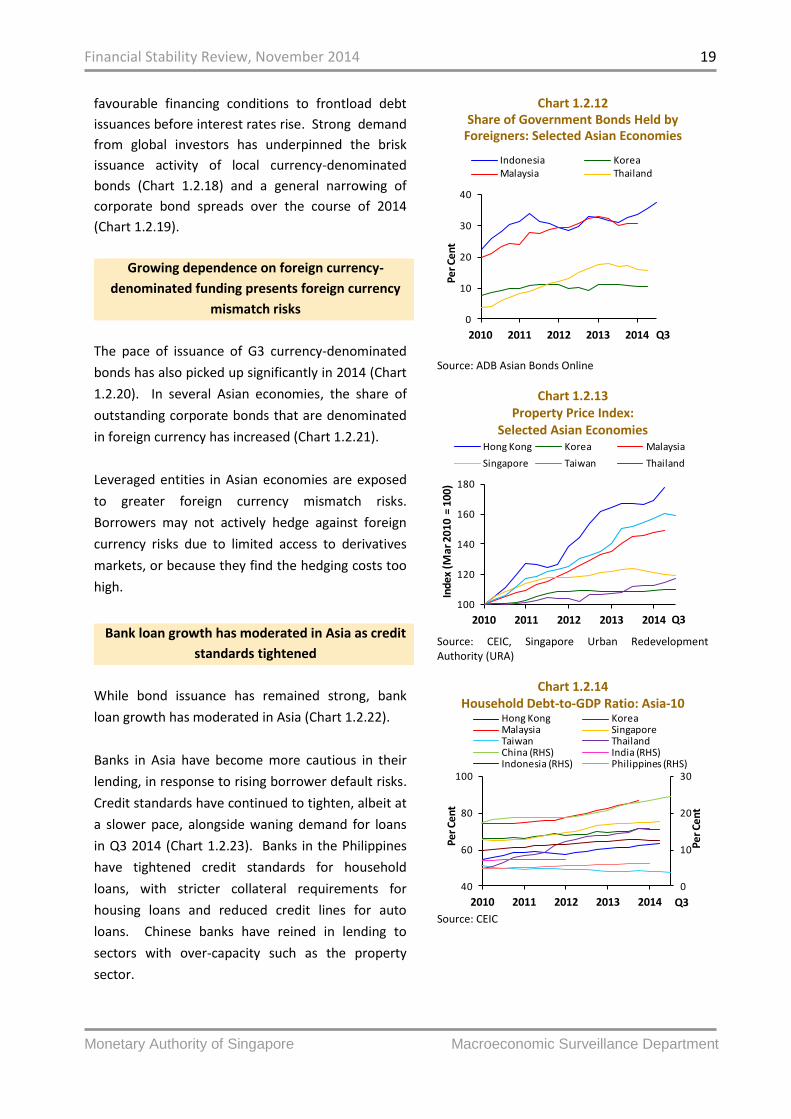
Further, sovereign bond yields have fallen in several
Asian economies (Chart 1.2.11) as foreign appetite
for Asian sovereign credit picked up once again
(Chart 1.2.12).
Chart 1.2.8
International Reserves: Months of Import Cover: Selected Asian Economies
Source: IMF Note: Imports are calculated based on a 12-month rolling average basis.
Chart 1.2.9 Stock Market Indices: Asia-10
Source: Bloomberg
0
10
20
30
5
7
9
11
2013Jan
2013 May
2013 Sep
2014Jan
2014 May
2014 Sep
Mo
nth
s
Mo
nth
s
Hong Kong India Indonesia KoreaMalaysia SingaporeThailand China (RHS)Philippines (RHS)
40
60
80
100
120
140
160
2010 2011 2012 2013 2014
Ind
ex
(1 J
an 2
01
0 =
10
0)
China Hong Kong
India Korea
Taiwan
Nov
60
90
120
150
180
210
240
2010 2011 2012 2013 2014
Inde
x (1
Jan
201
0 =
100)
Indonesia MalaysiaPhilippines SingaporeThailand
Nov
Financial Stability Review, November 2014 18
Monetary Authority of Singapore Macroeconomic Surveillance Department
The continued search for yield has led to high
valuations in selected asset classes, including
property
Amid investors’ continued search for yield, pockets
of high valuation have arisen in some Asian asset
classes, including property. Property tightening
measures have dampened investor sentiment and
cooled property markets in some economies, but
property prices have persisted on an uptrend in
other economies (Chart 1.2.13).
The dynamics in property markets warrant close
attention, as a turn in investor sentiment could
trigger a sharp correction in prices, which could in
turn dampen domestic demand and growth through
the negative wealth effect. Highly leveraged
households and corporate entities that have
borrowed using property as collateral would also be
at risk.
Private sector debt has continued to rise in Asia,
exposing corporates and households to risks in the
event of a global or domestic shock
Elevated private sector debt levels in Asia have
raised concerns that debt repayment burdens would
be unsustainable for over-leveraged corporates and
households when interest rates rise, or earnings
decline in the event of a global or domestic shock.
Household debt relative to GDP has continued to
rise across several economies (Chart 1.2.14),
prompting authorities in some countries – such as
Malaysia and Hong Kong – to implement additional
measures to curb excessive borrowing.
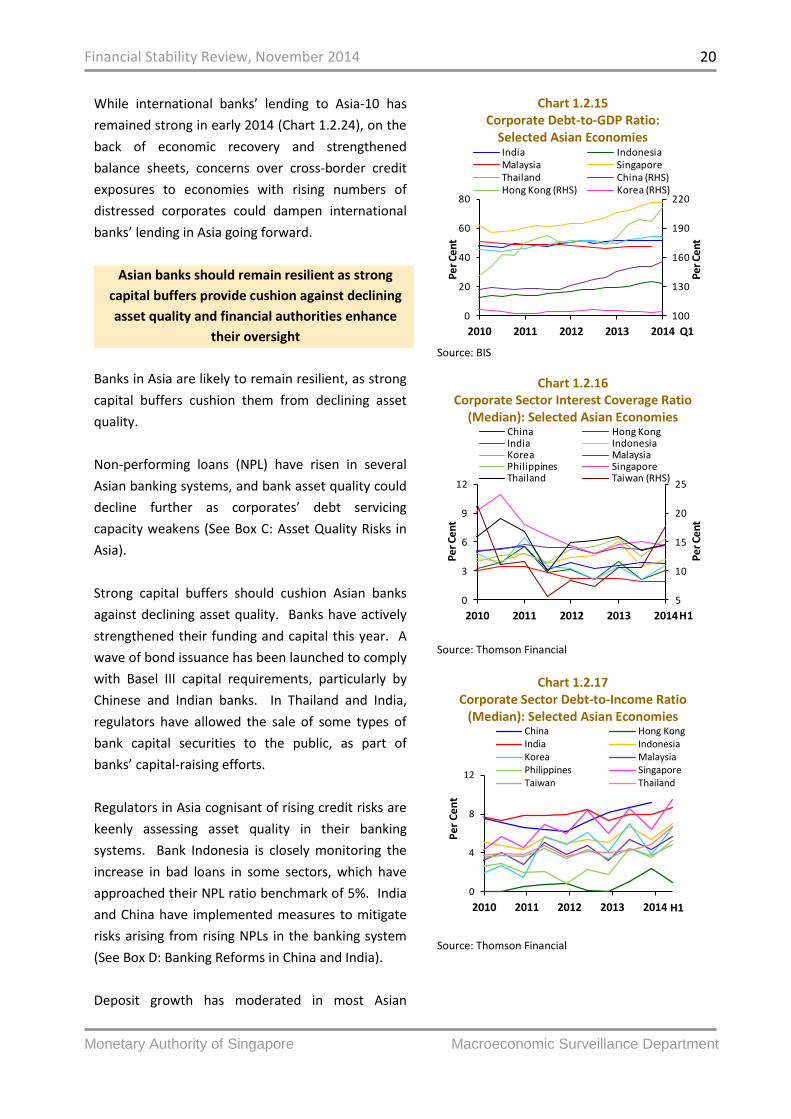
Corporate debt relative to GDP has increased in
some economies (Chart 1.2.15). Deteriorating
interest coverage ratios (Chart 1.2.16) and debt-to-
income ratios (Chart 1.2.17) reported by firms in
some countries could indicate declining debt
repayment capacities.
Some Asian corporates have capitalised on
Chart 1.2.10 Currency Indices: Selected Asian Economies
Source: Bloomberg
Chart 1.2.11
Sovereign Bond Yields: Asia-10
Source: Bloomberg
60
80
100
120
2010 2011 2012 2013 2014
Inde
x (1
Jan
201
0 =
100)
India Indonesia
Korea Malaysia
Philippines Thailand
Nov
7
8
9
10
0
2
4
6
2010 2011 2012 2013 2014
Per
Cent
Per
Cent
China Hong KongKorea TaiwanIndia (RHS)
Nov
3
5
7
9
11
1
2
3
4
5
2010 2011 2012 2013 2014
Pe
r C
en
t
Pe
r C
en
t
Malaysia SingaporeThailand Indonesia (RHS)Philippines (RHS)
Nov
Financial Stability Review, November 2014 19
Monetary Authority of Singapore Macroeconomic Surveillance Department
favourable financing conditions to frontload debt
issuances before interest rates rise. Strong demand
from global investors has underpinned the brisk
issuance activity of local currency-denominated
bonds (Chart 1.2.18) and a general narrowing of
corporate bond spreads over the course of 2014
(Chart 1.2.19).
Growing dependence on foreign currency-
denominated funding presents foreign currency
mismatch risks
The pace of issuance of G3 currency-denominated
bonds has also picked up significantly in 2014 (Chart
1.2.20). In several Asian economies, the share of
outstanding corporate bonds that are denominated
in foreign currency has increased (Chart 1.2.21).
Leveraged entities in Asian economies are exposed
to greater foreign currency mismatch risks.
Borrowers may not actively hedge against foreign
currency risks due to limited access to derivatives
markets, or because they find the hedging costs too
high.
Bank loan growth has moderated in Asia as credit
standards tightened
While bond issuance has remained strong, bank
loan growth has moderated in Asia (Chart 1.2.22).
Banks in Asia have become more cautious in their
lending, in response to rising borrower default risks.
Credit standards have continued to tighten, albeit at
a slower pace, alongside waning demand for loans
in Q3 2014 (Chart 1.2.23). Banks in the Philippines
have tightened credit standards for household
loans, with stricter collateral requirements for
housing loans and reduced credit lines for auto
loans. Chinese banks have reined in lending to
sectors with over-capacity such as the property
sector.
Chart 1.2.12 Share of Government Bonds Held by
Foreigners: Selected Asian Economies
Source: ADB Asian Bonds Online
Chart 1.2.13 Property Price Index:
Selected Asian Economies
Source: CEIC, Singapore Urban Redevelopment Authority (URA)
Chart 1.2.14 Household Debt-to-GDP Ratio: Asia-10
Source: CEIC
0
10
20
30
40
2010 2011 2012 2013 2014
Pe
r Ce
nt
Indonesia Korea Malaysia Thailand
Q3
100
120
140
160
180
2010 2011 2012 2013 2014
Inde
x (M
ar 2
010
= 10
0)Hong Kong Korea Malaysia
Singapore Taiwan Thailand
Q3
0
10
20
30
40
60
80
100
2010 2011 2012 2013 2014
Pe
r C
ent
Per C
ent
Hong Kong KoreaMalaysia SingaporeTaiwan ThailandChina (RHS) India (RHS)Indonesia (RHS) Philippines (RHS)
Q3
Financial Stability Review, November 2014 20
Monetary Authority of Singapore Macroeconomic Surveillance Department
While international banks’ lending to Asia-10 has
remained strong in early 2014 (Chart 1.2.24), on the
back of economic recovery and strengthened
balance sheets, concerns over cross-border credit
exposures to economies with rising numbers of
distressed corporates could dampen international
banks’ lending in Asia going forward.
Asian banks should remain resilient as strong
capital buffers provide cushion against declining
asset quality and financial authorities enhance
their oversight
Banks in Asia are likely to remain resilient, as strong
capital buffers cushion them from declining asset
quality.
Non-performing loans (NPL) have risen in several
Asian banking systems, and bank asset quality could
decline further as corporates’ debt servicing
capacity weakens (See Box C: Asset Quality Risks in
Asia).
Strong capital buffers should cushion Asian banks
against declining asset quality. Banks have actively
strengthened their funding and capital this year. A
wave of bond issuance has been launched to comply
with Basel III capital requirements, particularly by
Chinese and Indian banks. In Thailand and India,
regulators have allowed the sale of some types of
bank capital securities to the public, as part of
banks’ capital-raising efforts.
Regulators in Asia cognisant of rising credit risks are
keenly assessing asset quality in their banking
systems. Bank Indonesia is closely monitoring the
increase in bad loans in some sectors, which have
approached their NPL ratio benchmark of 5%. India
and China have implemented measures to mitigate
risks arising from rising NPLs in the banking system
(See Box D: Banking Reforms in China and India).
Deposit growth has moderated in most Asian
Chart 1.2.15 Corporate Debt-to-GDP Ratio:
Selected Asian Economies
Source: BIS
Chart 1.2.16 Corporate Sector Interest Coverage Ratio
(Median): Selected Asian Economies
Source: Thomson Financial
Chart 1.2.17
Corporate Sector Debt-to-Income Ratio (Median): Selected Asian Economies
Source: Thomson Financial
100
130
160
190
220
0
20
40
60
80
2010 2011 2012 2013 2014
Per C
ent
Pe
r Ce
nt
India IndonesiaMalaysia SingaporeThailand China (RHS)Hong Kong (RHS) Korea (RHS)
Q1
5
10
15
20
25
0
3
6
9
12
2010 2011 2012 2013 2014
Per C
ent
Pe
r C
ent
China Hong KongIndia IndonesiaKorea MalaysiaPhilippines SingaporeThailand Taiwan (RHS)
H1
0
4
8
12
2010 2011 2012 2013 2014
Pe
r C
en
t
China Hong KongIndia IndonesiaKorea MalaysiaPhilippines SingaporeTaiwan Thailand
H1

Financial Stability Review, November 2014 21
Monetary Authority of Singapore Macroeconomic Surveillance Department
economies (Chart 1.2.25) as depositors search for
higher yield in other asset classes. In several
economies, deposit growth has not kept pace with
loan growth, and the consequent rise in loan-to-
deposit (LTD) ratios and funding concerns could
constrain bank capacity to support new lending.
Banks across several parts of Asia have already
raised rates on time and fixed deposits to attract
depositors. The intensifying competition for
deposits could adversely impact the smaller banks in
the banking system.
A pullback in funding by international banks amid
evolving global monetary conditions could also
exacerbate funding and liquidity risks in the Asian
banking system.
Tightening of regulated lending has facilitated the
growth in non-bank financing, but risks arising
from shadow banking should be closely monitored
The tightening of bank credit in Asia has encouraged
some borrowers to turn to non-bank financing. The
size of non-bank financial intermediaries in most
parts of Asia, as a proportion of GDP, remains small
compared to advanced economies. In several
economies, the growth in non-bank financing has
been rapid, and has outpaced banking sector
growth (Chart 1.2.26).
Rapid growth in non-bank financing has led to
concerns over regulatory arbitrage and risks arising
from the shadow banking sector.
Non-bank financial intermediaries in emerging
markets can function as an alternative source of
credit intermediation and facilitate the deepening of
financial markets. Micro-lending in India, for
example, and more diversified funding sources for
corporate debt across Asia are not unwelcome
developments.
However, a precipitate shift towards unregulated
lending could undermine efforts by authorities to
Chart 1.2.18 Local Currency-Denominated Corporate Bond
Issuance: Selected Asian Economies
Source: ADB Asian Bonds Online
Chart 1.2.19 Corporate Bond Spreads: Asia-10
Source: JP Morgan Note: Spreads comprise the difference between yields on US dollar-denominated corporate bonds in Asia and yields on US treasury bonds.
0
100
200
300
0
10
20
30
2010 2011 2012 2013 2014
US$
Bill
ion
US$
Bil
lion
Hong Kong Indonesia Malaysia
Philippines Singapore Thailand
China (RHS) Korea (RHS)
Q3
250
500
750
1,000
1,250
1,500
100
200
300
400
500
600
2010 2011 2012 2013 2014
Bas
is P
oin
ts
Bas
is P
oin
ts
Hong Kong India
Korea Taiwan
China(RHS)
Nov
250
500
750
1,000
1,250
1,500
100
200
300
400
500
600
2010 2011 2012 2013 2014
Bas
is P
oin
ts
Bas
is P
oin
ts
Malaysia Philippines
Singapore Thailand
Indonesia (RHS)
Nov
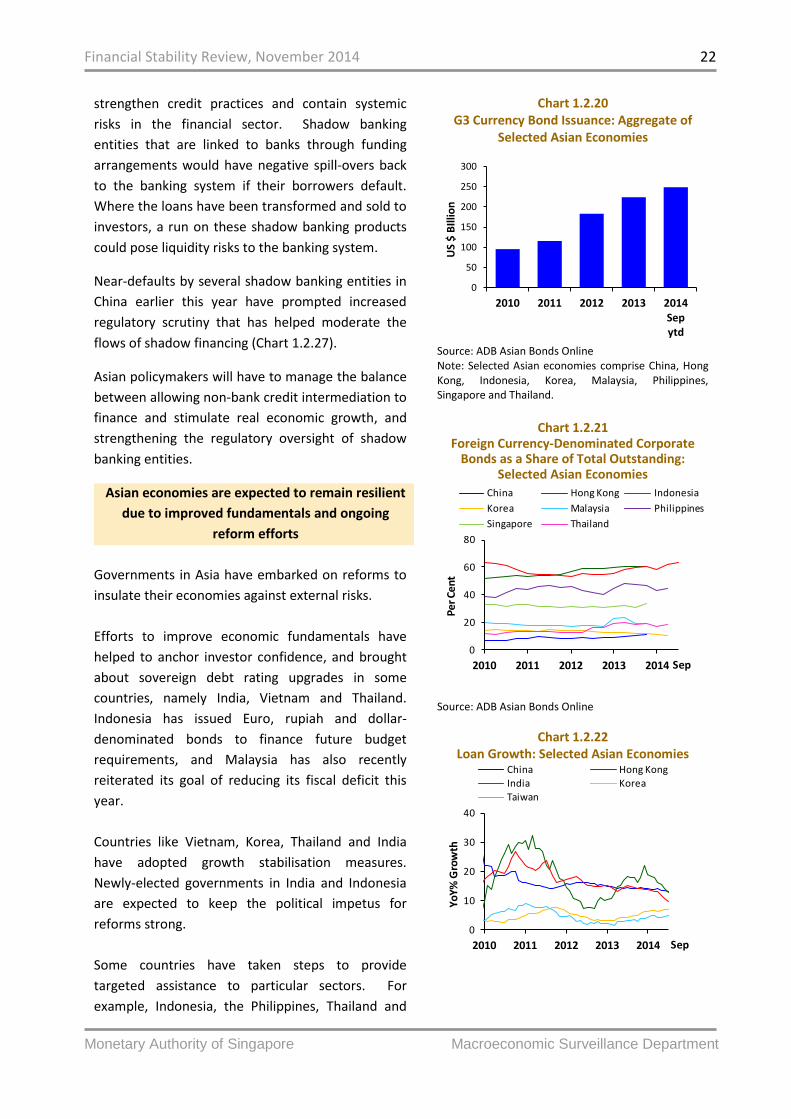
Financial Stability Review, November 2014 22
Monetary Authority of Singapore Macroeconomic Surveillance Department
strengthen credit practices and contain systemic
risks in the financial sector. Shadow banking
entities that are linked to banks through funding
arrangements would have negative spill-overs back
to the banking system if their borrowers default.
Where the loans have been transformed and sold to
investors, a run on these shadow banking products
could pose liquidity risks to the banking system.
Near-defaults by several shadow banking entities in
China earlier this year have prompted increased
regulatory scrutiny that has helped moderate the
flows of shadow financing (Chart 1.2.27).
Asian policymakers will have to manage the balance
between allowing non-bank credit intermediation to
finance and stimulate real economic growth, and
strengthening the regulatory oversight of shadow
banking entities.
Asian economies are expected to remain resilient
due to improved fundamentals and ongoing
reform efforts
Governments in Asia have embarked on reforms to
insulate their economies against external risks.
Efforts to improve economic fundamentals have
helped to anchor investor confidence, and brought
about sovereign debt rating upgrades in some
countries, namely India, Vietnam and Thailand.
Indonesia has issued Euro, rupiah and dollar-
denominated bonds to finance future budget
requirements, and Malaysia has also recently
reiterated its goal of reducing its fiscal deficit this
year.
Countries like Vietnam, Korea, Thailand and India
have adopted growth stabilisation measures.
Newly-elected governments in India and Indonesia
are expected to keep the political impetus for
reforms strong.
Some countries have taken steps to provide
targeted assistance to particular sectors. For
example, Indonesia, the Philippines, Thailand and
Chart 1.2.20 G3 Currency Bond Issuance: Aggregate of
Selected Asian Economies
Source: ADB Asian Bonds Online Note: Selected Asian economies comprise China, Hong Kong, Indonesia, Korea, Malaysia, Philippines, Singapore and Thailand.
Chart 1.2.21
Foreign Currency-Denominated Corporate Bonds as a Share of Total Outstanding:
Selected Asian Economies
Source: ADB Asian Bonds Online
Chart 1.2.22 Loan Growth: Selected Asian Economies
0
50
100
150
200
250
300
2010 2011 2012 2013 2014Sepytd
US
$ B
Illio
n
0
20
40
60
80
2010 2011 2012 2013 2014
Pe
r C
en
t
China Hong Kong Indonesia
Korea Malaysia Philippines
Singapore Thailand
Sep
0
10
20
30
40
2010 2011 2012 2013 2014
Yo
Y%
Gro
wth
China Hong Kong
India Korea
Taiwan
Sep
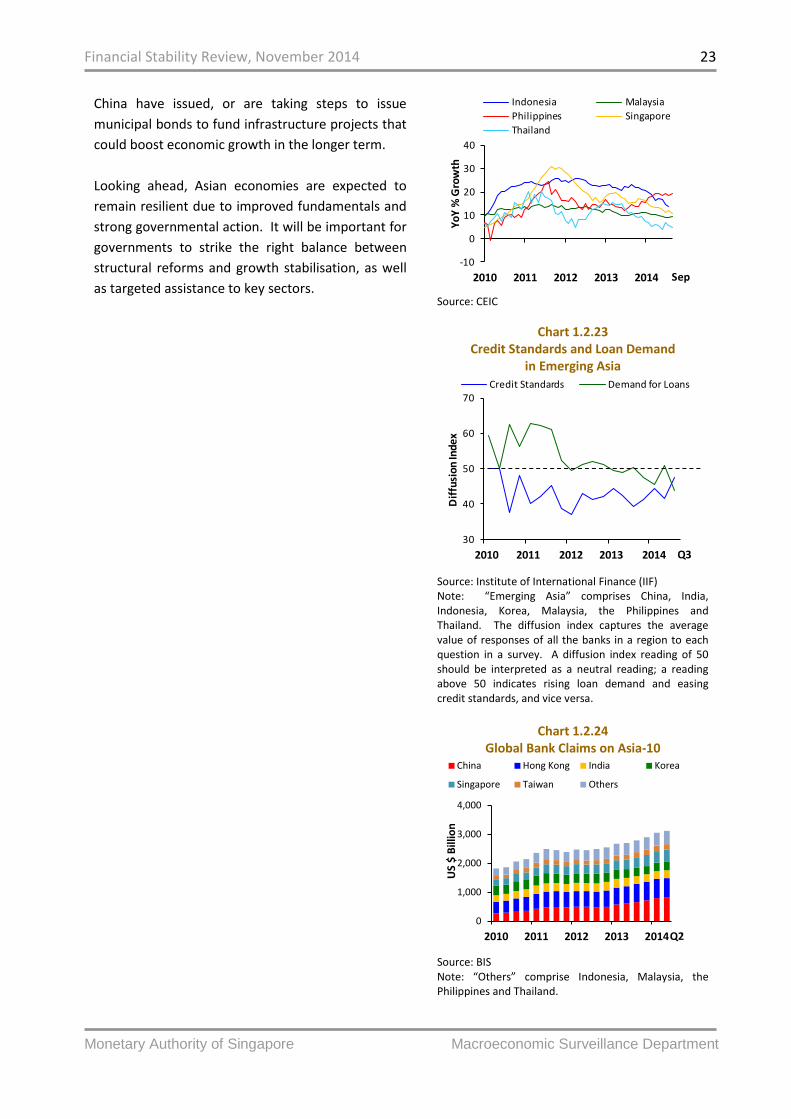
Financial Stability Review, November 2014 23
Monetary Authority of Singapore Macroeconomic Surveillance Department
China have issued, or are taking steps to issue
municipal bonds to fund infrastructure projects that
could boost economic growth in the longer term.
Looking ahead, Asian economies are expected to
remain resilient due to improved fundamentals and
strong governmental action. It will be important for
governments to strike the right balance between
structural reforms and growth stabilisation, as well
as targeted assistance to key sectors.
Source: CEIC
Chart 1.2.23 Credit Standards and Loan Demand
in Emerging Asia
Source: Institute of International Finance (IIF) Note: “Emerging Asia” comprises China, India, Indonesia, Korea, Malaysia, the Philippines and Thailand. The diffusion index captures the average value of responses of all the banks in a region to each question in a survey. A diffusion index reading of 50 should be interpreted as a neutral reading; a reading above 50 indicates rising loan demand and easing credit standards, and vice versa.
Chart 1.2.24
Global Bank Claims on Asia-10
Source: BIS Note: “Others” comprise Indonesia, Malaysia, the Philippines and Thailand.
-10
0
10
20
30
40
2010 2011 2012 2013 2014
Yo
Y %
Gro
wth
Indonesia Malaysia
Philippines Singapore
Thailand
Sep
30
40
50
60
70
2010 2011 2012 2013 2014
Dif
fusi
on
Ind
ex
Credit Standards Demand for Loans
Q3
0
1,000
2,000
3,000
4,000
2010 2011 2012 2013 2014
US
$ B
illio
n
China Hong Kong India Korea
Singapore Taiwan Others
Q2
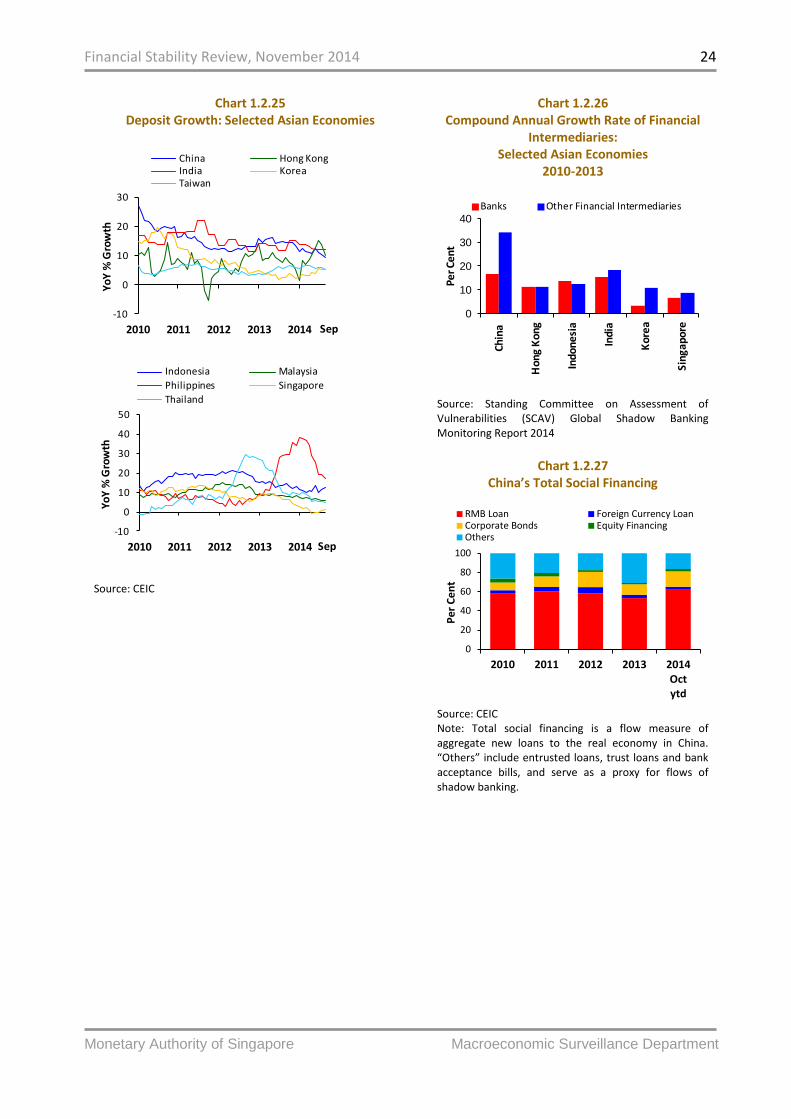
Financial Stability Review, November 2014 24
Monetary Authority of Singapore Macroeconomic Surveillance Department
Chart 1.2.25 Deposit Growth: Selected Asian Economies
Source: CEIC
Chart 1.2.26 Compound Annual Growth Rate of Financial
Intermediaries: Selected Asian Economies
2010-2013
Source: Standing Committee on Assessment of Vulnerabilities (SCAV) Global Shadow Banking Monitoring Report 2014
Chart 1.2.27
China’s Total Social Financing
Source: CEIC Note: Total social financing is a flow measure of aggregate new loans to the real economy in China. “Others” include entrusted loans, trust loans and bank acceptance bills, and serve as a proxy for flows of shadow banking.
-10
0
10
20
30
2010 2011 2012 2013 2014
Yo
Y %
Gro
wth
China Hong KongIndia KoreaTaiwan
Sep
-10
0
10
20
30
40
50
2010 2011 2012 2013 2014
Yo
Y %
Gro
wth
Indonesia Malaysia
Philippines Singapore
Thailand
Sep
0
10
20
30
40
Ch
ina
Ho
ng
Ko
ng
Ind
on
esi
a
Ind
ia
Ko
rea
Sin
gapo
re
Per C
ent
Banks Other Financial Intermediaries
0
20
40
60
80
100
2010 2011 2012 2013 2014Octytd
Pe
r C
en
t
RMB Loan Foreign Currency LoanCorporate Bonds Equity FinancingOthers

Financial Stability Review, November 2014 25
Monetary Authority of Singapore Macroeconomic Surveillance Department
Box C
Asset Quality Risks in Asia
Rising corporate leverage and an increase in NPLs in some Asian banking systems have raised concerns over
asset quality risks in banks’ corporate loan books (Chart C1). Across most of Asia-10, corporate loans make up
the majority of bank loan exposures (Chart C2). This box takes a closer look at asset quality risks in Asia by
examining banks’ corporate loan exposures and indicators of corporate leverage.
While banks in Asia remain broadly resilient, pockets of risk exist in specific sectors. Corporates’ un-hedged
exposures to foreign currency borrowings could also subject banks to foreign currency mismatch risks.
Enhancing data collection initiatives could help authorities improve their oversight of asset quality risks posed
by corporate borrowers.
Chart C1
Non-Performing Loan (NPL) Ratios: Asia-10
Source: CEIC
Chart C2
Breakdown of Total Bank Loan Books: Selected Asian Economies
Source: Asia-9 Central Banks Note: Excludes inter-bank loans
Banks in Asia are primarily exposed to manufacturing, retail and property sectors, but these sectors are
affected by headwinds to varying extents
The manufacturing, retail and construction sectors combined account for more than 50% of banks’ corporate
loans in most Asian economies (Chart C3). Headwinds to these sectors are thus likely to affect asset quality to a
greater extent. Strong capital inflows in recent years have also contributed to high valuations in certain asset
classes, including property. Banks exposed to these sectors could be subject to additional asset quality risks in
the event of a disorderly correction in market conditions.
0
2
4
6
2010 2011 2012 2013 2014
Pe
r C
en
t
China Hong KongIndia IndonesiaKorea MalaysiaPhilippines Singapore Taiwan Thailand
Sep
0
20
40
60
80
100PH IN TH ID H
K
SG KR
TW MY
Per C
ent
Corporates Households Others

Financial Stability Review, November 2014 26
Monetary Authority of Singapore Macroeconomic Surveillance Department
Chart C3
Breakdown of Corporate Loan Books by Sectors: Selected Asian Economies
Source: Asia-9 Central Banks
A closer examination of corporates’ credit risk metrics suggests that headwinds to the same sector would not
have homogenous effects across countries. Within the manufacturing sector, for instance, while overall
corporate leverage (as measured by the median debt-to-equity ratio) has remained relatively unchanged over
time, manufacturers in some economies appear structurally more leveraged than others (Chart C4). Corporates
in these economies could face greater debt repayment burdens in the event of an increase in borrowing costs.
Chart C4
Manufacturing Sector Debt-to-Equity Ratios
(Median): Selected Asian Economies
Source: Thomson Financial, MAS estimates
A disparity in corporate leverage indicators is also observed in diverging median debt-to-income ratios (Chart
C5), and interest coverage ratios (Chart C6). While manufacturers in most economies maintained a median
interest coverage ratio of more than two, leverage relative to earnings seem to have increased for
manufacturers in some economies. Country-specific movements could possibly be due to sub-sectoral
exposures to more volatile industries (e.g. shipping and oil refining). In the event of an income shock,
corporates which are highly leveraged in relation to earnings could come under strain.
0
20
40
60
80
100
TW KR ID HK
MY
PH SG TH IN
Per C
ent
Manufacturing RetailConstruction and real estate FinancialsServices TSCUtilities Others
0
20
40
60
80
100
2006 2008 2010 2012 2014
Per
Cent
China Hong KongIndia IndonesiaKorea MalaysiaPhilippines SingaporeTaiwan Thailand
Q2
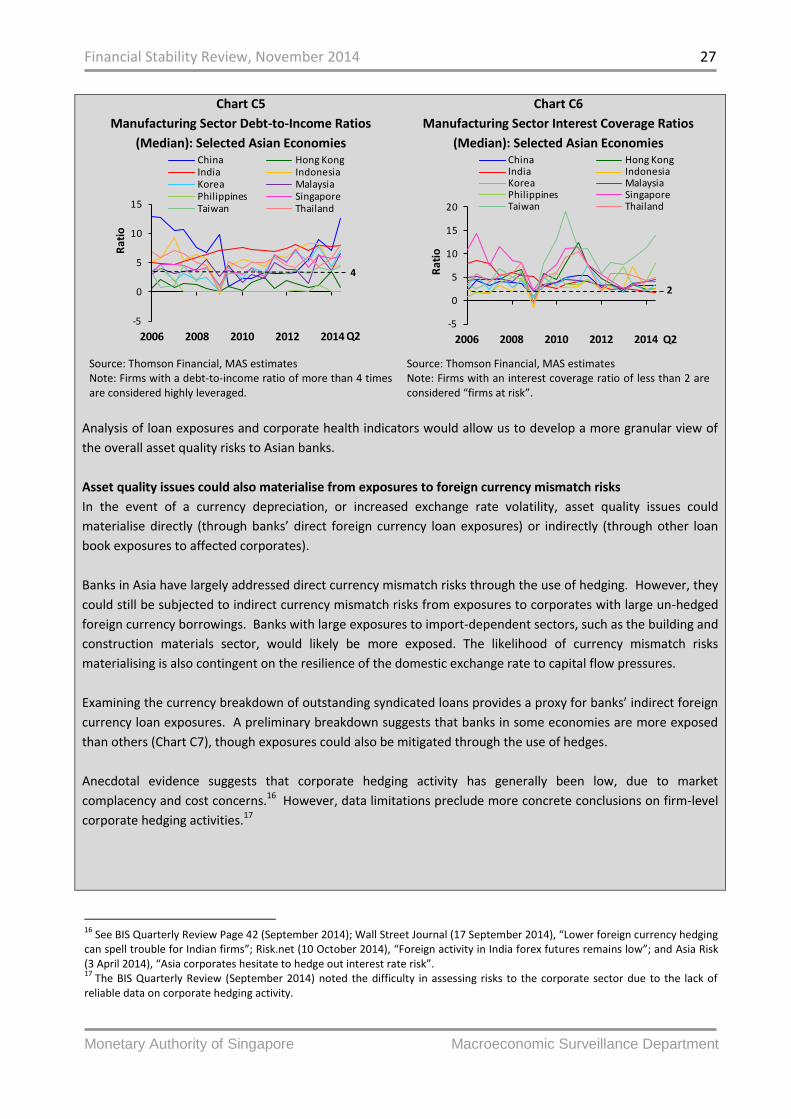
Financial Stability Review, November 2014 27
Monetary Authority of Singapore Macroeconomic Surveillance Department
Chart C5
Manufacturing Sector Debt-to-Income Ratios
(Median): Selected Asian Economies
Source: Thomson Financial, MAS estimates Note: Firms with a debt-to-income ratio of more than 4 times are considered highly leveraged.
Chart C6
Manufacturing Sector Interest Coverage Ratios
(Median): Selected Asian Economies
Source: Thomson Financial, MAS estimates Note: Firms with an interest coverage ratio of less than 2 are considered “firms at risk”.
Analysis of loan exposures and corporate health indicators would allow us to develop a more granular view of
the overall asset quality risks to Asian banks.
Asset quality issues could also materialise from exposures to foreign currency mismatch risks
In the event of a currency depreciation, or increased exchange rate volatility, asset quality issues could
materialise directly (through banks’ direct foreign currency loan exposures) or indirectly (through other loan
book exposures to affected corporates).
Banks in Asia have largely addressed direct currency mismatch risks through the use of hedging. However, they
could still be subjected to indirect currency mismatch risks from exposures to corporates with large un-hedged
foreign currency borrowings. Banks with large exposures to import-dependent sectors, such as the building and
construction materials sector, would likely be more exposed. The likelihood of currency mismatch risks
materialising is also contingent on the resilience of the domestic exchange rate to capital flow pressures.
Examining the currency breakdown of outstanding syndicated loans provides a proxy for banks’ indirect foreign
currency loan exposures. A preliminary breakdown suggests that banks in some economies are more exposed
than others (Chart C7), though exposures could also be mitigated through the use of hedges.
Anecdotal evidence suggests that corporate hedging activity has generally been low, due to market
complacency and cost concerns.16 However, data limitations preclude more concrete conclusions on firm-level
corporate hedging activities.17
16
See BIS Quarterly Review Page 42 (September 2014); Wall Street Journal (17 September 2014), “Lower foreign currency hedging can spell trouble for Indian firms”; Risk.net (10 October 2014), “Foreign activity in India forex futures remains low”; and Asia Risk (3 April 2014), “Asia corporates hesitate to hedge out interest rate risk”. 17
The BIS Quarterly Review (September 2014) noted the difficulty in assessing risks to the corporate sector due to the lack of reliable data on corporate hedging activity.
-5
0
5
10
15
2006 2008 2010 2012 2014
Rat
io
China Hong KongIndia IndonesiaKorea MalaysiaPhilippines SingaporeTaiwan Thailand
Q2
4
-5
0
5
10
15
20
2006 2008 2010 2012 2014
Rat
io
China Hong KongIndia IndonesiaKorea MalaysiaPhilippines SingaporeTaiwan Thailand
Q2
2

Financial Stability Review, November 2014 28
Monetary Authority of Singapore Macroeconomic Surveillance Department
Chart C7
Breakdown of Outstanding Syndicated Loans by
Deal Nationality and Currency of Denomination:
Asia-10
Source: Dealogic Note: Data is as of end 2013.
Chart C8
Tier 1 Capital to Risk-Weighted Assets: Asia-10
Source: IMF Financial Soundness Indicators, Asia-10 Central Banks
Asian banks should remain resilient, while defences could be enhanced Generally, Asian banks should remain resilient due to their ample capital buffers (Chart C8). Sound
underwriting standards have also kept NPL ratios far below levels reached during the Asian Financial Crisis.18
Asian authorities have also implemented additional measures to address rising asset quality risks. For instance,
central banks in Indonesia, Malaysia and India conduct regular stress testing exercises to assess banking system
resilience to corporate defaults. Authorities in China and India have also introduced reforms aimed at
improving bank asset quality (See Box D: Banking Reforms in China and India).
However, more could be done to strengthen oversight of corporate borrowers, particularly in relation to
indirect risk exposures that may not be captured by conventional banking data (e.g. loans from other banks,
leveraged loan issuances and extent of natural hedges). To build a more complete perspective of the asset
quality risks posed by corporate borrowers, authorities could consider closer coordination with domestic bank
regulators, which may be able to leverage on their supervisory capacities to bridge the data gap. Moving
forward with the Financial Stability Board (FSB)-sanctioned reforms in their respective domestic countries could
also help in overcoming data limitations with regards to hedging. Based on data findings, relevant authorities
could then endeavour to address foreign currency mismatch risks by facilitating access to hedging instruments
and reviewing hedging markets for potential avenues to bring down the cost of hedging.
18
NPL ratios reached 35% in some banking systems during the Asian Financial Crisis.
0
20
40
60
80
100
PH ID CH TH IN HK
MY
SG
KR
TW
Per C
ent
Foreign currency Local currency
0
5
10
15
20
ID SG PH
HK
MY
TH KR
CN IN TW
Pe
r C
en
t
6%Basel III
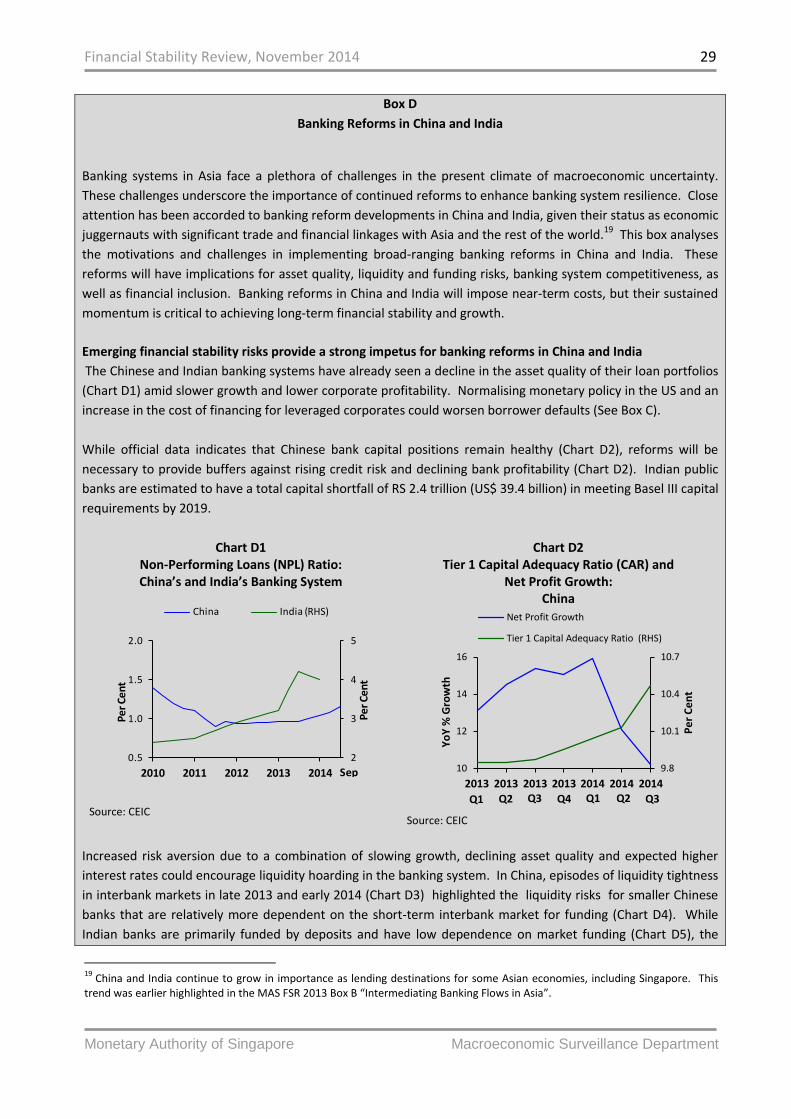
Financial Stability Review, November 2014 29
Monetary Authority of Singapore Macroeconomic Surveillance Department
Box D
Banking Reforms in China and India
Banking systems in Asia face a plethora of challenges in the present climate of macroeconomic uncertainty.
These challenges underscore the importance of continued reforms to enhance banking system resilience. Close
attention has been accorded to banking reform developments in China and India, given their status as economic
juggernauts with significant trade and financial linkages with Asia and the rest of the world.19 This box analyses
the motivations and challenges in implementing broad-ranging banking reforms in China and India. These
reforms will have implications for asset quality, liquidity and funding risks, banking system competitiveness, as
well as financial inclusion. Banking reforms in China and India will impose near-term costs, but their sustained
momentum is critical to achieving long-term financial stability and growth.
Emerging financial stability risks provide a strong impetus for banking reforms in China and India
The Chinese and Indian banking systems have already seen a decline in the asset quality of their loan portfolios
(Chart D1) amid slower growth and lower corporate profitability. Normalising monetary policy in the US and an
increase in the cost of financing for leveraged corporates could worsen borrower defaults (See Box C).
While official data indicates that Chinese bank capital positions remain healthy (Chart D2), reforms will be
necessary to provide buffers against rising credit risk and declining bank profitability (Chart D2). Indian public
banks are estimated to have a total capital shortfall of RS 2.4 trillion (US$ 39.4 billion) in meeting Basel III capital
requirements by 2019.
Chart D1 Non-Performing Loans (NPL) Ratio: China’s and India’s Banking System
Source: CEIC
Chart D2 Tier 1 Capital Adequacy Ratio (CAR) and
Net Profit Growth: China
Source: CEIC
Increased risk aversion due to a combination of slowing growth, declining asset quality and expected higher
interest rates could encourage liquidity hoarding in the banking system. In China, episodes of liquidity tightness
in interbank markets in late 2013 and early 2014 (Chart D3) highlighted the liquidity risks for smaller Chinese
banks that are relatively more dependent on the short-term interbank market for funding (Chart D4). While
Indian banks are primarily funded by deposits and have low dependence on market funding (Chart D5), the
19
China and India continue to grow in importance as lending destinations for some Asian economies, including Singapore. This trend was earlier highlighted in the MAS FSR 2013 Box B “Intermediating Banking Flows in Asia”.
2
3
4
5
0.5
1.0
1.5
2.0
2010 2011 2012 2013 2014
Per
Cent
Pe
r C
ent
China India (RHS)
Sep 9.8
10.1
10.4
10.7
10
12
14
16
2013 2013 2013 2013 2014 2014 2014
Pe
r C
en
t
Yo
Y %
Gro
wth
Net Profit Growth
Tier 1 Capital Adequacy Ratio (RHS)
Q1 Q2 Q3Q3 Q4 Q1 Q2
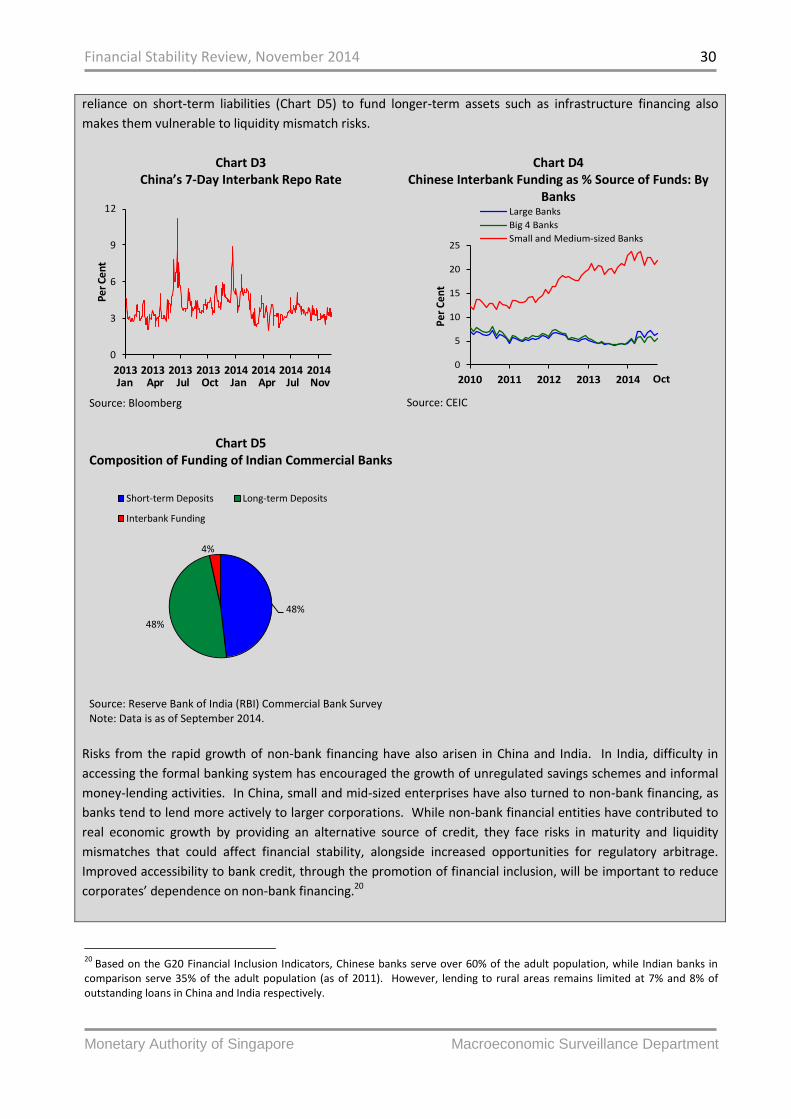
Financial Stability Review, November 2014 30
Monetary Authority of Singapore Macroeconomic Surveillance Department
reliance on short-term liabilities (Chart D5) to fund longer-term assets such as infrastructure financing also
makes them vulnerable to liquidity mismatch risks.
Chart D3 China’s 7-Day Interbank Repo Rate
Source: Bloomberg
Chart D4 Chinese Interbank Funding as % Source of Funds: By
Banks
Source: CEIC
Chart D5
Composition of Funding of Indian Commercial Banks
Source: Reserve Bank of India (RBI) Commercial Bank Survey Note: Data is as of September 2014.
Risks from the rapid growth of non-bank financing have also arisen in China and India. In India, difficulty in
accessing the formal banking system has encouraged the growth of unregulated savings schemes and informal
money-lending activities. In China, small and mid-sized enterprises have also turned to non-bank financing, as
banks tend to lend more actively to larger corporations. While non-bank financial entities have contributed to
real economic growth by providing an alternative source of credit, they face risks in maturity and liquidity
mismatches that could affect financial stability, alongside increased opportunities for regulatory arbitrage.
Improved accessibility to bank credit, through the promotion of financial inclusion, will be important to reduce
corporates’ dependence on non-bank financing.20
20
Based on the G20 Financial Inclusion Indicators, Chinese banks serve over 60% of the adult population, while Indian banks in comparison serve 35% of the adult population (as of 2011). However, lending to rural areas remains limited at 7% and 8% of outstanding loans in China and India respectively.
0
3
6
9
12
2013 2013 2013 2013 2014 2014 2014 2014
Per C
ent
Jan Apr Jul Oct Jan Apr Jul Nov
0
5
10
15
20
25
2010 2011 2012 2013 2014
Per
Cen
t
Large Banks
Big 4 Banks
Small and Medium-sized Banks
Oct
48%
48%
4%
Short-term Deposits Long-term Deposits
Interbank Funding

Financial Stability Review, November 2014 31
Monetary Authority of Singapore Macroeconomic Surveillance Department
Banking reforms will enhance the resilience and competitiveness of the banking system and promote social
and developmental objectives
Policymakers in China and India have undertaken banking system reforms to address asset quality, liquidity and
funding risks, and to promote competition and financial inclusion within the banking sector. Table D1
summarises and compares key reforms in the two countries.
Table D1
Key Banking Reforms: China and India
Type of Banking Reforms
China India
NPL reforms to improve bank asset quality
Five local governments have been given approval to establish “bad banks” to buy NPLs from local banks, in addition to the four existing state-owned asset management firms.
Reserve Bank of India (RBI) has pushed for earlier recognition of stressed assets.
A Central Repository of Information on Large Credits (CRILC) has been set up to collect and disseminate credit data to banks on large credit exposures, which will help enhance credit underwriting standards.
Enhancement of liquidity and funding of banks
The Chinese Banking Regulatory Commission (CBRC) has required commercial banks to increase LCR to 100% by 2018.
The Chinese Securities Regulatory Commission (CSRC) has launched a pilot scheme allowing banks to obtain funding through issuing preferred shares.
CBRC has also introduced regulations to limit interbank borrowing of commercial banks to less than a third of liabilities.
RBI issued guidelines on issuance of onshore long-term bonds which would allow both the loan and the bond to be on-sold in five years, better matching asset-liability maturities.
Opening up banking system to increased competition
CBRC has allowed qualified private capital (including Tencent and Alibaba) to establish FIs such as small and medium-sized banks.
21
CBRC has issued administrative regulations allowing foreign lenders to open additional branches and issue bank capital instruments.
Deposit rate liberalisation is expected to be achieved in one to two years, facilitating more competitive pricing.
22
RBI released rules promising “near national” treatment limited to foreign banks with reciprocity for Indian banks in home countries, to encourage subsidiarisation of foreign banks.
India also has plans to cut government holdings in public sector banks to below 50%, reducing the burden of government recapitalisation and encouraging better shareholder accountability from banks.
Promoting financial inclusion
The People’s Bank of China (PBOC) has reduced the required reserve ratio by 0.5% for banks that mainly lend to small businesses and rural borrowers.
The State Council issued guidelines in late 2013, encouraging FIs to support small and medium-sized enterprise (SME) developments.
23
RBI has launched a plan to start 150 million bank accounts for poor households over the next year.
Draft guidelines have also been issued for the establishment of niche banks (payments and small banks) to provide banking services to more businesses and households.
21
As of September 2014, CBRC has approved the establishment of five private banks. 22
This was mentioned by Bank of China Governor Zhou Xiaochuan in a press conference on the sideline of the National People’s Congress in March. 23
One measure to support the development of small and micro-sized enterprises includes the stipulation that growth rate of loans provided to small and micro-sized enterprises shall not be lower than the average growth rate of all type of loans.

Financial Stability Review, November 2014 32
Monetary Authority of Singapore Macroeconomic Surveillance Department
Policy trade-offs and sequencing of reforms will be key
A key challenge faced by both China and India in implementing their respective banking reforms is the trade-off
with economic growth. Banking sector reforms that dampen credit growth could stifle financial deepening. The
banking system in India is relatively small, with banking assets at 72% of GDP, compared to 270% in China.
Analysts have estimated that a 1% increase in bank credit growth would contribute an additional 0.2% in real
GDP growth for India and 1% in real GDP growth for China.24
Policymakers have actively sought to balance growth and financial stability. In China, the reserve ratio
requirement (RRR) has been reduced, in a targeted fashion, for banks with significant loans for small business,
hence averting financial risks from a broad-based debt build-up across sectors while continuing to provide
positive economic stimulus.
Indian policymakers have to manage the trade-off between promoting financial inclusion and enhancing bank
resilience. Financial inclusion has meant providing banking services to less profitable and lower asset quality
sectors. One such example is the current RBI requirement for banks to set aside stipulated percentages of
lending to priority sectors of the economy, including micro and small enterprises.
The sequencing of reforms is also important. China has yet to fully liberalise its interest rates and also has some
way to go in liberalising its capital account. The pace and timing of banking reforms will need to be balanced
against progress in broader economic reforms, including efforts to internationalise the RMB. The completion of
interest rate liberalisation may need to precede full capital account liberalisation and RMB internationalisation
in order to avert potential capital flight in search of higher yield. A deposit insurance system, coupled with a
resolution mechanism for distressed banks, may also have to be in place to support the increased competition
in the banking system following full interest rate liberalisation.
Banking reforms are a step in the right direction, and sustained emphasis on increasing competitiveness
within the Chinese and Indian banking systems would help anchor longer-term economic growth and
financial stability
The present reform momentum in China and India, if maintained, will strengthen banking system
competitiveness and facilitate the transition towards a market-oriented approach for credit allocation. The
shift away from top-down credit allocation will encourage greater accountability and efficiency of individual
banks, improve credit assessment and reduce NPLs.
24
Goldman Sachs (February 2014), “Asia Economics Analyst- India: No ‘banking’ on growth”. The lower sensitivity of GDP growth in India to bank credit growth is attributed by Goldman Sachs to the low level of absolute credit in India. India’s bank credit-to-GDP ratio is 55% as compared to China’s 240% (including shadow banking).
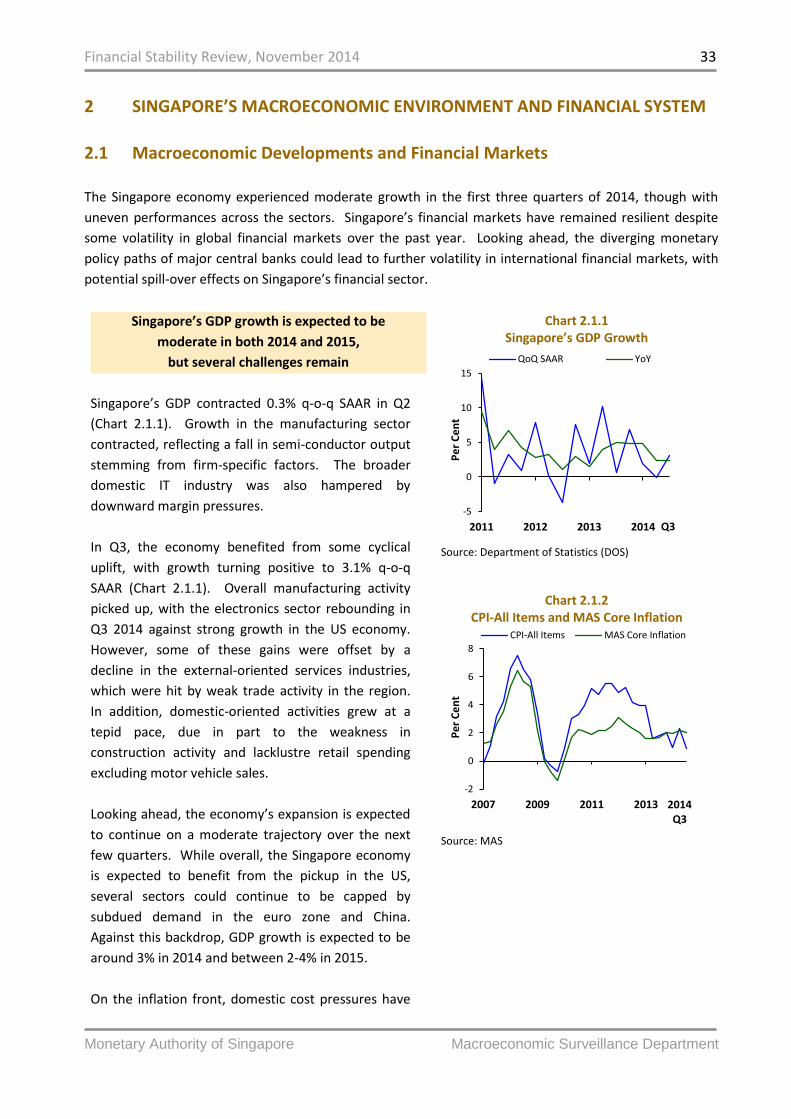
Financial Stability Review, November 2014 33
Monetary Authority of Singapore Macroeconomic Surveillance Department
2 SINGAPORE’S MACROECONOMIC ENVIRONMENT AND FINANCIAL SYSTEM
2.1 Macroeconomic Developments and Financial Markets
The Singapore economy experienced moderate growth in the first three quarters of 2014, though with
uneven performances across the sectors. Singapore’s financial markets have remained resilient despite
some volatility in global financial markets over the past year. Looking ahead, the diverging monetary
policy paths of major central banks could lead to further volatility in international financial markets, with
potential spill-over effects on Singapore’s financial sector.
Singapore’s GDP growth is expected to be
moderate in both 2014 and 2015,
but several challenges remain
Singapore’s GDP contracted 0.3% q-o-q SAAR in Q2
(Chart 2.1.1). Growth in the manufacturing sector
contracted, reflecting a fall in semi-conductor output
stemming from firm-specific factors. The broader
domestic IT industry was also hampered by
downward margin pressures.
In Q3, the economy benefited from some cyclical
uplift, with growth turning positive to 3.1% q-o-q
SAAR (Chart 2.1.1). Overall manufacturing activity
picked up, with the electronics sector rebounding in
Q3 2014 against strong growth in the US economy.
However, some of these gains were offset by a
decline in the external-oriented services industries,
which were hit by weak trade activity in the region.
In addition, domestic-oriented activities grew at a
tepid pace, due in part to the weakness in
construction activity and lacklustre retail spending
excluding motor vehicle sales.
Looking ahead, the economy’s expansion is expected
to continue on a moderate trajectory over the next
few quarters. While overall, the Singapore economy
is expected to benefit from the pickup in the US,
several sectors could continue to be capped by
subdued demand in the euro zone and China.
Against this backdrop, GDP growth is expected to be
around 3% in 2014 and between 2-4% in 2015.
On the inflation front, domestic cost pressures have
Chart 2.1.1 Singapore’s GDP Growth
Source: Department of Statistics (DOS)
Chart 2.1.2
CPI-All Items and MAS Core Inflation
Source: MAS
-5
0
5
10
15
2011 2012 2013 2014
Pe
r C
en
t
QoQ SAAR YoY
Q3
-2
0
2
4
6
8
2007 2009 2011 2013
Pe
r C
en
t
CPI-All Items MAS Core Inflation
2014Q3
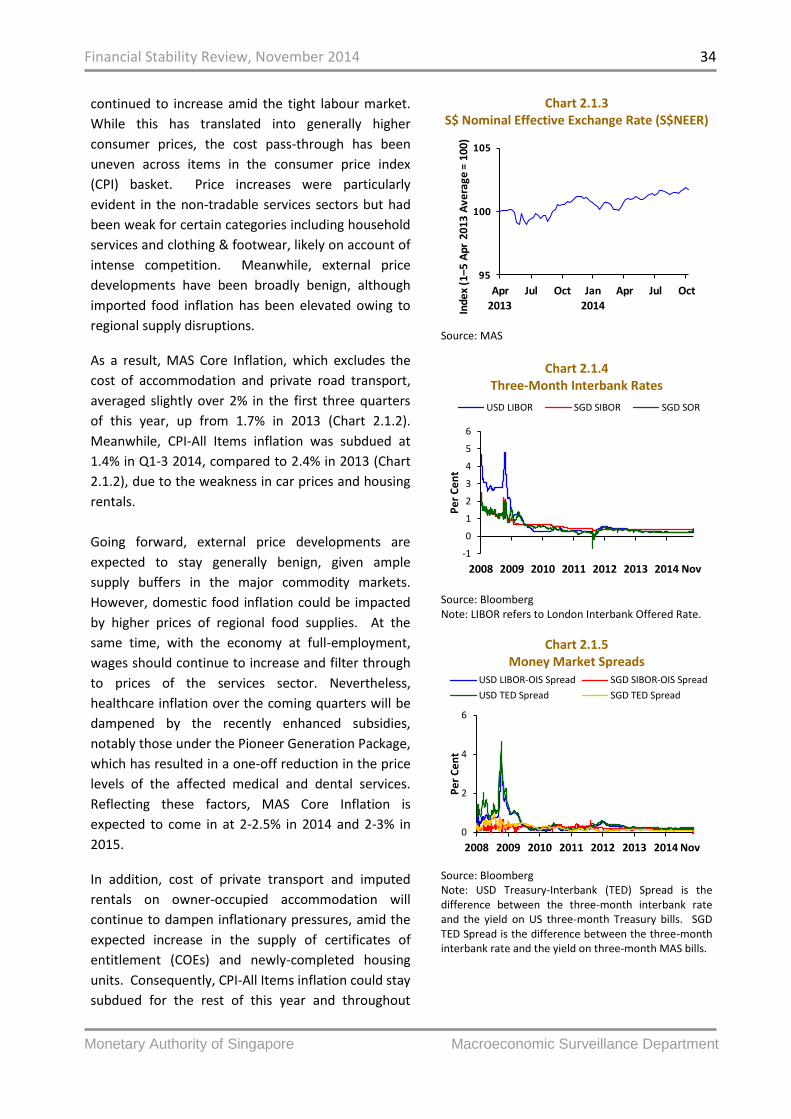
Financial Stability Review, November 2014 34
Monetary Authority of Singapore Macroeconomic Surveillance Department
continued to increase amid the tight labour market.
While this has translated into generally higher
consumer prices, the cost pass-through has been
uneven across items in the consumer price index
(CPI) basket. Price increases were particularly
evident in the non-tradable services sectors but had
been weak for certain categories including household
services and clothing & footwear, likely on account of
intense competition. Meanwhile, external price
developments have been broadly benign, although
imported food inflation has been elevated owing to
regional supply disruptions.
As a result, MAS Core Inflation, which excludes the
cost of accommodation and private road transport,
averaged slightly over 2% in the first three quarters
of this year, up from 1.7% in 2013 (Chart 2.1.2).
Meanwhile, CPI-All Items inflation was subdued at
1.4% in Q1-3 2014, compared to 2.4% in 2013 (Chart
2.1.2), due to the weakness in car prices and housing
rentals.
Going forward, external price developments are
expected to stay generally benign, given ample
supply buffers in the major commodity markets.
However, domestic food inflation could be impacted
by higher prices of regional food supplies. At the
same time, with the economy at full-employment,
wages should continue to increase and filter through
to prices of the services sector. Nevertheless,
healthcare inflation over the coming quarters will be
dampened by the recently enhanced subsidies,
notably those under the Pioneer Generation Package,
which has resulted in a one-off reduction in the price
levels of the affected medical and dental services.
Reflecting these factors, MAS Core Inflation is
expected to come in at 2-2.5% in 2014 and 2-3% in
2015.
In addition, cost of private transport and imputed
rentals on owner-occupied accommodation will
continue to dampen inflationary pressures, amid the
expected increase in the supply of certificates of
entitlement (COEs) and newly-completed housing
units. Consequently, CPI-All Items inflation could stay
subdued for the rest of this year and throughout
Chart 2.1.3 S$ Nominal Effective Exchange Rate (S$NEER)
Source: MAS
Chart 2.1.4
Three-Month Interbank Rates
Source: Bloomberg Note: LIBOR refers to London Interbank Offered Rate.
Chart 2.1.5 Money Market Spreads
Source: Bloomberg Note: USD Treasury-Interbank (TED) Spread is the difference between the three-month interbank rate and the yield on US three-month Treasury bills. SGD TED Spread is the difference between the three-month interbank rate and the yield on three-month MAS bills.
95
100
105
Apr
2013Jul Oct Jan
2014Apr Jul Oct
Ind
ex
(1–
5 A
pr
20
13
Ave
rage
= 1
00
)
-1
0
1
2
3
4
5
6
2008 2009 2010 2011 2012 2013 2014
Pe
r C
en
t
USD LIBOR SGD SIBOR SGD SOR
Nov
0
2
4
6
2008 2009 2010 2011 2012 2013 2014
Pe
r C
en
t
USD LIBOR-OIS Spread SGD SIBOR-OIS Spread
USD TED Spread SGD TED Spread
Nov

Financial Stability Review, November 2014 35
Monetary Authority of Singapore Macroeconomic Surveillance Department
2015, averaging 1-1.5% in 2014 and 0.5-1.5% in 2015.
In October 2014, MAS maintained its monetary
stance of a modest and gradual appreciation of the
Singapore dollar nominal effective exchange rate
(S$NEER) (Chart 2.1.3). This policy stance was
assessed to be appropriate for containing domestic
and imported sources of inflationary pressure, and
ensuring that inflation expectations remain well-
anchored.
Singapore’s financial markets have remained
resilient, but could become more volatile ahead
Singapore’s financial markets have remained stable
through 2014, with advanced economies’ UMP
keeping global financial conditions easy and
Singapore’s economic growth holding up. However,
markets are expected to experience more volatility in
the period ahead, against the backdrop of diverging
monetary policy settings of the major economies.
In the banking sector, Singapore’s domestic liquidity
conditions have remained stable over the past year
(Chart 2.1.4). Counterparty credit risks have also
been very modest, as reflected in the low and stable
SGD and USD interbank overnight indexed swap (OIS)
and Treasury-Interbank (TED) spreads (Chart 2.1.5).
In the Singapore Government Securities (SGS)
market, the two-year SGS yield has edged higher in
tandem with the corresponding US Treasury yield,
against the expectation of US rate normalisation. The
ten-year SGS yield fluctuated within a tight 45 bps
range between January and November, as the Fed
embarked on its LSAP exit (Chart 2.1.6).
Singapore’s equity market started off the year poorly
with the Straits Times Index (STI) falling 6.4% in the
month of January alone due to tapering concerns, but
rallied from February to August, gaining 13.7% (Chart
2.1.7). However, the STI has edged down since,
ending off in November just 4.8% higher than
January, weighed down by concerns over global
growth.
Chart 2.1.6 SGS Two- and Ten-Year Benchmark Yields
and US Ten-Year Treasury Yield
Source: Bloomberg
Chart 2.1.7 Straits Times Index and MSCI World Index
Source: Bloomberg
0
1
2
3
4
5
2008 2009 2010 2011 2012 2013 2014
Pe
r C
en
t
SGS Two-Year
SGS Ten-Year
US Treasuries Ten-Year
Nov
500
1,000
1,500
2,000
1,000
2,000
3,000
4,000
2008 2010 2012 2014
Ind
ex
Leve
l
Ind
ex
Leve
l
Straits Times IndexMSCI World Index (RHS)
Nov
Financial Stability Review, November 2014 36
Monetary Authority of Singapore Macroeconomic Surveillance Department
Looking ahead, the diverging monetary policy paths
of major central banks could lead to further volatility
in international financial markets, with potential spill-
over effects on Singapore’s financial sector.

Financial Stability Review, November 2014 37
Monetary Authority of Singapore Macroeconomic Surveillance Department
2.2 Corporate Sector25
Singapore corporate balance sheets have remained firm, as corporates registered healthy profitability and
held ample solvency buffers. The prolonged low interest rate environment post-GFC has seen corporate
debt rising, with corporates taking the opportunity to finance capital expenditure or embark on
restructuring. Some highly leveraged firms, however, could be vulnerable should economic conditions
take a turn for the worse, together with a normalisation in interest rates. MAS’ stress tests of corporate
balance sheets suggest that corporate debt servicing ability remains strong and that corporates are
generally able to withstand interest rate and earnings shocks.
25
All corporate financial data cover only companies listed on the SGX. The latest data point provided is for Q2 2014. 26
A net weighted balance of 1% of manufacturing firms expect a more favourable business situation in the six months ending March 2015, while a net weighted balance of 7% of firms in the services sector also maintain a positive outlook for the same period. Economic Development Board (EDB) (October 2014), “Survey of Business Expectations of the Manufacturing Sector, Q4 2014”. DOS (October 2014), “Business Expectations Survey, Q4 2014”.
Corporate balance sheets remained on a firm
footing
Corporate balance sheets have remained firm,
supported by healthy economic conditions. Corporate
profitability and liquidity are generally sound. The
median return on assets (ROA) has stayed broadly
stable at 3.9% in Q2 2014, compared with 4.0% in Q2
2013 (Chart 2.2.1). However, earnings in some sectors
showed some weakness. The transport, storage and
communications (TSC) sector continued to be weighed
down by sluggish external demand in the logistics and
shipping industries. Profit margins also came under
pressure for some labour intensive sectors, such as the
construction sector, due to tighter foreign labour
restrictions.
The median current ratio stayed firm at 1.7 times, in
line with its medium-term average (Chart 2.2.2).
Reflecting the overall healthy state of corporates, the
outlook for businesses remained positive for the period
ending March 2015 (Chart 2.2.3).26
Debt-to-equity ratios have stabilised in the past year
after trending upwards in the post-GFC period. The
median debt-to-equity ratio declined marginally from
38% in Q2 2013 to 37% in Q2 2014, although it remains
above the medium-term average of 34% (Chart 2.2.4).
Chart 2.2.1 Return on Assets (Median)
Source: Thomson Financial
Chart 2.2.2 Current Ratio (Median)
Source: Thomson Financial
0
2
4
6
8
10
12
14
2004 Q4
2006 2008 2010 2012
Pe
r C
en
t
Commerce Construction
Hotels & Restaurants Manufacturing
Multi-Industry Property
TSC Overall
2014Q2
0.5
1.5
2.5
3.5
2004 Q4
2006 2008 2010 2012
Rat
io
Commerce Construction
Hotels & Restaurants Manufacturing
Multi-Industry Property
TSC Overall
2014Q2

Financial Stability Review, November 2014 38
Monetary Authority of Singapore Macroeconomic Surveillance Department
Corporates may have taken advantage of the
prolonged low interest rate environment to bring
forward capital expenditure (Chart 2.2.5). Some
corporates may also have taken on debt to aid
restructuring as part of their efforts to boost
productivity.
The asset quality of banks’ corporate loan books
remains high, with the NPL ratio for non-financial
corporate loans remaining low at 1.3% (Chart 2.2.6).
The number of bankruptcy petitions filed also fell from
102 in H1 2013 to 93 in H1 2014. However, the
number of companies wound up rose from 54 in H1
2013 to 75 in H1 2014 (Chart 2.2.7).
The debt servicing ability of corporates remains strong,
with the median interest coverage ratio of corporates
standing at a healthy 5.6 times in Q2 2014, broadly
unchanged from a year ago. This suggests that
corporates have significant buffers to cover interest
expenses (Chart 2.2.8).
While highly leveraged corporates could face greater
stress in servicing their debt if interest rates were to
rise, stress tests suggest that on aggregate, firms
remain resilient
The current low interest rate environment is unlikely to
persist, and corporates’ debt servicing burdens could
increase with US monetary policy normalisation.
Corporates that have taken on significant debt would
be particularly vulnerable as a sharp rise in interest
rates would leave them exposed to heavier debt
servicing burdens.
MAS’ stress tests of corporate balance sheets suggest
that the corporate sector is sound and generally robust
to an interest rate and earnings shock (See Box E:
Assessing the Risks of Corporate Leverage in
Singapore).
Chart 2.2.3 General Business Outlook
Source: DOS, Business Expectations Survey; EDB, Survey of Business Expectations of the Manufacturing Sector
Chart 2.2.4 Debt-to-Equity Ratio (Median)
Source: Thomson Financial
Chart 2.2.5 Capital Expenditure
Source: Thomson Financial
-80
-60
-40
-20
0
20
40
60
2007 2009 2011 2013
Pe
r C
en
t
Manufacturing Services
2014Q3
0
20
40
60
80
2004 Q4
2006 2008 2010 2012
Pe
r C
en
t
Commerce ConstructionHotels & Restaurants ManufacturingMulti-Industry PropertyTSC Overall
2014Q2
0
10
20
30
40
50
60
2005 2007 2009 2011 2013
S$ B
illio
n
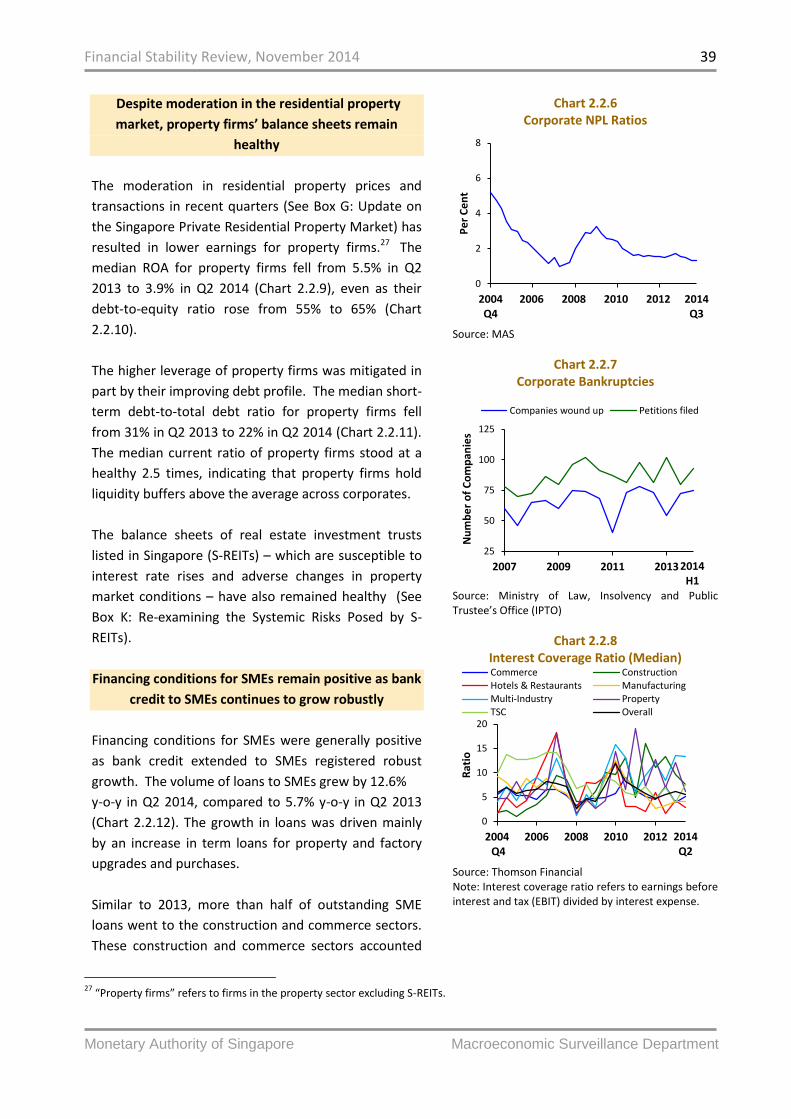
Financial Stability Review, November 2014 39
Monetary Authority of Singapore Macroeconomic Surveillance Department
27
“Property firms” refers to firms in the property sector excluding S-REITs.
Despite moderation in the residential property
market, property firms’ balance sheets remain
healthy
The moderation in residential property prices and
transactions in recent quarters (See Box G: Update on
the Singapore Private Residential Property Market) has
resulted in lower earnings for property firms.27 The
median ROA for property firms fell from 5.5% in Q2
2013 to 3.9% in Q2 2014 (Chart 2.2.9), even as their
debt-to-equity ratio rose from 55% to 65% (Chart
2.2.10).
The higher leverage of property firms was mitigated in
part by their improving debt profile. The median short-
term debt-to-total debt ratio for property firms fell
from 31% in Q2 2013 to 22% in Q2 2014 (Chart 2.2.11).
The median current ratio of property firms stood at a
healthy 2.5 times, indicating that property firms hold
liquidity buffers above the average across corporates.
The balance sheets of real estate investment trusts
listed in Singapore (S-REITs) – which are susceptible to
interest rate rises and adverse changes in property
market conditions – have also remained healthy (See
Box K: Re-examining the Systemic Risks Posed by S-
REITs).
Financing conditions for SMEs remain positive as bank
credit to SMEs continues to grow robustly
Financing conditions for SMEs were generally positive
as bank credit extended to SMEs registered robust
growth. The volume of loans to SMEs grew by 12.6%
y-o-y in Q2 2014, compared to 5.7% y-o-y in Q2 2013
(Chart 2.2.12). The growth in loans was driven mainly
by an increase in term loans for property and factory
upgrades and purchases.
Similar to 2013, more than half of outstanding SME
loans went to the construction and commerce sectors.
These construction and commerce sectors accounted
Chart 2.2.6 Corporate NPL Ratios
Source: MAS
Chart 2.2.7 Corporate Bankruptcies
Source: Ministry of Law, Insolvency and Public Trustee’s Office (IPTO)
Chart 2.2.8 Interest Coverage Ratio (Median)
Source: Thomson Financial Note: Interest coverage ratio refers to earnings before interest and tax (EBIT) divided by interest expense.
0
2
4
6
8
2004Q4
2006 2008 2010 2012 2014Q3
Pe
r C
en
t
25
50
75
100
125
2007 2009 2011 2013
Nu
mb
er
of
Co
mp
anie
s
Companies wound up Petitions filed
2014H1
0
5
10
15
20
2004 Q4
2006 2008 2010 2012
Rat
io
Commerce ConstructionHotels & Restaurants ManufacturingMulti-Industry PropertyTSC Overall
2014Q2
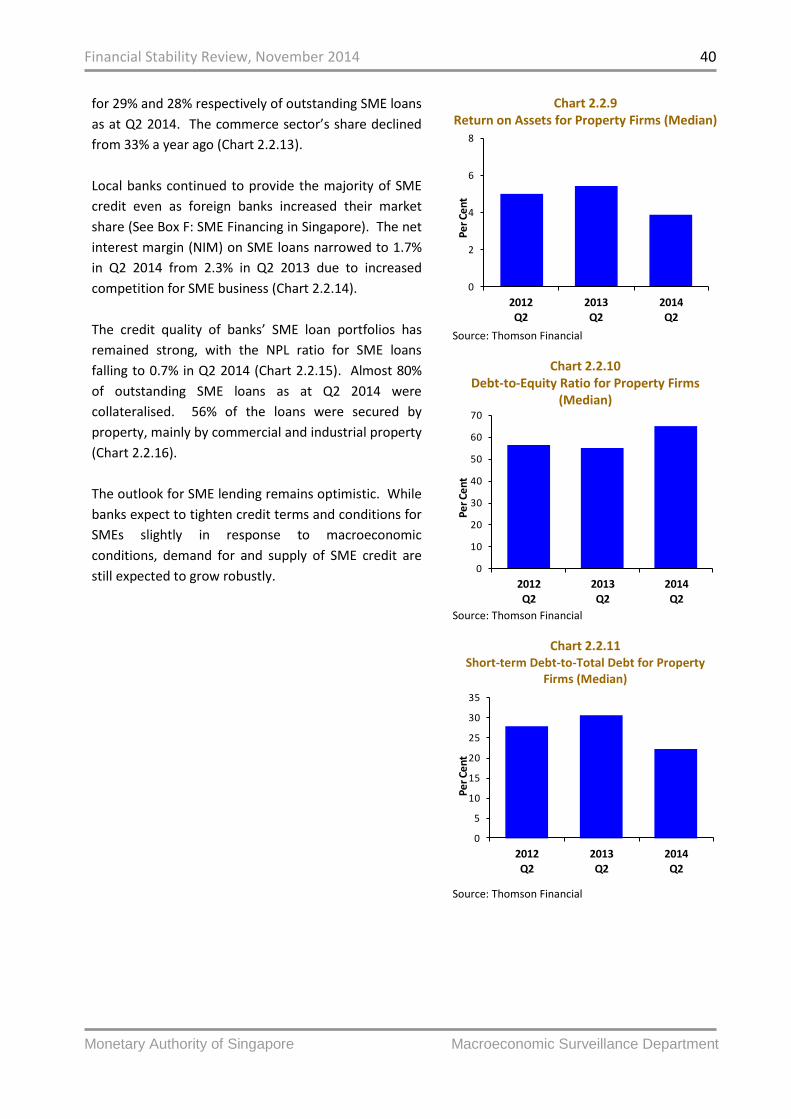
Financial Stability Review, November 2014 40
Monetary Authority of Singapore Macroeconomic Surveillance Department
for 29% and 28% respectively of outstanding SME loans
as at Q2 2014. The commerce sector’s share declined
from 33% a year ago (Chart 2.2.13).
Local banks continued to provide the majority of SME
credit even as foreign banks increased their market
share (See Box F: SME Financing in Singapore). The net
interest margin (NIM) on SME loans narrowed to 1.7%
in Q2 2014 from 2.3% in Q2 2013 due to increased
competition for SME business (Chart 2.2.14).
The credit quality of banks’ SME loan portfolios has
remained strong, with the NPL ratio for SME loans
falling to 0.7% in Q2 2014 (Chart 2.2.15). Almost 80%
of outstanding SME loans as at Q2 2014 were
collateralised. 56% of the loans were secured by
property, mainly by commercial and industrial property
(Chart 2.2.16).
The outlook for SME lending remains optimistic. While
banks expect to tighten credit terms and conditions for
SMEs slightly in response to macroeconomic
conditions, demand for and supply of SME credit are
still expected to grow robustly.
Chart 2.2.9 Return on Assets for Property Firms (Median)
Source: Thomson Financial
Chart 2.2.10 Debt-to-Equity Ratio for Property Firms
(Median)
Source: Thomson Financial
Chart 2.2.11
Short-term Debt-to-Total Debt for Property Firms (Median)
Source: Thomson Financial
0
2
4
6
8
2012Q2
2013Q2
2014Q2
Pe
r C
ent
0
10
20
30
40
50
60
70
2012
Q2
2013
Q2
2014
Q2
Pe
r C
ent
0
5
10
15
20
25
30
35
2012Q2
2013Q2
2014Q2
Pe
r C
ent
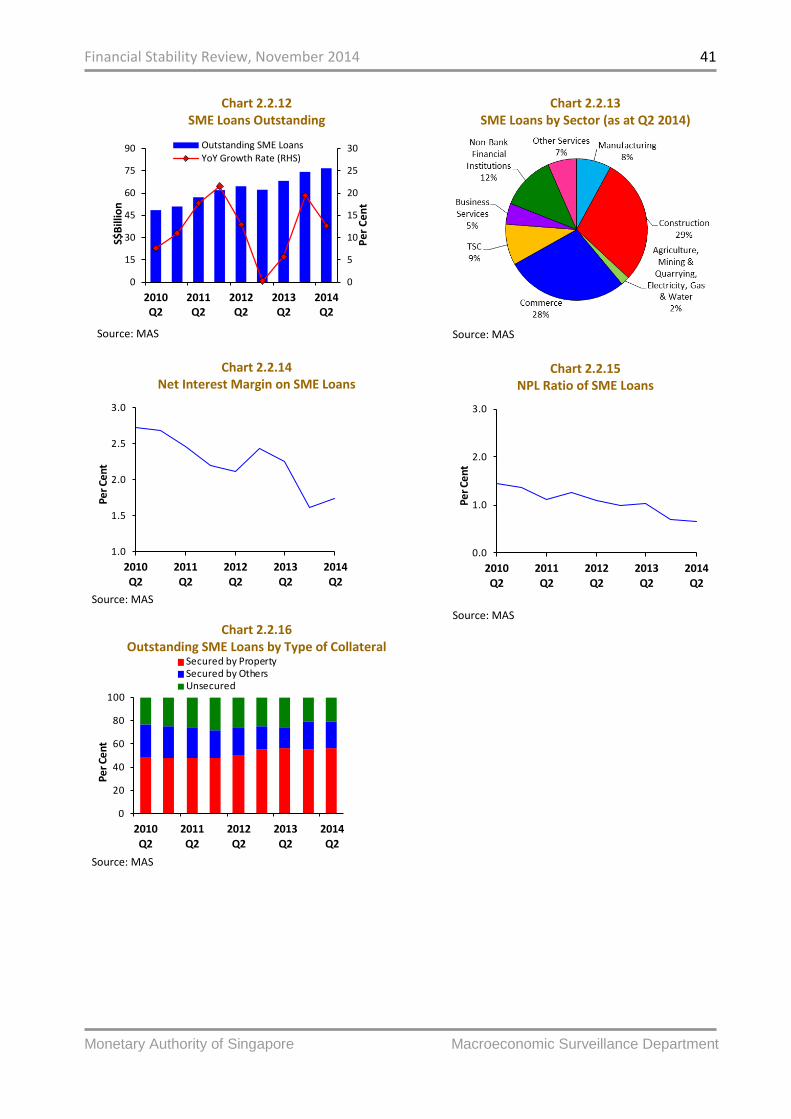
Financial Stability Review, November 2014 41
Monetary Authority of Singapore Macroeconomic Surveillance Department
Chart 2.2.12 SME Loans Outstanding
Source: MAS
Chart 2.2.14
Net Interest Margin on SME Loans
Source: MAS
Chart 2.2.16 Outstanding SME Loans by Type of Collateral
Source: MAS
Chart 2.2.13 SME Loans by Sector (as at Q2 2014)
Source: MAS
Chart 2.2.15
NPL Ratio of SME Loans
Source: MAS
0
5
10
15
20
25
30
0
15
30
45
60
75
90
2010Q2
2011Q2
2012Q2
2013Q2
2014Q2
Pe
r C
en
t
S$B
illio
n
Outstanding SME LoansYoY Growth Rate (RHS)
1.0
1.5
2.0
2.5
3.0
2010
Q22011
Q22012
Q22013
Q22014
Q2
Per C
ent
0
20
40
60
80
100
2010Q2
2011Q2
2012Q2
2013Q2
2014Q2
Pe
r C
ent
Secured by PropertySecured by OthersUnsecured
0.0
1.0
2.0
3.0
2010Q2
2011Q2
2012Q2
2013Q2
2014Q2
Per C
ent
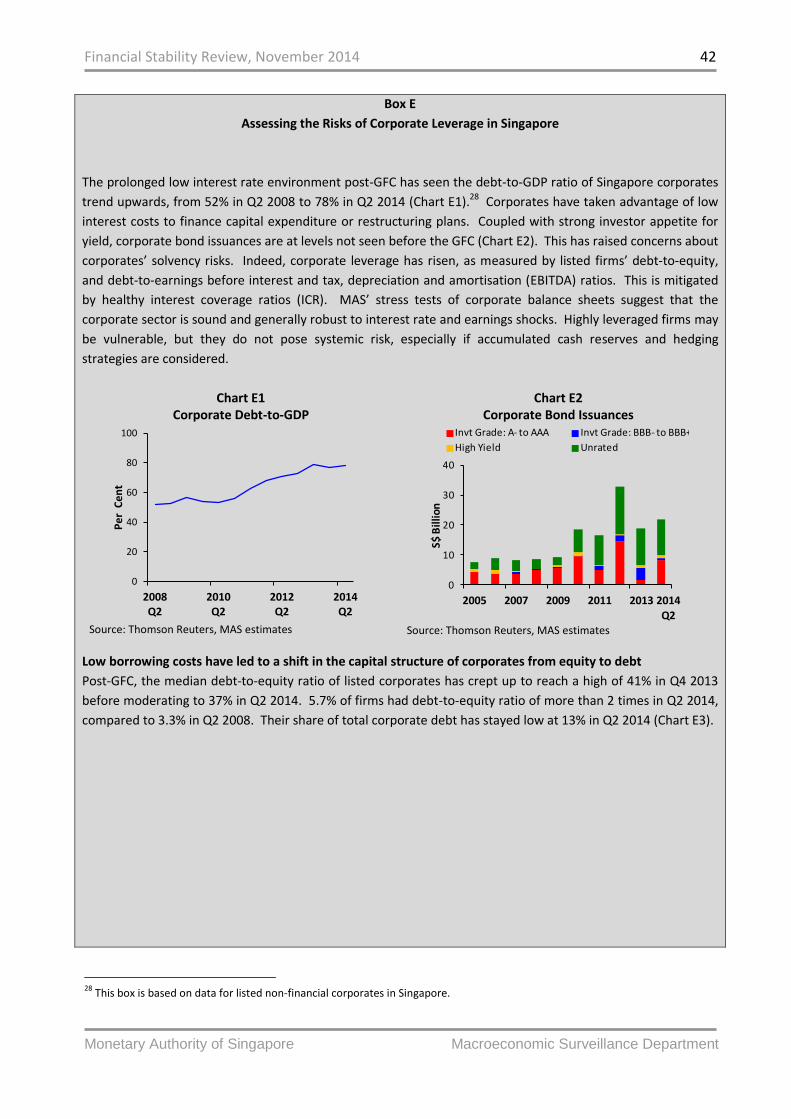
Financial Stability Review, November 2014 42
Monetary Authority of Singapore Macroeconomic Surveillance Department
Box E
Assessing the Risks of Corporate Leverage in Singapore
The prolonged low interest rate environment post-GFC has seen the debt-to-GDP ratio of Singapore corporates
trend upwards, from 52% in Q2 2008 to 78% in Q2 2014 (Chart E1).28 Corporates have taken advantage of low
interest costs to finance capital expenditure or restructuring plans. Coupled with strong investor appetite for
yield, corporate bond issuances are at levels not seen before the GFC (Chart E2). This has raised concerns about
corporates’ solvency risks. Indeed, corporate leverage has risen, as measured by listed firms’ debt-to-equity,
and debt-to-earnings before interest and tax, depreciation and amortisation (EBITDA) ratios. This is mitigated
by healthy interest coverage ratios (ICR). MAS’ stress tests of corporate balance sheets suggest that the
corporate sector is sound and generally robust to interest rate and earnings shocks. Highly leveraged firms may
be vulnerable, but they do not pose systemic risk, especially if accumulated cash reserves and hedging
strategies are considered.
Chart E1 Corporate Debt-to-GDP
Source: Thomson Reuters, MAS estimates
Chart E2 Corporate Bond Issuances
Source: Thomson Reuters, MAS estimates
Low borrowing costs have led to a shift in the capital structure of corporates from equity to debt
Post-GFC, the median debt-to-equity ratio of listed corporates has crept up to reach a high of 41% in Q4 2013
before moderating to 37% in Q2 2014. 5.7% of firms had debt-to-equity ratio of more than 2 times in Q2 2014,
compared to 3.3% in Q2 2008. Their share of total corporate debt has stayed low at 13% in Q2 2014 (Chart E3).
28
This box is based on data for listed non-financial corporates in Singapore.
0
20
40
60
80
100
2008Q2
2010Q2
2012Q2
2014Q2
Pe
r C
en
t
0
10
20
30
40
2005 2007 2009 2011 2013
S$ B
illio
nInvt Grade: A- to AAA Invt Grade: BBB- to BBB+
High Yield Unrated
2014
Q2

Financial Stability Review, November 2014 43
Monetary Authority of Singapore Macroeconomic Surveillance Department
Chart E3 Share of Corporate Debt based on Debt-to-Equity
Ratio
Source: Thomson Reuters, MAS estimates
Chart E4 Share of Corporate Debt Held by Firms with Debt-
to-Equity of > 2 & Debt-to-EBITDA of > 4
Source: Thomson Reuters, MAS estimates
Debt-to-EBITDA measures a firm’s ability to repay debt; the higher the debt-to-EBITDA ratio, the more
leveraged the firm is relative to earnings. The median debt-to-EBITDA ratio of listed corporates (adjusted for
seasonality) has increased to 1.6 times in Q2 2014 from 1.5 times in Q2 2008. 29
The number of firms with debt-to-EBITDA ratios greater than 4 times has risen to 30% of listed corporates in Q2
2014, compared to 18% in Q2 2008 (Chart E5). Their share of total corporate debt increased to 61% from 32%
over the period (Chart E6).
Corporates which are highly leveraged both in their capital structure and in relation to earnings, i.e. corporates
with debt-to-equity ratio of more than 2 times and debt-to-EBITDA ratio of more than 4 times, form 3% of all
listed corporates. They account for 8% of total corporate debt (Chart E4).
Chart E5 Number of Firms by Debt-to-EBITDA Ratio as % of
Total Number of Firms
Source: Thomson Reuters, MAS estimates
Chart E6 Share of Corporate Debt based on Debt-to-EBITDA
Ratio
Source: Thomson Reuters, MAS estimates
29
Adjusted Debt-to-EBITDA is calculated as total debt over the rolling average of four quarters of EBITDA to adjust for the seasonality of earnings.
0
4
8
12
16
20
0
20
40
60
80
100
2008Q2
2010Q2
2012Q2
2014Q2
Pe
r C
en
t
Pe
r C
en
t
Debt-to-Equity ≤ 2Debt-to-Equity > 2% of Firms with Debt-to-Equity > 2 (RHS)
0
1
2
3
4
5
0
2
4
6
8
10
2008Q2
2010Q2
2012Q2
2014Q2
Pe
r C
en
t
Pe
r C
en
t
Debt/EBITDA > 4 and Debt-to-Equity > 2% of Firms (RHS)
0
20
40
60
80
100
2008Q2
2010Q2
2012Q2
2014Q2
Pe
r C
en
t
Debt/EBITDA > 4 3 < Debt/EBITDA ≤ 42 < Debt/EBITDA ≤ 3 1 < Debt/EBITDA ≤ 2Debt/EBITDA ≤ 1
0
20
40
60
80
100
2008Q2
2010Q2
2012Q2
2014Q2
Pe
r C
en
t
Debt/EBITDA > 4 3 < Debt/EBITDA ≤ 42 < Debt/EBITDA ≤ 3 1 < Debt/EBITDA ≤ 2Debt/EBITDA ≤ 1

Financial Stability Review, November 2014 44
Monetary Authority of Singapore Macroeconomic Surveillance Department
The majority of corporates have sufficient solvency buffers to service interest expenses
While debt-to-equity and debt-to-EBITDA ratios indicate that Singapore corporates have taken on more
leverage, this could reflect corporates bringing forward capital expenditure or undertaking capital-intensive
restructuring in a low interest rate environment, and is not necessarily imprudent. The ability of corporates to
service interest expenses is measured by the ICR.30 Firms with ICR of less than 2, make up less than 20% of all
listed corporates (Chart E7). The amount of corporate debt held by such firms is smaller, at 7% of total
corporate debt (Chart E8). By these measures, Singapore corporates’ balance sheets remain healthy.
Chart E7 Number of Firms by Interest Coverage Ratio
as % of Total Number of Firms
Source: Thomson Reuters, MAS estimates
Chart E8 Share of Corporate Debt based on
Interest Coverage Ratio
Source: Thomson Reuters, MAS estimates
Some highly leveraged corporates are at risk to interest rate and earnings shocks. Accumulated cash reserves
provide additional buffers
Highly leveraged corporates may be vulnerable to a severe stress scenario of falling earnings and higher interest
rates, e.g. when an economic downturn coincides with normalisation of US monetary policy. Under a stress
scenario of an increase in interest costs of 25% and a decline in EBITDA of 25%, MAS estimates that the
percentage of firms with ICRs of less than 2 will rise from 20% to 27% of all corporates.31 The amount of debt
held by such firms will increase from 7% to about 22% of total corporate debt (Chart E9).
Cash reserves provide an additional buffer against interest rate and earnings shocks. In the same stress test,
the share of firms with ICRs of less than 2 declines to 5% (Chart E9) if their cash reserves are taken into
consideration. The corresponding share of debt held by such firms falls to 2% of total corporate debt (Chart
E9).
30
ICR is measured by EBITDA over interest expense. 31
An earnings shock places further stress on corporates which are highly leveraged in relation to earnings.
0
20
40
60
80
100
2008Q2
2010Q2
2012Q2
2014Q2
Pe
r C
en
t
ICR < 1 1 ≤ ICR < 2 2 ≤ ICR < 3
3 ≤ ICR < 4 ICR ≥ 4
0
20
40
60
80
100
2008Q2
2010Q2
2012Q2
2014Q2
Pe
r C
en
t
ICR < 1 1 ≤ ICR < 2 2 ≤ ICR < 3
3 ≤ ICR < 4 ICR ≥ 4
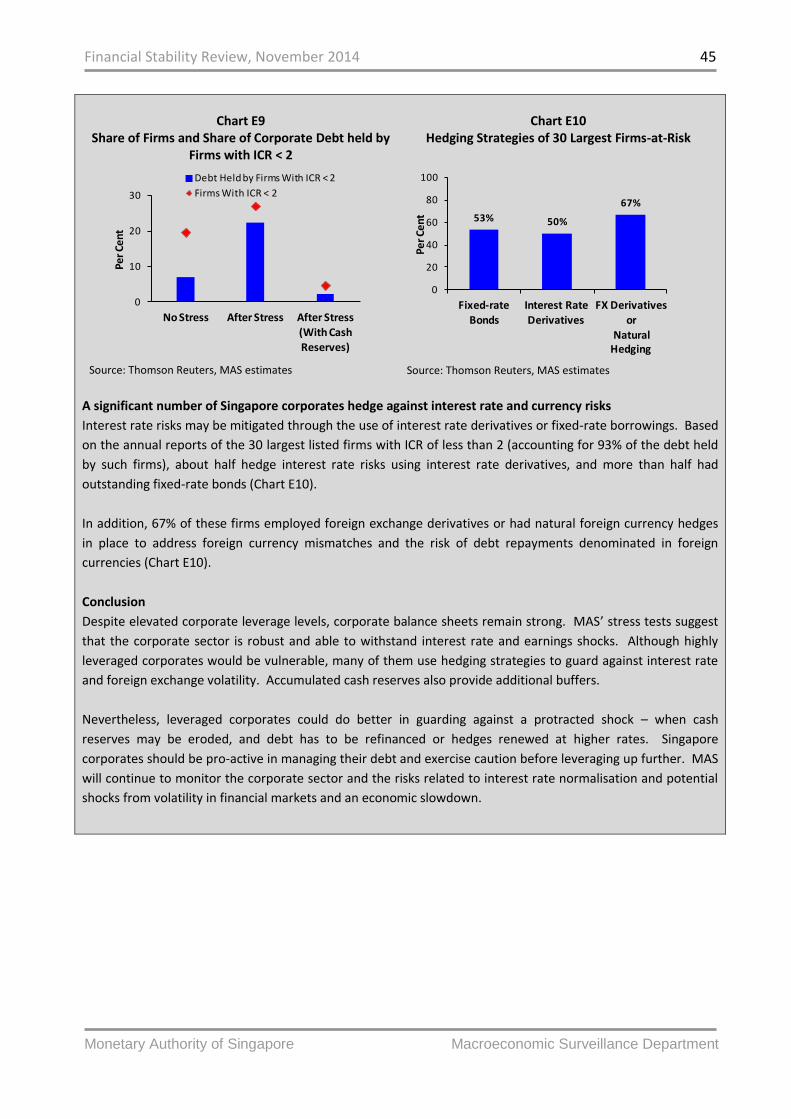
Financial Stability Review, November 2014 45
Monetary Authority of Singapore Macroeconomic Surveillance Department
Chart E9
Share of Firms and Share of Corporate Debt held by Firms with ICR < 2
Source: Thomson Reuters, MAS estimates
Chart E10
Hedging Strategies of 30 Largest Firms-at-Risk
Source: Thomson Reuters, MAS estimates
A significant number of Singapore corporates hedge against interest rate and currency risks
Interest rate risks may be mitigated through the use of interest rate derivatives or fixed-rate borrowings. Based
on the annual reports of the 30 largest listed firms with ICR of less than 2 (accounting for 93% of the debt held
by such firms), about half hedge interest rate risks using interest rate derivatives, and more than half had
outstanding fixed-rate bonds (Chart E10).
In addition, 67% of these firms employed foreign exchange derivatives or had natural foreign currency hedges
in place to address foreign currency mismatches and the risk of debt repayments denominated in foreign
currencies (Chart E10).
Conclusion
Despite elevated corporate leverage levels, corporate balance sheets remain strong. MAS’ stress tests suggest
that the corporate sector is robust and able to withstand interest rate and earnings shocks. Although highly
leveraged corporates would be vulnerable, many of them use hedging strategies to guard against interest rate
and foreign exchange volatility. Accumulated cash reserves also provide additional buffers.
Nevertheless, leveraged corporates could do better in guarding against a protracted shock – when cash
reserves may be eroded, and debt has to be refinanced or hedges renewed at higher rates. Singapore
corporates should be pro-active in managing their debt and exercise caution before leveraging up further. MAS
will continue to monitor the corporate sector and the risks related to interest rate normalisation and potential
shocks from volatility in financial markets and an economic slowdown.
0
10
20
30
No Stress After Stress After Stress (With Cash Reserves)
Per C
ent
Debt Held by Firms With ICR < 2
Firms With ICR < 2
53% 50%
67%
0
20
40
60
80
100
Fixed-rate Bonds
Interest Rate Derivatives
FX Derivatives or
Natural Hedging
Pe
r Ce
nt
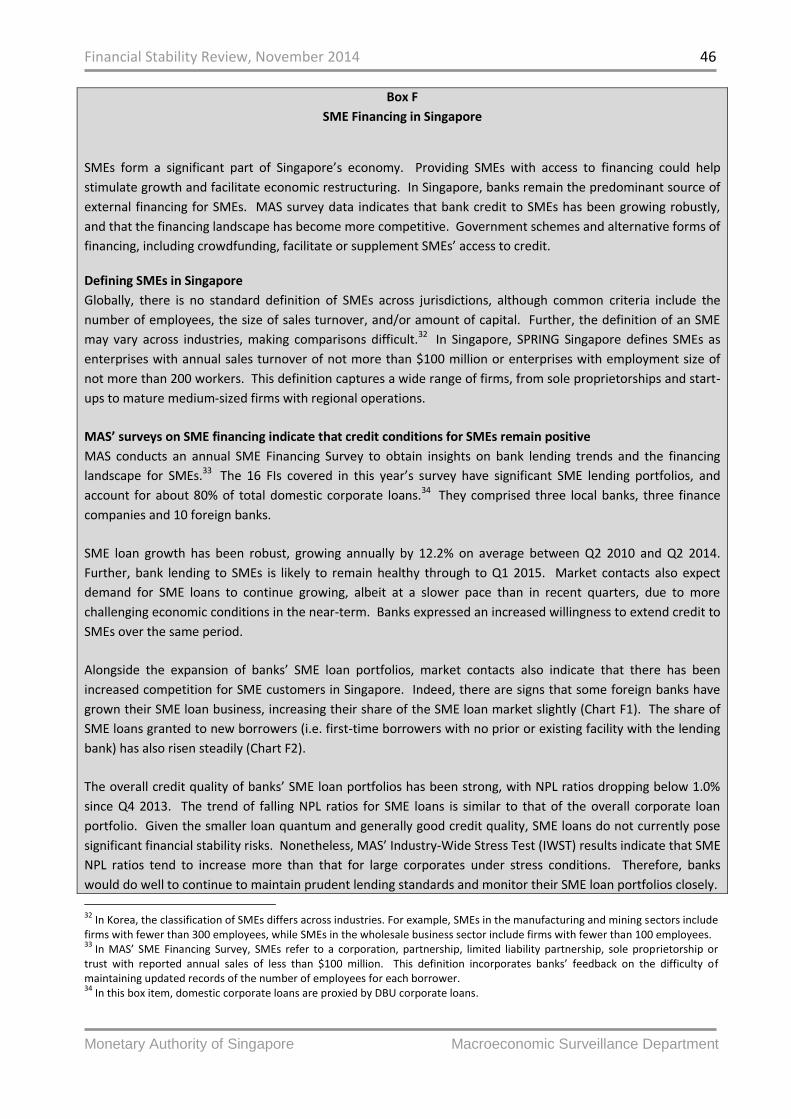
Financial Stability Review, November 2014 46
Monetary Authority of Singapore Macroeconomic Surveillance Department
32
In Korea, the classification of SMEs differs across industries. For example, SMEs in the manufacturing and mining sectors include firms with fewer than 300 employees, while SMEs in the wholesale business sector include firms with fewer than 100 employees. 33
In MAS’ SME Financing Survey, SMEs refer to a corporation, partnership, limited liability partnership, sole proprietorship or trust with reported annual sales of less than $100 million. This definition incorporates banks’ feedback on the difficulty of maintaining updated records of the number of employees for each borrower. 34
In this box item, domestic corporate loans are proxied by DBU corporate loans.
Box F
SME Financing in Singapore SMEs form a significant part of Singapore’s economy. Providing SMEs with access to financing could help
stimulate growth and facilitate economic restructuring. In Singapore, banks remain the predominant source of
external financing for SMEs. MAS survey data indicates that bank credit to SMEs has been growing robustly,
and that the financing landscape has become more competitive. Government schemes and alternative forms of
financing, including crowdfunding, facilitate or supplement SMEs’ access to credit.
Defining SMEs in Singapore
Globally, there is no standard definition of SMEs across jurisdictions, although common criteria include the
number of employees, the size of sales turnover, and/or amount of capital. Further, the definition of an SME
may vary across industries, making comparisons difficult.32 In Singapore, SPRING Singapore defines SMEs as
enterprises with annual sales turnover of not more than $100 million or enterprises with employment size of
not more than 200 workers. This definition captures a wide range of firms, from sole proprietorships and start-
ups to mature medium-sized firms with regional operations.
MAS’ surveys on SME financing indicate that credit conditions for SMEs remain positive
MAS conducts an annual SME Financing Survey to obtain insights on bank lending trends and the financing
landscape for SMEs.33 The 16 FIs covered in this year’s survey have significant SME lending portfolios, and
account for about 80% of total domestic corporate loans.34 They comprised three local banks, three finance
companies and 10 foreign banks.
SME loan growth has been robust, growing annually by 12.2% on average between Q2 2010 and Q2 2014.
Further, bank lending to SMEs is likely to remain healthy through to Q1 2015. Market contacts also expect
demand for SME loans to continue growing, albeit at a slower pace than in recent quarters, due to more
challenging economic conditions in the near-term. Banks expressed an increased willingness to extend credit to
SMEs over the same period.
Alongside the expansion of banks’ SME loan portfolios, market contacts also indicate that there has been
increased competition for SME customers in Singapore. Indeed, there are signs that some foreign banks have
grown their SME loan business, increasing their share of the SME loan market slightly (Chart F1). The share of
SME loans granted to new borrowers (i.e. first-time borrowers with no prior or existing facility with the lending
bank) has also risen steadily (Chart F2).
The overall credit quality of banks’ SME loan portfolios has been strong, with NPL ratios dropping below 1.0%
since Q4 2013. The trend of falling NPL ratios for SME loans is similar to that of the overall corporate loan
portfolio. Given the smaller loan quantum and generally good credit quality, SME loans do not currently pose
significant financial stability risks. Nonetheless, MAS’ Industry-Wide Stress Test (IWST) results indicate that SME
NPL ratios tend to increase more than that for large corporates under stress conditions. Therefore, banks
would do well to continue to maintain prudent lending standards and monitor their SME loan portfolios closely.
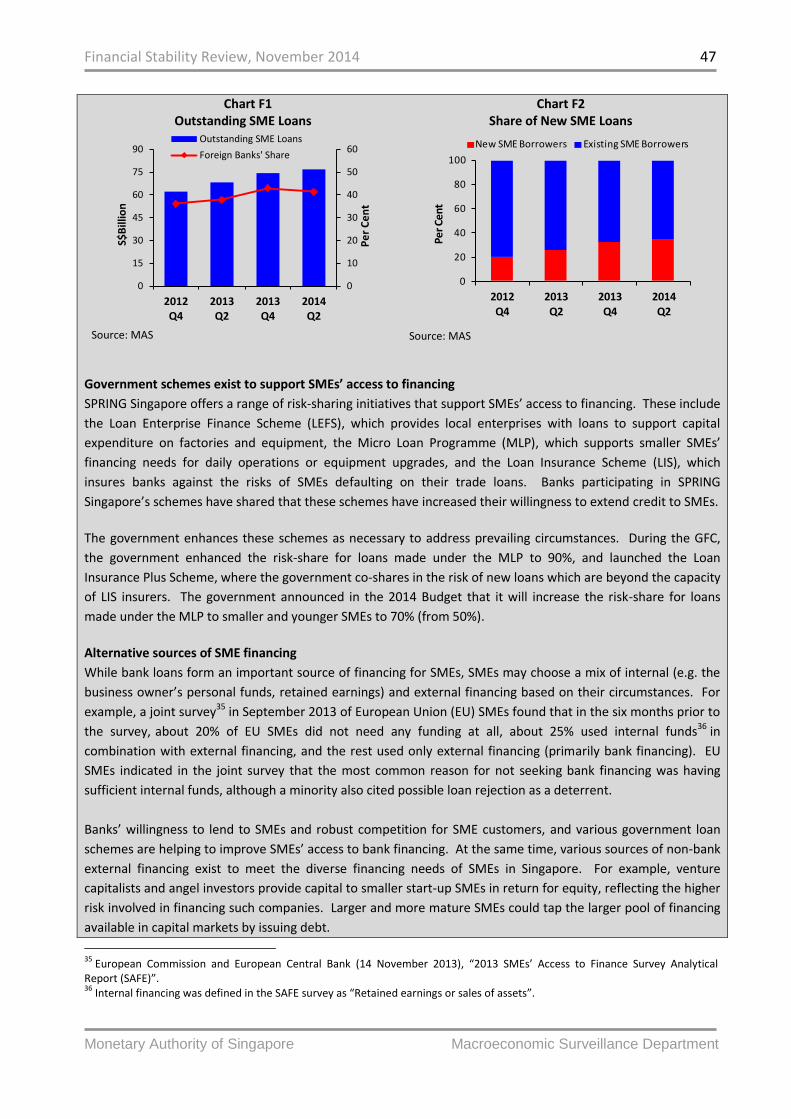
Financial Stability Review, November 2014 47
Monetary Authority of Singapore Macroeconomic Surveillance Department
35
European Commission and European Central Bank (14 November 2013), “2013 SMEs’ Access to Finance Survey Analytical Report (SAFE)”. 36
Internal financing was defined in the SAFE survey as “Retained earnings or sales of assets”.
Chart F1 Outstanding SME Loans
Source: MAS
Chart F2 Share of New SME Loans
Source: MAS
Government schemes exist to support SMEs’ access to financing
SPRING Singapore offers a range of risk-sharing initiatives that support SMEs’ access to financing. These include
the Loan Enterprise Finance Scheme (LEFS), which provides local enterprises with loans to support capital
expenditure on factories and equipment, the Micro Loan Programme (MLP), which supports smaller SMEs’
financing needs for daily operations or equipment upgrades, and the Loan Insurance Scheme (LIS), which
insures banks against the risks of SMEs defaulting on their trade loans. Banks participating in SPRING
Singapore’s schemes have shared that these schemes have increased their willingness to extend credit to SMEs.
The government enhances these schemes as necessary to address prevailing circumstances. During the GFC,
the government enhanced the risk-share for loans made under the MLP to 90%, and launched the Loan
Insurance Plus Scheme, where the government co-shares in the risk of new loans which are beyond the capacity
of LIS insurers. The government announced in the 2014 Budget that it will increase the risk-share for loans
made under the MLP to smaller and younger SMEs to 70% (from 50%).
Alternative sources of SME financing
While bank loans form an important source of financing for SMEs, SMEs may choose a mix of internal (e.g. the
business owner’s personal funds, retained earnings) and external financing based on their circumstances. For
example, a joint survey35 in September 2013 of European Union (EU) SMEs found that in the six months prior to
the survey, about 20% of EU SMEs did not need any funding at all, about 25% used internal funds36 in
combination with external financing, and the rest used only external financing (primarily bank financing). EU
SMEs indicated in the joint survey that the most common reason for not seeking bank financing was having
sufficient internal funds, although a minority also cited possible loan rejection as a deterrent.
Banks’ willingness to lend to SMEs and robust competition for SME customers, and various government loan
schemes are helping to improve SMEs’ access to bank financing. At the same time, various sources of non-bank
external financing exist to meet the diverse financing needs of SMEs in Singapore. For example, venture
capitalists and angel investors provide capital to smaller start-up SMEs in return for equity, reflecting the higher
risk involved in financing such companies. Larger and more mature SMEs could tap the larger pool of financing
available in capital markets by issuing debt.
0
10
20
30
40
50
60
0
15
30
45
60
75
90
2012Q4
2013Q2
2013Q4
2014Q2
Pe
r C
en
t
S$B
illio
n
Outstanding SME Loans
Foreign Banks' Share
0
20
40
60
80
100
2012
Q42013
Q22013
Q42014
Q2
Per C
ent
New SME Borrowers Existing SME Borrowers

Financial Stability Review, November 2014 48
Monetary Authority of Singapore Macroeconomic Surveillance Department
37
Eleanor Kirby and Shane Worner (2014), “Crowdfunding: An Infant Industry Growing Fast”, an IOSCO staff working paper.
In recent years, additional forms of external financing have emerged. For example, crowdfunding allows firms
or individuals to raise funds, typically via an online platform, from a large number of individual contributors,
who may receive a reward or asset in return. Crowdfunding has been suggested as an alternative source of
financing for start-ups and small companies, allowing businesses to obtain seed funding and test the viability of
their business ideas. In equity-based crowdfunding, contributors invest in shares sold by a firm and receive a
share of the profits, either as a dividend or as a distribution. In debt-based crowdfunding, contributors will
receive a commitment from a firm to repay the contribution at pre-determined time intervals and interest
rates.
The global crowdfunding market has grown significantly in recent years. In 2013, an estimated US$2.8 billion of
loans were originated through debt-based crowdfunding platforms, an increase of 145% from 2012. As at Q3
2014, total outstanding funds raised through debt-based and equity-based crowdfunding were estimated to be
at US$6.4 billion, with the US, UK and China making up 96% of all activity.37 In Singapore, the concept of
crowdfunding is still nascent. The government is currently studying the potential of crowdfunding as an
alternative source of funding for start-ups and small companies in Singapore, and MAS is exploring the
possibility of developing an appropriate regulatory framework for these new business models.
Conclusion
While access to financing is important in the development and growth of SMEs, other factors play a key role in
SMEs’ success. The overall business climate (including a consistent regulatory environment and reduced
barriers to entry) sets the conditions under which SMEs compete. At an individual SME level, idiosyncratic
factors such as competitors, business costs (including labour), customer demand and management capability
dictate profitability and growth prospects. MAS will continue to monitor the state of SME financing in
Singapore to support the growth and development of SMEs.
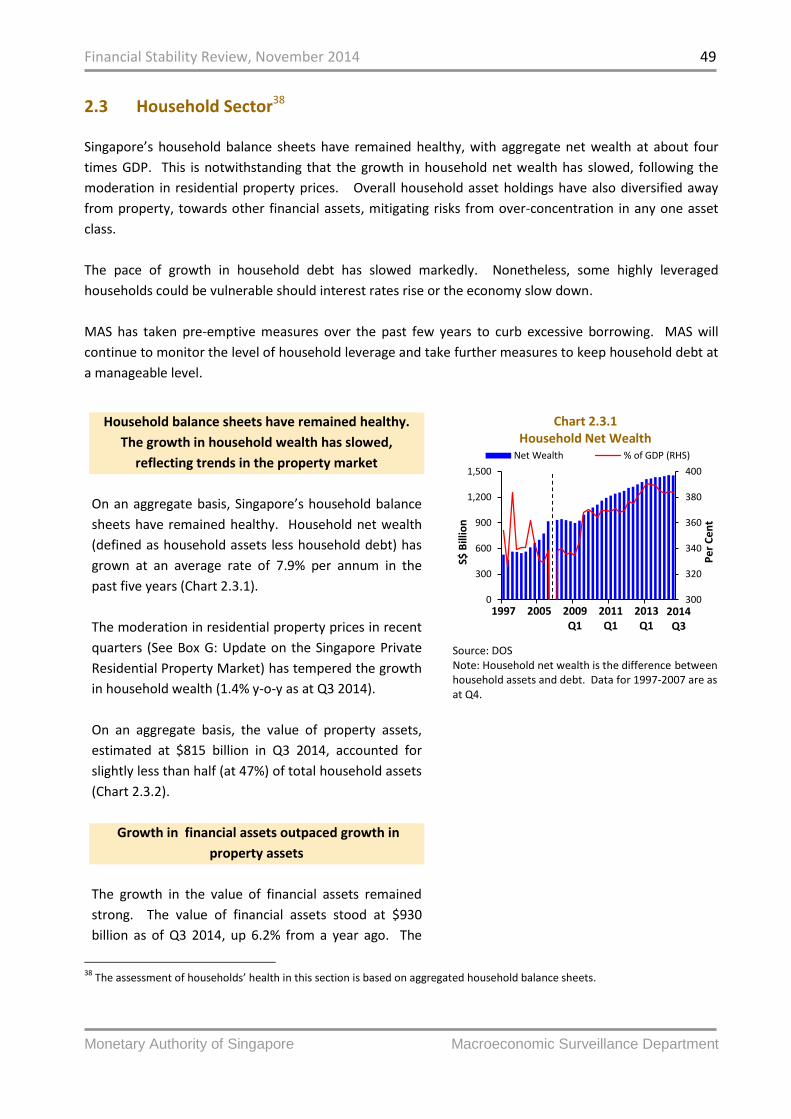
Financial Stability Review, November 2014 49
Monetary Authority of Singapore Macroeconomic Surveillance Department
2.3 Household Sector38
Singapore’s household balance sheets have remained healthy, with aggregate net wealth at about four
times GDP. This is notwithstanding that the growth in household net wealth has slowed, following the
moderation in residential property prices. Overall household asset holdings have also diversified away
from property, towards other financial assets, mitigating risks from over-concentration in any one asset
class.
The pace of growth in household debt has slowed markedly. Nonetheless, some highly leveraged
households could be vulnerable should interest rates rise or the economy slow down.
MAS has taken pre-emptive measures over the past few years to curb excessive borrowing. MAS will
continue to monitor the level of household leverage and take further measures to keep household debt at
a manageable level.
38
The assessment of households’ health in this section is based on aggregated household balance sheets.
Household balance sheets have remained healthy.
The growth in household wealth has slowed,
reflecting trends in the property market
On an aggregate basis, Singapore’s household balance
sheets have remained healthy. Household net wealth
(defined as household assets less household debt) has
grown at an average rate of 7.9% per annum in the
past five years (Chart 2.3.1).
The moderation in residential property prices in recent
quarters (See Box G: Update on the Singapore Private
Residential Property Market) has tempered the growth
in household wealth (1.4% y-o-y as at Q3 2014).
On an aggregate basis, the value of property assets,
estimated at $815 billion in Q3 2014, accounted for
slightly less than half (at 47%) of total household assets
(Chart 2.3.2).
Growth in financial assets outpaced growth in
property assets
The growth in the value of financial assets remained
strong. The value of financial assets stood at $930
billion as of Q3 2014, up 6.2% from a year ago. The
Chart 2.3.1 Household Net Wealth
Source: DOS Note: Household net wealth is the difference between household assets and debt. Data for 1997-2007 are as at Q4.
300
320
340
360
380
400
0
300
600
900
1,200
1,500
1997 2005 2009Q1
2011Q1
2013Q1
Pe
r C
en
t
S$ B
illio
nNet Wealth % of GDP (RHS)
2014Q3

Financial Stability Review, November 2014 50
Monetary Authority of Singapore Macroeconomic Surveillance Department
39
Under the proposal, offers of precious metals buyback schemes and collectively-managed investment schemes (e.g. land or forestry investment schemes) will need to be accompanied by a prospectus and the intermediaries licensed by MAS.
share of financial assets in total household assets has
risen, from 50% in Q3 2011 to 53% in Q3 2014.
In particular, the growth in the value of financial assets
was driven by a significant increase in cash and
deposits, Central Provident Fund (CPF) savings and
insurance assets, which grew by 5.7%, 8.9% and 8.7%
y-o-y respectively in Q3 2014. The value of shares and
securities increased by 1.9% compared to a year ago.
The diversification in household assets towards
financial assets is a welcome development as it
mitigates risks to household balance sheets from over-
concentration in any one asset class. To further
develop financial markets and broaden investment
options for the retail market, MAS is working on
initiatives to encourage well-rated companies to issue
bonds, and to improve retail investors’ access to the
bond market.
Consumers should continue to exercise due diligence
before committing to investment decisions, particularly
given the rise in the number of non-conventional
products offered to retail investors as alternative
investments. Some of these products have features
that are similar to regulated capital market products,
but are deliberately structured to assign ownership of
underlying physical assets to investors, thereby taking
them outside the perimeter of MAS’ regulatory
framework.39 To safeguard consumers’ interests, MAS
has proposed to extend to investors in these products
the current regulatory safeguards for investors in
capital markets.
MAS macroprudential measures have strengthened
household balance sheets and slowed the pace of
growth in household debt
The pace of growth in household debt has slowed
markedly. In Q3 2014, household liabilities grew at
5.6% y-o-y, compared to an average of 9.2% over the
last five years (Chart 2.3.3). The household debt-to-
Chart 2.3.2 Household Assets and Household Debt
Source: DOS Note: Data for 1997-2007 are as at Q4.
Chart 2.3.3 Growth of Household Assets and Debt
Source: DOS
Chart 2.3.4 Household Debt
Source: DOS Note: Data for 1997-2007 are as at Q4.
0
300
600
900
1,200
1,500
1,800
1997 2005 2009Q1
2011Q1
2013Q1
S$ B
illio
n
Cash & Deposits CPF & Pensions
Life Insurance Shares & Securities
Property Household Debt
2014Q3
-5
0
5
10
15
20
2004 2006 2008 2010 2012 2014Q3
Yo
Y %
Gro
wth
Assets Debt
0
50
100
150
200
250
300
1997 2005 2009Q1
2011Q1
2013Q1
S$ B
illio
n
OthersCredit/Charge Card LoansMotor Vehicle LoansHousing Loans
2014Q3
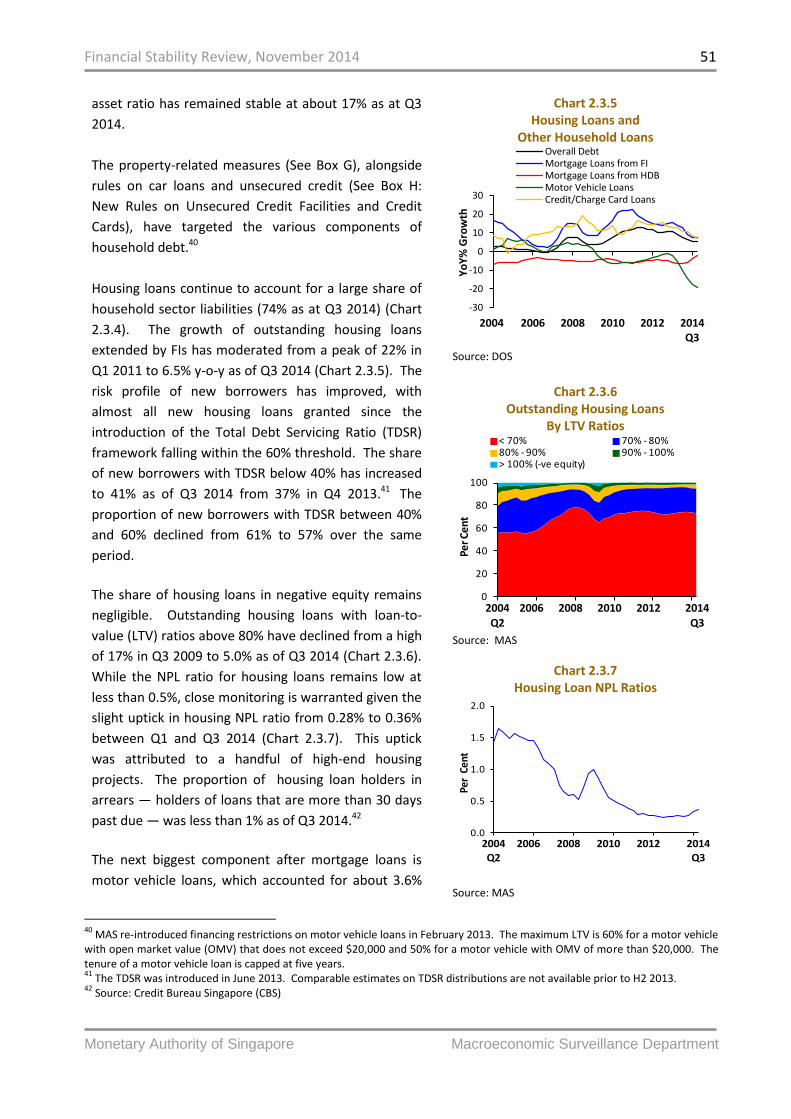
Financial Stability Review, November 2014 51
Monetary Authority of Singapore Macroeconomic Surveillance Department
40
MAS re-introduced financing restrictions on motor vehicle loans in February 2013. The maximum LTV is 60% for a motor vehicle with open market value (OMV) that does not exceed $20,000 and 50% for a motor vehicle with OMV of more than $20,000. The tenure of a motor vehicle loan is capped at five years. 41
The TDSR was introduced in June 2013. Comparable estimates on TDSR distributions are not available prior to H2 2013. 42
Source: Credit Bureau Singapore (CBS)
asset ratio has remained stable at about 17% as at Q3
2014.
The property-related measures (See Box G), alongside
rules on car loans and unsecured credit (See Box H:
New Rules on Unsecured Credit Facilities and Credit
Cards), have targeted the various components of
household debt.40
Housing loans continue to account for a large share of
household sector liabilities (74% as at Q3 2014) (Chart
2.3.4). The growth of outstanding housing loans
extended by FIs has moderated from a peak of 22% in
Q1 2011 to 6.5% y-o-y as of Q3 2014 (Chart 2.3.5). The
risk profile of new borrowers has improved, with
almost all new housing loans granted since the
introduction of the Total Debt Servicing Ratio (TDSR)
framework falling within the 60% threshold. The share
of new borrowers with TDSR below 40% has increased
to 41% as of Q3 2014 from 37% in Q4 2013.41 The
proportion of new borrowers with TDSR between 40%
and 60% declined from 61% to 57% over the same
period.
The share of housing loans in negative equity remains
negligible. Outstanding housing loans with loan-to-
value (LTV) ratios above 80% have declined from a high
of 17% in Q3 2009 to 5.0% as of Q3 2014 (Chart 2.3.6).
While the NPL ratio for housing loans remains low at
less than 0.5%, close monitoring is warranted given the
slight uptick in housing NPL ratio from 0.28% to 0.36%
between Q1 and Q3 2014 (Chart 2.3.7). This uptick
was attributed to a handful of high-end housing
projects. The proportion of housing loan holders in
arrears — holders of loans that are more than 30 days
past due — was less than 1% as of Q3 2014.42
The next biggest component after mortgage loans is
motor vehicle loans, which accounted for about 3.6%
Chart 2.3.5 Housing Loans and
Other Household Loans
Source: DOS
Chart 2.3.6 Outstanding Housing Loans
By LTV Ratios
Source: MAS
Chart 2.3.7 Housing Loan NPL Ratios
Source: MAS
-30
-20
-10
0
10
20
30
2004 2006 2008 2010 2012 2014Q3
Yo
Y%
Gro
wth
Overall DebtMortgage Loans from FIMortgage Loans from HDBMotor Vehicle LoansCredit/Charge Card Loans
0
20
40
60
80
100
2004Q2
2006 2008 2010 2012 2014Q3
Per C
ent
< 70% 70% - 80%80% - 90% 90% - 100%> 100% (-ve equity)
0.0
0.5
1.0
1.5
2.0
2004Q2
2006 2008 2010 2012 2014 Q3
Per
Cent
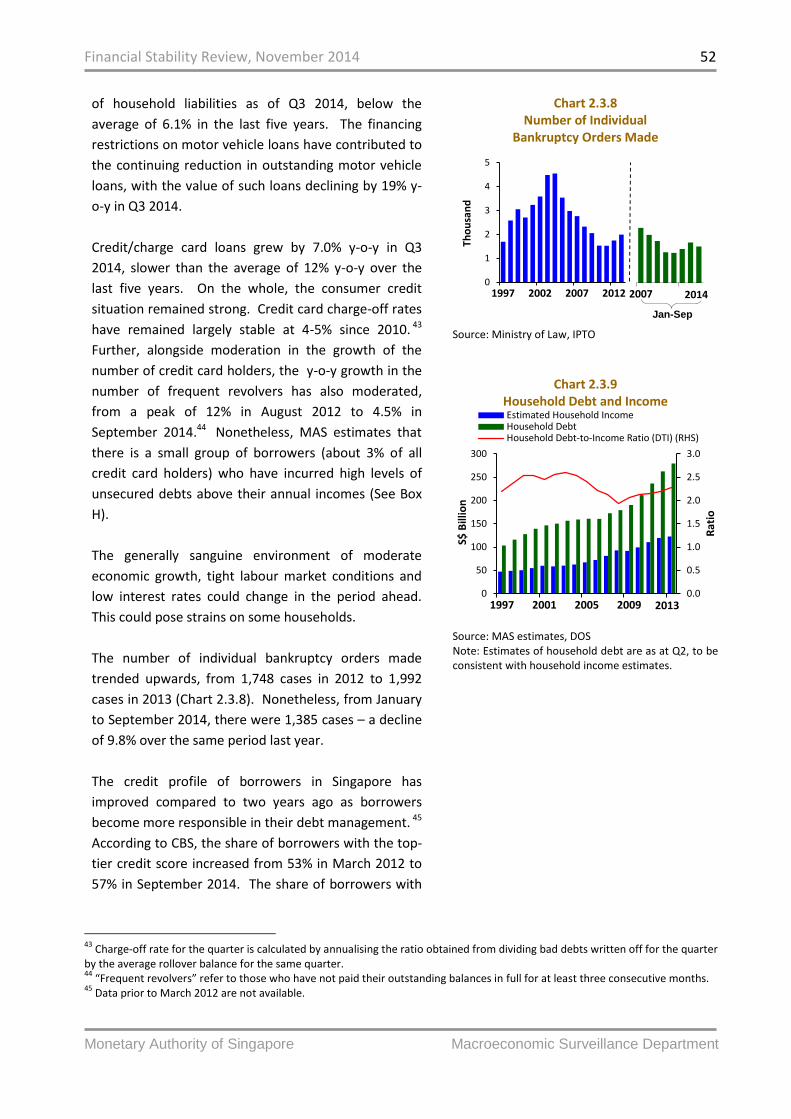
Financial Stability Review, November 2014 52
Monetary Authority of Singapore Macroeconomic Surveillance Department
43
Charge-off rate for the quarter is calculated by annualising the ratio obtained from dividing bad debts written off for the quarter by the average rollover balance for the same quarter. 44
“Frequent revolvers” refer to those who have not paid their outstanding balances in full for at least three consecutive months. 45
Data prior to March 2012 are not available.
of household liabilities as of Q3 2014, below the
average of 6.1% in the last five years. The financing
restrictions on motor vehicle loans have contributed to
the continuing reduction in outstanding motor vehicle
loans, with the value of such loans declining by 19% y-
o-y in Q3 2014.
Credit/charge card loans grew by 7.0% y-o-y in Q3
2014, slower than the average of 12% y-o-y over the
last five years. On the whole, the consumer credit
situation remained strong. Credit card charge-off rates
have remained largely stable at 4-5% since 2010. 43
Further, alongside moderation in the growth of the
number of credit card holders, the y-o-y growth in the
number of frequent revolvers has also moderated,
from a peak of 12% in August 2012 to 4.5% in
September 2014.44 Nonetheless, MAS estimates that
there is a small group of borrowers (about 3% of all
credit card holders) who have incurred high levels of
unsecured debts above their annual incomes (See Box
H).
The generally sanguine environment of moderate
economic growth, tight labour market conditions and
low interest rates could change in the period ahead.
This could pose strains on some households.
The number of individual bankruptcy orders made
trended upwards, from 1,748 cases in 2012 to 1,992
cases in 2013 (Chart 2.3.8). Nonetheless, from January
to September 2014, there were 1,385 cases – a decline
of 9.8% over the same period last year.
The credit profile of borrowers in Singapore has
improved compared to two years ago as borrowers
become more responsible in their debt management. 45
According to CBS, the share of borrowers with the top-
tier credit score increased from 53% in March 2012 to
57% in September 2014. The share of borrowers with
Chart 2.3.8 Number of Individual
Bankruptcy Orders Made
Source: Ministry of Law, IPTO
Chart 2.3.9 Household Debt and Income
Source: MAS estimates, DOS Note: Estimates of household debt are as at Q2, to be consistent with household income estimates.
0
1
2
3
4
5
1997 2002 2007 2012
Tho
usa
nd
2007 2012
Jan-Sep
2014
0.0
0.5
1.0
1.5
2.0
2.5
3.0
0
50
100
150
200
250
300
1997 2001 2005 2009
Rat
io
S$ B
illio
n
Estimated Household IncomeHousehold DebtHousehold Debt-to-Income Ratio (DTI) (RHS)
2013

Financial Stability Review, November 2014 53
Monetary Authority of Singapore Macroeconomic Surveillance Department
46
The CBS scores measure the probability of the consumer defaulting within the next 12 months based on his or her credit history.
scores in the lowest tier also declined from 8.1% to
7.4% over the same period.46
Despite moderation in household leverage, the level
of debt among highly leveraged households poses a
risk; reducing their level of debt will take time
Despite some moderation in the overall level of
household indebtedness, the level of debt among
highly leveraged households bears close watching. The
household debt-to-income ratio has risen from a low of
1.9 times in 2008 during the Lehman crisis to 2.3 times
in 2013 (Chart 2.3.9).
At higher levels of indebtedness, households are more
vulnerable to payment difficulties in the event of
interest rate or income shocks. Under an adverse
scenario, households with debt at high TDSR levels may
have limited room to cut back on spending in order to
keep up with monthly debt repayments. For a highly
leveraged household, reducing the level of debt will
take time, and it will need to work with its bank and a
credit counselling agency to reduce its debt via a debt
repayment plan. In some cases, the sale of investment
properties or rightsizing of homes may be necessary.
The risk of a downturn in the global economy even as
the supply of new housing comes onstream and rental
markets weaken could put further downward pressure
on the property market.
MAS has taken pre-emptive action where appropriate,
to curb excessive household borrowing over the past
few years. MAS will continue to monitor lending and
borrowing activities, and take further measures where
necessary to keep household debt at a manageable
level.

Financial Stability Review, November 2014 54
Monetary Authority of Singapore Macroeconomic Surveillance Department
Box G
Update on the Singapore Private Residential Property Market
Demand for private residential property continued to moderate in 2014. Monthly transaction volumes have
fallen to less than half their numbers in the preceding two years, while prices registered the most sustained –
albeit moderate – decline since Q2 2009 in the last four quarters. New housing loans have also contracted.
While prices have moderated following the series of property measures introduced since 2009, they remain at
an elevated level. At the same time, purchases of foreign properties have risen in the last one to two years.
While increased interest in foreign properties could reflect a desire to diversify investment assets, households
should be mindful of the risks associated with investing in overseas property markets and conduct appropriate
due diligence before committing to a purchase.
Private Property Prices and Transactions
Prices in the private housing market have declined for four consecutive quarters, by a cumulative 3.9% since Q4
2013 (Chart G1). However, prices remained at an elevated level, having increased by 62% from the trough in
Q2 2009 to Q3 2013.
The price decline was broad-based, but the momentum varied across different market segments. Prices in the
Core Central Region (CCR) trended down before other market segments, declining by 5.7% from the peak in Q1
2013 to Q3 2014. Prices of mass market homes in the Outside Central Region (OCR) started falling only two
quarters later in Q4 2013, with a smaller decline of 2.3% since then (Chart G2).
Overall transaction activity in the private residential property market fell as buyers turned cautious, as some
may be holding back their purchases in anticipation of further price declines. 47 Average monthly transactions
moderated to 1,200 units in the first ten months of this year, down from 1,900 units in 2013 and a peak of
3,200 units in 2012. Sub-sale and resale activity remained subdued, while new sales – which had held up when
sub-sales and resales declined previously – also fell, averaging 700 units per month in the first ten months of
2014, compared to 1,300 units in 2013 (Chart G3). The share of purchases by foreigners has remained low
(Chart G4) since the implementation of the Additional Buyer Stamp Duty (ABSD).
The supply of new housing units due for completion in the near-term (Chart G5) will continue to exert pressure
on vacancy rates (Chart G6) and rentals (Chart G7) for investment properties. The anticipated increase in
mortgage costs as interest rates normalise would likely dampen housing demand as well.
47
This encompasses new sale, sub-sale and resale transactions.

Financial Stability Review, November 2014 55
Monetary Authority of Singapore Macroeconomic Surveillance Department
Chart G1 Private Property Price Index (Q-o-Q Change)
Chart G2 Private Property Price Index by Region
Source: URA
Source: URA
Chart G3
Number of Private Residential Property Transactions
Chart G4 Foreign Transactions for Private
Residential Property
Source: URA Source: URA
Chart G5
Supply of Private Residential Properties by Expected Year of Completion
(As at Q3 2014)
Chart G6
Vacancy Rates for Private Residential Property
Source: URA Source: URA
-20
-10
0
10
20
2004 2006 2008 2010 2012 2014
Pe
r C
en
t
Q3
100
140
180
220
260
2004 2006 2008 2010 2012 2014
Ind
ex
(19
98
Q4
=10
0)
Overall Core Central
Rest of Central Outside Central
Q3
0
1
2
3
4
5
2011 2012 2013 2014
Tho
usa
nd
ResaleSub-SaleNew SaleMonthly Average since 2011
Oct
0
5
10
15
20
25
0
500
1,000
1,500
2,000
2,500
2004 2006 2008 2010 2012 2014
Pe
r C
en
t
Un
its
Foreign TransactionsForeign Share as % of Total Transactions (RHS)
Q3
0
5
10
15
20
25
2014 2015 2016 2017 2018
Tho
usa
nd
Uncompleted Completed
4
5
6
7
8
9
10
1995 1999 2003 2007 2011
Per
Cent
2014
Q3

Financial Stability Review, November 2014 56
Monetary Authority of Singapore Macroeconomic Surveillance Department
Chart G7
Private Residential Rental Index (Q-o-Q Change)
Source: URA
Housing Loans
The property-related measures have tempered the growth of outstanding housing loans, with y-o-y growth
moderating from the peak of 23% in August 2010 to 6% in September 2014 (Chart G8). The volume of new
housing loans, which generally tracks housing transactions, contracted from $11.4 billion in Q2 2013 to $6.7
billion in Q3 2014. New housing loans taken up since the introduction of the various property measures have
lower LTV ratios and shorter loan tenures. The share of new private housing loans with LTV ratios above 70%
declined from 77% in Q2 2010 to an average of 65% since 2012 (Chart G9). The average tenure of new private
housing loans has also declined, from 30 years in 2012 to 25 years in Q3 2014 (Chart G10). Borrowers taking
multiple loans accounted for 15% of all new housing loans as of Q3 2014, compared to 30% in 2011 (Chart
G11).
The banking system remains sound and is resilient to risks arising from the property market. There is a healthy
buffer against property price reductions with the average outstanding housing LTV ratio in the banking system
just under 50%. The banking system’s housing NPL ratio – loans that are more than 90 days past due –
remained very low; a slight uptick from 0.28% to 0.36% between Q1 2014 and Q3 2014 was attributed to a
handful of defaults for high-end housing projects (Chart G12). The proportion of housing loan holders in
arrears – holders of loans that are more than 30 days past due – was less than 1% as of Q3 2014. 48 Further,
under the stress scenario in MAS’ IWST exercise, banking system housing NPL ratios remained below 6% and
banks continued to meet their minimum regulatory total capital adequacy ratio (CAR) requirement of 10%.49
48
Source: CBS 49
The IWST incorporates scenarios of US economic growth collapsing on the back of a US rating downgrade, a crisis in Europe and an underperforming Chinese economy. In Singapore, the scenario envisaged rising unemployment, a sharp drop in property prices and a jump in corporate sector defaults.
-10
-5
0
5
10
15
2004 2006 2008 2010 2012 2014
Per C
ent
Q3

Financial Stability Review, November 2014 57
Monetary Authority of Singapore Macroeconomic Surveillance Department
Chart G8
Housing Loan Growth
Chart G9
New Housing Loans by LTV Ratios
Source: MAS Source: MAS
Chart G10 Average Loan Tenure of New Private
Housing Loans
Source: MAS
Chart G11
Share of New Housing Loans Borrowers With Existing Housing Loans
Source: MAS Note: The number of housing loans includes new housing loans under application.
Chart G12
Housing Loans NPL Ratio
.
Source: MAS
0
5
10
15
20
25
2005 2007 2009 2011 2013
Yo
Y%
Gro
wth
2014Q3
0
20
40
60
80
100
2008 2009 2010 2011 2012 2013 2014
Pe
r C
en
t
With LTV < 50% LTV Between 50%-60%LTV Between 60%-70% With LTV < 70%LTV Between 70%-80% LTV > 80%
Q3
20
22
24
26
28
30
2009 2010 2011 2012 2013 2014
Loan
Te
nu
re (
In Y
ear
s)
Q30
20
40
60
80
100
2011 Jul 2012 Jul 2013 Jul 2014
Pe
r C
en
t1 loan 2 loans 3 and more loans
Sep
0.0
0.5
1.0
1.5
2.0
2004 2006 2008 2010 2012
Pe
r C
en
t
2014Q3Q2

Financial Stability Review, November 2014 58
Monetary Authority of Singapore Macroeconomic Surveillance Department
Purchase of Overseas Properties
Banks’ exposures to foreign property loans remained low, comprising less than 2% of total housing loan
exposures. Nonetheless, real estate agencies in Singapore have seen increased interest in overseas property
purchases, from across a broader spectrum of Singapore buyers. Based on an MAS survey that covers data
collected on overseas properties transacted by real estate agencies in Singapore, the value of overseas
property purchases transacted in Singapore rose from $1.9 billion in 2012 to $3.0 billion in 2013, before
moderating to $1.1 billion in H1 2014 (Chart G13).50 Properties in the UK, Malaysia and Australia accounted for
91% of total transactions by value and 76% by number in H1 2014, but households also purchased properties in
Japan, the Philippines and Thailand. The lower price quantums of properties in some markets might have made
them more attractive to lower- and middle-income households.
Households should be mindful of additional risks associated with overseas property purchases. Besides foreign
exchange and interest rate risks, investors may be unfamiliar with conditions in overseas markets, including
risks associated with property price cycles, the legal and regulatory frameworks governing property purchases
and financing agreements, and any measures taken by authorities to manage non-residents’ holdings of
property. In some emerging markets, the tenant pool is not established and the rental markets are not
sufficiently mature to provide assurance of investment returns. Households should also do their financial sums
carefully – as they would for Singapore properties – before committing to additional debt to finance foreign
property purchases.
Chart G13 Overseas Property Transactions
by Singaporeans (Value)
Source: MAS survey on overseas property transactions by real estate agencies in Singapore, July 2014
Conclusion
Private property prices in Singapore have moderated but remain at an elevated level. New housing loans have
declined in tandem with the fall in transactions. The property measures have also contributed to restoring
financial prudence, but the prospect of higher interest rates remains a risk for some highly leveraged
households. MAS will continue to monitor the property market and take appropriate measures to maintain a
stable and sustainable market.
50
In an earlier May 2014 survey which covered fewer real estate agencies, the value of overseas properties purchases by Singaporeans transacted by real estate agencies in Singapore was estimated at $2 billion in 2013.
0
400
800
1,200
1,600
2,000
2012H1
2012H2
2013H1
2013H2
2014H1
S$ M
illio
n

Financial Stability Review, November 2014 59
Monetary Authority of Singapore Macroeconomic Surveillance Department
Box H
New Rules on Unsecured Credit Facilities and Credit Cards
Credit card usage in Singapore has risen
The use of credit cards has become more commonplace, as evidenced by the increase in the number of credit
and charge cards issued, from 5.9 million in 2008 to 9.3 million in 2013. This translated to an increase in card
penetration rate from 3.1 in 2008 to 4.4 in 2013.51 These trends have been brought about in part by the
increased convenience and acceptance of such cards, a growing working population, and a general rise in
affluence. The number of professionals, managers, executives and technicians (PMETs) in the resident
workforce has grown by 2.8% per annum between 2008 and 2013. The number of individuals with incomes of
$2,500 or higher rose at an average rate of 5.6% per annum over the same period.52
Consumer credit situation in Singapore remains healthy
The consumer credit situation in Singapore remains sound on the whole. While the ratio of outstanding credit
card balances to GDP has grown with increasing card usage, the ratio of rollover balances to GDP has remained
low at about 1.4% (Chart H1).53 The proportion of revolvers has also stayed broadly stable at about 35% of all
credit cardholders (Chart H2). 54 Bad debts written off from credit cards (i.e. charge-off rates55) have remained
low at 4-5% of average rollover balances (Chart H3). Nonetheless, MAS estimates that about 3% of credit card
holders have accumulated unsecured debts that exceed their annual incomes.
Chart H1 Credit Card Rollover Balances as % of GDP
Source: MAS
Chart H2 Percentage of Credit Card Holders with
Rollover Balances
Source: MAS
51
Card penetration rate is defined as the total number of cards divided by the total number of economically active residents aged fifteen years and above. Data is as at June 2013. 52
For an individual to qualify for a credit card facility, he has to have a minimum annual income of $30,000. This is about $2,500 in monthly income. 53
Rollover balance is defined to be the amount of the outstanding balance that is not paid in full within the billing month. 54
“Revolvers” refer to credit cardholders who do not pay in full their outstanding credit card balances. 55
Charge-off rate for the quarter is calculated by annualising the ratio obtained from dividing bad debts written off for the quarter by the average rollover balance for the same quarter.
0.0
0.5
1.0
1.5
2.0
2.5
3.0
2004 2006 2008 2010 2012
Pe
r C
en
t
Total outstanding to GDP ratio
Rollover balance to GDP ratio
2014 Q30
10
20
30
40
50
2005Q4
2007 Q4
2009 Q4
2011Q4
2013 Q4
Pe
r C
en
t
2014Q3

Financial Stability Review, November 2014 60
Monetary Authority of Singapore Macroeconomic Surveillance Department
Chart H3
Credit Card Charge-Off Rates
Source: MAS
To encourage financial prudence and enhance FIs’ lending practices, MAS has strengthened unsecured credit
and credit card rules as set out below.
Enhanced credit assessment
Since June 2014, FIs have been required to conduct checks with credit bureaus and take into account the total
credit limits and total outstanding debt balances of a borrower before they can grant a borrower a new credit
card, a new unsecured credit facility or an increase in credit limit.
Measures to prevent accumulation of debt
With effect from June 2015, an FI will not be allowed to grant additional unsecured credit to a borrower who is 60 days or more past due on any credit card or unsecured credit facility. In addition, other FIs will not be able to increase credit limits or grant new unsecured facilities to this individual.
FIs will also be prohibited from granting further unsecured credit to a borrower whose outstanding unsecured
debt aggregated across all FIs exceeds his annual income for three consecutive months or more.
Information disclosure by FIs
From June 2015, FIs will be required to disclose to a borrower who has rolled over unsecured debt, the total
amount and time needed to pay off his debts fully if he settled only the FI’s required minimum payment every
month. He will also be informed of the amount of debt that will accumulate if the debt were to be accrued over
the next six months. Such disclosure is aimed at raising awareness on the cost of rolling over debts so that
borrowers can make more informed borrowing decisions.
Conclusion
The consumer credit situation is healthy and the regulatory actions taken are pre-emptive. The strengthened
rules will further encourage prudent lending and help prevent borrowers from accumulating excessive debts.
MAS will continue to monitor trends in unsecured credit facilities and credit cards.
0
2
4
6
8
10
2004 2006 2008 2010 2012 2014
Pe
r C
en
t
Q3

Financial Stability Review, November 2014 61
Monetary Authority of Singapore Macroeconomic Surveillance Department
2.4 Banking Sector
Singapore’s banking system remains resilient through 2014. The local banking groups have maintained
healthy funding and capital positions amid regional expansion.
Loan growth has decelerated over the past year, in both the non-bank and interbank markets. Asset
quality remains healthy. Banks should continue to maintain good credit underwriting practices and ensure
that provisioning is prudent and robust to potential stress conditions.
In line with increasing cross-border exposures, the banking system’s foreign currency exposures have
risen. Banks should continue to monitor foreign currency funding risks closely as they expand in the
region and grow their foreign currency lending. Domestically, SGD funding remains adequate with non-
bank deposits sourced from Singapore exceeding financing needs of the corporate and household sectors.
Bank loan growth has moderated since the turn of
the year
Overall loan growth has slowed since the turn of the
year to 7.4% y-o-y in Q3 2014 from a recent peak of
12.6% in Q4 2013. Both non-bank and interbank loan
growth contributed to the slowdown (Chart 2.4.1).
Non-bank loan growth moderated from 19.7% y-o-y in
Q4 2013 to 14.0% in Q3 2014. Macroprudential
measures on housing loans, as well as a subdued
domestic and regional growth outlook, have reined in
loan growth to households and corporates.
The interbank loan market contracted 2.5% y-o-y in
Q3 2014. While Domestic Banking Unit (DBU)
interbank loan growth has been flat or negative since
Q3 2011, Asian Currency Unit (ACU) interbank loan
growth turned negative only in Q2 2014.
Cross-border non-bank exposures, particularly to
Asia, continue to increase, as both Asian and
European banks in Singapore grew their loan books
Banks in Singapore have grown their cross-border
loan books as an increasing number of local and
international corporates use Singapore as a funding
hub to expand across Asia. As a result, ACU non-bank
loans posted strong growth of 19.0% y-o-y in Q3 2014
(Chart 2.4.2).
Chart 2.4.1 Components of Overall Loan Growth
Source: MAS
Chart 2.4.2 Growth in Cross-Border ACU Non-Bank Loans
by Region
Source: MAS
-20
-10
0
10
20
30
2008 2010 2012 2014
% P
oin
t C
on
trib
uti
on
to Y
oY
% G
row
th
Total ACU Non-Bank LoansTotal DBU Non-Bank LoansTotal ACU Interbank LoansTotal DBU Interbank LoansYoY Growth
Q3
-40
-20
0
20
40
60
2008 2010 2012 2014
Yo
Y %
Gro
wth
Asia AmericasEurope OthersTotal
Q3

Financial Stability Review, November 2014 62
Monetary Authority of Singapore Macroeconomic Surveillance Department
Asia continues to dominate cross-border lending from
Singapore, accounting for 63% of cross-border ACU
non-bank loans in Q3 2014, up from 60% a year ago
(Chart 2.4.3).
Total syndicated loans grew by 7.5% y-o-y in Q3 2014,
up slightly from 7.3% in Q3 2013. Total trade finance
facilities grew 16.8% y-o-y in Q3 2014, compared to
29.3% in Q3 2013. The slower growth was due to a
10.7% y-o-y contraction in letters of credit in Q3 2014,
compared to growth of 24.4% in Q3 2013. However,
this was outweighed by continued robust y-o-y
growth in bills and trust receipts of 31.2% and 14.4%
respectively.
Over the past year, European banks in Singapore
retained their market shares in the expanding
syndicated loan and trade finance space, halting the
gains made by the local and other Asian banks in the
immediate aftermath of the GFC (Chart 2.4.4).
Cross-border interbank loans have contracted over
recent months; the Americas is the exception
Cross-border ACU interbank loans contracted in
recent months across all regions except for the
Americas (Chart 2.4.5). The recent revival in
interbank lending to the Americas reversed a four-
year trend of declining interbank loans to that region.
DBU non-bank loan growth has moderated over the
past year
DBU non-bank loan growth has moderated from
17.0% y-o-y in Q4 2013 to 10.6% y-o-y in Q3 2014 due
to slower growth in property-related loans (Chart
2.4.6). Based on a survey of banks, non-bank loan
growth could continue to moderate in the near
future, especially for housing loans.
The banking system is self-sufficient domestically,
but foreign currency funding gaps could constrain
future growth in cross-border lending
Chart 2.4.3 Cross-Border ACU Non-Bank Loans by Region
Source: MAS
Chart 2.4.4 Trade Finance and Syndicated Loan Market Shares by Bank Nationality
Source: MAS
Chart 2.4.5 Growth in Cross-Border ACU Interbank Loans
by Region
Source: MAS
0
80
160
240
320
400
2008 2010 2012 2014
S$ B
illio
n
Asia Americas Europe Others
Q3
0
20
40
60
80
100
Q208
Q313
Q314
Q208
Q313
Q314
Q208
Q313
Q314
Q208
Q313
Q314
Pe
r C
en
t
Asia
Europe
Others
Export/Import
Bills
Letters of Credit
Trust Receipts
Syndicated Loans
-60
-40
-20
0
20
40
60
2008 2010 2012 2014
Yo
Y %
Gro
wth
Asia Americas Europe
Others Total
Q3

Financial Stability Review, November 2014 63
Monetary Authority of Singapore Macroeconomic Surveillance Department
Domestic SGD funding remains adequate as non-bank
deposits sourced from Singapore exceed loans to
Singapore corporates and households. Excess
deposits are channelled into cross-border lending
(See Box I: Funding Needs and Cross-border
Exposures of Singapore’s Banking System: Financing
the Domestic Economy and Beyond).
However, overall funding and liquidity risks in the
banking system bear close monitoring. The growth in
non-bank deposits declined steadily since Q3 2013,
reaching 4.7% y-o-y in Q3 2014, while non-bank loans
grew at a faster clip of 14.0% y-o-y over the same
period.
As a result, loan-to-deposit (LTD) ratios have trended
upwards. The overall LTD ratio rose to 110.7% in Q3
2014 from 101.7% in Q3 2013, driven primarily by a
higher foreign currency LTD ratio. The foreign
currency LTD ratio reached a high of 146.4% in May
2014 before coming down to 139.9% in Q3 2014
(Chart 2.4.7). The upward trend in the foreign
currency LTD ratio was due mainly to rising foreign
currency loans. In contrast, the SGD LTD ratio
remains healthy at 84.3% in Q3 2014 (Chart 2.4.7).
Rising LTD ratios could put pressure on the availability
and cost of funding to support growth in cross-border
lending (See Box J: Funding Liquidity in Singapore’s
Banking System: Making Sense from Different
Perspectives).
Asset quality remains strong, but banks should
ensure loan provisions are adequate and robust to a
reversal in current low NPLs
Asset quality of non-bank loans remains strong. The
overall NPL ratio in Q3 2014 was 1.1%, a slight
improvement over 2013 (Chart 2.4.8). The NPL ratio
for the TSC sector has declined from a peak of 8.2% in
Q3 2013 to 5.6% in Q3 2014, reversing a six-year
trend of rising NPLs. Although accounting for only
7.1% of outstanding non-bank loans, the TSC sector
contributed the largest share of overall NPLs at 36%.
Chart 2.4.6 DBU Non-Bank Loans by Sector
Source: MAS
Chart 2.4.7 Banking System
Loan-To-Deposit Ratios
Source: MAS
Chart 2.4.8 Overall NPL Ratio
Source: MAS
-10
0
10
20
30
40
2008 2010 2012 2014Q3
% P
oin
t C
on
trib
uti
on
to
Yo
Y %
Gro
wth
Others Transport, Storage & CommProfessional & Private Indiv Non-bank Financial InstitutionsManufacturing Housing & Bridging LoansGeneral Commerce Business ServicesBuilding & Construction Agriculture
0
50
100
150
200
250
300
Pe
r C
en
t
Foreign Currency Non-Bank LTD RatioSGD Non-Bank LTD RatioOverall Non-Bank LTD Ratio
Q3
0
1
2
3
4
5
6
2004Q3
2006 2008 2009 2011 2013
Pe
r C
en
t
2014Q3
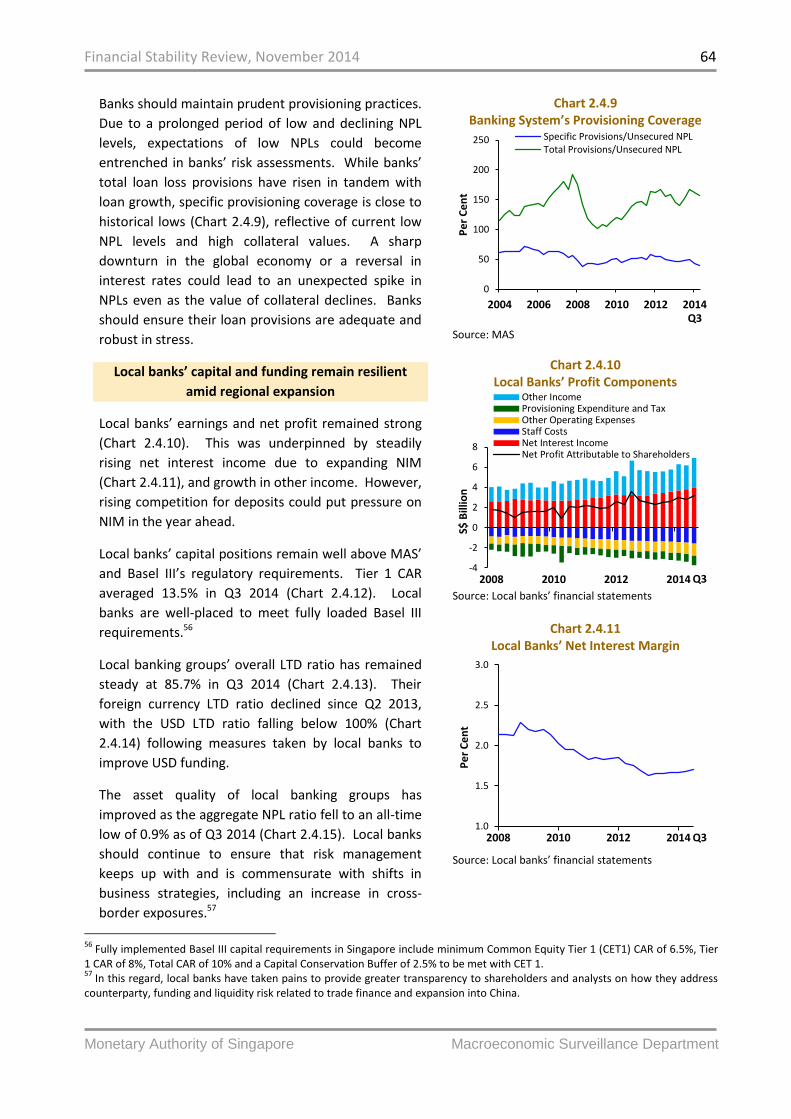
Financial Stability Review, November 2014 64
Monetary Authority of Singapore Macroeconomic Surveillance Department
56
Fully implemented Basel III capital requirements in Singapore include minimum Common Equity Tier 1 (CET1) CAR of 6.5%, Tier 1 CAR of 8%, Total CAR of 10% and a Capital Conservation Buffer of 2.5% to be met with CET 1. 57
In this regard, local banks have taken pains to provide greater transparency to shareholders and analysts on how they address counterparty, funding and liquidity risk related to trade finance and expansion into China.
Banks should maintain prudent provisioning practices.
Due to a prolonged period of low and declining NPL
levels, expectations of low NPLs could become
entrenched in banks’ risk assessments. While banks’
total loan loss provisions have risen in tandem with
loan growth, specific provisioning coverage is close to
historical lows (Chart 2.4.9), reflective of current low
NPL levels and high collateral values. A sharp
downturn in the global economy or a reversal in
interest rates could lead to an unexpected spike in
NPLs even as the value of collateral declines. Banks
should ensure their loan provisions are adequate and
robust in stress.
Local banks’ capital and funding remain resilient
amid regional expansion
Local banks’ earnings and net profit remained strong
(Chart 2.4.10). This was underpinned by steadily
rising net interest income due to expanding NIM
(Chart 2.4.11), and growth in other income. However,
rising competition for deposits could put pressure on
NIM in the year ahead.
Local banks’ capital positions remain well above MAS’
and Basel III’s regulatory requirements. Tier 1 CAR
averaged 13.5% in Q3 2014 (Chart 2.4.12). Local
banks are well-placed to meet fully loaded Basel III
requirements.56
Local banking groups’ overall LTD ratio has remained
steady at 85.7% in Q3 2014 (Chart 2.4.13). Their
foreign currency LTD ratio declined since Q2 2013,
with the USD LTD ratio falling below 100% (Chart
2.4.14) following measures taken by local banks to
improve USD funding.
The asset quality of local banking groups has
improved as the aggregate NPL ratio fell to an all-time
low of 0.9% as of Q3 2014 (Chart 2.4.15). Local banks
should continue to ensure that risk management
keeps up with and is commensurate with shifts in
business strategies, including an increase in cross-
border exposures.57
Chart 2.4.9 Banking System’s Provisioning Coverage
Source: MAS
Chart 2.4.10 Local Banks’ Profit Components
Source: Local banks’ financial statements
Chart 2.4.11
Local Banks’ Net Interest Margin
Source: Local banks’ financial statements
0
50
100
150
200
250
2004 2006 2008 2010 2012 2014
Pe
r C
en
t
Specific Provisions/Unsecured NPLTotal Provisions/Unsecured NPL
Q3
-4
-2
0
2
4
6
8
2008 2010 2012 2014
S$ B
illio
n
Other IncomeProvisioning Expenditure and TaxOther Operating ExpensesStaff CostsNet Interest IncomeNet Profit Attributable to Shareholders
Q3
1.0
1.5
2.0
2.5
3.0
2008 2010 2012 2014
Pe
r C
en
t
Q3
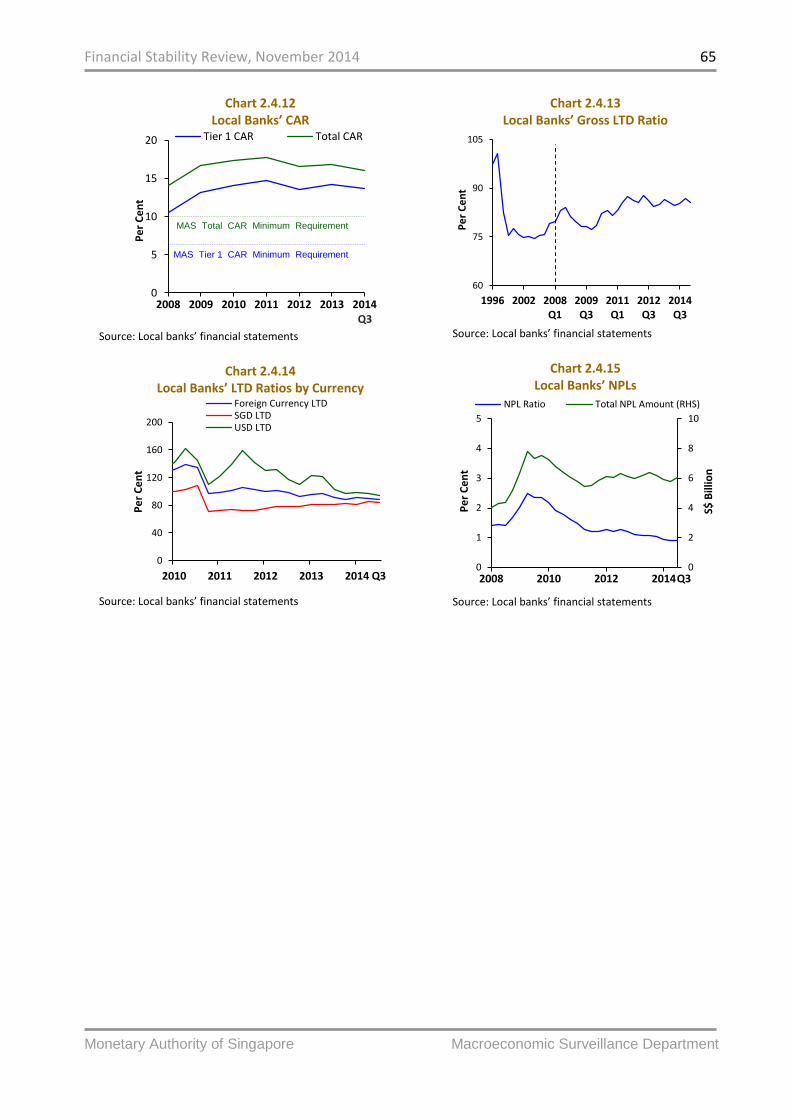
Financial Stability Review, November 2014 65
Monetary Authority of Singapore Macroeconomic Surveillance Department
Chart 2.4.12 Local Banks’ CAR
Source: Local banks’ financial statements
Chart 2.4.14 Local Banks’ LTD Ratios by Currency
Source: Local banks’ financial statements
Chart 2.4.13 Local Banks’ Gross LTD Ratio
Source: Local banks’ financial statements
Chart 2.4.15 Local Banks’ NPLs
Source: Local banks’ financial statements
0
5
10
15
20
2008 2009 2010 2011 2012 2013 2014
Pe
r C
en
tTier 1 CAR Total CAR
MAS Tier 1 CAR Minimum Requirement
MAS Total CAR Minimum Requirement
Q3
0
40
80
120
160
200
2010 2011 2012 2013 2014
Pe
r C
en
t
Foreign Currency LTDSGD LTDUSD LTD
Q3
60
75
90
105
1996 2002 2008Q1
2009Q3
2011Q1
2012Q3
2014Q3
Pe
r C
en
t
0
2
4
6
8
10
0
1
2
3
4
5
2008 2010 2012 2014
S$ B
illio
n
Pe
r C
en
t
NPL Ratio Total NPL Amount (RHS)
Q3

Financial Stability Review, November 2014 66
Monetary Authority of Singapore Macroeconomic Surveillance Department
Box I
Funding Needs and Cross-Border Exposures of Singapore’s Banking System: Financing the Domestic
Economy and Beyond
As global monetary conditions continue to evolve, there are growing concerns that global liquidity could
tighten, with consequent impact on the banking system. This box examines the funding needs and cross-
border exposures of Singapore’s banking system. We find that Singapore’s banking system is self-sufficient in
supporting domestic lending, as it is underpinned by strong domestic funding and is not reliant on external
liquidity. As the pattern of cross-border credit intermediation evolves, Singapore banks would do well to
carefully monitor their increasing exposures to emerging Asia.
Singapore’s banking system is self-sufficient in supporting domestic lending
Singapore’s banking system has sufficient domestic non-bank funding to support domestic lending and does
not rely on foreign liquidity (Chart I1). Underpinned by a healthy domestic funding position, the banking
system would likely be able to continue lending to non-bank borrowers and support the Singapore economy,
even if global financial conditions were to tighten suddenly.
Singapore is a net provider of funds to the rest of the world
Singapore’s banking system is a net provider of funds to the world. On average, about 90% of cross-border
exposures are funded by cross-border deposits (Chart I2).58 This gap arises because the banking system is able
to channel surplus domestic deposits into cross-border loans and investments.
Chart I1
Domestic Non-bank Loans and Deposits
Chart I2 Banking System’s Cross-border Exposures and
Deposits
Source: MAS Source: MAS
The banking system channels funds from advanced economies to emerging Asia
Since 2008, the banking system’s role has evolved from being a net lender to advanced economies to being a
conduit of funds to emerging Asia. This role has grown in recent years, with deposits from Europe, the
Americas and developed Asia increasingly being channelled to emerging Asia (Figure I1). This shift in the
pattern of cross-border credit intermediation could be attributed to stronger growth in emerging Asia relative
to advanced economies in recent years, and the ongoing search for yield in the current low interest rate
environment.
58
Cross-border exposures are defined as the sum of cross-border interbank loans, non-bank loans and investments.
0
100
200
300
400
500
600
700
800
2004 2006 2008 2010 2012 2014
S$ B
illio
n
Non-Bank LoansNon-Bank Deposits
Sep
-300
0
300
600
900
1,200
1,500
2004 2006 2008 2010 2012 2014
S$ B
illio
n
Exposures Deposits Net Funding
Sep

Financial Stability Review, November 2014 67
Monetary Authority of Singapore Macroeconomic Surveillance Department
Figure I1 Fund Flows to and from External Sources
June 2009 – May 2012
June 2012 – September 2014
Source: MAS Note: Amount shown at a blue (red) arrow refers to the average monthly gross inflow from (gross outflow to) the specific region, with the width of the arrow corresponding to the amount. Amount shown at a node refers to the average monthly net fund flows from or to the region, with the colour of the bubble indicating whether the region is a net borrower (red) from or a net depositor (blue) with banks in Singapore, and the size of the bubble corresponding to the amount.
Banks in Singapore need to monitor risks from increased financial linkages with emerging Asia
Singapore’s financial linkages with emerging Asia have multiplied, with the region accounting for more than
half of the banking system’s cross-border exposures. While emerging Asia has become more resilient to
external shocks following the Asian Financial Crisis and emerged relatively unscathed from the GFC, the region
is not without risks.
MAS’ most recent IWST included a stress scenario based on a disorderly market adjustment to policy
normalisation in the US. The results showed that credit losses from emerging Asia are slightly higher than
those from other regions in the event of a sharp increase in interest rates and an economic slowdown,
although banks’ cross-border exposures on the whole remain relatively healthy.
Growth in emerging Asia has slowed in recent quarters and could face further challenges amid more volatile
external conditions. Banks in Singapore need to carefully monitor the risks arising from their increased cross-
border exposures to the region. MAS will also remain vigilant in its cross-border surveillance as global
monetary conditions continue to evolve.
SG
Emerging AsiaS$23.8bn
EuropeS$34.1bn
AmericasS$19.7bn
Developed AsiaS$25.7bn
OthersS$19.2bn
$360.0bn
$336.2bn
$117.9bn
$143.6bn
$271.5bn $237.4bn
$58.8bn
$39.6bn
$90.0bn
$109.6bn
SG
Emerging AsiaS$204.2bn
EuropeS$83.9bn
AmericasS$51.4bn
Developed AsiaS$82.4bn
OthersS$32.4bn
$526.9bn
$322.7bn
$121.0bn
$203.3bn
$287.5bn $203.6bn
$81.9bn
$57.6bn
$91.2bn
$142.6n

Financial Stability Review, November 2014 68
Monetary Authority of Singapore Macroeconomic Surveillance Department
Box J
Funding Liquidity in Singapore’s Banking System: Making Sense from Different Perspectives
This box describes the potential liquidity risks to Singapore’s banking system and factors which could
mitigate such risks. Driven by foreign currency loans, Singapore’s overall LTD ratio, a measure of liquidity
in the banking system, has exceeded 100% since 2013. This reflects Singapore’s role as an international
financial centre in intermediating fund flows to the region. The potential liquidity risks from such
activities are partly mitigated by the banks’ access to intragroup funding and the short-term nature of a
significant portion of their loans. MAS’ stress tests also indicate that banks’ liquidity positions are likely
to remain resilient even under conditions of severe stress.
Overall LTD ratio is driven by foreign currency loans
Since 2013, Singapore’s overall LTD ratio has remained above 100%, which indicates that total non-bank
loans exceed total non-bank deposits. This trend has been driven by the foreign currency LTD ratio,
which was 140% as at September 2014. In contrast, the SGD LTD ratio has remained below 100%,
indicating that SGD deposits are more than sufficient to meet the borrowing needs of Singapore
corporates and households in the local currency.
The higher foreign currency LTD ratio is a consequence of Singapore’s role as an international financial
centre. Singapore’s banking system extends credit to the region to support trade and growth, mostly in
the form of foreign currency-denominated non-bank loans. Additionally, foreign banks use Singapore as
a funding hub, funding these loans to the region through intragroup deposits from their head office or
other related banks outside Singapore. Such loans therefore contribute to the higher foreign currency
LTD ratio as intragroup deposits are not included in LTD calculations.
Liquidity stresses could be mitigated by net intragroup funding and short-term trade finance
Intragroup funding could partly mitigate potential liquidity squeezes during periods of heightened risk.
During the GFC, while net unrelated interbank funding fell by nearly S$100 billion from peak to trough,
net intragroup funding increased by similar amounts (Chart J1), implying that banks substituted
intragroup funding for unrelated interbank funding when the latter became unavailable. Indeed, net
intragroup funding has increasingly played a more significant role in the banking system’s funding
structure (Chart J2), accounting for 10.1% of total funding as at September 2014.
However, intragroup funding can pose additional liquidity risks to the banking system under certain
circumstances. While intragroup funding reduces counterparty risk, an event that leaves a bank unable
to access head office funding could stress its liquidity position.59 To mitigate the risk of such an event,
MAS assesses whether the head offices of foreign banks are able and willing to support their branches in
Singapore. This includes regular reviews of the liquidity profiles of foreign banks’ head offices and
ongoing interactions with their home regulators.
59
Related parties are less likely to unexpectedly withdraw funding compared to unrelated counterparties.
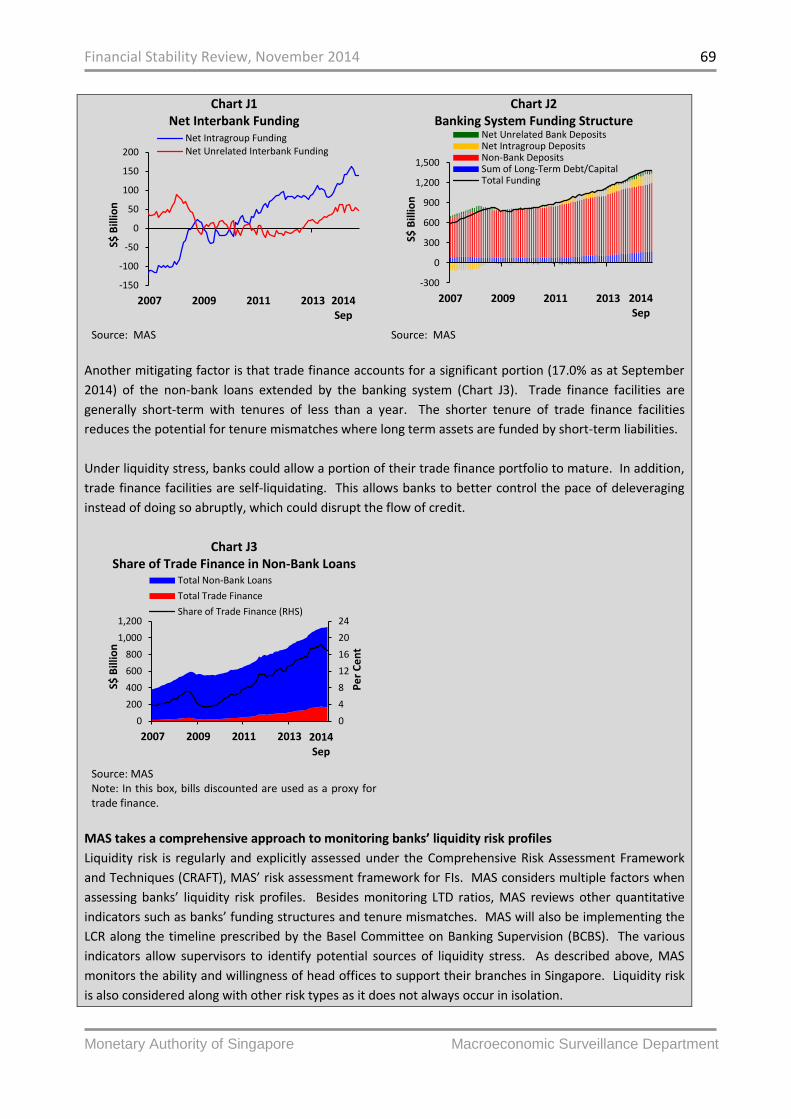
Financial Stability Review, November 2014 69
Monetary Authority of Singapore Macroeconomic Surveillance Department
Chart J1 Net Interbank Funding
Chart J2 Banking System Funding Structure
Source: MAS Source: MAS
Another mitigating factor is that trade finance accounts for a significant portion (17.0% as at September
2014) of the non-bank loans extended by the banking system (Chart J3). Trade finance facilities are
generally short-term with tenures of less than a year. The shorter tenure of trade finance facilities
reduces the potential for tenure mismatches where long term assets are funded by short-term liabilities.
Under liquidity stress, banks could allow a portion of their trade finance portfolio to mature. In addition,
trade finance facilities are self-liquidating. This allows banks to better control the pace of deleveraging
instead of doing so abruptly, which could disrupt the flow of credit.
Chart J3 Share of Trade Finance in Non-Bank Loans
Source: MAS Note: In this box, bills discounted are used as a proxy for trade finance.
MAS takes a comprehensive approach to monitoring banks’ liquidity risk profiles
Liquidity risk is regularly and explicitly assessed under the Comprehensive Risk Assessment Framework
and Techniques (CRAFT), MAS’ risk assessment framework for FIs. MAS considers multiple factors when
assessing banks’ liquidity risk profiles. Besides monitoring LTD ratios, MAS reviews other quantitative
indicators such as banks’ funding structures and tenure mismatches. MAS will also be implementing the
LCR along the timeline prescribed by the Basel Committee on Banking Supervision (BCBS). The various
indicators allow supervisors to identify potential sources of liquidity stress. As described above, MAS
monitors the ability and willingness of head offices to support their branches in Singapore. Liquidity risk
is also considered along with other risk types as it does not always occur in isolation.
-150
-100
-50
0
50
100
150
200
2007 2009 2011 2013
S$ B
illio
n
Net Intragroup FundingNet Unrelated Interbank Funding
2014 Sep
-300
0
300
600
900
1,200
1,500
2007 2009 2011 2013
S$ B
illio
n
Net Unrelated Bank DepositsNet Intragroup DepositsNon-Bank DepositsSum of Long-Term Debt/CapitalTotal Funding
2014 Sep
0
4
8
12
16
20
24
0
200
400
600
800
1,000
1,200
2007 2009 2011 2013
Pe
r C
en
t
S$ B
illio
n
Total Non-Bank Loans
Total Trade Finance
Share of Trade Finance (RHS)
2014 Sep

Financial Stability Review, November 2014 70
Monetary Authority of Singapore Macroeconomic Surveillance Department
In addition, MAS regularly stress tests banks’ liquidity positions as part of its annual IWST. The most
recent stress test results indicate that banks’ liquidity positions are likely to remain resilient even under
conditions of severe stress. Nevertheless, banks that had assumed the availability of
interbank/intragroup funding or swap market liquidity under stressed scenarios, faced vulnerabilities if
these sources were not available. Following the IWST, these banks are now able to refine their liquidity
contingency plans to better manage stress situations where these funding sources become unavailable.
MAS will continue to be vigilant in monitoring liquidity in the banking system, refining both quantitative
and qualitative indicators as necessary to identify and mitigate liquidity risks.

Financial Stability Review, November 2014 71
Monetary Authority of Singapore Macroeconomic Surveillance Department
2.5 Non-Bank Financial Sector
2.5.1 Insurance Sector
60
In this section, y-o-y % growth is defined as the growth rate of the cumulative quarters for the year. For example, y-o-y % growth as at Q3 2014 should be interpreted as the increase in new business premiums from the first three quarters of 2013 to the first three quarters of 2014.
The insurance industry remains well-capitalised,
with strong investment income and
underwriting profits
The insurance industry in Singapore remains well-
capitalised. As at Q3 2014, more than 80% of insurers
have CAR of above 200%, well above the regulatory
minimum of 120%. The average CAR for the direct life
and direct general insurance industry are 248% and
278% respectively (Chart 2.5.1.1).
New business premiums of the direct life insurance
industry amounted to $2.46 billion in the first three
quarters of 2014, a 3.6% decrease as compared to the
corresponding period last year. The reduction in
premiums was largely attributable to a drop in non-
participating whole life and endowment products sold.
New premiums for participating and non-participating
business dropped 2.4% y-o-y and 10.2% y-o-y
respectively.60 In contrast, there was a healthy growth
of 9.1% y-o-y in new business premiums related to
investment-linked policies (Chart 2.5.1.2).
Despite a slight fall in new business premiums, direct
life insurers’ net income improved significantly to $1.4
billion for the first three quarters of 2014, mainly
attributable to the investment profits reported (Chart
2.5.1.3). As a result of an overall rise in equity prices
and slight drops in longer-term bond yields, unrealised
profits as well as dividend/interest income from debt
and equity securities contributed to the growth of
investment profits. Volatility in net income observed
over the quarters largely mirrors the volatility in
investment income as assets are valued on a mark-to-
market basis.
Chart 2.5.1.1
Capital Adequacy Ratio of Direct Life and Direct General Insurers
Source: MAS
Chart 2.5.1.2 Direct Life Insurers: New Business Premiums
Source: MAS Note: Refer to footnote 60.
0
80
160
240
320
400
0
20
40
60
80
100
2009 2010 2011 2012 20132014 Q3
Pe
r C
en
t
Pe
r C
en
t
≥ 200%150 ≤ CAR < 200%120 ≤ CAR < 150%100 ≤ CAR < 120%CAR - Direct Life Insurers (RHS)CAR - Direct General Insurers (RHS)
-120
-60
0
60
120
180
-0.6
-0.3
0.0
0.3
0.6
0.9
2009 2010 2011 2012 2013 2014
Non-ParticipatingParticipatingInvestment-linkedYoY Growth - Link (RHS)YoY Growth - Par (RHS)YoY Growth - Non-Par (RHS)
S$ B
illio
n
Pe
r C
en
t
Q3
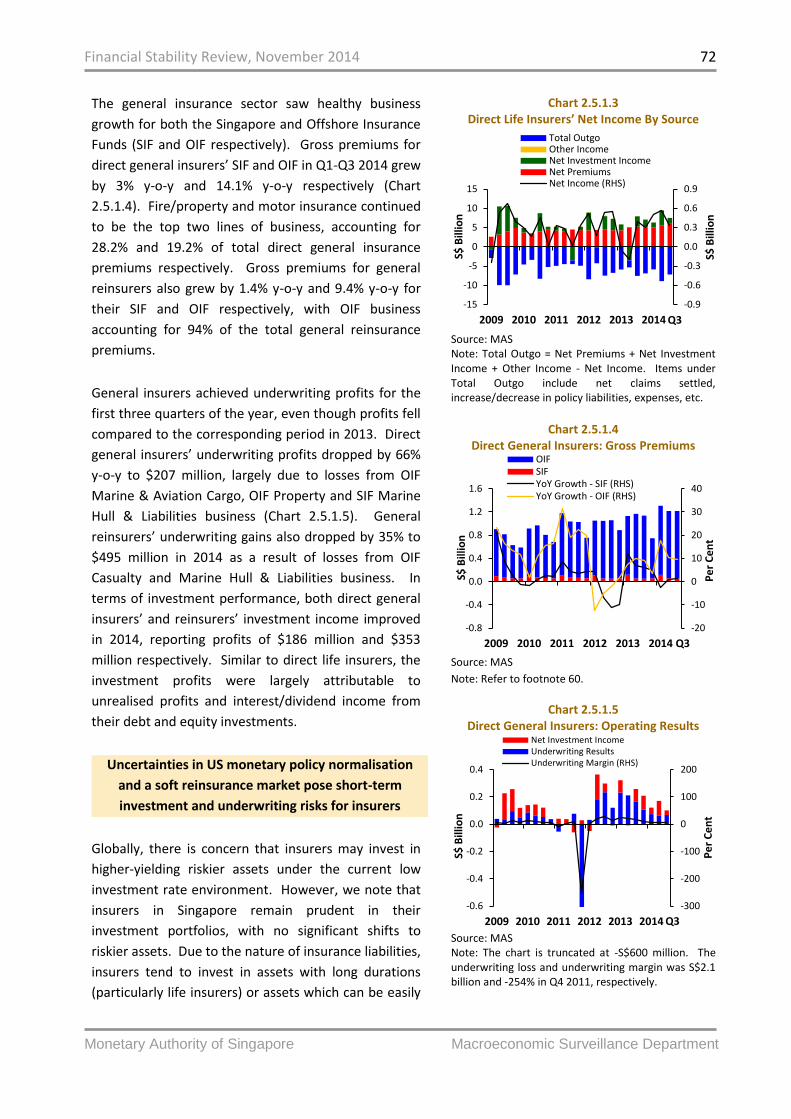
Financial Stability Review, November 2014 72
Monetary Authority of Singapore Macroeconomic Surveillance Department
The general insurance sector saw healthy business
growth for both the Singapore and Offshore Insurance
Funds (SIF and OIF respectively). Gross premiums for
direct general insurers’ SIF and OIF in Q1-Q3 2014 grew
by 3% y-o-y and 14.1% y-o-y respectively (Chart
2.5.1.4). Fire/property and motor insurance continued
to be the top two lines of business, accounting for
28.2% and 19.2% of total direct general insurance
premiums respectively. Gross premiums for general
reinsurers also grew by 1.4% y-o-y and 9.4% y-o-y for
their SIF and OIF respectively, with OIF business
accounting for 94% of the total general reinsurance
premiums.
General insurers achieved underwriting profits for the
first three quarters of the year, even though profits fell
compared to the corresponding period in 2013. Direct
general insurers’ underwriting profits dropped by 66%
y-o-y to $207 million, largely due to losses from OIF
Marine & Aviation Cargo, OIF Property and SIF Marine
Hull & Liabilities business (Chart 2.5.1.5). General
reinsurers’ underwriting gains also dropped by 35% to
$495 million in 2014 as a result of losses from OIF
Casualty and Marine Hull & Liabilities business. In
terms of investment performance, both direct general
insurers’ and reinsurers’ investment income improved
in 2014, reporting profits of $186 million and $353
million respectively. Similar to direct life insurers, the
investment profits were largely attributable to
unrealised profits and interest/dividend income from
their debt and equity investments.
Uncertainties in US monetary policy normalisation
and a soft reinsurance market pose short-term
investment and underwriting risks for insurers
Globally, there is concern that insurers may invest in
higher-yielding riskier assets under the current low
investment rate environment. However, we note that
insurers in Singapore remain prudent in their
investment portfolios, with no significant shifts to
riskier assets. Due to the nature of insurance liabilities,
insurers tend to invest in assets with long durations
(particularly life insurers) or assets which can be easily
Chart 2.5.1.3 Direct Life Insurers’ Net Income By Source
Source: MAS Note: Total Outgo = Net Premiums + Net Investment Income + Other Income - Net Income. Items under Total Outgo include net claims settled, increase/decrease in policy liabilities, expenses, etc.
Chart 2.5.1.4
Direct General Insurers: Gross Premiums
Source: MAS
Note: Refer to footnote 60.
Chart 2.5.1.5 Direct General Insurers: Operating Results
Source: MAS Note: The chart is truncated at -S$600 million. The underwriting loss and underwriting margin was S$2.1 billion and -254% in Q4 2011, respectively.
-0.9
-0.6
-0.3
0.0
0.3
0.6
0.9
-15
-10
-5
0
5
10
15
2009 2010 2011 2012 2013 2014
Total OutgoOther IncomeNet Investment IncomeNet PremiumsNet Income (RHS)
S$ B
illio
n
S$ B
illio
n
Q3
-20
-10
0
10
20
30
40
-0.8
-0.4
0.0
0.4
0.8
1.2
1.6
2009 2010 2011 2012 2013 2014
OIFSIFYoY Growth - SIF (RHS)YoY Growth - OIF (RHS)
S$ B
illio
n
Pe
r C
en
t
Q3
-300
-200
-100
0
100
200
-0.6
-0.4
-0.2
0.0
0.2
0.4
2009 2010 2011 2012 2013 2014
Net Investment IncomeUnderwriting ResultsUnderwriting Margin (RHS)
S$ B
illio
n
Pe
r C
en
t
Q3

Financial Stability Review, November 2014 73
Monetary Authority of Singapore Macroeconomic Surveillance Department
liquidated (particularly general insurers). Insurers hold
most of their assets in corporate debt, government
securities and equities, in addition to cash and
deposits. Around 80% of the debt holdings are in
investment-grade securities, followed by unrated debt
securities, which are mostly issued by Singapore
Statutory Boards (Chart 2.5.1.6). More than 80% of
insurers’ sovereign debt holdings are in SGS and US
Treasury bills/bonds (Chart 2.5.1.7). Insurers’ equity
holdings are also not overly concentrated in any
particular industry, and are largely Singapore-issued
stocks.
Uncertainties surrounding US monetary policy
normalisation could pose some short-term risks to
insurers’ investment performance and balance sheets,
especially for life insurers. Life insurers tend to hold
longer-duration fixed-income securities to match their
longer-term liabilities. A rapidly rising interest rate will
result in reduction in the mark-to-market value of
insurers’ fixed-income investments. There could also
be an increase in policy surrenders from policyholders
searching for higher yield from the capital markets.
However, a persistent higher interest rate will improve
insurers’ balance sheets over the longer term, as
insurers can benefit from higher coupon income from
new fixed income assets. In addition, insurers’
liabilities will be discounted at a higher interest rate,
which will reduce their liabilities and improve their
balance sheets.
Looking ahead, a softening market may continue to
pose a challenge to the reinsurance industry globally.
The increasing availability of alternative capital from
sources such as pension and private equity funds, and
the recent absence of large losses have built up
underwriting capacity in the reinsurance market. In
addition, sluggish demand from reinsurance buyers is
being observed as cedants are increasingly retaining
more risks and purchasing reinsurance on a more
global operational and centralised approach.
Reinsurers should continue to be prudent in managing
their underwriting risks in the face of soft market
conditions.
Chart 2.5.1.6 Credit Rating Profile of Debt Securities
of All Insurers
Source: MAS
Chart 2.5.1.7 Country Exposure of Government Debt
Securities of All Insurers
Source: MAS
0
20
40
60
80
100
Direct &Composite
Life Industry
DirectGeneralIndustry
ReinsuranceIndustry
Pe
r C
en
t
AAA AA A BBB BB B CCC & below Unrated
0
20
40
60
80
100
Direct &Composite
Life Industry
DirectGeneralIndustry
ReinsuranceIndustry
Pe
r C
en
t
Singapore USAAsia Pacific EuropeMiddle East, Africa & Others Other Americas
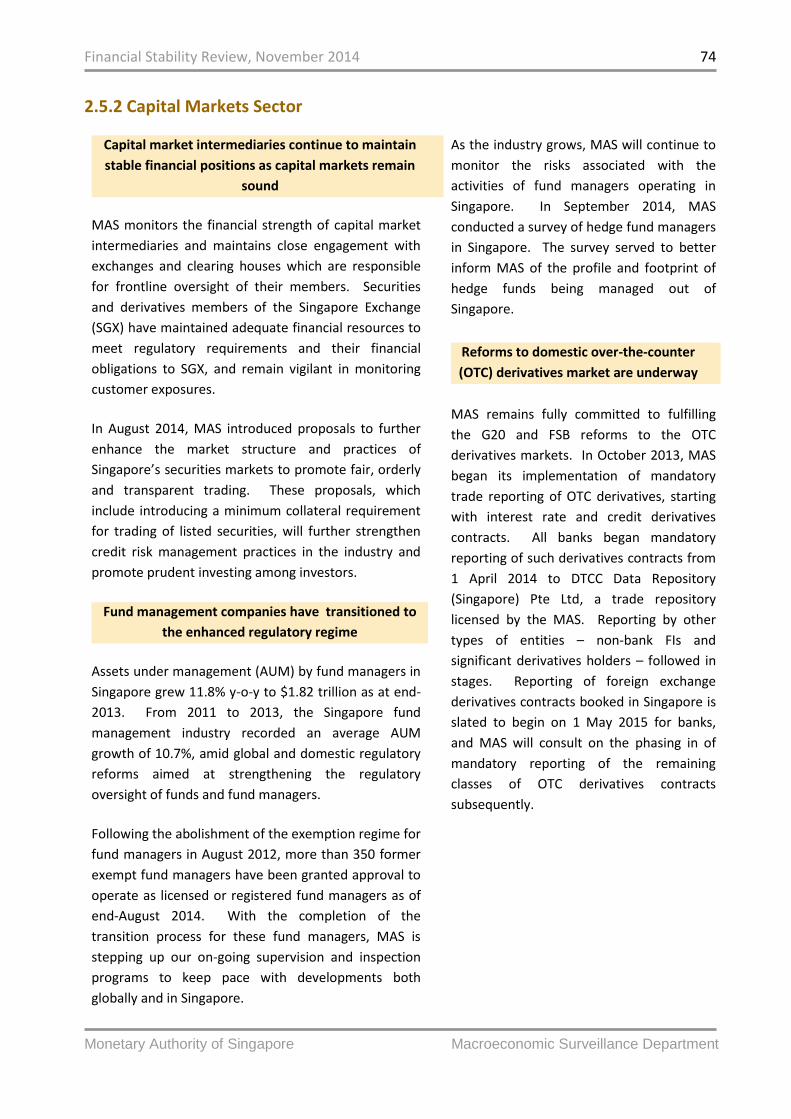
Financial Stability Review, November 2014 74
Monetary Authority of Singapore Macroeconomic Surveillance Department
2.5.2 Capital Markets Sector
Capital market intermediaries continue to maintain
stable financial positions as capital markets remain
sound
MAS monitors the financial strength of capital market
intermediaries and maintains close engagement with
exchanges and clearing houses which are responsible
for frontline oversight of their members. Securities
and derivatives members of the Singapore Exchange
(SGX) have maintained adequate financial resources to
meet regulatory requirements and their financial
obligations to SGX, and remain vigilant in monitoring
customer exposures.
In August 2014, MAS introduced proposals to further
enhance the market structure and practices of
Singapore’s securities markets to promote fair, orderly
and transparent trading. These proposals, which
include introducing a minimum collateral requirement
for trading of listed securities, will further strengthen
credit risk management practices in the industry and
promote prudent investing among investors.
Fund management companies have transitioned to
the enhanced regulatory regime
Assets under management (AUM) by fund managers in
Singapore grew 11.8% y-o-y to $1.82 trillion as at end-
2013. From 2011 to 2013, the Singapore fund
management industry recorded an average AUM
growth of 10.7%, amid global and domestic regulatory
reforms aimed at strengthening the regulatory
oversight of funds and fund managers.
Following the abolishment of the exemption regime for
fund managers in August 2012, more than 350 former
exempt fund managers have been granted approval to
operate as licensed or registered fund managers as of
end-August 2014. With the completion of the
transition process for these fund managers, MAS is
stepping up our on-going supervision and inspection
programs to keep pace with developments both
globally and in Singapore.
As the industry grows, MAS will continue to
monitor the risks associated with the
activities of fund managers operating in
Singapore. In September 2014, MAS
conducted a survey of hedge fund managers
in Singapore. The survey served to better
inform MAS of the profile and footprint of
hedge funds being managed out of
Singapore.
Reforms to domestic over-the-counter
(OTC) derivatives market are underway
MAS remains fully committed to fulfilling
the G20 and FSB reforms to the OTC
derivatives markets. In October 2013, MAS
began its implementation of mandatory
trade reporting of OTC derivatives, starting
with interest rate and credit derivatives
contracts. All banks began mandatory
reporting of such derivatives contracts from
1 April 2014 to DTCC Data Repository
(Singapore) Pte Ltd, a trade repository
licensed by the MAS. Reporting by other
types of entities – non-bank FIs and
significant derivatives holders – followed in
stages. Reporting of foreign exchange
derivatives contracts booked in Singapore is
slated to begin on 1 May 2015 for banks,
and MAS will consult on the phasing in of
mandatory reporting of the remaining
classes of OTC derivatives contracts
subsequently.

Financial Stability Review, November 2014 75
Monetary Authority of Singapore Macroeconomic Surveillance Department
On mandatory central clearing, MAS will be consulting
on the detailed regulations for implementation in the
coming months. With the growing use and
concentration of risks in central counterparties (CCPs),
concerns that CCPs may have become the new “too-
big-to-fail” have arisen. To address these concerns and
ensure the continued rigor of risk management
standards on CCPs, the Committee on Payments and
Market Infrastructures (CPMI, formerly the Committee
on Payments and Settlement Systems (CPSS)) and the
International Organisation of Securities Commissions
(IOSCO) in April 2012 established international risk
management standards for systemically important
financial market infrastructures, including CCPs.
MAS adopted the CPSS-IOSCO Principles for Financial
Market Infrastructures (PFMI) as part of its supervisory
objectives and approach in January 2013, and has
applied it to the domestic systemically-important CCPs
regulated by MAS. Both domestic systemically-
important CCPs, The Central Depository (Pte) Limited
(CDP) and Singapore Exchange Derivatives Clearing
Limited (SGX-DC), were assessed against the PFMI as
part of the IMF’s Financial Sector Assessment
Programme (FSAP) in November 2013. Both CCPs were
assessed to have high compliance with international
standards, and were rated “Observed” for all but one
principle (which was rated as “Broadly Observed”).
MAS is in the process of studying margin requirements
for non-centrally cleared OTC derivatives, taking
guidance from the BCBS and IOSCO framework
published in September 2013. The requirements aim
to reduce counterparty credit risk and limit contagion
risk for such contracts. Alongside the work on margin
requirements, IOSCO formed a Working Group on Risk
Mitigation Requirements (WGRMS), chaired by MAS,
to develop standards on risk mitigation techniques,
including documentation, confirmation, portfolio
reconciliation and compression, valuation and dispute
resolution. The WGRMS has published a consultation
report on the proposed standards. MAS intends to
adopt requirements in line with the final
recommendations issued by the WGRMS.
MAS continues to review other aspects of
our OTC derivatives regulatory regime,
including the regulation of intermediaries
dealing in OTC derivatives and of OTC
derivatives market operators, and is
committed to implement a sound and
effective regulatory framework that is well-
placed to facilitate and achieve the
objectives of the G20 and FSB OTC
derivatives reforms.
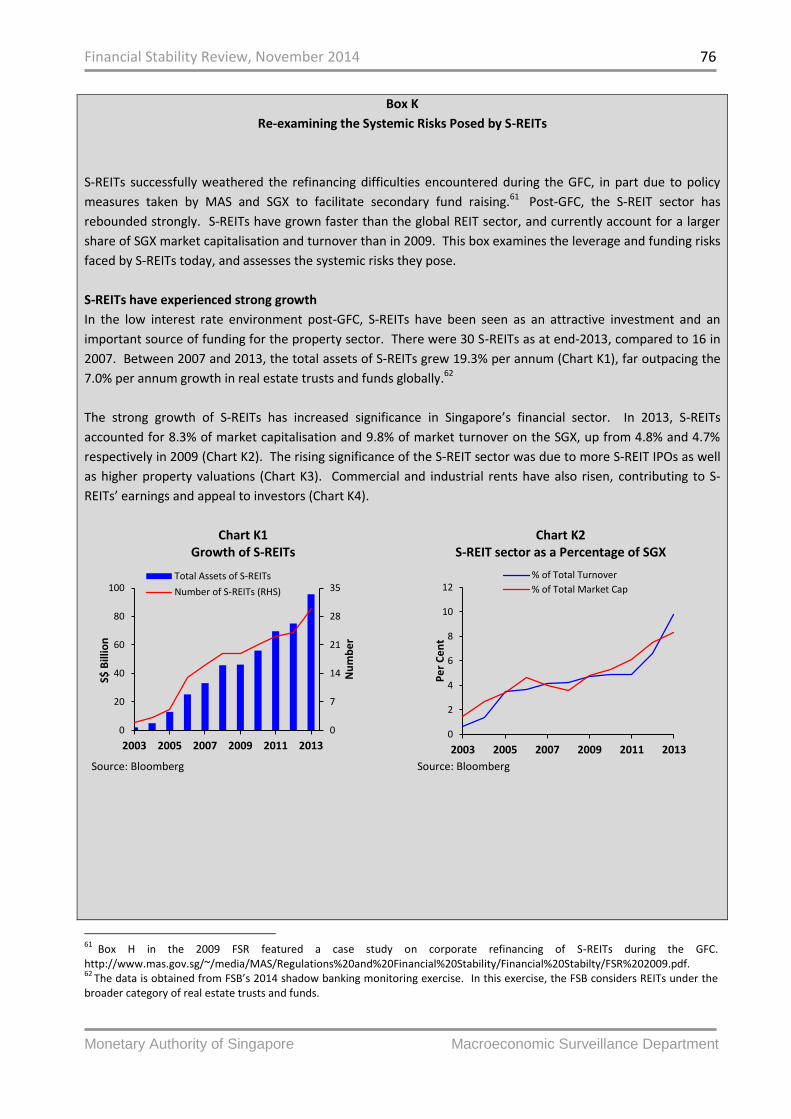
Financial Stability Review, November 2014 76
Monetary Authority of Singapore Macroeconomic Surveillance Department
Box K
Re-examining the Systemic Risks Posed by S-REITs
S-REITs successfully weathered the refinancing difficulties encountered during the GFC, in part due to policy
measures taken by MAS and SGX to facilitate secondary fund raising.61 Post-GFC, the S-REIT sector has
rebounded strongly. S-REITs have grown faster than the global REIT sector, and currently account for a larger
share of SGX market capitalisation and turnover than in 2009. This box examines the leverage and funding risks
faced by S-REITs today, and assesses the systemic risks they pose.
S-REITs have experienced strong growth
In the low interest rate environment post-GFC, S-REITs have been seen as an attractive investment and an
important source of funding for the property sector. There were 30 S-REITs as at end-2013, compared to 16 in
2007. Between 2007 and 2013, the total assets of S-REITs grew 19.3% per annum (Chart K1), far outpacing the
7.0% per annum growth in real estate trusts and funds globally.62
The strong growth of S-REITs has increased significance in Singapore’s financial sector. In 2013, S-REITs
accounted for 8.3% of market capitalisation and 9.8% of market turnover on the SGX, up from 4.8% and 4.7%
respectively in 2009 (Chart K2). The rising significance of the S-REIT sector was due to more S-REIT IPOs as well
as higher property valuations (Chart K3). Commercial and industrial rents have also risen, contributing to S-
REITs’ earnings and appeal to investors (Chart K4).
Chart K1 Growth of S-REITs
Source: Bloomberg
Chart K2 S-REIT sector as a Percentage of SGX
Source: Bloomberg
61
Box H in the 2009 FSR featured a case study on corporate refinancing of S-REITs during the GFC. http://www.mas.gov.sg/~/media/MAS/Regulations%20and%20Financial%20Stability/Financial%20Stabilty/FSR%202009.pdf. 62
The data is obtained from FSB’s 2014 shadow banking monitoring exercise. In this exercise, the FSB considers REITs under the broader category of real estate trusts and funds.
0
7
14
21
28
35
0
20
40
60
80
100
2003 2005 2007 2009 2011 2013
Nu
mb
er
S$ B
illio
n
Total Assets of S-REITs
Number of S-REITs (RHS)
0
2
4
6
8
10
12
2003 2005 2007 2009 2011 2013
Pe
r C
en
t
% of Total Turnover
% of Total Market Cap

Financial Stability Review, November 2014 77
Monetary Authority of Singapore Macroeconomic Surveillance Department
Chart K3 Property Price Index
Source: URA, JTC
Chart K4 Rental Index
Source: URA, JTC, IRAS
S-REITs today are more resilient to funding shocks
S-REITs experienced refinancing pressure during the GFC when approximately one-third of their debt matured
within the same year in 2009 (See Box H in FSR 2009). S-REITs have since taken steps to improve their resilience
to funding shocks, through better management of overall leverage and debt maturity.
Most S-REITs are well under the leverage limit set out in the Singapore Code of Collective Investment Schemes
(CIS Code).63 In 2013, rated S-REITs had a median leverage ratio of 35% while unrated S-REITs had a median
leverage ratio of 29%. The weighted-average debt maturity of the S-REIT sector has increased to 3.2 years,
from 2.1 years at the end of 2008. The overall debt maturity profile has improved, with maturities spread out
over a longer period (Chart K5).64
To hedge against the risk of rising interest rates, S-REITs have used derivatives to convert their floating-rate
borrowings to fixed rates. While the median interest coverage ratio for the S-REIT sector declined to 2.7 times
in Q4 2008, stress test results indicate that S-REITs are currently well placed to weather interest rate hikes.
Under a stress scenario of a 3 percentage point increase in interest rates and 10% fall in EBITDA, the sector’s
median interest coverage ratio would still be relatively healthy at 3.6 times (Chart K6).65
63
The CIS Code currently restricts S-REITs to a maximum leverage ratio (total borrowings and deferred payments over fund’s deposited property) of 35% if the S-REIT does not have a credit rating and 60% if the S-REIT is rated. 64
This graph is obtained from a Moody’s report and only applies to 14 S-REITs. 65
During the period when S-REITs faced refinancing difficulties in H2 2008, the rental index for office space declined by 7%, industrial space declined by 4% and shop space by 1%.
50
100
150
200
250
2005 2007 2009 2011 2013
Ind
ex
(19
98
Q4
=10
0)
Industrial SpaceOffice SpaceShop Space
2014 Q3
50
100
150
200
250
2005 2007 2009 2011 2013
Ind
ex
(19
98
Q4
=10
0)
Industrial SpaceOffice SpaceShop Space
2014 Q3

Financial Stability Review, November 2014 78
Monetary Authority of Singapore Macroeconomic Surveillance Department
Chart K5 Debt Maturity Profile of Moody’s Rated S-REITs
Source: Moody’s *“cal yr” refers to “calendar year”
Chart K6 Median Interest Coverage of S-REITs
Source: Annual Reports, MAS Analysis
S-REITs are not shadow banking entities, but may pose systemic risks to the financial system
The CIS Code requires S-REITs to invest primarily in physical real estate.66 S-REITs therefore do not fall within
the FSB’s definition of shadow banking as they do not perform credit intermediation.
Nonetheless, S-REITs can be a source of systemic risk. This is because they invest in properties, which generally
have longer holding periods and are significantly less liquid than S-REITs’ sources of funding.
To assess the systemic risks posed by S-REITs, it is important to understand the potential transmission channels
(Figure K1). A stress on the S-REIT sector could directly impact the banking system if S-REITs default on their
borrowings (Figure K1, Arrow A). A shock that impacts S-REITs’ ability to pay dividends or put downward
pressure on property prices may cause their market capitalisation to fall. Falling unit prices or dividends may
affect the financial standing of S-REIT investors, and in turn their ability to meet other financial obligations such
as loan repayments. A key group of investors would be S-REIT sponsors as they typically retain significant
stakes in their REITs (Figure K1, Arrows B).
Stresses which force S-REITs to liquidate their assets may put downward pressure on property prices. S-REITs
may need to do so to raise cash if rental incomes weaken due to an economic downturn. Falling property prices
could have downstream implications for firms in the building and construction sector, which could face revenue
and cash flow difficulties if the value of their projects decline. A depressed property market could also lead to a
negative feedback loop if S-REITs have loan covenants tied to property values, e.g. where a decline in the value
of an S-REIT’s property holdings would lead to lending banks requesting for collateral top-ups (Figure K1,
Arrows C).
66
This is unlike REITs in some other markets which can invest in non-physical assets including property loans.
0
10
20
30
40
50
≤1 cal yr* 1-2 cal yrs2-3 cal yrs3-4 cal yrs ≥5 cal yrs
Pe
r C
en
t
2009 2010 2011
2012 2013 2014 Jun
0
1
2
3
4
5
6
0% 1% 2% 3%
Me
dia
n In
tere
st R
ate
C
ove
rage
Rat
io
Interest Rate Increase
Without Hedging With Hedging
EBITDA -10% (Hedged)
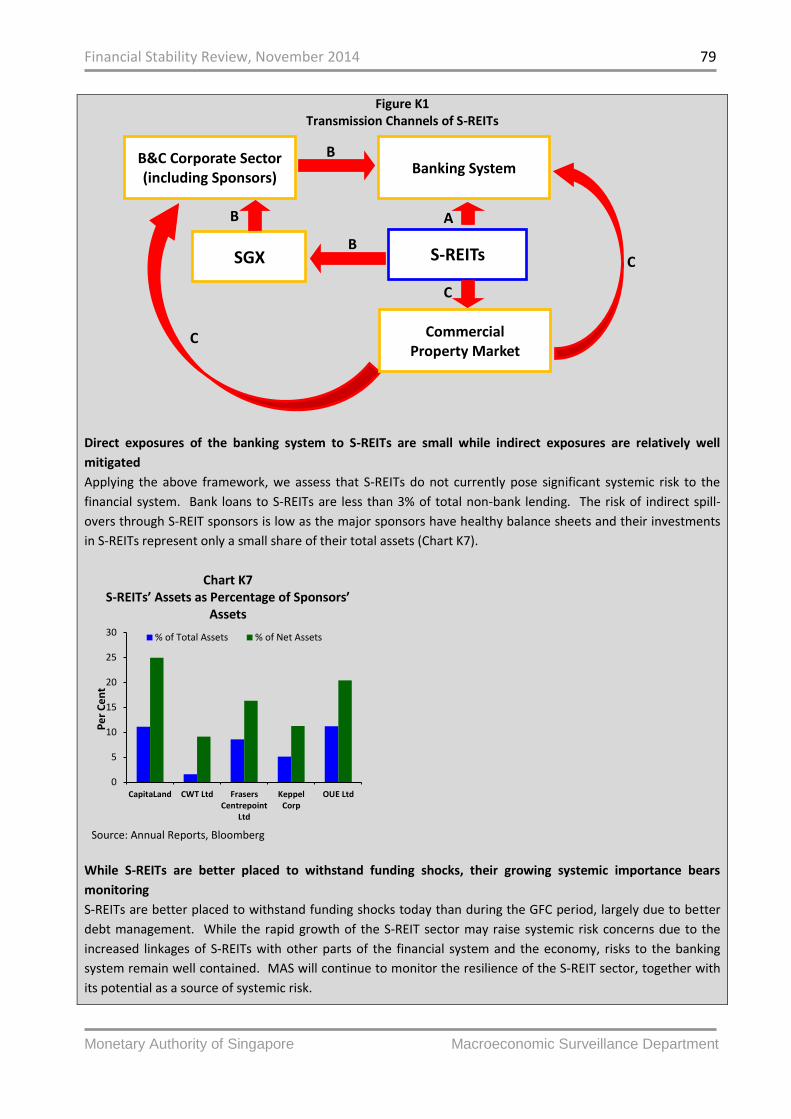
Financial Stability Review, November 2014 79
Monetary Authority of Singapore Macroeconomic Surveillance Department
Figure K1 Transmission Channels of S-REITs
Direct exposures of the banking system to S-REITs are small while indirect exposures are relatively well
mitigated
Applying the above framework, we assess that S-REITs do not currently pose significant systemic risk to the
financial system. Bank loans to S-REITs are less than 3% of total non-bank lending. The risk of indirect spill-
overs through S-REIT sponsors is low as the major sponsors have healthy balance sheets and their investments
in S-REITs represent only a small share of their total assets (Chart K7).
Chart K7 S-REITs’ Assets as Percentage of Sponsors’
Assets
Source: Annual Reports, Bloomberg
While S-REITs are better placed to withstand funding shocks, their growing systemic importance bears
monitoring
S-REITs are better placed to withstand funding shocks today than during the GFC period, largely due to better
debt management. While the rapid growth of the S-REIT sector may raise systemic risk concerns due to the
increased linkages of S-REITs with other parts of the financial system and the economy, risks to the banking
system remain well contained. MAS will continue to monitor the resilience of the S-REIT sector, together with
its potential as a source of systemic risk.
0
5
10
15
20
25
30
CapitaLand CWT Ltd FrasersCentrepoint
Ltd
KeppelCorp
OUE Ltd
Pe
r C
en
t
% of Total Assets % of Net Assets
S-REITs SGX
A
B
C
B
C
C
B Banking System
Commercial Property Market
B&C Corporate Sector (including Sponsors)
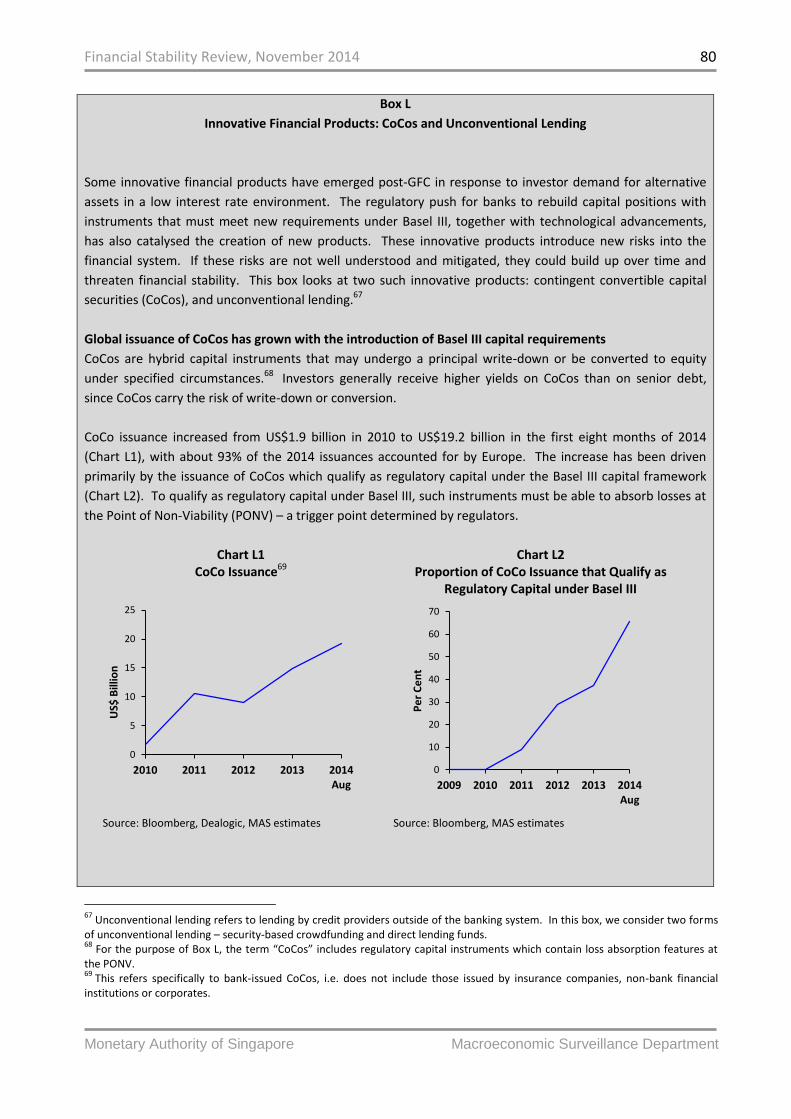
Financial Stability Review, November 2014 80
Monetary Authority of Singapore Macroeconomic Surveillance Department
Box L
Innovative Financial Products: CoCos and Unconventional Lending
Some innovative financial products have emerged post-GFC in response to investor demand for alternative
assets in a low interest rate environment. The regulatory push for banks to rebuild capital positions with
instruments that must meet new requirements under Basel III, together with technological advancements,
has also catalysed the creation of new products. These innovative products introduce new risks into the
financial system. If these risks are not well understood and mitigated, they could build up over time and
threaten financial stability. This box looks at two such innovative products: contingent convertible capital
securities (CoCos), and unconventional lending.67
Global issuance of CoCos has grown with the introduction of Basel III capital requirements
CoCos are hybrid capital instruments that may undergo a principal write-down or be converted to equity
under specified circumstances.68 Investors generally receive higher yields on CoCos than on senior debt,
since CoCos carry the risk of write-down or conversion.
CoCo issuance increased from US$1.9 billion in 2010 to US$19.2 billion in the first eight months of 2014
(Chart L1), with about 93% of the 2014 issuances accounted for by Europe. The increase has been driven
primarily by the issuance of CoCos which qualify as regulatory capital under the Basel III capital framework
(Chart L2). To qualify as regulatory capital under Basel III, such instruments must be able to absorb losses at
the Point of Non-Viability (PONV) – a trigger point determined by regulators.
Chart L1 CoCo Issuance69
Chart L2 Proportion of CoCo Issuance that Qualify as
Regulatory Capital under Basel III
Source: Bloomberg, Dealogic, MAS estimates
Source: Bloomberg, MAS estimates
67
Unconventional lending refers to lending by credit providers outside of the banking system. In this box, we consider two forms of unconventional lending – security-based crowdfunding and direct lending funds. 68
For the purpose of Box L, the term “CoCos” includes regulatory capital instruments which contain loss absorption features at the PONV. 69
This refers specifically to bank-issued CoCos, i.e. does not include those issued by insurance companies, non-bank financial institutions or corporates.
0
5
10
15
20
25
2010 2011 2012 2013 2014Aug
US$
Bill
ion
0
10
20
30
40
50
60
70
2009 2010 2011 2012 2013 2014Aug
Pe
r C
en
t
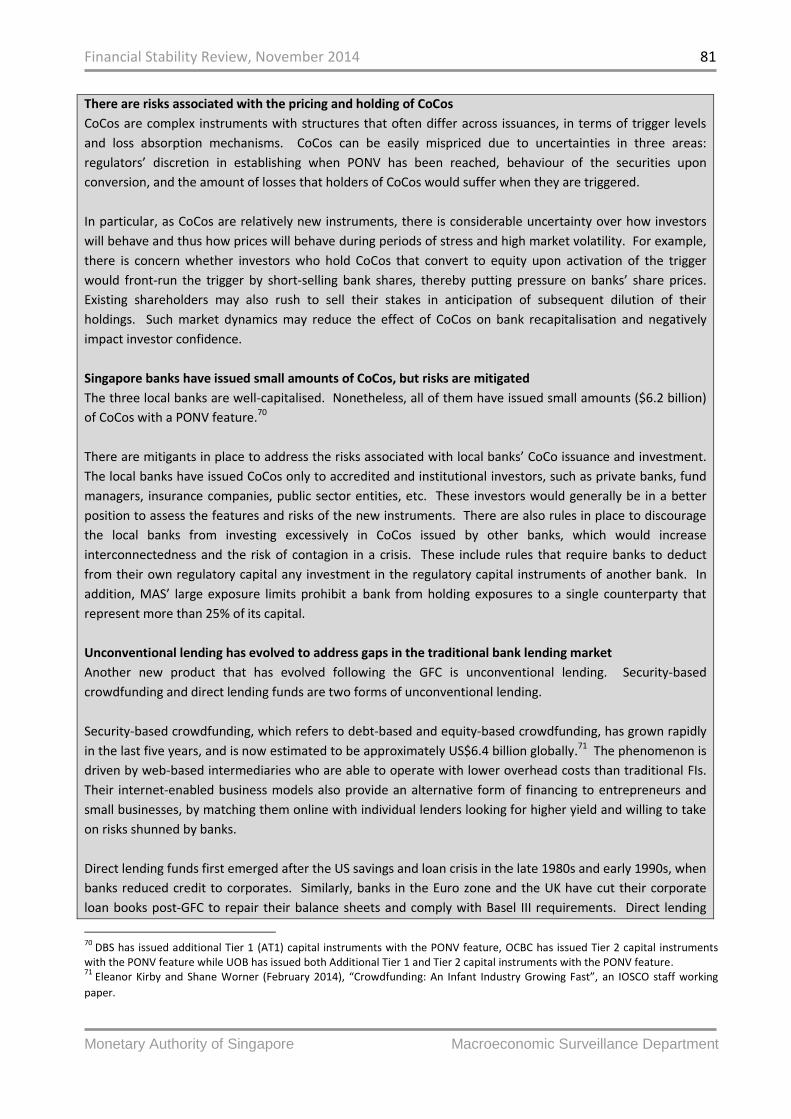
Financial Stability Review, November 2014 81
Monetary Authority of Singapore Macroeconomic Surveillance Department
There are risks associated with the pricing and holding of CoCos
CoCos are complex instruments with structures that often differ across issuances, in terms of trigger levels
and loss absorption mechanisms. CoCos can be easily mispriced due to uncertainties in three areas:
regulators’ discretion in establishing when PONV has been reached, behaviour of the securities upon
conversion, and the amount of losses that holders of CoCos would suffer when they are triggered.
In particular, as CoCos are relatively new instruments, there is considerable uncertainty over how investors
will behave and thus how prices will behave during periods of stress and high market volatility. For example,
there is concern whether investors who hold CoCos that convert to equity upon activation of the trigger
would front-run the trigger by short-selling bank shares, thereby putting pressure on banks’ share prices.
Existing shareholders may also rush to sell their stakes in anticipation of subsequent dilution of their
holdings. Such market dynamics may reduce the effect of CoCos on bank recapitalisation and negatively
impact investor confidence.
Singapore banks have issued small amounts of CoCos, but risks are mitigated
The three local banks are well-capitalised. Nonetheless, all of them have issued small amounts ($6.2 billion)
of CoCos with a PONV feature.70
There are mitigants in place to address the risks associated with local banks’ CoCo issuance and investment.
The local banks have issued CoCos only to accredited and institutional investors, such as private banks, fund
managers, insurance companies, public sector entities, etc. These investors would generally be in a better
position to assess the features and risks of the new instruments. There are also rules in place to discourage
the local banks from investing excessively in CoCos issued by other banks, which would increase
interconnectedness and the risk of contagion in a crisis. These include rules that require banks to deduct
from their own regulatory capital any investment in the regulatory capital instruments of another bank. In
addition, MAS’ large exposure limits prohibit a bank from holding exposures to a single counterparty that
represent more than 25% of its capital.
Unconventional lending has evolved to address gaps in the traditional bank lending market
Another new product that has evolved following the GFC is unconventional lending. Security-based
crowdfunding and direct lending funds are two forms of unconventional lending.
Security-based crowdfunding, which refers to debt-based and equity-based crowdfunding, has grown rapidly
in the last five years, and is now estimated to be approximately US$6.4 billion globally.71 The phenomenon is
driven by web-based intermediaries who are able to operate with lower overhead costs than traditional FIs.
Their internet-enabled business models also provide an alternative form of financing to entrepreneurs and
small businesses, by matching them online with individual lenders looking for higher yield and willing to take
on risks shunned by banks.
Direct lending funds first emerged after the US savings and loan crisis in the late 1980s and early 1990s, when
banks reduced credit to corporates. Similarly, banks in the Euro zone and the UK have cut their corporate
loan books post-GFC to repair their balance sheets and comply with Basel III requirements. Direct lending
70
DBS has issued additional Tier 1 (AT1) capital instruments with the PONV feature, OCBC has issued Tier 2 capital instruments with the PONV feature while UOB has issued both Additional Tier 1 and Tier 2 capital instruments with the PONV feature. 71
Eleanor Kirby and Shane Worner (February 2014), “Crowdfunding: An Infant Industry Growing Fast”, an IOSCO staff working
paper.
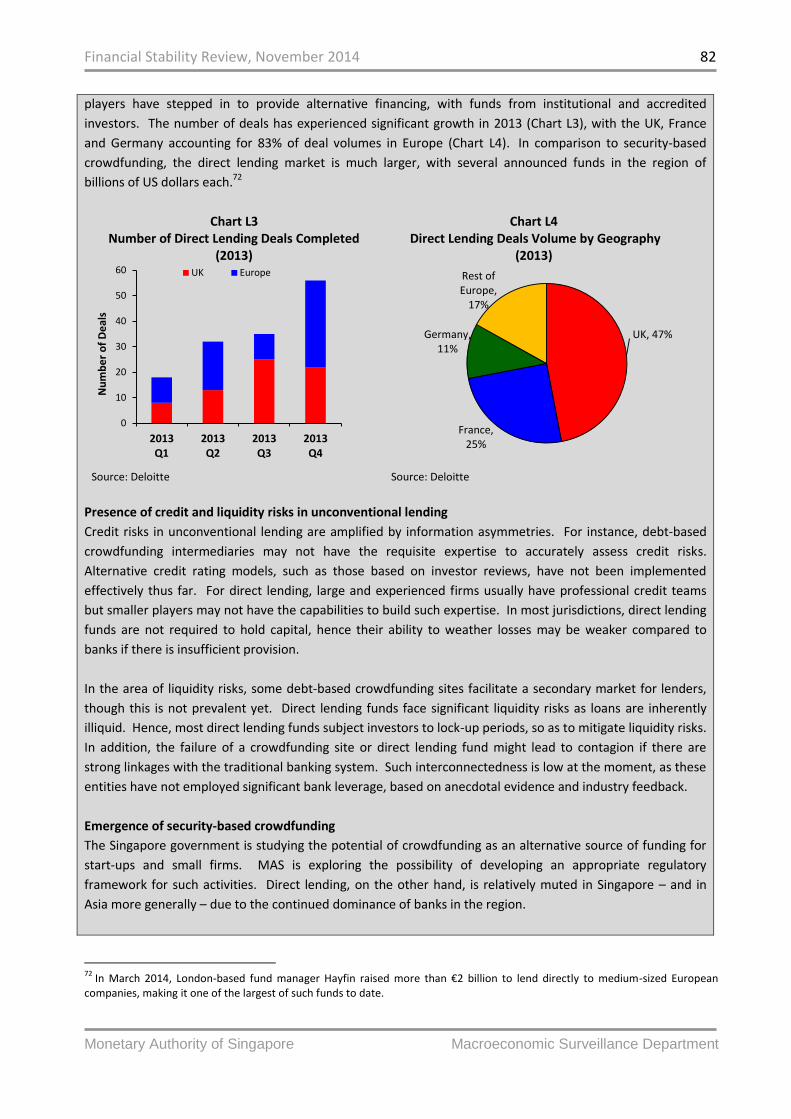
Financial Stability Review, November 2014 82
Monetary Authority of Singapore Macroeconomic Surveillance Department
players have stepped in to provide alternative financing, with funds from institutional and accredited
investors. The number of deals has experienced significant growth in 2013 (Chart L3), with the UK, France
and Germany accounting for 83% of deal volumes in Europe (Chart L4). In comparison to security-based
crowdfunding, the direct lending market is much larger, with several announced funds in the region of
billions of US dollars each.72
Chart L3 Number of Direct Lending Deals Completed
(2013)
Chart L4 Direct Lending Deals Volume by Geography
(2013)
Source: Deloitte Source: Deloitte
Presence of credit and liquidity risks in unconventional lending
Credit risks in unconventional lending are amplified by information asymmetries. For instance, debt-based
crowdfunding intermediaries may not have the requisite expertise to accurately assess credit risks.
Alternative credit rating models, such as those based on investor reviews, have not been implemented
effectively thus far. For direct lending, large and experienced firms usually have professional credit teams
but smaller players may not have the capabilities to build such expertise. In most jurisdictions, direct lending
funds are not required to hold capital, hence their ability to weather losses may be weaker compared to
banks if there is insufficient provision.
In the area of liquidity risks, some debt-based crowdfunding sites facilitate a secondary market for lenders,
though this is not prevalent yet. Direct lending funds face significant liquidity risks as loans are inherently
illiquid. Hence, most direct lending funds subject investors to lock-up periods, so as to mitigate liquidity risks.
In addition, the failure of a crowdfunding site or direct lending fund might lead to contagion if there are
strong linkages with the traditional banking system. Such interconnectedness is low at the moment, as these
entities have not employed significant bank leverage, based on anecdotal evidence and industry feedback.
Emergence of security-based crowdfunding
The Singapore government is studying the potential of crowdfunding as an alternative source of funding for
start-ups and small firms. MAS is exploring the possibility of developing an appropriate regulatory
framework for such activities. Direct lending, on the other hand, is relatively muted in Singapore – and in
Asia more generally – due to the continued dominance of banks in the region.
72
In March 2014, London-based fund manager Hayfin raised more than €2 billion to lend directly to medium-sized European companies, making it one of the largest of such funds to date.
0
10
20
30
40
50
60
2013Q1
2013Q2
2013Q3
2013Q4
Nu
mb
er
of
De
als
UK Europe
UK, 47%
France, 25%
Germany, 11%
Rest of Europe,
17%

Financial Stability Review, November 2014 83
Monetary Authority of Singapore Macroeconomic Surveillance Department
Conclusion
The nascent market for CoCos in Singapore could see future growth. Unconventional forms of lending have
grown rapidly in other markets but are only starting to develop in Singapore. While the risks posed by these
innovative products, in particular CoCos, are currently low and generally mitigated, their nature and
magnitude will continue to evolve as the markets develop. MAS will continue to monitor these
developments and their associated risks.
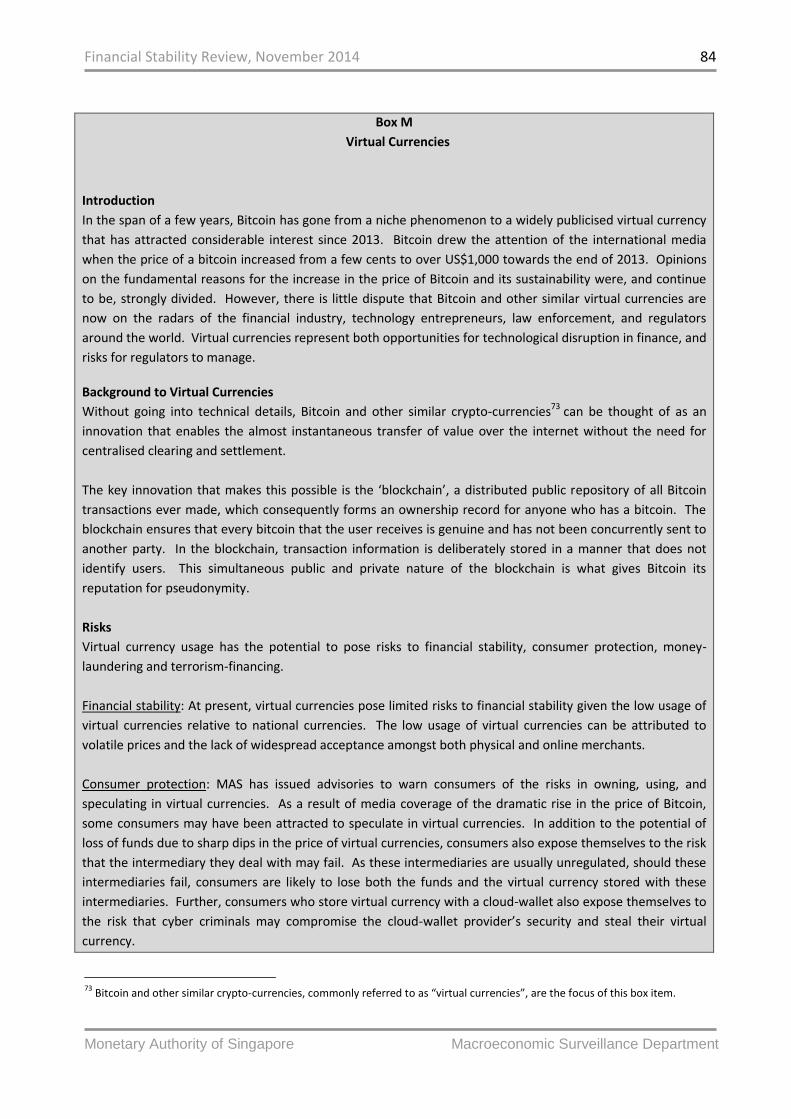
Financial Stability Review, November 2014 84
Monetary Authority of Singapore Macroeconomic Surveillance Department
Box M
Virtual Currencies
Introduction
In the span of a few years, Bitcoin has gone from a niche phenomenon to a widely publicised virtual currency
that has attracted considerable interest since 2013. Bitcoin drew the attention of the international media
when the price of a bitcoin increased from a few cents to over US$1,000 towards the end of 2013. Opinions
on the fundamental reasons for the increase in the price of Bitcoin and its sustainability were, and continue
to be, strongly divided. However, there is little dispute that Bitcoin and other similar virtual currencies are
now on the radars of the financial industry, technology entrepreneurs, law enforcement, and regulators
around the world. Virtual currencies represent both opportunities for technological disruption in finance, and
risks for regulators to manage.
Background to Virtual Currencies
Without going into technical details, Bitcoin and other similar crypto-currencies73 can be thought of as an
innovation that enables the almost instantaneous transfer of value over the internet without the need for
centralised clearing and settlement.
The key innovation that makes this possible is the ‘blockchain’, a distributed public repository of all Bitcoin
transactions ever made, which consequently forms an ownership record for anyone who has a bitcoin. The
blockchain ensures that every bitcoin that the user receives is genuine and has not been concurrently sent to
another party. In the blockchain, transaction information is deliberately stored in a manner that does not
identify users. This simultaneous public and private nature of the blockchain is what gives Bitcoin its
reputation for pseudonymity.
Risks
Virtual currency usage has the potential to pose risks to financial stability, consumer protection, money-
laundering and terrorism-financing.
Financial stability: At present, virtual currencies pose limited risks to financial stability given the low usage of
virtual currencies relative to national currencies. The low usage of virtual currencies can be attributed to
volatile prices and the lack of widespread acceptance amongst both physical and online merchants.
Consumer protection: MAS has issued advisories to warn consumers of the risks in owning, using, and
speculating in virtual currencies. As a result of media coverage of the dramatic rise in the price of Bitcoin,
some consumers may have been attracted to speculate in virtual currencies. In addition to the potential of
loss of funds due to sharp dips in the price of virtual currencies, consumers also expose themselves to the risk
that the intermediary they deal with may fail. As these intermediaries are usually unregulated, should these
intermediaries fail, consumers are likely to lose both the funds and the virtual currency stored with these
intermediaries. Further, consumers who store virtual currency with a cloud-wallet also expose themselves to
the risk that cyber criminals may compromise the cloud-wallet provider’s security and steal their virtual
currency.
73
Bitcoin and other similar crypto-currencies, commonly referred to as “virtual currencies”, are the focus of this box item.

Financial Stability Review, November 2014 85
Monetary Authority of Singapore Macroeconomic Surveillance Department
Money-Laundering and Terrorism-Financing: The electronic and pseudonymous nature of virtual currencies
makes them an attractive medium for the cross-border movement of funds for illicit purposes. MAS has
announced in March 2014 that it will introduce regulations for virtual currency intermediaries in Singapore to
mitigate this risk. Amongst other requirements, virtual currency intermediaries will be required to conduct
customer due diligence checks. MAS notes that regulation in a single jurisdiction will not be sufficient to
combat money-laundering and terrorism financing risks, and that a common approach for regulation of
virtual currency intermediaries is needed across jurisdictions.
In the event that virtual currency usage becomes more widespread globally, MAS will consider further
measures to address any impact to financial stability and consumer protection.

Financial Stability Review, November 2014 86
Monetary Authority of Singapore Macroeconomic Surveillance Department
STATISTICAL APPENDIX SINGAPORE NON-FINANCIAL SECTOR Table A.1: Corporate Sector’s Financial Ratios and Number of Companies Wound Up Table A.2: Household Sector’s Financial Indicators
SINGAPORE FINANCIAL SECTOR Table B.1: Banking Sector’s Selected Financial Indicators Table B.2: Local Banks’ Selected Financial Indicators Table B.3: Direct Life Insurers: Total New Business Gross Premiums Table B.4: Direct Life Insurers: Asset Distribution of Singapore Insurance Fund (Non-
Linked Assets) Table B.5: General Direct Insurers: Gross Premiums Table B.6: General Direct Insurers: Composition of Net Premiums of Singapore
Insurance Fund Table B.7: General Direct Insurers: Incurred Loss Ratio of Singapore Insurance Fund

Financial Stability Review, November 2014 87
Monetary Authority of Singapore Macroeconomic Surveillance Department
SINGAPORE NON-FINANCIAL SECTOR
Table A.1: Corporate Sector’s Financial Ratios and Number of Companies Wound up
H2 H1 H2 H1 H2 H1 H2 H1
2010 2011 2011 2012 2012 2013 2013 2014
Median Return on Assets (Per Cent)
Transport, Storage & Communication 6.3 6.1 5.1 5.2 5.7 5.8 4.0 3.2
Property 6.3 6.7 5.5 5.9 6.3 6.4 6.0 6.3
Multi-Industry 5.5 5.7 3.8 4.3 4.2 3.7 5.2 4.6
Manufacturing 5.9 5.3 4.3 3.7 3.0 2.3 2.2 3.2
Hotels & Restaurants 4.9 5.3 6.7 4.3 3.2 3.4 3.3 3.2
Construction 7.5 6.1 5.1 4.0 4.8 6.8 4.3 4.6
Commerce 5.2 6.1 5.1 3.8 3.8 4.3 3.1 3.4
Median Current Ratio (Ratio)
Transport, Storage & Communication 1.5 1.6 1.3 1.3 1.2 1.2 1.2 1.2
Property 2.1 2.0 1.9 2.0 1.9 1.8 2.1 1.9
Multi-Industry 2.0 2.0 2.3 2.1 1.7 1.8 1.6 1.6
Manufacturing 1.9 1.8 1.8 1.8 1.7 1.7 1.8 1.7
Hotels & Restaurants 1.8 1.8 1.9 1.8 1.3 1.2 1.9 2.5
Construction 1.8 2.1 1.7 1.9 1.7 1.8 1.6 1.5
Commerce 1.7 1.7 1.6 1.8 1.7 1.8 1.6 1.6
Median Total Debt/Equity (Per Cent)
Transport, Storage & Communication 41.3 45.0 43.9 56.2 49.4 55.5 52.4 62.3
Property 51.8 51.2 48.3 49.0 50.6 52.1 57.2 54.4
Multi-Industry 34.5 42.4 41.1 43.7 51.5 34.1 37.2 42.0
Manufacturing 19.4 19.9 22.0 25.0 25.0 26.4 31.3 24.9
Hotels & Restaurants 25.5 39.8 31.6 32.1 62.4 67.9 42.3 20.5
Construction 28.2 34.1 35.3 48.4 41.1 49.1 53.5 36.9
Commerce 25.4 29.4 33.1 34.7 34.5 27.6 41.9 30.9
Median Interest Coverage Ratio* (Ratio)
Transport, Storage & Communication 8.2 5.9 5.4 7.1 4.6 6.9 3.8 7.5
Property 14.4 7.1 19.1 7.7 12.8 7.0 12.2 6.3
Multi-Industry 15.8 12.7 5.9 9.4 12.0 8.5 13.5 13.4
Manufacturing 13.1 8.8 6.9 5.3 2.6 3.3 4.1 4.2
Hotels & Restaurants 12.1 3.0 3.0 2.0 5.9 1.6 4.3 2.9
Construction 9.7 13.2 4.9 12.6 11.0 13.3 9.6 7.6
Commerce 5.7 9.0 6.4 5.1 4.4 7.2 3.9 5.1
Number of Companies Wound Up
All Sectors 68 40 73 78 73 54 72 75
Source: Thomson Financial, Ministry of Law * Earnings before interest and tax divided by interest expense. Note: A revised list of firms (all SGX-listed firms as of October 2014) was included in the computation of ratios for H2 2013 and H1 2014 in the table above.

Financial Stability Review, November 2014 88
Monetary Authority of Singapore Macroeconomic Surveillance Department
Table A.2: Household Sector’s Financial Indicators
Source: DOS, MAS and Ministry of Law * Charge-off rate for the quarter is calculated by annualising the ratio obtained from dividing bad debts written off for the quarter by the average rollover balance for the same quarter.
Q2 Q3 Q4 Q1 Q2 Q3 Q4 Q1 Q2 Q3
2012 2012 2012 2013 2013 2013 2013 2014 2014 2014
Per Cent (unless otherwise stated)
Household Assets (S$ Billion)
1568.5 1603.4 1640.6 1678.0 1689.5 1709.3 1715.2 1727.3 1744.0 1745.0
Residential Property Assets as % of Total Assets
49.7 49.4 49.6 49.1 49.3 48.8 48.3 47.7 47.1 46.7
Household Liabilities (S$ Billion)
247.9 255.0 262.8 267.4 271.2 274.9 279.6 282.0 286.4 290.3
Household Liabilities to Assets Ratio (%)
15.8 15.9 16.0 15.9 16.1 16.1 16.3 16.3 16.4 16.6
Household Liabilities as % of GDP
70.3 71.9 73.3 74.1 74.5 74.6 75.0 74.7 75.6 76.3
Per Cent (unless otherwise stated)
Credit Card Charge-Off Rate*
4.8 5.1 4.8 4.6 5.1 4.7 5.0 4.7 5.0 5.4
Housing & Bridging Loan NPL Ratio
0.3 0.3 0.3 0.3 0.3 0.3 0.3 0.3 0.3 0.4
Professional & Private Individuals Loan NPL Ratio
0.7 0.6 0.6 0.6 0.6 0.5 0.6 0.5 0.5 0.5
Number of Individual Bankruptcy Orders
446 425 461 485 576 475 456 394 555 436

Financial Stability Review, November 2014 89
Monetary Authority of Singapore Macroeconomic Surveillance Department
SINGAPORE FINANCIAL SECTOR
Table B.1: Banking Sector’s* Selected Financial Indicators
2011** 2012** 2013** Q1
2013 Q2
2013 Q3
2013 Q4
2013 Q1
2014 Q2
2014 Q3
2014
Loan Concentration (% of Total Commercial Bank Loans)
Interbank Loans 46.0 42.5 39.5 40.5 40.3 39.8 39.5 38.4 39.0 37.8
Non-Bank Loans 54.0 57.5 60.5 59.5 59.7 60.2 60.5 61.6 61.0 62.2
Loans through the Asian Dollar Market (% of Total Commercial Bank Loans)
Total ADM Loans 60.9 58.6 59.4 58.2 58.9 59.5 59.4 59.3 59.9 59.1
Of which to (% of Total Asian Dollar Market Loans):
USA 4.9 3.3 3.2 3.4 2.9 3.0 3.2 2.8 3.1 3.0
United Kingdom 6.9 6.6 5.5 6.4 6.5 5.8 5.5 5.2 6.5 4.7
Switzerland 4.0 3.8 3.4 3.3 3.2 3.7 3.4 3.2 3.0 2.9
Japan 6.6 8.7 7.7 8.0 6.8 7.5 7.7 7.6 7.2 7.4
Hong Kong 10.2 8.9 10.4 9.2 9.8 10.3 10.4 10.2 10.2 10.7
Interbank 58.1 56.7 54.4 54.5 54.7 54.5 54.4 52.9 53.7 52.0
Non-Bank 41.9 43.3 45.6 45.5 45.3 45.5 45.6 47.1 46.3 48.0
Loans through Domestic Banking Units (% of Total Commercial Bank Loans)
Total DBU Loans 39.1 41.4 40.6 41.8 41.1 40.5 40.6 40.7 40.1 40.9
Of which to (% of Total DBU Loans):
Manufacturing 3.3 4.3 4.7 5.3 5.2 4.7 4.7 4.6 4.6 4.5
Building & Construction 11.7 12.4 13.3 12.7 13.0 13.3 13.3 13.2 13.2 13.1
Housing 22.8 24.0 24.5 23.8 24.1 24.5 24.5 24.3 24.1 23.8
Professionals & Private Individuals
9.1 9.6 9.5 9.4 9.5 9.5 9.5 9.6 9.5 9.3
Non-Bank Financial Institutions 9.6 10.3 10.7 10.0 10.3 10.5 10.7 10.9 11.1 11.4
Banks 27.0 22.5 17.6 21.2 19.7 18.2 17.6 17.3 16.8 17.3
Per Cent
DBU Net Interest Income to Total DBU Loans
1.5 1.5 1.4 1.4 1.4 1.4 1.4 1.5 1.5 1.5
Per Cent
Liquid DBU Assets to Total DBU Assets
9.9 9.7 9.7 9.9 9.9 9.5 9.7 9.6 9.3 9.4
Liquid DBU Assets to Total DBU Liabilities
10.7 10.5 10.5 10.7 10.7 10.2 10.5 10.4 10.0 10.1
All DBU Loans to All DBU Deposits
102.5 105.3 107.3 104.5 105.6 107.7 107.3 109.5 110.4 111.0
DBU Non-Bank Loans to DBU Non-Bank Deposits
87.0 94.6 103.1 96.5 99.5 101.8 103.1 105.5 106.8 107.2
DBU Non-Bank Loan Growth (y-o-y)
30.3 16.7 13.0 19.7 17.7 15.7 13.0 9.3 7.9 6.5
DBU Non-Bank Deposit Growth (y-o-y)
11.4 7.4 3.6 8.9 8.6 6.5 3.6 0.0 0.4 1.2
Source: MAS * Data relates to all commercial banks, Singapore operations only. ** Annual figures are as at Q4.

Financial Stability Review, November 2014 90
Monetary Authority of Singapore Macroeconomic Surveillance Department
Table B.2: Local Banks’* Selected Financial Indicators
2011** 2012** 2013** Q1
2013 Q2
2013 Q3
2013 Q4
2013 Q1
2014 Q2
2014 Q3
2014
Capital Adequacy (Per Cent)
Regulatory Capital to Risk-Weighted Assets (RWA)
16.0 18.1 16.4 16.9 16.3 16.1 16.4 16.1 16.8 16.0
Regulatory Tier I Capital to Risk-Weighted Assets (RWA)
13.5 14.9 13.8 14.2 13.6 13.5 13.8 13.7 14.0 13.5
Shareholders’ Funds to Total Assets^
8.7 9.2 8.4 8.9 8.6 8.3 8.4 8.4 8.6 8.5
Asset Quality (Per Cent)
Non-Bank NPLs to Non-Bank Loans
1.2 1.2 1.0 1.1 1.1 1.1 1.0 0.9 0.9 0.9
Total Provisions to Non-Bank NPLs
125.5 128.3 135.4 133.7 134.3 131.2 135.4 146.2 149.1 148.6
Specific Provisions to Non-Bank NPLs
39.3 41.8 34.8 39.9 38.7 35.7 34.8 35.4 34.4 32.4
Loan Concentration (% of Total Loans)
Interbank Loans 13.3 12.7 15.5 13.6 13.3 14.4 15.5 15.7 14.9 14.4
Non-Bank loans 86.7 87.3 84.5 86.4 86.7 85.6 84.5 84.3 85.1 85.6
Of which to (% of Total Loans):
Manufacturing 8.1 7.9 7.9 8.9 8.8 8.1 7.9 7.8 7.9 8.0
Building & Construction
12.1 12.6 12.8 12.9 13.0 13.0 12.8 12.6 12.7 12.9
Housing 20.7 22.0 19.8 21.3 20.8 20.4 19.8 19.6 19.8 20.4
Professional & Private Individuals
8.3 8.8 8.4 8.6 8.7 8.6 8.4 8.7 8.9 8.8
Non-Bank Financial Institutions
10.7 10.7 8.8 8.9 8.9 8.8 8.8 9.3 9.5 9.0
Profitability (Per Cent)
ROA (Simple Average) 1.0 1.1 1.0 1.1 1.0 1.0 1.0 1.1 1.1 1.0
ROE (Simple Average) 11.1 12.0 11.5 11.8 11.3 11.6 11.5 13.2 12.8 12.4
Net Interest Margin (Simple Average)
1.9 1.8 1.7 1.7 1.7 1.6 1.7 1.7 1.7 1.7
Non-Interest Income to Total Income
37.3 43.6 39.5 42.6 40.9 40.1 39.5 41.4 38.3 42.2
Source: Local banks’ financial statements, MAS calculations * Local banks' consolidated operations. ** Annual figures are as at Q4. ^ Figures include assets of Great Eastern Holdings.

Financial Stability Review, November 2014 91
Monetary Authority of Singapore Macroeconomic Surveillance Department
Table B.3: Direct Life Insurers: Total New Business Gross Premiums
2011 2012 2013
Q1 2013
Q2 2013
Q3 2013
Q4 2013
Q1 2014
Q2 2014
Q3 2014
Year-on-Year % Change
Policies 5.9 -0.6 -2.1 -17.6 3.0 5.9 0.1 6.9 -7.4 -8.8
Annual Premiums 23.0 19.6 26.0 20.4 39.8 26.5 17.7 7.2 -20.5 -14.3
Single Premiums 16.4 -10.0 17.3 -18.0 27.7 31.9 29.1 29.2 17.5 24.7
Sum Insured 27.0 15.3 -8.0 -7.5 -6.4 3.4 -19.8 11.4 12.0 0.7
Source: MAS
Table B.4: Direct Life Insurers: Asset Distribution of Singapore Insurance Fund (Non-Linked Assets)
2011 2012 2013
Q1 2013
Q2 2013
Q3 2013
Q4 2013
Q1 2014
Q2 2014
Q3 2014
S$ Million (% of Total Assets)
Debt Securities
61,041 71,347 72,000 71,770 69,997 71,365 72,131 74,226 77,535 79,558
(63.2) (66.1) (65.3) (65.5) (65.2) (65.3) (65.3) (65.4) (66.1) (66.3)
Equity Shares
19,218 21,931 25,545 23,343 23,091 24,221 25,392 26,577 26,957 27,306
(19.9) (20.3) (23.2) (21.3) (21.5) (22.2) (23.0) (23.4) (23.0) (22.8)
Cash & Deposits
7,172 5,695 4,695 5,409 5,706 5,047 4,813 4,029 4,049 4,759
(7.4) (5.3) (4.3) (4.9) (5.3) (4.6) (4.4) (3.5) (3.5) (4.0)
Loans 3,885 3,320 3,314 3,369 3,370 3,278 3,314 3,333 3,281 3,261
(4.0) (3.1) (3.0) (3.1) (3.1) (3.0) (3.0) (2.9) (2.8) (2.7)
Land & Buildings
3,056 3,109 3,188 3,111 3,067 3,073 3,188 3,188 3,213 3,212
(3.2) (2.9) (2.9) (2.8) (2.9) (2.8) (2.9) (2.8) (2.7) (2.7)
Other Assets
2,164 2,512 1,594 2,601 2,109 2,308 1,604 2,198 2,188 1,867
(2.2) (2.3) (1.4) (2.4) (2.0) (2.1) (1.5) (1.9) (1.9) (1.6)
Total Assets
96,537 107,914 110,336 109,604 107,341 109,292 110,441 113,552 117,223 119,964
(100) (100) (100) (100) (100) (100) (100) (100) (100) (100)
Source: MAS
Table B.5: General Direct Insurers: Gross Premiums
2011 2012 2013
Q1 2013
Q2 2013
Q3 2013
Q4 2013
Q1 2014
Q2 2014
Q3 2014
S$ Million
Total Operations
5,056.5 5,524.6 5,999.8 1,545.6 1,485.0 1,428.2 1,349.3 1,716.2 1,564.3 1,492.6
SIF 3,423.6 3,626.7 3,738.1 1,048.9 908.5 884.2 828.0 1,111.2 940.4 876.6
OIF 1,632.9 1,897.9 2,261.7 496.7 576.5 544.0 521.3 605.0 623.9 616.0
Source: MAS
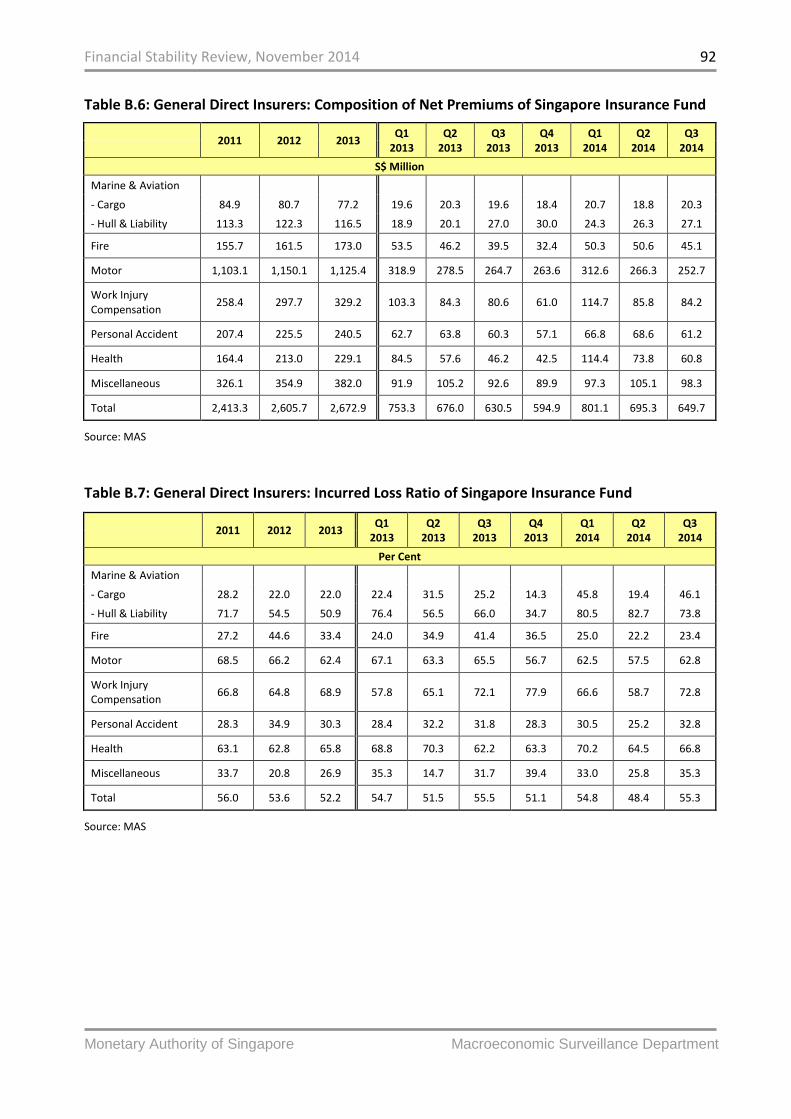
Financial Stability Review, November 2014 92
Monetary Authority of Singapore Macroeconomic Surveillance Department
Table B.6: General Direct Insurers: Composition of Net Premiums of Singapore Insurance Fund
2011 2012 2013
Q1 2013
Q2 2013
Q3 2013
Q4 2013
Q1 2014
Q2 2014
Q3 2014
S$ Million
Marine & Aviation
- Cargo 84.9 80.7 77.2 19.6 20.3 19.6 18.4 20.7 18.8 20.3
- Hull & Liability 113.3 122.3 116.5 18.9 20.1 27.0 30.0 24.3 26.3 27.1
Fire 155.7 161.5 173.0 53.5 46.2 39.5 32.4 50.3 50.6 45.1
Motor 1,103.1 1,150.1 1,125.4 318.9 278.5 264.7 263.6 312.6 266.3 252.7
Work Injury Compensation
258.4 297.7 329.2 103.3 84.3 80.6 61.0 114.7 85.8 84.2
Personal Accident 207.4 225.5 240.5 62.7 63.8 60.3 57.1 66.8 68.6 61.2
Health 164.4 213.0 229.1 84.5 57.6 46.2 42.5 114.4 73.8 60.8
Miscellaneous 326.1 354.9 382.0 91.9 105.2 92.6 89.9 97.3 105.1 98.3
Total 2,413.3 2,605.7 2,672.9 753.3 676.0 630.5 594.9 801.1 695.3 649.7
Source: MAS
Table B.7: General Direct Insurers: Incurred Loss Ratio of Singapore Insurance Fund
2011 2012 2013
Q1 2013
Q2 2013
Q3 2013
Q4 2013
Q1 2014
Q2 2014
Q3 2014
Per Cent
Marine & Aviation
- Cargo 28.2 22.0 22.0 22.4 31.5 25.2 14.3 45.8 19.4 46.1
- Hull & Liability 71.7 54.5 50.9 76.4 56.5 66.0 34.7 80.5 82.7 73.8
Fire 27.2 44.6 33.4 24.0 34.9 41.4 36.5 25.0 22.2 23.4
Motor 68.5 66.2 62.4 67.1 63.3 65.5 56.7 62.5 57.5 62.8
Work Injury Compensation
66.8 64.8 68.9 57.8 65.1 72.1 77.9 66.6 58.7 72.8
Personal Accident 28.3 34.9 30.3 28.4 32.2 31.8 28.3 30.5 25.2 32.8
Health 63.1 62.8 65.8 68.8 70.3 62.2 63.3 70.2 64.5 66.8
Miscellaneous 33.7 20.8 26.9 35.3 14.7 31.7 39.4 33.0 25.8 35.3
Total 56.0 53.6 52.2 54.7 51.5 55.5 51.1 54.8 48.4 55.3
Source: MAS