november 2017 grownotes - grdc
TRANSCRIPT
GROWNOTES™
PLANNING/PADDOCK PREPARATION
PRE-PLANTING
PLANTING
PLANT GROWTH AND PHYSIOLOGY
NUTRITION AND FERTILISER
WEED CONTROL
INSECT CONTROL
NEMATODE CONTROL
DISEASES
PLANT GROWTH REGULATORS
AND CANOPY MANAGEMENT
CROP DESICCATION AND SPRAY OUT
HARVEST
STORAGE
ENVIRONMENTAL ISSUES
MARKETING
CURRENT RESEARCH
CANOLA
INTRODUCTION
ASSESSING YOUR CURRENT BUSINESS MODEL
FARM RESOURCES – HOW CAN YOU ACCESS THEM MORE EFFECTIVELY?
FINDING THE RIGHT FARM BUSINESS MODEL
NEXT STEPS
ADDITIONAL INFORMATION
FARM BUSINESS MODELS
NOVEMBER 2017
FARM BUSINESS MODELS
Front page image: Kellie Penfold
ISBN: 978-1-921779-46-6 (online only)
© 2017 Grains Research and Development Corporation
All rights reserved.
GRDC contact details
Ms Maureen Cribb, Manager Integrated Publications Grains Research & Development Corporation PO Box 5367 Kingston ACT 2604 Phone: 02 6166 4500 Email: [email protected]
DISCLAIMER
Any recommendations, suggestions or opinions contained in this publication do not necessarily represent the policy or views of the Grains Research and Development Corporation (GRDC). No person should act on the basis of the contents of this publication without first obtaining specific, independent professional advice.
The Grains Research and Development Corporation may identify products by proprietary or trade names to help readers identify particular types of products. We do not endorse or recommend the products of any manufacturer referred to. Other products may perform as well as or better than those specifically referred to. The GRDC will not be liable for any loss, damage, cost or expense incurred or arising by reason of any person using or relying on the information in this publication.
Copyright @ All material published in this GrowNote is copyright protected and may not be reproduced in any form without written permission from the GRDC.

FARM BUSINESS MODELS – OPTIONS FOR BUILDING YOUR FUTURE 3
GROWNOTES
ContentsForeword ......................................................................................................................................................7Acknowledgements ..................................................................................................................................8Introduction to farm business models ............................................................................................... 10Farm business model versus business structure .......................................................................... 10What is a farm business model? ......................................................................................................... 111.1. Useful links and additional information – farm business management ............................ 12Assessing your current farm business model ................................................................................. 132.1. Step 1 – Why change the current business model?............................................................... 13
2.1.1. Improved profitability .............................................................................................................. 132.1.2. Risk management ................................................................................................................... 142.1.3. Supporting business succession ....................................................................................... 142.1.4. Access to capital ..................................................................................................................... 15
Business structures for succession .................................................................................................... 152.2. Step 2 – What do the key people in your farm business need? ..................................... 162.3. Step 3 – What stage of the business cycle are you in? ...................................................... 172.4. Step 4 – What is your financial position? ................................................................................. 182.5. Step 5 – What farm resources do you have available? ...................................................... 182.6. Useful links and additional information – assessing your farm business ...................... 19Farm resources – how can you access them more effectively? .............................................203.1 Separating farm assets and operations .....................................................................................203.2 Exploring farm resources in detail ...............................................................................................21Separating farm business assets and operations .........................................................................21Basic principles of the farm business model ..................................................................................21
3.2.1. Land ...........................................................................................................................................223.2.2. Irrigation water ......................................................................................................................243.2.3. Livestock .................................................................................................................................243.2.4. Management ..........................................................................................................................253.2.5. Labour and machinery .......................................................................................................253.2.6. Capital ......................................................................................................................................263.2.7. Reflection and summary ..................................................................................................... 27
3.3. Useful links and additional information – farm resources .................................................28Finding the right farm business model .............................................................................................29Farm resources (Section 3.2) ..............................................................................................................29Basic principles of the farm business model (Section 3.1) ..........................................................304.1. Family farms ........................................................................................................................................ 31
4.1.1. ‘Nesting’ business models in the family farm .................................................................. 314.1.2. Family labour ............................................................................................................................ 314.1.3. Establishing an equitable family farm agreement .......................................................324.1.4. Analysis of financial performance – family farms ........................................................ 334.1.5. Self-assessment – family farm model ............................................................................. 334.1.6. Useful links and additional information – family farms .............................................. 34
4.2. Leasing ............................................................................................................................................... 344.2.1. Operating solely on leased land ......................................................................................364.2.2. Developing a leasing model ............................................................................................ 37
‘Sale and lease back’ ............................................................................................................................. 374.2.3. Establishing an equitable lease agreement ................................................................394.2.4. Participatory leases .............................................................................................................404.2.5. Analysis of financial performance – leasing ................................................................ 414.2.6. Self-assessment – leasing model ................................................................................... 434.2.7. Useful links and additional information – leasing ....................................................... 43
4.3. Share farming ...................................................................................................................................464.3.1. Operating solely on share-farmed land ......................................................................... 474.3.2. Developing a share farming model ................................................................................ 474.3.3. Establishing an equitable share-farm agreement ......................................................494.3.4. Profit sharing agreements .................................................................................................504.3.5. Analysis of financial performance – share farming ....................................................514.3.6. Self-assessment – share-farming model ......................................................................534.3.7. Useful links and additional information – share farming ..........................................53
4.4. Contracting ........................................................................................................................................534.4.1. Operating solely as a contractor ......................................................................................56
FARM BUSINESS MODELS – OPTIONS FOR BUILDING YOUR FUTURE4
GROWNOTES
FARM BUSINESS MODELS4.4.2. Developing a contracting model.....................................................................................564.4.3. Establishing an equitable contracting agreement ..................................................... 574.4.4. Analysis of financial performance ...................................................................................584.4.5. Self-assessment – contracting model ...........................................................................624.4.6. Useful links and additional information – contracting ..............................................62
4.5. Joint ventures (equity partnerships)..........................................................................................624.5.1. Access to capital through joint ventures .......................................................................634.5.2. Equity partnerships ..............................................................................................................634.5.3. Developing an equity partnership model ....................................................................644.5.4. Establishing an equitable joint venture agreement ..................................................664.5.5. Analysis of financial performance – joint ventures ................................................... 674.5.6. Self-assessment – equity partnership model .............................................................694.5.7. Useful links and additional information – joint ventures ..........................................69
4.6. Financial comparisons of farm business models .................................................................694.6.1. Comparing farm business models for a dryland
cropping operation – the assumptions ............................................................................ 724.6.2. Comparing farm business models for a dryland
cropping operation – the results ......................................................................................... 724.6.3. Varying key inputs – what happens to financial returns? ........................................ 754.6.4. Detailed assumptions for financial analysis by model type ................................... 79
Next steps ..................................................................................................................................................85Additional information ............................................................................................................................866.1. Introduction to farm business models ......................................................................................86
6.1.1. Australian grains industry at a glance ..............................................................................866.1.2. Relative contribution of family farms to Australian agriculture ................................ 876.1.3. Changing demographics of Australian farm businesses ..........................................886.1.4. Family farms – the situation in the European Union ..................................................896.1.5. Partnerships are the most common trading entity for
farm businesses ........................................................................................................................896.2 Assessing your current business model ..................................................................................90
6.2.1. Productivity growth in Australian agriculture ...............................................................906.2.2. Trends in productivity growth and farm size ...............................................................906.2.3. Farm business succession – baby boomers handing over the ‘reins’ ................916.2.4. Rural debt – current profile ................................................................................................916.2.5. Land values – trends and impact on capital requirements
for farm business.......................................................................................................................926.2.6. Returns from agriculture compared with other asset classes ...............................946.2.7. Access to capital for farm businesses elsewhere around the world ...................966.2.8. Stage of business cycle and implications for business goals
and performance targets........................................................................................................ 976.2.9. Grains industry profile: stages of business cycle, business
confidence and planning .......................................................................................................996.3. Farm resources.............................................................................................................................. 100
6.3.1. Irrigation water as a farm business asset and enterprise input ............................ 1006.3.2. Role of livestock in mixed farming businesses ..........................................................1016.3.3. Livestock leasing – ‘CowBank’ (commercial product)
and ‘EweBank’ (proposal) .......................................................................................................1016.3.4. High labour efficiency can be achieved with models other
than family farms ..................................................................................................................... 1026.4. Finding the right farm business model .................................................................................. 103
6.4.1. Nesting farm business models in the family farm ..................................................... 1036.4.2. Off-farm employment – diversifying income sources and lowering risk ......... 1046.4.3. Leasing and share farming – lessons from abroad ................................................ 1056.4.4. What proportion of total farm capital is attributed to land? ...................................1076.4.5. Increasing land values – a driver for increasing lease costs
and lower profitability ............................................................................................................ 1086.4.6. Acts of parliament covering lease and share farming agreements .................. 1096.4.7. What proportion of total farm capital is attributed to machinery? ....................... 1096.4.8. Example contract farming agreement ...........................................................................1106.4.9. Corporate farming – a form of joint venture ..............................................................114
Endnotes ....................................................................................................................................................116
FARM BUSINESS MODELS – OPTIONS FOR BUILDING YOUR FUTURE 5
GROWNOTES
List of TablesTable 1 Project steering committee and expert contributors. .................................................... 9Table 2 Case study videos. .................................................................................................................. 9Table 3 Summary of farm business resources. ............................................................................22Table 4 Primary farm business model ‘types’ – typical ownership and access
arrangements for farm resources. ..............................................................................................30Table 5 Developing a family farm business model – summary. ............................................32Table 6 Key performance indicators and profit drivers for family farms. ............................. 34Table 7 Self-assessment guide – family farm business model. ..............................................35Table 8 Developing a leasing business model – summary. ....................................................38Table 9 Summary of income and costs – example of a dryland cropping operation
under a leasing farm business model. ......................................................................................42Table 10 Self-assessment guide – leasing business model. ................................................... 44Table 11 Developing a share-farming agreement – summary. .................................................48Table 12 Summary of income and costs – example of a dryland cropping operation
under a share-farming business model using a ‘profit share’ agreement. ...................52Table 13 Self-assessment guide – share-farming business model. .......................................54Table 14 Developing a contracting agreement – summary. ..................................................... 57Table 15 Summary of income and costs – example of a dryland cropping operation
under a contracting business model (machinery and management)..............................59Table 16 Self-assessment guide – contracting business model. ............................................60Table 17 Developing an equity partnership model – summary. ..............................................66Table 18 Summary of income and costs – example of a dryland cropping operation
under an equity partnership business model. ........................................................................68Table 19 Self-assessment guide – joint venture (equity partnership) business model. ...........70Table 20 Summary of management plan and crop gross margins used in analysis. ...... 72Table 21 Results of financial analysis – the farm business operator’s perspective. ......... 73Table 22 Results of financial analysis – the landowner’s perspective. ................................ 73Table 23 Impact of variations in key input assumptions on profit for the family farm
business model – results from @Risk........................................................................................ 76Table 24 Detailed assumptions for financial analysis – leasing. ............................................80Table 25 Detailed assumptions for financial analysis – share farming (profit share). ....... 81Table 26 Detailed assumptions for financial analysis – share farming (75:25). .................82Table 27 Detailed assumptions for financial analysis – contracting......................................83Table 28 Detailed assumptions for financial analysis – joint venture (equity partnership). ....84Average farm business scale. .............................................................................................................86Grain production 2014-15. .....................................................................................................................86Grain production ranges. ......................................................................................................................86Table 29 Corporate farms with greater than $2 million annual income, 2006
compared with 2011. ........................................................................................................................88Table 30 Land values for broadacre farms by zone 1977-78 versus 2013-14. ....................93Table 31 Australian farmland values – change in national median value. ...........................93Table 32 Australian farmland values – change in national median value by state. .........94Table 33 Financial performance of broadacre farms by industry. ..........................................95Table 34 Rate of return to total capital, excluding appreciation, by industry,
farm size and performance rank. ................................................................................................96Table 35 Lease and share-farming data – proportion of total business and
total farm area (by commercial farm performance dataset). ............................................ 103Table 36 East Europe European Union member states – land tenure, 2007. ................. 106Table 37 AgProfit (2010 to 2014) – owned land asset value as percentage
of total farm asset value. .............................................................................................................. 108Table 38 AgProfit (2010 to 2014) – machinery asset value as a percentage
of total farm asset value. .............................................................................................................. 109Table 39 Main corporate farm business models in Australia. ..................................................115
FARM BUSINESS MODELS – OPTIONS FOR BUILDING YOUR FUTURE6
GROWNOTES
FARM BUSINESS MODELS
List of FiguresFigure 1: Sources of farm business capital for Australian broad acre and dairy
farm businesses, 1994-95 to 2014-15. .......................................................................................... 15Figure 2: Stages of business cycle. .................................................................................................................17Figure 3: Comparing the profit distribution of share farming models from the
share farmer’s perspective using @Risk. ...................................................................................77Figure 4: Comparing the profit distribution of share farming and leasing models
from the farm business operator’s perspective using @Risk. ...........................................77Figure 5: Comparing the profit distribution of share farming and three-way joint
venture models from the farm business operator’s perspective using @Risk. ...................78Figure 6: Comparing the profit distribution for the share farmer and landowner
in a share farming (75:25) agreement using @Risk. ............................................................ 79Figure 7: Comparing the profit distribution for the share farmer and landowner
in a profit share agreement using @Risk. ................................................................................. 79Figure 8: Australian farm business income by income category. ......................................................87Figure 9: Business entity type in Australia – comparison between farm businesses
and rest of economy. ........................................................................................................................89Figure 10: Productivity growth for specialist cropping farm businesses
in Australia, 1977-78 to 2013-14. ..................................................................................................90Figure 11: Composition of average farm business debt on a broadacre farm,
1995-96 to 2014-15. ...........................................................................................................................92Figure 12: Land values for broadacre farms by zone from 1977-78 to 2013-14. ........................... 93Figure 13: Ten-year returns to December 2014 for a range of Australian
and international investments .....................................................................................................95Figure 14: GRDC Grower Survey (2015) – stage of business cycle. .................................................98Figure 15: GRDC Grower Survey (2015) – industry perception. .........................................................98Figure 16: GRDC Grower Survey (2014) – business planning. ............................................................99Figure 17: Irrigation water temporary trade within Murray Irrigation system – volume
and weighted average price for sales from 1998-99 to 2014-15. .................................101Figure 18: Labour indicators for broadacre grain farms. .......................................................................103Figure 19: ABARES Farm Survey (1990 to 2014) – lease as proportion (%) of total
cash costs for specialist cropping businesses. ...................................................................104Figure 20: Off-farm income – ABARES NSW mixed crops and livestock
businesses, 1994-95 to 2013-14. ..............................................................................................105Figure 21: Proportion of farm income derived from ‘non-farm’ sources, 1990 to 2014. ..........105Figure 22: United States 2012 Census of Agriculture – proportion of total farm
land rented or leased. ..................................................................................................................106Figure 23: ABARES Farm Surveys (1990 to 2014): capital values for land and fixed
improvements and total per farm. ...........................................................................................107Figure 24: ABARES Farm Surveys (1995-96 to 2013-14), land prices and farm income ($/ha). .....108
List of VideosIntroduction to Farm Business Models GrowNotes™ – Animation ........................................... 10Graham Mattschoss (grower), Yorke Peninsula, SA .....................................................................29David Heinjus (consultant), Clare, SA ............................................................................................... 31Simon Ballinger (grower), Wolseley, SA ...........................................................................................32Scott Campbell (grower, Keith, SA .................................................................................................... 33David Critch (grower), Mullewa, WA ................................................................................................. 34Phil O’Callaghan (consultant), Bendigo, Vic ..................................................................................46Alex and Helen Jobling (grower), Swan Hill, Vic ........................................................................... 47Brian Wibberley (consultant) ................................................................................................................62Graham Mattschoss (grower), Yorke Peninsula, SA .....................................................................64Paul Schulz (grower), Sandilands, SA ..............................................................................................66
FARM BUSINESS MODELS – OPTIONS FOR BUILDING YOUR FUTURE 7
GROWNOTES
Foreword
GrowNotesTM reflect the GRDC’s commitment to equipping growers and advisers with up-to-date, relevant and comprehensive farm business management information to complement the GRDC’s investment in grains research, development and extension (RD&E).
The primary focus of the GRDC’s investment in RD&E is in the production technology fields of plant breeding and agronomy, covering areas such as variety selection, application rates and timing, row spacing and farming systems. The overall aim is to ensure profitable and sustainable farm businesses. Growers need to assess available production technologies for suitability before incorporating them into their farming systems. The process of assessing and adopting production technologies requires skills and knowledge in farm business management.
The GRDC recognises the importance of business management knowledge and skills in assessing and adopting the outcomes of its RD&E investments. This GrowNotesTM is the first to focus on farm business management, complementing the existing GrowNotes that focus on crop-specific production.
GrowNotes are industry-owned resources, developed with input from respected advisers, researchers and growers. The process for developing a GrowNotesTM is particularly well suited to the needs of farm business models, as there are many options and relatively few other sources of comprehensive information and resources.
I trust that you will find the GRDC’s Farm Business Models GrowNotesTM useful in the management of your farm business.
Sincerely,
Steve Jefferies Managing Director, Grains Research and Development Corporation
FARM BUSINESS MODELS – OPTIONS FOR BUILDING YOUR FUTURE8
GROWNOTES
AcknowledgementsThe project manager for and major contributor to this GrowNotes was Andrew Rice (ORM Pty Ltd).
ORM was assisted in the development of the publication by a steering committee comprising growers and advisers (Table 1). A subgroup of expert contributors provided detailed input and feedback through the drafting, review and layout stages. ORM would especially like to thank expert contributors Cameron Weeks, David Heinjus and Phil O’Callaghan.
Maureen Cribb (manager Integrated Publications, GRDC) has provided invaluable guidance and ensured that the GrowNote is focused on meeting the needs of grain growers.
In addition, the case study videos, produced by Anvil Media, would not have been possible without insights from growers and their advisers about their experiences with various farm business models (Table 2).

FARM BUSINESS MODELS – OPTIONS FOR BUILDING YOUR FUTURE 9
GROWNOTES
TABLE 1 Project steering committee and expert contributors.
Name Position Business Location
David Brownhill grower Spring Ridge, NSWBasil Doonan consultant Macquarie Franklin East Devonport, TasmaniaJohn Francis consultant Holmes Sackett Wagga Wagga, NSWSimon Fritsch principal Agripath Tamworth, NSW
Rod Glass vice-chancellor’s research fellow
University of Southern Queensland Toowoomba, Queensland
Brian Gregg grower Dysart, Queensland
David Heinjus managing director and consultant Rural Directions Pty Ltd Clare, SA
Bec Lanham consultant Collaborative Farming Australia Wangaratta, Victoria
Phil O’Callaghan managing director and consultant ORM Pty Ltd Bendigo, Victoria
Andrew Rice agribusiness consultant ORM Pty Ltd Parkes, NSWDavid Sackett managing director Growth Farms Australia Borambola, NSWBrendan Tierney grower Moora, WASimon Venus corporate lawyer Piper Alderman Adelaide SACameron Weeks director and consultant Planfarm Pty Ltd Geraldton, WA
Brian Wibberley principal and accountant Wibberleys Chartered Accountants Port Lincoln, SA
TABLE 2 Case study videos.
Name Position Location Business model
Simon Ballinger grower Wolseley, SA Family farmScott Campbell grower Keith, SA Family farm
David Heinjus managing director and consultant Clare, SA Consultant
David Critch grower Mullewa, WA LeasingAlex and Helen Jobling grower Swan Hill, Victoria Share farming
Phil O’Callaghan managing director and consultant Bendigo, Victoria Share farming
Graham Mattschoss Yorke Peninsula, SA Joint venturePaul Schulz Sandilands, SA Joint ventureBrian Wibberley principal and accountant Port Lincoln, SA Joint venture
FARM BUSINESS MODELS – OPTIONS FOR BUILDING YOUR FUTURE10
GROWNOTES
FARM BUSINESS MODELS
IN FOCUSFarm business model versus business structureA farm business model is commonly mistaken to mean ‘business structure’, or the combination of legal entities for business operation and asset ownership, such as a partnership, trust or company.
While legal entities are important, they are only part of the puzzle and may not take into consideration the foundations for a successful farm business. The business entity is best addressed in the later stages of setting up or restructuring a farm business model, matching the entity to the needs of the business and people. Section 1.1 provides links to additional information on farm business structures.
SECTION 1
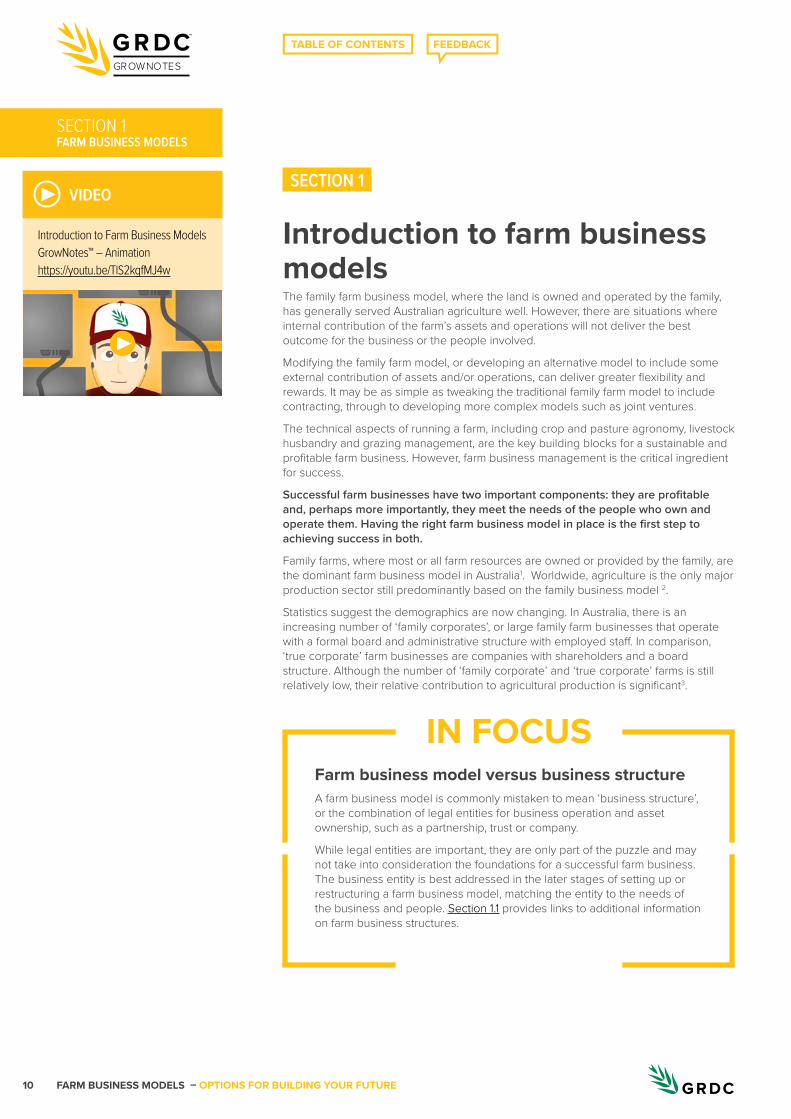
Introduction to farm business modelsThe family farm business model, where the land is owned and operated by the family, has generally served Australian agriculture well. However, there are situations where internal contribution of the farm’s assets and operations will not deliver the best outcome for the business or the people involved.
Modifying the family farm model, or developing an alternative model to include some external contribution of assets and/or operations, can deliver greater flexibility and rewards. It may be as simple as tweaking the traditional family farm model to include contracting, through to developing more complex models such as joint ventures.
The technical aspects of running a farm, including crop and pasture agronomy, livestock husbandry and grazing management, are the key building blocks for a sustainable and profitable farm business. However, farm business management is the critical ingredient for success.
Successful farm businesses have two important components: they are profitable and, perhaps more importantly, they meet the needs of the people who own and operate them. Having the right farm business model in place is the first step to achieving success in both.
Family farms, where most or all farm resources are owned or provided by the family, are the dominant farm business model in Australia1. Worldwide, agriculture is the only major production sector still predominantly based on the family business model 2.
Statistics suggest the demographics are now changing. In Australia, there is an increasing number of ‘family corporates’, or large family farm businesses that operate with a formal board and administrative structure with employed staff. In comparison, ‘true corporate’ farm businesses are companies with shareholders and a board structure. Although the number of ‘family corporate’ and ‘true corporate’ farms is still relatively low, their relative contribution to agricultural production is significant3.
▶ VIDEO
Introduction to Farm Business Models GrowNotes™ – Animation https://youtu.be/TlS2kgfMJ4w
▶
SECTION 1
FARM BUSINESS MODELS – OPTIONS FOR BUILDING YOUR FUTURE 11
GROWNOTES
FARM BUSINESS MODELSSECTION 1
6.1.1. Australian grains industry at a glance
6.1.2. Relative contribution of family farms to Australian agriculture
6.1.3. Changing demographics of Australian farm businesses
6.1.4. Family farms – the situation in the European Union37
6.1.5. Partnerships are the most common trading entity for farm businesses
What is a farm business model? A farm business model involves arrangements for:
• business ownership and access to resources;• business management; and• sources of capital for the business.
Examples of farm business models include leasing, share farming, family farms and joint ventures.
There are many reasons why a grower or ‘farm business operator’ may consider changing their farm business model. The most common drivers for change include:
• increased profitability by improving cost structures and access to resources; • greater risk management through sharing risk with other parties;• facilitation of business succession; and• increased access to capital for growth and operation, reducing the reliance on debt
funding.
These drivers are explored further in Section 2.1.
While adopting an appropriate farm business model can help address these drivers, business success also depends on the ability to manage and operate the business well. Traditionally, family farms owned all assets and provided all or most of the resources for operating the business, including land, water, labour, management and working capital. Alternative farm business models provide an opportunity to vary this model to include the contribution of resources from:
• other farm business operators and service providers such as contractors; and• investors, including landowners not operating their own farm businesses or passive
investors offering capital for business operation and growth.
It is essential that the perspectives and needs of all farm business operators and investors are considered when developing farm business models. Models can be customised and multiple models may be included in a business at any one time.
This GrowNote aims to assist growers in assessing their current business model, including their:
• personal and business circumstances (Section 2); and • farm resources (Section 3).
It then guides them through:
• alternative business models (Section 4)
to assess those that better suit their needs, based on the key considerations of:
• people;• finances; and• resources.
MORE INFORMATION
FARM BUSINESS MODELS – OPTIONS FOR BUILDING YOUR FUTURE12
GROWNOTES
FARM BUSINESS MODELSSECTION 1
1.1. Useful links and additional information – farm business management
GRDC Farm Business Management resources – www.grdc.com.au/Resources
Krause M (2014), Farming the Business Manual, GRDC, Canberra – www.grdc.com.au/Resources/Publications/2015/01/Farming-the-Business-Manual
Crowe Horwath (2014), Business structures for a successful family farm – www.grdc.com.au/Research-and-Development/GRDC-Update-Papers/2014/10/Business-structures-for-a-successful-family-farm
Wibberley B (2014), Business structures for the family farm – www.grdc.com.au/Research-and-Development/GRDC-Update-Papers/2014/09/Business-structures-for-the-family-farm
Videos www.youtube.com/playlist?list=PL2PndQdkNRHEJ9OAMJOxlCn53Yh64lOhs

FARM BUSINESS MODELS – OPTIONS FOR BUILDING YOUR FUTURE 13
GROWNOTES
FARM BUSINESS MODELSSECTION 2
SECTION 2
Assessing your current farm business modelAlternative farm business models cannot be selected ‘off the shelf’. They need to be developed to suit specific personal and business needs, focusing on people, finances and resources.
The following steps can be used to better understand your personal and business situation, identifying where changes are required that may be accommodated by an alternative farm business model.
• Step 1 – 2.1. Step 1 – Why change the current business model?
• Step 2 – 2.2. Step 2 – What do the key people in your farm business need?
• Step 3 – 2.3. Step 3 – What stage of the business cycle are you in?
• Step 4 – 2.4. Step 4 – What is your financial position?
• Step 5 – 2.5. Step 5 – What farm resources do you have available?
Farm business management is based on decision-making, choosing a path for your business that has acceptable rewards, both financial and non-financial, for acceptable effort with an acceptable level of risk 4. What is ‘acceptable’ will vary from business to business and person to person. It is essential that farm decision-making includes all key people in the farm business.
2.1. Step 1 – Why change the current business model?For existing farm businesses, it is important to understand what is driving the need to explore other business models. For new businesses, what are the drivers for establishing a business? Are you looking for:
• increased profitability?• greater risk management?• support for business succession?• increased access to capital?
These drivers, explored in detail below, are the most common reasons for seeking an alternative business model and will help you develop the most suitable model for your situation, or even help you assess if a change is warranted.
2.1.1. Improved profitabilityProfitability is underpinned by productivity, managing costs and access to sufficient resources. Alternative farm business models offer an opportunity to improve profitability through:
• increased farm business scale, resulting in stronger bargaining and purchasing power to decrease costs;
• business relationships with other parties that can provide access to resources and technology not currently available; and
• matching resources to the scale of operations, for greatest economic efficiency.
Better matching resources to scale can benefit businesses of all sizes. For every scale of operations, there is a level of resources that delivers the greatest economic efficiency. It should be noted that farm performance data indicates only a weak relationship between operating scale, measured by gross income, and profitability.
6.2.1. Productivity growth in Australian agriculture
6.2.2. Trends in productivity growth and farm size
MORE INFORMATION
FARM BUSINESS MODELS – OPTIONS FOR BUILDING YOUR FUTURE14
GROWNOTES
FARM BUSINESS MODELS
A Guide to Succession: Sustaining farm families and farms
6.2.3. Farm business succession – baby boomers handing over the ‘reins’
SECTION 2
Options to increase the farm business scale of operations include:
• larger area operated, through land purchase, lease, share farming, contracting or joint venture; or
• greater productivity of the current operation by investing in the business.
2.1.2. Risk managementFarm businesses are exposed to a variety of risks, including:
• production risk – impact of weather events, such as hail, wind, frost and heat; and pests, weeds and diseases;
• technology risk – adoption of new practices;• market risk – variability in commodity prices, market access and product demand;• business risk – payment defaults on farm sales and services; legal responsibilities
such as workplace health and safety; changes to suppliers of goods and services;• government risk – legislation changes resulting in additional record-keeping and
reporting costs; restrictions on land tenure, management practices and/or land use; and
• personnel risk – death, injury, illness and departure of key resources.
Traditional farm business models can leave growers bearing the entire responsibility for managing risks and liabilities, except for those covered by insurance. The scope for managing risk is relatively limited, with options generally based on risk avoidance or mitigation.
Alternative farm business models provide an opportunity for growers to share risk with other parties that are involved in the ownership and operation of the business. Ideally, the risks are shared in a way that is proportional to individual contributions and potential returns.
Farm business models also provide an opportunity to formally separate assets and operations. This is commonly addressed by legal advisers to manage business risk through asset protection. Most of the risk in farm businesses occurs in the operations, so having assets owned by one or more legal entities that are separate to the operation of the farm business can be beneficial.
2.1.3. Supporting business successionSuccession is a complex issue for all businesses and can be particularly so for family farms. Succession involves the transfer of management and ownership of business operations and assets.
Traditionally, succession has been implemented at the point of retirement, although for many growers retirement is delayed until ill health forces the decision. An increasing number of farm businesses are now recognising the importance of early succession planning. Often this is triggered by key personal or farm business events5 such as:
• marriage;• birth of a child;• children finishing school;• taking on major debt;• significant financial loss, often as a result of a specific event or drought;• transfer of business responsibility, often when a child assumes full management
responsibility from parents; or• injury, illness or death of a family member.
Understanding the needs of the key people in the farm business and designing a business model to suit can simplify the succession process. A suitable model can enable growers to exit farming in a manner and timing of their choosing. It can also enable growers to continue their involvement in the business without relying on their physical capacity. Succession in the family farm business model is discussed further in Section 4.1.3.
MORE INFORMATION

FARM BUSINESS MODELS – OPTIONS FOR BUILDING YOUR FUTURE 15
GROWNOTES
FARM BUSINESS MODELSSECTION 2
Business structures for successionAn important component of the farm business model in relation to succession is the business structure. The business structure can include one or more legal entities such as sole trader, partnership, company or family trusts.
An appropriate business structure can provide a smooth pathway for the transfer of management and asset ownership in farm business succession. It can also provide asset protection, effective management of income taxation and provisions for off-farm family members6.
Growers should consult with qualified professional advisers to assess the specific financial, taxation and legal implications of entities for their own personal and business circumstances. Links to general resources can be found in Section 2.6.
IN FOCUS
2.1.4. Access to capitalFarm businesses are capital intensive with often high demands for growth, development and working capital.
There are currently few alternatives available for farm businesses to access capital7,8, with most Australian family farms funded by a combination of equity and debt finance9 (Figure 1). With sufficient equity, this approach is generally the simplest to establish and manage on an ongoing basis and often provides a cost-effective source of capital.
Recent data shows that 64 per cent of total capital in Australian farm businesses is supplied by internal equity funding through the business operator and their immediate family, with 22 per cent supplied by equity from an external source10.
SOURCE: SCHNEIDER, 201610 p – provisional data
FIGURE 1 Sources of farm business capital for Australian broadacre and dairyfarm businesses, 1994-95 to 2014-15.
Equity – operator and spouse Equity – other Debt
%100
90
80
70
60
50
40
30
20
10
0
1994
-95
1995
-96
1996
-97
1997
-98
1998
-99
1999
-200
0
2000
-01
2001
-02
2002
-03
2003
-04
2004
-05
2005
-06
2006
-07
2007
-08
2008
-09
2009
-10
2010
-11
2011-
12
2012
-13
2013
-1420
14-15
p
FARM BUSINESS MODELS – OPTIONS FOR BUILDING YOUR FUTURE16
GROWNOTES
FARM BUSINESS MODELS
6.2.4. Rural debt – current profile
6.2.5. Land values – trends and impact on capital requirements for farm business
6.2.6. Returns from agriculture compared with other asset classes
4.5.1. Access to capital through joint ventures
SECTION 2
Internal equity is generated by the farm business through appreciation of assets and retained profits. In some situations, farm succession can have a significant impact on internal equity available for capital, with a portion required to fund the retirement of older generations and provide for, or pay out, off-farm family members. The steady increase in land values in recent years has compounded this impact.
Sourcing capital through external equity can be complex to establish and manage and requires a return to the investor. It will therefore generally be more costly than debt finance.
However, the capacity for debt finance to fund capital requirements is limited, given the reliance on land as loan security and gearing ratios, such as the loan-to-value ratio, used by Australian banks. Trade finance is unable to meet the total working capital needs of farm businesses given the current level of debt9.
Access to capital is one of the primary barriers to farm business expansion and new entrants, particularly where there is insufficient internal equity. With the asset value of an average broadacre farm around $4 million, there are few opportunities using traditional farm business models for young people, outside family succession, and for new entrants to independently own and operate farm businesses11. However, opportunities do exist with alternative farm business models where only some of the farm business resources are provided by the owner, therefore reducing capital requirements for business operation. Contracting, share farming or leasing are typical examples. Options to access capital using these models are explored further in Section 4.
2.2. Step 2 – What do the key people in your farm business need?
When developing a farm business model, it is essential to consider the needs of all key people involved.
While the priority will naturally be to focus on people who own and/or manage the business, alternative farm business models involve other parties whose requirements also need to be considered to ensure a successful partnership. Other parties may include:
• investors;• landowners;• contractors;• lessees;• share farmers;• employees; and• advisers.
Alternative farm business models offer the opportunity to better match the business to the needs of the key people involved in the business. The needs will be diverse, but are likely to be based on:
• stage of life;• aspirations for lifestyle and associated level of involvement in the business; and• attitude to risk.
These are also important components of business succession planning, which may be one of the drivers behind developing an alternative business model, as addressed in Section 2.1.3.
Stage of life is not purely age dependent, as is often the case with retirement. It can also be defined by significant personal events, such as changing career or starting a family. Irrespective of the timing, these events have an influence on the suitability of different business models for the key people in a farm business.
Aspirations for lifestyle can change with stage of life. Management and operation of a farm business requires significant time and energy commitments. While there is some scope to manage the impact on lifestyle, inevitably a high level of involvement in the farm business will come at some cost to lifestyle.
MORE INFORMATION
FARM BUSINESS MODELS – OPTIONS FOR BUILDING YOUR FUTURE 17
GROWNOTES
FARM BUSINESS MODELSSECTION 2
Attitude to risk is personal and can range from wary to risk seeking; it may change according to stage of life and past experiences. Understanding the risk attitude of key people will help to identify their needs and pathways for working with others in the business. Ultimately, all key people need to be comfortable with the risks involved. Effective risk management is an integral part of running a successful farm business, providing the opportunity to maximise positive business outcomes, avoid or minimise losses and capitalise on opportunities.
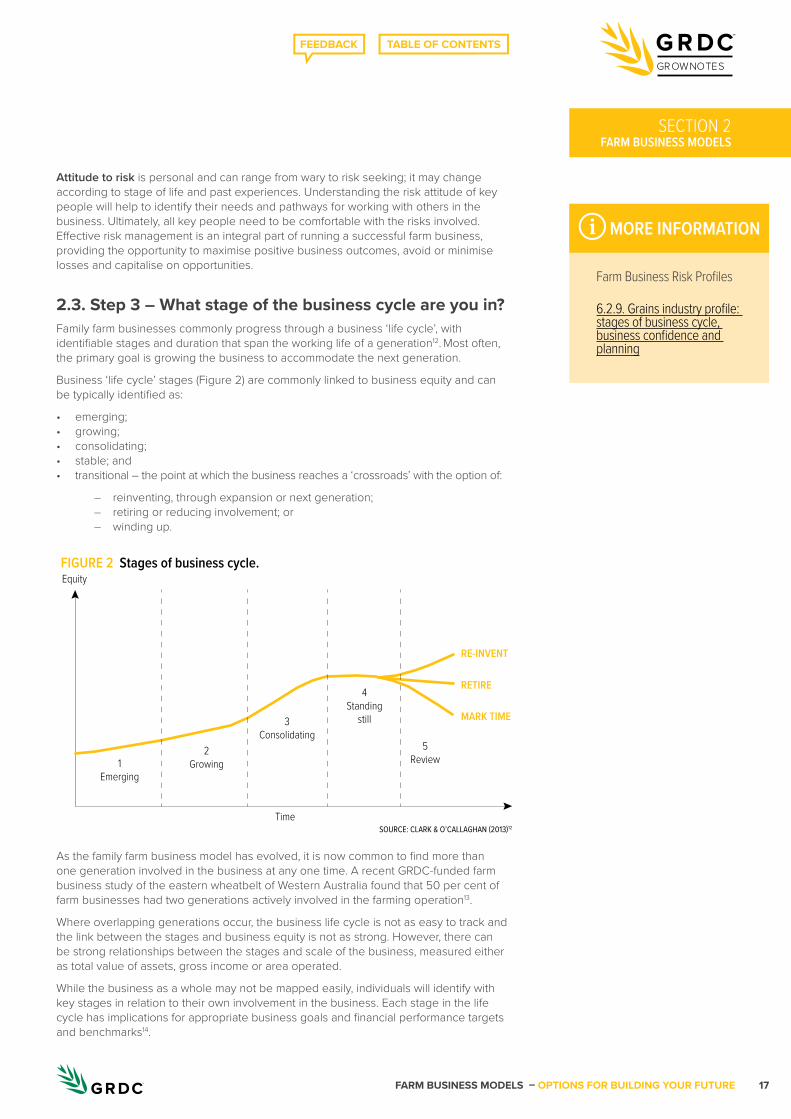
2.3. Step 3 – What stage of the business cycle are you in?Family farm businesses commonly progress through a business ‘life cycle’, with identifiable stages and duration that span the working life of a generation12. Most often, the primary goal is growing the business to accommodate the next generation.
Business ‘life cycle’ stages (Figure 2) are commonly linked to business equity and can be typically identified as:
• emerging;• growing;• consolidating;• stable; and• transitional – the point at which the business reaches a ‘crossroads’ with the option of:
– reinventing, through expansion or next generation; – retiring or reducing involvement; or – winding up.
As the family farm business model has evolved, it is now common to find more than one generation involved in the business at any one time. A recent GRDC-funded farm business study of the eastern wheatbelt of Western Australia found that 50 per cent of farm businesses had two generations actively involved in the farming operation13.
Where overlapping generations occur, the business life cycle is not as easy to track and the link between the stages and business equity is not as strong. However, there can be strong relationships between the stages and scale of the business, measured either as total value of assets, gross income or area operated.
While the business as a whole may not be mapped easily, individuals will identify with key stages in relation to their own involvement in the business. Each stage in the life cycle has implications for appropriate business goals and financial performance targets and benchmarks14.
SOURCE: CLARK & O’CALLAGHAN (2013)12
FIGURE 2 Stages of business cycle.Equity
Time
1Emerging
2Growing
3Consolidating
4Standing
still
RE-INVENT
RETIRE
MARK TIME
5Review
Farm Business Risk Profiles
6.2.9. Grains industry profile: stages of business cycle, business confidence and planning
MORE INFORMATION
FARM BUSINESS MODELS – OPTIONS FOR BUILDING YOUR FUTURE18
GROWNOTES
FARM BUSINESS MODELS
Farming the Business manual
AgProfit, a cloud-based farm business tool for budgeting, monitoring cash flow and benchmarking financial performance, is supported by the GRDC – www.agprofit.com.au
SECTION 2
2.4. Step 4 – What is your financial position?While the needs and aspirations of key people are critical when developing a farm business model, they do not always match the financial capacity of the business. Alternative farm business models may offer pathways to overcome financial constraints, depending on the business’s financial position or stage in the business life cycle.
The financial position of the business will influence the ability to:
• access capital; and• manage fluctuations in financial performance.
Where the financial position of the business is weak, with low equity and/or cash flow, the ability to access capital is limited. Alternative farm business models can:
• reduce capital requirements, accessing capital from other parties for growth, development and operations; and
• share costs and risks.
2.5. Step 5 – What farm resources do you have available?Assessing farm resources, including assets and operations, is a form of ‘stocktake’. The assessment is an effective process for developing a business model that can address capacity issues associated with over or under-utilisation.
Each resource, including land, water, livestock, machinery and labour, should be described in terms of:
• condition;• capacity;• suitability to the farm business; and• improvements or maintenance required.
For example, in a cropping business, machinery is a resource that may be over-utilised, resulting in poor timing of key operations. An alternative model may involve the use of machinery contractors. Alternatively, where existing machinery is under-utilised, excess capacity presents an opportunity to expand by contracting out machinery or accessing additional land through purchasing, leasing or share farming.
The key resources of a farm business are explored in detail in Section 3, including how each resource can be accessed in alternative farm business models and how to value their relative contribution to the business.
MORE INFORMATION
FARM BUSINESS MODELS – OPTIONS FOR BUILDING YOUR FUTURE 19
GROWNOTES
FARM BUSINESS MODELSSECTION 2
2.6. Useful links and additional information – assessing your farm business
Improving profitability
6.2.1. Productivity growth in Australian agriculture
How to make good farm expansion decisions – www.grdc.com.au/Research-and-Development/GRDC-Update-Papers/2015/03/How-to-make-good-farm-expansion-decisions
Farm decision making – https://grdc.com.a.u/FarmDecisionMaking
Business succession
6.2.3. Farm business succession – baby boomers handing over the ‘reins’
A Guide to Succession: Sustaining farm families and farms – www.grdc.com.au/GRDC-Guide-Succession-SustainingFamiliesAndFarms
Succession planning fact sheet – www.grdc.com.au/GRDC-FS-SuccessionPlanning
Access to capital
6.2.4. Rural debt – current profile
6.2.5. Land values – trends and impact on capital requirements for farm business
6.2.6. Returns from agriculture compared with other asset classes
6.2.7. Access to capital for farm businesses elsewhere around the world75
Needs of key people
Farm Business Risk Profiles – www.grdc.com.au/GRDC-FS-FarmBusinessRiskProfiles
Business life cycle
6.2.8. Stage of business cycle and implications for business goals and performance targets
6.2.9. Grains industry profile: stages of business cycle, business confidence and planning
Financial position, assessment of financial performance and resource utilisation
Farming the Business manual – www.grdc.com.au/Resources/Publications/2015/01/Farming-the-Business-Manual
AgProfit farm performance analysis and benchmarking – www.agprofit.com.au
Farm business costs fact sheet – www.grdc.com.au/FBM-FarmBusinessCosts
Machinery investment and costs fact sheet – www.grdc.com.au/FBM-MachineryInvestmentAndCosts
Cost of production fact sheet – www.grdc.com.au/GRDC-FS-CostOfProduction
General
Farm business decision-making – www.grdc.com.au/FarmDecisionMaking
Farm business management, GRDC Ground Cover Supplement – www.grdc.com.au/GCS107
GRDC Farm Business Update newsletters – www.grdc.com.au/Media-Centre/GRDC-E-Newsletters/GRDC-Farm-Business-Update-Newsletters
Videos
Farm business models case studies – www.grdc.com.au/farm-business-models-playlist

FARM BUSINESS MODELS – OPTIONS FOR BUILDING YOUR FUTURE20
GROWNOTES
FARM BUSINESS MODELSSECTION 3
SECTION 3
Farm resources – how can you access them more effectively?Farm resources can be broadly categorised into ‘assets’ and ‘operations’. Farm assets include land, water and livestock, while operations encompass management, labour and machinery.
3.1 Separating farm assets and operationsFarm assets and operations are commonly separated in a business structure to protect assets from operational risks (Section 2.1.2).
However, it is also beneficial to separate assets and operations in a farm business model to allow greater flexibility in management and rewarding contributions. The ability to define the relative contributions associated with each farm resource, value them and provide a reward is critical to the success of farm business models.
In the traditional family farm model, farm assets and farming operations, including management and labour, are usually provided solely by the family. The contribution each resource makes to the farm business is typically not specifically or fully valued and rewarded.
In alternative models, farm assets and farming operations are separated so that some can be provided by the business and the balance by other parties, with each party being rewarded for their respective contributions.
Corporate farming is based on the separation of farm business resources, with clear separation of farm asset ownership, business management and reliance on employed labour for farming operations2.
An increasing number of family farms are evolving towards the corporate model through changes to some of the business resources. Sometimes referred to as ‘family corporates’, many of these businesses operate with formal board and administrative structures as well as employed staff1.
Where a farm’s assets are provided by different parties within the business model, it is important to link their ownership through a suitable business structure, using legal advice. Where farming operations are provided by different parties, an agreement can be used rather than a formal business structure. Share farming is a common example of an agreement covering the contribution of farming operations including management, labour and machinery.
SECTION 3
FARM BUSINESS MODELS – OPTIONS FOR BUILDING YOUR FUTURE 21
GROWNOTES
FARM BUSINESS MODELS
3.2 Exploring farm resources in detailWithin the categories of assets and operations, farm business resources can be broken down into:
• land;• irrigation water, where applicable;• livestock, where applicable;• management;• labour and machinery; and• capital.
In the traditional family farm model, these resources are typically provided internally by the farm owner(s). Although the family farm model has generally served Australian agriculture well, there are situations where accessing certain assets and operations externally will deliver a better outcome for the finances of and key people involved in the farm business.
The following sections explore these resources in relation to farm business models, including how they can be accessed for use in the business and how to value their relative contributions to the business. A summary is provided in Table 3.
Separating farm business assets and operationsFarm business models that separate assets and operations are more likely to be successful in:
• business risk management (see Section 2.1.2);• farm succession planning (see Section 2.1.3); and• increasing the access to capital for the business, including external
investors (see Section 2.1.4).
Basic principles of the farm business modelThe following principles are critical to the success of farm business models:
• the farm business can be broken down into business resources;• the resources help define the relative contributions to the farm
business; and• the contributions to the farm business can be valued and rewarded.
Land is the most common example of a resource that is valued and rewarded. Lease payments made under lease agreements are a ‘reward’ for the contribution of land as a key resource to a farm business.
IN FOCUS
FARM BUSINESS MODELS – OPTIONS FOR BUILDING YOUR FUTURE22
GROWNOTES
FARM BUSINESS MODELSSECTION 3
3.2.1. LandThe significant relative value of land and associated infrastructure, compared to other farm resources, means it plays a major role in developing a suitable farm business model.
In a traditional family farm business, the land is owned and operated by the family. However, separating ownership of the land from the farming operations and accessing land through an external party provides an opportunity to reduce capital requirements of the business and/or use the capital elsewhere. This can have benefits for:
• new entrants to farming, who can operate a farm business through leasing or share farming without the capital required to purchase land; and
• existing farm businesses, which can expand their operations through leasing or share farming with little or no additional capital investment other than working capital.
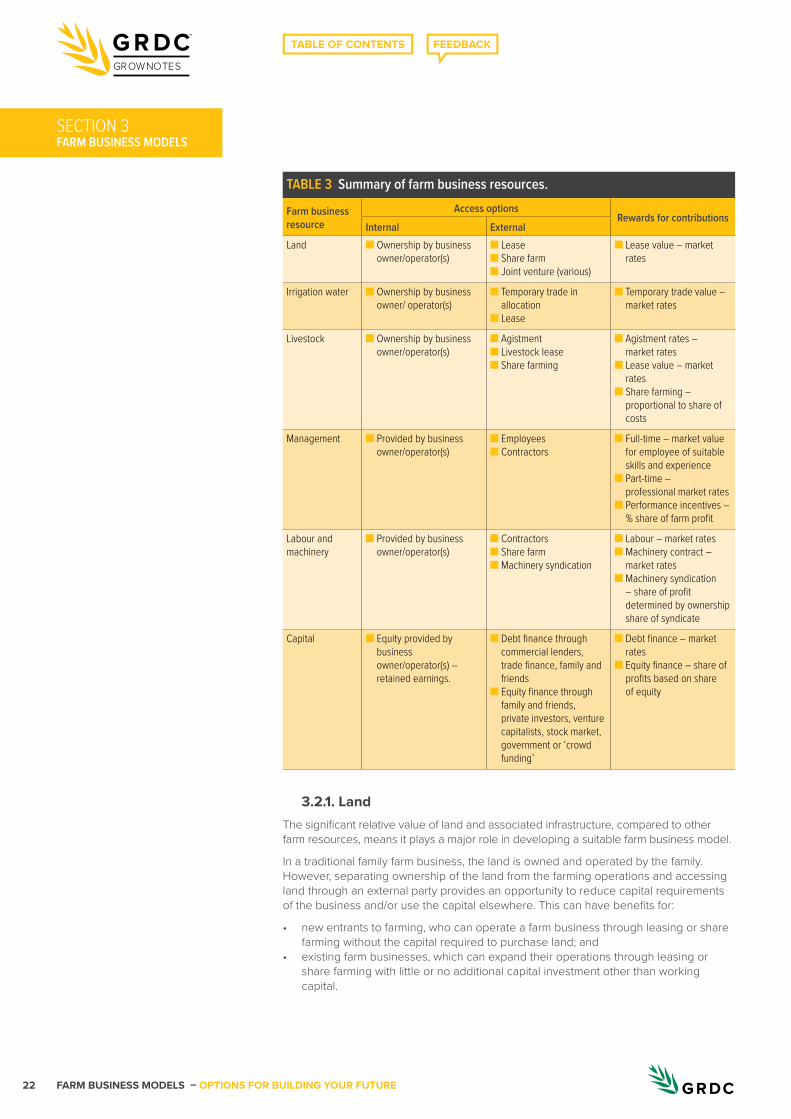
TABLE 3 Summary of farm business resources.
Farm business resource
Access optionsRewards for contributions
Internal ExternalLand ■ Ownership by business
owner/operator(s)■ Lease■ Share farm■ Joint venture (various)
■ Lease value – market rates
Irrigation water ■ Ownership by business owner/ operator(s)
■ Temporary trade in allocation
■ Lease
■ Temporary trade value – market rates
Livestock ■ Ownership by business owner/operator(s)
■ Agistment■ Livestock lease■ Share farming
■ Agistment rates – market rates
■ Lease value – market rates
■ Share farming – proportional to share of costs
Management ■ Provided by business owner/operator(s)
■ Employees■ Contractors
■ Full-time – market value for employee of suitable skills and experience
■ Part-time – professional market rates
■ Performance incentives – % share of farm profit
Labour and machinery
■ Provided by business owner/operator(s)
■ Contractors■ Share farm■ Machinery syndication
■ Labour – market rates■ Machinery contract –
market rates■ Machinery syndication
– share of profit determined by ownership share of syndicate
Capital ■ Equity provided by business owner/operator(s) – retained earnings.
■ Debt finance through commercial lenders, trade finance, family and friends
■ Equity finance through family and friends, private investors, venture capitalists, stock market, government or ‘crowd funding’
■ Debt finance – market rates
■ Equity finance – share of profits based on share of equity
SECTION 3
FARM BUSINESS MODELS – OPTIONS FOR BUILDING YOUR FUTURE 23
GROWNOTES
FARM BUSINESS MODELS
The benefits of accessing land through an external party, including lower capital requirements and reduced financial risk, need to be weighed up against the negatives of not owning land. Land ownership provides a potential source of financial return through growth in land values, as well as business equity and security for capital borrowings.
Farm businesses can access land through:
1. internal ownership – where land is owned by the operator, as in a traditional family farm model. Although there may be separate entities for land ownership (for example partnerships or trusts), members of the farm family are connected to the ownership structures and are therefore the common link; and
2. external ownership – where land is accessed through leasing, share farming or joint ventures. Joint ventures offer the opportunity for a mixture of internal and external ownership or solely external ownership.
The capital requirements for land are directly related to internal or external ownership. Internal ownership requires capital for land to be provided by the farm business using either internal equity or debt finance. Internal equity is limited by ‘self-funding’ options such as business revenue or contributions from business members. External ownership enables opportunities for sourcing capital from external parties in return for equity in the land and/or business operations.
Complexities can occur where there is a combination of internal and external ownership of land; for example, in some joint ventures. Land owned in the name of internal and external parties needs to be ‘sold’ to the remaining party. This sale incurs costs and taxes that should be accounted for in the exit arrangements of a farm business model (discussed in Section 4.5.3).
Rewarding land contributions in a farm business model
Land contributions can be directly equated to an equivalent ‘lease value’, even though the farm business model may not be based on leasing land. Leasing is the alternative to internal ownership, so it is an appropriate way to value the contribution or opportunity cost; that is, what could have been earned or paid if the land was leased.
Land lease values are determined through one of the following:
• percentage of the land’s market value – while this method was originally intended to reflect returns from alternative investments, it has since lost that relevance. Cropping land leases once valued at five to eight per cent of the land’s market value can now be as high as seven to nine per cent, depending on market value. In some circumstances, the market value of the land will include allowances for fencing and livestock water, but exclude structural improvements if they are not available to or utilised by the lessee;
• fixed rate per unit of production – an agreed rate per hectare is paid by the lease holder based on actual production (per tonne of grain) and stocking rate (per head) (where livestock are run); or
• proportion of financial returns – the lease value is an agreed ‘share’ of financial returns. The relative profitability of operating the land is commonly determined by calculating the crop and livestock gross margins; that is, gross income less costs directly attributable to the enterprise.
For the purposes of valuing the contribution of land to the business, the percentage of market value is the simplest to calculate and apply. However, without a link to production or financial returns, it has the potential to over or underestimate the value of the land and its contribution to the farm business. Values equivalent to seven to nine per cent of the market value are likely to exceed what could be viewed as a fair return for the relative contributions to the overall business and exposure to risk.
6.2.5. Land values – trends and impact on capital requirements for farm business
6.4.4. What proportion of total farm capital is attributed to land?
MORE INFORMATION
SECTION 3
FARM BUSINESS MODELS – OPTIONS FOR BUILDING YOUR FUTURE24
GROWNOTES
FARM BUSINESS MODELS
3.2.2. Irrigation waterFor irrigation businesses, water can be considered as both an asset and an enterprise input as it can be purchased to meet crop and pasture requirements.
Markets for irrigation water allow the effective trade of permanent water entitlements and seasonal allocations. This enables efficient pricing and transfer of water resources between irrigators.
Irrigation growers have come to rely on water trading as a means of allocating water to its best, and usually highest, value uses. Water trading is an important tool for irrigators in making production, investment and risk management decisions. It is valuable in a variety of seasonal conditions, not just as a reactive response to droughts. Irrigators have used water markets to tailor water entitlement ownership and trading strategies to suit their business objectives and financial situations15. In this way, water has become an integral part of their individual farm business models.
Farm businesses can access irrigation water through:
1. internal ownership – where water is owned by the operator; and
2. external ownership – where water is accessed through the purchase of allocation, or temporary trade, on a seasonal basis to meet irrigated crop and pasture requirements. Alternatively, water can be accessed through leasing entitlements for a term that spans multiple seasons.
Rewarding irrigation water contributions in a farm business model
Water contributions can be valued based on the current water market, using market values for temporary trade if the water is supplied on a seasonal basis, or leasing entitlement values for longer-term supply.
3.2.3. LivestockLivestock is unique in that it may be an enterprise in its own right or a management tool used in cropping systems for tasks such as complementing herbicides in controlling weeds or to justify a pasture phase as a break in the cropping sequence.
Farm businesses can access livestock through:
1. internal ownership where livestock is owned by the operator, typically where livestock is an integral enterprise of the farm business; and
2. external ownership, most commonly through agistment, although options are available for livestock share farming or leasing. Agistment allows livestock to be accessed as a management tool in cropping systems, rather than a long-term enterprise.
Leasing livestock is relatively uncommon in extensive livestock industries, but is becoming more common in the dairy industry. Similar to the ‘CowBank’ concept used for dairy cattle, the potential for ‘EweBank’ was explored in a recent study for the sheep industry by the Department of Agriculture and Food, Western Australia (DAFWA)16. Under this model, a company would finance the upfront purchase of ewes and lease them to a producer over an agreed term. The producer pays monthly operating lease payments, which are tax deductible, with the option to purchase the ewes at residual value at the end of the lease. This is similar to machinery finance.
6.3.1. Irrigation water as a farm business asset and enterprise input
MORE INFORMATION
SECTION 3
FARM BUSINESS MODELS – OPTIONS FOR BUILDING YOUR FUTURE 25
GROWNOTES
FARM BUSINESS MODELS
Rewarding livestock contributions in a farm business model
The appropriate approach to valuing the contribution of livestock to a farm business depends on whether it is an enterprise in its own right or a management tool for use in cropping systems.
For true sheep enterprises owned by the farm business, livestock leasing values could be used as a guide. Indicative values and terms of agreements could be sought from the leasing models used in the dairy industry.
For livestock share farming, the proceeds of progeny and wool sales are commonly shared in the same proportion as the contribution to production costs. Costs can include labour, feed and reduction in value of breeding stock (difference in value between introduction to the breeding herd/flock and the value when culled). Feed costs include supplements, valued at purchase cost or market value if produced on-farm, and grazing crops and pastures, valued at agistment rates based on feed quality and quantity. The livestock owner supplies the breeding stock and replacements.
3.2.4. ManagementIn the family farm model, the business is generally managed internally by one or more family members, although additional support may be provided by external advisers.
Some farm business models rely on significant external management input, including employment of management personnel or contract managers. In both North America and Europe, professional farm management consultants are commonly engaged to manage farm businesses on behalf of absentee farm business owners.
Farm businesses can be managed through:
1. internal management by the owner; and/or
2. external management by employees, professional management contractors or a combination of both.
Rewarding management in a farm business model
Farm business management is best valued at the market rate for external managers, either as a permanent employee, where management is a full-time role, or as a professional contractor for part-time management.
3.2.5. Labour and machineryFor the purpose of assessing farm business models, labour and machinery are considered together as they are often provided as one service; for example, through machinery contracting or share farming.
Labour efficiency is often claimed to be higher in the family farm model, on the basis that family labour is motivated to work harder and longer due to the added profit incentive associated with farm ownership1.
However, there is evidence that high levels of labour efficiency are achievable with other farm business models.
Farm businesses can access labour and machinery through:
1. internal provision of labour, with machinery owned by the business as typical of family farms; and
2. external provision of labour through employment, contracting or share farming, with machinery accessed through contracting or machinery syndication.
6.3.2. Role of livestock in mixed farming businesses
6.3.3. Livestock leasing – ‘CowBank’ (commercial product) and ‘EweBank’ (proposal)
6.3.4. High labour efficiency can be achieved with models other than family farms
6.4.7. What proportion of total farm capital is attributed to machinery?
MORE INFORMATION
MORE INFORMATION
SECTION 3
FARM BUSINESS MODELS – OPTIONS FOR BUILDING YOUR FUTURE26
GROWNOTES
FARM BUSINESS MODELS
Rewarding labour and machinery contributions in a farm business model
Labour inputs are best valued at the market rate for both internal and external labour, using:
• permanent employee where full-time labour is required;• casual employee where only part-time labour is required; or• contractor where specific skills/experience and tools/equipment are required.
Where machinery is syndicated, rewards are generally based on the share of ownership of the syndicate.
3.2.6. CapitalCapital is required by farm businesses for asset ownership, growth, development and ongoing business operations, or working capital. As described in Section 2.1.4, access to capital is one of the primary barriers to farm expansion and new entrants to the industry.
With alternative farm business models, opportunities exist for reducing the capital required by the farm business operator; for example, through contracting, share farming, leasing or equity partnerships.
Farm businesses can access capital using:
1. Debt financed through:
• financial institutions such as banks;• finance companies;• suppliers, through trade credit;• customers, through product sales; and• private loans from family or friends.
2. Equity sourced:
• internally through retained earnings; or• externally, in return for a share of business ownership and profits, through: – family or friends; – private investors with no existing relationship to the farm business; – venture capitalists/other businesses; – stock market, through initial public offerings; – government, through business grants; and – ‘crowdfunding’17,18.
Debt
The amount of debt finance available for capital will be limited by business equity. As total borrowings for a business increase, with no change in asset values, business equity declines and the financing risk is greater. Lenders will typically limit capital finance when equity is in the range of 50 to 70 per cent, requiring historical and forecast trading results to demonstrate sufficient cash flow to service the debt. Most lenders will be reluctant to provide new lending where business equity falls below 50 per cent, although this will depend on individual business circumstances.
It is also important to remember that the use of debt finance involves the business owner assuming all risk for the capital utilised by the business. There are limits to the amount of risk that can be taken on by farm businesses without affecting financial sustainability and personal health and wellbeing.
SECTION 3
FARM BUSINESS MODELS – OPTIONS FOR BUILDING YOUR FUTURE 27
GROWNOTES
FARM BUSINESS MODELS
Equity
The complexities of exchanging equity and future profits for capital means external equity is not commonly sourced by farm businesses, other than through family or friends.
However, private investors are readily accessible and can be sourced through a variety of internet-based service providers for mid-market investments in farm businesses, ranging from $5 million to $100 million (see Section 3.3). Alternatively, ‘crowdfunding’ uses social media platforms for businesses to market their business and equity offer. There are two distinct crowdfunding models that are based either on donations or an investment with expectation of a return; investing through crowdfunding is a relatively new chapter in the crowdfunding story and is increasing rapidly18.
Total funds sourced through crowdfunding platforms have increased two-fold or greater every year since their emergence, with US$34.4 billion (A$44.7 billion) raised in 201519. At first glance, crowdfunding for capital to invest in agriculture would seem to be a pathway to a practically limitless source of funds. However, the regulations in place around equity crowdfunding limit its applicability for agriculture within Australia to public (unlisted) companies with assets or income of less than $5 million18.
While both the above options are non-traditional and have some complexities and potential risks, there are examples of farm businesses that have accessed capital using these pathways.
Attracting external equity requires investors to fully understand the opportunities and challenges associated with the Australian farm sector. Compared with investment elsewhere in the world, the Australian farm sector offers relative economic stability, access to proven technology and management practices, managerial skills of farm business managers, and regional trade opportunities for farm exports7. However, these need to be considered against the potential negative influences on farm production, particularly climate variability.
Rewarding capital contributions in a farm business model
Rewarding contributions of debt finance are specific to the financing agreement, usually comprising interest paid and other costs as set out in the agreement.
Equity capital is generally rewarded via entitlements to future farm business profits. The share of profit to an equity partner generally reflects the relative share of equity in the business.
3.2.7. Reflection and summaryOne of the most critical times to review the farm business model is when expansion is being considered. Using the farm business resources as a guide, an initial checklist can be run through.
• Land (and water)
– Is the expansion permanent? Or is there value in having flexibility to scale down after a period?
– What is the relative return from use of the land (and/or water) in the farm business?
– What is the long-term outlook for capital growth in land (and/or water) values?
• Livestock
– Does the farm business have sufficient equity to fund the purchase of the livestock?

SECTION 3
FARM BUSINESS MODELS – OPTIONS FOR BUILDING YOUR FUTURE28
GROWNOTES
FARM BUSINESS MODELS
• Management, labour and machinery
– Is there sufficient management, labour and machinery capacity to run the expanded operations?
• Capital
– Does the farm business have sufficient equity and cash flow to fund the capital requirements for the expansion?
Sticking with a traditional family farm business, all the ‘boxes’ for the above checklist should be ‘ticked’. If not, considering alternative farm business models opens up opportunities for business expansion where it would not be possible under the current farm business model.
3.3. Useful links and additional information – farm resources
Land:
Ashby, RG et al (2016), Is agricultural land a good investment? Decisions on farm land tenure: buying, leasing and the alternatives. Proceedings, GRDC Farm Business Update – www.grdc.com.au/Research-and-Development/GRDC-Update-Papers/2016/03/Is-agricultural-land-a-good-investment
Irrigation water:
6.3.1. Irrigation water as a farm business asset and enterprise input
Livestock:
6.3.2. Role of livestock in mixed farming businesses
6.3.3. Livestock leasing – ‘CowBank’ (commercial product) and ‘EweBank’ (proposal)
Management:
Valuing family drawings and your management, GRDC fact sheet – www.grdc.com.au/GRDC-FS-ValuingManagement
Labour and machinery:
6.3.4. High labour efficiency can be achieved with models other than family farms
Capital:
Examples of internet-based service providers facilitating private investment in businesses
• www.businessangels.com.au
• www.domacom.com.au
• www.neu.capital
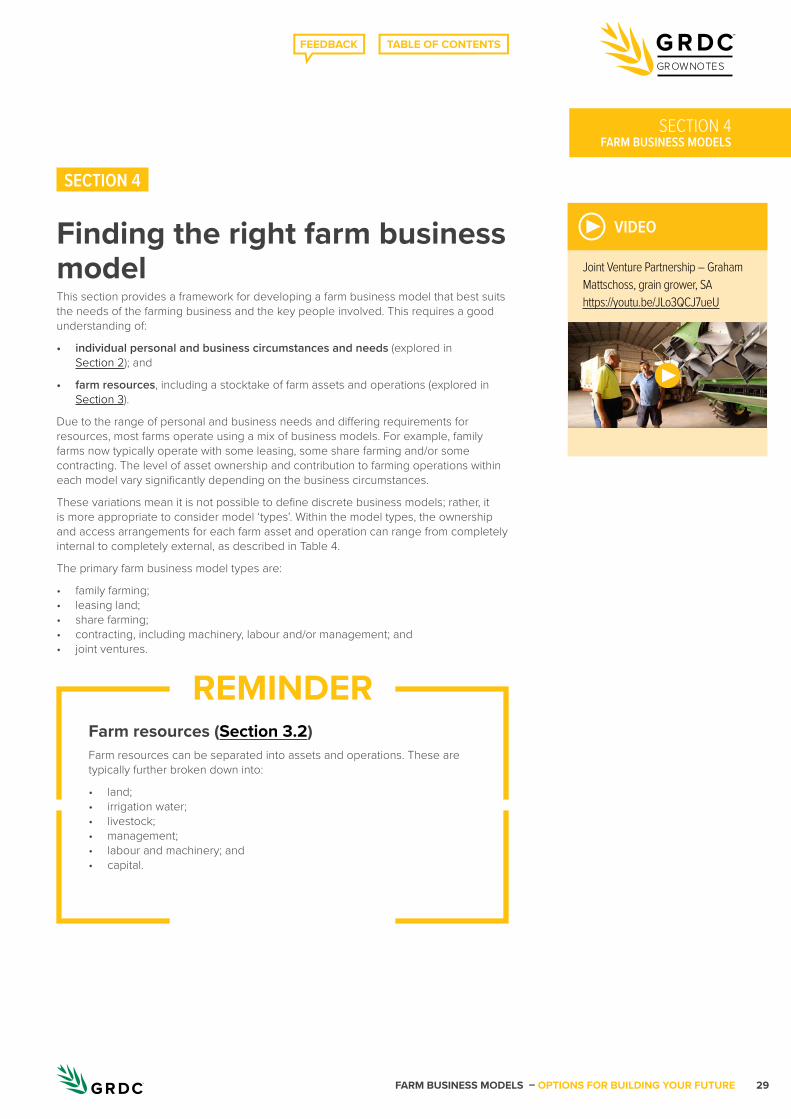
FARM BUSINESS MODELS – OPTIONS FOR BUILDING YOUR FUTURE 29
GROWNOTES
FARM BUSINESS MODELSSECTION 4
Farm resources (Section 3.2)Farm resources can be separated into assets and operations. These are typically further broken down into:
• land;• irrigation water;• livestock;• management;• labour and machinery; and• capital.
REMINDER
SECTION 4
Finding the right farm business modelThis section provides a framework for developing a farm business model that best suits the needs of the farming business and the key people involved. This requires a good understanding of:
• individual personal and business circumstances and needs (explored in Section 2); and
• farm resources, including a stocktake of farm assets and operations (explored in Section 3).
Due to the range of personal and business needs and differing requirements for resources, most farms operate using a mix of business models. For example, family farms now typically operate with some leasing, some share farming and/or some contracting. The level of asset ownership and contribution to farming operations within each model vary significantly depending on the business circumstances.
These variations mean it is not possible to define discrete business models; rather, it is more appropriate to consider model ‘types’. Within the model types, the ownership and access arrangements for each farm asset and operation can range from completely internal to completely external, as described in Table 4.
The primary farm business model types are:
• family farming;• leasing land;• share farming;• contracting, including machinery, labour and/or management; and• joint ventures.
▶ VIDEO
Joint Venture Partnership – Graham Mattschoss, grain grower, SA https://youtu.be/JLo3QCJ7ueU
▶
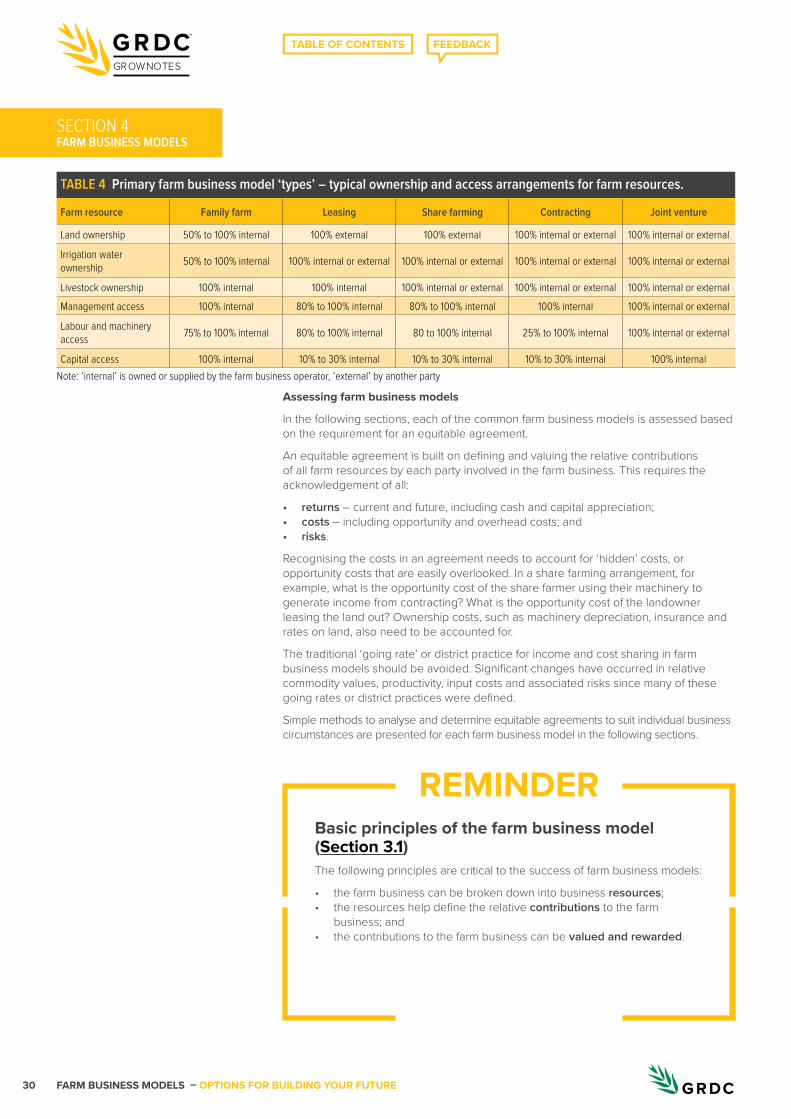
FARM BUSINESS MODELS – OPTIONS FOR BUILDING YOUR FUTURE30
GROWNOTES
FARM BUSINESS MODELSSECTION 4
Basic principles of the farm business model (Section 3.1)The following principles are critical to the success of farm business models:
• the farm business can be broken down into business resources;• the resources help define the relative contributions to the farm
business; and• the contributions to the farm business can be valued and rewarded.
REMINDER
Assessing farm business models
In the following sections, each of the common farm business models is assessed based on the requirement for an equitable agreement.
An equitable agreement is built on defining and valuing the relative contributions of all farm resources by each party involved in the farm business. This requires the acknowledgement of all:
• returns – current and future, including cash and capital appreciation;• costs – including opportunity and overhead costs; and• risks.
Recognising the costs in an agreement needs to account for ‘hidden’ costs, or opportunity costs that are easily overlooked. In a share farming arrangement, for example, what is the opportunity cost of the share farmer using their machinery to generate income from contracting? What is the opportunity cost of the landowner leasing the land out? Ownership costs, such as machinery depreciation, insurance and rates on land, also need to be accounted for.
The traditional ‘going rate’ or district practice for income and cost sharing in farm business models should be avoided. Significant changes have occurred in relative commodity values, productivity, input costs and associated risks since many of these going rates or district practices were defined.
Simple methods to analyse and determine equitable agreements to suit individual business circumstances are presented for each farm business model in the following sections.
TABLE 4 Primary farm business model ‘types’ – typical ownership and access arrangements for farm resources.
Farm resource Family farm Leasing Share farming Contracting Joint venture
Land ownership 50% to 100% internal 100% external 100% external 100% internal or external 100% internal or external
Irrigation water ownership 50% to 100% internal 100% internal or external 100% internal or external 100% internal or external 100% internal or external
Livestock ownership 100% internal 100% internal 100% internal or external 100% internal or external 100% internal or external Management access 100% internal 80% to 100% internal 80% to 100% internal 100% internal 100% internal or external
Labour and machinery access 75% to 100% internal 80% to 100% internal 80 to 100% internal 25% to 100% internal 100% internal or external
Capital access 100% internal 10% to 30% internal 10% to 30% internal 10% to 30% internal 100% internal Note: ‘internal’ is owned or supplied by the farm business operator, ‘external’ by another party
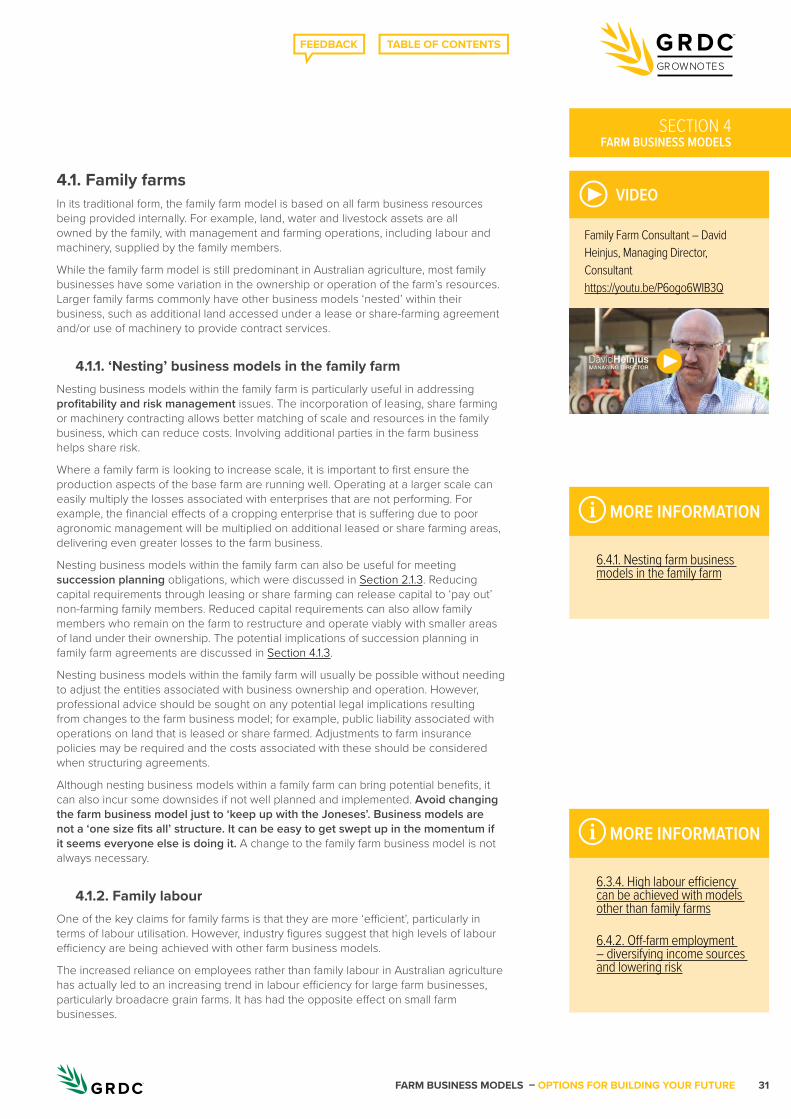
FARM BUSINESS MODELS – OPTIONS FOR BUILDING YOUR FUTURE 31
GROWNOTES
FARM BUSINESS MODELSSECTION 4
4.1. Family farmsIn its traditional form, the family farm model is based on all farm business resources being provided internally. For example, land, water and livestock assets are all owned by the family, with management and farming operations, including labour and machinery, supplied by the family members.
While the family farm model is still predominant in Australian agriculture, most family businesses have some variation in the ownership or operation of the farm’s resources. Larger family farms commonly have other business models ‘nested’ within their business, such as additional land accessed under a lease or share-farming agreement and/or use of machinery to provide contract services.
4.1.1. ‘Nesting’ business models in the family farmNesting business models within the family farm is particularly useful in addressing profitability and risk management issues. The incorporation of leasing, share farming or machinery contracting allows better matching of scale and resources in the family business, which can reduce costs. Involving additional parties in the farm business helps share risk.
Where a family farm is looking to increase scale, it is important to first ensure the production aspects of the base farm are running well. Operating at a larger scale can easily multiply the losses associated with enterprises that are not performing. For example, the financial effects of a cropping enterprise that is suffering due to poor agronomic management will be multiplied on additional leased or share farming areas, delivering even greater losses to the farm business.
Nesting business models within the family farm can also be useful for meeting succession planning obligations, which were discussed in Section 2.1.3. Reducing capital requirements through leasing or share farming can release capital to ‘pay out’ non-farming family members. Reduced capital requirements can also allow family members who remain on the farm to restructure and operate viably with smaller areas of land under their ownership. The potential implications of succession planning in family farm agreements are discussed in Section 4.1.3.
Nesting business models within the family farm will usually be possible without needing to adjust the entities associated with business ownership and operation. However, professional advice should be sought on any potential legal implications resulting from changes to the farm business model; for example, public liability associated with operations on land that is leased or share farmed. Adjustments to farm insurance policies may be required and the costs associated with these should be considered when structuring agreements.
Although nesting business models within a family farm can bring potential benefits, it can also incur some downsides if not well planned and implemented. Avoid changing the farm business model just to ‘keep up with the Joneses’. Business models are not a ‘one size fits all’ structure. It can be easy to get swept up in the momentum if it seems everyone else is doing it. A change to the family farm business model is not always necessary.
4.1.2. Family labourOne of the key claims for family farms is that they are more ‘efficient’, particularly in terms of labour utilisation. However, industry figures suggest that high levels of labour efficiency are being achieved with other farm business models.
The increased reliance on employees rather than family labour in Australian agriculture has actually led to an increasing trend in labour efficiency for large farm businesses, particularly broadacre grain farms. It has had the opposite effect on small farm businesses.
6.3.4. High labour efficiency can be achieved with models other than family farms
6.4.2. Off-farm employment – diversifying income sources and lowering risk
6.4.1. Nesting farm business models in the family farm
MORE INFORMATION
MORE INFORMATION
▶ VIDEO
Family Farm Consultant – David Heinjus, Managing Director, Consultant https://youtu.be/P6ogo6WIB3Q
▶

FARM BUSINESS MODELS – OPTIONS FOR BUILDING YOUR FUTURE32
GROWNOTES
FARM BUSINESS MODELSSECTION 4
When assessing the labour requirements for a family farm, consider the potential for off-farm employment. While not applicable in all situations, off-farm employment has the potential to utilise ‘surplus’ family labour without any requirements for additional capital or risk exposure. Where surplus family labour is used for machinery contracting, it is important to ensure that the family business is not compromised; for example, competing for timeliness of operations that exposes the business to production risk.
4.1.3. Establishing an equitable family farm agreementFamily farm businesses have traditionally operated without formal business structures and agreements. This was often seen as a strength because of increased flexibility in management and business operations.
However, when dealing with multiple family members and generations, the lack of a formal agreement can result in the benefits of flexibility being outweighed by the risks. Without a clear plan and shared understanding of the day-to-day and longer-term strategic business direction, inefficiencies can creep into business operations. The incentives of business ownership can be eroded if family members do not feel valued or do not have recognised roles and rewards within the business.
Improved succession planning has contributed to an increasing level of structured agreements in family businesses, often occurring earlier in business cycles or when a new generation enters the business. In many succession plans, it is now common for the farm assets to be divided equally, in terms of value, between children. While there is strong reasoning for equality in entitlement, the results may not be equitable for family members remaining on the farm. The principles of equality are contributing to the decline in farm numbers and rising farm debt. There are two competing factors at play within succession:
• succession planning tends to lead to smaller farms as a result of dividing up the farm, or farms, with significant debt levels from paying out off-farm family members; and
• increased scale is required for a viable farm business.
For family farms, it is important to establish an equitable agreement within the family business first, before creating agreements with external parties.
Following are some of the key areas that need to be addressed in family farm business agreements (summarised in Table 5).
▶ VIDEO
Family Farm – Simon Ballinger, grain grower, SA https://youtu.be/N3E0zT7l7kc
▶
TABLE 5 Developing a family farm business model – summary.
Do Don’t
Consider developing and nesting other business models within the family farm
Make changes to a farm business model that are not linked to a specific purpose
Make changes to the family farm model that provide for the needs of the business and key people involved
Increase the scale of a business that is not already performing well due to production issues
Consider implications of any changes to the model for liability and risk
Make changes to the farm business model without understanding the capacity of current resources
Consider off-farm employment as a valid component of the farm business model
Plan and budget to assess the impacts of any changes to the farm business model
Clearly define the roles and responsibilities of all family members; don’t make assumptions!
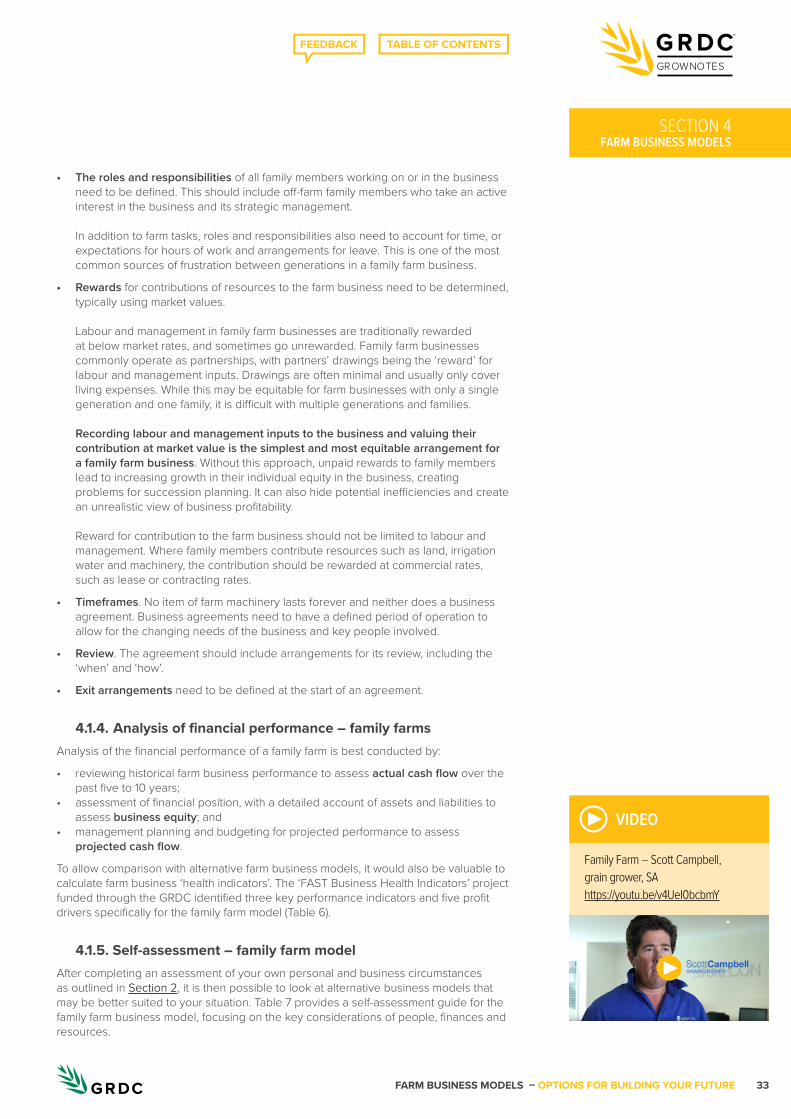
FARM BUSINESS MODELS – OPTIONS FOR BUILDING YOUR FUTURE 33
GROWNOTES
FARM BUSINESS MODELSSECTION 4
• The roles and responsibilities of all family members working on or in the business need to be defined. This should include off-farm family members who take an active interest in the business and its strategic management. In addition to farm tasks, roles and responsibilities also need to account for time, or expectations for hours of work and arrangements for leave. This is one of the most common sources of frustration between generations in a family farm business.
• Rewards for contributions of resources to the farm business need to be determined, typically using market values. Labour and management in family farm businesses are traditionally rewarded at below market rates, and sometimes go unrewarded. Family farm businesses commonly operate as partnerships, with partners’ drawings being the ‘reward’ for labour and management inputs. Drawings are often minimal and usually only cover living expenses. While this may be equitable for farm businesses with only a single generation and one family, it is difficult with multiple generations and families. Recording labour and management inputs to the business and valuing their contribution at market value is the simplest and most equitable arrangement for a family farm business. Without this approach, unpaid rewards to family members lead to increasing growth in their individual equity in the business, creating problems for succession planning. It can also hide potential inefficiencies and create an unrealistic view of business profitability. Reward for contribution to the farm business should not be limited to labour and management. Where family members contribute resources such as land, irrigation water and machinery, the contribution should be rewarded at commercial rates, such as lease or contracting rates.
• Timeframes. No item of farm machinery lasts forever and neither does a business agreement. Business agreements need to have a defined period of operation to allow for the changing needs of the business and key people involved.
• Review. The agreement should include arrangements for its review, including the ‘when’ and ‘how’.
• Exit arrangements need to be defined at the start of an agreement.
4.1.4. Analysis of financial performance – family farmsAnalysis of the financial performance of a family farm is best conducted by:
• reviewing historical farm business performance to assess actual cash flow over the past five to 10 years;
• assessment of financial position, with a detailed account of assets and liabilities to assess business equity; and
• management planning and budgeting for projected performance to assess projected cash flow.
To allow comparison with alternative farm business models, it would also be valuable to calculate farm business ‘health indicators’. The ‘FAST Business Health Indicators’ project funded through the GRDC identified three key performance indicators and five profit drivers specifically for the family farm model (Table 6).
4.1.5. Self-assessment – family farm modelAfter completing an assessment of your own personal and business circumstances as outlined in Section 2, it is then possible to look at alternative business models that may be better suited to your situation. Table 7 provides a self-assessment guide for the family farm business model, focusing on the key considerations of people, finances and resources.
▶ VIDEO
Family Farm – Scott Campbell, grain grower, SA https://youtu.be/v4UeI0bcbmY
▶
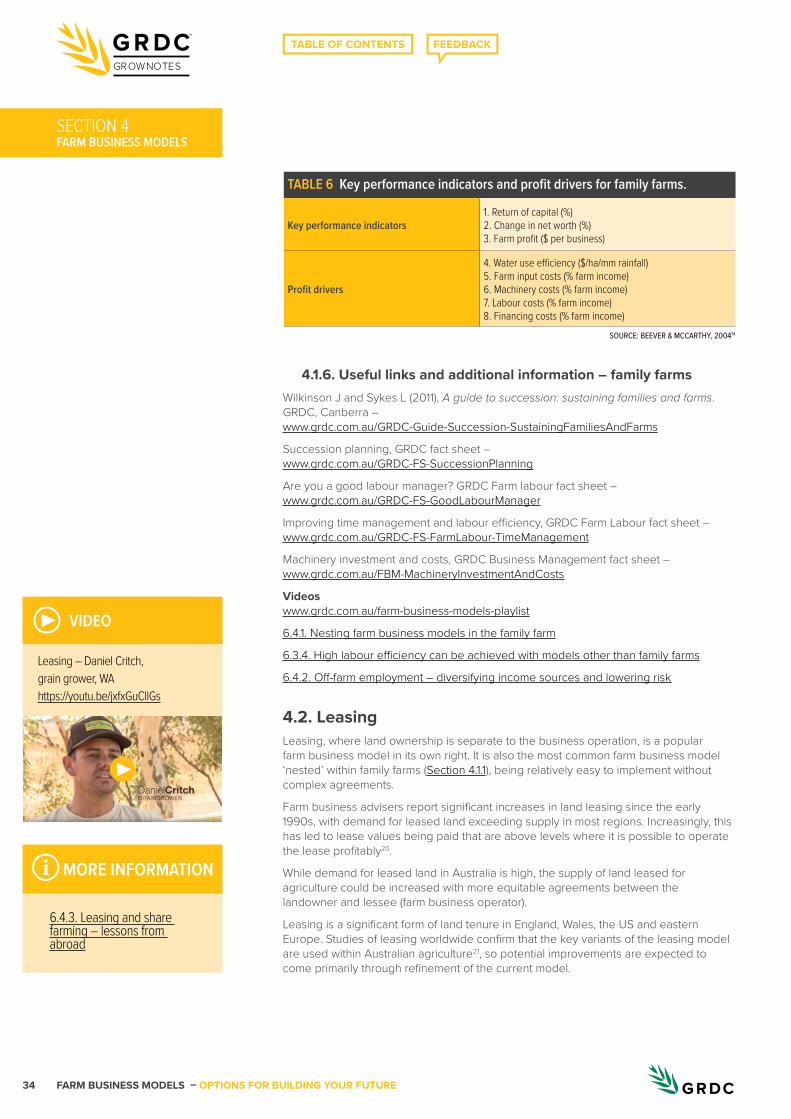
FARM BUSINESS MODELS – OPTIONS FOR BUILDING YOUR FUTURE34
GROWNOTES
FARM BUSINESS MODELSSECTION 4
4.1.6. Useful links and additional information – family farmsWilkinson J and Sykes L (2011), A guide to succession: sustaining families and farms. GRDC, Canberra – www.grdc.com.au/GRDC-Guide-Succession-SustainingFamiliesAndFarms
Succession planning, GRDC fact sheet – www.grdc.com.au/GRDC-FS-SuccessionPlanning
Are you a good labour manager? GRDC Farm labour fact sheet – www.grdc.com.au/GRDC-FS-GoodLabourManager
Improving time management and labour efficiency, GRDC Farm Labour fact sheet – www.grdc.com.au/GRDC-FS-FarmLabour-TimeManagement
Machinery investment and costs, GRDC Business Management fact sheet – www.grdc.com.au/FBM-MachineryInvestmentAndCosts
Videos www.grdc.com.au/farm-business-models-playlist
6.4.1. Nesting farm business models in the family farm
6.3.4. High labour efficiency can be achieved with models other than family farms
6.4.2. Off-farm employment – diversifying income sources and lowering risk
4.2. LeasingLeasing, where land ownership is separate to the business operation, is a popular farm business model in its own right. It is also the most common farm business model ‘nested’ within family farms (Section 4.1.1), being relatively easy to implement without complex agreements.
Farm business advisers report significant increases in land leasing since the early 1990s, with demand for leased land exceeding supply in most regions. Increasingly, this has led to lease values being paid that are above levels where it is possible to operate the lease profitably20.
While demand for leased land in Australia is high, the supply of land leased for agriculture could be increased with more equitable agreements between the landowner and lessee (farm business operator).
Leasing is a significant form of land tenure in England, Wales, the US and eastern Europe. Studies of leasing worldwide confirm that the key variants of the leasing model are used within Australian agriculture21, so potential improvements are expected to come primarily through refinement of the current model.
▶ VIDEO
Leasing – Daniel Critch, grain grower, WA https://youtu.be/jxfxGuCllGs
▶
TABLE 6 Key performance indicators and profit drivers for family farms.
Key performance indicators1. Return of capital (%)2. Change in net worth (%)3. Farm profit ($ per business)
Profit drivers
4. Water use efficiency ($/ha/mm rainfall)5. Farm input costs (% farm income)6. Machinery costs (% farm income)7. Labour costs (% farm income)8. Financing costs (% farm income)
SOURCE: BEEVER & MCCARTHY, 200414
6.4.3. Leasing and share farming – lessons from abroad
MORE INFORMATION
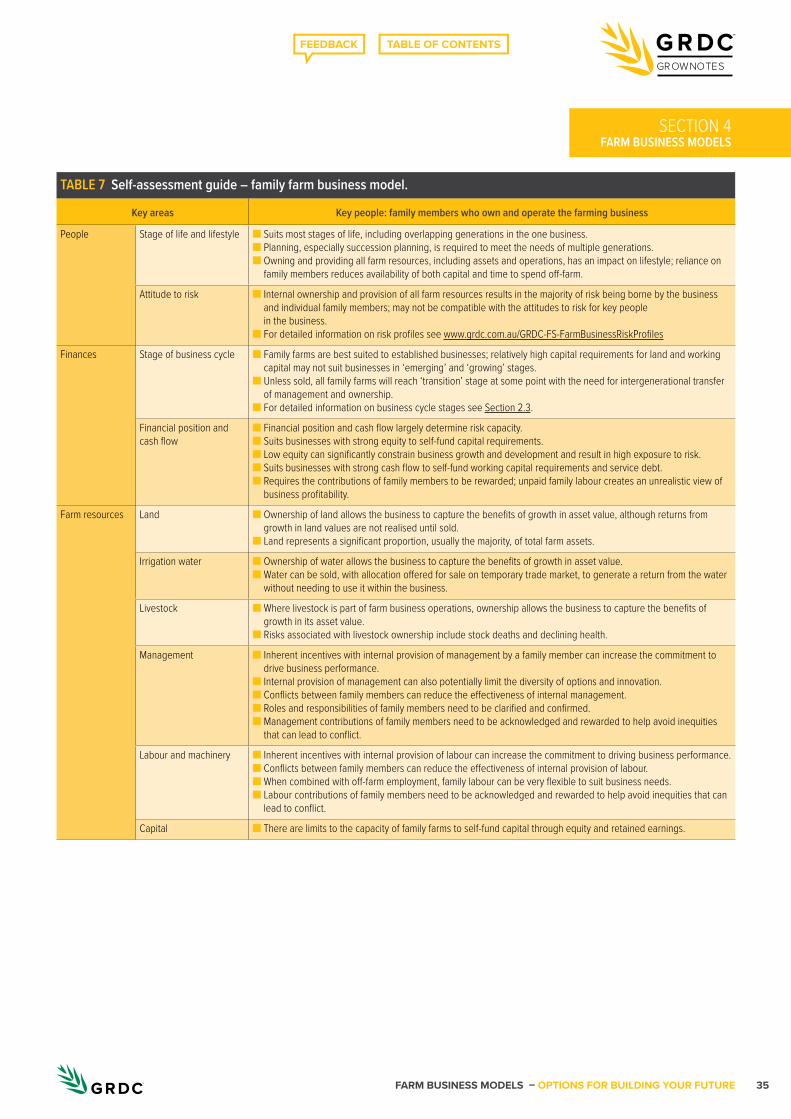
FARM BUSINESS MODELS – OPTIONS FOR BUILDING YOUR FUTURE 35
GROWNOTES
FARM BUSINESS MODELSSECTION 4
TABLE 7 Self-assessment guide – family farm business model.
Key areas Key people: family members who own and operate the farming business
People Stage of life and lifestyle ■ Suits most stages of life, including overlapping generations in the one business.■ Planning, especially succession planning, is required to meet the needs of multiple generations.■ Owning and providing all farm resources, including assets and operations, has an impact on lifestyle; reliance on
family members reduces availability of both capital and time to spend off-farm.
Attitude to risk ■ Internal ownership and provision of all farm resources results in the majority of risk being borne by the business and individual family members; may not be compatible with the attitudes to risk for key people in the business.
■ For detailed information on risk profiles see www.grdc.com.au/GRDC-FS-FarmBusinessRiskProfiles
Finances Stage of business cycle ■ Family farms are best suited to established businesses; relatively high capital requirements for land and working capital may not suit businesses in ‘emerging’ and ‘growing’ stages.
■ Unless sold, all family farms will reach ‘transition’ stage at some point with the need for intergenerational transfer of management and ownership.
■ For detailed information on business cycle stages see Section 2.3.
Financial position and cash flow
■ Financial position and cash flow largely determine risk capacity.■ Suits businesses with strong equity to self-fund capital requirements.■ Low equity can significantly constrain business growth and development and result in high exposure to risk.■ Suits businesses with strong cash flow to self-fund working capital requirements and service debt.■ Requires the contributions of family members to be rewarded; unpaid family labour creates an unrealistic view of
business profitability.
Farm resources Land ■ Ownership of land allows the business to capture the benefits of growth in asset value, although returns from growth in land values are not realised until sold.
■ Land represents a significant proportion, usually the majority, of total farm assets.
Irrigation water ■ Ownership of water allows the business to capture the benefits of growth in asset value.■ Water can be sold, with allocation offered for sale on temporary trade market, to generate a return from the water
without needing to use it within the business.
Livestock ■ Where livestock is part of farm business operations, ownership allows the business to capture the benefits of growth in its asset value.
■ Risks associated with livestock ownership include stock deaths and declining health.
Management ■ Inherent incentives with internal provision of management by a family member can increase the commitment to drive business performance.
■ Internal provision of management can also potentially limit the diversity of options and innovation.■ Conflicts between family members can reduce the effectiveness of internal management.■ Roles and responsibilities of family members need to be clarified and confirmed.■ Management contributions of family members need to be acknowledged and rewarded to help avoid inequities
that can lead to conflict.
Labour and machinery ■ Inherent incentives with internal provision of labour can increase the commitment to driving business performance.■ Conflicts between family members can reduce the effectiveness of internal provision of labour.■ When combined with off-farm employment, family labour can be very flexible to suit business needs.■ Labour contributions of family members need to be acknowledged and rewarded to help avoid inequities that can
lead to conflict.
Capital ■ There are limits to the capacity of family farms to self-fund capital through equity and retained earnings.
FARM BUSINESS MODELS – OPTIONS FOR BUILDING YOUR FUTURE36
GROWNOTES
FARM BUSINESS MODELSSECTION 4
6.4.4. What proportion of total farm capital is attributed to land?
Leasing versus share farming
Leasing and share-farming business models are closely related, particularly with modifications to the traditional leasing model. A key distinction between the two models is the lease fee.
Lease fees are scheduled, periodic payments that provide the landowner with a return for the contribution of land for use by the lessee (farm business operator). Share farming payments to landowners are generally not scheduled, but are made with the sale of farm produce when the landowner receives a share of the proceeds according to their level of contribution. In a share-farming agreement, the landowner typically contributes a share of input and management costs in addition to land.
4.2.1. Operating solely on leased landAlthough leasing is commonly nested within the family farm business model, it is not common for family businesses to operate solely on leased land. This usually only occurs in non-family or corporate farm businesses.
Although operating solely on leased land is viable in a practical sense, there are financial implications. Farm land is the primary form of security for farm business borrowings, including working capital, from banks. When the land is not owned, alternative sources of finance need to be sourced. These often have associated higher costs to reflect the absence of land as security.
Farm businesses operating solely on leased land will have different arrangements for ownership and provision of farm resources compared with the family farm model, where all resources are usually accessed internally. In a leasing model:
• management can be supplied internally by the lessee/farm business operator or externally through an employee or management contractor;
• labour and machinery are usually supplied internally by the lessee, but can be supplemented externally through employees or machinery contractors; and
• capital is supplied both internally and externally:
– land and associated improvements are supplied externally, which in specialist crop-production farms make up approximately 70 to 80 per cent of total farm capital. External access of capital at 100 per cent would make the farm business a form of joint venture (Section 4.5); and
– machinery and working capital are generally supplied internally by the lessee.
Key features that distinguish leasing land from other farm business models
• Leases are based on an agreement between the landowner and lessee, or farm business operator, where the landowner contributes land for use by the lessee in return for a lease payment.
• The landowner and lessee are separate business entities.• Return to the landowner for contribution of land is through scheduled, periodic
lease payments made by the lessee. • The operating costs and management of the farm business operations are the
sole responsibility of the lessee, accounting for any management requirements or constraints in the lease agreement.
• The lessee has exclusive rights to the use of the land for the period of the agreement; only the lessee occupies the land during the lease agreement. This is in contrast to a share farming agreement, where both the share farmer and landowner occupy the land during the agreement.
• Agreements are covered in some states by Acts of Parliament; these usually describe the legal obligations of both parties and provide a framework for dispute resolution22 (see Section 4.2.7).
MORE INFORMATION
FARM BUSINESS MODELS – OPTIONS FOR BUILDING YOUR FUTURE 37
GROWNOTES
FARM BUSINESS MODELSSECTION 4
‘Sale and lease back’There is increasing interest in the use of ‘sale and lease back’ opportunities in Australian agriculture. For a family farm business, the sale of all or part of its land holdings allows capital to be released for alternative uses, including working capital for a new enterprise, expansion or business succession requirements.
The sale and lease back option also provides opportunities for businesses that are in a weak financial position with low equity and constrained by the costs of servicing debt. Selling all or part of the land can provide cash to repay debt and therefore reduce borrowing costs.
Farm businesses have been slower to adopt the sale and lease back option than other industries, mainly due to the security, control and personal satisfaction that comes with land ownership. However, where long-term leases can be secured, the positives of land ownership need to be weighed up against the benefits of reduced capital requirements when operating on leased land.
IN FOCUS
4.2.2. Developing a leasing modelThere is a range of useful and specific information resources available on leasing agricultural land (see Section 4.2.7). Some of the critical considerations when developing a leasing business model are summarised below.
• Develop a written agreement. Verbal agreements are often the source of disputes in leasing arrangements. The best approach is to start with an agreement template and use this as the basis of discussions between the lessee/farm business operator and landowner. Once agreement has been reached on the key aspects of the lease, seek professional legal advice to have the lease agreement drawn up. Lease agreement templates and checklists can be found in Section 4.2.7.
• Conduct a pre-agreement inspection of the land. Check the condition of the land and improvements and agree on requirements for ongoing maintenance, with details recorded in the lease agreement. The condition of the land, yield potential and required annual costs for nutrients/soil amelioration and weed control should be considered when determining the type of agreement, lease structure and fees. During the inspection, consideration should also be given to the expected condition of land and improvements on hand-back at the end of the agreement. For crop production, it is relevant to consider the residual herbicide activity and any potential effects outside the term of the agreement.
• Develop a management plan for the operation of the land, including any capital expenditure required. In addition to crop and pasture rotations, the agreement should include any capital improvements required. Capital improvements are any works or expenses that increase the value of the property and the operating returns over a period longer than the term of the lease. These expenses can be met fully by the landowner, shared by both parties or allowed for in the lease fee. Common capital expenses include:
– soil ameliorants, such as lime and gypsum;
– fertiliser applications above annual crop/pasture use;
– control of existing weed infestations beyond what would be expected in normal crop production;
6.4.5. Increasing land values – a driver for increasing lease costs and lower profitability
MORE INFORMATION
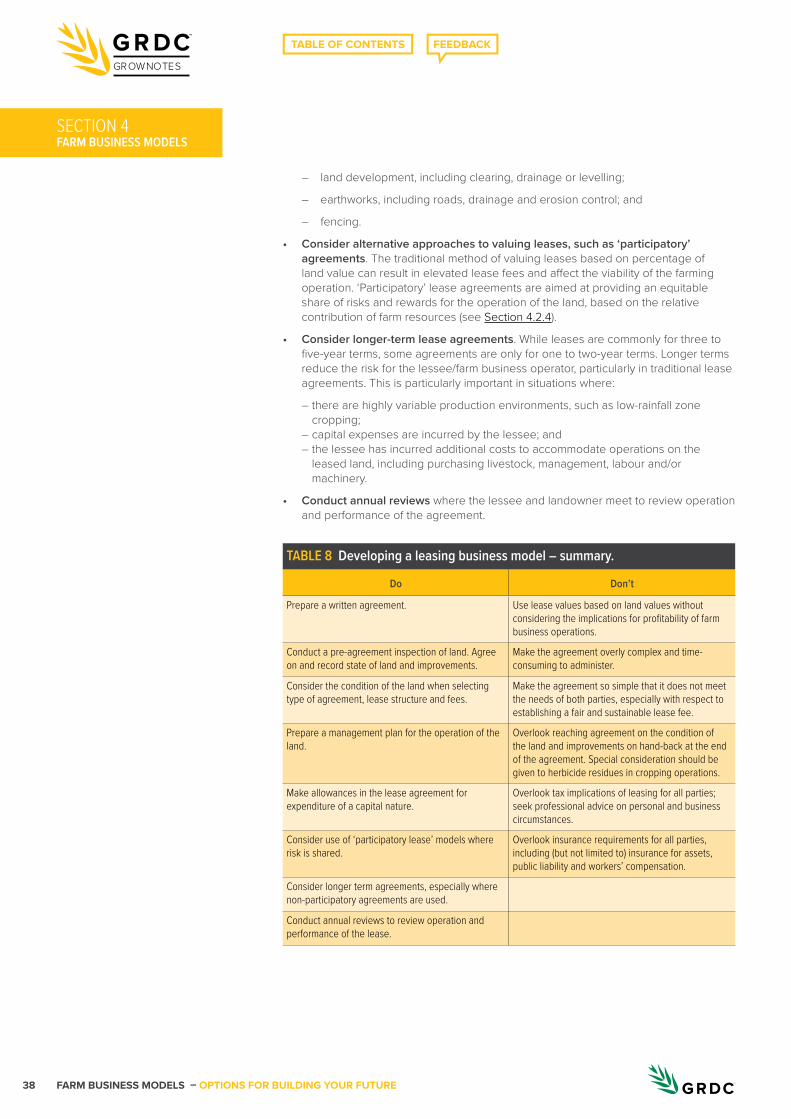
FARM BUSINESS MODELS – OPTIONS FOR BUILDING YOUR FUTURE38
GROWNOTES
FARM BUSINESS MODELSSECTION 4
– land development, including clearing, drainage or levelling;
– earthworks, including roads, drainage and erosion control; and
– fencing.
• Consider alternative approaches to valuing leases, such as ‘participatory’ agreements. The traditional method of valuing leases based on percentage of land value can result in elevated lease fees and affect the viability of the farming operation. ‘Participatory’ lease agreements are aimed at providing an equitable share of risks and rewards for the operation of the land, based on the relative contribution of farm resources (see Section 4.2.4).
• Consider longer-term lease agreements. While leases are commonly for three to five-year terms, some agreements are only for one to two-year terms. Longer terms reduce the risk for the lessee/farm business operator, particularly in traditional lease agreements. This is particularly important in situations where:
– there are highly variable production environments, such as low-rainfall zone cropping;
– capital expenses are incurred by the lessee; and – the lessee has incurred additional costs to accommodate operations on the
leased land, including purchasing livestock, management, labour and/or machinery.
• Conduct annual reviews where the lessee and landowner meet to review operation and performance of the agreement.
TABLE 8 Developing a leasing business model – summary.
Do Don’t
Prepare a written agreement. Use lease values based on land values without considering the implications for profitability of farm business operations.
Conduct a pre-agreement inspection of land. Agree on and record state of land and improvements.
Make the agreement overly complex and time-consuming to administer.
Consider the condition of the land when selecting type of agreement, lease structure and fees.
Make the agreement so simple that it does not meet the needs of both parties, especially with respect to establishing a fair and sustainable lease fee.
Prepare a management plan for the operation of the land.
Overlook reaching agreement on the condition of the land and improvements on hand-back at the end of the agreement. Special consideration should be given to herbicide residues in cropping operations.
Make allowances in the lease agreement for expenditure of a capital nature.
Overlook tax implications of leasing for all parties; seek professional advice on personal and business circumstances.
Consider use of ‘participatory lease’ models where risk is shared.
Overlook insurance requirements for all parties, including (but not limited to) insurance for assets, public liability and workers’ compensation.
Consider longer term agreements, especially where non-participatory agreements are used.
Conduct annual reviews to review operation and performance of the lease.
FARM BUSINESS MODELS – OPTIONS FOR BUILDING YOUR FUTURE 39
GROWNOTES
FARM BUSINESS MODELSSECTION 4
4.2.3. Establishing an equitable lease agreementFor all farm business models, an equitable agreement is developed by considering the relative contributions and perspectives of all parties.
With leasing, there is a clear separation between ownership of the land and the business operation. Typically, the landowner and lessee/farm business operator are unrelated parties. This makes communication about the agreement critical, particularly as the landowner is usually not involved in management of the operations. The only means for valuing contributions is through lease payments.
When establishing a lease agreement, the challenge is to consider and account for the perspectives of both parties. Key considerations for each party include:
1. Farm business operator (lessee)
• Under common agreements, the lease fee is a reward to the landowner for the contribution of land only.
• Other farming resources are supplied by the lessee so the reward for their contribution should be retained by them.
• An equitable lease fee should reflect the relative profitability of operating the land and account for the lessee’s contribution of management, labour/machinery and capital. Lease fees calculated as a percentage of land value may result in inflated fees that are not viable.
• Good management practices and demonstration of high productivity can increase the value of land, which can result in increased lease fees.
• The lessee bears all the production risk under traditional lease agreements. The risks can be managed through:
– the use of participatory lease agreements (Section 4.2.4); and – longer lease terms, which provide operators with a longer period of time to
generate profits and recoup start-up costs. Leases with five-year terms are reasonable.
• Required capital costs should be identified during negotiations and suitable arrangements made in the lease agreement to accommodate them. This can be managed by:
– sharing costs, with the lessee paying a proportion that reflects the expected benefits received during the term of the lease. For example, if liming is expected to have a positive effect on production for eight years and the lease agreement is five years, the lessee should pay five-eighths of the lime costs, or 62.5 per cent; and
– lease terms that match the longest expected period of benefit. Using the lime example above, the appropriate lease term would be eight years.
• Nesting land leasing in an existing farm business model can increase the use of under-utilised resources, such as management, labour/machinery and capital. However, these benefits should be retained by the farm business operator. Their use in farming operations on leased land should be valued at contract rates.
• Lease fees and agreements should account for the scale of the lease area to reflect the impact on profitability and risk within the farm business operation. For example, leasing a small block next door may warrant paying a premium lease fee to reflect potential profitability attributed to the relative ease of management, limited additional costs and likely knowledge of the property. By comparison, leasing a large area some distance away from home base will incur additional costs such as travel, and may also require additional plant and equipment or machinery contractors.
• Lease fees should account for production zones; for example, high-rainfall versus low-rainfall zones for crop production.
FARM BUSINESS MODELS – OPTIONS FOR BUILDING YOUR FUTURE40
GROWNOTES
FARM BUSINESS MODELSSECTION 4
• Leasing land can provide a pathway to purchasing the land. Agreements can include arrangements for an option to purchase, providing an opportunity to ‘try before you buy’.
2. Landowner
• Under common lease agreements, the landowner contributes the land only, therefore is entitled to a return on the contribution of land only.
• Considering the returns from both the appreication in land values and lease fee, returns from leasing land should be comparable to returns from other forms of investment to ensure the continued supply of land for long-term lease.
• Continuity of the lease agreement has a value to the landowner. An equitable agreement with a fair lease fee can result in a higher return to the landowner over the longer term.
• Management of the land should ensure that its value is maintained or improved. Participatory lease agreements (see Section 4.2.4), longer lease terms and specific arrangements for capital costs will promote good management practices by the lessee.
• Depending on the circumstances of the landowner, maintaining access to tax concessions as a primary producer may be beneficial, including income averaging and expense deductions, as well as capital gains tax concessions20. While professional advice should be sought from a tax specialist, participatory lease agreements are likely to assist in meeting the requirements of the Australian Tax Office (ATO) to maintain tax concessions23. ATO rulings on standard lease agreements do not consider landowners to be conducting the business of primary production or the land as being an active asset.
4.2.4. Participatory leasesUnder traditional lease agreements, lessees/farm business operators bear all the production risk from year to year, while landowners have a guaranteed return through lease payments. However, over the longer term, some risk is passed to the landowner. Ongoing poor profitability can lead to default on lease payments, disputes and termination of the agreement. Although another lessee may be found, there are costs to the landowner associated with finding, negotiating and securing a new lease.
Although relatively uncommon, participatory leases are a variation on the standard leasing model and provide the opportunity to share risk between the lessee and landowner. In the participatory model, the returns to the landowner are not fixed, but can vary with actual or potential levels of production. Risk sharing arises from sharing the operating costs or profits.
In sharing costs and profits, participatory leases are similar to share-farming agreements. However, they differ in two key respects: participatory leases have regular payments made by the lessee to the landowner, usually in advance; and the landowner does not make a contribution to management.
Participatory leases offer the opportunity to address the needs of both the lessee and landowner by the sharing of risk and accommodating variable returns from the farming of leased land.
There are two common forms of participatory leases:
1. Profit sharing, where the relative profitability of the farming operation on the leased area determines the lease payments.
Examples of profit-sharing lease arrangements include21 24:
• Share of crop gross margin for a ‘median year’.
– The method for calculating gross margins is set out in the lease agreement. Contract rates are used for machinery operations and other costs as per actuals.
FARM BUSINESS MODELS – OPTIONS FOR BUILDING YOUR FUTURE 41
GROWNOTES
FARM BUSINESS MODELSSECTION 4
– Gross margins are calculated for each crop type based on a ‘median year’ to reflect realistic returns and risks. Median values for crop yields, grain prices and costs should be determined in consultation with both parties.
– Median gross margins for each crop type are then used to calculate a gross margin for the lease period. The landowner is paid a portion of this gross margin, for example 40 per cent, which needs to be defined in the lease agreement.
• Base lease plus variable production payment based on actual financial performance.
– The landowner is paid a lease payment by the lessee to reflect a base reward for contribution of land.
– A production payment is also made to the landowner based on an agreed financial target being met or exceeded. Targets are most simply defined as crop gross margins ($/ha). For example, $x bonus for each $/ha above target.
– The method for calculating gross margins is set out in the lease agreement. Contract rates are used for machinery operations and other costs as per actuals.
2. Production-based, where the lease fee is based on actual grain production (t/ha). This is a simplified version of the second example of profit sharing above.
4.2.5. Analysis of financial performance – leasingThe financial performance of a lease should be assessed over the full term of the agreement to account for fluctuating income and expenses during the crop rotation. An analysis of financial performance can be prepared based on crop gross margins, using realistic figures for expected crop production, inputs and machinery operations. This should be based on a detailed crop-production plan, outlining the crop rotation, expected yields and prices, as well as key inputs such as seed, fertiliser and chemicals. Links to guidelines and templates for the preparation of gross margin budgets are provided in Section 4.2.7.
Although indicative gross margins are available from state agriculture departments (Section 4.2.7), budgets need to be specific to the lease area and proposed management program. Realistic crop yields and grain production should reflect:
• land capability, including soil type and topography;
• local climate, including topographic influences; and
• land use history, which may influence nutrient, pest, weed and disease status.
Developing a management plan that details key inputs through the duration of the lease will help to identify expenses that have a long-term benefit, beyond the term of agreement. Expenditure to address issues such as soil acidity, herbicide-resistant weeds and low nutrient levels can have a significant impact on the profitability of a lease agreement, but can also increase the value of the property. These expense items are capital improvements and should be specifically accounted for in the terms of the agreement, with the costs shared between the lessee and landowner proportional to the relative benefits derived.
A summary of key items in a financial analysis of leasing is shown in Table 9. Most income and expense items can be drawn directly from a standard gross margin budget. The summary includes the following items.
• Operating costs. These are the actual costs incurred in the operation of the agreement and the relative sharing between lessee and landowner. Costs for working capital can be sourced from a standard gross margin budget.
• Operating income. These are the sources of income under the agreement and the relative sharing between lessee and landowner.
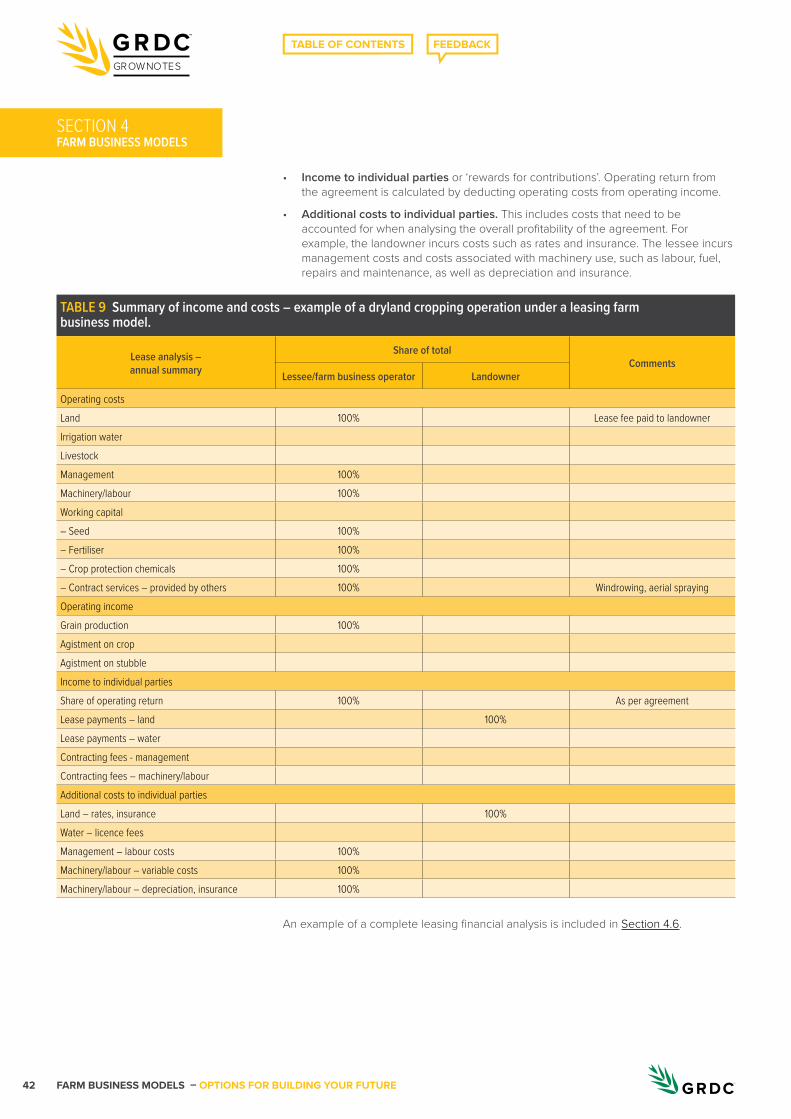
FARM BUSINESS MODELS – OPTIONS FOR BUILDING YOUR FUTURE42
GROWNOTES
FARM BUSINESS MODELSSECTION 4
• Income to individual parties or ‘rewards for contributions’. Operating return from the agreement is calculated by deducting operating costs from operating income.
• Additional costs to individual parties. This includes costs that need to be accounted for when analysing the overall profitability of the agreement. For example, the landowner incurs costs such as rates and insurance. The lessee incurs management costs and costs associated with machinery use, such as labour, fuel, repairs and maintenance, as well as depreciation and insurance.
An example of a complete leasing financial analysis is included in Section 4.6.
TABLE 9 Summary of income and costs – example of a dryland cropping operation under a leasing farm business model.
Lease analysis – annual summary
Share of totalComments
Lessee/farm business operator Landowner
Operating costsLand 100% Lease fee paid to landownerIrrigation waterLivestockManagement 100%Machinery/labour 100%Working capital– Seed 100%– Fertiliser 100%– Crop protection chemicals 100%– Contract services – provided by others 100% Windrowing, aerial sprayingOperating incomeGrain production 100%Agistment on cropAgistment on stubbleIncome to individual partiesShare of operating return 100% As per agreementLease payments – land 100%Lease payments – waterContracting fees - managementContracting fees – machinery/labourAdditional costs to individual partiesLand – rates, insurance 100%Water – licence feesManagement – labour costs 100%Machinery/labour – variable costs 100%Machinery/labour – depreciation, insurance 100%
FARM BUSINESS MODELS – OPTIONS FOR BUILDING YOUR FUTURE 43
GROWNOTES
FARM BUSINESS MODELSSECTION 4
4.2.6. Self-assessment – leasing modelAfter completing an assessment of your own personal and business circumstances as outlined in Section 2, it is then possible to look at alternate business models that may be better suited to your situation. Table 8 provides a self-assessment guide for the ‘land leasing’ farm business model, focusing on the key considerations of people, finances and resources. As the model can be nested within a family farm business, the self-assessment considers both small-scale (nested) and large-scale (standalone) leasing operations.
4.2.7. Useful links and additional information – leasingMaking profitable leasing decisions – www.grdc.com.au/FBM-LeasingShareFarmingLand
Ashby R and Ashby D (2011), Successful land leasing in Australia – a guide for farmers and their advisers, Publication No. 11/052, Rural Industries Research & Development Corporation, Canberra – http://www.agrifutures.com.au/publications-resources/publications/?fwp_rural_industry_search=successful%20land%20leasing%20in%20australia
Preparing a lease agreement, GRDC Business Management fact sheet – www.grdc.com.au/FS-LeasePreparation
Leasing and share farming land, GRDC Business Management fact sheet – www.grdc.com.au/FBM-LeasingShareFarmingLand
Agricultural Tenancies Act 1990 (NSW) is a worthwhile resource when developing a leasing agreement, particularly in relation to the legal responsibilities of each party – www5.austlii.edu.au/au/legis/nsw/consol_act/ata1990233/index.html#longtitle
Gross margin budgets
Farm financial tool: Crop gross margin budget, GRDC fact sheet – www.grdc.com.au/GRDC-FS-FFT-CropGrossMarginBudget
Farm financial tool: Livestock gross margin budget, GRDC fact sheet – www.grdc.com.au/GRDC-FS-FFT-LivestockGrossMarginBudget
Farm Gross Margin Guide – www.grdc.com.au/FarmGrossMarginGuide2017
Gross margin guides by state
NSW – www.dpi.nsw.gov.au/agriculture/farm-business/budgets
Victoria – www.agriculture.vic.gov.au/agriculture/farm-management/business-management/farm-budgets-and-tools/farm-gross-margins
Tasmania – www.dpipwe.tas.gov.au/agriculture/investing-in-irrigation/farm-business-planning-tools
WA – www.agric.wa.gov.au/improvement-tools-gross-margin-analysis
Queensland – www.daf.qld.gov.au/plants/field-crops-and-pastures/broadacre-field-crops/gross-margins/field-crops
Videos www.grdc.com.au/farm-business-models-playlist
6.4.3. Leasing and share farming – lessons from abroad
6.4.4. What proportion of total farm capital is attributed to land?
6.4.5. Increasing land values – a driver for increasing lease costs and lower profitability
6.4.6. Acts of parliament covering lease and share farming agreements
MORE INFORMATION

FARM BUSINESS MODELS – OPTIONS FOR BUILDING YOUR FUTURE44
GROWNOTES
FARM BUSINESS MODELSSECTION 4
TABLE 10 Self-assessment guide – leasing business model.
Key areas Specific considerationsKey people
Lessee in small-scale agreement
Lessee in large-scale agreement Landowner
Generally suited to: Generally suited to: Generally suited to:People Stage of life
and lifestyle■ Successful land leasing requires a professional
approach by both parties, particularly the lessee; although less time consuming than share farming, commitment to record keeping and communication is required.
■ Irrespective of scale, finding, negotiating and operating lease agreements requires time and commitment to communications.
■ For lessees with a passion for livestock, livestock enterprises are more easily accommodated in land leasing than share farming.
While time requirements are modest, business managers need to have available time to set up and manage agreement.
People with very good communication skills and time to commit where the business operates on multiple leased areas.
Landowners with a financial and personal interest in agriculture but not wanting to be involved in management and operation; and retiring growers or investors looking to invest in agriculture through direct land ownership.
Attitude to risk ■ Production risk is borne by the lessee with traditional lease agreements; risks for landowner are confined primarily to default on lease payments and failure of lessee to maintain land and improvements.
■ Although ‘participatory’ lease agreements enable sharing of production risk between lessee and landowner, the nature of lease agreements means the lessee takes on majority of financial risk.
■ Greater flexibility for lessee in managing longer-term risk; under-performing lease land can be removed from business much more readily than if land is owned.
■ For detailed information on risk profiles see www.grdc.com.au/GRDC-FS-FarmBusinessRiskProfiles
Risk exposure is low to moderate; suits a range of attitudes to risk.
Without land ownership the business has lower financial buffering for poor performance. Suits farm business operators who are ‘daring’, understanding that higher risk can lead to higher returns.
Traditional lease agreements present relatively low risk; suit ‘wary’ or risk-averse landowners.
Finances Stage of business cycle
■ Irrespective of stage of business cycle, lessees require surplus farm resources, including management, labour/machinery and working capital. This provides opportunity to reduce marginal costs of production by spreading overhead costs over a larger area.
■ Leasing can be used as a tool in business succession, providing a pathway to business and asset ownership. Land can be leased to next generation, requiring less capital in the early stages of business, and providing returns to the older generation.
■ For detailed information on business cycle stages see Section 2.3.
Suits established businesses due to cash flow and working capital requirements.
Suits growing businesses due to the relatively low capital requirements without land ownership. Can be challenging to fund working capital requirements without land as security.
*Suits landowners in a ‘stable’ or ‘transition’ stage; also retiring or retired growers who want to maintain ownership of land as investment. Can be used as part of a succession plan.
Financial position andcash flow
■ Financial position and cash flow largely determine risk capacity.
■ Lessee: ■ financial position determines the accessibility of
working capital to support expanded operations on lease area and financial buffering to cover losses in poor years; and
■ cash flow is required to service debt for working capital.
Financial requirements can be more easily accommodated through small-scale leasing, but additional risk to business needs to be managed.
Requires very strong cash flow and sound financial position; lessee provides all working capital under traditional agreements and takes on all production risk.‘Sale and lease back’ arrangements can help manage this.
Requires landowners with a sound financial position and low cash flow requirements as rates of return from leasing are equivalent to borrowing costs.
CONTINUED PAGE 45
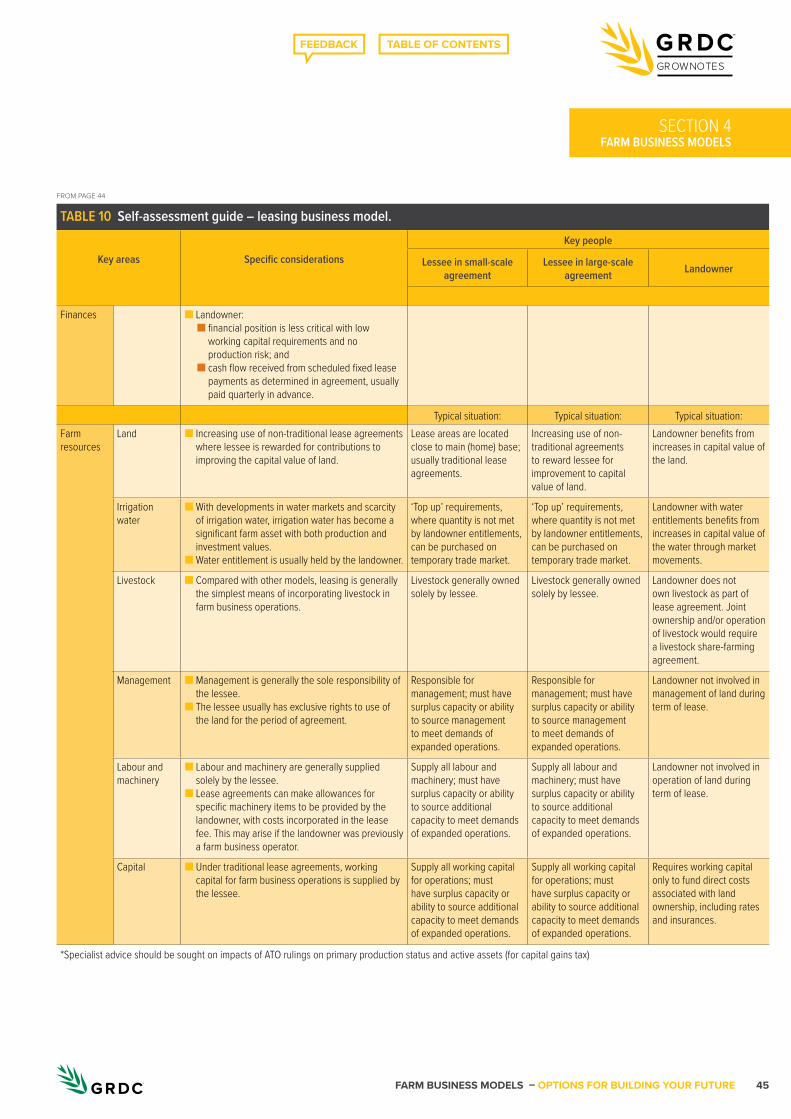
FARM BUSINESS MODELS – OPTIONS FOR BUILDING YOUR FUTURE 45
GROWNOTES
FARM BUSINESS MODELSSECTION 4
TABLE 10 Self-assessment guide – leasing business model.
Key areas Specific considerationsKey people
Lessee in small-scale agreement
Lessee in large-scale agreement Landowner
Finances ■ Landowner: ■ financial position is less critical with low
working capital requirements and no production risk; and
■ cash flow received from scheduled fixed lease payments as determined in agreement, usually paid quarterly in advance.
Typical situation: Typical situation: Typical situation:Farm resources
Land ■ Increasing use of non-traditional lease agreements where lessee is rewarded for contributions to improving the capital value of land.
Lease areas are located close to main (home) base; usually traditional lease agreements.
Increasing use of non-traditional agreements to reward lessee for improvement to capital value of land.
Landowner benefits from increases in capital value of the land.
Irrigation water
■ With developments in water markets and scarcity of irrigation water, irrigation water has become a significant farm asset with both production and investment values.
■ Water entitlement is usually held by the landowner.
‘Top up’ requirements, where quantity is not met by landowner entitlements, can be purchased on temporary trade market.
‘Top up’ requirements, where quantity is not met by landowner entitlements, can be purchased on temporary trade market.
Landowner with water entitlements benefits from increases in capital value of the water through market movements.
Livestock ■ Compared with other models, leasing is generally the simplest means of incorporating livestock in farm business operations.
Livestock generally owned solely by lessee.
Livestock generally owned solely by lessee.
Landowner does not own livestock as part of lease agreement. Joint ownership and/or operation of livestock would require a livestock share-farming agreement.
Management ■ Management is generally the sole responsibility of the lessee.
■ The lessee usually has exclusive rights to use of the land for the period of agreement.
Responsible for management; must have surplus capacity or ability to source management to meet demands of expanded operations.
Responsible for management; must have surplus capacity or ability to source management to meet demands of expanded operations.
Landowner not involved in management of land during term of lease.
Labour and machinery
■ Labour and machinery are generally supplied solely by the lessee.
■ Lease agreements can make allowances for specific machinery items to be provided by the landowner, with costs incorporated in the lease fee. This may arise if the landowner was previously a farm business operator.
Supply all labour and machinery; must have surplus capacity or ability to source additional capacity to meet demands of expanded operations.
Supply all labour and machinery; must have surplus capacity or ability to source additional capacity to meet demands of expanded operations.
Landowner not involved in operation of land during term of lease.
Capital ■ Under traditional lease agreements, working capital for farm business operations is supplied by the lessee.
Supply all working capital for operations; must have surplus capacity or ability to source additional capacity to meet demands of expanded operations.
Supply all working capital for operations; must have surplus capacity or ability to source additional capacity to meet demands of expanded operations.
Requires working capital only to fund direct costs associated with land ownership, including rates and insurances.
*Specialist advice should be sought on impacts of ATO rulings on primary production status and active assets (for capital gains tax)
FROM PAGE 44
FARM BUSINESS MODELS – OPTIONS FOR BUILDING YOUR FUTURE46
GROWNOTES
FARM BUSINESS MODELSSECTION 4
4.3. Share farmingShare farming was once the most common alternative farm business model, both as a standalone model and as a model nested within family farms. Although leasing is now the most common model nested in a family farm business (see Section 4.1.1), share farming remains a key farm business model in its own right, both in Australia and around the world. Similar to leasing, share farming involves a separation of land ownership from the operation of the business.
Share farming is relatively common in the dairy industry within Australia and New Zealand, particularly as a pathway for new entrants. Although this has also been the case in the grains industry, anecdotally its use has declined, with new entrants tending to favour business models built on land ownership.
Share-farming agreements were once relatively simple, based on income sharing ratios of, for example, 60:40 or 80:20 between the share farmer and landowner, with varying arrangements for sharing costs. However, higher costs and associated risks means share-farming agreements now have to include more complex mechanisms to calculate the respective shares of income.
Share-farming agreements are more complex to establish and operate than land leasing, therefore they require a higher level of communication and trust between both parties.
▶ VIDEO
Share Farm Consultant – Phil O’Callaghan, ORM, Vic https://youtu.be/yG9vHUT3ZoE
▶
6.4.3. Leasing and share farming – lessons from abroad
MORE INFORMATION Key features that distinguish share farming from other farm business models
• Share farming is based on an agreement between the landowner and farm business operator, or share farmer, where the landowner contributes land for use by the share farmer.
• The landowner and share farmer are separate business entities.
• The operating costs and management of the farm business are shared between the landowner and share farmer. Where management was once considered the sole responsibility of the share farmer, it is now more common for the share farmer and landowner to consult on key management decisions.
• The agreement includes pre-defined arrangements for sharing crop and/or livestock input costs, ranging from zero to 100 per cent.
• Labour and machinery are typically supplied by the share farmer, with the agreement recognising the value of these inputs in determining the share of income.
• The landowner receives a share of income from crop or livestock production. The share is based on contribution of the land and relative share of total costs, including cash and, in some agreements, opportunity costs.
• Unlike leasing, returns to the landowner are not scheduled payments or pre-determined amounts, rather they occur when produce is sold and vary depending on production levels and prices.
• The share farmer does not generally have exclusive rights to use of the land for the period of the agreement. Both the share farmer and landowner occupy the land during the agreement. For cropping land, the landowner may use the fallow periods between crops for grazing livestock, unless specifically excluded within the terms of the agreement.
• Agreements are covered in some states by Acts of Parliament; these usually describe the legal obligations of both parties and provide a framework for dispute resolution25 (see Section 4.3.7).
FARM BUSINESS MODELS – OPTIONS FOR BUILDING YOUR FUTURE 47
GROWNOTES
FARM BUSINESS MODELSSECTION 4
4.3.1. Operating solely on share-farmed landFarm businesses that operate solely on share-farmed land will have different arrangements for ownership and provision of farm resources compared with the family farm model, where all resources are usually accessed internally. The share-farm model usually acts as follows.
• Management is primarily supplied internally by the share farmer, often with some external input from the landowner. Although there is an option to supplement internal management with employed or contract management, this is relatively uncommon in share-farming agreements and creates additional complexity.
• Labour and machinery are usually all supplied internally by the share farmer, but may be supplemented externally through employees or machinery contractors; and
• Capital is supplied both internally and externally:
– land and associated improvements are supplied externally, which in specialist crop-production farms makes up approximately 70 to 80 per cent of total farm capital. External access of capital at 100 per cent would make the farm business a form of joint venture (see Section 4.5); and
– machinery and working capital are generally supplied internally by the share farmer.
4.3.2. Developing a share farming modelThere is a range of useful and specific information resources available on share farming (see Section 4.3.7). Some of the critical considerations when developing a share-farming arrangement are detailed below (and summarised in Table 11).
• Communication and trust are key elements of successful, long-term share-farm agreements. Generally, good communication will be the key to developing trust. Where either party is reluctant to commit to effective communication, through formal meetings or regular discussions, leasing may be a better option.
• Develop a written agreement. Verbal agreements are often the source of dispute in share-farming arrangements. The best approach is to start with an agreement template and use this as the basis of discussions between the share farmer and landowner. Once agreement has been reached on the key aspects of the share-farming arrangement, seek professional legal advice to have the agreement drawn up. Share-farming agreement templates and checklists can be found in Section 4.3.7.
• Conduct a pre-agreement inspection of the land. Check the condition of the land and improvements and agree on requirements for ongoing maintenance, usually the responsibility of the landowner, with details recorded in the share-farming agreement. The condition of the land, likely yield potential and required annual costs of nutrients/soil amelioration and weed control should be considered when determining the sharing of costs. This will also assist in determining the appropriate share of production sales. During the inspection, consideration should also be given to the expected condition of land and improvements on hand-back at the end of the agreement. For crop production, it is relevant to consider residual herbicide activity and any potential effects outside the term of the agreement.
• Develop a management plan for the operation of the land. A management plan should include crop and pasture rotations and expected input costs and production levels, such as crop yields/quality and stocking rates. A clear understanding of the projected production and profitability of the share-farming operation is required to be able to structure an equitable share-farming agreement.
• Specify any capital improvements required. Capital improvements are any works or expenses that increase the value of the property and the operating returns over a period longer than the term of the agreement. These expenses can be met fully by the landowner or shared by both parties in proportion to the expected share of benefits.
6.4.4. What proportion of total farm capital is attributed to land?
6.4.7. What proportion of total farm capital is attributed to machinery?
MORE INFORMATION
▶ VIDEO
Share Farm - Alex Jobling, grain grower, Vic and Phil O’Callaghan, ORM, Consultant https://youtu.be/CPhLz_scnkE
▶
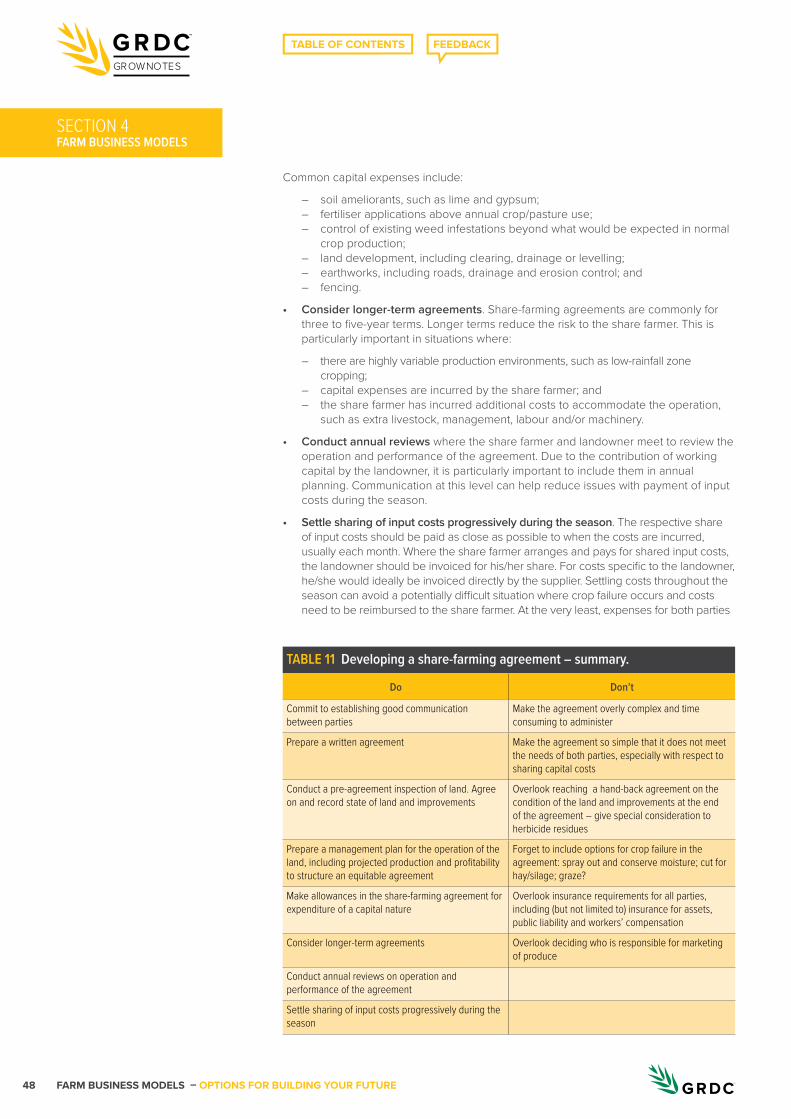
FARM BUSINESS MODELS – OPTIONS FOR BUILDING YOUR FUTURE48
GROWNOTES
FARM BUSINESS MODELSSECTION 4
Common capital expenses include:
– soil ameliorants, such as lime and gypsum; – fertiliser applications above annual crop/pasture use; – control of existing weed infestations beyond what would be expected in normal
crop production; – land development, including clearing, drainage or levelling; – earthworks, including roads, drainage and erosion control; and – fencing.
• Consider longer-term agreements. Share-farming agreements are commonly for three to five-year terms. Longer terms reduce the risk to the share farmer. This is particularly important in situations where:
– there are highly variable production environments, such as low-rainfall zone cropping;
– capital expenses are incurred by the share farmer; and – the share farmer has incurred additional costs to accommodate the operation,
such as extra livestock, management, labour and/or machinery.
• Conduct annual reviews where the share farmer and landowner meet to review the operation and performance of the agreement. Due to the contribution of working capital by the landowner, it is particularly important to include them in annual planning. Communication at this level can help reduce issues with payment of input costs during the season.
• Settle sharing of input costs progressively during the season. The respective share of input costs should be paid as close as possible to when the costs are incurred, usually each month. Where the share farmer arranges and pays for shared input costs, the landowner should be invoiced for his/her share. For costs specific to the landowner, he/she would ideally be invoiced directly by the supplier. Settling costs throughout the season can avoid a potentially difficult situation where crop failure occurs and costs need to be reimbursed to the share farmer. At the very least, expenses for both parties
TABLE 11 Developing a share-farming agreement – summary.
Do Don’t
Commit to establishing good communication between parties
Make the agreement overly complex and time consuming to administer
Prepare a written agreement Make the agreement so simple that it does not meet the needs of both parties, especially with respect to sharing capital costs
Conduct a pre-agreement inspection of land. Agree on and record state of land and improvements
Overlook reaching a hand-back agreement on the condition of the land and improvements at the end of the agreement – give special consideration to herbicide residues
Prepare a management plan for the operation of the land, including projected production and profitability to structure an equitable agreement
Forget to include options for crop failure in the agreement: spray out and conserve moisture; cut for hay/silage; graze?
Make allowances in the share-farming agreement for expenditure of a capital nature
Overlook insurance requirements for all parties, including (but not limited to) insurance for assets, public liability and workers’ compensation
Consider longer-term agreements Overlook deciding who is responsible for marketing of produce
Conduct annual reviews on operation and performance of the agreement
Settle sharing of input costs progressively during the season
FARM BUSINESS MODELS – OPTIONS FOR BUILDING YOUR FUTURE 49
GROWNOTES
FARM BUSINESS MODELSSECTION 4
should be reconciled prior to harvest. Consider the use of a professional adviser, engaged jointly by both parties, to help with documentation and negotiations.
4.3.3. Establishing an equitable share-farm agreementFor all farm business models, an equitable agreement is developed by considering the relative contributions and perspectives of all parties.
In both share farming and leasing there is a clear separation between ownership of the land and the business operation although, unlike leasing, the landowner is often involved in management decisions with the share farmer. Typically, the landowner and share farmer are unrelated parties, making communication regarding the agreement critical. The only means for valuing contributions is through the share of production income as defined by the share-farming agreement.
When establishing a share-farming agreement, the challenge is to consider and account for the perspectives of both parties. Key considerations for each party include the following.
1. Farm business operator (share farmer)
• Under an equitable agreement, the share of production income to the share farmer needs to be a fair reward for his/her contribution of management, labour, machinery and working capital, or input costs.
• It is common for the share farmer’s management, labour and machinery inputs to be valued inappropriately, or not at all. However, these contributions have an opportunity cost, where they could be otherwise used for contracting to other businesses. They should therefore be valued at applicable contract machinery or management rates.
• Required capital costs should be identified during negotiations and suitable arrangements made in the share-farming agreement to accommodate them. Although sometimes complex, this can be managed through:
– sharing costs, with the share farmer paying a proportion that reflects the expected benefits received during the term of the agreement. For example, if liming is expected to have a positive effect on production for eight years and the share-farming agreement is five years, the share farmer should pay five-eighths of the lime costs, or 62.5 per cent;
– share-farming terms that match the longest expected period of benefit. Using the lime example above, the appropriate share-farming term would be eight years.
• Nesting share farming in an existing farm business can increase the use of under-utilised resources, such as management, labour/machinery and capital. However, these benefits should be retained by the share farmer. Their use in farming operations on a share farm should be valued at contract rates.
2. Landowner
• Under an equitable agreement, the share of production income to the landowner needs to be a fair reward for his/her contribution of land, management and working capital, or input costs.
• Reward for the contribution of land needs to be realistic, with lease values likely to be the most appropriate. The lease value should be one that is fair, not at the top end of the market.
• Management of the land should ensure that its value is maintained or improved.
• Depending on the landowner’s circumstances, maintaining access to tax concessions as primary producer may be beneficial, including income averaging and expense deductions, as well as capital gains tax20. While professional advice should be sought from a tax specialist, share-farming agreements are likely to assist in meeting the requirements of the Australian Tax Office (ATO) to maintain tax concessions26. A key consideration to meeting ATO requirements is the contribution to management of the share-farming operation.

FARM BUSINESS MODELS – OPTIONS FOR BUILDING YOUR FUTURE50
GROWNOTES
FARM BUSINESS MODELSSECTION 4
4.3.4. Profit sharing agreementsUnlike traditional lease agreements, share farming provides a means of sharing production risk between the landowner and share farmer. With the landowner providing a share of input costs, reflected in their share of production income, they also share the financial loss in a poor season. However, the majority of the production risk is still borne by the share farmer.
A variant of share farming, often referred to as ‘profit sharing lease’, takes risk sharing to a higher level and potentially offers a more equitable agreement for both parties. Profit-sharing agreements are not common in Australia, but are relatively common in the UK20,21. Although the title includes ‘lease’, profit-sharing agreements do not involve regular, scheduled payments for land. Instead, the land contribution is rewarded through a share of production income, making it a form of share farming.
The key principle with profit-sharing agreements is sharing costs and income in the same proportion, therefore sharing profit equitably and rewarding each party for their contribution of farming resources, as described in the example below. Most importantly, profit-sharing agreements reduce the exposure of the share farmer to production risk and also reduce their capital requirements. For the landowner, profit sharing offers the potential for higher returns.
Example of a profit-sharing agreement, with a 50:50 share of costs and profit in a cropping operation
• Working capital required for the cropping operation is shared equally between the share farmer and landowner.
– This can be achieved most simply by each party depositing equal funds into a joint working bank account, from which all costs are paid. Alternatively, each party pays costs as they occur and invoices the other party for a 50 per cent share of costs. This method can be more complex and difficult to manage.
• The share farmer is paid contract fees, as specified in the agreement, for all operations associated with preparing the land, sowing, in-crop operations, harvesting and grain cartage.
– Contract fees provide a reward to the share farmer for labour and machinery contributions. Where a joint bank account is used, contract fees can be paid using these funds.
• The landowner is paid a lease payment, with the value specified in the agreement.
– Lease fees provide a reward to the landowner for contribution of land. Where a joint bank account is used, lease fees can be paid using these funds.
• Strategic management of the operations is equally shared between the share farmer and landowner.
– Management includes annual review and planning for the operation of the agreement and regular meetings to monitor business performance and approve payment of costs. As equal contributions are made by both parties, there is no need for payments for this strategic management input.
• Tactical, day-to-day management of operations is supplied by the share farmer, an external adviser or a combination of both.
– The agreement needs to specify a value for tactical management provided by the share farmer, for example, using contract management rates.
– Where a joint bank account is used, management fees can be paid using these funds.
• Surplus funds after all costs have been met are shared 50:50 between the share farmer and landowner.
– Where a joint bank account is used, proceeds from the sale of production are deposited into the account. After all costs have been met, the profit can then be shared equally between the share farmer and landowner.
FARM BUSINESS MODELS – OPTIONS FOR BUILDING YOUR FUTURE 51
GROWNOTES
FARM BUSINESS MODELSSECTION 4
Livestock can be included in profit-sharing agreements, although this is not common in Australia. Possible methods to accommodate livestock in agreements include:
• breeding livestock to be owned by one party, either share farmer or landowner, who is paid a livestock lease fee. The livestock owner is responsible for cost of replacements to breeding stock;
• trading livestock to be jointly owned;• livestock operating costs to be shared equally; and• income from the sale of livestock progeny and products, including wool and milk,
are paid into a joint account to cover operating costs for the agreement.
A similar model to profit sharing, called ‘contract farming’, is used in the UK and New Zealand21. This model is distinct from the typical contracting farm business model (Section 4.4) as it involves a sharing of profit from the operations. In the UK, ‘contract farming’ is often made more complex through the involvement of additional parties. For example, a farming operator leases land through one agreement, then enters into a ‘contract farming’ agreement with a farming contractor.
4.3.5. Analysis of financial performance – share farmingThe financial performance of a share-farming agreement should be assessed over the full term of the agreement to account for fluctuating income and expenses during the crop rotation. An analysis of financial performance can be prepared based on crop gross margins, using realistic figures for expected crop production, inputs and machinery operations. This should be based on a detailed crop production plan, outlining the crop rotation, expected yields and prices, as well as key inputs such as seed, fertiliser and chemicals. Links to guidelines and templates for the preparation of gross margin budgets are provide in Section 4.2.7.
Although indicative gross margins are available from state agriculture departments (Section 4.2.7), budgets need to be specific to the share farming area and proposed management program. Realistic crop yields and grain production should reflect:
• land capability, including soil type and topography; • local climate, including topographic influences; and • land use history, which may influence nutrient, pest, weed and disease status.
Developing a management plan that details key inputs through the duration of the share-farming agreement will help to identify expenses that have a long-term benefit, beyond the term of agreement. Expenditure to address issues such as soil acidity, herbicide-resistant weeds and low nutrient levels can have a significant impact on the profitability of a share-farming operation, but can also increase the value of the property. These expense items are capital improvements and should be specifically accounted for in the terms of the agreement, with the costs shared between the share farmer and landowner proportional to the relative benefits derived.
A summary of key items in a financial analysis of share farming, specifically a ‘profit share’ agreement, is shown in Table 12. Most income and expense items can be drawn directly from a standard gross margin budget, although machinery and labour need to be valued as opportunity costs; for example, using contract rates. The analysis assumes a joint working account is established for the agreement.
The summary includes the following items.
• Operating costs. These are the actual costs incurred in the operation of the agreement and the relative sharing between share farmer and landowner. Costs for working capital can be sourced from a standard gross margin budget. The opportunity costs, including the lease fee for the land and contracting fees for machinery and management, are shared by both parties. Working capital and opportunity costs can be paid from the joint working account.
• Operating income. These are the sources of income under the agreement and the relative sharing between share famer and landowner.
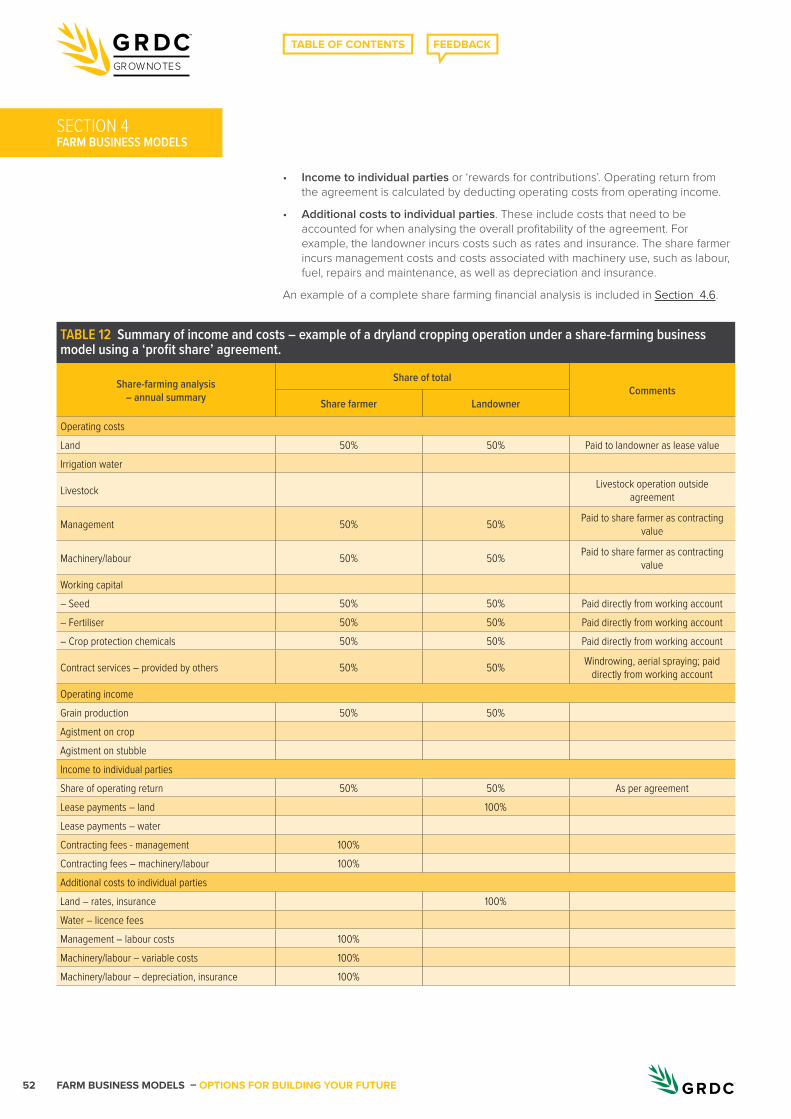
FARM BUSINESS MODELS – OPTIONS FOR BUILDING YOUR FUTURE52
GROWNOTES
FARM BUSINESS MODELSSECTION 4
• Income to individual parties or ‘rewards for contributions’. Operating return from the agreement is calculated by deducting operating costs from operating income.
• Additional costs to individual parties. These include costs that need to be accounted for when analysing the overall profitability of the agreement. For example, the landowner incurs costs such as rates and insurance. The share farmer incurs management costs and costs associated with machinery use, such as labour, fuel, repairs and maintenance, as well as depreciation and insurance.
An example of a complete share farming financial analysis is included in Section 4.6.
TABLE 12 Summary of income and costs – example of a dryland cropping operation under a share-farming business model using a ‘profit share’ agreement.
Share-farming analysis – annual summary
Share of totalComments
Share farmer Landowner
Operating costsLand 50% 50% Paid to landowner as lease valueIrrigation water
Livestock Livestock operation outside agreement
Management 50% 50% Paid to share farmer as contracting value
Machinery/labour 50% 50% Paid to share farmer as contracting value
Working capital– Seed 50% 50% Paid directly from working account– Fertiliser 50% 50% Paid directly from working account– Crop protection chemicals 50% 50% Paid directly from working account
Contract services – provided by others 50% 50% Windrowing, aerial spraying; paid directly from working account
Operating incomeGrain production 50% 50%Agistment on cropAgistment on stubbleIncome to individual partiesShare of operating return 50% 50% As per agreementLease payments – land 100%Lease payments – waterContracting fees - management 100%Contracting fees – machinery/labour 100%Additional costs to individual partiesLand – rates, insurance 100%Water – licence feesManagement – labour costs 100%Machinery/labour – variable costs 100%Machinery/labour – depreciation, insurance 100%

FARM BUSINESS MODELS – OPTIONS FOR BUILDING YOUR FUTURE 53
GROWNOTES
FARM BUSINESS MODELSSECTION 4
4.3.6. Self-assessment – share-farming modelAfter completing an assessment of your own personal and business circumstances as outlined in Section 2, it is then possible to look at alternate business models that may be better suited to your situation. Table 13 (see page 54) provides a self-assessment guide for the share-farming business model, focusing on the key considerations of people, finances and resources. As the model can be nested within a family farm business, the self-assessment considers both small-scale (nested) and large-scale (standalone) share-farming operations.
4.3.7. Useful links and additional information – share farmingPreparing a lease agreement, GRDC Business Management fact sheet (many principles apply to share farming) – www.grdc.com.au/FS-LeasePreparation
Leasing and share farming land, GRDC Business Management fact sheet – www.grdc.com.au/FBM-LeasingShareFarmingLand
Agricultural Tenancies Act 1990 (NSW) is a worthwhile resource when developing a share-farming agreement, particularly in relation to the legal responsibilities of each party – www5.austlii.edu.au/au/legis/nsw/consol_act/ata1990233/index.html#longtitle
Videos www.grdc.com.au/farm-business-models-playlist
4.4. ContractingThe contracting business model typically involves supplying services with surplus capacity, such as machinery, labour or management, to other farm businesses.
The contracting model is commonly nested within family farms. There are relatively few businesses operating purely under a contracting model, although the number is growing. These businesses can be referred to as ‘professional contractors’, where their operation is based solely on contracting their machinery and labour to other farm businesses.
Conversely, there are relatively few farm businesses that rely solely on contracting to carry out all farming operations, although this is also becoming more common.
Contract agreements are relatively simple to establish and operate. However, good communication between the contractor and the client is essential, particularly where management services are provided.
Machinery contracting is a relatively simple and flexible option to use surplus machinery and labour to generate additional profit. However, careful planning is required to ensure that the demands on resources do not cause undue delays in the timing of key operations in the base farm business.
Management contracting presents an opportunity that is not widely used by farm businesses. Existing farm operators have the opportunity to provide their management expertise on a contract basis to other farm businesses. Similarly, skilled managers can contract their services to farm businesses, without having their own farming operation. While contract management is relatively uncommon in Australia, there is potential for growth.
Contracting, particularly machinery contracting, is commonly used by farm businesses in the US27 and is known as ‘custom farming’. The use of contracting is so common and of such importance to farm business management that annual surveys of ‘custom farming’ rates are conducted and results published by university extension services. In comparison, there is relatively little information available on contract rates within Australia, which may be an impediment to the growth of agricultural contracting services.
6.4.3. Leasing and share farming – lessons from abroad
6.4.4. What proportion of total farm capital is attributed to land?
MORE INFORMATION
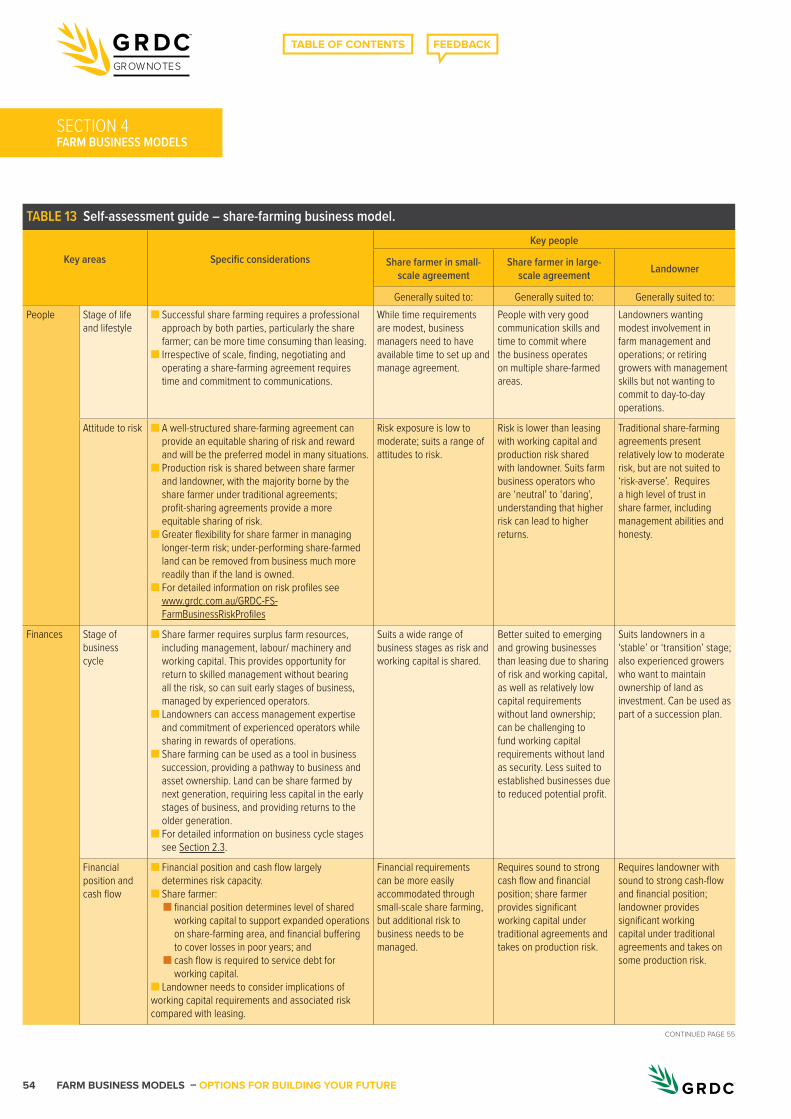
FARM BUSINESS MODELS – OPTIONS FOR BUILDING YOUR FUTURE54
GROWNOTES
FARM BUSINESS MODELSSECTION 4
TABLE 13 Self-assessment guide – share-farming business model.
Key areas Specific considerationsKey people
Share farmer in small-scale agreement
Share farmer in large-scale agreement Landowner
Generally suited to: Generally suited to: Generally suited to:People Stage of life
and lifestyle■ Successful share farming requires a professional
approach by both parties, particularly the share farmer; can be more time consuming than leasing.
■ Irrespective of scale, finding, negotiating and operating a share-farming agreement requires time and commitment to communications.
While time requirements are modest, business managers need to have available time to set up and manage agreement.
People with very good communication skills and time to commit where the business operates on multiple share-farmed areas.
Landowners wanting modest involvement in farm management and operations; or retiring growers with management skills but not wanting to commit to day-to-day operations.
Attitude to risk ■ A well-structured share-farming agreement can provide an equitable sharing of risk and reward and will be the preferred model in many situations.
■ Production risk is shared between share farmer and landowner, with the majority borne by the share farmer under traditional agreements; profit-sharing agreements provide a more equitable sharing of risk.
■ Greater flexibility for share farmer in managing longer-term risk; under-performing share-farmed land can be removed from business much more readily than if the land is owned.
■ For detailed information on risk profiles see www.grdc.com.au/GRDC-FS-FarmBusinessRiskProfiles
Risk exposure is low to moderate; suits a range of attitudes to risk.
Risk is lower than leasing with working capital and production risk shared with landowner. Suits farm business operators who are ‘neutral’ to ‘daring’, understanding that higher risk can lead to higher returns.
Traditional share-farming agreements present relatively low to moderate risk, but are not suited to ‘risk-averse’. Requires a high level of trust in share farmer, including management abilities and honesty.
Finances Stage of business cycle
■ Share farmer requires surplus farm resources, including management, labour/ machinery and working capital. This provides opportunity for return to skilled management without bearing all the risk, so can suit early stages of business, managed by experienced operators.
■ Landowners can access management expertise and commitment of experienced operators while sharing in rewards of operations.
■ Share farming can be used as a tool in business succession, providing a pathway to business and asset ownership. Land can be share farmed by next generation, requiring less capital in the early stages of business, and providing returns to the older generation.
■ For detailed information on business cycle stages see Section 2.3.
Suits a wide range of business stages as risk and working capital is shared.
Better suited to emerging and growing businesses than leasing due to sharing of risk and working capital, as well as relatively low capital requirements without land ownership; can be challenging to fund working capital requirements without land as security. Less suited to established businesses due to reduced potential profit.
Suits landowners in a ‘stable’ or ‘transition’ stage; also experienced growers who want to maintain ownership of land as investment. Can be used as part of a succession plan.
Financial position andcash flow
■ Financial position and cash flow largely determines risk capacity.
■ Share farmer: ■ financial position determines level of shared
working capital to support expanded operations on share-farming area, and financial buffering to cover losses in poor years; and
■ cash flow is required to service debt for working capital.
■ Landowner needs to consider implications of working capital requirements and associated risk compared with leasing.
Financial requirements can be more easily accommodated through small-scale share farming, but additional risk to business needs to be managed.
Requires sound to strong cash flow and financial position; share farmer provides significant working capital under traditional agreements and takes on production risk.
Requires landowner with sound to strong cash-flow and financial position; landowner provides significant working capital under traditional agreements and takes on some production risk.
CONTINUED PAGE 55
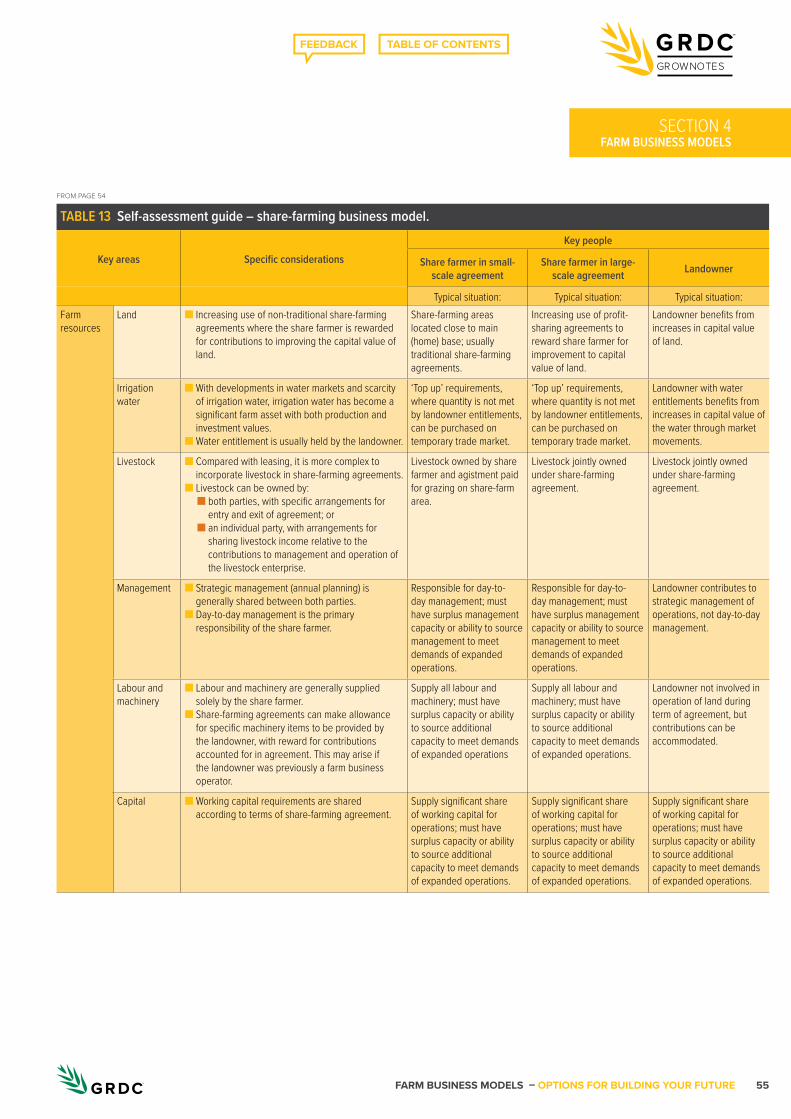
FARM BUSINESS MODELS – OPTIONS FOR BUILDING YOUR FUTURE 55
GROWNOTES
FARM BUSINESS MODELSSECTION 4
TABLE 13 Self-assessment guide – share-farming business model.
Key areas Specific considerationsKey people
Share farmer in small-scale agreement
Share farmer in large-scale agreement Landowner
Typical situation: Typical situation: Typical situation:Farm resources
Land ■ Increasing use of non-traditional share-farming agreements where the share farmer is rewarded for contributions to improving the capital value of land.
Share-farming areas located close to main (home) base; usually traditional share-farming agreements.
Increasing use of profit-sharing agreements to reward share farmer for improvement to capital value of land.
Landowner benefits from increases in capital value of land.
Irrigation water
■ With developments in water markets and scarcity of irrigation water, irrigation water has become a significant farm asset with both production and investment values.
■ Water entitlement is usually held by the landowner.
‘Top up’ requirements, where quantity is not met by landowner entitlements, can be purchased on temporary trade market.
‘Top up’ requirements, where quantity is not met by landowner entitlements, can be purchased on temporary trade market.
Landowner with water entitlements benefits from increases in capital value of the water through market movements.
Livestock ■ Compared with leasing, it is more complex to incorporate livestock in share-farming agreements.
■ Livestock can be owned by: ■ both parties, with specific arrangements for
entry and exit of agreement; or ■ an individual party, with arrangements for
sharing livestock income relative to the contributions to management and operation of the livestock enterprise.
Livestock owned by share farmer and agistment paid for grazing on share-farm area.
Livestock jointly owned under share-farming agreement.
Livestock jointly owned under share-farming agreement.
Management ■ Strategic management (annual planning) is generally shared between both parties.
■ Day-to-day management is the primary responsibility of the share farmer.
Responsible for day-to-day management; must have surplus management capacity or ability to source management to meet demands of expanded operations.
Responsible for day-to-day management; must have surplus management capacity or ability to source management to meet demands of expanded operations.
Landowner contributes to strategic management of operations, not day-to-day management.
Labour and machinery
■ Labour and machinery are generally supplied solely by the share farmer.
■ Share-farming agreements can make allowance for specific machinery items to be provided by the landowner, with reward for contributions accounted for in agreement. This may arise if the landowner was previously a farm business operator.
Supply all labour and machinery; must have surplus capacity or ability to source additional capacity to meet demands of expanded operations
Supply all labour and machinery; must have surplus capacity or ability to source additional capacity to meet demands of expanded operations.
Landowner not involved in operation of land during term of agreement, but contributions can be accommodated.
Capital ■ Working capital requirements are shared according to terms of share-farming agreement.
Supply significant share of working capital for operations; must have surplus capacity or ability to source additional capacity to meet demands of expanded operations.
Supply significant share of working capital for operations; must have surplus capacity or ability to source additional capacity to meet demands of expanded operations.
Supply significant share of working capital for operations; must have surplus capacity or ability to source additional capacity to meet demands of expanded operations.
FROM PAGE 54
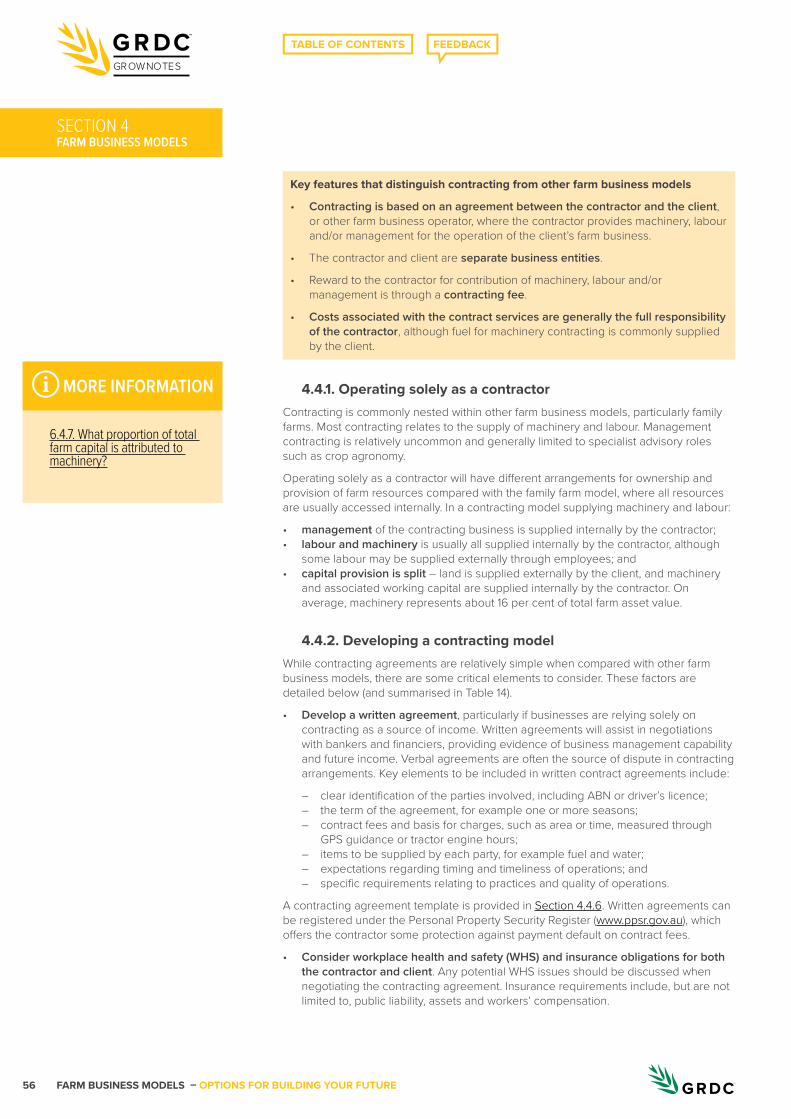
FARM BUSINESS MODELS – OPTIONS FOR BUILDING YOUR FUTURE56
GROWNOTES
FARM BUSINESS MODELSSECTION 4
6.4.7. What proportion of total farm capital is attributed to machinery?
4.4.1. Operating solely as a contractorContracting is commonly nested within other farm business models, particularly family farms. Most contracting relates to the supply of machinery and labour. Management contracting is relatively uncommon and generally limited to specialist advisory roles such as crop agronomy.
Operating solely as a contractor will have different arrangements for ownership and provision of farm resources compared with the family farm model, where all resources are usually accessed internally. In a contracting model supplying machinery and labour:
• management of the contracting business is supplied internally by the contractor;• labour and machinery is usually all supplied internally by the contractor, although
some labour may be supplied externally through employees; and• capital provision is split – land is supplied externally by the client, and machinery
and associated working capital are supplied internally by the contractor. On average, machinery represents about 16 per cent of total farm asset value.
4.4.2. Developing a contracting modelWhile contracting agreements are relatively simple when compared with other farm business models, there are some critical elements to consider. These factors are detailed below (and summarised in Table 14).
• Develop a written agreement, particularly if businesses are relying solely on contracting as a source of income. Written agreements will assist in negotiations with bankers and financiers, providing evidence of business management capability and future income. Verbal agreements are often the source of dispute in contracting arrangements. Key elements to be included in written contract agreements include:
– clear identification of the parties involved, including ABN or driver’s licence; – the term of the agreement, for example one or more seasons; – contract fees and basis for charges, such as area or time, measured through
GPS guidance or tractor engine hours; – items to be supplied by each party, for example fuel and water; – expectations regarding timing and timeliness of operations; and – specific requirements relating to practices and quality of operations.
A contracting agreement template is provided in Section 4.4.6. Written agreements can be registered under the Personal Property Security Register (www.ppsr.gov.au), which offers the contractor some protection against payment default on contract fees.
• Consider workplace health and safety (WHS) and insurance obligations for both the contractor and client. Any potential WHS issues should be discussed when negotiating the contracting agreement. Insurance requirements include, but are not limited to, public liability, assets and workers’ compensation.
Key features that distinguish contracting from other farm business models
• Contracting is based on an agreement between the contractor and the client, or other farm business operator, where the contractor provides machinery, labour and/or management for the operation of the client’s farm business.
• The contractor and client are separate business entities.
• Reward to the contractor for contribution of machinery, labour and/or management is through a contracting fee.
• Costs associated with the contract services are generally the full responsibility of the contractor, although fuel for machinery contracting is commonly supplied by the client.
MORE INFORMATION
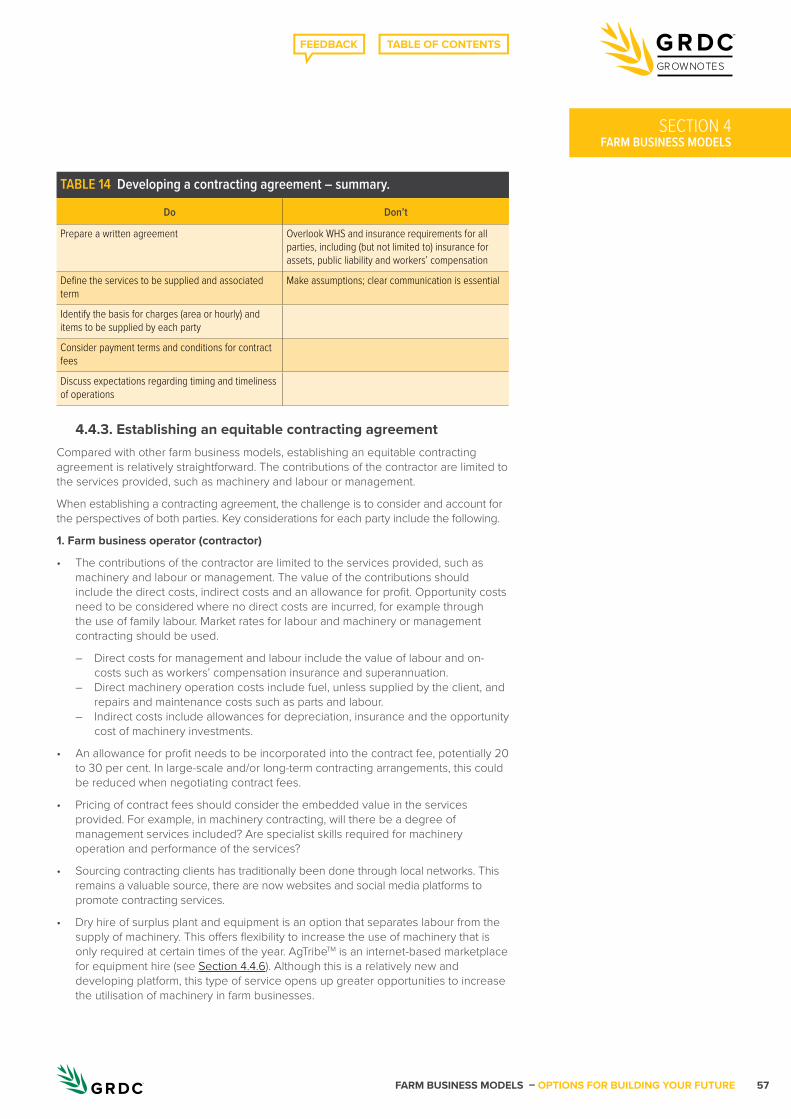
FARM BUSINESS MODELS – OPTIONS FOR BUILDING YOUR FUTURE 57
GROWNOTES
FARM BUSINESS MODELSSECTION 4
4.4.3. Establishing an equitable contracting agreementCompared with other farm business models, establishing an equitable contracting agreement is relatively straightforward. The contributions of the contractor are limited to the services provided, such as machinery and labour or management.
When establishing a contracting agreement, the challenge is to consider and account for the perspectives of both parties. Key considerations for each party include the following.
1. Farm business operator (contractor)
• The contributions of the contractor are limited to the services provided, such as machinery and labour or management. The value of the contributions should include the direct costs, indirect costs and an allowance for profit. Opportunity costs need to be considered where no direct costs are incurred, for example through the use of family labour. Market rates for labour and machinery or management contracting should be used.
– Direct costs for management and labour include the value of labour and on-costs such as workers’ compensation insurance and superannuation.
– Direct machinery operation costs include fuel, unless supplied by the client, and repairs and maintenance costs such as parts and labour.
– Indirect costs include allowances for depreciation, insurance and the opportunity cost of machinery investments.
• An allowance for profit needs to be incorporated into the contract fee, potentially 20 to 30 per cent. In large-scale and/or long-term contracting arrangements, this could be reduced when negotiating contract fees.
• Pricing of contract fees should consider the embedded value in the services provided. For example, in machinery contracting, will there be a degree of management services included? Are specialist skills required for machinery operation and performance of the services?
• Sourcing contracting clients has traditionally been done through local networks. This remains a valuable source, there are now websites and social media platforms to promote contracting services.
• Dry hire of surplus plant and equipment is an option that separates labour from the supply of machinery. This offers flexibility to increase the use of machinery that is only required at certain times of the year. AgTribeTM is an internet-based marketplace for equipment hire (see Section 4.4.6). Although this is a relatively new and developing platform, this type of service opens up greater opportunities to increase the utilisation of machinery in farm businesses.
TABLE 14 Developing a contracting agreement – summary.
Do Don’t
Prepare a written agreement Overlook WHS and insurance requirements for all parties, including (but not limited to) insurance for assets, public liability and workers’ compensation
Define the services to be supplied and associated term
Make assumptions; clear communication is essential
Identify the basis for charges (area or hourly) and items to be supplied by each party
Consider payment terms and conditions for contract fees
Discuss expectations regarding timing and timeliness of operations
FARM BUSINESS MODELS – OPTIONS FOR BUILDING YOUR FUTURE58
GROWNOTES
FARM BUSINESS MODELSSECTION 4
– Market rates for machinery contracting can be used as a guide to dry hire rates, deducting an allowance for labour. For example, if the market rate for contract windrowing is $180 per hour plus GST, excluding fuel, and contract labour is valued at $35 per hour, an applicable dry hire rate would be: $180 – $35 = $145 per hour plus GST.
• For large-scale contract agreements and/or agreements with new clients, consider registering the agreement under the Personal Property Security Register (www.ppsr.gov.au). Registering a contracting agreement with PPSR offers the contractor some protection against payment default on contract fees.
2. Client (other farm business operator)
• Timeliness and quality of work are key factors when determining the value of contract services. These need to be specified in the contract agreement.
• There are a growing number of ‘professional agricultural contractors’ who specialise in contract services instead of having their own farming business. However, ‘farmer contractors’ still play an important role in meeting client demand with their excess capacity in machinery and labour. Both types of contractors will have competing demands on their time in peak work periods. It is important to determine timeliness requirements for contract work and the capacity of the contractor to meet this.
• Consider options to make the business more attractive to contractors and improve the timeliness and efficiency of operations. For cropping enterprises, this could be achieved by considering the layout of crop areas, for example ‘long runs’ and ‘block farming’, as well as improving access to inputs such as chemicals and water for spraying operations.
• Sourcing contractors has traditionally been done through local networks. While this remains a valuable source, there are now websites and social media platforms to locate contracting services.
4.4.4. Analysis of financial performanceWhile less critical than for other farm business models, the financial performance of a contracting arrangement should be assessed over the term of the contracting agreement, if more than one season. This accounts for the impact of crop rotation on machinery operations or management and allows for the increasing trend towards long-term contracting agreements.
Typically, financial analysis of contracting agreements only considers the perspective of the contractor. However, contracting can be a pathway to other farm business models, such as where the contractor and client consider developing a share-farming or leasing arrangement. In this situation, it would be worth considering the perspectives of both parties when assessing the overall performance of the agreement.
Resources to assist with a detailed analysis of machinery costs and guidance on the process of calculating contracting rates are provided in Section 4.4.6. While contract rates are often set by the ‘going’ market rate, contractors are encouraged to calculate their own rates as costs will vary between machinery type and condition, including fuel usage, repairs and maintenance, and depreciation. Variations in operating costs can impact on the profitability of the agreement.
A summary of key costs in a financial analysis of contracting is shown in Table 15. The summary includes the following items.
• Operating costs. These are the direct costs incurred by the client in the farming operation and can be sourced from a standard gross margin budget.
• Operating income. This is the client’s income from the farming operation.
• Income to individual parties or ‘rewards for contributions’. Financial returns to the
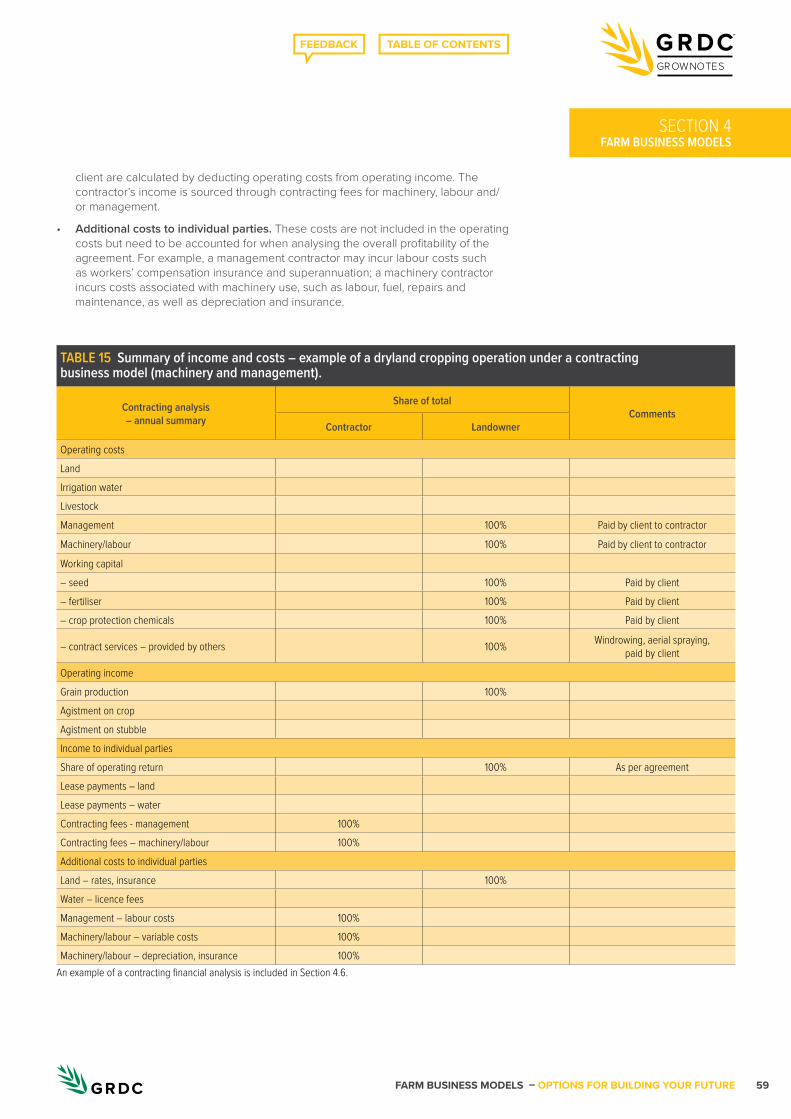
FARM BUSINESS MODELS – OPTIONS FOR BUILDING YOUR FUTURE 59
GROWNOTES
FARM BUSINESS MODELSSECTION 4
client are calculated by deducting operating costs from operating income. The contractor’s income is sourced through contracting fees for machinery, labour and/or management.
• Additional costs to individual parties. These costs are not included in the operating costs but need to be accounted for when analysing the overall profitability of the agreement. For example, a management contractor may incur labour costs such as workers’ compensation insurance and superannuation; a machinery contractor incurs costs associated with machinery use, such as labour, fuel, repairs and maintenance, as well as depreciation and insurance.
TABLE 15 Summary of income and costs – example of a dryland cropping operation under a contracting business model (machinery and management).
Contracting analysis – annual summary
Share of totalComments
Contractor Landowner
Operating costsLandIrrigation waterLivestockManagement 100% Paid by client to contractor
Machinery/labour 100% Paid by client to contractor
Working capital– seed 100% Paid by client– fertiliser 100% Paid by client– crop protection chemicals 100% Paid by client
– contract services – provided by others 100% Windrowing, aerial spraying, paid by client
Operating incomeGrain production 100%Agistment on cropAgistment on stubbleIncome to individual partiesShare of operating return 100% As per agreementLease payments – landLease payments – waterContracting fees - management 100%Contracting fees – machinery/labour 100%Additional costs to individual partiesLand – rates, insurance 100%Water – licence feesManagement – labour costs 100%Machinery/labour – variable costs 100%Machinery/labour – depreciation, insurance 100%
An example of a contracting financial analysis is included in Section 4.6.
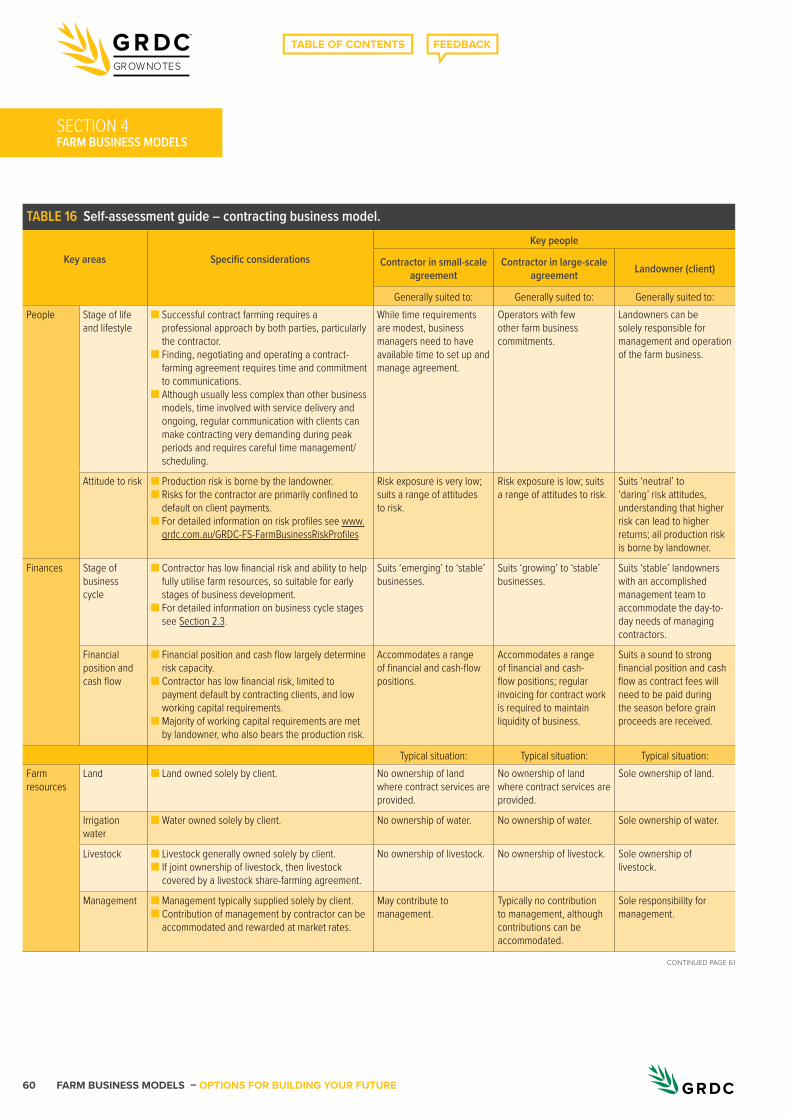
FARM BUSINESS MODELS – OPTIONS FOR BUILDING YOUR FUTURE60
GROWNOTES
FARM BUSINESS MODELSSECTION 4
TABLE 16 Self-assessment guide – contracting business model.
Key areas Specific considerationsKey people
Contractor in small-scale agreement
Contractor in large-scale agreement Landowner (client)
Generally suited to: Generally suited to: Generally suited to:People Stage of life
and lifestyle■ Successful contract farming requires a
professional approach by both parties, particularly the contractor.
■ Finding, negotiating and operating a contract-farming agreement requires time and commitment to communications.
■ Although usually less complex than other business models, time involved with service delivery and ongoing, regular communication with clients can make contracting very demanding during peak periods and requires careful time management/scheduling.
While time requirements are modest, business managers need to have available time to set up and manage agreement.
Operators with few other farm business commitments.
Landowners can be solely responsible for management and operation of the farm business.
Attitude to risk ■ Production risk is borne by the landowner.■ Risks for the contractor are primarily confined to
default on client payments.■ For detailed information on risk profiles see www.
grdc.com.au/GRDC-FS-FarmBusinessRiskProfiles
Risk exposure is very low; suits a range of attitudes to risk.
Risk exposure is low; suits a range of attitudes to risk.
Suits ‘neutral’ to ‘daring’ risk attitudes, understanding that higher risk can lead to higher returns; all production risk is borne by landowner.
Finances Stage of business cycle
■ Contractor has low financial risk and ability to help fully utilise farm resources, so suitable for early stages of business development.
■ For detailed information on business cycle stages see Section 2.3.
Suits ‘emerging’ to ‘stable’ businesses.
Suits ‘growing’ to ‘stable’ businesses.
Suits ‘stable’ landowners with an accomplished management team to accommodate the day-to-day needs of managing contractors.
Financial position andcash flow
■ Financial position and cash flow largely determine risk capacity.
■ Contractor has low financial risk, limited to payment default by contracting clients, and low working capital requirements.
■ Majority of working capital requirements are met by landowner, who also bears the production risk.
Accommodates a range of financial and cash-flow positions.
Accommodates a range of financial and cash-flow positions; regular invoicing for contract work is required to maintain liquidity of business.
Suits a sound to strong financial position and cash flow as contract fees will need to be paid during the season before grain proceeds are received.
Typical situation: Typical situation: Typical situation:Farm resources
Land ■ Land owned solely by client. No ownership of land where contract services are provided.
No ownership of land where contract services are provided.
Sole ownership of land.
Irrigation water
■ Water owned solely by client. No ownership of water. No ownership of water. Sole ownership of water.
Livestock ■ Livestock generally owned solely by client.■ If joint ownership of livestock, then livestock
covered by a livestock share-farming agreement.
No ownership of livestock. No ownership of livestock. Sole ownership of livestock.
Management ■ Management typically supplied solely by client.■ Contribution of management by contractor can be
accommodated and rewarded at market rates.
May contribute to management.
Typically no contribution to management, although contributions can be accommodated.
Sole responsibility for management.
CONTINUED PAGE 61
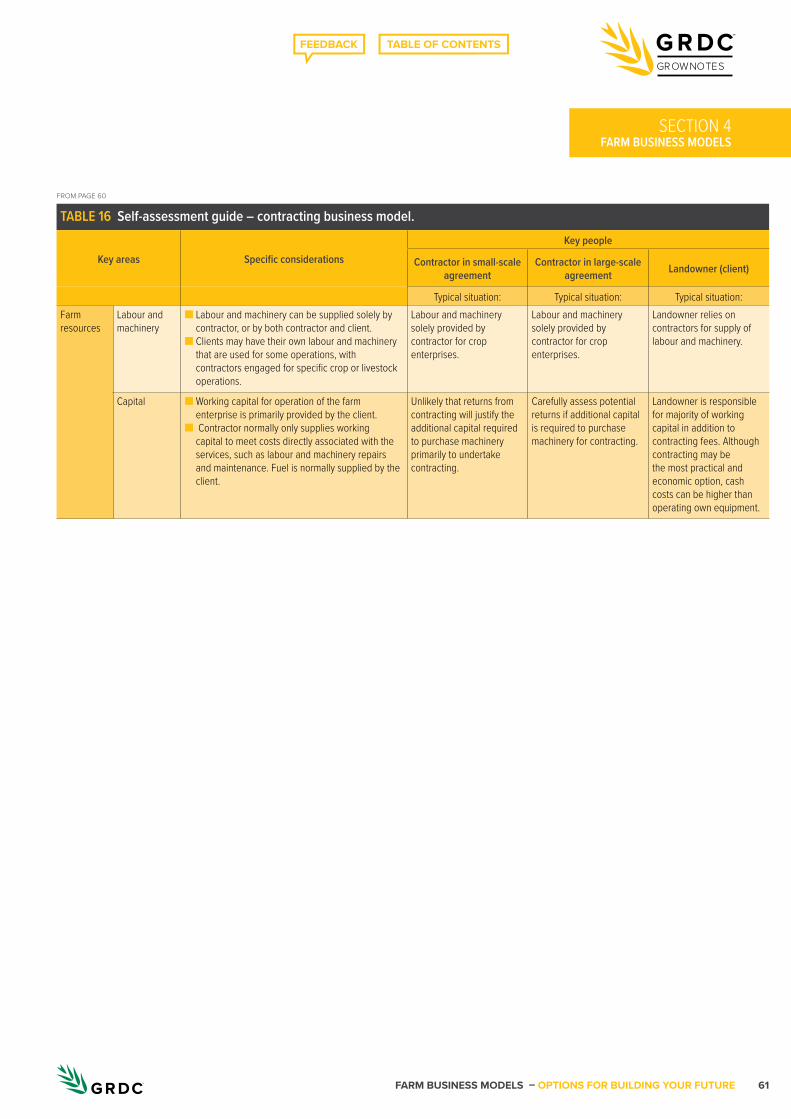
FARM BUSINESS MODELS – OPTIONS FOR BUILDING YOUR FUTURE 61
GROWNOTES
FARM BUSINESS MODELSSECTION 4
TABLE 16 Self-assessment guide – contracting business model.
Key areas Specific considerationsKey people
Contractor in small-scale agreement
Contractor in large-scale agreement Landowner (client)
Typical situation: Typical situation: Typical situation:Farm resources
Labour and machinery
■ Labour and machinery can be supplied solely by contractor, or by both contractor and client.
■ Clients may have their own labour and machinery that are used for some operations, with contractors engaged for specific crop or livestock operations.
Labour and machinery solely provided by contractor for crop enterprises.
Labour and machinery solely provided by contractor for crop enterprises.
Landowner relies on contractors for supply of labour and machinery.
Capital ■ Working capital for operation of the farm enterprise is primarily provided by the client.
■ Contractor normally only supplies working capital to meet costs directly associated with the services, such as labour and machinery repairs and maintenance. Fuel is normally supplied by the client.
Unlikely that returns from contracting will justify the additional capital required to purchase machinery primarily to undertake contracting.
Carefully assess potential returns if additional capital is required to purchase machinery for contracting.
Landowner is responsible for majority of working capital in addition to contracting fees. Although contracting may be the most practical and economic option, cash costs can be higher than operating own equipment.
FROM PAGE 60
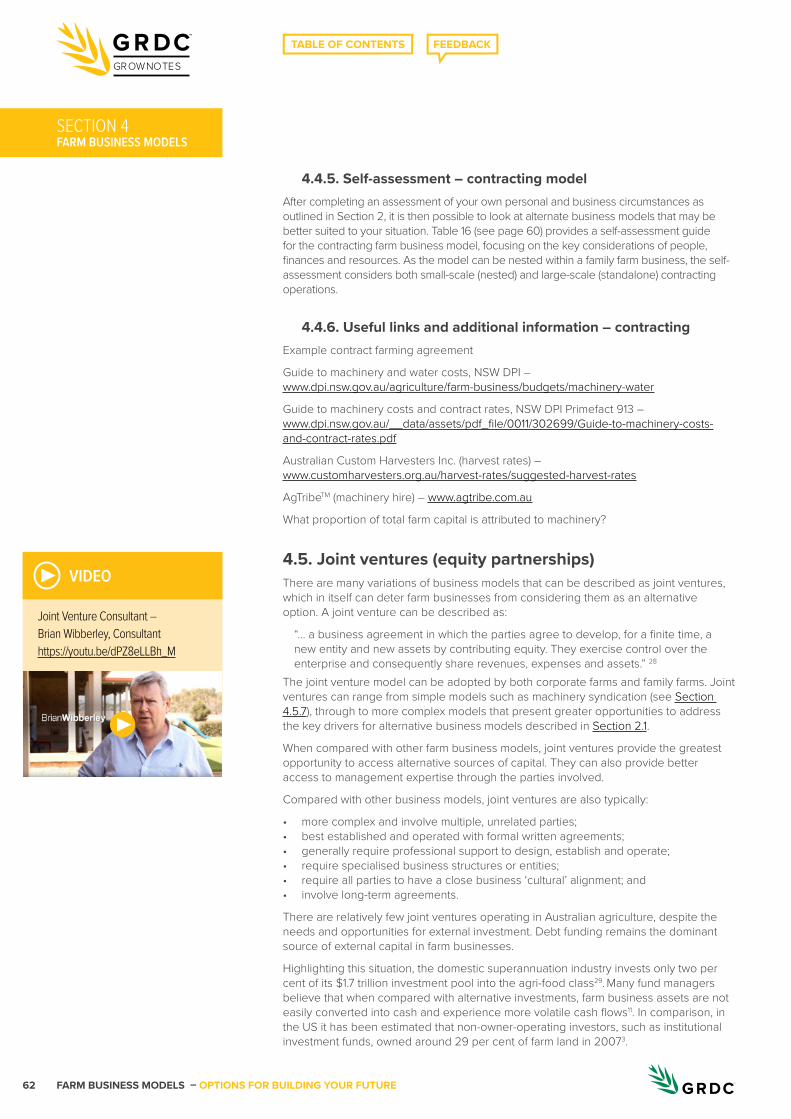
FARM BUSINESS MODELS – OPTIONS FOR BUILDING YOUR FUTURE62
GROWNOTES
FARM BUSINESS MODELSSECTION 4
4.4.5. Self-assessment – contracting modelAfter completing an assessment of your own personal and business circumstances as outlined in Section 2, it is then possible to look at alternate business models that may be better suited to your situation. Table 16 (see page 60) provides a self-assessment guide for the contracting farm business model, focusing on the key considerations of people, finances and resources. As the model can be nested within a family farm business, the self-assessment considers both small-scale (nested) and large-scale (standalone) contracting operations.
4.4.6. Useful links and additional information – contractingExample contract farming agreement
Guide to machinery and water costs, NSW DPI – www.dpi.nsw.gov.au/agriculture/farm-business/budgets/machinery-water
Guide to machinery costs and contract rates, NSW DPI Primefact 913 – www.dpi.nsw.gov.au/__data/assets/pdf_file/0011/302699/Guide-to-machinery-costs-and-contract-rates.pdf
Australian Custom Harvesters Inc. (harvest rates) – www.customharvesters.org.au/harvest-rates/suggested-harvest-rates
AgTribeTM (machinery hire) – www.agtribe.com.au
What proportion of total farm capital is attributed to machinery?
4.5. Joint ventures (equity partnerships)There are many variations of business models that can be described as joint ventures, which in itself can deter farm businesses from considering them as an alternative option. A joint venture can be described as:
“… a business agreement in which the parties agree to develop, for a finite time, a new entity and new assets by contributing equity. They exercise control over the enterprise and consequently share revenues, expenses and assets.” 28
The joint venture model can be adopted by both corporate farms and family farms. Joint ventures can range from simple models such as machinery syndication (see Section 4.5.7), through to more complex models that present greater opportunities to address the key drivers for alternative business models described in Section 2.1.
When compared with other farm business models, joint ventures provide the greatest opportunity to access alternative sources of capital. They can also provide better access to management expertise through the parties involved.
Compared with other business models, joint ventures are also typically:
• more complex and involve multiple, unrelated parties;• best established and operated with formal written agreements;• generally require professional support to design, establish and operate;• require specialised business structures or entities; • require all parties to have a close business ‘cultural’ alignment; and • involve long-term agreements.
There are relatively few joint ventures operating in Australian agriculture, despite the needs and opportunities for external investment. Debt funding remains the dominant source of external capital in farm businesses.
Highlighting this situation, the domestic superannuation industry invests only two per cent of its $1.7 trillion investment pool into the agri-food class29. Many fund managers believe that when compared with alternative investments, farm business assets are not easily converted into cash and experience more volatile cash flows11. In comparison, in the US it has been estimated that non-owner-operating investors, such as institutional investment funds, owned around 29 per cent of farm land in 20073.
▶ VIDEO
Joint Venture Consultant – Brian Wibberley, Consultant https://youtu.be/dPZ8eLLBh_M
▶
FARM BUSINESS MODELS – OPTIONS FOR BUILDING YOUR FUTURE 63
GROWNOTES
FARM BUSINESS MODELSSECTION 4
For the purposes of this document, joint ventures will be discussed in relation to ‘equity partnerships’. Equity partnerships generally provide the greatest flexibility and are most likely to suit family farms seeking an alternative business model. Examples of other joint venture models are found in the link below.
4.5.1. Access to capital through joint venturesJoint ventures provide considerable scope to access other sources of capital as an alternative to debt funding. This is particularly relevant to land purchases, where the scale of the investment and increasing land prices present considerable challenges to farm businesses.
With land representing about 70 to 80 per cent of total farm capital, investing in land is generally profitable but seldom feasible on a cash-flow basis30. As a ‘growth’ asset, land is more suited to equity financing than debt financing, where cash flow is required for servicing debt.
Under the traditional family farm model, the ‘land’ and ‘farming operations’ are both owned by the family business, with the overall profitability being a combination of the returns from both. The farming operations primarily deliver a cash return, with little growth in capital value, while the land does not provide a return until it is sold.
Dividing the farming business into two separate businesses, ‘land’ and ‘farming operations’, can allow the returns from each to be considered separately and over different timeframes30 where:
• ‘land’ returns are measured by changes in asset value over time, with rewards dependent on smart purchase and sale decisions; and
• ‘farming operation’ returns are dependent on effective, efficient and sustainable use of the farm resources.
The two businesses are a form of joint venture, which would usually be linked in their ownership and operation. The challenge is to determine an equitable return to each party.
4.5.2. Equity partnershipsThere are a range of joint-venture models to suit different business drivers. Equity partnerships are one form of joint venture that are usually most suited to family farms, being less complex and generally the most flexible. Note that unlike other business models, equity partnerships are not usually nested within family farms because the capital required to invest is already fully utilised.
Many equity partnerships in Australia and New Zealand are agreements between farm business operators who have ceased their individual family farm businesses to join forces, pooling their resources to form an equity partnership.
Equity partnerships can be described as a joint venture based on an agreement between a few, usually non-related parties such as individuals, partnerships, trusts or companies31 where:
• the parties contribute capital to invest in a business, therefore becoming equity holders; and
• expertise and other resources are often pooled to set up and operate the business.
Similar to family farm business models, it is critical to have good relationships, clear communication and alignment of goals between all parties in an equity partnership. The success of the joint venture also depends on31:
• robust business processes and reporting systems;
• agreed entry and exit processes and strategies for equity holders; and
• agreed processes for dispute resolution.
6.4.9. Corporate farming – a form of joint venture
MORE INFORMATION
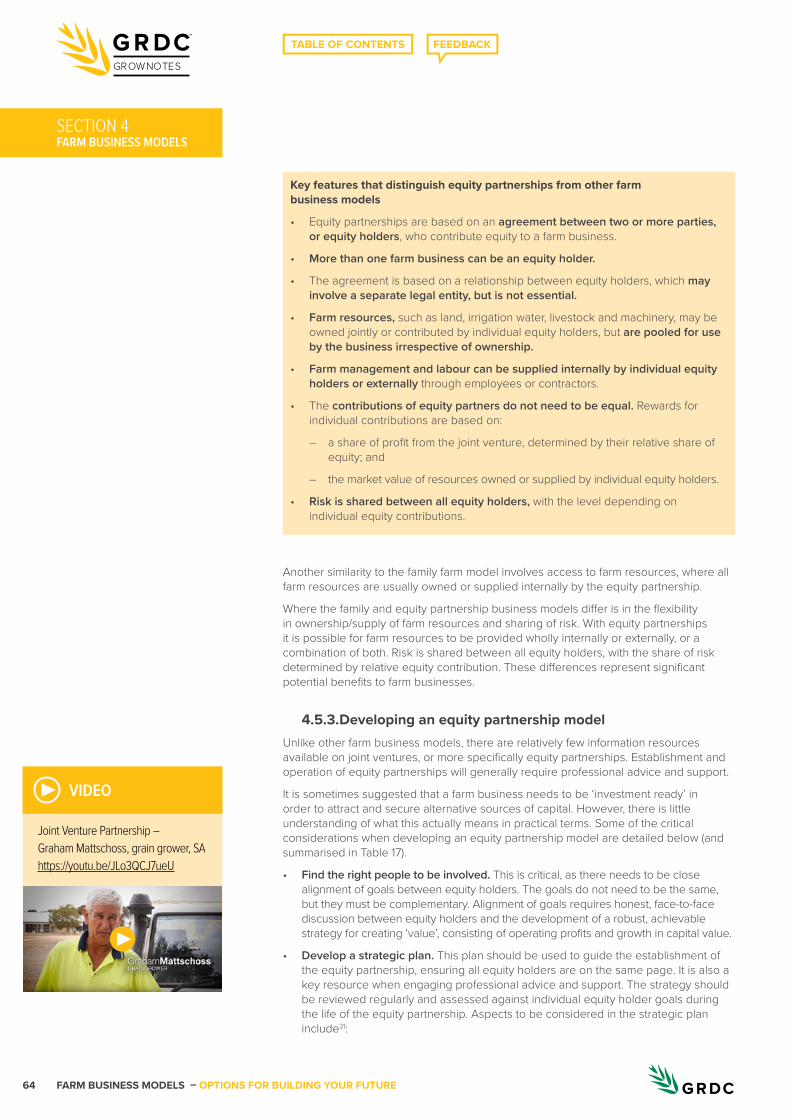
FARM BUSINESS MODELS – OPTIONS FOR BUILDING YOUR FUTURE64
GROWNOTES
FARM BUSINESS MODELS
Another similarity to the family farm model involves access to farm resources, where all farm resources are usually owned or supplied internally by the equity partnership.
Where the family and equity partnership business models differ is in the flexibility in ownership/supply of farm resources and sharing of risk. With equity partnerships it is possible for farm resources to be provided wholly internally or externally, or a combination of both. Risk is shared between all equity holders, with the share of risk determined by relative equity contribution. These differences represent significant potential benefits to farm businesses.
4.5.3. Developing an equity partnership modelUnlike other farm business models, there are relatively few information resources available on joint ventures, or more specifically equity partnerships. Establishment and operation of equity partnerships will generally require professional advice and support.
It is sometimes suggested that a farm business needs to be ‘investment ready’ in order to attract and secure alternative sources of capital. However, there is little understanding of what this actually means in practical terms. Some of the critical considerations when developing an equity partnership model are detailed below (and summarised in Table 17).
• Find the right people to be involved. This is critical, as there needs to be close alignment of goals between equity holders. The goals do not need to be the same, but they must be complementary. Alignment of goals requires honest, face-to-face discussion between equity holders and the development of a robust, achievable strategy for creating ‘value’, consisting of operating profits and growth in capital value.
• Develop a strategic plan. This plan should be used to guide the establishment of the equity partnership, ensuring all equity holders are on the same page. It is also a key resource when engaging professional advice and support. The strategy should be reviewed regularly and assessed against individual equity holder goals during the life of the equity partnership. Aspects to be considered in the strategic plan include31:
▶ VIDEO
Joint Venture Partnership – Graham Mattschoss, grain grower, SA https://youtu.be/JLo3QCJ7ueU
▶
SECTION 4
Key features that distinguish equity partnerships from other farm business models
• Equity partnerships are based on an agreement between two or more parties, or equity holders, who contribute equity to a farm business.
• More than one farm business can be an equity holder.
• The agreement is based on a relationship between equity holders, which may involve a separate legal entity, but is not essential.
• Farm resources, such as land, irrigation water, livestock and machinery, may be owned jointly or contributed by individual equity holders, but are pooled for use by the business irrespective of ownership.
• Farm management and labour can be supplied internally by individual equity holders or externally through employees or contractors.
• The contributions of equity partners do not need to be equal. Rewards for individual contributions are based on:
– a share of profit from the joint venture, determined by their relative share of equity; and
– the market value of resources owned or supplied by individual equity holders.
• Risk is shared between all equity holders, with the level depending on individual equity contributions.
FARM BUSINESS MODELS – OPTIONS FOR BUILDING YOUR FUTURE 65
GROWNOTES
FARM BUSINESS MODELSSECTION 4
– What are the objectives of the equity partnership?
⊲ What brings the parties together?
⊲ If all goals are not shared, are they complementary?
⊲ What farm business resources, in addition to capital, do equity holders bring to the partnership? Can they supply land, irrigation water, livestock, management, labour and machinery for use in the business?
– What is the investment scope and timeframe for the equity partnership?
⊲ What types of assets, enterprises and production systems will be focused on?
⊲ Are the timeframes:
– short term – develop and re-sell for capital gain;
– medium term – develop, improve production and profitability, expand scale and sell as an established business; or
– long term – develop, improve production and profitability, expand scale and continue to operate.
– How will the equity partnership be funded?
⊲ Capital contributions from individual equity holders?
⊲ Debt funding to supplement capital from equity holders?
⊲ Agreed arrangements for additional capital contributions from equity holders, if required?
– What is the business structure and processes to deliver the strategy?
⊲ Consider the legal structure for asset ownership and business operation. The structure needs to allow for unequal equity contributions, ease of entry and exit and business operation.
– Conduct due diligence on investment and operating options or opportunities for the equity partnership, including:
⊲ asset purchases – land, livestock and machinery;
⊲ operations – enterprises and production systems;
⊲ assessing alignment with the strategy; and
⊲ comparing relative investment and business opportunities.
– Define the role of equity partners in the management and operation of the business.
– Define governance structure and processes.
• Establish a board of directors or advisory board. This board should determine and manage strategy, policy and governance for investments and operation of the business. The core roles of the board are to:
– establish a team for day-to-day management of the business, defining position descriptions and recruiting;
– establish and review major business policies in areas of human resource management, financial management and reporting, workplace health and safety (WHS) and general risk management;
– manage returns to equity holders through a dividends distribution policy;
– manage capital and expenditure; and
– oversee the management of debt finance.
Ideally, the board should include independent member(s) in addition to the equity holders and advisers. These members can provide independent input into the strategic

FARM BUSINESS MODELS – OPTIONS FOR BUILDING YOUR FUTURE66
GROWNOTES
FARM BUSINESS MODELS
direction of the business, as well as an independent view when contentious decisions need to be made or there is conflict between equity holders.
• Consider the options for independent management on a day-to-day basis. While the scale of operations will determine the practicality of employing a manager or engaging contract management, there may be benefits in having a manager who is not an equity holder. Independent management can remove a potential source of conflict between equity holders, particularly regarding motivations for management decisions, extra rewards derived or responsibility for poor business performance.
• Develop processes for dispute resolution and the exit of individual equity holders. Changes to individual and business circumstances can mean an equity holder may want to exit the agreement. Exit strategies need to take into account the time taken to sell and release capital, particularly land, to return to the exiting partner.
• Develop processes for entry of new equity partners. Where appropriate, incorporate entry processes into the equity partnership agreement. Entry of new equity partners can provide a pathway for accessing additional capital to fund growth of the business.
4.5.4. Establishing an equitable joint venture agreementFor all farm business models, an equitable agreement is developed by considering the relative contributions and perspectives of all parties. Unlike other models, the establishment of an equitable agreement is integral to equity partnerships and recorded formally through the joint venture agreement.
An equitable agreement under an equity partnership includes the following features.
• Farm business resources, including land, irrigation water, livestock and machinery, may be owned jointly or contributed by individual equity holders, but are pooled for use by the business irrespective of ownership.
• Farm management and labour can be supplied internally by individual equity holders or externally through employees or contractors.
• The contributions of equity partners do not need to be equal. Rewards for individual contributions are based on:
– a share of profit from the joint venture, determined by the partners’ relative share of equity; and
– the market value of resources owned or supplied by individual equity holders.
▶ VIDEO
Joint Venture - Paul Schulz, grain grower, SA https://youtu.be/7cottkz-2W0
▶
SECTION 4
TABLE 17 Developing an equity partnership model – summary.
Do Don’t
Spend time to find the right people to work with. Dismiss differences of opinion between equity holders on strategic management; operate on consensus decision-making.
Invest time in honest, face-to-face discussions with potential equity holders.
Overlook the benefits of having independent board members.
Ensure alignment of goals for equity holders. Underestimate the potential conflict with an individual equity partner being solely responsible for day-to-day management.
Develop a strategic plan for the equity partnership. Overlook the opportunities associated with taking on new equity partners.
Establish and use a board of directors or advisory board for strategic management of the business and consider the inclusion of independent members.
Define processes for dispute resolution and exit/entry of individual equity holders.
FARM BUSINESS MODELS – OPTIONS FOR BUILDING YOUR FUTURE 67
GROWNOTES
FARM BUSINESS MODELSSECTION 4
4.5.5. Analysis of financial performance – joint venturesThe financial performance of a joint venture should be assessed over the duration of a complete crop rotation to account for fluctuating income and expenses with different crop types. Compared with business models such as leasing and share farming, which tend to operate for terms of two to five years, joint ventures tend to operate for much longer periods, so analysing financial performance over the full term of the joint-venture agreement is likely to be impractical.
An analysis of financial performance can be prepared based on crop gross margins, using realistic figures for expected crop production, inputs and machinery operations. This should be based on a detailed crop production plan, outlining the crop rotation, expected yields and prices, as well as key inputs such as seed, fertiliser and chemicals. Links to guidelines and templates for the preparation of gross margin budgets are provide in Section 4.2.7.
Although indicative gross margins are available from state agriculture departments (Section 4.2.7), budgets need to be specific to the joint venture area and proposed management program. Realistic crop yields and grain production should reflect:
• land capability, including soil type and topography;
• local climate, including topographic influences; and
• land use history, which may influence nutrient, pest, weed and disease status.
Developing a management plan that details key inputs through the duration of the joint venture agreement, where possible, will help identify expenses that have a long-term benefit, beyond the term of agreement. Expenditure to address issues such as soil acidity, herbicide-resistant weeds and low nutrient levels can have a significant impact on the profitability of a joint venture operation, but can also increase the value of the property. These expense items are capital improvements and should be specifically accounted for in the terms of the agreement if the land is not owned by the joint venture.
Where the land is owned by the joint venture, the impact of capital improvements on land values is shared by all parties, in accordance with their equity share. However, if the land is owned by one or more of the equity partners and the period of benefits extends beyond the term of the agreement, the costs of capital improvements should be shared between the joint venture and the landowner(s), proportional to the relative benefits derived.
A summary of key items in the financial analysis of a joint venture, specifically an equity partnership, is shown in Table 18. Although equity partnerships can accommodate many variations in how the farming resources are provided, the summary assumes the following contributions:
• land is owned by one of the equity partners – the ‘landowner’;
• management is supplied by another equity partner – the ‘manager’; and
• labour/machinery is supplied by another equity partner – the ‘farm business operator’.
With the exception of land costs, valued at lease rates, most income and expense items can be drawn directly from a standard gross margin budget. Machinery and labour can be valued as opportunity costs, for example using contract rates, which should also allow for depreciation and insurance. Machinery ‘management’ may also be accounted for, allowing an indirect cost for the time associated with planning and monitoring machinery operations.
The analysis assumes a joint working account is established for the agreement, with each party making equal contributions of working capital into the account. All operating expenses are paid from this account.
The summary includes the following items.
• Operating costs. These are the actual costs incurred in the operation of the agreement and the relative sharing between equity holders. Costs for working capital can be sourced from a standard gross margin budget. The opportunity
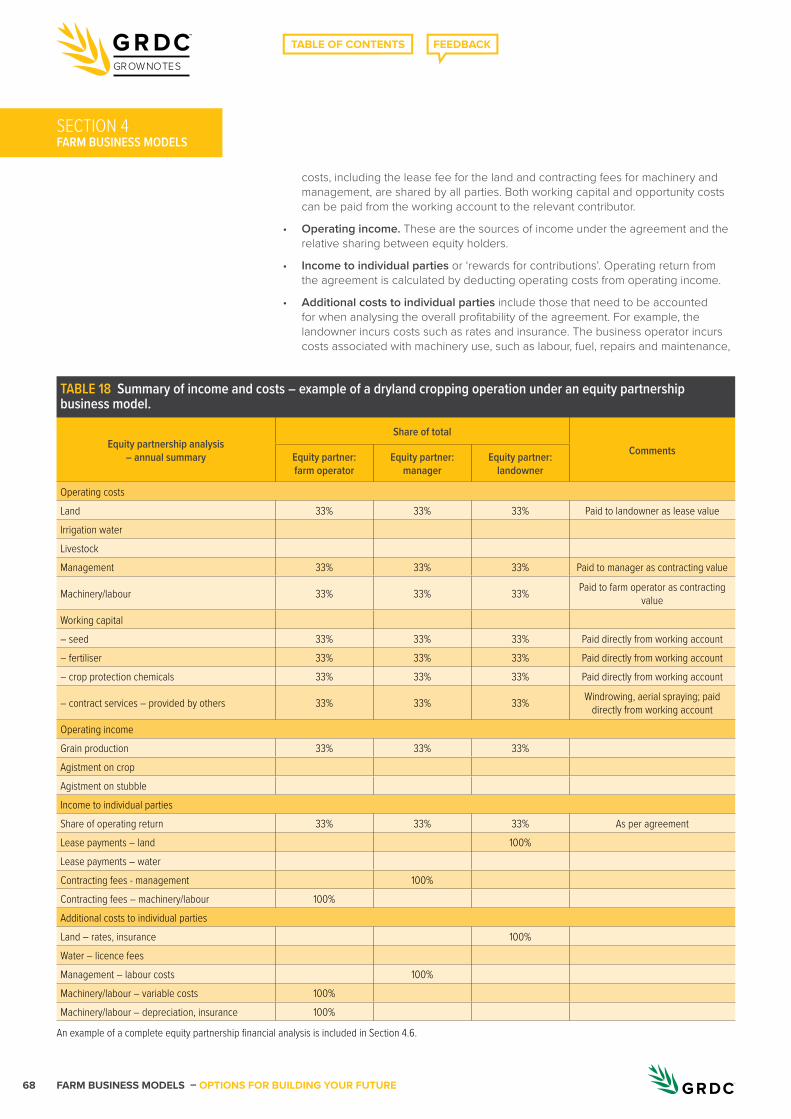
FARM BUSINESS MODELS – OPTIONS FOR BUILDING YOUR FUTURE68
GROWNOTES
FARM BUSINESS MODELS
costs, including the lease fee for the land and contracting fees for machinery and management, are shared by all parties. Both working capital and opportunity costs can be paid from the working account to the relevant contributor.
• Operating income. These are the sources of income under the agreement and the relative sharing between equity holders.
• Income to individual parties or ‘rewards for contributions’. Operating return from the agreement is calculated by deducting operating costs from operating income.
• Additional costs to individual parties include those that need to be accounted for when analysing the overall profitability of the agreement. For example, the landowner incurs costs such as rates and insurance. The business operator incurs costs associated with machinery use, such as labour, fuel, repairs and maintenance,
SECTION 4
TABLE 18 Summary of income and costs – example of a dryland cropping operation under an equity partnership business model.
Equity partnership analysis – annual summary
Share of totalCommentsEquity partner:
farm operatorEquity partner:
managerEquity partner:
landowner
Operating costsLand 33% 33% 33% Paid to landowner as lease valueIrrigation waterLivestockManagement 33% 33% 33% Paid to manager as contracting value
Machinery/labour 33% 33% 33% Paid to farm operator as contracting value
Working capital– seed 33% 33% 33% Paid directly from working account– fertiliser 33% 33% 33% Paid directly from working account– crop protection chemicals 33% 33% 33% Paid directly from working account
– contract services – provided by others 33% 33% 33% Windrowing, aerial spraying; paid directly from working account
Operating incomeGrain production 33% 33% 33%Agistment on cropAgistment on stubbleIncome to individual partiesShare of operating return 33% 33% 33% As per agreementLease payments – land 100%Lease payments – waterContracting fees - management 100%Contracting fees – machinery/labour 100%Additional costs to individual partiesLand – rates, insurance 100%Water – licence feesManagement – labour costs 100%Machinery/labour – variable costs 100%Machinery/labour – depreciation, insurance 100%
An example of a complete equity partnership financial analysis is included in Section 4.6.
FARM BUSINESS MODELS – OPTIONS FOR BUILDING YOUR FUTURE 69
GROWNOTES
FARM BUSINESS MODELSSECTION 4
as well as depreciation and insurance. The manager incurs labour costs such as workers’ compensation and superannuation.
4.5.6. Self-assessment – equity partnership modelAfter completing an assessment of your own personal and business circumstances as outlined in Section 2, it is then possible to look at alternate business models that may be better suited to your situation. Table 19 (see page 70) provides a self-assessment guide for the equity partnership farm business model, focusing on the key considerations of people, finances and resources. Although there are several joint-venture models, equity partnerships are suited to the widest range of personal and business circumstances.
4.5.7. Useful links and additional information – joint venturesIs machinery syndication a good fit for your business? GRDC Business Management fact sheet – www.grdc.com.au/FS-MachinerySyndication
Videos www.grdc.com.au/farm-business-models-playlist
4.6. Financial comparisons of farm business modelsWhen comparing the overall performance of alternative farm business models, it is essential to include both financial and non-financial considerations. Considerations that have been discussed in previous sections include the following.
• What is driving the need to explore other business models? (Section 2.1)
– Improved profitability?
– Risk management?
– Business succession?
– Access to capital?
• What are the personal and business requirements for each party involved? (Section 2.2 to Section 2.5)
A summary of key financial considerations for each farm business model are presented in Section 4.1 to Section 4.5. These include:
• operating costs;
• operating income;
• income to individual parties, as per agreement; and
• additional costs to individual parties.
For a financial analysis of business models, most costs and income can be sourced directly from crop gross margins using realistic figures for expected crop production (yield and price), crop inputs and machinery operations. These should be based on a detailed crop production plan that outlines the crop rotation, expected yields and prices for each crop type, as well as key inputs such as seed, fertiliser and chemicals. For leasing, share-farming and contracting models, the production plan should cover the full term of the agreement.
To illustrate the relative financial performance of farm business models, an analysis has been prepared using the following example. The actual dollar values will be specific to each farm business; as such, there is no substitute for preparing an analysis based on individual personal and business circumstances.
6.4.9. Corporate farming – a form of joint venture
MORE INFORMATION
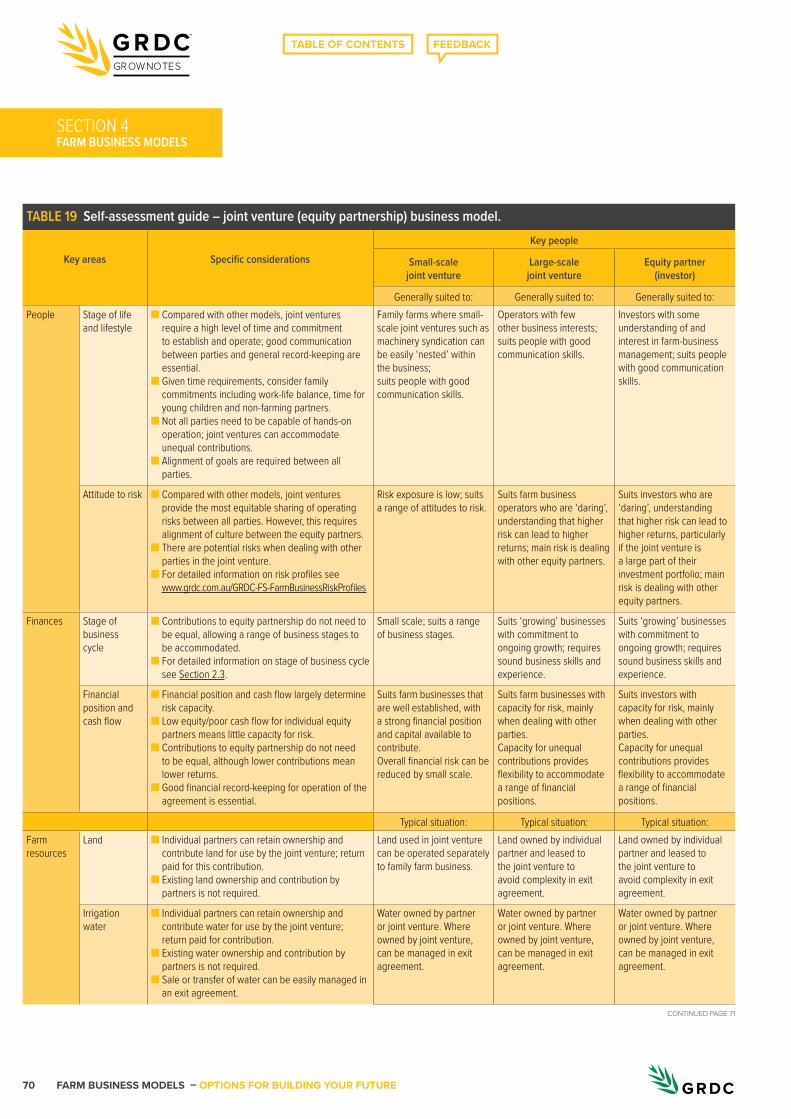
FARM BUSINESS MODELS – OPTIONS FOR BUILDING YOUR FUTURE70
GROWNOTES
FARM BUSINESS MODELSSECTION 4
TABLE 19 Self-assessment guide – joint venture (equity partnership) business model.
Key areas Specific considerationsKey people
Small-scale joint venture
Large-scale joint venture
Equity partner (investor)
Generally suited to: Generally suited to: Generally suited to:People Stage of life
and lifestyle■ Compared with other models, joint ventures
require a high level of time and commitment to establish and operate; good communication between parties and general record-keeping are essential.
■ Given time requirements, consider family commitments including work-life balance, time for young children and non-farming partners.
■ Not all parties need to be capable of hands-on operation; joint ventures can accommodate unequal contributions.
■ Alignment of goals are required between all parties.
Family farms where small-scale joint ventures such as machinery syndication can be easily ‘nested’ within the business;suits people with good communication skills.
Operators with few other business interests; suits people with good communication skills.
Investors with some understanding of and interest in farm-business management; suits people with good communication skills.
Attitude to risk ■ Compared with other models, joint ventures provide the most equitable sharing of operating risks between all parties. However, this requires alignment of culture between the equity partners.
■ There are potential risks when dealing with other parties in the joint venture.
■ For detailed information on risk profiles see www.grdc.com.au/GRDC-FS-FarmBusinessRiskProfiles
Risk exposure is low; suits a range of attitudes to risk.
Suits farm business operators who are ‘daring’, understanding that higher risk can lead to higher returns; main risk is dealing with other equity partners.
Suits investors who are ‘daring’, understanding that higher risk can lead to higher returns, particularly if the joint venture is a large part of their investment portfolio; main risk is dealing with other equity partners.
Finances Stage of business cycle
■ Contributions to equity partnership do not need to be equal, allowing a range of business stages to be accommodated.
■ For detailed information on stage of business cycle see Section 2.3.
Small scale; suits a range of business stages.
Suits ‘growing’ businesses with commitment to ongoing growth; requires sound business skills and experience.
Suits ‘growing’ businesses with commitment to ongoing growth; requires sound business skills and experience.
Financial position andcash flow
■ Financial position and cash flow largely determine risk capacity.
■ Low equity/poor cash flow for individual equity partners means little capacity for risk.
■ Contributions to equity partnership do not need to be equal, although lower contributions mean lower returns.
■ Good financial record-keeping for operation of the agreement is essential.
Suits farm businesses that are well established, with a strong financial position and capital available to contribute.Overall financial risk can be reduced by small scale.
Suits farm businesses with capacity for risk, mainly when dealing with other parties. Capacity for unequal contributions provides flexibility to accommodate a range of financial positions.
Suits investors with capacity for risk, mainly when dealing with other parties. Capacity for unequal contributions provides flexibility to accommodate a range of financial positions.
Typical situation: Typical situation: Typical situation:Farm resources
Land ■ Individual partners can retain ownership and contribute land for use by the joint venture; return paid for this contribution.
■ Existing land ownership and contribution by partners is not required.
Land used in joint venture can be operated separately to family farm business.
Land owned by individual partner and leased to the joint venture to avoid complexity in exit agreement.
Land owned by individual partner and leased to the joint venture to avoid complexity in exit agreement.
Irrigation water
■ Individual partners can retain ownership and contribute water for use by the joint venture; return paid for contribution.
■ Existing water ownership and contribution by partners is not required.
■ Sale or transfer of water can be easily managed in an exit agreement.
Water owned by partner or joint venture. Where owned by joint venture, can be managed in exit agreement.
Water owned by partner or joint venture. Where owned by joint venture, can be managed in exit agreement.
Water owned by partner or joint venture. Where owned by joint venture, can be managed in exit agreement.
CONTINUED PAGE 71
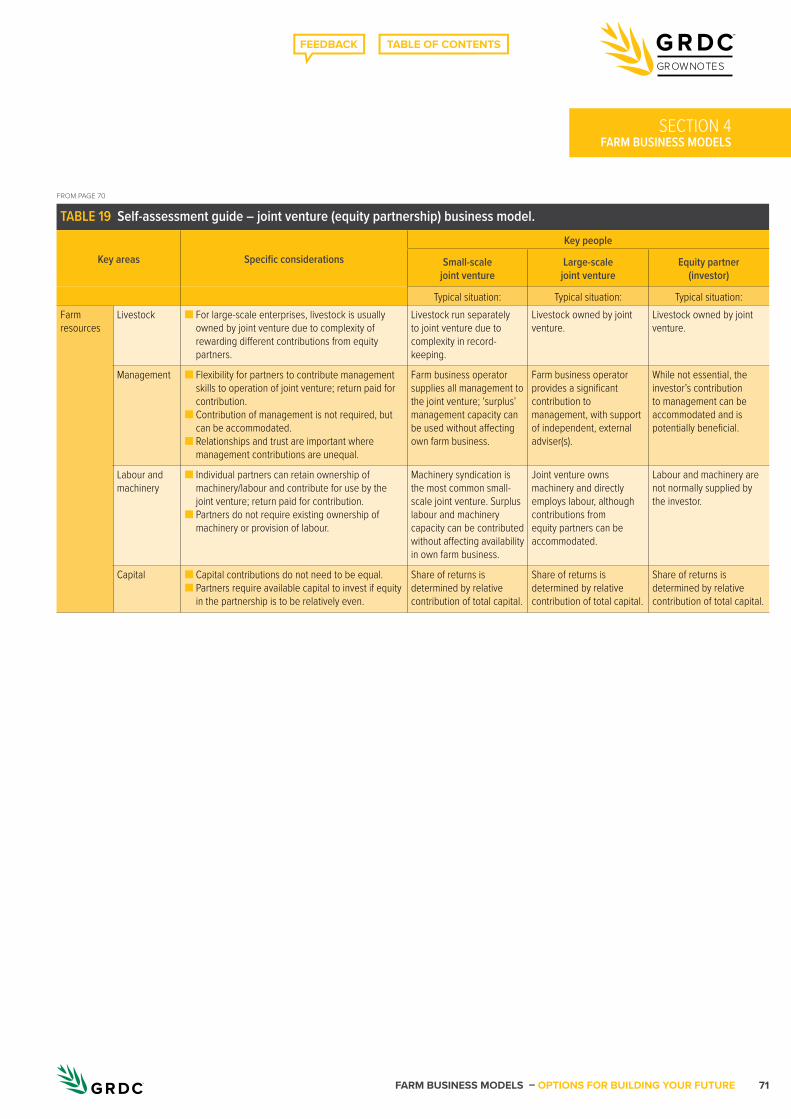
FARM BUSINESS MODELS – OPTIONS FOR BUILDING YOUR FUTURE 71
GROWNOTES
FARM BUSINESS MODELSSECTION 4
TABLE 19 Self-assessment guide – joint venture (equity partnership) business model.
Key areas Specific considerationsKey people
Small-scale joint venture
Large-scale joint venture
Equity partner (investor)
Typical situation: Typical situation: Typical situation:Farm resources
Livestock ■ For large-scale enterprises, livestock is usually owned by joint venture due to complexity of rewarding different contributions from equity partners.
Livestock run separately to joint venture due to complexity in record-keeping.
Livestock owned by joint venture.
Livestock owned by joint venture.
Management ■ Flexibility for partners to contribute management skills to operation of joint venture; return paid for contribution.
■ Contribution of management is not required, but can be accommodated.
■ Relationships and trust are important where management contributions are unequal.
Farm business operator supplies all management to the joint venture; ‘surplus’ management capacity can be used without affecting own farm business.
Farm business operator provides a significant contribution to management, with support of independent, external adviser(s).
While not essential, the investor’s contribution to management can be accommodated and is potentially beneficial.
Labour and machinery
■ Individual partners can retain ownership of machinery/labour and contribute for use by the joint venture; return paid for contribution.
■ Partners do not require existing ownership of machinery or provision of labour.
Machinery syndication is the most common small-scale joint venture. Surplus labour and machinery capacity can be contributed without affecting availability in own farm business.
Joint venture owns machinery and directly employs labour, although contributions from equity partners can be accommodated.
Labour and machinery are not normally supplied by the investor.
Capital ■ Capital contributions do not need to be equal.■ Partners require available capital to invest if equity
in the partnership is to be relatively even.
Share of returns is determined by relative contribution of total capital.
Share of returns is determined by relative contribution of total capital.
Share of returns is determined by relative contribution of total capital.
FROM PAGE 70
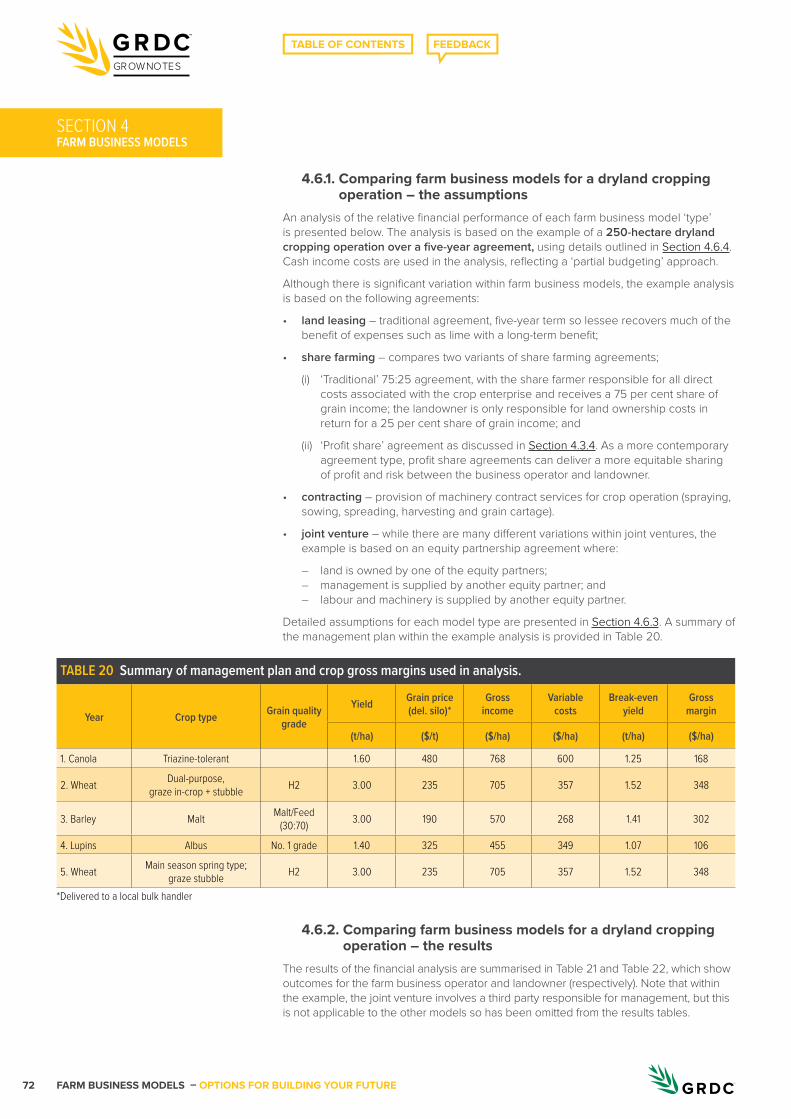
FARM BUSINESS MODELS – OPTIONS FOR BUILDING YOUR FUTURE72
GROWNOTES
FARM BUSINESS MODELSSECTION 4
4.6.1. Comparing farm business models for a dryland cropping operation – the assumptions
An analysis of the relative financial performance of each farm business model ‘type’ is presented below. The analysis is based on the example of a 250-hectare dryland cropping operation over a five-year agreement, using details outlined in Section 4.6.4. Cash income costs are used in the analysis, reflecting a ‘partial budgeting’ approach.
Although there is significant variation within farm business models, the example analysis is based on the following agreements:
• land leasing – traditional agreement, five-year term so lessee recovers much of the benefit of expenses such as lime with a long-term benefit;
• share farming – compares two variants of share farming agreements;
(i) ‘Traditional’ 75:25 agreement, with the share farmer responsible for all direct costs associated with the crop enterprise and receives a 75 per cent share of grain income; the landowner is only responsible for land ownership costs in return for a 25 per cent share of grain income; and
(ii) ‘Profit share’ agreement as discussed in Section 4.3.4. As a more contemporary agreement type, profit share agreements can deliver a more equitable sharing of profit and risk between the business operator and landowner.
• contracting – provision of machinery contract services for crop operation (spraying, sowing, spreading, harvesting and grain cartage).
• joint venture – while there are many different variations within joint ventures, the example is based on an equity partnership agreement where:
– land is owned by one of the equity partners; – management is supplied by another equity partner; and – labour and machinery is supplied by another equity partner.
Detailed assumptions for each model type are presented in Section 4.6.3. A summary of the management plan within the example analysis is provided in Table 20.
4.6.2. Comparing farm business models for a dryland cropping operation – the results
The results of the financial analysis are summarised in Table 21 and Table 22, which show outcomes for the farm business operator and landowner (respectively). Note that within the example, the joint venture involves a third party responsible for management, but this is not applicable to the other models so has been omitted from the results tables.
TABLE 20 Summary of management plan and crop gross margins used in analysis.
Year Crop type Grain quality grade
Yield Grain price (del. silo)*
Gross income
Variable costs
Break-even yield
Gross margin
(t/ha) ($/t) ($/ha) ($/ha) (t/ha) ($/ha)
1. Canola Triazine-tolerant 1.60 480 768 600 1.25 168
2. Wheat Dual-purpose, graze in-crop + stubble H2 3.00 235 705 357 1.52 348
3. Barley Malt Malt/Feed (30:70) 3.00 190 570 268 1.41 302
4. Lupins Albus No. 1 grade 1.40 325 455 349 1.07 106
5. Wheat Main season spring type; graze stubble H2 3.00 235 705 357 1.52 348
*Delivered to a local bulk handler
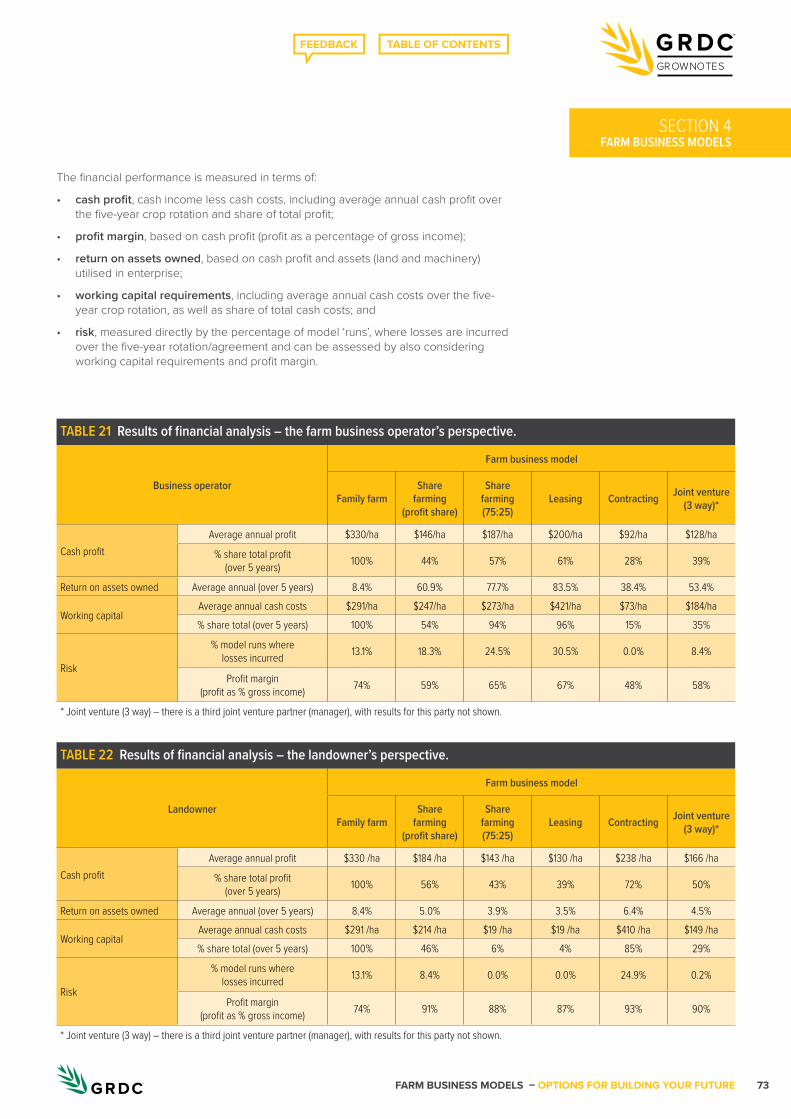
FARM BUSINESS MODELS – OPTIONS FOR BUILDING YOUR FUTURE 73
GROWNOTES
FARM BUSINESS MODELSSECTION 4
The financial performance is measured in terms of:
• cash profit, cash income less cash costs, including average annual cash profit over the five-year crop rotation and share of total profit;
• profit margin, based on cash profit (profit as a percentage of gross income);
• return on assets owned, based on cash profit and assets (land and machinery) utilised in enterprise;
• working capital requirements, including average annual cash costs over the five-year crop rotation, as well as share of total cash costs; and
• risk, measured directly by the percentage of model ‘runs’, where losses are incurred over the five-year rotation/agreement and can be assessed by also considering working capital requirements and profit margin.
TABLE 21 Results of financial analysis – the farm business operator’s perspective.
Business operator
Farm business model
Family farmShare
farming (profit share)
Share farming (75:25)
Leasing Contracting Joint venture (3 way)*
Cash profitAverage annual profit $330/ha $146/ha $187/ha $200/ha $92/ha $128/ha
% share total profit (over 5 years) 100% 44% 57% 61% 28% 39%
Return on assets owned Average annual (over 5 years) 8.4% 60.9% 77.7% 83.5% 38.4% 53.4%
Working capitalAverage annual cash costs $291/ha $247/ha $273/ha $421/ha $73/ha $184/ha% share total (over 5 years) 100% 54% 94% 96% 15% 35%
Risk
% model runs where losses incurred 13.1% 18.3% 24.5% 30.5% 0.0% 8.4%
Profit margin (profit as % gross income) 74% 59% 65% 67% 48% 58%
* Joint venture (3 way) – there is a third joint venture partner (manager), with results for this party not shown.
TABLE 22 Results of financial analysis – the landowner’s perspective.
Landowner
Farm business model
Family farmShare
farming (profit share)
Share farming (75:25)
Leasing Contracting Joint venture (3 way)*
Cash profitAverage annual profit $330 /ha $184 /ha $143 /ha $130 /ha $238 /ha $166 /ha
% share total profit (over 5 years) 100% 56% 43% 39% 72% 50%
Return on assets owned Average annual (over 5 years) 8.4% 5.0% 3.9% 3.5% 6.4% 4.5%
Working capitalAverage annual cash costs $291 /ha $214 /ha $19 /ha $19 /ha $410 /ha $149 /ha% share total (over 5 years) 100% 46% 6% 4% 85% 29%
Risk
% model runs where losses incurred 13.1% 8.4% 0.0% 0.0% 24.9% 0.2%
Profit margin (profit as % gross income) 74% 91% 88% 87% 93% 90%
* Joint venture (3 way) – there is a third joint venture partner (manager), with results for this party not shown.
FARM BUSINESS MODELS – OPTIONS FOR BUILDING YOUR FUTURE74
GROWNOTES
FARM BUSINESS MODELS
While the actual dollar values for the results are specific to the assumptions in the example analysis, the assumptions have less impact on the relative performance of the farm business models. Specifically, the rankings of business models in terms of profit, profit margin, working capital requirements and risk of losses is relatively unaffected by the management operation and production environment in crop enterprises across Australia.
“While management has a significant impact on business performance, the business model used can result in the business sailing into a significant headwind in terms of profitability and risk.”
– David Heinjus, 2016, on findings from GRDC project RDP00013
The financial performance of the models is discussed below in relation to the:
• four drivers for alternative business models; and• parties involved in the agreement, including the farm business operator and landowner.
Depending on the model, the farm business operation will include:
• family farm owner;• share farmer;• lessee (leasing);• contractor; or• joint venture farm operator.
1. Improving profitability
Profitability can be measured by average annual cash profit and profit margin.
• Farm business operator
The family farm produces the highest average annual cash profit as well as the highest profit margin. While the other business models are less profitable, there are other aspects of their financial performance that could make them more attractive.
• Landowner
While the family farm produces the highest average annual cash profit, higher profit margins are produced by the other farm business models.
2. Managing risk
In farm businesses, there is seldom reward without risk. The right balance between risk and reward will be specific to personal and business circumstances. Farm management decisions can be made to reduce risk, but it usually comes at a price, namely a lower financial return32. Farm business models can play an important role in managing risk.
Within the financial analysis, relative financial risk is measured directly by the ‘percentage of model runs where losses are incurred’, as well as working capital requirements and profit margin.
• Farm business operator
Leasing has the highest working capital requirements, with farm business operators being responsible for all operating costs and also the payment of a lease fee for use of the land. However, leasing has the second highest profit margin of the models analysed. Share farming (75:25) and leasing have the highest ‘risk of losses’ (percentage of model runs where losses are incurred), and also have relatively high working capital requirements. This combination makes them particularly risky models for business operators. In contrast, the contracting component has no ‘risk of losses’ in the analysis, with the only real risk being payment default on contract fees. The risk of losses in the joint venture is also relatively low, with risk shared between equity partners.
• Landowner
The contracting model has the highest working capital requirements and ‘risk of losses’, but also the highest profit margin. This reflects the costs associated with land ownership, responsibility for all crop inputs and contracting fees. Share farming (75:25) and leasing have the lowest working capital requirements for landowners, representing only the direct costs associated with land ownership such as rates and insurances.
SECTION 4
FARM BUSINESS MODELS – OPTIONS FOR BUILDING YOUR FUTURE 75
GROWNOTES
FARM BUSINESS MODELSSECTION 4
Share farming (75:25) and leasing have no risk of losses in the example. For share farming (75:25), allowances for management of failed crops (cutting hay and/or reducing crop inputs) and of livestock in the example analysis remove the risk of losses with crop failure for the landowner. This may not occur in all share-farming agreements, with some risk of loss for landowners with share farming, albeit much lower than all other models (with the exception of leasing). The landowner in a joint venture also has a very low ‘risk of loss’, with risk shared between equity partners.
3. Supporting business succession
The specific financial needs of business succession vary widely with individual circumstances, but generally there are capital requirements associated with the next generation purchasing farm business assets and providing for off-farm family members. In most cases of intergenerational transfer of family farms there is considerable equity passed on from one generation to the next, meaning that the full value of farm assets is required to fund succession.
Where the business has strong (high) equity, debt financing can be used by the next generation for working capital and providing for the previous generation and needs of off-farm family members. Alternatively, where equity is weak (low) or when the previous generation needs to realise a significant proportion of their assets to provide for their needs in retirement, debt funding can become a challenge. This can limit the availability of working capital to the family member(s) remaining on-farm18.
Farm business models that require relatively low working capital can assist with implementation of business succession plans.
• Farm business operator
Contracting and joint ventures require the lowest working capital of the models analysed and may suit business operators with limited available capital. In contrast, leasing requires considerable working capital due to the payment of lease fees.
• Landowner
Share farming (75:25) and leasing agreements have the lowest working capital requirements for landowners, limited to direct costs associated with land ownership such as rates and insurance. Both these models may be attractive to a landowner with limited available capital, which may occur where the land has been purchased through debt funding.
4. Increasing access to capital
• Farm business operator
Of the business models analysed, share farming and joint ventures provide greater access to capital through external investment from the landowner/joint venture partners, as an alternative to debt funding. This is reflected in the relatively low share of annual costs for business operators with these models. While share farming, leasing, contracting and joint ventures all reduce the total capital required (no land ownership), accessing working capital can be challenging without land as security for borrowings. This is particularly important with leasing due to the high working capital requirements.
• Landowner
Like the situation for business operators, share farming and joint ventures provide greater access to capital through external investment from the business operator/joint-venture partners, as an alternative to debt funding. However, unlike the situation for business operators, land ownership provides security for borrowings, making it easier to access working capital.
4.6.3. Varying key inputs – what happens to financial returns?Variation in crop yields, grain prices and key crop inputs have a significant bearing on the results of any financial analysis of crop enterprises. A common limitation with financial analyses is the way risk is analysed and considered. Most analyses are based solely on averages, which mask variability and as a result hide risk32.
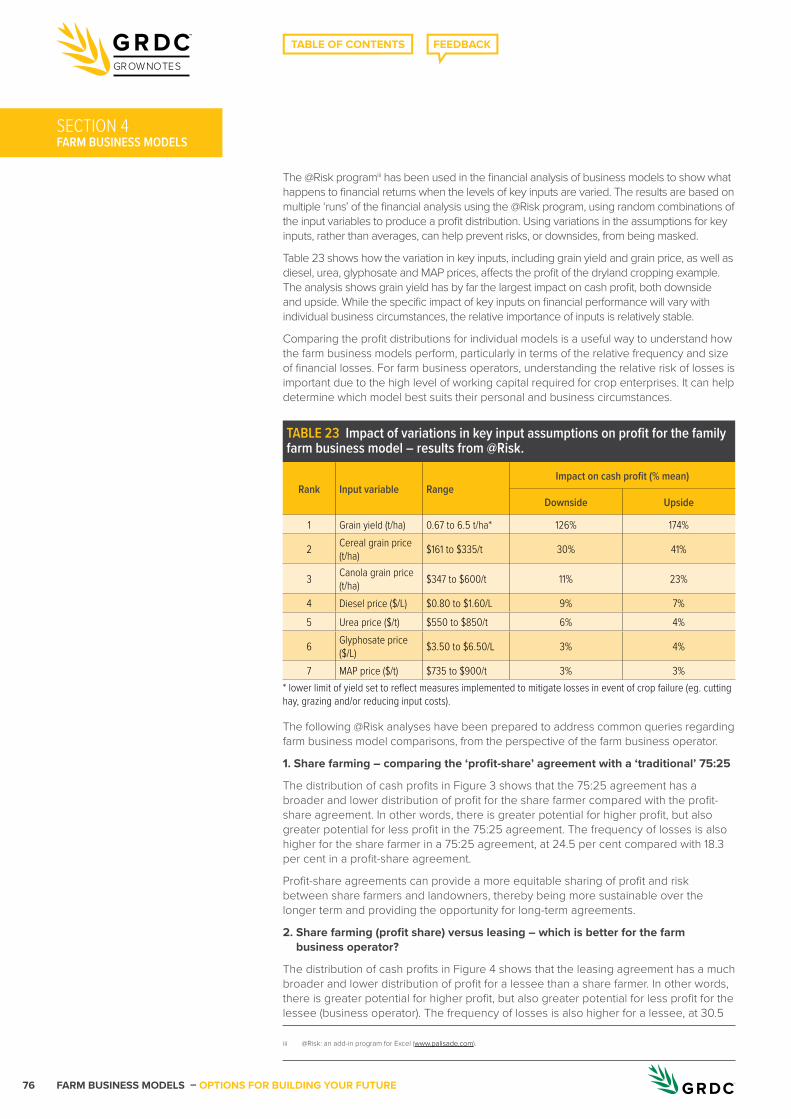
FARM BUSINESS MODELS – OPTIONS FOR BUILDING YOUR FUTURE76
GROWNOTES
FARM BUSINESS MODELS
The @Risk programiii has been used in the financial analysis of business models to show what happens to financial returns when the levels of key inputs are varied. The results are based on multiple ‘runs’ of the financial analysis using the @Risk program, using random combinations of the input variables to produce a profit distribution. Using variations in the assumptions for key inputs, rather than averages, can help prevent risks, or downsides, from being masked.
Table 23 shows how the variation in key inputs, including grain yield and grain price, as well as diesel, urea, glyphosate and MAP prices, affects the profit of the dryland cropping example. The analysis shows grain yield has by far the largest impact on cash profit, both downside and upside. While the specific impact of key inputs on financial performance will vary with individual business circumstances, the relative importance of inputs is relatively stable.
Comparing the profit distributions for individual models is a useful way to understand how the farm business models perform, particularly in terms of the relative frequency and size of financial losses. For farm business operators, understanding the relative risk of losses is important due to the high level of working capital required for crop enterprises. It can help determine which model best suits their personal and business circumstances.
The following @Risk analyses have been prepared to address common queries regarding farm business model comparisons, from the perspective of the farm business operator.
1. Share farming – comparing the ‘profit-share’ agreement with a ‘traditional’ 75:25
The distribution of cash profits in Figure 3 shows that the 75:25 agreement has a broader and lower distribution of profit for the share farmer compared with the profit-share agreement. In other words, there is greater potential for higher profit, but also greater potential for less profit in the 75:25 agreement. The frequency of losses is also higher for the share farmer in a 75:25 agreement, at 24.5 per cent compared with 18.3 per cent in a profit-share agreement.
Profit-share agreements can provide a more equitable sharing of profit and risk between share farmers and landowners, thereby being more sustainable over the longer term and providing the opportunity for long-term agreements.
2. Share farming (profit share) versus leasing – which is better for the farm business operator?
The distribution of cash profits in Figure 4 shows that the leasing agreement has a much broader and lower distribution of profit for a lessee than a share farmer. In other words, there is greater potential for higher profit, but also greater potential for less profit for the lessee (business operator). The frequency of losses is also higher for a lessee, at 30.5
SECTION 4
TABLE 23 Impact of variations in key input assumptions on profit for the family farm business model – results from @Risk.
Rank Input variable RangeImpact on cash profit (% mean)
Downside Upside
1 Grain yield (t/ha) 0.67 to 6.5 t/ha* 126% 174%
2 Cereal grain price (t/ha) $161 to $335/t 30% 41%
3 Canola grain price (t/ha) $347 to $600/t 11% 23%
4 Diesel price ($/L) $0.80 to $1.60/L 9% 7%5 Urea price ($/t) $550 to $850/t 6% 4%
6 Glyphosate price ($/L) $3.50 to $6.50/L 3% 4%
7 MAP price ($/t) $735 to $900/t 3% 3%* lower limit of yield set to reflect measures implemented to mitigate losses in event of crop failure (eg. cutting hay, grazing and/or reducing input costs).
iii @Risk: an add-in program for Excel (www.palisade.com).
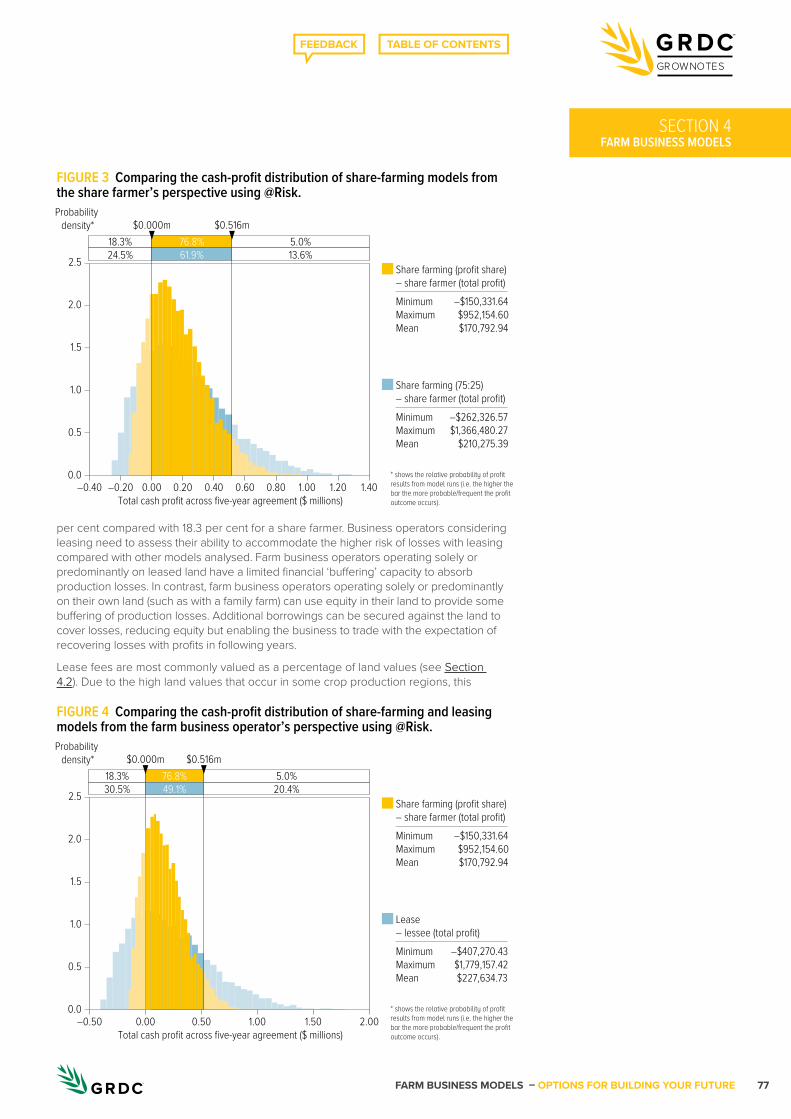
FARM BUSINESS MODELS – OPTIONS FOR BUILDING YOUR FUTURE 77
GROWNOTES
FARM BUSINESS MODELSSECTION 4
per cent compared with 18.3 per cent for a share farmer. Business operators considering leasing need to assess their ability to accommodate the higher risk of losses with leasing compared with other models analysed. Farm business operators operating solely or predominantly on leased land have a limited financial ‘buffering’ capacity to absorb production losses. In contrast, farm business operators operating solely or predominantly on their own land (such as with a family farm) can use equity in their land to provide some buffering of production losses. Additional borrowings can be secured against the land to cover losses, reducing equity but enabling the business to trade with the expectation of recovering losses with profits in following years.
Lease fees are most commonly valued as a percentage of land values (see Section 4.2). Due to the high land values that occur in some crop production regions, this
FIGURE 3 Comparing the cash-profit distribution of share-farming models from the share farmer’s perspective using @Risk.
Share farming (profit share)– share farmer (total profit)Minimum –$150,331.64Maximum $952,154.60Mean $170,792.94
Share farming (75:25)– share farmer (total profit)Minimum –$262,326.57Maximum $1,366,480.27Mean $210,275.39
–0.40 –0.20
24.5%18.3%
$0.000m $0.516m
13.6%5.0%
0.00 0.20 0.40 0.60 0.80 1.00 1.20 1.40
2.5
2.0
1.5
1.0
0.5
0.0
61.9%76.8%
* shows the relative probability of profit results from model runs (i.e. the higher the bar the more probable/frequent the profit outcome occurs).
Probability density*
Total cash profit across five-year agreement ($ millions)
FIGURE 4 Comparing the cash-profit distribution of share-farming and leasing models from the farm business operator’s perspective using @Risk.
Share farming (profit share)– share farmer (total profit)Minimum –$150,331.64Maximum $952,154.60Mean $170,792.94
Lease– lessee (total profit)Minimum –$407,270.43Maximum $1,779,157.42Mean $227,634.73
–0.50
30.5%18.3%
$0.000m $0.516m
20.4%5.0%
0.00 0.50 1.00 1.50 2.00
2.5
2.0
1.5
1.0
0.5
0.0
49.1%76.8%
* shows the relative probability of profit results from model runs (i.e. the higher the bar the more probable/frequent the profit outcome occurs).
Probability density*
Total cash profit across five-year agreement ($ millions)
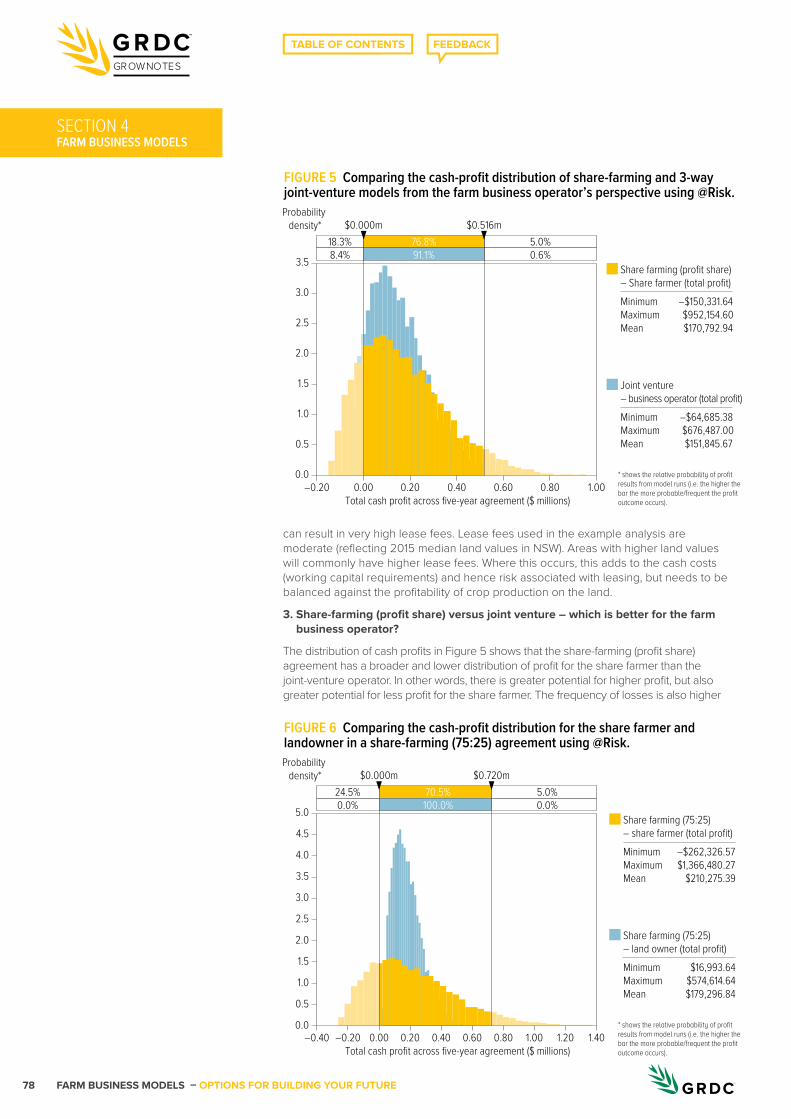
FARM BUSINESS MODELS – OPTIONS FOR BUILDING YOUR FUTURE78
GROWNOTES
FARM BUSINESS MODELS
can result in very high lease fees. Lease fees used in the example analysis are moderate (reflecting 2015 median land values in NSW). Areas with higher land values will commonly have higher lease fees. Where this occurs, this adds to the cash costs (working capital requirements) and hence risk associated with leasing, but needs to be balanced against the profitability of crop production on the land.
3. Share-farming (profit share) versus joint venture – which is better for the farm business operator?
The distribution of cash profits in Figure 5 shows that the share-farming (profit share) agreement has a broader and lower distribution of profit for the share farmer than the joint-venture operator. In other words, there is greater potential for higher profit, but also greater potential for less profit for the share farmer. The frequency of losses is also higher
SECTION 4
FIGURE 5 Comparing the cash-profit distribution of share-farming and 3-way joint-venture models from the farm business operator’s perspective using @Risk.
Share farming (profit share)– Share farmer (total profit)Minimum –$150,331.64Maximum $952,154.60Mean $170,792.94
Joint venture– business operator (total profit)Minimum –$64,685.38Maximum $676,487.00Mean $151,845.67
–0.20
8.4%18.3%
$0.000m $0.516m
0.6%5.0%
0.00 0.20 0.40 0.800.60 1.00
3.5
3.0
2.5
2.0
1.5
1.0
0.5
0.0
91.1%76.8%
* shows the relative probability of profit results from model runs (i.e. the higher the bar the more probable/frequent the profit outcome occurs).
Probability density*
Total cash profit across five-year agreement ($ millions)
FIGURE 6 Comparing the cash-profit distribution for the share farmer and landowner in a share-farming (75:25) agreement using @Risk.
Share farming (75:25)– share farmer (total profit)Minimum –$262,326.57Maximum $1,366,480.27Mean $210,275.39
Share farming (75:25)– land owner (total profit)Minimum $16,993.64Maximum $574,614.64Mean $179,296.84
–0.40 –0.20
0.0%24.5%
$0.000m $0.720m5.0%
0.00 0.20 0.40 1.00 1.200.800.60 1.40
5.0
4.5
4.0
3.5
3.0
2.5
2.0
1.5
1.0
0.5
0.0
100.0%70.5%
0.0%
* shows the relative probability of profit results from model runs (i.e. the higher the bar the more probable/frequent the profit outcome occurs).
Probability density*
Total cash profit across five-year agreement ($ millions)
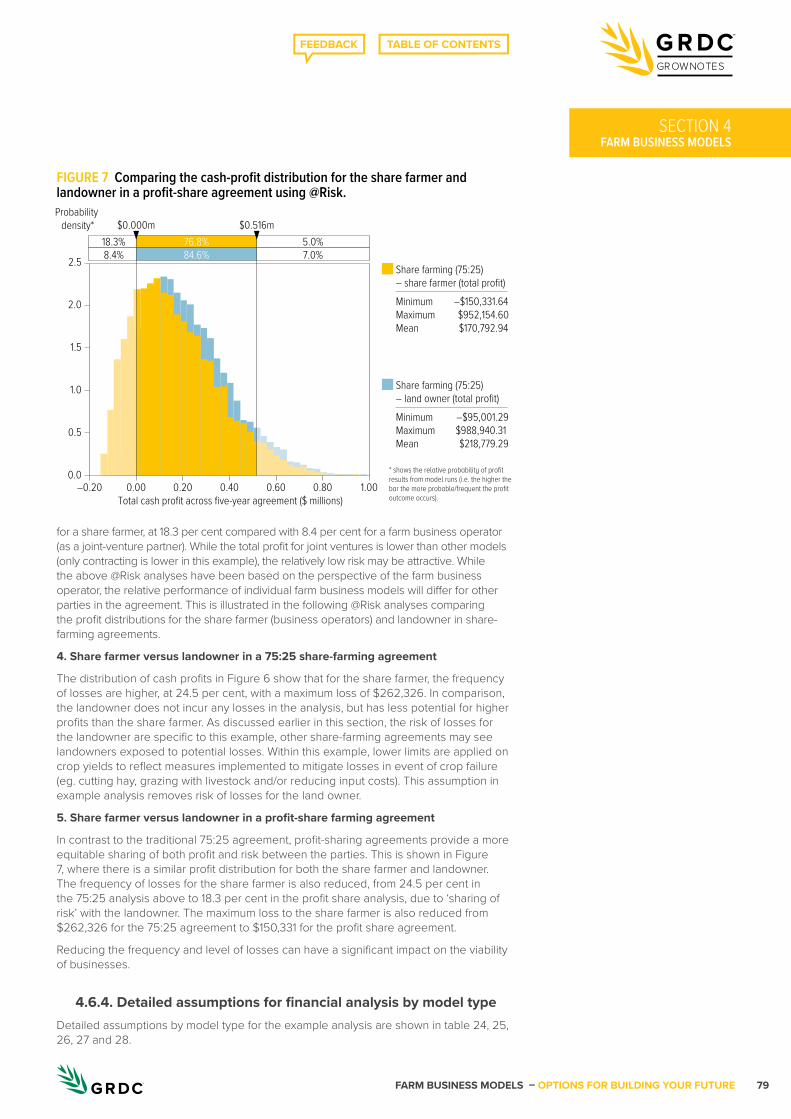
FARM BUSINESS MODELS – OPTIONS FOR BUILDING YOUR FUTURE 79
GROWNOTES
FARM BUSINESS MODELSSECTION 4
for a share farmer, at 18.3 per cent compared with 8.4 per cent for a farm business operator (as a joint-venture partner). While the total profit for joint ventures is lower than other models (only contracting is lower in this example), the relatively low risk may be attractive. While the above @Risk analyses have been based on the perspective of the farm business operator, the relative performance of individual farm business models will differ for other parties in the agreement. This is illustrated in the following @Risk analyses comparing the profit distributions for the share farmer (business operators) and landowner in share-farming agreements.
4. Share farmer versus landowner in a 75:25 share-farming agreement
The distribution of cash profits in Figure 6 show that for the share farmer, the frequency of losses are higher, at 24.5 per cent, with a maximum loss of $262,326. In comparison, the landowner does not incur any losses in the analysis, but has less potential for higher profits than the share farmer. As discussed earlier in this section, the risk of losses for the landowner are specific to this example, other share-farming agreements may see landowners exposed to potential losses. Within this example, lower limits are applied on crop yields to reflect measures implemented to mitigate losses in event of crop failure (eg. cutting hay, grazing with livestock and/or reducing input costs). This assumption in example analysis removes risk of losses for the land owner.
5. Share farmer versus landowner in a profit-share farming agreement
In contrast to the traditional 75:25 agreement, profit-sharing agreements provide a more equitable sharing of both profit and risk between the parties. This is shown in Figure 7, where there is a similar profit distribution for both the share farmer and landowner. The frequency of losses for the share farmer is also reduced, from 24.5 per cent in the 75:25 analysis above to 18.3 per cent in the profit share analysis, due to ‘sharing of risk’ with the landowner. The maximum loss to the share farmer is also reduced from $262,326 for the 75:25 agreement to $150,331 for the profit share agreement.
Reducing the frequency and level of losses can have a significant impact on the viability of businesses.
4.6.4. Detailed assumptions for financial analysis by model typeDetailed assumptions by model type for the example analysis are shown in table 24, 25, 26, 27 and 28.
FIGURE 7 Comparing the cash-profit distribution for the share farmer and landowner in a profit-share agreement using @Risk.
Share farming (75:25)– share farmer (total profit)Minimum –$150,331.64Maximum $952,154.60Mean $170,792.94
Share farming (75:25)– land owner (total profit)Minimum –$95,001.29Maximum $988,940.31Mean $218,779.29
Probability density*
–0.20
$0.000m $0.516m5.0%
0.00 0.20Total cash profit across five-year agreement ($ millions)
0.40 0.800.60 1.00
2.5
2.0
1.5
1.0
0.5
0.0
84.6%76.8%
7.0%18.3%8.4%
* shows the relative probability of profit results from model runs (i.e. the higher the bar the more probable/frequent the profit outcome occurs).
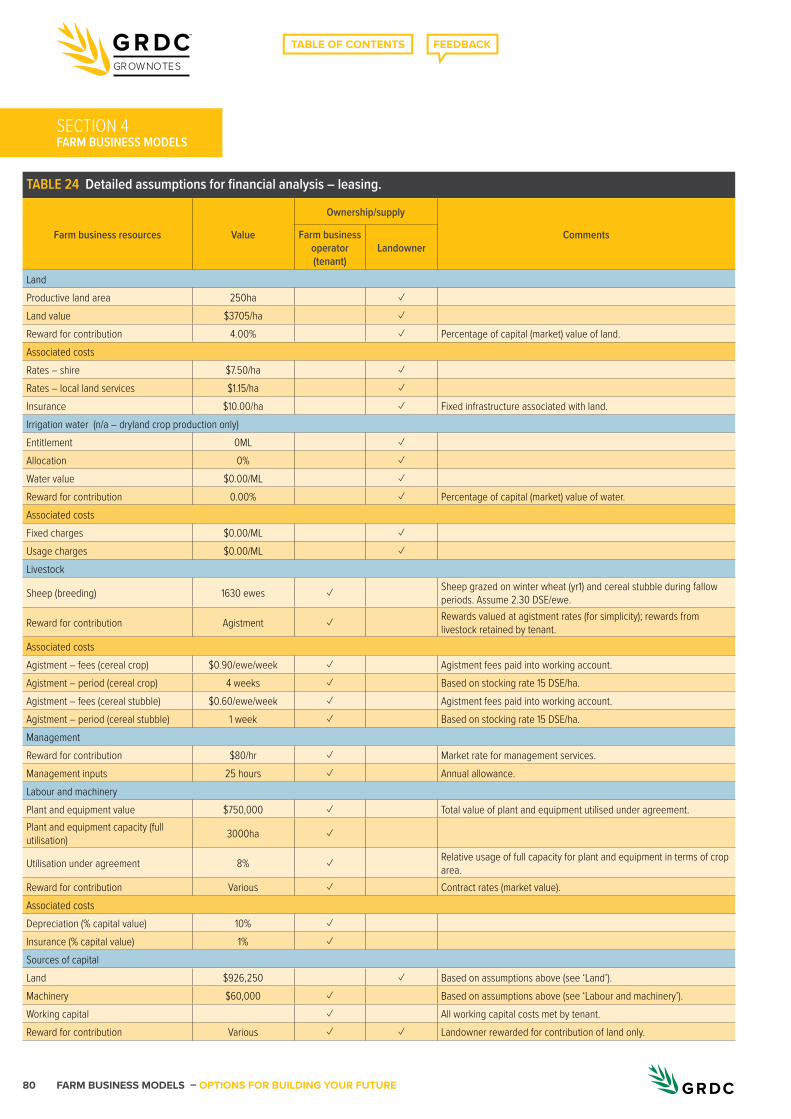
FARM BUSINESS MODELS – OPTIONS FOR BUILDING YOUR FUTURE80
GROWNOTES
FARM BUSINESS MODELSSECTION 4
TABLE 24 Detailed assumptions for financial analysis – leasing.
Farm business resources Value
Ownership/supply
CommentsFarm business operator (tenant)
Landowner
LandProductive land area 250ha ✓Land value $3705/ha ✓Reward for contribution 4.00% ✓ Percentage of capital (market) value of land.Associated costsRates – shire $7.50/ha ✓Rates – local land services $1.15/ha ✓Insurance $10.00/ha ✓ Fixed infrastructure associated with land.Irrigation water (n/a – dryland crop production only)Entitlement 0ML ✓Allocation 0% ✓Water value $0.00/ML ✓Reward for contribution 0.00% ✓ Percentage of capital (market) value of water.Associated costsFixed charges $0.00/ML ✓Usage charges $0.00/ML ✓Livestock
Sheep (breeding) 1630 ewes ✓ Sheep grazed on winter wheat (yr1) and cereal stubble during fallow periods. Assume 2.30 DSE/ewe.
Reward for contribution Agistment ✓ Rewards valued at agistment rates (for simplicity); rewards from livestock retained by tenant.
Associated costsAgistment – fees (cereal crop) $0.90/ewe/week ✓ Agistment fees paid into working account.Agistment – period (cereal crop) 4 weeks ✓ Based on stocking rate 15 DSE/ha.Agistment – fees (cereal stubble) $0.60/ewe/week ✓ Agistment fees paid into working account.Agistment – period (cereal stubble) 1 week ✓ Based on stocking rate 15 DSE/ha.ManagementReward for contribution $80/hr ✓ Market rate for management services.Management inputs 25 hours ✓ Annual allowance.Labour and machineryPlant and equipment value $750,000 ✓ Total value of plant and equipment utilised under agreement.Plant and equipment capacity (full utilisation) 3000ha ✓
Utilisation under agreement 8% ✓ Relative usage of full capacity for plant and equipment in terms of crop area.
Reward for contribution Various ✓ Contract rates (market value).Associated costsDepreciation (% capital value) 10% ✓Insurance (% capital value) 1% ✓Sources of capitalLand $926,250 ✓ Based on assumptions above (see ‘Land’).Machinery $60,000 ✓ Based on assumptions above (see ‘Labour and machinery’).Working capital ✓ All working capital costs met by tenant.Reward for contribution Various ✓ ✓ Landowner rewarded for contribution of land only.
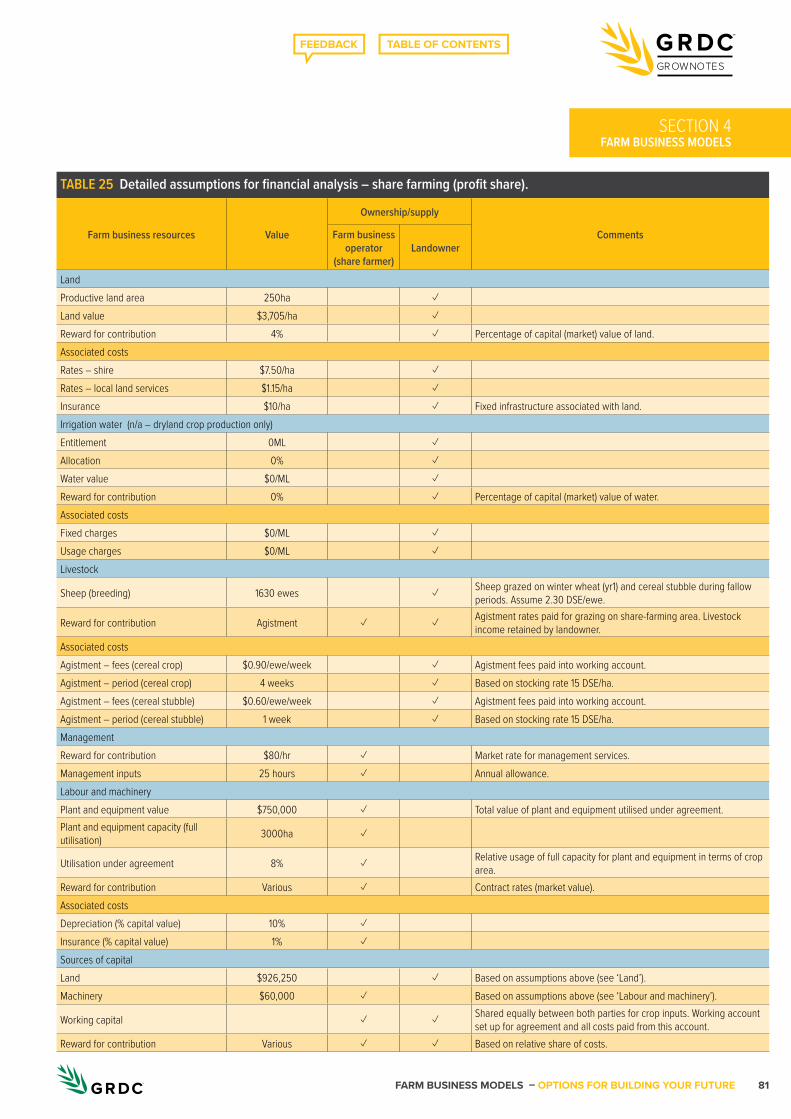
FARM BUSINESS MODELS – OPTIONS FOR BUILDING YOUR FUTURE 81
GROWNOTES
FARM BUSINESS MODELSSECTION 4
TABLE 25 Detailed assumptions for financial analysis – share farming (profit share).
Farm business resources Value
Ownership/supply
CommentsFarm business operator
(share farmer)Landowner
LandProductive land area 250ha ✓Land value $3,705/ha ✓Reward for contribution 4% ✓ Percentage of capital (market) value of land.Associated costsRates – shire $7.50/ha ✓Rates – local land services $1.15/ha ✓Insurance $10/ha ✓ Fixed infrastructure associated with land.Irrigation water (n/a – dryland crop production only)Entitlement 0ML ✓Allocation 0% ✓Water value $0/ML ✓Reward for contribution 0% ✓ Percentage of capital (market) value of water.Associated costsFixed charges $0/ML ✓Usage charges $0/ML ✓Livestock
Sheep (breeding) 1630 ewes ✓ Sheep grazed on winter wheat (yr1) and cereal stubble during fallow periods. Assume 2.30 DSE/ewe.
Reward for contribution Agistment ✓ ✓ Agistment rates paid for grazing on share-farming area. Livestock income retained by landowner.
Associated costsAgistment – fees (cereal crop) $0.90/ewe/week ✓ Agistment fees paid into working account.Agistment – period (cereal crop) 4 weeks ✓ Based on stocking rate 15 DSE/ha.Agistment – fees (cereal stubble) $0.60/ewe/week ✓ Agistment fees paid into working account.Agistment – period (cereal stubble) 1 week ✓ Based on stocking rate 15 DSE/ha.ManagementReward for contribution $80/hr ✓ Market rate for management services.Management inputs 25 hours ✓ Annual allowance.Labour and machineryPlant and equipment value $750,000 ✓ Total value of plant and equipment utilised under agreement.Plant and equipment capacity (full utilisation) 3000ha ✓
Utilisation under agreement 8% ✓ Relative usage of full capacity for plant and equipment in terms of crop area.
Reward for contribution Various ✓ Contract rates (market value).Associated costsDepreciation (% capital value) 10% ✓Insurance (% capital value) 1% ✓Sources of capitalLand $926,250 ✓ Based on assumptions above (see ‘Land’).Machinery $60,000 ✓ Based on assumptions above (see ‘Labour and machinery’).
Working capital ✓ ✓ Shared equally between both parties for crop inputs. Working account set up for agreement and all costs paid from this account.
Reward for contribution Various ✓ ✓ Based on relative share of costs.
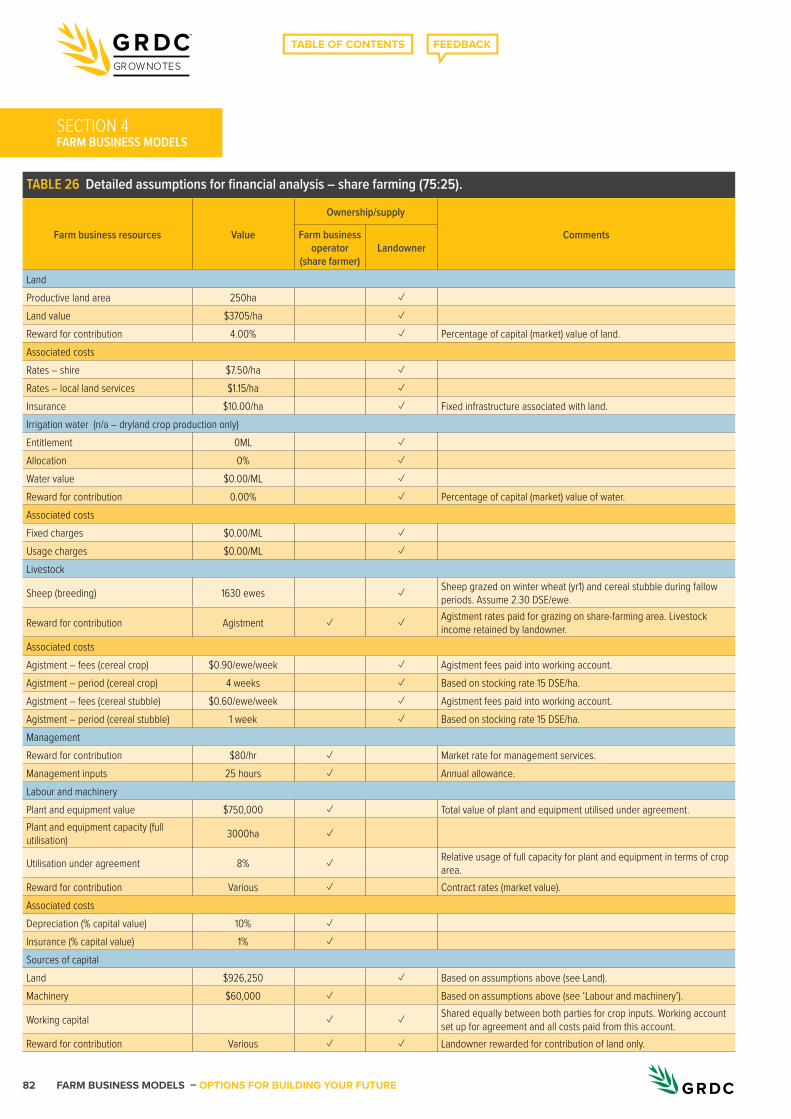
FARM BUSINESS MODELS – OPTIONS FOR BUILDING YOUR FUTURE82
GROWNOTES
FARM BUSINESS MODELSSECTION 4
TABLE 26 Detailed assumptions for financial analysis – share farming (75:25).
Farm business resources Value
Ownership/supply
CommentsFarm business operator
(share farmer)Landowner
LandProductive land area 250ha ✓Land value $3705/ha ✓Reward for contribution 4.00% ✓ Percentage of capital (market) value of land.Associated costsRates – shire $7.50/ha ✓Rates – local land services $1.15/ha ✓Insurance $10.00/ha ✓ Fixed infrastructure associated with land.Irrigation water (n/a – dryland crop production only)Entitlement 0ML ✓Allocation 0% ✓Water value $0.00/ML ✓Reward for contribution 0.00% ✓ Percentage of capital (market) value of water.Associated costsFixed charges $0.00/ML ✓Usage charges $0.00/ML ✓Livestock
Sheep (breeding) 1630 ewes ✓ Sheep grazed on winter wheat (yr1) and cereal stubble during fallow periods. Assume 2.30 DSE/ewe.
Reward for contribution Agistment ✓ ✓ Agistment rates paid for grazing on share-farming area. Livestock income retained by landowner.
Associated costsAgistment – fees (cereal crop) $0.90/ewe/week ✓ Agistment fees paid into working account.Agistment – period (cereal crop) 4 weeks ✓ Based on stocking rate 15 DSE/ha.Agistment – fees (cereal stubble) $0.60/ewe/week ✓ Agistment fees paid into working account.Agistment – period (cereal stubble) 1 week ✓ Based on stocking rate 15 DSE/ha.ManagementReward for contribution $80/hr ✓ Market rate for management services.Management inputs 25 hours ✓ Annual allowance.Labour and machineryPlant and equipment value $750,000 ✓ Total value of plant and equipment utilised under agreement.Plant and equipment capacity (full utilisation) 3000ha ✓
Utilisation under agreement 8% ✓ Relative usage of full capacity for plant and equipment in terms of crop area.
Reward for contribution Various ✓ Contract rates (market value).Associated costsDepreciation (% capital value) 10% ✓Insurance (% capital value) 1% ✓Sources of capitalLand $926,250 ✓ Based on assumptions above (see Land).Machinery $60,000 ✓ Based on assumptions above (see ‘Labour and machinery’).
Working capital ✓ ✓ Shared equally between both parties for crop inputs. Working account set up for agreement and all costs paid from this account.
Reward for contribution Various ✓ ✓ Landowner rewarded for contribution of land only.

FARM BUSINESS MODELS – OPTIONS FOR BUILDING YOUR FUTURE 83
GROWNOTES
FARM BUSINESS MODELSSECTION 4
TABLE 27 Detailed assumptions for financial analysis – contracting.
Farm business resources Value
Ownership/supply
CommentsContractor Landowner
LandProductive land area 250ha ✓Land value $3705/ha ✓Reward for contribution 4.00% ✓ Percentage of capital (market) value of land.Associated costsRates – shire $7.50/ha ✓Rates – local land services $1.15/ha ✓Insurance $10.00/ha ✓ Fixed infrastructure associated with land.Irrigation water (n/a – dryland crop production only)Entitlement 0ML ✓Allocation 0% ✓Water value $0.00/ML ✓Reward for contribution 0.00% ✓ Percentage of capital (market) value of water.Associated costsFixed charges $0.00/ML ✓Usage charges $0.00/ML ✓Livestock
Sheep (breeding) 1630 ewes ✓ Sheep grazed on winter wheat (yr1) and cereal stubble during fallow periods. Assume 2.30 DSE/ewe.
Reward for contribution Agistment ✓ Agistment rates paid for grazing on share-farming area. Livestock income retained by landowner.
Associated costsAgistment – fees (cereal crop) $0.90/ewe/week ✓ Agistment fees paid into working account.Agistment – period (cereal crop) 4 weeks ✓ Based on stocking rate 15 DSE/ha.Agistment – fees (cereal stubble) $0.60/ewe/week ✓ Agistment fees paid into working account.Agistment – period (cereal stubble) 1 week ✓ Based on stocking rate 15 DSE/ha.ManagementReward for contribution $80/hr ✓ Market rate for management services.Management inputs 25 hours ✓ Annual allowance.Labour and machineryPlant and equipment value $750,000 ✓ Total value of plant and equipment utilised under agreement.Plant and equipment capacity (full utilisation) 3000ha ✓
Utilisation under agreement 8% ✓ Relative usage of full capacity for plant and equipment in terms of crop area.
Reward for contribution Various ✓ Contract rates (market value).Associated costsDepreciation (% capital value) 10% ✓Insurance (% capital value) 1% ✓Sources of capitalLand $926,250 ✓ Based on assumptions above (see Land).Machinery $60,000 ✓ Based on assumptions above (see ‘Labour and machinery’).
Working capital ✓ Shared equally between both parties for crop inputs. Working account set up for agreement and all costs paid from this account.
Reward for contribution Various ✓ ✓ Contractor reward based on management, labour and machinery.
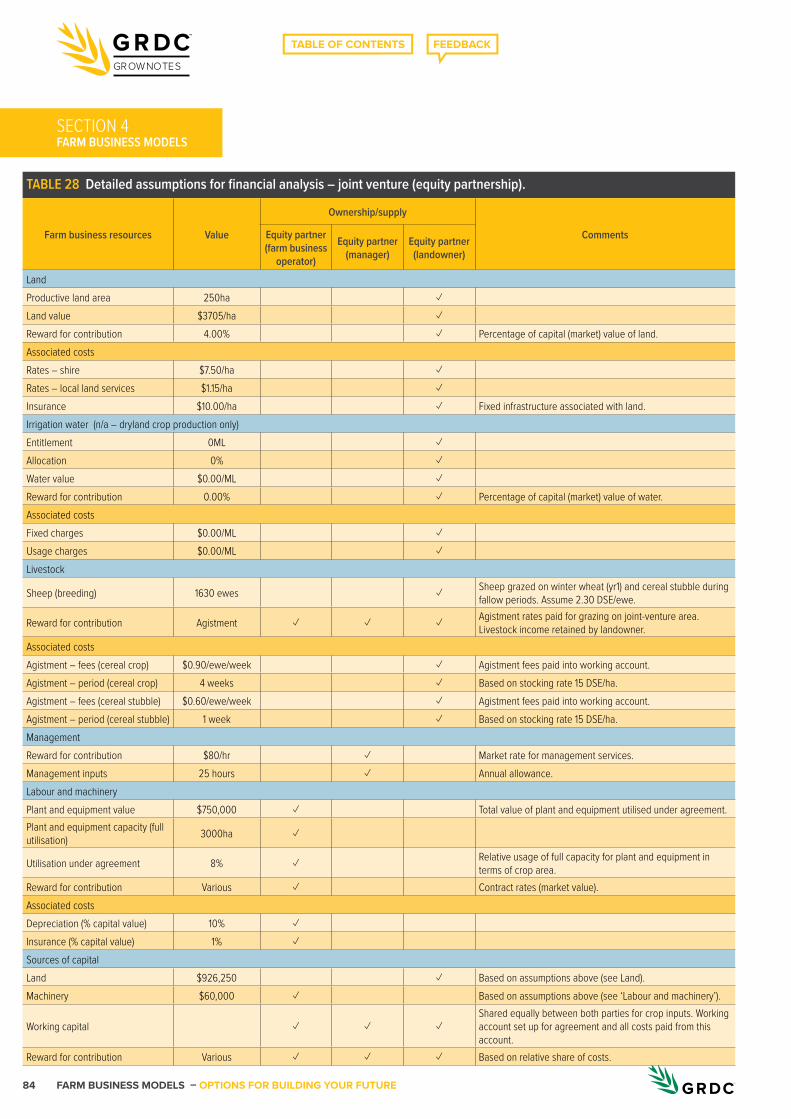
FARM BUSINESS MODELS – OPTIONS FOR BUILDING YOUR FUTURE84
GROWNOTES
FARM BUSINESS MODELSSECTION 4
TABLE 28 Detailed assumptions for financial analysis – joint venture (equity partnership).
Farm business resources Value
Ownership/supply
CommentsEquity partner (farm business
operator)
Equity partner (manager)
Equity partner (landowner)
LandProductive land area 250ha ✓Land value $3705/ha ✓Reward for contribution 4.00% ✓ Percentage of capital (market) value of land.Associated costsRates – shire $7.50/ha ✓Rates – local land services $1.15/ha ✓Insurance $10.00/ha ✓ Fixed infrastructure associated with land.Irrigation water (n/a – dryland crop production only)Entitlement 0ML ✓Allocation 0% ✓Water value $0.00/ML ✓Reward for contribution 0.00% ✓ Percentage of capital (market) value of water.Associated costsFixed charges $0.00/ML ✓Usage charges $0.00/ML ✓Livestock
Sheep (breeding) 1630 ewes ✓ Sheep grazed on winter wheat (yr1) and cereal stubble during fallow periods. Assume 2.30 DSE/ewe.
Reward for contribution Agistment ✓ ✓ ✓ Agistment rates paid for grazing on joint-venture area. Livestock income retained by landowner.
Associated costsAgistment – fees (cereal crop) $0.90/ewe/week ✓ Agistment fees paid into working account.Agistment – period (cereal crop) 4 weeks ✓ Based on stocking rate 15 DSE/ha.Agistment – fees (cereal stubble) $0.60/ewe/week ✓ Agistment fees paid into working account.Agistment – period (cereal stubble) 1 week ✓ Based on stocking rate 15 DSE/ha.ManagementReward for contribution $80/hr ✓ Market rate for management services.Management inputs 25 hours ✓ Annual allowance.Labour and machineryPlant and equipment value $750,000 ✓ Total value of plant and equipment utilised under agreement.Plant and equipment capacity (full utilisation) 3000ha ✓
Utilisation under agreement 8% ✓ Relative usage of full capacity for plant and equipment in terms of crop area.
Reward for contribution Various ✓ Contract rates (market value).Associated costsDepreciation (% capital value) 10% ✓Insurance (% capital value) 1% ✓Sources of capitalLand $926,250 ✓ Based on assumptions above (see Land).Machinery $60,000 ✓ Based on assumptions above (see ‘Labour and machinery’).
Working capital ✓ ✓ ✓Shared equally between both parties for crop inputs. Working account set up for agreement and all costs paid from this account.
Reward for contribution Various ✓ ✓ ✓ Based on relative share of costs.
FARM BUSINESS MODELS – OPTIONS FOR BUILDING YOUR FUTURE 85
GROWNOTES
FARM BUSINESS MODELSSECTION 5
SECTION 5
Next stepsWhile good business management remains the key determinant of financial performance within the control of the business operator, alternative farm business models offer the opportunity for the farm business operator to improve profitability, manage risk, facilitate business succession and increase access to capital.
Assessing your own personal and business circumstances is the essential first step when considering alternative farm business models, because a model cannot be selected ‘off the shelf’. Models need to be developed to suit personal and business needs, focusing on people, finances and resources.
When comparing the overall performance of alternative farm business models, it is essential to include both financial and non-financial considerations.
Financial analysis of business models can be completed relatively simply using costs and income sourced directly from crop gross margins, using realistic figures for expected crop production (yield and price), crop inputs and machinery operations. These should be based on a detailed crop production plan. The actual dollar values will be specific to each farm business; as such, there is no substitute for preparing an analysis based on individual personal and business circumstances.
Advisers can play an important role in supporting farm business operators and other parties considering alternative models, their relative performance and suitability.
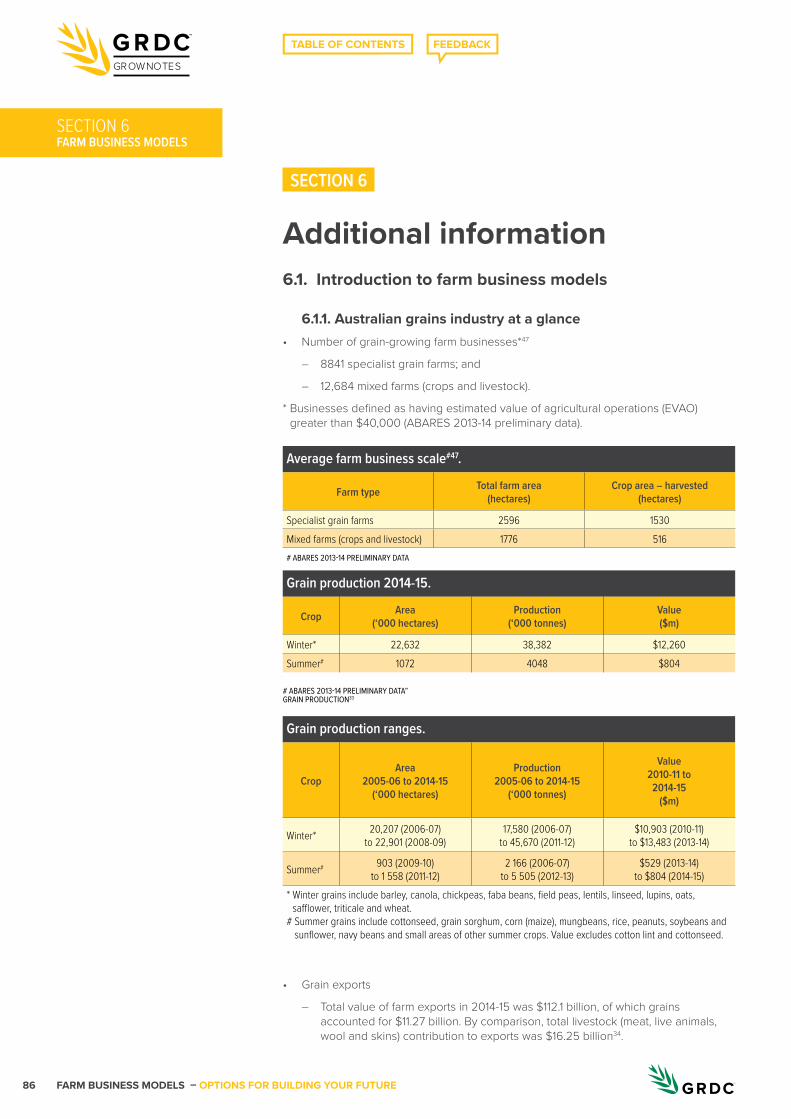
FARM BUSINESS MODELS – OPTIONS FOR BUILDING YOUR FUTURE86
GROWNOTES
FARM BUSINESS MODELS
SECTION 6
Additional information6.1. Introduction to farm business models
6.1.1. Australian grains industry at a glance• Number of grain-growing farm businesses*47
– 8841 specialist grain farms; and
– 12,684 mixed farms (crops and livestock).
* Businesses defined as having estimated value of agricultural operations (EVAO) greater than $40,000 (ABARES 2013-14 preliminary data).
# ABARES 2013-14 PRELIMINARY DATA”GRAIN PRODUCTION33
SECTION 6
Average farm business scale#47.
Farm type Total farm area (hectares)
Crop area – harvested (hectares)
Specialist grain farms 2596 1530Mixed farms (crops and livestock) 1776 516# ABARES 2013-14 PRELIMINARY DATA
Grain production 2014-15.
Crop Area (‘000 hectares)
Production (‘000 tonnes)
Value ($m)
Winter* 22,632 38,382 $12,260Summer# 1072 4048 $804
Grain production ranges.
CropArea
2005-06 to 2014-15 (‘000 hectares)
Production2005-06 to 2014-15
(‘000 tonnes)
Value2010-11 to
2014-15 ($m)
Winter* 20,207 (2006-07) to 22,901 (2008-09)
17,580 (2006-07) to 45,670 (2011-12)
$10,903 (2010-11) to $13,483 (2013-14)
Summer# 903 (2009-10) to 1 558 (2011-12)
2 166 (2006-07) to 5 505 (2012-13)
$529 (2013-14) to $804 (2014-15)
* Winter grains include barley, canola, chickpeas, faba beans, field peas, lentils, linseed, lupins, oats, safflower, triticale and wheat.
# Summer grains include cottonseed, grain sorghum, corn (maize), mungbeans, rice, peanuts, soybeans and sunflower, navy beans and small areas of other summer crops. Value excludes cotton lint and cottonseed.
• Grain exports
– Total value of farm exports in 2014-15 was $112.1 billion, of which grains accounted for $11.27 billion. By comparison, total livestock (meat, live animals, wool and skins) contribution to exports was $16.25 billion34.
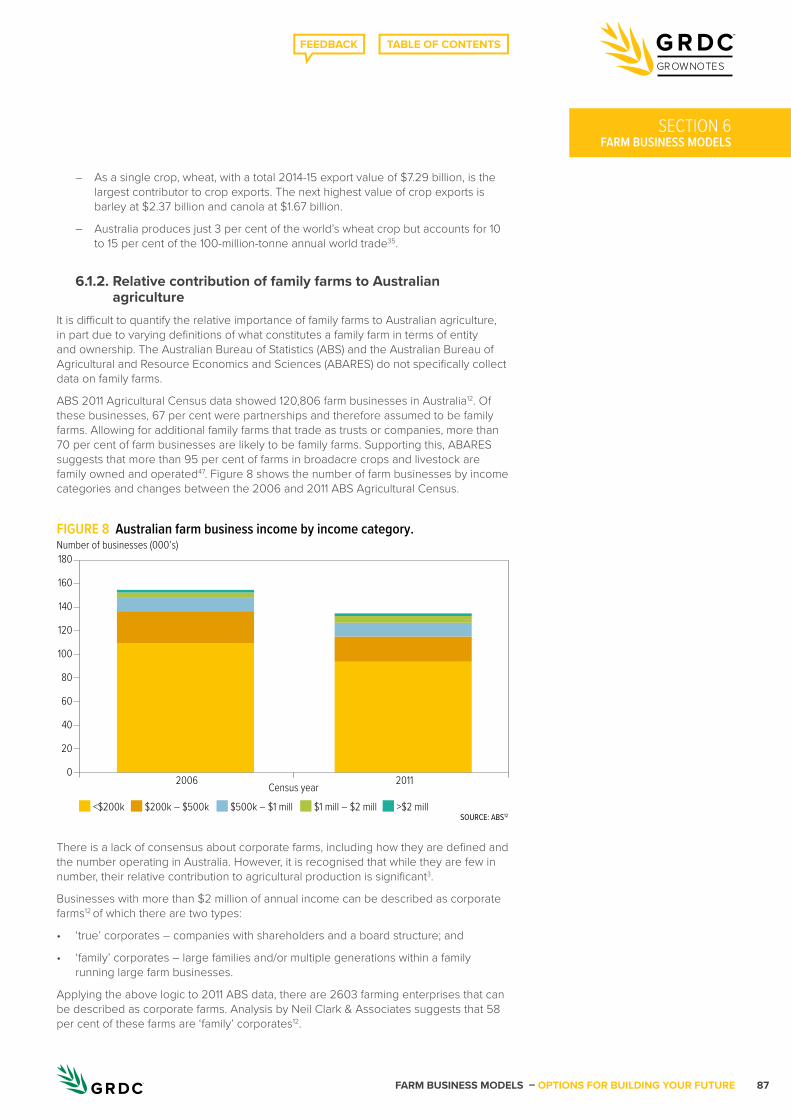
FARM BUSINESS MODELS – OPTIONS FOR BUILDING YOUR FUTURE 87
GROWNOTES
FARM BUSINESS MODELSSECTION 6
– As a single crop, wheat, with a total 2014-15 export value of $7.29 billion, is the largest contributor to crop exports. The next highest value of crop exports is barley at $2.37 billion and canola at $1.67 billion.
– Australia produces just 3 per cent of the world’s wheat crop but accounts for 10 to 15 per cent of the 100-million-tonne annual world trade35.
6.1.2. Relative contribution of family farms to Australian agriculture
It is difficult to quantify the relative importance of family farms to Australian agriculture, in part due to varying definitions of what constitutes a family farm in terms of entity and ownership. The Australian Bureau of Statistics (ABS) and the Australian Bureau of Agricultural and Resource Economics and Sciences (ABARES) do not specifically collect data on family farms.
ABS 2011 Agricultural Census data showed 120,806 farm businesses in Australia12. Of these businesses, 67 per cent were partnerships and therefore assumed to be family farms. Allowing for additional family farms that trade as trusts or companies, more than 70 per cent of farm businesses are likely to be family farms. Supporting this, ABARES suggests that more than 95 per cent of farms in broadacre crops and livestock are family owned and operated47. Figure 8 shows the number of farm businesses by income categories and changes between the 2006 and 2011 ABS Agricultural Census.
There is a lack of consensus about corporate farms, including how they are defined and the number operating in Australia. However, it is recognised that while they are few in number, their relative contribution to agricultural production is significant3.
Businesses with more than $2 million of annual income can be described as corporate farms12 of which there are two types:
• ‘true’ corporates – companies with shareholders and a board structure; and
• ‘family’ corporates – large families and/or multiple generations within a family running large farm businesses.
Applying the above logic to 2011 ABS data, there are 2603 farming enterprises that can be described as corporate farms. Analysis by Neil Clark & Associates suggests that 58 per cent of these farms are ‘family’ corporates12.
SOURCE: ABS12
FIGURE 8 Australian farm business income by income category.
<$200k $200k – $500k $500k – $1 mill $1 mill – $2 mill >$2 mill
Number of businesses (000’s)180
160
140
120
100
80
60
40
20
02006 Census year 2011

FARM BUSINESS MODELS – OPTIONS FOR BUILDING YOUR FUTURE88
GROWNOTES
FARM BUSINESS MODELS
Although both ‘true’ and ‘family’ corporate farms accounted for only 1.9 per cent of total business numbers, they accounted for 36 per cent ($16.3 billion) of the estimated value of farm production.12
Further analysis of ABS Agricultural Census data for 2006 and 2011 in Table 29 shows a 44 per cent increase in the number of corporate farms, including a 17 per cent increase in those operating within the grains industry.
Clark suggests some caution needs to be applied to this analysis due to the effects of drought on the 2006 figures, specifically with respect to businesses reliant on irrigation. Reduced water availability in 2005 is expected to have lowered income, potentially reducing the number of businesses with income greater than $2 million in the 2006 survey. Conversely, the 2011 figures may show an inflated increase in the number of businesses in the corporate category, with the recovery from drought and return of irrigation water in 2010. This is evident in Table 29, where the largest increases occurred in industries reliant on irrigation, such as horticulture, cotton and dairy.
Dryland agriculture is not as attractive to ‘true’ corporate businesses. In cropping industries, the highest concentration of ‘true’ corporates is in the cotton industry.
David Sackett, the managing director of Growth Farms Australia, estimates that there are $250 billion in assets in family farms, with $6 billion under the management of ‘true’ corporate farm businesses36.
6.1.3. Changing demographics of Australian farm businessesWhile family farming is the predominant farm business model in Australian agriculture, there are a number of family farms that now resemble medium-sized corporate businesses. Sometimes referred to as ‘family corporates’, the Australian Farm Institute suggests that many of these businesses operate with formal board and administrative structures as well as employed staff.
The reliance of these businesses on employees rather than family labour is evidenced by the fact that the proportion of salaried workers in the agricultural workforce has increased from 35 per cent in 1990 to 58 per cent in 2013, despite the total agricultural labour force, including employees and owner-operators, having declined by 25 per cent over the same period1.
These trends are particularly evident in the grains industry due to consolidation of smaller businesses and indicate the evolution of the family farm as a business model.
SECTION 6
TABLE 29 Corporate farms with greater than $2 million annual income, 2006 compared with 2011.
Industry (ABS categories) 2011: ‘true’ and ‘family’ corporates
2011: estimated ‘true’ corporates
2006: ‘true’ and ‘family’ corporates
Difference: 2011 compared with 2006
ABS categories: Number % total Number Number increase % increaseGrains 427 1.6% 364 63 17.3%Cotton 484 56.7% 174 310 178.2%Sugar 15 0.4% 14 1 7.1%Horticulture 615 3.5% 519 96 18.5%Beef and sheep 423 0.7% 374 49 13.1%Pigs and poultry 391 22.1% 219 172 78.5%Dairy 131 1.7% 36 95 263.9%Other 117 0.6% 106 11 10.4%TOTAL 2603 1.9% 1,806 797 44.1%Adapted from original source12
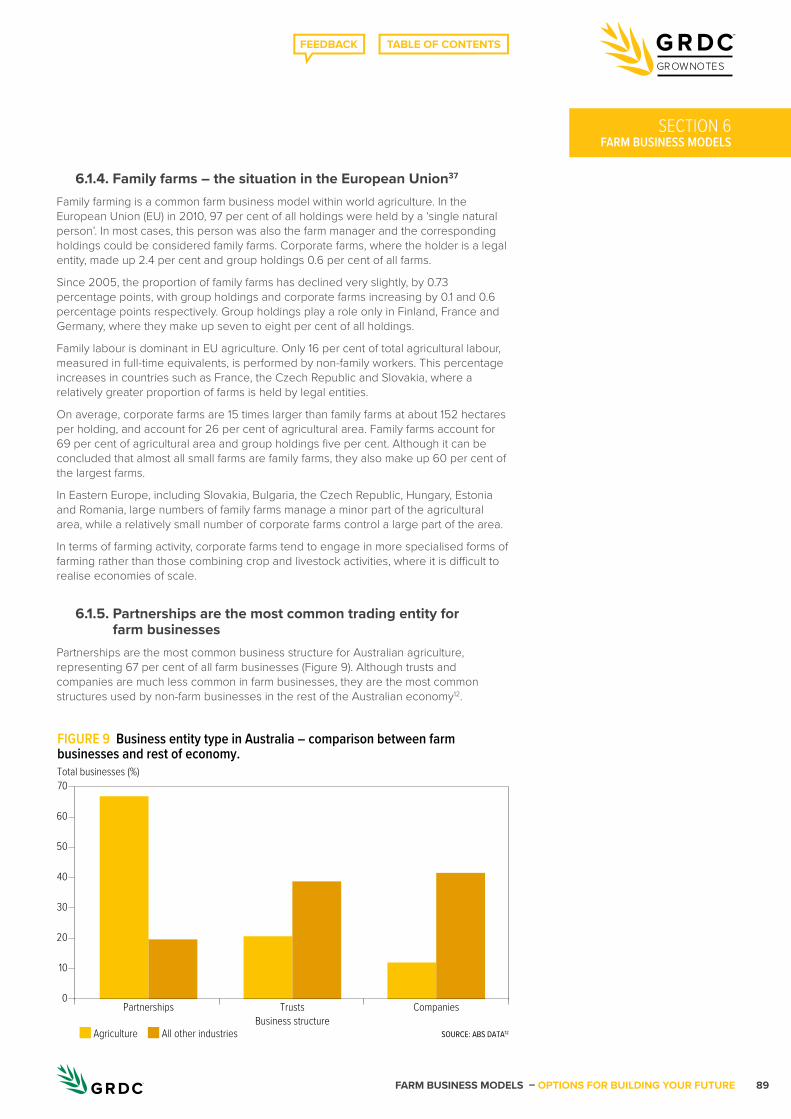
FARM BUSINESS MODELS – OPTIONS FOR BUILDING YOUR FUTURE 89
GROWNOTES
FARM BUSINESS MODELSSECTION 6
6.1.4. Family farms – the situation in the European Union37
Family farming is a common farm business model within world agriculture. In the European Union (EU) in 2010, 97 per cent of all holdings were held by a ‘single natural person’. In most cases, this person was also the farm manager and the corresponding holdings could be considered family farms. Corporate farms, where the holder is a legal entity, made up 2.4 per cent and group holdings 0.6 per cent of all farms.
Since 2005, the proportion of family farms has declined very slightly, by 0.73 percentage points, with group holdings and corporate farms increasing by 0.1 and 0.6 percentage points respectively. Group holdings play a role only in Finland, France and Germany, where they make up seven to eight per cent of all holdings.
Family labour is dominant in EU agriculture. Only 16 per cent of total agricultural labour, measured in full-time equivalents, is performed by non-family workers. This percentage increases in countries such as France, the Czech Republic and Slovakia, where a relatively greater proportion of farms is held by legal entities.
On average, corporate farms are 15 times larger than family farms at about 152 hectares per holding, and account for 26 per cent of agricultural area. Family farms account for 69 per cent of agricultural area and group holdings five per cent. Although it can be concluded that almost all small farms are family farms, they also make up 60 per cent of the largest farms.
In Eastern Europe, including Slovakia, Bulgaria, the Czech Republic, Hungary, Estonia and Romania, large numbers of family farms manage a minor part of the agricultural area, while a relatively small number of corporate farms control a large part of the area.
In terms of farming activity, corporate farms tend to engage in more specialised forms of farming rather than those combining crop and livestock activities, where it is difficult to realise economies of scale.
6.1.5. Partnerships are the most common trading entity for farm businesses
Partnerships are the most common business structure for Australian agriculture, representing 67 per cent of all farm businesses (Figure 9). Although trusts and companies are much less common in farm businesses, they are the most common structures used by non-farm businesses in the rest of the Australian economy12.
SOURCE: ABS DATA12
FIGURE 9 Business entity type in Australia – comparison between farm businesses and rest of economy.
Agriculture All other industries
Total businesses (%)70
60
50
40
30
20
10
0
Business structurePartnerships CompaniesTrusts
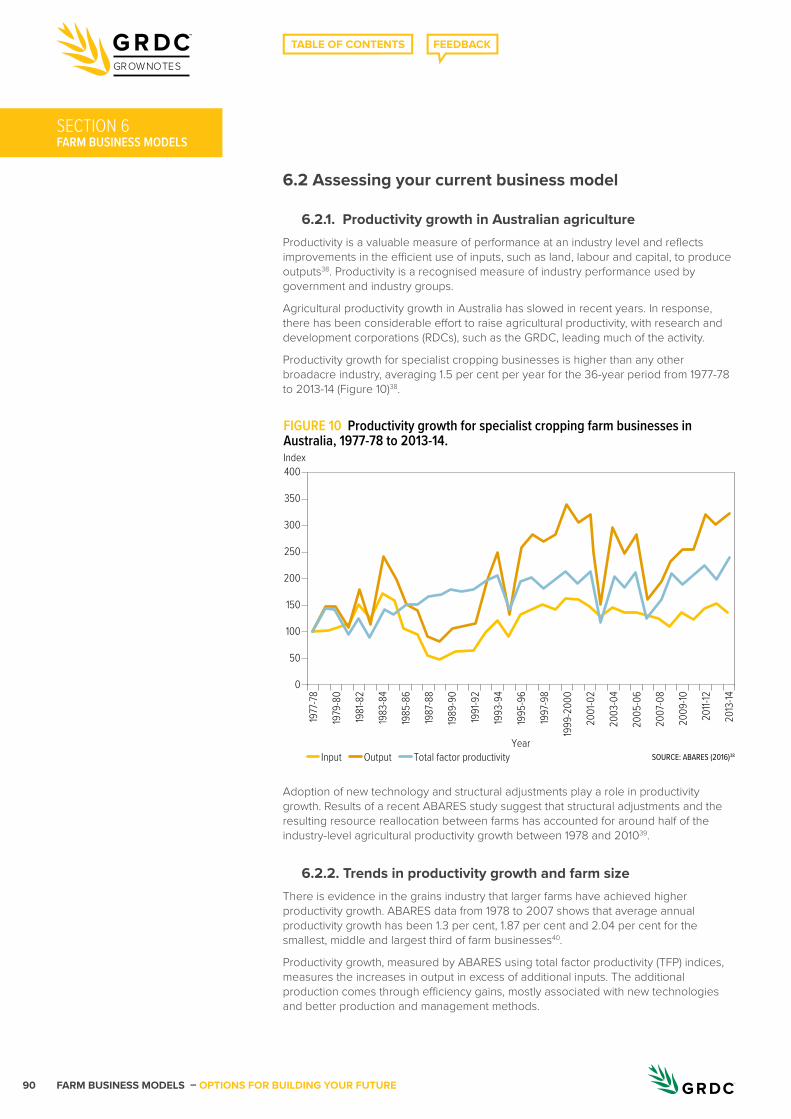
FARM BUSINESS MODELS – OPTIONS FOR BUILDING YOUR FUTURE90
GROWNOTES
FARM BUSINESS MODELS
6.2 Assessing your current business model
6.2.1. Productivity growth in Australian agricultureProductivity is a valuable measure of performance at an industry level and reflects improvements in the efficient use of inputs, such as land, labour and capital, to produce outputs38. Productivity is a recognised measure of industry performance used by government and industry groups.
Agricultural productivity growth in Australia has slowed in recent years. In response, there has been considerable effort to raise agricultural productivity, with research and development corporations (RDCs), such as the GRDC, leading much of the activity.
Productivity growth for specialist cropping businesses is higher than any other broadacre industry, averaging 1.5 per cent per year for the 36-year period from 1977-78 to 2013-14 (Figure 10)38.
Adoption of new technology and structural adjustments play a role in productivity growth. Results of a recent ABARES study suggest that structural adjustments and the resulting resource reallocation between farms has accounted for around half of the industry-level agricultural productivity growth between 1978 and 201039.
6.2.2. Trends in productivity growth and farm sizeThere is evidence in the grains industry that larger farms have achieved higher productivity growth. ABARES data from 1978 to 2007 shows that average annual productivity growth has been 1.3 per cent, 1.87 per cent and 2.04 per cent for the smallest, middle and largest third of farm businesses40.
Productivity growth, measured by ABARES using total factor productivity (TFP) indices, measures the increases in output in excess of additional inputs. The additional production comes through efficiency gains, mostly associated with new technologies and better production and management methods.
SECTION 6
SOURCE: ABARES (2016)38
FIGURE 10 Productivity growth for specialist cropping farm businesses in Australia, 1977-78 to 2013-14.
Input
Index400
350
300
250
200
150
100
50
0
Year
1977
-78
1979
-80
1981
-82
1983
-84
1985
-86
1987
-88
1989
-90
1991
-92
1993
-94
1995
-96
1997
-98
1999
-200
0
2001
-02
2003
-04
2005
-06
2007
-08
2009
-10
2011-
12
2013
-14
Output Total factor productivity
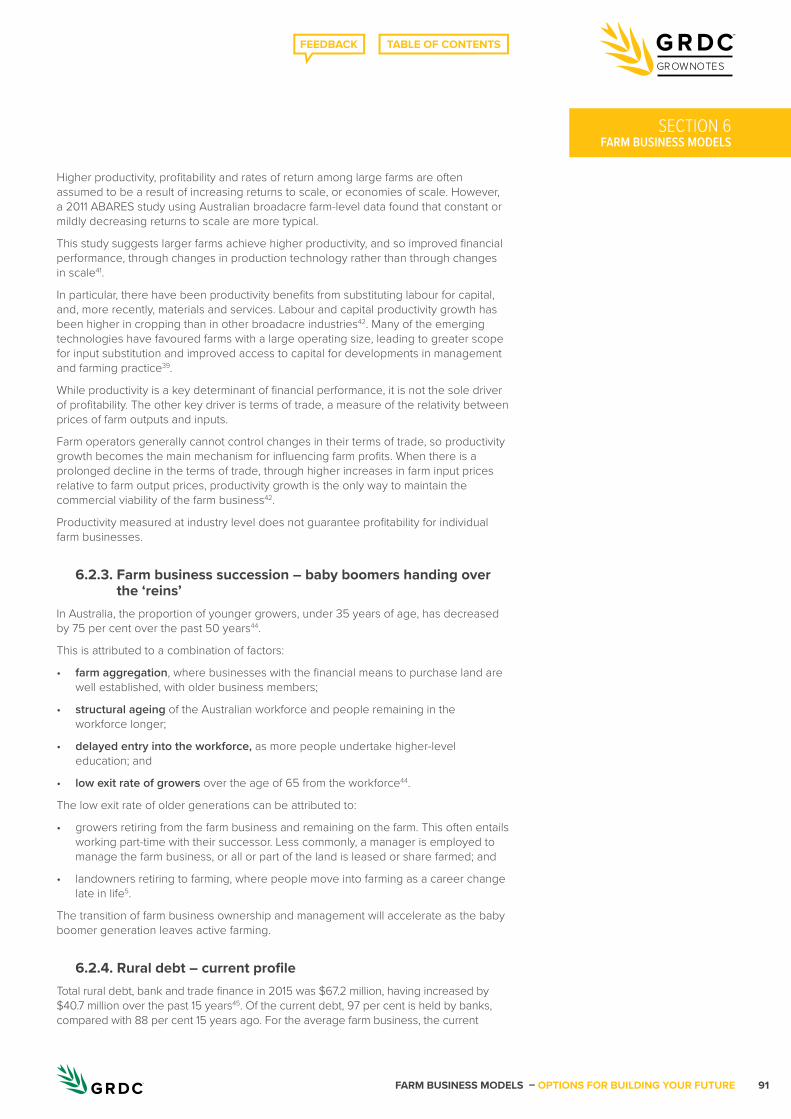
FARM BUSINESS MODELS – OPTIONS FOR BUILDING YOUR FUTURE 91
GROWNOTES
FARM BUSINESS MODELSSECTION 6
Higher productivity, profitability and rates of return among large farms are often assumed to be a result of increasing returns to scale, or economies of scale. However, a 2011 ABARES study using Australian broadacre farm-level data found that constant or mildly decreasing returns to scale are more typical.
This study suggests larger farms achieve higher productivity, and so improved financial performance, through changes in production technology rather than through changes in scale41.
In particular, there have been productivity benefits from substituting labour for capital, and, more recently, materials and services. Labour and capital productivity growth has been higher in cropping than in other broadacre industries42. Many of the emerging technologies have favoured farms with a large operating size, leading to greater scope for input substitution and improved access to capital for developments in management and farming practice39.
While productivity is a key determinant of financial performance, it is not the sole driver of profitability. The other key driver is terms of trade, a measure of the relativity between prices of farm outputs and inputs.
Farm operators generally cannot control changes in their terms of trade, so productivity growth becomes the main mechanism for influencing farm profits. When there is a prolonged decline in the terms of trade, through higher increases in farm input prices relative to farm output prices, productivity growth is the only way to maintain the commercial viability of the farm business42.
Productivity measured at industry level does not guarantee profitability for individual farm businesses.
6.2.3. Farm business succession – baby boomers handing over the ‘reins’
In Australia, the proportion of younger growers, under 35 years of age, has decreased by 75 per cent over the past 50 years44.
This is attributed to a combination of factors:
• farm aggregation, where businesses with the financial means to purchase land are well established, with older business members;
• structural ageing of the Australian workforce and people remaining in the workforce longer;
• delayed entry into the workforce, as more people undertake higher-level education; and
• low exit rate of growers over the age of 65 from the workforce44.
The low exit rate of older generations can be attributed to:
• growers retiring from the farm business and remaining on the farm. This often entails working part-time with their successor. Less commonly, a manager is employed to manage the farm business, or all or part of the land is leased or share farmed; and
• landowners retiring to farming, where people move into farming as a career change late in life5.
The transition of farm business ownership and management will accelerate as the baby boomer generation leaves active farming.
6.2.4. Rural debt – current profileTotal rural debt, bank and trade finance in 2015 was $67.2 million, having increased by $40.7 million over the past 15 years45. Of the current debt, 97 per cent is held by banks, compared with 88 per cent 15 years ago. For the average farm business, the current
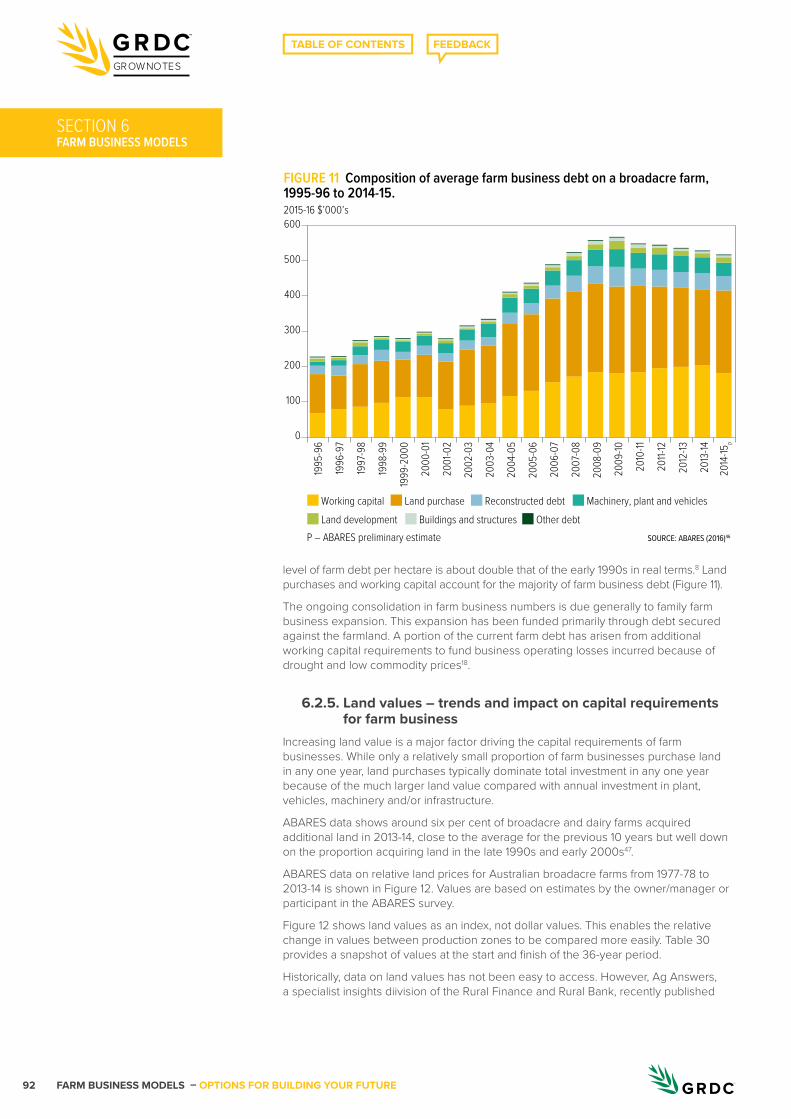
FARM BUSINESS MODELS – OPTIONS FOR BUILDING YOUR FUTURE92
GROWNOTES
FARM BUSINESS MODELS
level of farm debt per hectare is about double that of the early 1990s in real terms.8 Land purchases and working capital account for the majority of farm business debt (Figure 11).
The ongoing consolidation in farm business numbers is due generally to family farm business expansion. This expansion has been funded primarily through debt secured against the farmland. A portion of the current farm debt has arisen from additional working capital requirements to fund business operating losses incurred because of drought and low commodity prices18.
6.2.5. Land values – trends and impact on capital requirements for farm business
Increasing land value is a major factor driving the capital requirements of farm businesses. While only a relatively small proportion of farm businesses purchase land in any one year, land purchases typically dominate total investment in any one year because of the much larger land value compared with annual investment in plant, vehicles, machinery and/or infrastructure.
ABARES data shows around six per cent of broadacre and dairy farms acquired additional land in 2013-14, close to the average for the previous 10 years but well down on the proportion acquiring land in the late 1990s and early 2000s47.
ABARES data on relative land prices for Australian broadacre farms from 1977-78 to 2013-14 is shown in Figure 12. Values are based on estimates by the owner/manager or participant in the ABARES survey.
Figure 12 shows land values as an index, not dollar values. This enables the relative change in values between production zones to be compared more easily. Table 30 provides a snapshot of values at the start and finish of the 36-year period.
Historically, data on land values has not been easy to access. However, Ag Answers, a specialist insights diivision of the Rural Finance and Rural Bank, recently published
SECTION 6
SOURCE: ABARES (2016)46P – ABARES preliminary estimate
FIGURE 11 Composition of average farm business debt on a broadacre farm, 1995-96 to 2014-15.
Working capital Land purchase Reconstructed debt Machinery, plant and vehiclesLand development Buildings and structures Other debt
2015-16 $’000’s600
500
400
300
200
100
0
1995
-96
1996
-97
1997
-98
1998
-99
1999
-200
0
2000
-01
2001
-02
2002
-03
2003
-04
2004
-05
2005
-06
2006
-07
2007
-08
2008
-09
2009
-10
2010
-11
2011-
12
2012
-13
2013
-14
2014
-15p
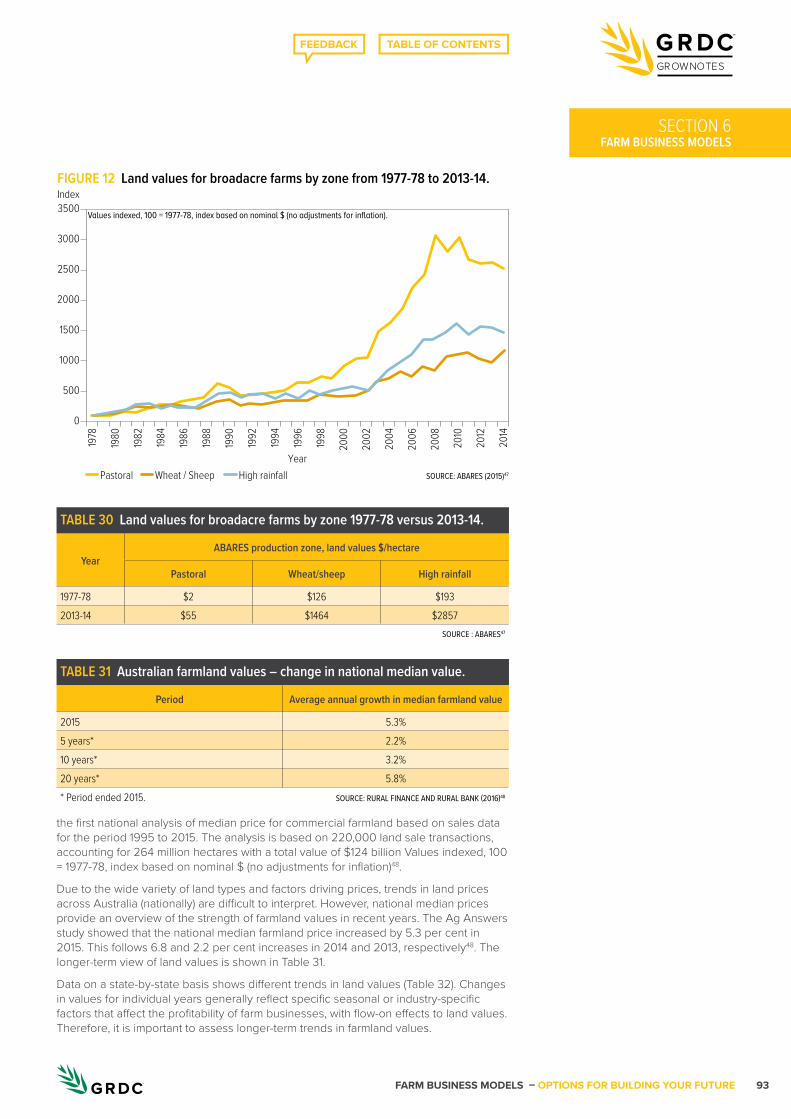
FARM BUSINESS MODELS – OPTIONS FOR BUILDING YOUR FUTURE 93
GROWNOTES
FARM BUSINESS MODELSSECTION 6
the first national analysis of median price for commercial farmland based on sales data for the period 1995 to 2015. The analysis is based on 220,000 land sale transactions, accounting for 264 million hectares with a total value of $124 billion Values indexed, 100 = 1977-78, index based on nominal $ (no adjustments for inflation)48.
Due to the wide variety of land types and factors driving prices, trends in land prices across Australia (nationally) are difficult to interpret. However, national median prices provide an overview of the strength of farmland values in recent years. The Ag Answers study showed that the national median farmland price increased by 5.3 per cent in 2015. This follows 6.8 and 2.2 per cent increases in 2014 and 2013, respectively48. The longer-term view of land values is shown in Table 31.
Data on a state-by-state basis shows different trends in land values (Table 32). Changes in values for individual years generally reflect specific seasonal or industry-specific factors that affect the profitability of farm businesses, with flow-on effects to land values. Therefore, it is important to assess longer-term trends in farmland values.
SOURCE: ABARES (2015)47
FIGURE 12 Land values for broadacre farms by zone from 1977-78 to 2013-14.
Pastoral
Index3500
3000
2500
2000
1500
1000
500
0
Year
1978
1980
1982
1984
1986
1988
1990
1992
1994
1996
1998
2000
2002
2004
2006
2008
2010
2012
2014
Wheat / Sheep High rainfall
Values indexed, 100 = 1977-78, index based on nominal $ (no adjustments for inflation).
TABLE 30 Land values for broadacre farms by zone 1977-78 versus 2013-14.
YearABARES production zone, land values $/hectare
Pastoral Wheat/sheep High rainfall
1977-78 $2 $126 $1932013-14 $55 $1464 $2857
SOURCE : ABARES47
TABLE 31 Australian farmland values – change in national median value.
Period Average annual growth in median farmland value
2015 5.3%5 years* 2.2%10 years* 3.2%20 years* 5.8%* Period ended 2015. SOURCE: RURAL FINANCE AND RURAL BANK (2016)48

FARM BUSINESS MODELS – OPTIONS FOR BUILDING YOUR FUTURE94
GROWNOTES
FARM BUSINESS MODELS
6.2.6. Returns from agriculture compared with other asset classes
Farming has traditionally been looked upon as a providing a ‘good lifestyle’ and representing a ‘safe’ investment. But how does it stack up compared with other investments?
Non-farming investments
Australian investors have a variety of asset classes to choose from when looking to invest capital, including Australian shares and residential property, cash, global shares and global property.
The average investment return from Australian shares was 7.1 per cent per year over the 10-year period to 2014. In comparison, global shares provided an average return of 7.8 per cent and global fixed income, or ‘bonds’, an average return of 7.6 per cent (Figure 13)49.
Share prices fluctuate widely over time. The ASX200 Index tracks share price movement in the Australian market. Over the past 10 years, the ASX200 reached a high of 6750 in October 2007 and a low of 3145 in March 2009. This movement represented a 53 per cent reduction in the value of shares over a period of less than 18 months. Although long-term returns from shares have been consistently positive, the fluctuations that occur from time to time mean losses can be incurred with market movements.
Farming investments
Australia-wide, agricultural land values in the traditional ‘wheat/sheep’ production zones have trebled over the past 20 years. In the past 10 years values have increased by 80 per cent.
The returns from farm businesses comprise two elements:
• returns from the operation of the business; and • returns from the change in asset values, predominantly land and irrigation water.
Rates of return for farm business types are provided in Table 33, shown with and without capital appreciation.
There is significant variation in the returns from farm businesses across different operating scales, management and region.
Larger farms tend to have higher returns. Large farms in Australia with total receipts greater than $1 million have had an average rate of return over the past 10 years of 3.9 per cent, excluding capital growth, and 5.3 per cent when capital growth is included.
Management has a significant impact on the performance of a farm business. The top 25 per cent of farms, across the range of business sizes, have significantly higher returns than the average (Table 34).
Farm business performance is also regionally specific, driven by seasonal factors that influence production income and costs, as shown in Ag Profit® farm performance data. From a total of 412 cropping farms in south-east Australia, predominantly in the Victorian Wimmera and Mallee, NSW Mallee and SA Mallee, an average return on capital of
SECTION 6
TABLE 32 Australian farmland values – change in national median value by state.
PeriodAverage annual growth in median farmland value (by state)
New South Wales South Australia Tasmania Queensland Victoria Western Australia Northern Territory
2015 10.2% –1.9% 12.8% 3.3% –2.3% 10.6% –6.4%5 years* 2.2% 0.0% 2.3% –0.4% 3.9% 5.7% –1.4%10 years* 3.3% 1.7% 5.4% 4.2% 2.9% 0.2% 10.3%20 years* 6.1% 5.6% 5.8% 5.7% 5.0% 6.1% 6.0%* Period ended 2015. SOURCE: RURAL FINANCE AND RURAL BANK (2016)48
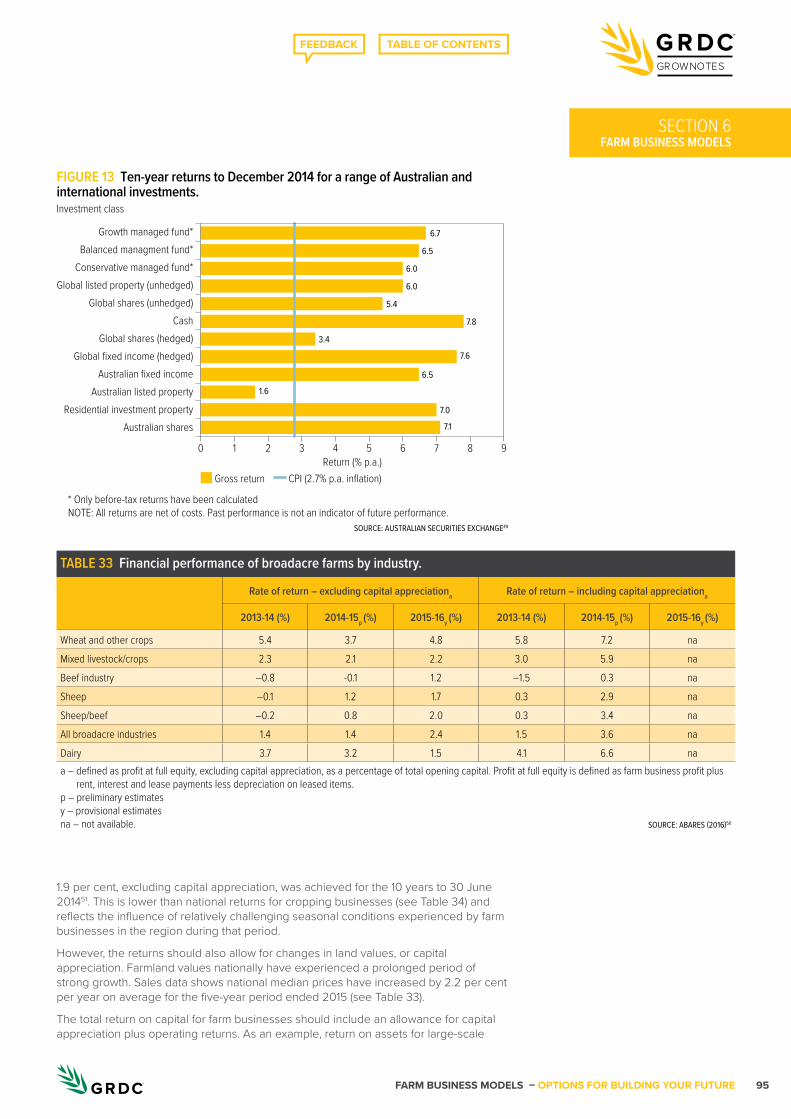
FARM BUSINESS MODELS – OPTIONS FOR BUILDING YOUR FUTURE 95
GROWNOTES
FARM BUSINESS MODELSSECTION 6
1.9 per cent, excluding capital appreciation, was achieved for the 10 years to 30 June 201451. This is lower than national returns for cropping businesses (see Table 34) and reflects the influence of relatively challenging seasonal conditions experienced by farm businesses in the region during that period.
However, the returns should also allow for changes in land values, or capital appreciation. Farmland values nationally have experienced a prolonged period of strong growth. Sales data shows national median prices have increased by 2.2 per cent per year on average for the five-year period ended 2015 (see Table 33).
The total return on capital for farm businesses should include an allowance for capital appreciation plus operating returns. As an example, return on assets for large-scale
SOURCE: AUSTRALIAN SECURITIES EXCHANGE49
FIGURE 13 Ten-year returns to December 2014 for a range of Australian and international investments.
Gross return
* Only before-tax returns have been calculatedNOTE: All returns are net of costs. Past performance is not an indicator of future performance.
CPI (2.7% p.a. inflation)
Investment class
Growth managed fund*Balanced managment fund*
Conservative managed fund*Global listed property (unhedged)
Global shares (unhedged)
Global shares (hedged)Cash
Global fixed income (hedged)Australian fixed income
Australian listed propertyResidential investment property
Australian shares
Return (% p.a.)0 1 2 3 4 95 6 7 8
7.1
7.0
1.6
6.5
7.6
3.4
7.8
5.4
6.0
6.0
6.5
6.7
TABLE 33 Financial performance of broadacre farms by industry.
Rate of return – excluding capital appreciationa Rate of return – including capital appreciationa
2013-14 (%) 2014-15p (%) 2015-16y (%) 2013-14 (%) 2014-15p (%) 2015-16y (%)
Wheat and other crops 5.4 3.7 4.8 5.8 7.2 naMixed livestock/crops 2.3 2.1 2.2 3.0 5.9 naBeef industry –0.8 -0.1 1.2 –1.5 0.3 naSheep –0.1 1.2 1.7 0.3 2.9 naSheep/beef –0.2 0.8 2.0 0.3 3.4 naAll broadacre industries 1.4 1.4 2.4 1.5 3.6 naDairy 3.7 3.2 1.5 4.1 6.6 naa – defined as profit at full equity, excluding capital appreciation, as a percentage of total opening capital. Profit at full equity is defined as farm business profit plus
rent, interest and lease payments less depreciation on leased items.p – preliminary estimatesy – provisional estimatesna – not available. SOURCE: ABARES (2016)50
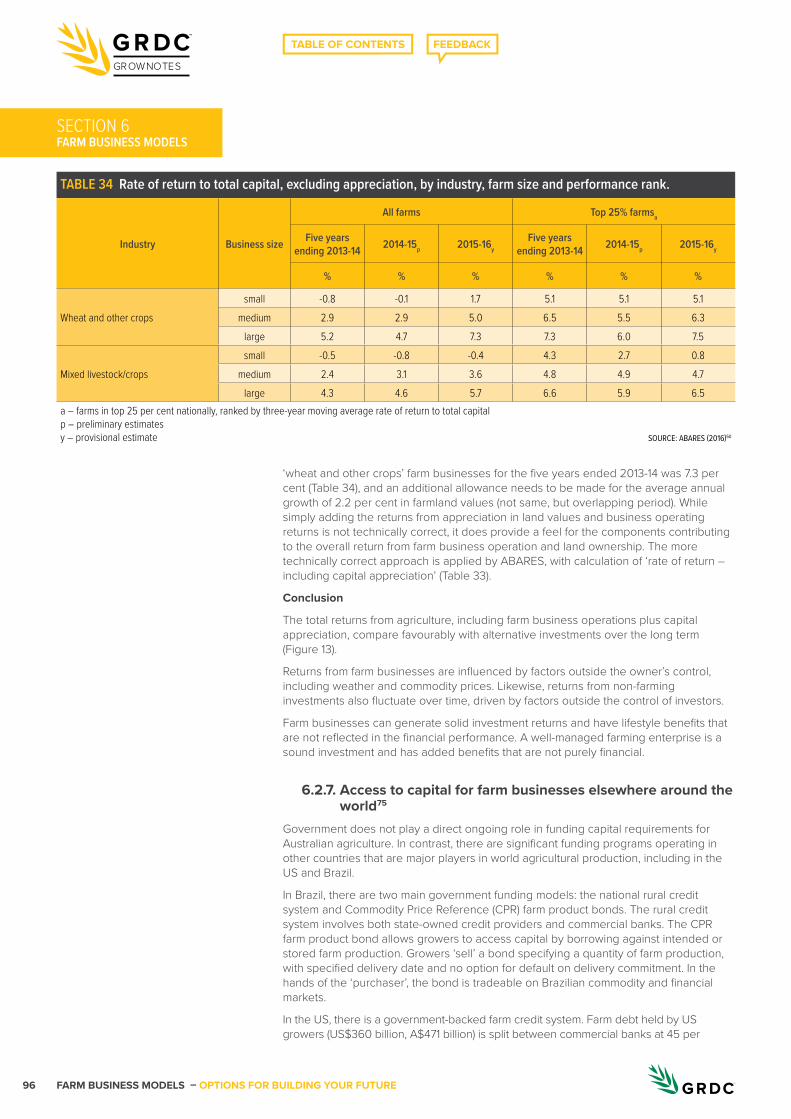
FARM BUSINESS MODELS – OPTIONS FOR BUILDING YOUR FUTURE96
GROWNOTES
FARM BUSINESS MODELS
‘wheat and other crops’ farm businesses for the five years ended 2013-14 was 7.3 per cent (Table 34), and an additional allowance needs to be made for the average annual growth of 2.2 per cent in farmland values (not same, but overlapping period). While simply adding the returns from appreciation in land values and business operating returns is not technically correct, it does provide a feel for the components contributing to the overall return from farm business operation and land ownership. The more technically correct approach is applied by ABARES, with calculation of ‘rate of return – including capital appreciation’ (Table 33).
Conclusion
The total returns from agriculture, including farm business operations plus capital appreciation, compare favourably with alternative investments over the long term (Figure 13).
Returns from farm businesses are influenced by factors outside the owner’s control, including weather and commodity prices. Likewise, returns from non-farming investments also fluctuate over time, driven by factors outside the control of investors.
Farm businesses can generate solid investment returns and have lifestyle benefits that are not reflected in the financial performance. A well-managed farming enterprise is a sound investment and has added benefits that are not purely financial.
6.2.7. Access to capital for farm businesses elsewhere around the world75
Government does not play a direct ongoing role in funding capital requirements for Australian agriculture. In contrast, there are significant funding programs operating in other countries that are major players in world agricultural production, including in the US and Brazil.
In Brazil, there are two main government funding models: the national rural credit system and Commodity Price Reference (CPR) farm product bonds. The rural credit system involves both state-owned credit providers and commercial banks. The CPR farm product bond allows growers to access capital by borrowing against intended or stored farm production. Growers ‘sell’ a bond specifying a quantity of farm production, with specified delivery date and no option for default on delivery commitment. In the hands of the ‘purchaser’, the bond is tradeable on Brazilian commodity and financial markets.
In the US, there is a government-backed farm credit system. Farm debt held by US growers (US$360 billion, A$471 billion) is split between commercial banks at 45 per
SECTION 6
TABLE 34 Rate of return to total capital, excluding appreciation, by industry, farm size and performance rank.
Industry Business size
All farms Top 25% farmsa
Five years ending 2013-14 2014-15p 2015-16y
Five years ending 2013-14 2014-15p 2015-16y
% % % % % %
Wheat and other cropssmall -0.8 -0.1 1.7 5.1 5.1 5.1
medium 2.9 2.9 5.0 6.5 5.5 6.3large 5.2 4.7 7.3 7.3 6.0 7.5
Mixed livestock/cropssmall -0.5 -0.8 -0.4 4.3 2.7 0.8
medium 2.4 3.1 3.6 4.8 4.9 4.7large 4.3 4.6 5.7 6.6 5.9 6.5
a – farms in top 25 per cent nationally, ranked by three-year moving average rate of return to total capitalp – preliminary estimatesy – provisional estimate SOURCE: ABARES (2016)50
FARM BUSINESS MODELS – OPTIONS FOR BUILDING YOUR FUTURE 97
GROWNOTES
FARM BUSINESS MODELSSECTION 6
cent and the government farm credit system at 55 per cent. Loans for farm land are predominantly provided by the farm credit system, with discounted interest rates and risk mitigation insurance. The main market for commercial banks is lending for working capital.
6.2.8. Stage of business cycle and implications for business goals and performance targets
The business cycle refers to stages of business growth and can be used to guide appropriate decision-making. Each stage provides a measure of financial stability, typically as dollar equity.
Business cycle stages are described as:
• emerging – the start-up phase, low asset value and low equity;
• growing – focusing on scale expansion, often by leveraging the equity of others. Typically high debt due to asset purchases of land, machinery or livestock;
• consolidation – balancing debt reduction with investment in the business;
• stable – appropriate scale, debt is well secured and profits are sufficient to meet business and family goals;
• transition – point where the business reaches the ‘crossroads’, with the next option including:
– reinventing, for dynamic businesses ready to take on expansion. Introduction of the next generation often triggers new enthusiasm and the need for growth;
– retirement, or continuing in farming by using business models that allow reduced involvement while retaining the preferred roles and investments; and
– wind-up, shifting investment and time out of the industry.
The business stage influences what can be achieved. For example, families with children at school or dependent parents have heavy financial commitments and can better sustain higher costs if their business is in the ‘stable’ phase with strong dollar equity.
During one generation the family business may move through three or four stages. As the next generation becomes actively involved, the cycle starts again. The next generation will typically start with low equity, focusing on growth and potentially leveraging equity from parents or investors through business models such as leasing or share farming. The older generation may elect to be part of the growth by forming a joint venture with the next generation, or may prefer to transition their equity and lifestyle into retirement.
Emerging and growing business stages are typically highly efficient in their use of machinery and labour. Profits are directed to capital purchase of land and machinery. Growth in scale is achieved using business models that leverage family or investor equity through leasing, share farming or joint ventures.
Consolidated and stable businesses have choices for profit allocation and equity growth. Many will continue to focus on increasing scale through investment in land; however, debt reduction is also a priority and will be balanced with business reinvestment needs, such as machinery upgrades or lifestyle choices.
Transition-to-retirement businesses have sufficient equity to meet their retirement needs, choosing to remain in farming or shift their investment elsewhere. They may support the next generation to enter the industry in conjunction with their business through a joint venture, or by assisting to establish them in their own right through the use of land, machinery or livestock. Asset transfer to the next generation can be considered separately to the use of assets for business operation.
Personal and business goals
Most families are highly skilled at managing production, but understanding and managing business structures that are best suited to family and personal needs can
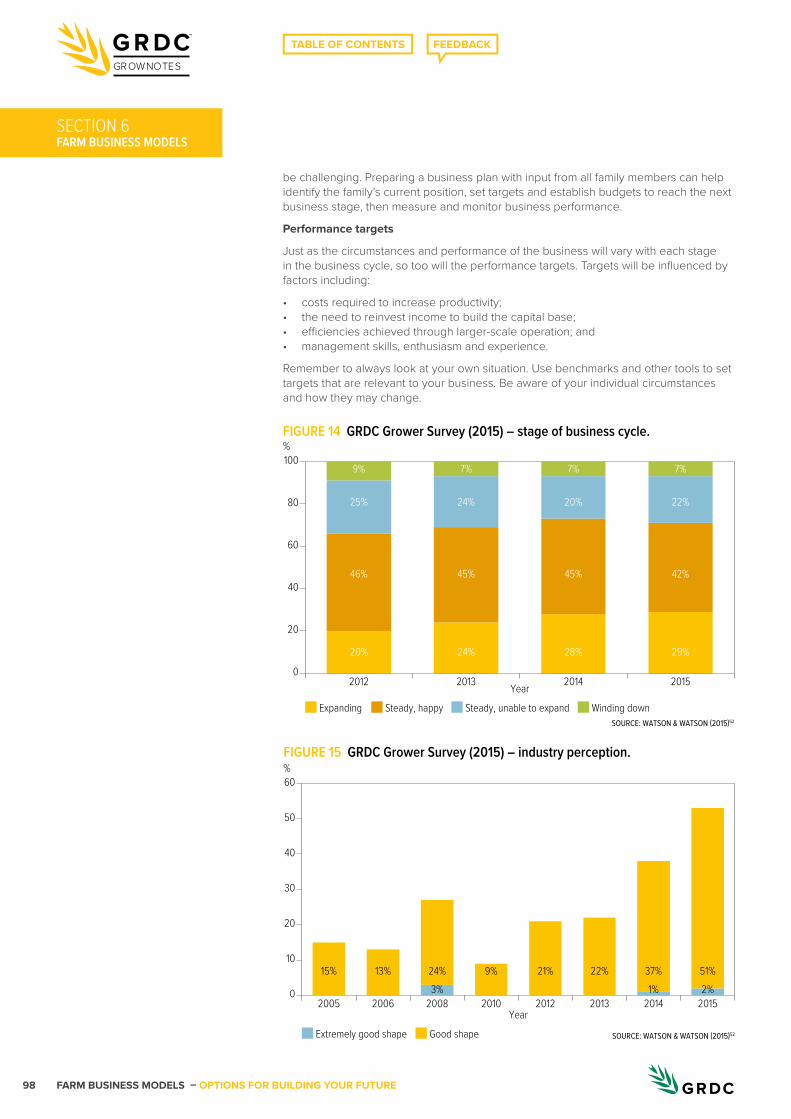
FARM BUSINESS MODELS – OPTIONS FOR BUILDING YOUR FUTURE98
GROWNOTES
FARM BUSINESS MODELS
be challenging. Preparing a business plan with input from all family members can help identify the family’s current position, set targets and establish budgets to reach the next business stage, then measure and monitor business performance.
Performance targets
Just as the circumstances and performance of the business will vary with each stage in the business cycle, so too will the performance targets. Targets will be influenced by factors including:
• costs required to increase productivity;• the need to reinvest income to build the capital base;• efficiencies achieved through larger-scale operation; and• management skills, enthusiasm and experience.
Remember to always look at your own situation. Use benchmarks and other tools to set targets that are relevant to your business. Be aware of your individual circumstances and how they may change.
SECTION 6
SOURCE: WATSON & WATSON (2015)52
FIGURE 14 GRDC Grower Survey (2015) – stage of business cycle.
Expanding Steady, happy Steady, unable to expand Winding down
%100
80
60
40
20
02012 2013 2014Year 2015
20% 24% 28% 29%
46% 45% 45% 42%
25% 24% 20% 22%
9% 7% 7% 7%
SOURCE: WATSON & WATSON (2015)52
FIGURE 15 GRDC Grower Survey (2015) – industry perception.
Extremely good shape Good shape
%60
50
40
30
20
10
020122010200820062005 2013 2014
Year2015
21%9%24%13%15% 22% 37% 51%3% 1% 2%
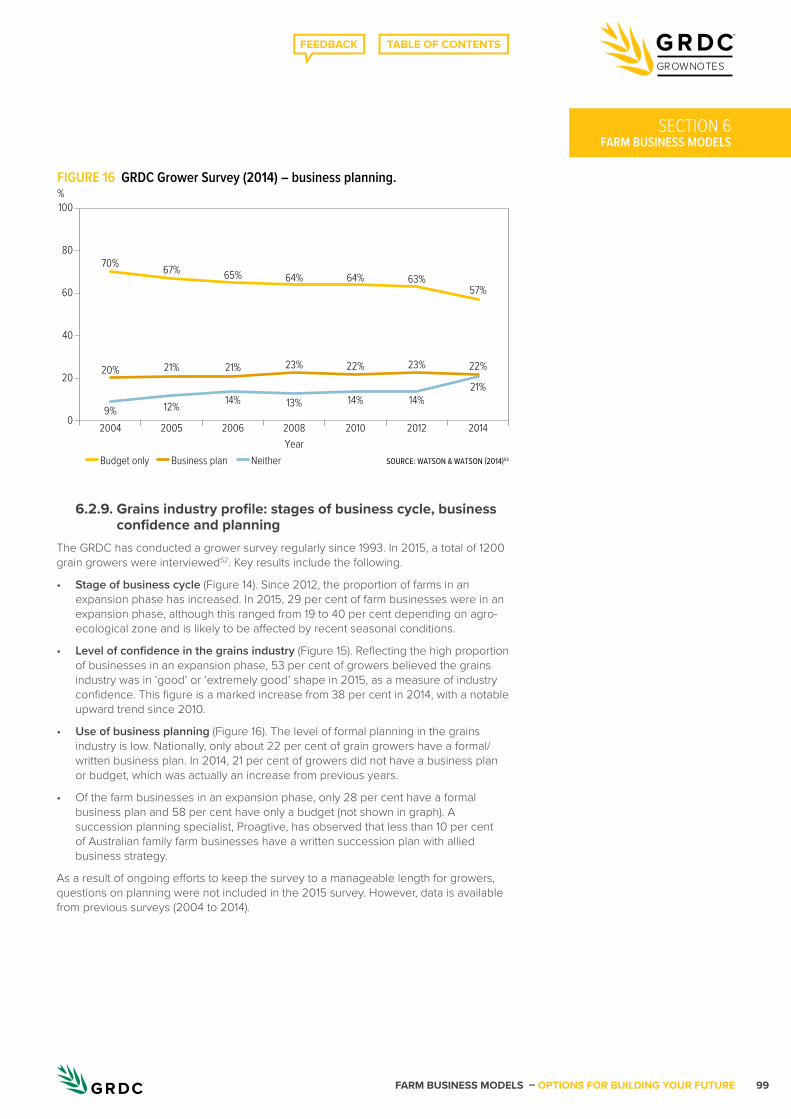
FARM BUSINESS MODELS – OPTIONS FOR BUILDING YOUR FUTURE 99
GROWNOTES
FARM BUSINESS MODELSSECTION 6
6.2.9. Grains industry profile: stages of business cycle, business confidence and planning
The GRDC has conducted a grower survey regularly since 1993. In 2015, a total of 1200 grain growers were interviewed52. Key results include the following.
• Stage of business cycle (Figure 14). Since 2012, the proportion of farms in an expansion phase has increased. In 2015, 29 per cent of farm businesses were in an expansion phase, although this ranged from 19 to 40 per cent depending on agro-ecological zone and is likely to be affected by recent seasonal conditions.
• Level of confidence in the grains industry (Figure 15). Reflecting the high proportion of businesses in an expansion phase, 53 per cent of growers believed the grains industry was in ‘good’ or ‘extremely good’ shape in 2015, as a measure of industry confidence. This figure is a marked increase from 38 per cent in 2014, with a notable upward trend since 2010.
• Use of business planning (Figure 16). The level of formal planning in the grains industry is low. Nationally, only about 22 per cent of grain growers have a formal/written business plan. In 2014, 21 per cent of growers did not have a business plan or budget, which was actually an increase from previous years.
• Of the farm businesses in an expansion phase, only 28 per cent have a formal business plan and 58 per cent have only a budget (not shown in graph). A succession planning specialist, Proagtive, has observed that less than 10 per cent of Australian family farm businesses have a written succession plan with allied business strategy.
As a result of ongoing efforts to keep the survey to a manageable length for growers, questions on planning were not included in the 2015 survey. However, data is available from previous surveys (2004 to 2014).
SOURCE: WATSON & WATSON (2014)53
FIGURE 16 GRDC Grower Survey (2014) – business planning.
Budget only
%100
80
60
40
20
0
Year2004 2005 2006 2008 2010 2012 20149% 12% 14% 13% 14% 14%
21%20% 21% 21% 23% 22% 23% 22%
70% 67% 65% 64% 64% 63%57%
Business plan Neither
FARM BUSINESS MODELS – OPTIONS FOR BUILDING YOUR FUTURE100
GROWNOTES
FARM BUSINESS MODELS
6.3. Farm resources
6.3.1. Irrigation water as a farm business asset and enterprise input
The Australian water market is composed of several water markets, differentiated by water system or administrative boundaries. The scale of Australia’s water markets varies greatly, from small unconnected water markets to extensive connected systems such as the Murray–Darling Basin, which is the largest water-trading area in Australia55.
There are two main rights to access irrigation water, and both are traded in Australian water markets:
• water access entitlement – the rights to an ongoing share of the total amount of water available in a water system; and
• water allocation – the actual amount of water available under water access entitlements in a given season.
During the year, water is distributed or ‘allocated’ against entitlements by state governments in response to factors such as changes in rainfall and water storages.
Subject to rules and regulations, owners of irrigation water can choose to:
• use the water allocated to their entitlements;• buy additional water allocations;• sell part or all of their water allocations;• buy or sell water entitlements; or• lease water entitlements.
Permanent trade is the trade of water entitlements, known as entitlement trade.
Temporary trade is the trade of water allocations, known as allocation trade.
Irrigated growers determine whether they need to buy or sell temporary trade water at a particular time. The price of water is a reflection of demand and supply factors.
The mix of water property rights traded in Australian water markets is dominated by water entitlements and water allocations. There is limited use of futures, options, leases or more sophisticated derivative products for trading water57.
Irrigation water can be considered as an irrigated crop input. For example, water allocation transfers are used to supplement water availability to meet irrigation requirements on crops in a given season, or to dispose of water that is surplus to crop requirements.
Increasingly, there also are circumstances where water is traded even though it is not surplus to crop requirements. This occurs when growers consider that the relative return from the use of water for crops is less than, or close to, the value of the water on the temporary transfer market.
Water markets within the Murray–Darling Basin have developed to become efficient mechanisms for transferring water between irrigators. Figure 17 shows temporary trade volume and average prices for Murray Irrigation (MI). MI supplies irrigation water to 2300 farms, covering 748,000 hectares of irrigated agriculture in southern NSW58.
The consulting firm RMCG conducted an analysis of irrigation water prices for the Lachlan, Murrumbidgee and Murray irrigation areas in 201460. Results showed irrigation water prices on annual (temporary) trading markets since 2000 have ranged from $60 to $100 per megalitre, representing an average of eight per cent of the capital value of the water entitlement. In contrast, for the period 1995 to 2000, water prices on annual trading markets ranged from $10 to $30 per megalitre, representing an average of two per cent of the capital value of the water entitlement.
Irrigation growers have come to rely on water trading as a means to allocate water to its best, and usually highest, value uses. Water trading is an important tool for irrigators
SECTION 6
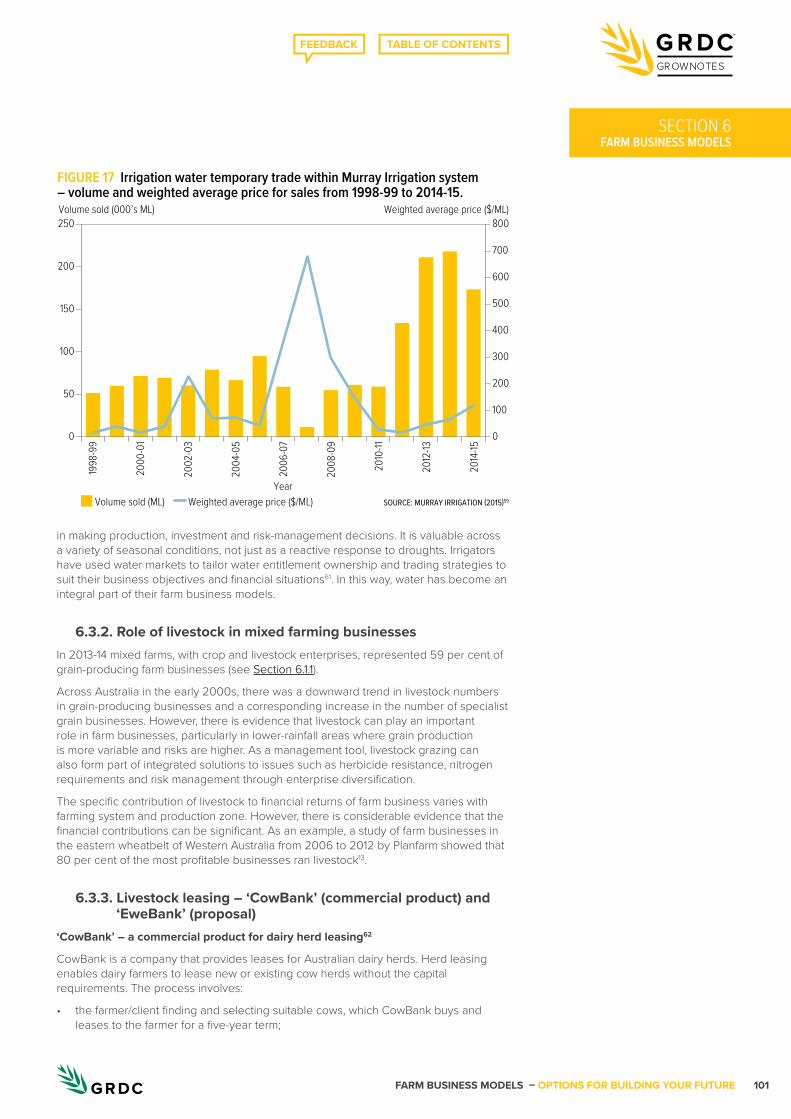
FARM BUSINESS MODELS – OPTIONS FOR BUILDING YOUR FUTURE 101
GROWNOTES
FARM BUSINESS MODELSSECTION 6
in making production, investment and risk-management decisions. It is valuable across a variety of seasonal conditions, not just as a reactive response to droughts. Irrigators have used water markets to tailor water entitlement ownership and trading strategies to suit their business objectives and financial situations61. In this way, water has become an integral part of their farm business models.
6.3.2. Role of livestock in mixed farming businessesIn 2013-14 mixed farms, with crop and livestock enterprises, represented 59 per cent of grain-producing farm businesses (see Section 6.1.1).
Across Australia in the early 2000s, there was a downward trend in livestock numbers in grain-producing businesses and a corresponding increase in the number of specialist grain businesses. However, there is evidence that livestock can play an important role in farm businesses, particularly in lower-rainfall areas where grain production is more variable and risks are higher. As a management tool, livestock grazing can also form part of integrated solutions to issues such as herbicide resistance, nitrogen requirements and risk management through enterprise diversification.
The specific contribution of livestock to financial returns of farm business varies with farming system and production zone. However, there is considerable evidence that the financial contributions can be significant. As an example, a study of farm businesses in the eastern wheatbelt of Western Australia from 2006 to 2012 by Planfarm showed that 80 per cent of the most profitable businesses ran livestock13.
6.3.3. Livestock leasing – ‘CowBank’ (commercial product) and ‘EweBank’ (proposal)
‘CowBank’ – a commercial product for dairy herd leasing62
CowBank is a company that provides leases for Australian dairy herds. Herd leasing enables dairy farmers to lease new or existing cow herds without the capital requirements. The process involves:
• the farmer/client finding and selecting suitable cows, which CowBank buys and leases to the farmer for a five-year term;
SOURCE: MURRAY IRRIGATION (2015)59
FIGURE 17 Irrigation water temporary trade within Murray Irrigation system – volume and weighted average price for sales from 1998-99 to 2014-15.
Volume sold (ML) Weighted average price ($/ML)Year
Volume sold (000’s ML) Weighted average price ($/ML)250
200
150
100
50
0
800
700
600
500
400
300
200
100
0
1998
-99
2000
-01
2002
-03
2004
-05
2006
-07
2008
-09
2010
-11
2012
-13
2014
-15
FARM BUSINESS MODELS – OPTIONS FOR BUILDING YOUR FUTURE102
GROWNOTES
FARM BUSINESS MODELS
• after completing the lease term, CowBank ‘sells’ the herd to the farmer/client for 20 per cent of the original purchase price.
The cost of CowBank herd leasing varies depending on the size and term of the contract. The cost is fixed for the term of the contract, typically equating to between 15 and 20 per cent of the income per cow. Being an operating lease, the monthly fees are deductible business expenses. The herd lease contracts are typically completed with a 20 per cent residual sale value at the end of a five-year contract16.
‘EweBank’ – a proposed model for the sheep industry16
The Department of Agriculture and Food, Western Australia (DAFWA), has proposed a ‘EweBank’ model, based on ‘CowBank’, for the WA sheep industry. The ‘EweBank’ company would finance the upfront purchase of ewes and lease them to the producer over an agreed term. The producer would pay monthly, tax-deductible lease payments, with an option to purchase the ewes at residual value at the end of the lease. This is similar to machinery finance.
‘EweBank’ would be best suited to farm businesses looking to rapidly expand their sheep flock but without the capital to purchase ewes. Benefits could include:
• accelerated growth of breeding flock to take advantage of strengthening prices;• financing 100 per cent of the ewe value;• cash flow, with costs covered progressively rather than upfront; and• potential tax advantages.
Other aspects to consider:
• there will be an interest component embedded in the lease payments. Producers will need to calculate the full after-tax value of leasing versus buying ewes;
• the productive life span of the ewe may be lower than expected; and• there may be tax implications.
6.3.4. High labour efficiency can be achieved with models other than family farms
Evidence that high labour efficiency is not exclusively associated with family farms has been provided in a recent Australian Farm Institute (AFI) analysis63.
There has been an increased reliance on employees rather than family labour in Australian agriculture. This is evident in the fact that the proportion of salaried workers in the agricultural workforce has increased from 35 per cent in 1990 to 58 per cent in 2013, despite the total agricultural labour force, including employees and owner-operators, having declined by 25 per cent over the same period.
Contrary to expectations, the increased reliance on employed labour, or non-family labour, has not led to a general decrease in farm labour efficiency. ABARES data used in the AFI analysis suggests that labour efficiency in small farm businesses has shown a decreasing trend, but in large farm businesses has shown a moderate increasing trend. Broadacre grain farm businesses have shown a strong increasing trend in labour efficiency. ABARES data defines ‘small’ farm businesses as those with an estimated value of agricultural output (EVAO) less than $200,000 a year and ‘large’ farm businesses with an EVAO greater than $400,000.
Figure 18 shows labour indicators for broadacre grain farm businesses, with labour costs ranging from 10 to 20 per cent of total costs during the period 1990 to 2013. This compares with 25 to 30 per cent for beef and sheep farms (not shown in graph). The three indicators displayed in the graph are:
• an index of labour efficiency (ILE), real dollars of farm output per real dollar of labour cost;
• labour costs as a proportion of total farm costs (LC); and
• salaried labour as a proportion of total labour (SL).
SECTION 6
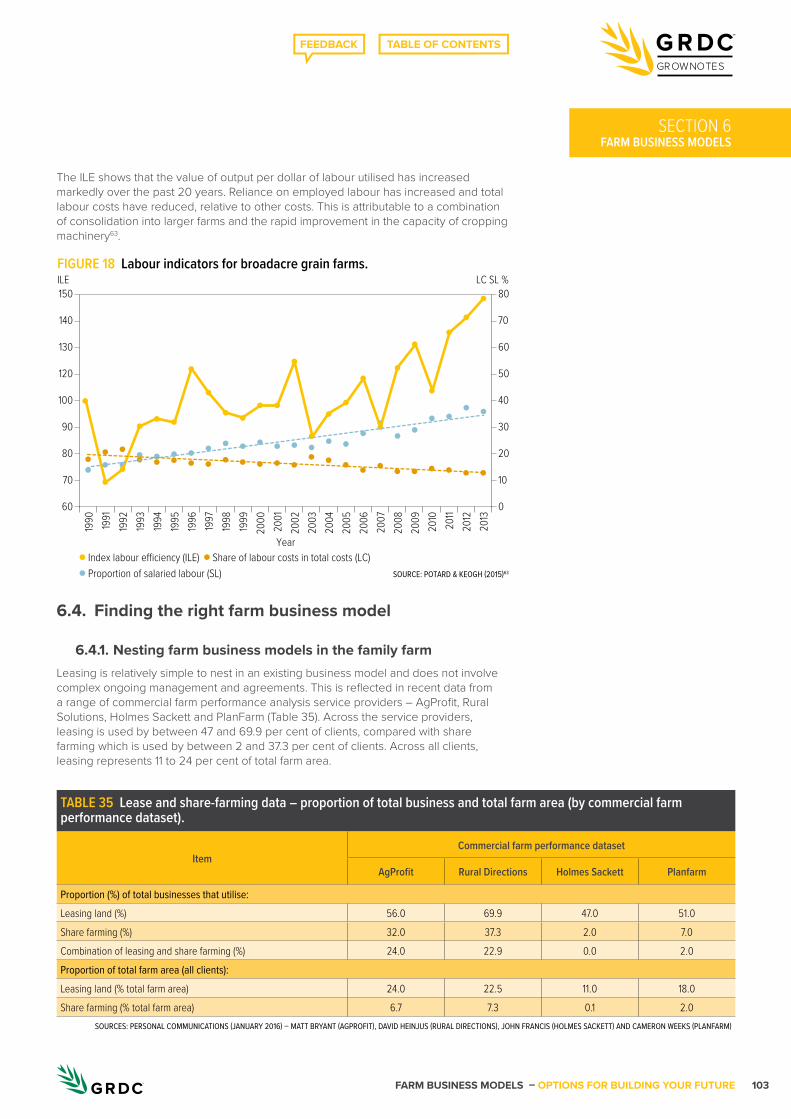
FARM BUSINESS MODELS – OPTIONS FOR BUILDING YOUR FUTURE 103
GROWNOTES
FARM BUSINESS MODELSSECTION 6
The ILE shows that the value of output per dollar of labour utilised has increased markedly over the past 20 years. Reliance on employed labour has increased and total labour costs have reduced, relative to other costs. This is attributable to a combination of consolidation into larger farms and the rapid improvement in the capacity of cropping machinery63.
6.4. Finding the right farm business model
6.4.1. Nesting farm business models in the family farmLeasing is relatively simple to nest in an existing business model and does not involve complex ongoing management and agreements. This is reflected in recent data from a range of commercial farm performance analysis service providers – AgProfit, Rural Solutions, Holmes Sackett and PlanFarm (Table 35). Across the service providers, leasing is used by between 47 and 69.9 per cent of clients, compared with share farming which is used by between 2 and 37.3 per cent of clients. Across all clients, leasing represents 11 to 24 per cent of total farm area.
SOURCE: POTARD & KEOGH (2015)63
FIGURE 18 Labour indicators for broadacre grain farms.
Index labour e�ciency (ILE)
ILE150
140
130
120
100
90
80
70
60
LC SL %80
70
60
50
40
30
20
10
0
Year
1990 1991
1992
1993
1994
1995
1996
1997
1998
1999
2001
2002
2003
2004
2000
2005
2006
2007
2008
2009
2010
2011
2012
2013
Proportion of salaried labour (SL)Share of labour costs in total costs (LC)
TABLE 35 Lease and share-farming data – proportion of total business and total farm area (by commercial farm performance dataset).
ItemCommercial farm performance dataset
AgProfit Rural Directions Holmes Sackett Planfarm
Proportion (%) of total businesses that utilise: Leasing land (%) 56.0 69.9 47.0 51.0Share farming (%) 32.0 37.3 2.0 7.0Combination of leasing and share farming (%) 24.0 22.9 0.0 2.0Proportion of total farm area (all clients): Leasing land (% total farm area) 24.0 22.5 11.0 18.0Share farming (% total farm area) 6.7 7.3 0.1 2.0
SOURCES: PERSONAL COMMUNICATIONS (JANUARY 2016) – MATT BRYANT (AGPROFIT), DAVID HEINJUS (RURAL DIRECTIONS), JOHN FRANCIS (HOLMES SACKETT) AND CAMERON WEEKS (PLANFARM)
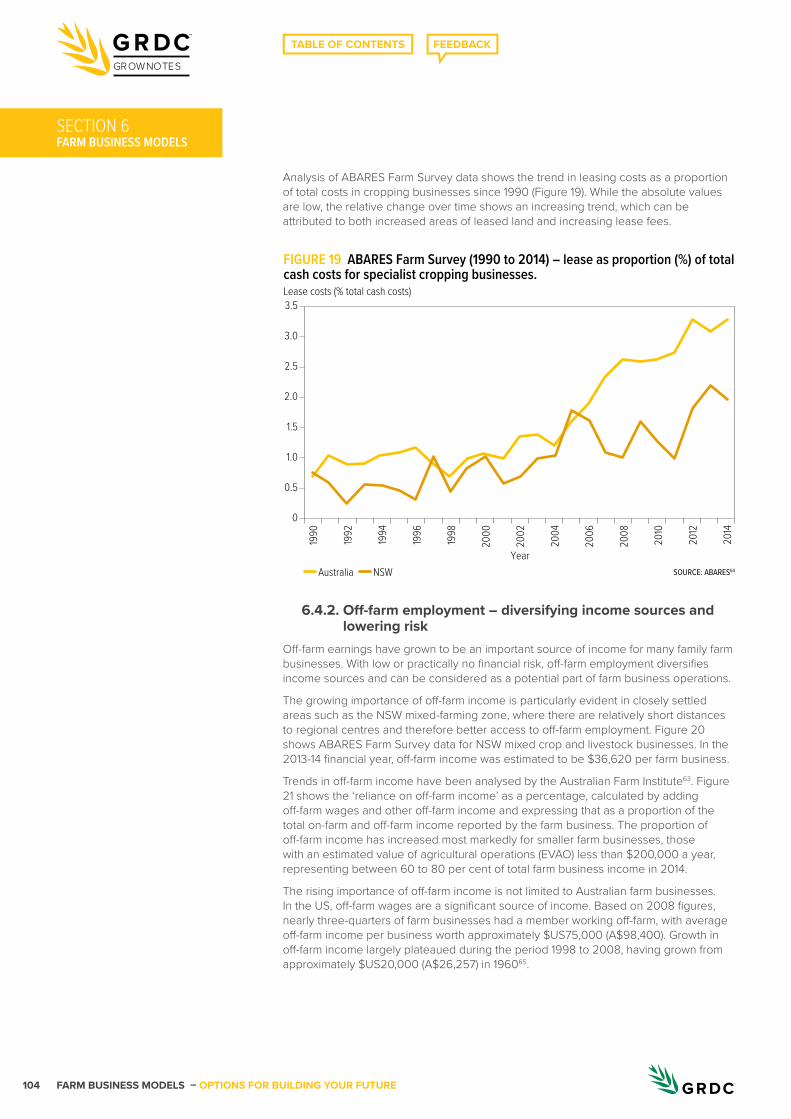
FARM BUSINESS MODELS – OPTIONS FOR BUILDING YOUR FUTURE104
GROWNOTES
FARM BUSINESS MODELS
Analysis of ABARES Farm Survey data shows the trend in leasing costs as a proportion of total costs in cropping businesses since 1990 (Figure 19). While the absolute values are low, the relative change over time shows an increasing trend, which can be attributed to both increased areas of leased land and increasing lease fees.
6.4.2. Off-farm employment – diversifying income sources and lowering risk
Off-farm earnings have grown to be an important source of income for many family farm businesses. With low or practically no financial risk, off-farm employment diversifies income sources and can be considered as a potential part of farm business operations.
The growing importance of off-farm income is particularly evident in closely settled areas such as the NSW mixed-farming zone, where there are relatively short distances to regional centres and therefore better access to off-farm employment. Figure 20 shows ABARES Farm Survey data for NSW mixed crop and livestock businesses. In the 2013-14 financial year, off-farm income was estimated to be $36,620 per farm business.
Trends in off-farm income have been analysed by the Australian Farm Institute63. Figure 21 shows the ‘reliance on off-farm income’ as a percentage, calculated by adding off-farm wages and other off-farm income and expressing that as a proportion of the total on-farm and off-farm income reported by the farm business. The proportion of off-farm income has increased most markedly for smaller farm businesses, those with an estimated value of agricultural operations (EVAO) less than $200,000 a year, representing between 60 to 80 per cent of total farm business income in 2014.
The rising importance of off-farm income is not limited to Australian farm businesses. In the US, off-farm wages are a significant source of income. Based on 2008 figures, nearly three-quarters of farm businesses had a member working off-farm, with average off-farm income per business worth approximately $US75,000 (A$98,400). Growth in off-farm income largely plateaued during the period 1998 to 2008, having grown from approximately $US20,000 (A$26,257) in 196065.
SECTION 6
SOURCE: ABARES64
FIGURE 19 ABARES Farm Survey (1990 to 2014) – lease as proportion (%) of total cash costs for specialist cropping businesses.
Australia
Lease costs (% total cash costs)3.5
3.0
2.5
2.0
1.5
1.0
0.5
0
Year
1990
1992
1994
1996
1998
2000
2002
2004
2006
2008
2010
2012
2014
NSW
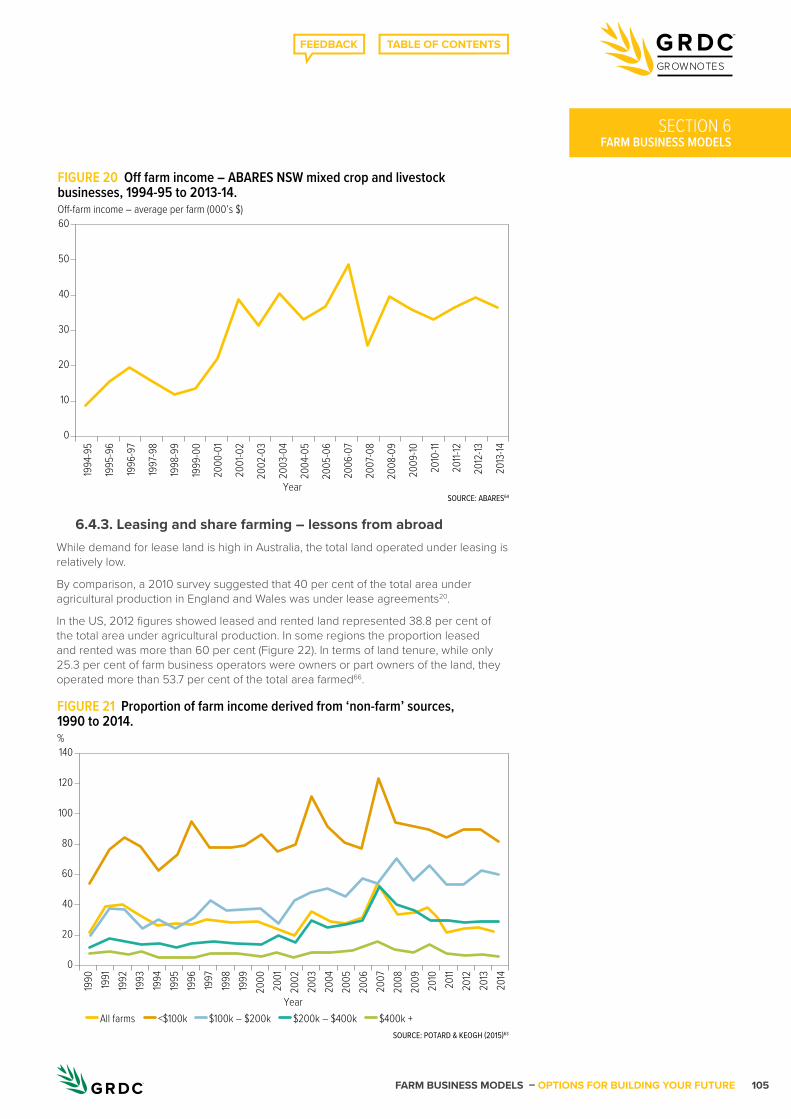
FARM BUSINESS MODELS – OPTIONS FOR BUILDING YOUR FUTURE 105
GROWNOTES
FARM BUSINESS MODELSSECTION 6
6.4.3. Leasing and share farming – lessons from abroadWhile demand for lease land is high in Australia, the total land operated under leasing is relatively low.
By comparison, a 2010 survey suggested that 40 per cent of the total area under agricultural production in England and Wales was under lease agreements20.
In the US, 2012 figures showed leased and rented land represented 38.8 per cent of the total area under agricultural production. In some regions the proportion leased and rented was more than 60 per cent (Figure 22). In terms of land tenure, while only 25.3 per cent of farm business operators were owners or part owners of the land, they operated more than 53.7 per cent of the total area farmed66.
SOURCE: ABARES64
FIGURE 20 O� farm income – ABARES NSW mixed crop and livestock businesses, 1994-95 to 2013-14.O�-farm income – average per farm (000’s $)60
50
40
30
20
10
0
Year
1994
-95
1995
-96
1996
-97
1997
-98
1998
-99
1999
-00
2000
-01
2002
-03
2003
-04
2001
-02
2004
-05
2005
-06
2006
-07
2007
-08
2008
-09
2009
-10
2010
-11
2011-
12
2012
-13
2013
-14
SOURCE: POTARD & KEOGH (2015)63
FIGURE 21 Proportion of farm income derived from ‘non-farm’ sources, 1990 to 2014.
All farms
%140
120
100
80
60
40
20
0
Year<$100k $200k – $400k $400k +$100k – $200k
1990
1992
1994
1996
1998
2000
2002
2004
2006
2008
2010
2012
1991
1993
1995
1997
1999
2001
2003
2005
2007
2009 2011
2013
2014
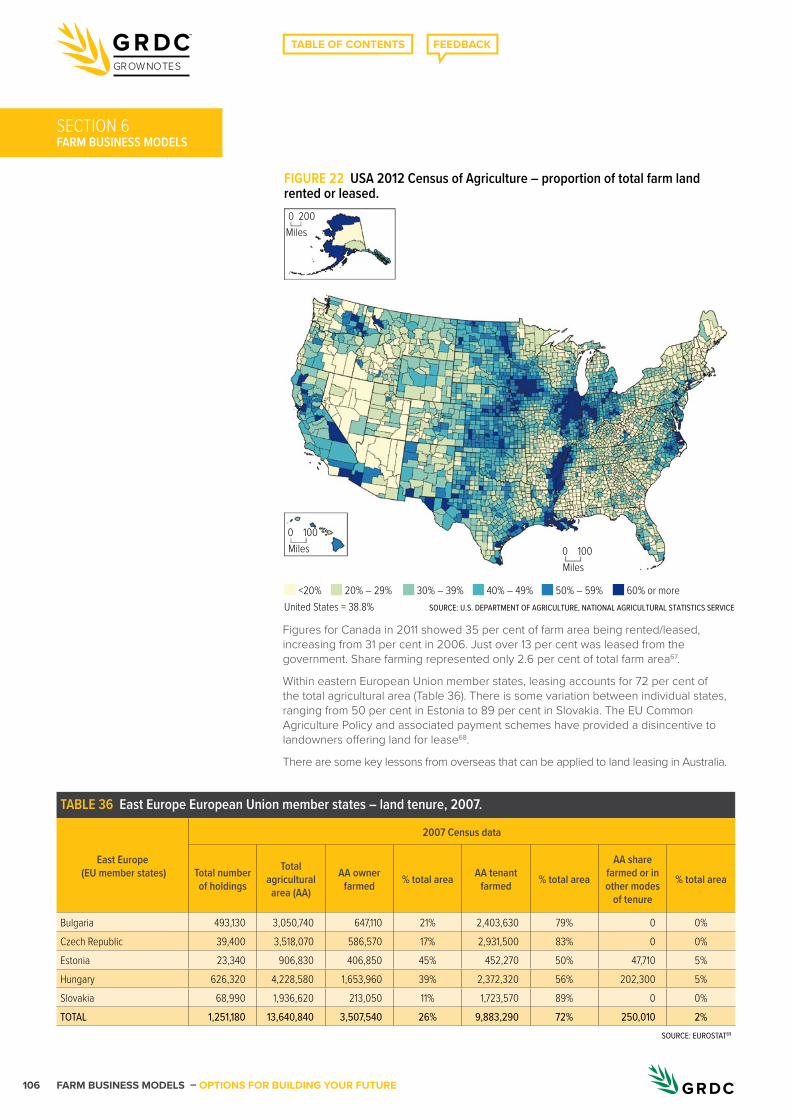
FARM BUSINESS MODELS – OPTIONS FOR BUILDING YOUR FUTURE106
GROWNOTES
FARM BUSINESS MODELS
Figures for Canada in 2011 showed 35 per cent of farm area being rented/leased, increasing from 31 per cent in 2006. Just over 13 per cent was leased from the government. Share farming represented only 2.6 per cent of total farm area67.
Within eastern European Union member states, leasing accounts for 72 per cent of the total agricultural area (Table 36). There is some variation between individual states, ranging from 50 per cent in Estonia to 89 per cent in Slovakia. The EU Common Agriculture Policy and associated payment schemes have provided a disincentive to landowners offering land for lease68.
There are some key lessons from overseas that can be applied to land leasing in Australia.
SECTION 6
SOURCE: U.S. DEPARTMENT OF AGRICULTURE, NATIONAL AGRICULTURAL STATISTICS SERVICEUnited States = 38.8%
0Miles
Miles0 100
Miles0 100
200
FIGURE 22 USA 2012 Census of Agriculture – proportion of total farm land rented or leased.
<20% 20% – 29% 30% – 39% 40% – 49% 50% – 59% 60% or more
TABLE 36 East Europe European Union member states – land tenure, 2007.
East Europe (EU member states)
2007 Census data
Total number of holdings
Total agricultural
area (AA)
AA owner farmed % total area AA tenant
farmed % total area
AA share farmed or in other modes
of tenure
% total area
Bulgaria 493,130 3,050,740 647,110 21% 2,403,630 79% 0 0%Czech Republic 39,400 3,518,070 586,570 17% 2,931,500 83% 0 0%Estonia 23,340 906,830 406,850 45% 452,270 50% 47,710 5%Hungary 626,320 4,228,580 1,653,960 39% 2,372,320 56% 202,300 5%Slovakia 68,990 1,936,620 213,050 11% 1,723,570 89% 0 0%TOTAL 1,251,180 13,640,840 3,507,540 26% 9,883,290 72% 250,010 2%
SOURCE: EUROSTAT69
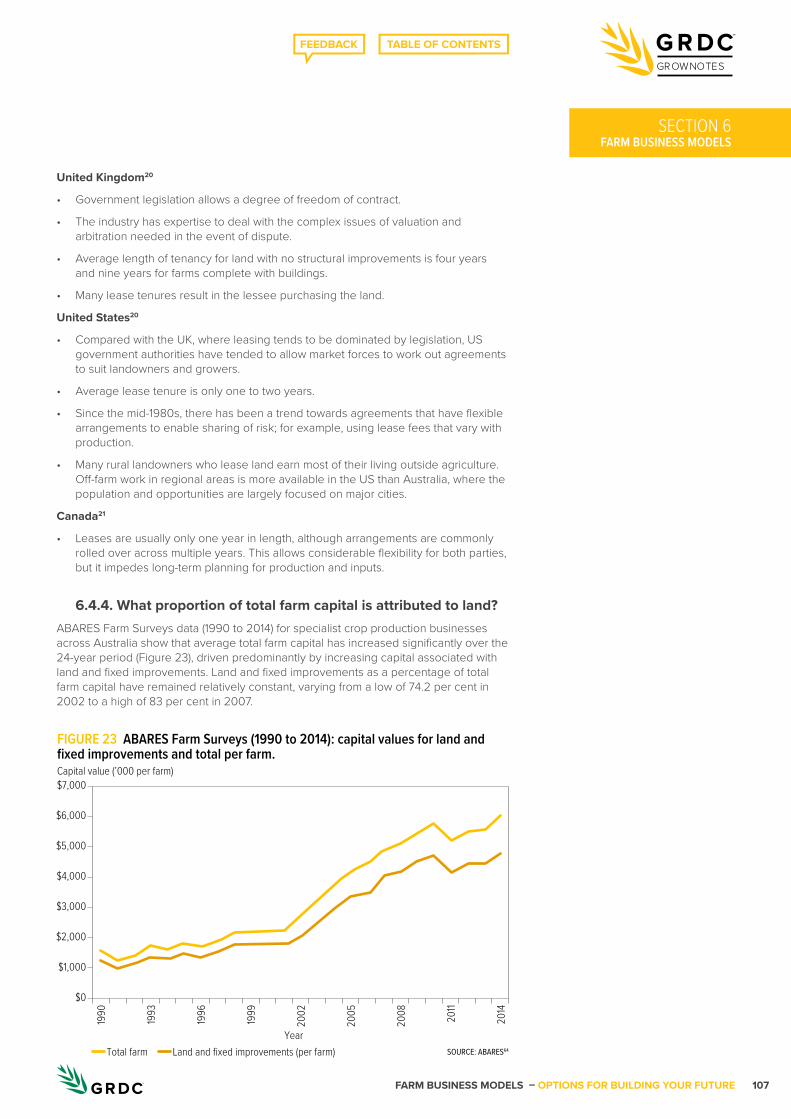
FARM BUSINESS MODELS – OPTIONS FOR BUILDING YOUR FUTURE 107
GROWNOTES
FARM BUSINESS MODELSSECTION 6
United Kingdom20
• Government legislation allows a degree of freedom of contract.
• The industry has expertise to deal with the complex issues of valuation and arbitration needed in the event of dispute.
• Average length of tenancy for land with no structural improvements is four years and nine years for farms complete with buildings.
• Many lease tenures result in the lessee purchasing the land.
United States20
• Compared with the UK, where leasing tends to be dominated by legislation, US government authorities have tended to allow market forces to work out agreements to suit landowners and growers.
• Average lease tenure is only one to two years.
• Since the mid-1980s, there has been a trend towards agreements that have flexible arrangements to enable sharing of risk; for example, using lease fees that vary with production.
• Many rural landowners who lease land earn most of their living outside agriculture. Off-farm work in regional areas is more available in the US than Australia, where the population and opportunities are largely focused on major cities.
Canada21
• Leases are usually only one year in length, although arrangements are commonly rolled over across multiple years. This allows considerable flexibility for both parties, but it impedes long-term planning for production and inputs.
6.4.4. What proportion of total farm capital is attributed to land?ABARES Farm Surveys data (1990 to 2014) for specialist crop production businesses across Australia show that average total farm capital has increased significantly over the 24-year period (Figure 23), driven predominantly by increasing capital associated with land and fixed improvements. Land and fixed improvements as a percentage of total farm capital have remained relatively constant, varying from a low of 74.2 per cent in 2002 to a high of 83 per cent in 2007.
SOURCE: ABARES64
FIGURE 23 ABARES Farm Surveys (1990 to 2014): capital values for land and fixed improvements and total per farm.
Total farm
Capital value (’000 per farm)$7,000
$6,000
$5,000
$4,000
$3,000
$2,000
$1,000
$0
Year
1990
1993
1996
1999
2002
2005
2008 2011
2014
Land and fixed improvements (per farm)
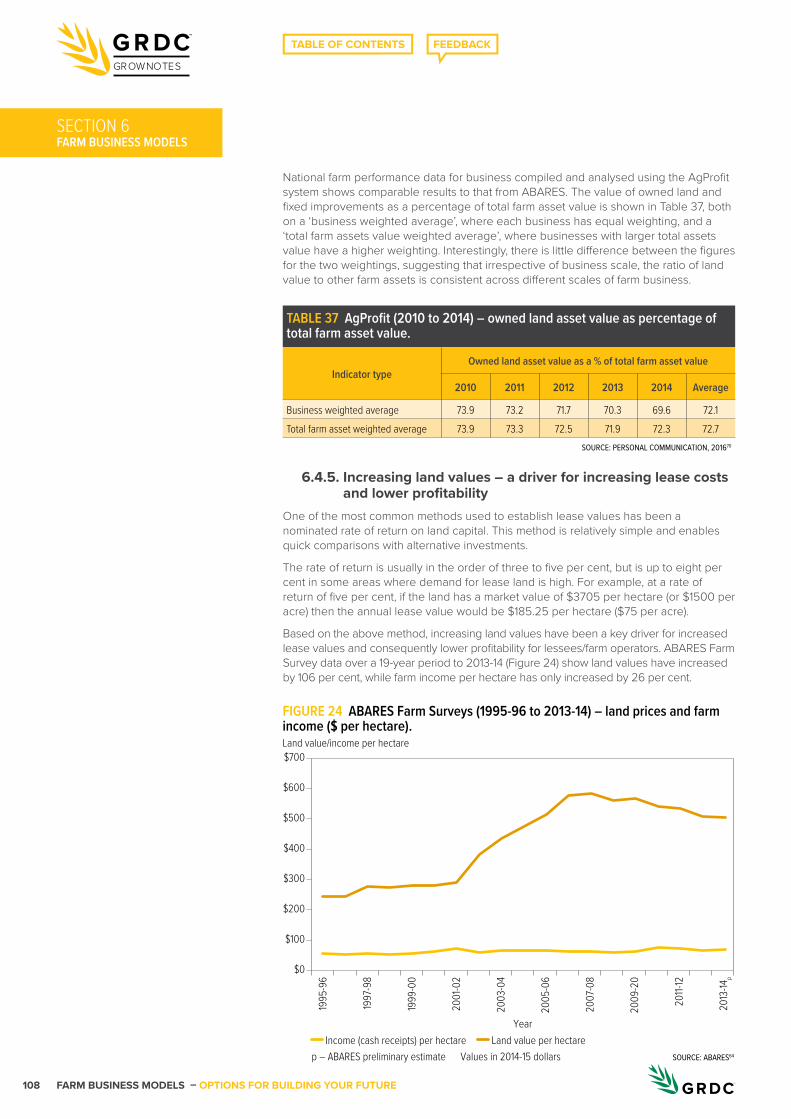
FARM BUSINESS MODELS – OPTIONS FOR BUILDING YOUR FUTURE108
GROWNOTES
FARM BUSINESS MODELS
National farm performance data for business compiled and analysed using the AgProfit system shows comparable results to that from ABARES. The value of owned land and fixed improvements as a percentage of total farm asset value is shown in Table 37, both on a ‘business weighted average’, where each business has equal weighting, and a ‘total farm assets value weighted average’, where businesses with larger total assets value have a higher weighting. Interestingly, there is little difference between the figures for the two weightings, suggesting that irrespective of business scale, the ratio of land value to other farm assets is consistent across different scales of farm business.
6.4.5. Increasing land values – a driver for increasing lease costs and lower profitability
One of the most common methods used to establish lease values has been a nominated rate of return on land capital. This method is relatively simple and enables quick comparisons with alternative investments.
The rate of return is usually in the order of three to five per cent, but is up to eight per cent in some areas where demand for lease land is high. For example, at a rate of return of five per cent, if the land has a market value of $3705 per hectare (or $1500 per acre) then the annual lease value would be $185.25 per hectare ($75 per acre).
Based on the above method, increasing land values have been a key driver for increased lease values and consequently lower profitability for lessees/farm operators. ABARES Farm Survey data over a 19-year period to 2013-14 (Figure 24) show land values have increased by 106 per cent, while farm income per hectare has only increased by 26 per cent.
SECTION 6
TABLE 37 AgProfit (2010 to 2014) – owned land asset value as percentage of total farm asset value.
Indicator typeOwned land asset value as a % of total farm asset value
2010 2011 2012 2013 2014 Average
Business weighted average 73.9 73.2 71.7 70.3 69.6 72.1Total farm asset weighted average 73.9 73.3 72.5 71.9 72.3 72.7
SOURCE: PERSONAL COMMUNICATION, 201670
SOURCE: ABARES64
FIGURE 24 ABARES Farm Surveys (1995-96 to 2013-14) – land prices and farm income ($ per hectare).
Income (cash receipts) per hectare
Land value/income per hectare$700
$600
$500
$400
$300
$200
$100
$0
Year
1995
-96
1997
-98
1999
-00
2001
-02
2003
-04
2005
-06
2007
-08
2009
-20
2011-
12
2013
-14p
Land value per hectarep – ABARES preliminary estimate Values in 2014-15 dollars
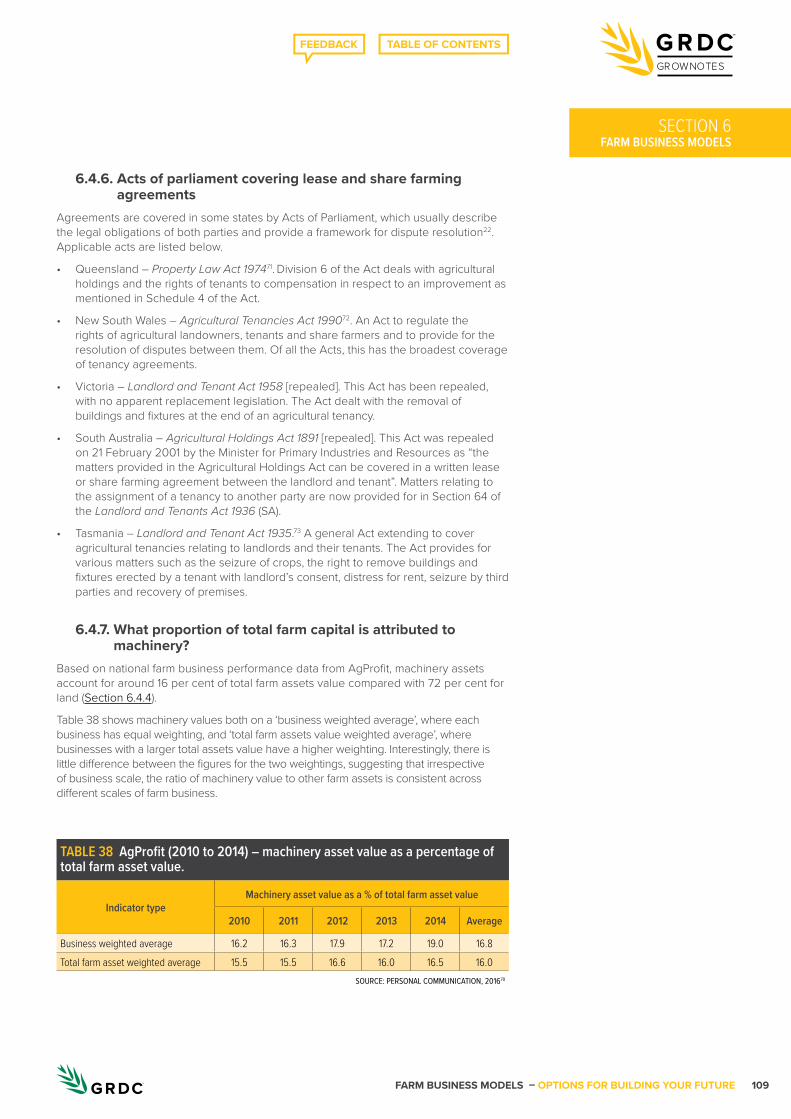
FARM BUSINESS MODELS – OPTIONS FOR BUILDING YOUR FUTURE 109
GROWNOTES
FARM BUSINESS MODELSSECTION 6
6.4.6. Acts of parliament covering lease and share farming agreements
Agreements are covered in some states by Acts of Parliament, which usually describe the legal obligations of both parties and provide a framework for dispute resolution22. Applicable acts are listed below.
• Queensland – Property Law Act 197471. Division 6 of the Act deals with agricultural holdings and the rights of tenants to compensation in respect to an improvement as mentioned in Schedule 4 of the Act.
• New South Wales – Agricultural Tenancies Act 199072. An Act to regulate the rights of agricultural landowners, tenants and share farmers and to provide for the resolution of disputes between them. Of all the Acts, this has the broadest coverage of tenancy agreements.
• Victoria – Landlord and Tenant Act 1958 [repealed]. This Act has been repealed, with no apparent replacement legislation. The Act dealt with the removal of buildings and fixtures at the end of an agricultural tenancy.
• South Australia – Agricultural Holdings Act 1891 [repealed]. This Act was repealed on 21 February 2001 by the Minister for Primary Industries and Resources as “the matters provided in the Agricultural Holdings Act can be covered in a written lease or share farming agreement between the landlord and tenant”. Matters relating to the assignment of a tenancy to another party are now provided for in Section 64 of the Landlord and Tenants Act 1936 (SA).
• Tasmania – Landlord and Tenant Act 1935.73 A general Act extending to cover agricultural tenancies relating to landlords and their tenants. The Act provides for various matters such as the seizure of crops, the right to remove buildings and fixtures erected by a tenant with landlord’s consent, distress for rent, seizure by third parties and recovery of premises.
6.4.7. What proportion of total farm capital is attributed to machinery?
Based on national farm business performance data from AgProfit, machinery assets account for around 16 per cent of total farm assets value compared with 72 per cent for land (Section 6.4.4).
Table 38 shows machinery values both on a ‘business weighted average’, where each business has equal weighting, and ‘total farm assets value weighted average’, where businesses with a larger total assets value have a higher weighting. Interestingly, there is little difference between the figures for the two weightings, suggesting that irrespective of business scale, the ratio of machinery value to other farm assets is consistent across different scales of farm business.
TABLE 38 AgProfit (2010 to 2014) – machinery asset value as a percentage of total farm asset value.
Indicator typeMachinery asset value as a % of total farm asset value
2010 2011 2012 2013 2014 Average
Business weighted average 16.2 16.3 17.9 17.2 19.0 16.8Total farm asset weighted average 15.5 15.5 16.6 16.0 16.5 16.0
SOURCE: PERSONAL COMMUNICATION, 201670
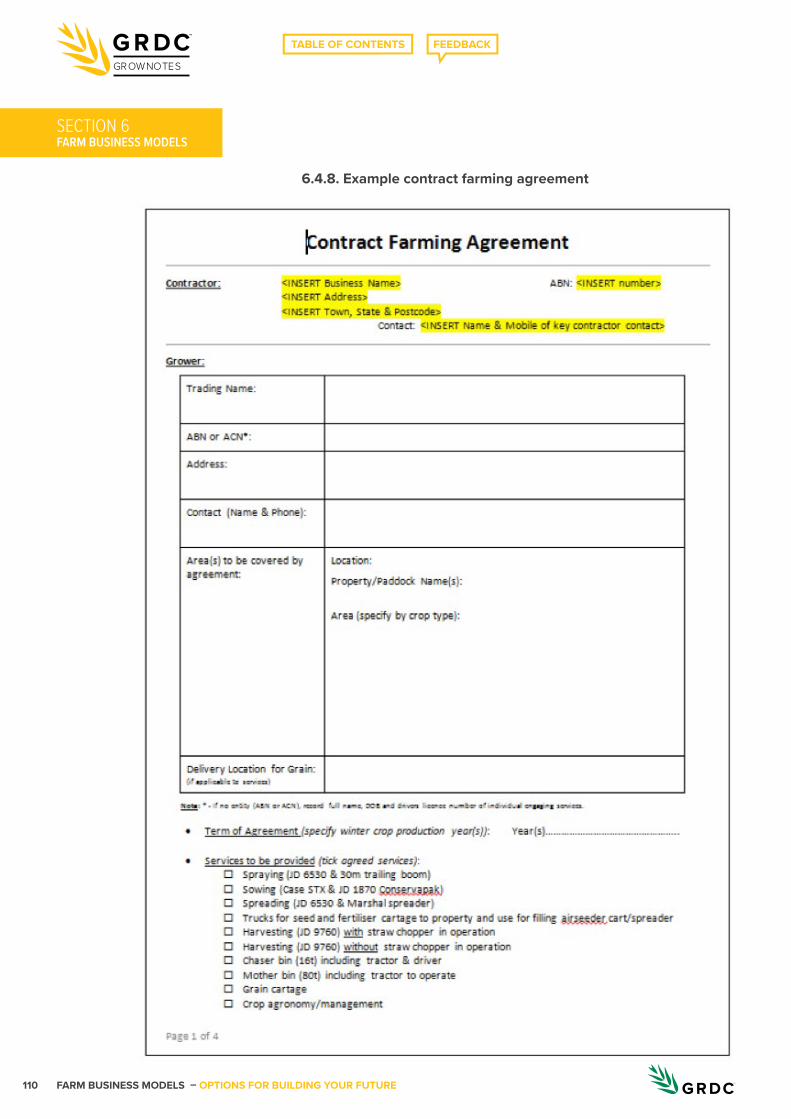
FARM BUSINESS MODELS – OPTIONS FOR BUILDING YOUR FUTURE110
GROWNOTES
FARM BUSINESS MODELSSECTION 6
6.4.8. Example contract farming agreement
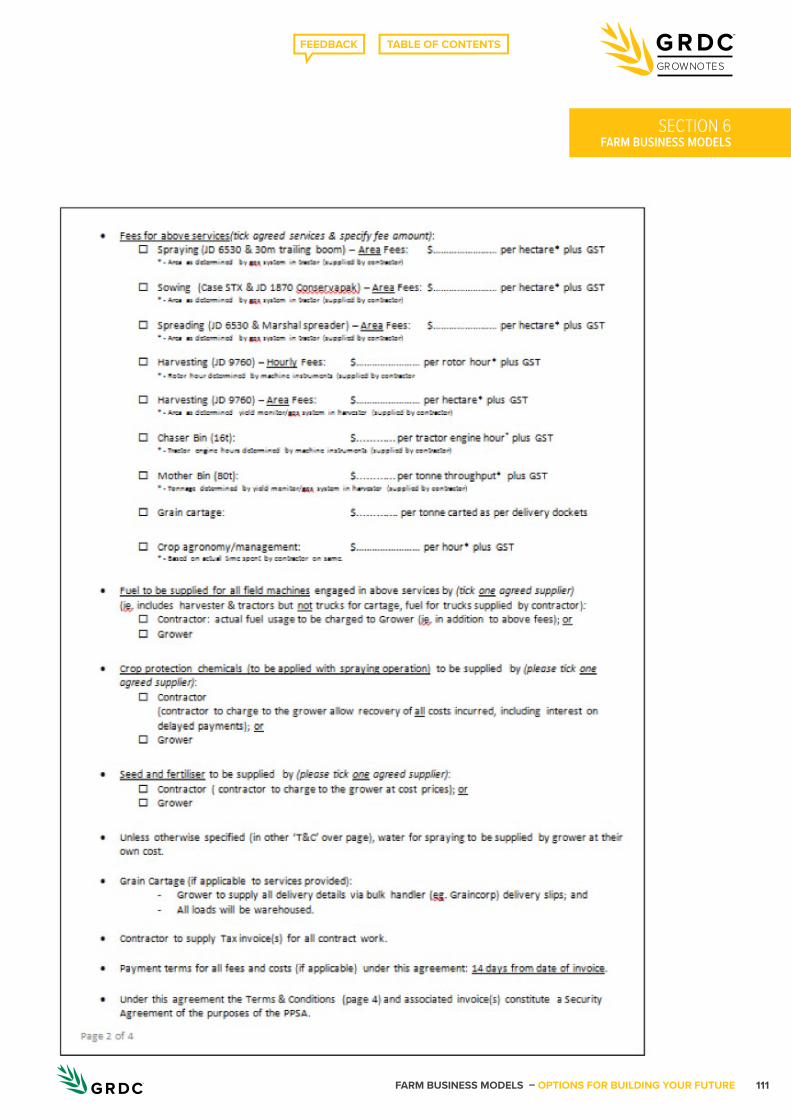
FARM BUSINESS MODELS – OPTIONS FOR BUILDING YOUR FUTURE 111
GROWNOTES
FARM BUSINESS MODELSSECTION 6
FARM BUSINESS MODELS – OPTIONS FOR BUILDING YOUR FUTURE112
GROWNOTES
FARM BUSINESS MODELSSECTION 6
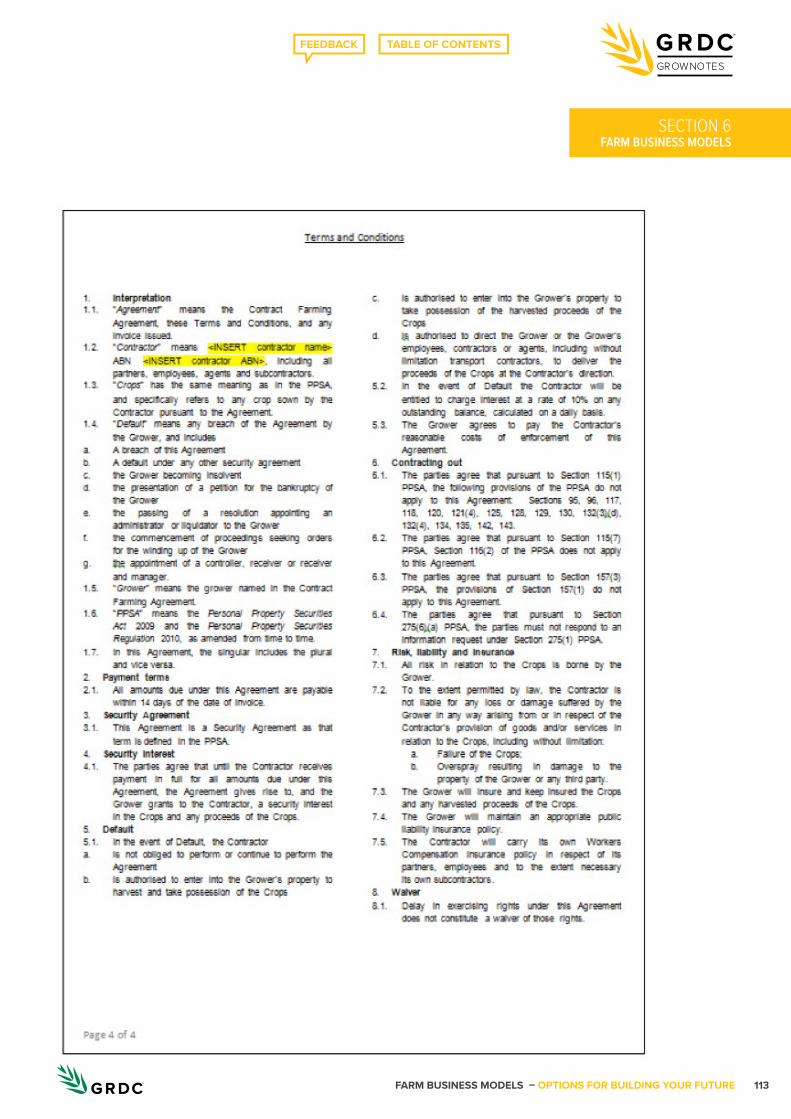
FARM BUSINESS MODELS – OPTIONS FOR BUILDING YOUR FUTURE 113
GROWNOTES
FARM BUSINESS MODELSSECTION 6
FARM BUSINESS MODELS – OPTIONS FOR BUILDING YOUR FUTURE114
GROWNOTES
FARM BUSINESS MODELSSECTION 6
6.4.9. Corporate farming – a form of joint ventureCorporate farms can most simply be described as farm business where capital is provided by a party other than the farm business operator76. In effect, corporate farms are joint ventures.
In terms of farm business models, the four main variants of corporate farms in Australia are described in Table 39, although the use of some models is declining, as described below.
Access to capital and specialised management are key advantages of corporate agriculture. However, evidence suggests that these can be overrun by other factors affecting business profitability, including rigid overhead cost structures associated with centralised management.
Analysis of corporate agriculture business performance (2000–13) by Growth Farms Australia and Pitt Capital Partners showed annual return on capital ranged from –5.4 per cent to an outlier of 20.7 per cent, with an average of 4 per cent. The variability in returns can be attributed to a range of factors including76:
• over-reliance on large scale to reduce operating and overhead costs and deliver operating efficiencies;
• centralised management and associated fee structures not always in alignment with the nature of farm business operations;
• conflicts and inefficiencies with assets rolled into large land purchases; if not suited to farm business operations, can create ‘dis-economies’ of scale;
• short investment timeframes to deploy large amounts of investor capital can make it difficult to make ‘good’ land purchases; and
• tendency to take on new and often unproven production systems and enterprises.
• https://www.youtube.com/watch?v=TJTWxESmeE8 – Alternative business funding models – 2017 Mingenew Farm Business Update – Kevin Sevenson, Sevenson Agriculture, Consultant.
• https://www.youtube.com/watch?v=xaPnMXijWfY Farm funding models and business structure in Australia – Richard Heath
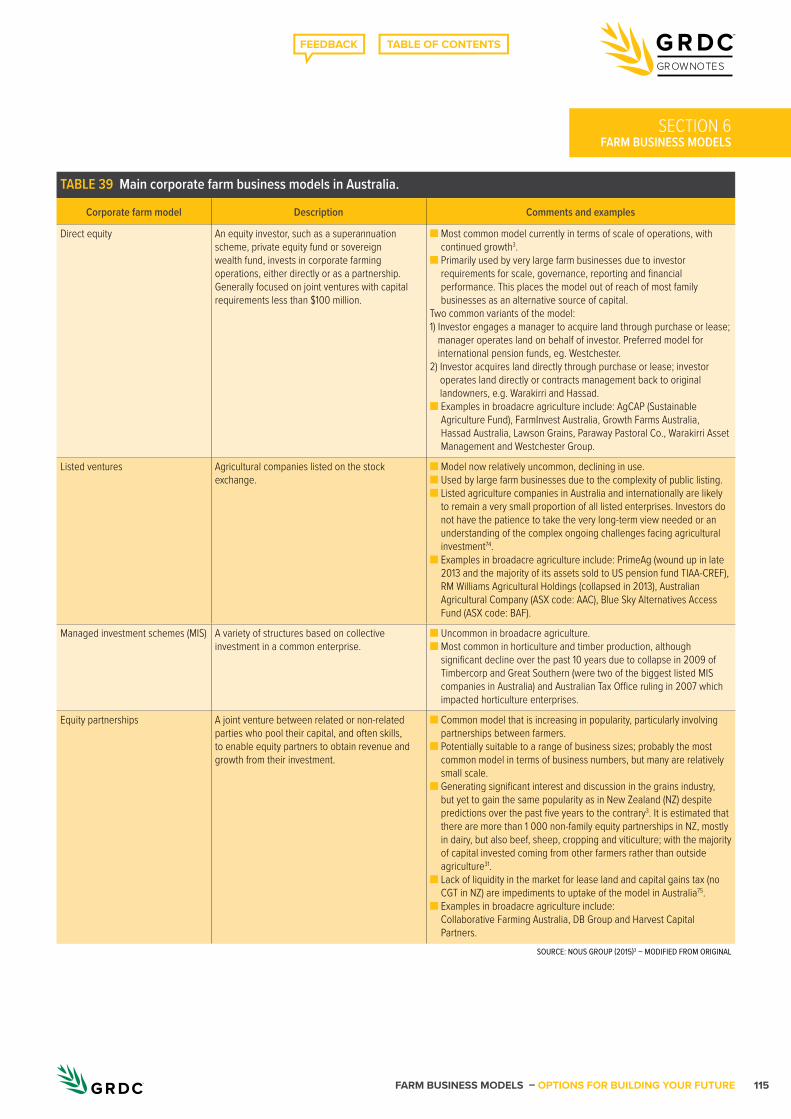
FARM BUSINESS MODELS – OPTIONS FOR BUILDING YOUR FUTURE 115
GROWNOTES
FARM BUSINESS MODELSSECTION 6
TABLE 39 Main corporate farm business models in Australia.
Corporate farm model Description Comments and examples
Direct equity An equity investor, such as a superannuation scheme, private equity fund or sovereign wealth fund, invests in corporate farming operations, either directly or as a partnership. Generally focused on joint ventures with capital requirements less than $100 million.
■ Most common model currently in terms of scale of operations, with continued growth3.
■ Primarily used by very large farm businesses due to investor requirements for scale, governance, reporting and financial performance. This places the model out of reach of most family businesses as an alternative source of capital.
Two common variants of the model:1) Investor engages a manager to acquire land through purchase or lease;
manager operates land on behalf of investor. Preferred model for international pension funds, eg. Westchester.
2) Investor acquires land directly through purchase or lease; investor operates land directly or contracts management back to original landowners, e.g. Warakirri and Hassad.
■ Examples in broadacre agriculture include: AgCAP (Sustainable Agriculture Fund), FarmInvest Australia, Growth Farms Australia, Hassad Australia, Lawson Grains, Paraway Pastoral Co., Warakirri Asset Management and Westchester Group.
Listed ventures Agricultural companies listed on the stock exchange.
■ Model now relatively uncommon, declining in use.■ Used by large farm businesses due to the complexity of public listing.■ Listed agriculture companies in Australia and internationally are likely
to remain a very small proportion of all listed enterprises. Investors do not have the patience to take the very long-term view needed or an understanding of the complex ongoing challenges facing agricultural investment74.
■ Examples in broadacre agriculture include: PrimeAg (wound up in late 2013 and the majority of its assets sold to US pension fund TIAA-CREF), RM Williams Agricultural Holdings (collapsed in 2013), Australian Agricultural Company (ASX code: AAC), Blue Sky Alternatives Access Fund (ASX code: BAF).
Managed investment schemes (MIS) A variety of structures based on collective investment in a common enterprise.
■ Uncommon in broadacre agriculture. ■ Most common in horticulture and timber production, although
significant decline over the past 10 years due to collapse in 2009 of Timbercorp and Great Southern (were two of the biggest listed MIS companies in Australia) and Australian Tax Office ruling in 2007 which impacted horticulture enterprises.
Equity partnerships A joint venture between related or non-related parties who pool their capital, and often skills, to enable equity partners to obtain revenue and growth from their investment.
■ Common model that is increasing in popularity, particularly involving partnerships between farmers.
■ Potentially suitable to a range of business sizes; probably the most common model in terms of business numbers, but many are relatively small scale.
■ Generating significant interest and discussion in the grains industry, but yet to gain the same popularity as in New Zealand (NZ) despite predictions over the past five years to the contrary3. It is estimated that there are more than 1 000 non-family equity partnerships in NZ, mostly in dairy, but also beef, sheep, cropping and viticulture; with the majority of capital invested coming from other farmers rather than outside agriculture31.
■ Lack of liquidity in the market for lease land and capital gains tax (no CGT in NZ) are impediments to uptake of the model in Australia75.
■ Examples in broadacre agriculture include: Collaborative Farming Australia, DB Group and Harvest Capital Partners.
SOURCE: NOUS GROUP (2015)3 – MODIFIED FROM ORIGINAL
FARM BUSINESS MODELS – OPTIONS FOR BUILDING YOUR FUTURE116
GROWNOTES
FARM BUSINESS MODELSSECTION 7
SECTION 7
Endnotes1 Keogh, M 2015, The family farm is becoming less family, Ag Forum, 9 July 2015,
available at www.farminstitute.org.au/ag-forum/the-family-farm-is-becoming-less-family
2 Byerlee, D, Lissita, A & Savanti, P 2012, ‘Corporate models of broadacre crop farming: international experience from Argentina and Ukraine’, Farm Policy Journal, vol. 9, no. 2, pp. 13–25.
3 Nous Group 2015, Contemporary business strategies and learning models in the agrifood industry, report for AgriFood Skills Australia, Canberra.
4 Nicholson, C, Long, J, England, D, Long, B, Creelman, Z, Mudge, B & Cornish, D 2015, Farm decision-making: The interaction of personality, farm business and risk to make more informed decisions, GRDC project code SFS000028, Grains Research & Development Corporation, Canberra.
5 Barclay, E 2007, Farm succession and inheritance – comparing Australian and international trends, Rural Industries Research and Development Corporation, publication no. 07/066.
6 Blackburn, A & Ashby R, 2006, Financing your farm: a practical guide to financial growth, 4th edn, Australian Bankers Association and Grain Growers Association.
7 Port Jackson Partners 2012, Greener Pastures: the global soft commodity opportunity for Australia and New Zealand, report prepared for ANZ as third report in ANZ Insight series.
8 Tomlinson, A 2014, ‘Australian farm businesses could do better with different funding models’, Farm Institute Insights, vol. 11, no. 3, Australian Farm Institute.
9 KPMG 2014, The road to riches: driving investment in Western Australian agriculture, report to Department of Agriculture and Food, Western Australia.
10 Schneider, K 2016, ‘Investing in agriculture – growing our future’, 2016 ABARES Outlook Conference, Canberra.
11 Commonwealth of Australia 2015, Agricultural competitiveness white paper: stronger farmers, stronger economy, Commonwealth of Australia, Canberra.
12 Clark, N & O’Callaghan, P 2013, ‘Australian farming families are here to stay’, Farm Policy Journal, Spring, vol. 10, no. 3, pp. 33–43.
13 Kirk, G 2013, ‘How to farm profitably in the eastern wheatbelt’, Planfarm output from a GRDC project, project code PLN00009, Grains Research & Development Corporation.
14 Beever, G & McCarthy, M 2004, Business health indicators for professional farmers, Farm Management 500, Bendigo, Victoria.
15 Commonwealth of Australia 2012, Impacts of water trading in the southern Murray–Darling Basin between 2006–07 and 2010–11, National Water Commission, Canberra.
16 Alexander, T 2015, ‘Concepts for alternative investment and financing models to expand sheep production in Western Australia’, Department of Agriculture and Food, Western Australia (DAFWA), Sheep Industry Business Innovation project.
17 Australian Government (2015), Business information website, available at www.business.gov.au/business-topics/tax-finance-insurance/business-finances/Pages/sources-of-finance.aspx, accessed 14/12/15.
18 Australian Farm Institute 2016 in press, A Review of Farm Funding Models and Business Structures in Australia, Research Report, Australian Farm Institute, Surry Hills, NSW.
FARM BUSINESS MODELS – OPTIONS FOR BUILDING YOUR FUTURE 117
GROWNOTES
FARM BUSINESS MODELSSECTION 7
19 Crowdsourcing (2016), 2015CF Crowdfunding Industry Report, http://www.crowdsourcing.org
20 Ashby, R & Ashby, D 2011, Successful Land Leasing in Australia – A guide for farmers and their advisers, publication no. 11/052, Rural Industries Research & Development Corporation, Canberra.
21 Ashby, D 2014, To determine how Australian farm succession and productivity can be improved through enhanced leasing practices, report as part of Churchill Fellowship, The Winston Churchill Memorial Trust Of Australia, available at: https://www.churchilltrust.com.au/fellows/detail/3767/Duncan+Ashby
22 Healey, B 2016, Partner at K&L Gates, personal communication.
23 Australian Taxation Office, Taxation Determination TD, 95/62, ‘Income tax: will the owner (or lessor) of land who allows the land to be used in a sharefarming arrangement be considered to be engaged in a business of primary production as defined by the Income Tax Assessment Act 1936 (‘the Act’)?’, available at http://law.ato.gov.au/atolaw/view.htm?docid=TXD/TD9562/NAT/ATO/00001
24 Rural Directions 2013, ‘Leasing and share farming – from both sides of the fence’, Participant Workbook from a Rural Directions management training course, further information at www.ruraldirections.com/pages/industry-development/training.php
25 Healey, B 2016, Partner at K&L Gates, personal communication.
26 Australian Taxation Office, Taxation Determination TD, 95/62, ‘Income tax: will the owner (or lessor) of land who allows the land to be used in a sharefarming arrangement be considered to be engaged in a business of primary production as defined by the Income Tax Assessment Act 1936 (‘the Act’)?’, available at http://law.ato.gov.au/atolaw/view.htm?docid=TXD/TD9562/NAT/ATO/00001
27 Plastina, A, Johanns, A & Weets, S 2015, ‘2015 Iowa Farm Custom Rate Survey’ Ag Decision Maker website (www.extension.iastate.edu/agdm), File A3-10, Iowa State University (US), Extension & Outreach.
28 Wikipedia, ‘Joint venture’, available at https://en.wikipedia.org/wiki/Joint_venture
29 McKinna, D 2014, ‘Food Bowl to Asia: The Policy Context’, Farm Policy Journal, vol. 11, no. 2, pp. 40–9.
30 Shadbolt, N & Gardner, J 2003, ‘Farm investments: alternative ownership structures that address the liquidity versus profitability conundrum’, in Proceedings of 14th International Farm Management Congress, Western Australia, Burswood Convention Centre, Perth, 10–15 August 2003.
31 ANZ 2014, ‘Equity Partnerships – A look under the bonnet’, ANZ Research – Agri Focus, April 2014.
32 Nicholson, C 2015, ‘Risk analysis: training notes for the use of @Risk in whole farm models’, Grain & Graze 3 – Extension and delivery on mixed farm benefits in the Southern Region, GRDC project code SFS00028, Grains Research & Development Corporation.
33 ABARES 2015, Australian crop report, no. 176, Australian Bureau of Agricultural and Resource Economics and Sciences, Canberra.
34 ABARES 2015, Agricultural commodities, December quarter 2015, Australian Bureau of Agricultural and Resource Economics and Sciences, Canberra.
35 Australian Export Grains Innovation Centre 2015, ’Australian grain production – a snapshot’, media release, 29 May 2015, available at http://aegic.org.au/australian-grain-production-a-snapshot

FARM BUSINESS MODELS – OPTIONS FOR BUILDING YOUR FUTURE118
GROWNOTES
FARM BUSINESS MODELSSECTION 7
36 Sackett, D 2015, Managing Director, Growth Farms Australia, personal communication.
37 European Commission 2013, ‘Structure and dynamics of EU farms: changes, trends and policy relevance’, Agriculture and Rural Development, Unit Economic Analysis of EU Agriculture.
38 ABARES 2016, Agricultural commodities, March quarter 2016, Commonwealth of Australia, Canberra.
39 Sheng, Y, Jackson, T & Davidson, A 2015, Resource reallocation and its contribution to productivity growth in Australian broadacre agriculture, ABARES technical report 15.1, April, Canberra.
40 Schneider, K 2014, ‘Recent trends in farm size and performance’, proceedings of the Funding Agriculture’s Future Conference, Australian Farm Institute, Canberra.
41 Sheng, Y, Zhao, S & Nossal, K 2011, ‘Productivity and farm size in Australian agriculture: reinvestigating the returns to scale’, proceedings of Australian Agricultural and Resource Economics Society, 9–11 February 2011, Melbourne, Victoria.
42 Nossal, K, & Sheng, Y 2010, ‘Productivity growth: trends, drivers and opportunities for broadacre and dairy industries, Australian Commodities, vol. 17, no. 1, March quarter 2010, ABARES, Canberra.
43 Gray, E, Jackson, T & Zhao, S 2011, Agricultural productivity: concepts, measurements and factors driving it, RIRDC publication no. 10/161, Rural Industries Research & Development Corporation, Canberra.
44 Barr, N 2014, New entrants to Australian agricultural industries – Where are the young farmers? RIRDC, publication no. 14/003, Rural Industries Research and Development Corporation, Canberra.
45 Reserve Bank of Australia 2016, Statistical Tables (webpage), Rural Debt by Lender (Table D9), RBA, Canberra, available at www.rba.gov.au/statistics/tables/
46 ABARES 2016, Agricultural commodities, March quarter, Australian Bureau of Agricultural and Resource Economics and Sciences, Canberra.
47 ABARES 2015, Australian farm surveys results 2012-13 to 2014-15, Australian Government’s Australian Bureau of Agricultural and Resource Economics and Sciences, Canberra.
48 Rural Finance and Rural Bank 2016, Ag Answers Division, Australian farmland values 2015, Volume 1.
49 Russell Investments 2015, 2015 long term investing report: taking a long term view of the investment landscape, report prepared for the Australian Stock Exchange.
50 ABARES 2016, Australian farm surveys results 2013-14 to 2015-16, Australian Government’s Australian Bureau of Agricultural and Resource Economics and Sciences, Canberra.
51 Bryant M 2016, personal communications, based on data from Ag Profit®, www.agprofit.com.au
52 Watson, P & Watson, D 2015, GRDC Organisational Performance Research – 2015 Grower Survey Report, prepared by Down to Earth Research (DTER) for Grains Research & Development Corporation.
53 Watson, P & Watson, D 2014, GRDC Organisational Performance Research – 2014 Grower Survey Report, prepared by Down to Earth Research (DTER) for Grains Research & Development Corporation.
54 Knight I, Proagtive, personal communication 28 January 2016.
FARM BUSINESS MODELS – OPTIONS FOR BUILDING YOUR FUTURE 119
GROWNOTES
FARM BUSINESS MODELSSECTION 7
55 Commonwealth of Australia 2015, Water Market Information, About the water market (webpage), available at www.nationalwatermarket.gov.au/about
56 RMCG & Murray Local Land Services 2015, ‘Water trading tool kit’, Murray Dairy and Dairy Australia.
57 Commonwealth of Australia 2011, Water markets in Australia: a short history, National Water Commission, Canberra.
58 Murray Irrigation 2015, Murray Irrigation website, available at www.murrayirrigation.com.au
59 Murray Irrigation 2015, Water exchange annual history data (webpage), available at www.murrayirrigation.com.au/water/water-trade/water-exchange-history
60 Rendell, R 2014, ‘R&D for irrigated grain production: Southern Region’, RMCG, client report to Grains Research & Development Corporation.
61 Commonwealth of Australia 2012, Impacts of water trading in the southern Murray–Darling Basin between 2006–07 and 2010–11, National Water Commission, Canberra.
62 Wight, V 2016, CowBank, personal communication.
63 Potard, G & Keogh, M 2015, ‘Labour utilization and trends in Australian agriculture’, Farm Policy Journal, vol. 12, no. 2, Winter Quarter, pp. 1–15.
64 ABARES Farm Survey data, accessed through AGsurf, available at http://apps.daff.gov.au/agsurf
65 Briggeman, BC 2011, ‘The importance of off-farm income to servicing farm debt’, Economic Review, Federal Reserve Bank of Kansas City, p.63.
66 National Statistics Service 2014, ‘Farms and farmland: numbers, acreage, ownership and use’, ACH12-13/ September 2014, United States Department of Agriculture National Statistics Service, available at www.agcensus.usda.gov/Publications/2012/Online_Resources/Highlights/Farms_and_Farmland/Highlights_Farms_and_Farmland.pdf
67 Statistics Canada 2015, 2011 Census of Agriculture, available at www.statcan.gc.ca/pub/95-640-x/2011001/p1/p1-01-eng.htm
68 Lewis, G 2015, ‘Sustainable land tenure for the farmer and the next generation’, Nuffield Farming Scholarship Trust report, Nuffield International.
69 Eurostat, ‘Structure of agricultural holdings by eurofarm region, main indicators’ (webpage), available at http://ec.europa.eu/eurostat/web/products-datasets/-/ef_r_farm, accessed 29 January 2016.
70 Bryant, M 2016, Agprofit (www.agprofit.com.au), personal communication.
71 Queensland Government, Property Law Act 1974, Division 6, available at www5.austlii.edu.au/au/legis/qld/consol_act/pla1974179/
72 NSW Government, Agricultural Tenancies Act 1990, available at www5.austlii.edu.au/au/legis/nsw/consol_act/ata1990233/index.html#longtitle
73 Tasmanian Government, Landlord and Tenant Act 1935, available at www5.austlii.edu.au/au/legis/tas/consol_act/lata1935177/
74 McCormick, D 2015, ‘Exploring agriculture investment’ (webpage), Money Management, 30 January 2015, available at www.moneymanagement.com.au/expert-analysis/editorial/exploring-agriculture-investment
75 Tomlinson, A 2014, ‘The realities of risk in Australian agriculture’, Farm Institute Insights, Australian Farm Institute Quarterly Newsletter, vol. 11, no. 3, August 2014.
76 Sackett, D, Scammell, D & Moreton, J 2014, ‘A view of corporate agriculture – performance and prospects’, proceedings of Funding Agriculture’s Future Conference, Australian Farm Institute, Canberra.