november 2018 management presentation - home ......2018/11/06 · large format retail and market...
TRANSCRIPT

Aventus Holdings Limited (ACN 627 640 180) Aventus Capital Limited (ACN 606 555 480) as responsible entity for the Aventus Retail Property Fund (ARSN 608 000 764)
Level 33, 1 Farrer Place / Sydney NSW 2000 / 02 9285 6700 www.aventusgroup.com.au
ASX ANNOUNCEMENT
6 November 2018
November 2018 Management Presentation Aventus Group today releases the attached presentation to be presented during ongoing investor meetings.
Mary Weaver
Company Secretary
(02) 9285 6700
For
per
sona
l use
onl
y

Management presentationNOVEMBER 2018
Hills Super Centre, Metro Sydney Belrose Super Centre, Metro Sydney
Kotara Home, NSW
For
per
sona
l use
onl
y

Aventus Group | Corporate Profile | November 2018 |
DARREN HOLLAND
Executive Director and
Chief Executive Officer
Peninsula Home, VIC
02 Aventus Overview
06 Strategy
08 LFR and Market Overview
15 Management Outcomes
21 Appendix A: Portfolio Overview
27 Appendix B: FY18 Financial Results
30 Appendix C: Tuggerah Case Study
33 Appendix D: Board and Executives
Contents
1
For
per
sona
l use
onl
y
Aventus Group | Corporate Profile | November 2018 | 2
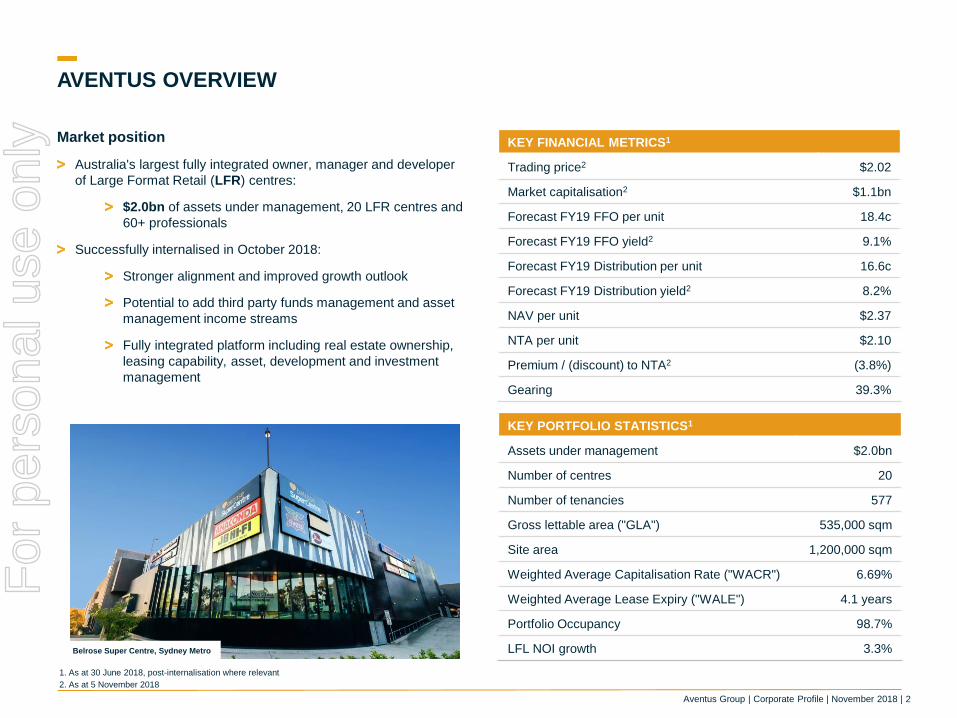
AVENTUS OVERVIEW
KEY FINANCIAL METRICS1
Trading price2 $2.02
Market capitalisation2 $1.1bn
Forecast FY19 FFO per unit 18.4c
Forecast FY19 FFO yield2 9.1%
Forecast FY19 Distribution per unit 16.6c
Forecast FY19 Distribution yield2 8.2%
NAV per unit $2.37
NTA per unit $2.10
Premium / (discount) to NTA2 (3.8%)
Gearing 39.3%
KEY PORTFOLIO STATISTICS1
Assets under management $2.0bn
Number of centres 20
Number of tenancies 577
Gross lettable area ("GLA") 535,000 sqm
Site area 1,200,000 sqm
Weighted Average Capitalisation Rate ("WACR") 6.69%
Weighted Average Lease Expiry ("WALE") 4.1 years
Portfolio Occupancy 98.7%
LFL NOI growth 3.3%
Market position
Australia's largest fully integrated owner, manager and developer
of Large Format Retail (LFR) centres:
$2.0bn of assets under management, 20 LFR centres and
60+ professionals
Successfully internalised in October 2018:
Stronger alignment and improved growth outlook
Potential to add third party funds management and asset
management income streams
Fully integrated platform including real estate ownership,
leasing capability, asset, development and investment
management
1. As at 30 June 2018, post-internalisation where relevant
2. As at 5 November 2018
Belrose Super Centre, Sydney Metro
For
per
sona
l use
onl
y
Aventus Group | Corporate Profile | November 2018 | 3
Aventus centres
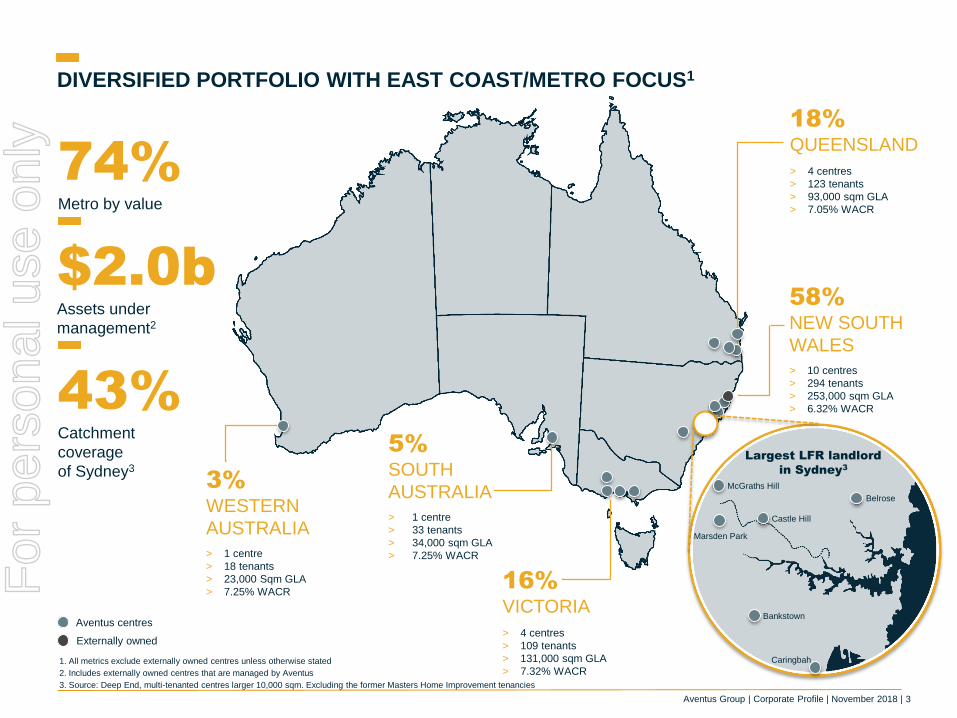
DIVERSIFIED PORTFOLIO WITH EAST COAST/METRO FOCUS1
Externally owned
3%
WESTERN
AUSTRALIA
> 1 centre
> 18 tenants
> 23,000 Sqm GLA
> 7.25% WACR
5%
SOUTH
AUSTRALIA
> 1 centre
> 33 tenants
> 34,000 sqm GLA
> 7.25% WACR
16%
VICTORIA
> 4 centres
> 109 tenants
> 131,000 sqm GLA
> 7.32% WACR
58%
NEW SOUTH
WALES
> 10 centres
> 294 tenants
> 253,000 sqm GLA
> 6.32% WACR
18%
QUEENSLAND
> 4 centres
> 123 tenants
> 93,000 sqm GLA
> 7.05% WACR
$2.0bAssets under
management2
74%Metro by value
Largest LFR landlord
in Sydney3
43%Catchment
coverage
of Sydney3
Castle Hill
McGraths Hill
Belrose
Bankstown
Caringbah
Marsden Park
1. All metrics exclude externally owned centres unless otherwise stated
2. Includes externally owned centres that are managed by Aventus
3. Source: Deep End, multi-tenanted centres larger 10,000 sqm. Excluding the former Masters Home Improvement tenancies
For
per
sona
l use
onl
y

Aventus Group | Corporate Profile | November 2018 | 4
PLATFORM
Aventus is a fully integrated property, development and investment manager and owner with
60+ property professionals
Corporate
Legal People and culture Financial reporting Tax Treasury Investor relations
Asset Management DevelopmentInvestment
ManagementCapital Transactions Leasing
Asset strategy
Centre management
Facilities management
Marketing
Project management
Master planning
Regulatory management
Design
Funds management
Capital management
Equity raising
Site identification and deal sourcing
Transaction execution
Contract negotiation
Divestments
Lease negotiation andadministration
Tenancy management
Retailer coordination
Fit out
For
per
sona
l use
onl
y

Aventus Group | Corporate Profile | November 2018 | 5
OUR GROWTH
Aventus has grown its assets under management from $0.9bn to $2.0bn since listing in October 2015
30 30 30 58 153 186
295 340 469
618 666
910
1,273
1,831
2,032
-
500
1,000
1,500
2,000
2,500
2004 2005 2006 2007 2008 2009 2010 2011 2012 2013 2014 2015 2016 2017 2018
As
se
ts u
nd
er
ma
na
ge
me
nt
($m
)
Growth since ASX listing FY15 FY16 FY17 FY18
Centres 14 20 22 20
Tenants 372 477 586 577
Total GLA 360,000 sqm 473,000 sqm 546,000 sqm 535,000 sqm
Assets under management $0.9bn $1.3bn $1.8bn $2.0bn1
Average centre value $65m $64m $83m $95m
Capitalisation rate 8.01% 7.53% 6.85% 6.69%
Key achievements2
Aventus listed on the ASX in October
Acquired 2 centres for a total of $46m
Acquired 5 centres for a total of $223m
$18m of development spend adding 920 sqm
Acquired 2 centres for a total of $436m
$16m of development spend adding 5,300 sqm3
Completed divestment of 2centres for a total of $60m
$32m of development spend adding 10,850 sqm
Aventus internalises its management functions,establishing a new stapled structure to acquire Aventus Property Group (APG)
1
1. Includes $1,892 of investment properties on balance sheet and post-internalisation additional external assets under management
2. Achievements made during the calendar years of 2015, 2016, 2017 and 2018 respectively
3. Excludes $9m of committed spend that occurred during 1QFY18
For
per
sona
l use
onl
y

Aventus Group | Corporate Profile | November 2018 | 6
Invest in
LFR centres in
Australia
Own centres that
have a stable
earnings profile
Pursue acquisition,
growth and value
enhancement
opportunities
Explore development
and repositioning
potential in the
portfolio
Maintain a
conservative capital
structure
Diversified by geography
and tenant mix
20 centres across
Australia, with 92% East
Coast exposure2
Land bank with 1.2m sqm
in site area
National portfolio that has
been built over 14 years
87% leased to
national tenants
85% of leases have
annual fixed or
CPI increases
Diversified tenancy mix
with 37%3 exposure to
non-household goods
Largest single brand
exposure to Bunnings
at 4%3
Utilise internal
management expertise
Potential for diversified
income streams
$496m of capital
transactions in FY18
Metro focus with 74% by
value of the portfolio in
metro locations
$40m+ development
pipeline forecasted
for FY19
45% site coverage ratio
provides additional future
opportunities
83% of portfolio with
development opportunity1
Target gearing range of
30-40% of total asset value
Improved debt profile, with
no expiries until Oct-20 and
4.4 year weighted average
debt expiry
Debt diversification with
$160m 7-year note facility
entered into in last
twelve months
Maintain headroom to debt
covenants
STRATEGY TO MEET OUR OBJECTIVES
Our objective is to provide investors with stable, secure and growing income returns and potential for
capital growth
To achieve this objective, our strategy is to:
1. By site area
2. By value
3. By gross income
For
per
sona
l use
onl
y
Aventus Group | Corporate Profile | November 2018 | 7
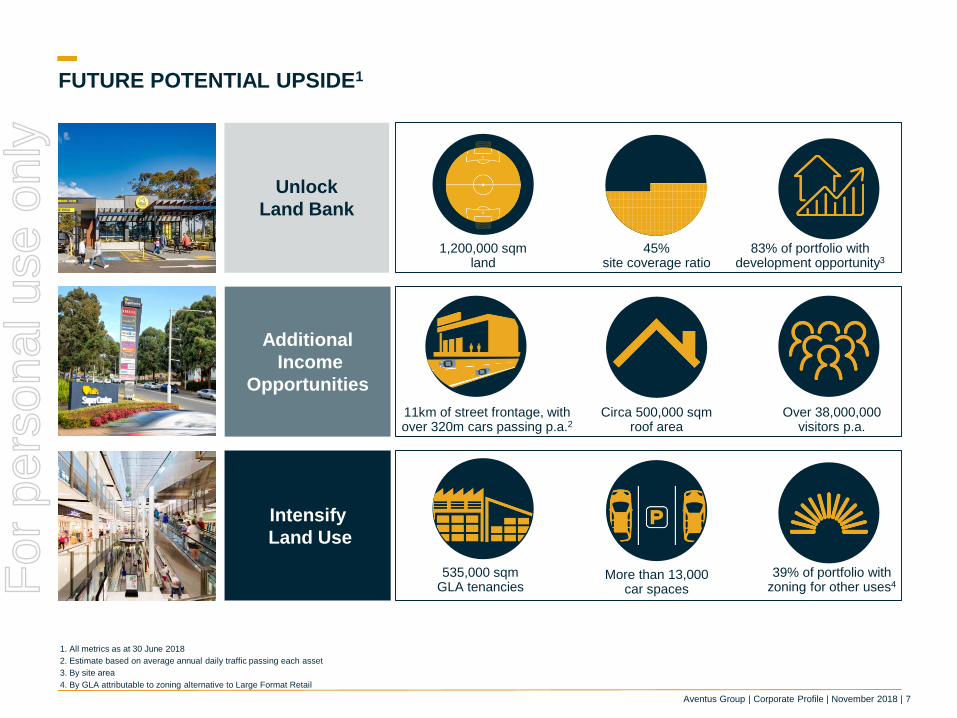
Additional
Income
Opportunities
FUTURE POTENTIAL UPSIDE1
Unlock
Land Bank
Intensify
Land Use
11km of street frontage, withover 320m cars passing p.a.2
1,200,000 sqmland
45% site coverage ratio
Circa 500,000 sqmroof area
More than 13,000 car spaces
83% of portfolio with development opportunity3
535,000 sqmGLA tenancies
39% of portfolio withzoning for other uses4
Over 38,000,000visitors p.a.
1. All metrics as at 30 June 2018
2. Estimate based on average annual daily traffic passing each asset
3. By site area
4. By GLA attributable to zoning alternative to Large Format Retail
For
per
sona
l use
onl
y

Aventus Group | Corporate Profile | November 2018 | 8
of all retail sales in Australia1
LARGE FORMAT RETAIL AND MARKET OVERVIEW
1. Large Format Retail Association (LFRA)
2. Deep End Services, Savills. Multi-tenanted centres larger than 10,000 sqm. Excluding the former Masters Home Improvement tenancies
of all retail floor space1 across
approximately 175 LFR centres2
22% 30%
$68billion1
Annual sales by LFR tenants
account for more than
For
per
sona
l use
onl
y

Aventus Group | Corporate Profile | November 2018 | 9
LFR centres were traditionally The sector has now evolved Key drivers include
Retail warehouses where a range of
retailers sell items of a bulky nature that
require a large area for handling, display or
storage:
Furniture
Electrical
Bedding
Hardware
Other household items
Independent family operated tenants
Smaller centres with basic design
(industrial single level buildings)
Mainly weekend visitation for
discretionary products
In addition to previous tenants, LFR
centres often include a broader offering of
tenants and uses including:
Fitness centres, sports, wellbeing
and leisure
Baby, pet, auto and office supplies
Medical services
Big box pharmacies
Supermarkets
Cafes and restaurants
These new tenants can lead to increased
frequency of foot traffic at centres, day to
day visitation and dwell time
Many centres are now larger, multi-level
and with more ASX listed, national or
international tenants
Demand for household goods is linked to
factors such as:
Population and employment growth
Turnover of existing dwellings
Development of new
residential property
Renovation activity
Interest rates and
consumer confidence
Low historical and forecast supply of
LFR centres
EVOLUTION OF THE LFR SECTOR
Cranbourne Home, VIC Belrose Super Centre, Sydney Metro Tuggerah Super Centre, NSW
LFR sector in Australia has grown in scale, quality and mix of tenants
For
per
sona
l use
onl
y

Aventus Group | Corporate Profile | November 2018 | 10
CONSOLIDATION OPPORTUNITIES IN THE LFR SECTOR
Since listing, Aventus has acquired 8 centres. Our specialist sector expertise, transaction capability and scale position us well to continue to
capitalise on consolidation opportunities in the LFR sector:
Market share of centres larger than 25,000 sqm has increased from 18% to 22%1
Most assets are held in smaller portfolios or single-asset ownership, with limited institutional ownership, providing an opportunity for
Aventus to continue to grow through consolidation
Limited supply of new LFR centres in the last 8 years with continued low supply forecasted
Australian LFR centre ownership – by GLA1
1. Deep End Services; multi-tenanted centres larger than 25,000 sqm. Excluding the former Masters Home Improvement tenancies
2. JLL Research, May 2018
As at July 2015 As at July 2018
Aventus Harvey Norman Other Centres
62%
16%
22%
66%
16%
18%
Cen
tres l
arg
er
tha
n 2
5,0
00 s
qm
Low supply of LFR centres2
Average: 175
Average: 82
-
50
100
150
200
250
300
350
2000 2002 2004 2006 2008 2010 2012 2014 2016 2018 2020 2022
GL
A s
qm
('0
00)
Completed Under Construction Plans Approved
76%
15%
9%
72%
15%
13%
Cen
tres l
arg
er
tha
n 1
0,0
00 s
qm
For
per
sona
l use
onl
y
Aventus Group | Corporate Profile | November 2018 | 11
$23
$28
$33
$38
$43
$48
$53
$58
Feb-03 Aug-05 Feb-08 Aug-10 Feb-13 Aug-15 Feb-18
Household goods retail spending CAGR 4.0%
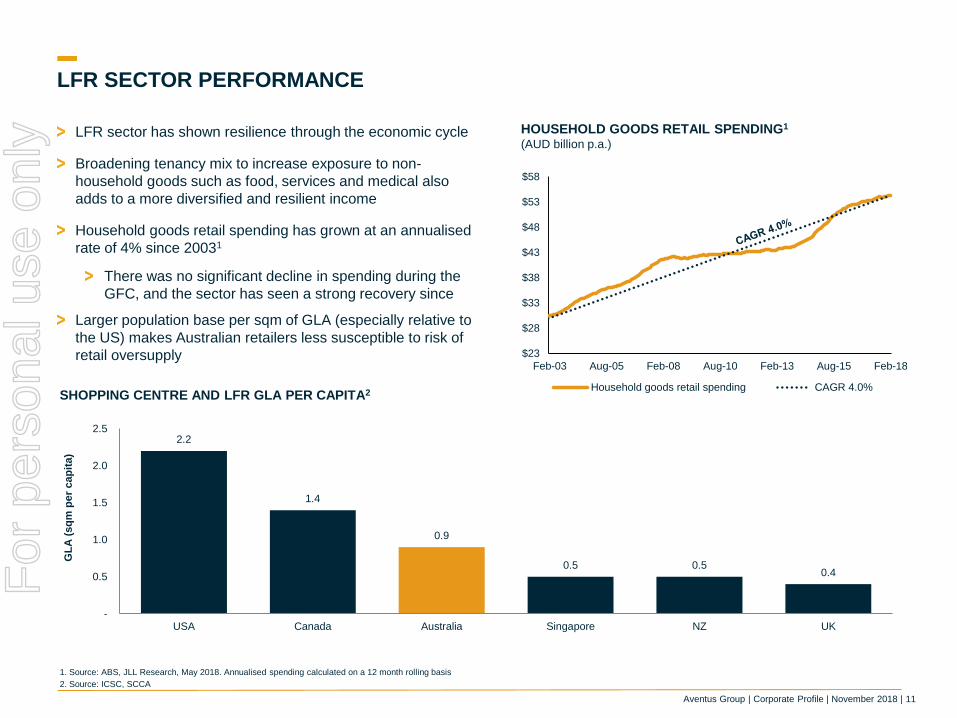
LFR SECTOR PERFORMANCE
1. Source: ABS, JLL Research, May 2018. Annualised spending calculated on a 12 month rolling basis
2. Source: ICSC, SCCA
HOUSEHOLD GOODS RETAIL SPENDING1
(AUD billion p.a.)
SHOPPING CENTRE AND LFR GLA PER CAPITA2
LFR sector has shown resilience through the economic cycle
Broadening tenancy mix to increase exposure to non-
household goods such as food, services and medical also
adds to a more diversified and resilient income
Household goods retail spending has grown at an annualised
rate of 4% since 20031
There was no significant decline in spending during the
GFC, and the sector has seen a strong recovery since
Larger population base per sqm of GLA (especially relative to
the US) makes Australian retailers less susceptible to risk of
retail oversupply
2.2
1.4
0.9
0.5 0.5 0.4
-
0.5
1.0
1.5
2.0
2.5
USA Canada Australia Singapore NZ UK
GL
A (
sq
m p
er
cap
ita)
For
per
sona
l use
onl
y

Aventus Group | Corporate Profile | November 2018 | 12
$400m
$500m
$600m
$700m
$800m
$900m
60
80
100
120
140
160
2005 2006 2007 2008 2009 2010 2011 2012 2013 2014 2015 2016 2017
Residential Property Price Index
Value of residential alternations and additions (rolling 12 months) (RHS)
DEMAND FOR HOUSEHOLD GOODS
1. Source: ABS alterations and additions
2. Source: ABS dwelling approvals and completions
Key drivers of demand for household goods include:
Population and employment growth
Turnover of existing dwellings
Development of new residential property
Renovation activity
Interest rates and consumer confidence
Despite recent moderation in house prices, the overall trend
reflects:
Annualised housing price growth of 5.5% since 2005 to
30 June 2018
Residential alterations and additions spending also remain
elevated at an annualised growth rate of 3.6% over the same
period, and in the last 12 months spending increased by 6.1%
Dwelling approvals have increased since the GFC and underpin
household goods demand (lag effect 2-3 years)
Other factors affecting demand for household goods include:
Changes in life stages and population growth (births, ageing,
divorce, upgraders, downsizers and migration)
Product trends, replacements and popularity of home renovations
generate interest and attention for large format retailers
Limited impact to date of online retailing as household goods are
considered major bulky purchases, difficult to transport and have a
'touch and feel' element
HOUSE PRICES AND RENOVATIONS GROWTH1
DWELLING APPROVALS AND COMPLETIONS2
0
50,000
100,000
150,000
200,000
250,000
2005 2006 2007 2008 2009 2010 2011 2012 2013 2014 2015 2016 2017 2018
Dwelling completions - year ending June
Dwelling approvals - year ending June
7-year avg. approvals: 174k
3-year avg. approvals: 230k
CAGR 5.5%
CAGR 3.6%
Residential Property Price Index (LHS)
2018
For
per
sona
l use
onl
y

Aventus Group | Corporate Profile | November 2018 | 13
LISTED LFR RETAILER PERFORMANCE
3.8%1 average growth in like-for-like sales for FY18
10 out of 14 of the listed retailers below reported higher profits2 in FY18 than in either of the preceding two years
5.3% increase in aggregated EBIT from $3.0bn in FY17 to $3.1bn in FY18
Source: Company disclosure
1. FY18 like-for-like average sales based on a simple average which is not weighted
2. Profits based on EBIT
-1.4%
7.3%
8.6%
4.3%
2.0%
3.6%
4.6% 4.4%
1.2%
5.1%
(1.3%)
6.9%
10.0%
14.3%
7.8%
6.2%
5.1%4.7%
3.6%
2.2%2.0%
1.6%1.1% 0.9%
(0.2%)
0.0%
-4%
-2%
0%
2%
4%
6%
8%
10%
12%
14%
16%
FY17 FY18
3.8%
avg.1
Like-for-like sales
For
per
sona
l use
onl
y
Aventus Group | Corporate Profile | November 2018 | 14
MARSDEN PARK HOME, NSW
MANAGEMENT OUTCOMES
For
per
sona
l use
onl
y
Aventus Group | Corporate Profile | November 2018 | 15
33%
10%
9%11%
37%
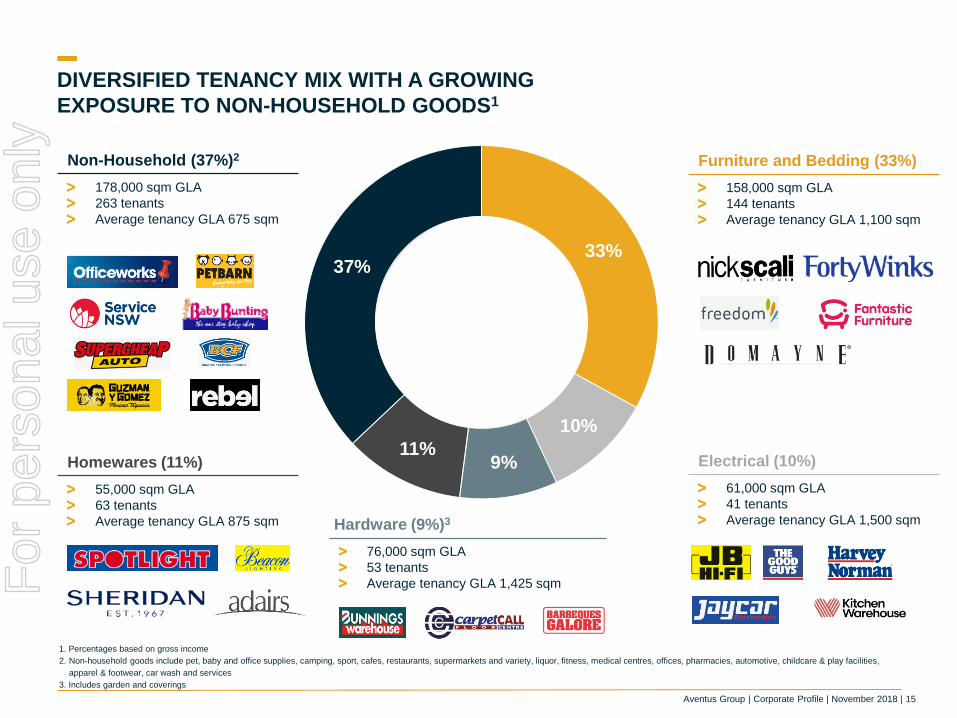
DIVERSIFIED TENANCY MIX WITH A GROWING
EXPOSURE TO NON-HOUSEHOLD GOODS1
Non-Household (37%)2
178,000 sqm GLA
263 tenants
Average tenancy GLA 675 sqm
Homewares (11%)
55,000 sqm GLA
63 tenants
Average tenancy GLA 875 sqm
Furniture and Bedding (33%)
158,000 sqm GLA
144 tenants
Average tenancy GLA 1,100 sqm
Electrical (10%)
61,000 sqm GLA
41 tenants
Average tenancy GLA 1,500 sqmHardware (9%)3
76,000 sqm GLA
53 tenants
Average tenancy GLA 1,425 sqm
1. Percentages based on gross income
2. Non-household goods include pet, baby and office supplies, camping, sport, cafes, restaurants, supermarkets and variety, liquor, fitness, medical centres, offices, pharmacies, automotive, childcare & play facilities,
apparel & footwear, car wash and services
3. Includes garden and coverings
For
per
sona
l use
onl
y

Aventus Group | Corporate Profile | November 2018 | 16
24%
15%
61%
CPI Market/Expiry/Other Fixed (3%-5% p.a)
1%
10%12%
14%12%
13%14%
24%
Vacant FY19 FY20 FY21 FY22 FY23 FY24 FY25+
PROACTIVE LEASING AND INCOME GROWTH
85% of leases have annual fixed (predominantly 3-5% p.a.)
or CPI rent increases1
Minimal holdover rate of 2% which is primarily associated
with centres marked for redevelopment2
Large format retail rental levels are lower relative to other
retail sectors
Sustainable average gross rent of $295 per sqm
Stable and staggered Weighted Average Lease Expiry
(WALE) of 4.1 years1
ANNUAL RENT INCREASES1LEASE EXPIRY PROFILE3
(reduced from 25%)4 (up from 60%)4
(unchanged)4
1. As at 30 June 2018. By gross rent
2. As at 30 June 2018. Holdover tenancies as at 30 June 2018 treated as FY19 expiries and by GLA
3. Source: JLL Research. Reflects specialty rents for all sub-sectors except Large Format Retail. Rents as at 1Q18
4. Compared to 31 December 2017
RENT BENCHMARKS BETWEEN RETAIL SUBSECTORS3
$254
$797
$997
$1,731
$2,941
$- $500 $1,000 $1,500 $2,000 $2,500 $3,000
Large Format Retail
Neighbourhood
Sub-regional
Regional
CBD
Average Gross Rent / sqm p.a.
For
per
sona
l use
onl
y

Aventus Group | Corporate Profile | November 2018 | 17
8.1%
5.8%6.1%
7.2%
6.5%
5.8% 5.6%
5.0%
4.3% 4.4%
3.8%
1.2%1.6%
3.1%
2.0%
2.6%2.9%
2.3%
1.7%1.3%
0
5
10
15
20
25
0%
1%
2%
3%
4%
5%
6%
7%
8%
9%
FY09 FY10 FY11 FY12 FY13 FY14 FY15 FY16 FY17 FY18
Number of LFR centres in the Aventus Portfolio National Average Vacancy Aventus Portfolio Vacancy
STRONG LFL NPI GROWTH AND CONSISTENTLY HIGH OCCUPANCY
IPO2
1. As at 30 June 2018. By gross rent
2. IPO at Oct 2015 based on June 2015 metrics
3. Source: Deep End Services (multi-tenanted centres larger than 10,000 sqm. Excluding the former Masters Home Improvement tenancies); by GLA
4. Historical metrics exclude centres prior to acquisition by Aventus
3 4
3.0%3.3%
FY17 FY18
Aventus has achieved 3.3% like-for-like net property income (NPI) growth
High occupancy of 98.7% achieved with low incentives
LFL NPI GROWTH1
For
per
sona
l use
onl
y

Aventus Group | Corporate Profile | November 2018 | 18
GROWTH THROUGH DEVELOPMENT
Development Spend
$32m
1. Year one weighted average unlevered development yield, for income producing projects completed and commenced in FY18
New GLA Created
10,850 sqmCash Yield1
9%
Key Projects
Castle Hill NSW
Caringbah NSW
Macgregor QLD
Jindalee QLD
Forecasted Pipeline
FY19 $40m+
FY18 Highlights
Photos 30/7
Tuggerah, NSW
For
per
sona
l use
onl
y

Aventus Group | Corporate Profile | November 2018 | 19
OUTLOOK
Strategy
Strategy continues to focus on sustainable and organic income growth from the portfolio
Active diversification of the tenant base with a focus on increasing non-household uses
Rental growth underpinned by high occupancy and annual contracted rent increases
Investment in the expansion and development of the portfolio to enhance and improve shopper
experience and deliver attractive returns
Financial
performanceFY19 guidance for FFO per unit is expected to be 18.4 cents per unit
Corporate
structure
Successfully completed internalisation of its management functions in October 2018
Created stronger alignment and improved Aventus' competitive position for acquisitions in addition
to potential to add third party funds management and asset management income streams
Aventus is now a fully integrated platform owning both real estate in addition to asset management,
development management, investment management and leasing capacity
For
per
sona
l use
onl
y
Aventus Group | Corporate Profile | November 2018 |
APPENDIX A
PORTFOLIO OVERVIEW
BELROSE SUPER CENTRE, NSW
For
per
sona
l use
onl
y

Aventus Group | Corporate Profile | November 2018 | 21
PORTFOLIO OVERVIEW
CENTRES STATEVALUATION
DATE
CARRYING
VALUE ($M)
CAP
RATEOCCUPANCY1
WALE
(YEARS)2
NO. OF
TENANCIES3
GLA
(‘000 SQM)3
SITE AREA
(‘000 SQM)
NATIONAL
RETAILERS1ZONING
DEV.
POTENTIAL4
Bankstown Home NSW Jun-18 61 6.75% 90% 3.1 21 17 40 81% LFR P
Belrose Super Centre NSW Jun-18 177 6.25% 100% 4.7 46 37 44 94% LFR/Retail O
Caringbah Home NSW Jun-18 92 7.50% 99% 1.1 26 19 23 87% LFR P
Hills Super Centre NSW Jun-18 347 5.50% 100% 3.6 76 52 60 80% LFR/Retail P
Highlands Hub NSW Jun-18 33 7.50% 100% 3.3 14 11 32 86% LFR/Retail P
Kotara Home South NSW Jun-18 121 6.50% 100% 3.6 23 29 53 98% LFR/Retail P
Marsden Park Home NSW Jun-18 101 6.00% 100% 5.7 32 20 40 81% LFR O
McGraths Hill Home NSW Jun-18 41 7.00% 100% 2.2 9 16 38 98% LFR O
Tuggerah Super Centre NSW Jun-18 85 7.00% 96% 6.5 35 39 127 84% LFR/Outlet P
Warners Bay Home NSW Jun-18 37 7.50% 98% 3.5 12 12 35 98% LFR O
TOTAL NSW 1,095 6.32% 99% 3.9 294 253 493 88%
Ballarat Home VIC Jun-18 41 7.50% 100% 5.1 15 20 52 93% LFR P
Cranbourne Home VIC Jun-18 134 7.25% 100% 6.6 34 56 194 89% LFR/Retail P
Epping Hub VIC Jun-18 43 7.50% 100% 3.8 30 22 60 66% Mixed Use P
Peninsula Home VIC Jun-18 84 7.25% 100% 3.2 30 33 85 90% LFR/Retail P
TOTAL VIC 302 7.32% 100% 5.0 109 131 390 86%
Jindalee Home QLD Jun-18 125 7.00% 100% 3.6 53 27 72 72% Mixed Use P
Logan Super Centre QLD Jun-18 91 7.00% 98% 4.5 31 27 27 89% LFR P
Macgregor Home QLD Jun-18 24 7.75% 82% 0.2 6 13 29 66% LFR P
Sunshine Coast Home QLD Jun-18 96 7.00% 98% 5.4 33 27 69 90% LFR/Retail P
TOTAL QLD 336 7.05% 96% 4.2 123 93 197 81%
Mile End Home SA Jun-18 98 7.25% 100% 3.6 33 34 71 88% LFR P
TOTAL SA 98 7.25% 100% 3.6 33 34 71 88%
Midland Home WA Jun-18 63 7.25% 100% 4.2 18 23 43 98% LFR O
TOTAL WA 63 7.25% 100% 4.2 18 23 43 98%
TOTAL AVENTUS 1,892 6.69% 99% 4.1 577 535 1,194 87%
1. By GLA as at 30 June 2018
2. By gross income as at 30 June 2018
3. Metrics as at 30 June 2018
4. Further development of certain centres may be subject to contractual and regulatory approvals including planning approvals from relevant local government authorities
For
per
sona
l use
onl
y

Aventus Group | Corporate Profile | November 2018 | 22
OUR PORTFOLIO
BANKSTOWN BELROSE CARINGBAH CASTLE HILL
HIGHLANDS KOTARA MARSDEN PARK MCGRATHS HILL
TUGGERAH WARNERS BAY
New South Wales
58% of the portfolio by value
in NSW
$1.1bn across 10 centres
For
per
sona
l use
onl
y

Aventus Group | Corporate Profile | November 2018 | 23
BALLARAT CRANBOURNE EPPING PENINSULA
JINDALEE LOGAN SUNSHINE COAST MACGREGOR
MILE END MIDLAND
Victoria
Queensland
South Australia Western Australia
OUR PORTFOLIO
1,200,000 sqm total land area across
74% metro locations by value
the portfolioFor
per
sona
l use
onl
y

Aventus Group | Corporate Profile | November 2018 | 24
RANK BRANDSNUMBER OF
TENANCIES
% OF
INCOME3 PARENT COMPANY
9 9 2%Steinhoff Asia
Pacific Limited
10 9 2%Quadrant Private
Equity
11 12 2% Adairs Limited
12 7 2% Wesfarmers Limited
13 5 2%
Spotlight Group
Holdings Pty
Limited
14 2 2%Harvey Norman
Holdings Limited
15 8 2%Super Retail Group
Limited
TOTAL 115 39%
RANK BRANDSNUMBER OF
TENANCIES
% OF
INCOME3 PARENT COMPANY
1 4 4%Wesfarmers
Limited
2 6 4%Harvey Norman
Holdings Limited
3 7 4%Steinhoff Asia
Pacific Limited
4 9 4% JB Hi-Fi Limited
5 9 3% JB Hi-Fi Limited
6 14 2%Beacon Lighting
Group Limited
7 9 2% Forty Winks
8 5 2% Nick Scali Limited
DIVERSITY OF INCOME1
87% national tenants, with majority public companies2
Less than 2% apparel and fashion exposure and no department stores2
1. All metrics as at 30 June 2018
2. By GLA
3. By gross income as at 30 June 2018 excluding rental guarantees
TOP 15 TENANTS
For
per
sona
l use
onl
y

Aventus Group | Corporate Profile | November 2018 | 25
28%
34%
24%
29%
At IPO FY18
Aventus
LFR sector
FOCUS ON DIVERSIFYING & EXPANDING
THE NON-HOUSEHOLD CATEGORY1
Non-household goods tenants contribute 37% of
gross income whilst covering 34% of the portfolio’s
GLA with over 250 tenancies
Non-household uses drive weekday traffic and
extend customer linger time
Tenancy Mix: Aventus vs. LFR Sector (by GLA)2,3 Focus on growing categories:
Food and
Beverage
1. All metrics as at 30 June 2018
2. Non-household goods include pet, baby and office supplies, camping, sport, cafes, restaurants, supermarkets and variety, liquor, fitness, medical centres, offices, pharmacies, automotive, childcare & play facilities,
apparel & footwear, car wash and services
3. Source: Deep End Services (multi-tenanted centres larger than 10,000 sqm. Excluding the former Masters Home Improvement tenancies) as at 30 June 2018
58
Wellbeing, Fitness
and Leisure
69
Offices, Government,
Childcare and
Services
34 Update
For
per
sona
l use
onl
y

Aventus Group | Corporate Profile | November 2018 |
APPENDIX B
FY18 FINANCIAL RESULTS
CRANBOURNE HOME, VIC
For
per
sona
l use
onl
y

Aventus Group | Corporate Profile | November 2018 | 27
1. All metrics as at 30 June 2018 unless otherwise stated2. Based on a weighted average number of units of 492m over the 12 months ended 30 June 20183. Year ended 30 June 20174. Pro forma as at 30 June 2018 post internalization5. Excludes acquisitions and development impacted centres and is calculated on a like-for-like basis versus the prior corresponding period (year ending 30 June 2017) 6. As at 30 June 20177. Post refinance. The weighted average debt expiry at 30 June 2018 before refinancing is 3.3 years8. By GLA as at 31 December 20179. As at 30 June 2017 and including settlement of Castle Hill and Marsden Park
FY18 FINANCIAL RESULTS1
Fund
Highlights
Financial
Management
Portfolio
Performance
$2.10NTA
Per unit4
$2.0bnAssets under management4
98.7%Occupancy
from 98.6%8
3.3%FY18 like-for-like NPI growth5
p From 3.0%6
⇧
6.69%Portfolio Cap Rate
From 6.85%9
39.3%Gearing4
16.3cents
DPU
2.4% from 15.9 cents3
Single sector focus and sustainable growth
⇧
4.4years
Weighted Average Debt Expiry7
18.1cents
FFO per unit2
2.3% from 17.7 cents3
$
For
per
sona
l use
onl
y

Aventus Group | Corporate Profile | November 2018 | 28
FINANCIAL METRICS
($m)
Property income 164.0
Other revenue 2.0
Property expenses (36.0)
Investment management fees (3.0)
Other expenses (8.0)
Transaction costs (6.0)
Finance costs (27.0)
Net profit after tax 87.0
Funds from operations adjustments 8.0
Funds from operations 96.0
Less: Maintenance capex2 (6.0)
Less: Leasing costs3 (3.0)
Adjusted funds from operations 87.0
Securities on issue (millions) 522.04
FFO per security (cents) 18.4
AFFO per security (cents) 16.7
FY19 forecast income and distribution statement
($m)
Cash and cash equivalents 7.0
Investment properties 1,887.0
Other assets 11.0
Intangible assets 143.0
Total assets 2,048.0
Borrowings 750.0
Other liabilities 44.0
Total liabilities 794.0
Total equity 1,254.0
Securities on issue (millions) 530.0
NTA per security 2.10
NAV per security 2.37
Gearing 39.3%
Pro forma balance sheet1
1. As at 30 June 2018 post internalisation
2. Maintenance capex includes operational capital expenditure and excludes tenancy fit out incentives, landlord works and development capital expenditure
3. Leasing costs represent lease incentives and leasing fees
4. Weighted average number of securities on issue for the financial year
For
per
sona
l use
onl
y

Aventus Group | Corporate Profile | November 2018 |
APPENDIX C
TUGGERAH SUPER CENTRE CASE STUDY
TUGGERAH SUPER CENTRE, NSW
For
per
sona
l use
onl
y

Aventus Group | Corporate Profile | November 2018 | 30
EXPANDED AND ENHANCED TUGGERAH SUPER CENTRE
Total project
cost: $28m
Additional
10,000sqm
11 new
tenancies
Completed
2018
Future 5.6 ha
development land
Before Before June 2018
For
per
sona
l use
onl
y

Aventus Group | Corporate Profile | November 2018 | 31
GROWTH THROUGH PROACTIVE LEASING AND DEVELOPMENT
2015 2016 2017 2018 Future
Purchased for $41mCompletion of ground
floor refurbishment
Stablisation of centre
and purchase of
vacant land
Completion and
opening of refurbished
level 1 with 11 new
tenancies
Expansion opportunity
by developing vacant
land, adding c.10,000
sqm of GLA
Tenants 24 22 22 35 40+
GLA (sqm) 28,000Refurbished
50% of the centre-
+10,000 added
39,000 total+10,000 in future
Capex spend - +$11m spent -+$17m spend
$28m total
Land (sqm) 72,000 +56,000 added - 127,000 total
Valuation $41m $61m $66m $85m
Major tenantsBunnings, Spotlight,
The Good Guys
Service NSW, Adairs,
Fantastic FurnitureFocus on Furniture
Planet Fitness, Oz
Education Childcare,
The Reject Shop
Before June 2016 June 2018
For
per
sona
l use
onl
y

Aventus Group | Corporate Profile | November 2018 |
APPENDIX E
BOARD OF DIRECTORS
AND EXECUTIVE TEAM
PENINSULA HOME, NSW
For
per
sona
l use
onl
y

Aventus Group | Corporate Profile | November 2018 | 33
BOARD OF DIRECTORS AND EXECUTIVE TEAM
BRUCE CARTER
Independent Non-Executive Chairman
Bruce has spent over 30 years in corporate recovery and
insolvency. Bruce is a consultant at Ferrier Hodgson in
Adelaide where he was previously the managing partner for 19
years. He was formerly a partner at Ernst & Young, Chair of the
South Australian Economic Development Board and a member
of the Executive Committee of Cabinet.
Bruce is currently Chair of the Australian Submarine
Corporation, Deputy Chair of SkyCity Entertainment Group
Limited, a director of the Bank of Queensland Limited and a
director of Genesee & Wyoming Inc. He holds a Masters of
Business Administration from Heriot-Watt University and a
Bachelor of Economics from University of Adelaide. He is a
Fellow of both the Institute of Chartered Accountants in
Australia and the Australian Institute of Company Directors.
Bruce is currently a member of the Audit, Risk and
Compliance Committee.
KIERAN PRYKE
Independent Non-Executive Director
Kieran has over 25 years experience in the property industry.
He spent nine years in various finance roles across the
construction, development and investment management
divisions within Lendlease Corporation before becoming CFO
of General Property Trust in 1996. He remained as CFO of
GPT during and after the internalisation of management of
GPT. Kieran was CFO of Australand Property Group between
2010 and 2014, and from July 2016 until July 2018 held the role
of CFO of Grocon Pty Limited.
Kieran holds a Bachelor of Commerce (Accounting) from the
University of Wollongong and is a Fellow of CPA Australia.
Kieran is currently chairman of the Audit, Risk and
Compliance Committee.
ROBYN STUBBS
Independent Non-Executive Director
Robyn is a Board Director and Executive Coach working across
the commercial, government and not-for-profit sectors. Drawing on
a successful 25+ year career as a senior executive in large,
complex organisations, Robyn sits on the Board of ASX-listed
Invocare Limited as well as Lifeline Northern Beaches. She
provides Executive Coaching services to a diverse range of
corporate clients via ECI Partners.
Prior to joining the Aventus Board in 2015, Robyn spent 8 years
with Stockland as a General Manager, her last role heading up
Retail Leasing across a portfolio of 40 shopping
centres nationally.
Robyn is a graduate of the Australian Institute of Company
Directors, she holds a Master of Science degree in Coaching
Psychology from the University of Sydney and was awarded a
University Medal with her business degree from the University of
Technology, Sydney.
Robyn is a member of the Audit, Risk and Compliance Committee.
BRETT BLUNDY
Non-Executive Director
Brett is Chairman and Founder of BB Retail Capital. BB Retail
Capital is a pre-eminent private investment group with diverse
interests across three key portfolios including global retail brands,
retail properties and the beef industry.
Brett also sits on the Board of Directors of Human Longevity Inc.
For
per
sona
l use
onl
y

Aventus Group | Corporate Profile | November 2018 | 34
DARREN HOLLAND
Managing Director and Chief Executive Officer
Darren has more than 25 years experience in the retail property
industry. He is experienced in leasing, development, asset
management and acquisitions, and has grown the Fund’s assets
under management from one centre in 2004 to a total value of
$2.0 billion.
Prior to co-founding Aventus, Darren played a leading role in the
development and management of the only pure-play listed
Australian large format retail owner and operator to date,
Homemaker Retail Group (ASX: HRP). He holds a Bachelor of
Business (Land Economics) from the University of Western Sydney
and is a Licensed Real Estate Agent.
LAWRENCE WONG
Chief Financial Officer
Lawrence has over 20 years of experience in investment
management, corporate development and financial services. He
is responsible for capital management and financial reporting
functions as well as overseeing investor relations, treasury
and accounting.
Prior to joining Aventus, Lawrence was the Fund Manager for a
number of listed and unlisted funds at Brookfield Multiplex. He
holds a Bachelor of Commerce (Accounting and Marketing) from
the University of New South Wales and is a Member of the
Institute of Chartered Accountants in Australia.
Lawrence is also a company secretary of all Aventus
Group companies.
CAMERON MALE
Head of Acquisitions
Cameron has over 15 years’ experience in the retail property
sector completing tier one property transactions, fund and joint
venture establishments.
Prior to joining Aventus, Cameron was the General Manager,
Capital Transactions and Valuations at Federation Centres
(now Vicinity Centres) where he was responsible in raising
more than $2 billion in third party joint venture capital.
Cameron holds a Bachelor of Business (Property) from
RMIT University.
ADAM TRENT
Head of Development & Leasing
Adam has more than 17 years of experience in the property
industry, primarily focused on the development, master
planning and repositioning of shopping centres and retail
assets for listed and large institutional owners and managers.
Adam has across-the-board experience in the retail property
sector gained through working on projects across Australia, as
well as in the UK and Europe.
Prior to joining Aventus, Adam held Senior Development
Management roles with Macquarie Bank Real Estate Group,
Charter Hall and most recently Frasers Property Australia /
Australand (Australand was acquired by Frasers in October
2014). During his time at Frasers, he was responsible for the
master planning, development and delivery of retail projects in
NSW and Queensland.
Adam holds a Bachelor of Land Economics (Hons) from the
University of Technology Sydney.
BOARD OF DIRECTORS AND EXECUTIVE TEAM (CONTINUED)
For
per
sona
l use
onl
y

Aventus Group | Corporate Profile | November 2018 | 35
SANDRA FRANCIS
Head of Talent & Culture
Sandra has over 30 years experience with proven capabilities in
managing organisational change and strategies to attract,
manage and retain key talent.
Prior to joining Aventus, Sandra was Human Resources Director
at Avanade and has broad experience in professional services
having held senior positions in Ashurst and IBM in her career.
Sandra is a Fellow of the Australian Human Resources Institute.
GARY JONES
Head of Asset Management
Gary has over 24 years of experience in the property industry
including the past 15 years in retail property. He is responsible
for asset management and centre operations, overseeing the
centre management, and marketing teams.
Prior to joining Aventus, Gary worked with Westfield and QIC
in the management of some of Australia’s premier super
regional retail shopping centres including Westfield Bondi
Junction and Castle Towers. He holds a Diploma in Law from
the Legal Profession Admissions Board, a Masters of
Management from the University of Technology, Sydney, and
a Bachelor of Arts from the University of New South Wales.
MARY WEAVER
Legal Counsel & Company Secretary
Mary has over 18 years’ experience as a legal practitioner and
since 2008, has also acted as Company Secretary for private and
public companies.
Prior to joining Aventus, Mary was Legal Counsel and Company
Secretary for seven years for Genea Limited, and spent nine
years as a corporate lawyer with Multiplex Limited (now Brookfield
Multiplex) working in the construction, development and funds
management divisions. She began her legal career with Allens as
a Graduate Solicitor and with Baker McKenzie as an associate in
their property division.
Mary holds a Combined Degree in Law and Arts (Honours) from
the University of Tasmania, and a Graduate Diploma of Applied
Corporate Governance from the Governance Institute of Australia
(GIA). She is an associate member of the GIA and the Institute of
Chartered Secretaries (Australian division).
BOARD OF DIRECTORS AND EXECUTIVE TEAM (CONTINUED)
For
per
sona
l use
onl
y
Aventus Group | Corporate Profile | November 2018 | 36
This presentation has been prepared on behalf of Aventus Holdings Limited (ACN 627 640 180) and Aventus Capital Limited (ACN 606 555 480) as the responsible entity of the Aventus Retail Property Fund (ARSN 608 000
764) (Aventus Group or AVN). The information in this presentation is current as at the date of this presentation, unless otherwise stated.
Summary information
This presentation should be read in conjunction with the financial statements for any relevant period, ASX announcements released from time to time, and AVN’s other periodic and continuous disclosure announcements lodged
with ASX available at www.asx.com.au and www.aventusgroup.com.au.
The information in this presentation (including any forecast financial information) is in summary form and does not purport to be complete.
This presentation is not, and does not contain all the information which would be required in, a prospectus, explanatory memorandum, product disclosure statement, or any other offering or disclosure document under Australian
law, or any other law.
Exclusion of liability
This presentation has been prepared from information believed to be accurate. However, no representation or warranty, express or implied, is made as to the fairness, accuracy, adequacy, completeness or correctness of any
information, opinions and conclusions, or as to the reasonableness of any assumption, contained in this presentation. To the maximum extent permitted by law, the Aventus Group, and each of their associates, related bodies
corporate, representatives, directors, officers, employees, agents and advisers disclaim all responsibility and liability (including, without limitation, in respect of direct, indirect or consequential loss or damage or any loss or
damage arising from negligence) arising from the issue or use of, or reliance on, anything contained in or omitted from this presentation.
General information only
The information in this presentation (including any forecast financial information) is general information only and does not take into account your individual objectives, financial situation or particular needs. It is not financial
product advice and is not intended to be used as the basis for making an investment decision. Nor shall any information in this presentation form the basis of any contract or commitment, or constitute legal or tax advice.
Consequently you should consider whether the information in this presentation is appropriate for you in light of your objectives, financial situation or particular needs. You should consider your own financial situation, objectives
and needs, conduct an independent investigation of, and obtain professional advice in relation to, this presentation.
Not an offer
This presentation does not in any way constitute an offer of, or an invitation to acquire, securities to any person in any jurisdiction.
Forward-looking statements and forecast financial information
This presentation contains certain forward-looking statements and certain forecast financial information. Forward-looking statements and forecasts are made only as at the date of this document, and reflect current expectations
concerning future results and events.
No representation or warranty is given as to the accuracy or likelihood of achievement of any forward-looking statement or as to any forecast financial information in this presentation, nor any events or results expressed or
implied in any such forward-looking statements or forecast financial information.
Forward looking statements can generally be identified by the use of words such as "anticipate", "believe", "expect", "project", "forecast", "estimate", "likely", “propose”, “will”, “outlook”, "intend", "should", "could", "may", "target",
"predict", "guidance", "plan" and other similar expressions and include but are not limited to statements relating to the impact of the internalisation proposal, and the future performance of the Fund and the Aventus Group.
Indications of, and guidance on, future earnings and financial position and performance are also forward-looking statements.
Such forward-looking statements and forecasts are not guarantees of future performance, and are by their nature subject to significant uncertainties, risks and contingencies. Actual events, results and outcomes for the Aventus
group, may differ materially from any expressed, projected or implied in any forward-looking statement or in any forecast, and deviations are both normal and to be expected.
Investors should form their own views as to these matters and any assumptions on which any of the forward-looking statements are based, and not place reliance on such statements, or any forecast financial information. To
the maximum extent permitted by law, AVN, and its’ associates, related bodies corporate, representatives, directors, officers, employees, advisers, agents and intermediaries disclaim any obligations or undertakings to release
any updates or revisions to the information to reflect any changes in expectations or assumptions.
Past performance and pro forma financial information
Information about past performance and pro-forma financial information in this presentation is given for illustrative purposes only. It should not be relied upon, and is not an indication or guarantee of future performance or
results of the Aventus Group, nor anyone else. The pro forma historical financial information has been prepared by AVN in accordance with the measurement and recognition principles, but not the disclosure requirements
prescribed by Australian Accounting Standards.
Historical information in this document relating to AVN is information that has been released to the market. For further information, please see past announcements released to ASX.
Rounding
A number of figures, amounts, percentages, prices, estimates, calculations of value and fractions in this presentation are subject to rounding. Accordingly, the actual calculation of these figures, amounts, percentages, prices,
estimates, calculations of value and fractions may differ from the figures, amounts, percentages, prices, estimates, calculations of value and fractions set out in this presentation.
As a result, any calculations you make based on the figures, amounts, percentages, prices, estimates, calculations of value and fractions in this presentation may differ from the correct answers to those calculations.
All dollar values are in Australian dollars (A$) unless otherwise stated.
Restrictions on distribution
This presentation may not be reproduced or distributed without AVN’s prior written consent.
Persons who come into possession of this presentation who are not in Australia should seek advice on and observe any legal restrictions on distribution in their own jurisdiction. Any failure to comply with such restrictions may
constitute a violation of applicable securities law. Distribution of this presentation outside of Australia (whether electronically or otherwise) may be restricted by law. Persons who receive this presentation outside of Australia are
required to observe any such restrictions. Failure to comply with such restrictions may find you in violation of applicable securities laws. In particular, any securities referred in this presentation have not been, and will not be,
registered under the U.S. Securities Act of 1933 (US Securities Act), as amended, or the securities laws of any state or other jurisdiction of the United States and may not be offered or sold, directly and indirectly, in the United
States except pursuant to an exemption from, or in a transaction not subject to, the registration requirements of the US Securities Act and any applicable securities laws of any state or other jurisdiction of the United States.
DISCLAIMER
For
per
sona
l use
onl
y